Embed Size (px)
Citation preview

AD/A-005 048
THE NATICK LANDFORM CLASSIFICATIONSYSTEM
Robert L. Anstey
Army Materiel Systems Analysis ActivityAberdeen Proving Ground, Maryland
October 1974
DISTRIBUTED BY:
National Technical Infoo ation ServiceU. S. DEPARTMENT Of COMMERCE

UNCLASSI FIEDSCCURITY CLASSIFICATION OF TNIS PAGE (1Whm Deeis _ _tno
REPORT DOCUMENTATION PAGE READ INSTRUCTIONSBEFORE COMPLETING FORM
. IMPOTN 2. GOVT ACCESSION NO. 3. RECIENTS CATALOG NUMBERTR-IO00 PE-00s e
4. TITLE (and Subtit.) S. TYPE OF REPORT & PERIOD COVERED
THE NATICK LANDFORM CLASSIFICATION SYSTEM FINAL6. PERFORMING ORG. REPORT NUMBER
7. AUTHOR(e) 8. CONTRACT OR GRANT NUMBER(..
Robert L. Anstey, COL QM USAR
9. PERFORMING ORGANIZATION NAME AND ADDRESS 10. PROGRAM ELEMENT, PROJECT. TASK
US Army Materiel Systems Analysis Activity AREA G WORK UNIT NUMBERS
Aberdeen Proving Ground, MD 21005 DA 1S665702DS37
II. CONTROLLING OFFICE NAME AND ADDRESS 12. REPORT DATE
US Army Materiel Command October 1974Alexandria, VA 13. NUMBER OF PAGES
14. MONITORING AGENCY NAME & ADDRESS(If differmnt from Conutolflng Office) IS. SECURITY CLASS. (of this report)
UNCLASSIFIEDISa. DECLASSIFICATION/DOWNGRAOING
SCHEDULE
16. DISTRIBUTION STATEMENT (of thie Report)
Approved for public release; distribution unlimited
17. DISTRIBUTION STATEMENT (of the absrr•c entered in Block 20, If different from Report) D D UJJ
IS. SUPPLEMENTARY NOTES
COLOR 1ILLUSTRATIONS REPRODUCEDL -)IN BLACK AND WHITE D
19. KEY WORDS (Continue on reverse side if neceeeary and Identify by block number)
Terrain Classification Federal Republic of GermanyLandformsMappingIntervisibilityDigitized Terrain
20. ABSTRACT (Continue an revere* side If neceesary and identify by block number)
This report provides a description of the landform classificationsystem developed by the US Army Natick Laboratories for AMSAA environmentalevaluations, employing maximum hill height, modal hill height, and number ofpositive features per mile as criteria, together with the development ration-ale and limitations. Instructions for using the code to classify other areasand suggestions for expansion of the system are given.
Reprod.N A TC C PRICES SUBJ ECT TO CHANGENATIONAL TECHNICAL
INFORMATION SERVICEDD IO4RM3 1473 U s D• o,,•r., of Commerce UNCLASS I FI ED
SECURITY Sp,;CAI;,COd VA 22I51SECURITY CLASSIFICATION OF THIS PAGE (When Does Entered)
FOREWORD
The Earth Sciences Laboratory of the US Army Natick Laboratorieswas requested by USAMSAA (US Army Materiel Systems Analysis Activity)under PRON No. A1-O-90060-Ol-AJ-BG to develop a technique to classifylandform regions according to differences in line-of-sight characteris-tics. A code was developed and employed in constructing maps of anumber of landform rcgions in the Federal Republic of Germany, SouthVietnam, Western Thailand, and Northeastern United States with particu-lar application to intervisibility evaluation. It was found that terraindata classified under this scheme could be related quantitatively tospecific features in other areas around the world using source materialavailable in this country.
A number of sample landform areas have been digitized (x,y,z coor-dinates at regular intervals), both from topographic maps developed byNatick Laboratories and from US Defense Mapping Agency and foreigns.ources. The Natick Laboratories developed maps having one-meter con-tour intervals, to enable us to study the partial masking effects ofterrain irregularities not illustrated on the typical "Standard A" mil-itary map (a tank company can be hidden in a 20-meter contour interval).
Several models, developed by Mr. Warren K. Olson of AMSAA, are usedto examine line-of-sight existence, area masking, and terrain shape fromany vantage point. The models, together with the landform classifica-tion system and digitized sample regions, are useful for studies of sen-sor observation capabilities, direct-fire weapons, laser designators,flare illumination, target availability time, and as input to war games.
The landform classification system developed by Natick Laboratoriesprovides a quantitative measure of the general applicability of the re-sults of field experiments and studies that are based on only one or twoterrain regions. It has been applied by AMSAA in comparison of terrainat one US test site (Hunter Liggett Military Reservation, US Amy CombatDevelopment Experimentation Command), a region near Aberdeen ProvingGround, and selected areas in Germany. It was used by Natick Labora-tories to show terrain analoos between Germany and the United States,and between Vietnam and Thailand. Additional comparisons are under study.
AEDH. REID
Chief,Tactical Operations Analysis Office
1i
TABLE OF CONTENTS
PAGE
FOREWORD ........ ...........................
LIST OF ILLUSTRATIONS AND TABLES ...... ............. 3
1. INTRODUCTION ........ ....................... 4
1.1 Objective ........ ..................... 4
1.2 Background .......... .................... 4
2. DEVELOPMENT OF THE CLASSIFICATION SYSTEM ......... . 4
2.1 Criteria for Intervisibility ................ 4
2.1.1 Maximum Hill Height .... ............. 52.1.2 Molal Hill:Height ...... .............. 7
2.1.3 Positive Features Per Mile ............. 7
2.2 Profile Selection ...... .................. 8
2.3 Landform Classification .................. .. 9
3. INSTRUCTIONS FOR CLASSIFYING LANDFORMS ............ .10
3.1 Map Selection ........... .................... ..103.2 Map Analysis ......... .................... 11
3.3 Profiling ....... ..................... 11
3.4 Regionalization ...... ................... 13
4. SUMMARY AND CONCLUSIONS ...... ................ 13
BIBLIOGRAPHY .......... ....................... 16
APPENDIX A: AMSAA SAMPLING OF REPRESENTATIVE TERRAIN . .27
APPENDIX B: PLANIMETRY OF LANDFORM CLASSIFICATIONREGIONS WITHIN WEST GERMANY ........... 31
DISTRIBUTION LIST ......... .................... 43
2

LIST OF ILLUSTRATIONS AND TABLES
PAGE
1. Line-of-Sight Profile Region 6Ca ............. 17
2. Fritzlar Area, Federal Republic of Germany ..... .18
3. Frequency Distribution Graphs, Maximum Hill Heights 19
a. Region 1 ....... ................... 19b. Region 2 ...... .................. 19c. Region 3 ........ ................... 19d. Region 4 ......................... .19e. Region 5 ....... .................. 19f. Region 6 .......................... 19
4. Regions 5 and 6,.Federal Republic if Germany . ... 20
5. Regions Aa and Ab, Federal Republic of Germany. 21
6. Terrain Regionalization, Federal Republic ofGermany ....... ..................... 22
7. Terrain Regionalization, Northern Maryland..... 23
8. Terrain Regionalization, Southern New Hampshire . 24
9. Hypsometry, Ansbach Area, Germany ............ 29
10. Hypsometry, Aberdeen Area, Maryland .... ........ 30
TABLES
TABLE I Class Intervals of Classification Descriptors . . . 25
TABLE II Landform Breakdown (West Germany) .......... 26
TABLE III Planimetry Summary By Region ................ 32
TABLE IV Planimetry of Landform Classification RegionsWithin West Germany .... ............... .33
3

THE NATICK LANDFORM CLASSIFICATION SYSTEM
1. INTRODUCTION
1.1. Objective.
The AMSAA objectives in the evaluation of tK ,fasking Pffectof landforms included the need for a system to describe differences inintervisibility in various regions world-wide and the estimation of line-of-sight probability as a function of range and terrain roughness thatcould be utilized in personnel exposure problems and studies of materielsystLeis effectiveness.
The purpose of this report is to describe the rationale for,and development of, the US Army Natick Laboratories landform classifi-cation system, and the recommended procedure for using this system.
1.2 Background.
The present investigation borrowed from pioneer work in land-form classification conducted at Natick Laboratories by Wood and Snell(1957, 1958, 1959, 1960) Anstey (1963, 1964, 1965, 1966) and by Hammondat the University of Wisconsin (1954). These studies were aimed primarilytoward the systematization and logical interpretation of terrain data toassist in the determination of design criteria for materiel, and second-arily toward the development of a universal system for the quantificationof landform data. While not specifically oriented toward intervisibility,the analysis of line-of-sight profiles was an integral element in theseinvestigations, and an evaluation of descriptors of landform physioqnomywas conducted.
Limitations in time and funding restricted the present studyto secondary data sources (tactical scale maps and aerial photographs)and to the use of a sampling technique (profiling) to obtain pertinentdescriptors. A part of the initial instructions placed the emphasis ofthe investigation on the terrain of the Federal Rer blic of Germany to-gether with its analogous regions in the glaciatee area of NortheasternUnited States. The evolved classification system may be expected toprovide a point of departure for a series of investigations on furtherquantification of landform physiognomy.
2. DEVELOPMENT OF THE CLASSIFICATION SYSTEM
2.1 Criteria for Intervisibility.
One of the specific relationships of line-of-sight probabilitystudies and the terrain in which it is conducted is obscuration or thescreening effect caused by the interference of higher elevations be-tween the elevation of the observer and that of the observed. Therefore,
4

the major topographic considerations for study in any line-of-sightproblem are the height and number of hills that would interfere withintervisibility. It is recognized that size and shape of vegetationand buildings as well as atmospheric effects are also limiting condi-tions for visibility distance, but they are not a part of the presentstudy.
2.1.1 Maximum Hill Height (local relief . In the presentstudy the first parameter to be determined was maximum hill height (seeTable 1). It is defined as the difference in elevation of the highestand lowest points on a map. These points were connected by a line-of-sight profile (see Figure 1) which resulted in a continuous but irregu-lar "slope" between the two points. It is recognized that normallythere will be numerous irregularities or "peaks" along the profile whichmust be considered because of their masking effect on intervisibility.Due to the necessity of differentiating the maximum hill height from allof the other "peaks" or hills shown on the profile, each with its ownupilope and downslope relief, it was decided to refer to this first digitin the code as maximum hill height (local relief). In other words, itis local relief of the map area. Maximum hill height is not the reliefto an adjacent valley if there is a lower valley on the same map sheet,and it is not the elevation above sea level of the highest point on themap.
This digit initially clas sifies the entire large-scale map on
which it is located, unless the locations of nickpoints along the pro-file show that most of the map is of a different relief classification(i.e., belonging to a higher or lower elevation area shown on an adja-cent map). In the original planning the first digit of the classifica-tion system was the sole regional index and would have been labeled asthe actual range of relief found in the region. This plan was satis-factory in the lowlands but could not be used in mountains because ofthe several modifiers required to adequately describe each of a largenumber of diverse small areas which occur there. For this reason, thefirst digit (numeric) refers to the ranges of relief in the classification(see Figure 2).
Frequency diagrams were compiled to show the range of variationin descriptor characteristics that could be found within a region, aswell as the number of times the values occur. The central tendency ofthe data in Figures 3.a - 3.f shows the nature of regional adherence tothe classification scheme. In some instances these figures show thatvalues were included which exceed the range of the original classifica-tion. This was the result of combining tiny regions, that would bedifficult to show on a map of small scale within a larger region. On alarge scale map, these tiny areas would be indicated as separate regions.The incidence of values found in a region beyond the range of the originalclassification shows a need for redesignation of the regional descriptor.The small sample size shown for Region 6 results in a double maximum, butthis probably would disappear with an increase in the sample size. Anotherproblem is illustrated for Region 5, where a number of occurrences in the
5

range 451 to 475 indicates that these slopes probably should have beenin Region 6, but because of their small areal extent they were includedwithin Reqion 5.
A large incidence of values (peak) for one descriptor at eitherend of the histogram, or a double maximum within the histogram usuallyindicates that the region is not homogeneous in terms of the selectedcriteria or class interval. If the peaks are closely spaced, the plotmay indicate that the arbitrary division between classes is actuallydividing a natural region, and the interval should be changed in afuture reclassification scheme or a modification of the present scheme.The outer limits shown in Figures 3a thru 3f thus become the actualdescriptors of the region regardless of the central tendency of thedata.
The map grid derived from plotting the borders of the 1:50,000scale sheets on a national or continental map gives a convenient meansfor arbttrary compartmentalization within the broad natural compartments.The maximum hill height on each of these map sheets is an essentialfeature of the classification scheme. This arbitrary compartmentalizationreserves the local relief data for various possible sub-region uses.There is no intention of combining all upland area and classifying itaccording to the highest elevation found in the whole area. Rather, theobjective is to sort out those portions of the uplands and lowlands whichhave common characteristics, even though these may be yery small regionsor subregions, and may require some subsequent regrouping for mappingpurpuses.(see Figure 4).
The scale at which the classification is to be plotted determinesthe amount of area included in each class. Obviously, narrow, flat bot-tomed valleys in mountainous regions, while clearly delimited on largescale maps, cannot be accurately depicted as separate regions on smallscale maps, and would be shown as an integral part of a large mountainousregion. Also, a small isolated peak standing above its neighbors cannotbe accurately delimited and labeled except on a very large scale map.If all landscape features are plotted on very large scale maps, the indi-vidual differences between landforms are clearly seen, and using thepresent classification system, each slope can be identified and de-scribed quantitatively. For example, at a scale of 1:5,000, areas assmall as 10 meters square can be delimited and classified. When con-sidering an area as large as the Federal Republic of Germany or North-eastern United States, it is necessary to group individual small land-scape features into traditional large landform units (plains, mountains,hills etc.) which can be differentiated quantitatively.
Figure 2 shows the landforms in the Fritzlar district ofGermany, an area of approximately 21 X 22 km, which permits detaileddemarcation of landform regions. Note, however, that on the map ofthe Federal Republic of Germany (Figure 5) it is impossible to showthe lowland detail, and consequently, the entire region is given theclassification of the highlands. In general, transfer and conversion
6

of regional information between maps of different scales causes lossof detail going to smaller map scales or over-generalization when goingto larger map scales.
Each of the 100 meter grid areas on the Fritzlar diagram hasa specific highest elevation, but this mass of data has no meaning forthe district as a whole without a means of compartmentalizing it. Datato be used in studies of comparability must all be obtained from thesame sized area and from materials of the same scale and contour interval.
2.1.2 Modal Hill Height (modal local relief). The modal hillheight (modal local relief) was determined by assigning an alphabeticcode (see Table 1) to each slope in each profile, and finding the frequen-cy of occurrence of each relief category for all of the profiles drawnfor each map sheet. These were later combined for all portions of con-tinuous map sheets falling within the same maximum hill height category.The letter code, representing the most frequently occurring category,was used as the first modifier of the landform region designator,(maximum hill height) and as an indicator of a sub-region.
Some rare bi-modal slope conditions were found within a singleregion. Normally, the most frequent incidence is shown immediately afterthe maximum hill height indicator, and, if significant, the second mostfrequent incidence is shown. In most instances there is only one mode,but if a second sample size is nearly as large it should be recognizedin the region code as a second modifier.
Isolated hill masses (inselbergs) in a lower hilly area, ora series of lower valleys in a relatively higher hilly area, normallyresult in different local relief sample sizes in the slope frequencystudy. Although these conditions iihdicate a need for further divisionof subregions, there was not time in the present study to constructthe large number of profiles that would have been required to determineadditional subregions with two modal hill height designators (seeFigure 6).
Additional slope samples usually removed the bi-modal problem,but it usually did not change the regional boundary or the high incidenceof slopes in a different classification category. A change in classintervals also failed to remove the duality, inasmuch as these occurredin categories A thru K, the entire range.
2.1.3 Positive Features Per Mile. The number of positivefeatures per mile is the usual second modifier in the classificationcode (see Table 1). This number is the average frequency of all "peaks"on all of the profile segments which fall within a given maximum hillheight category. In this classification system a positive feature musthave more than 10 feet (3 meters) of relief on both its upslop and down-slope sides. This average is an index of terrain roughness in theregion.
7
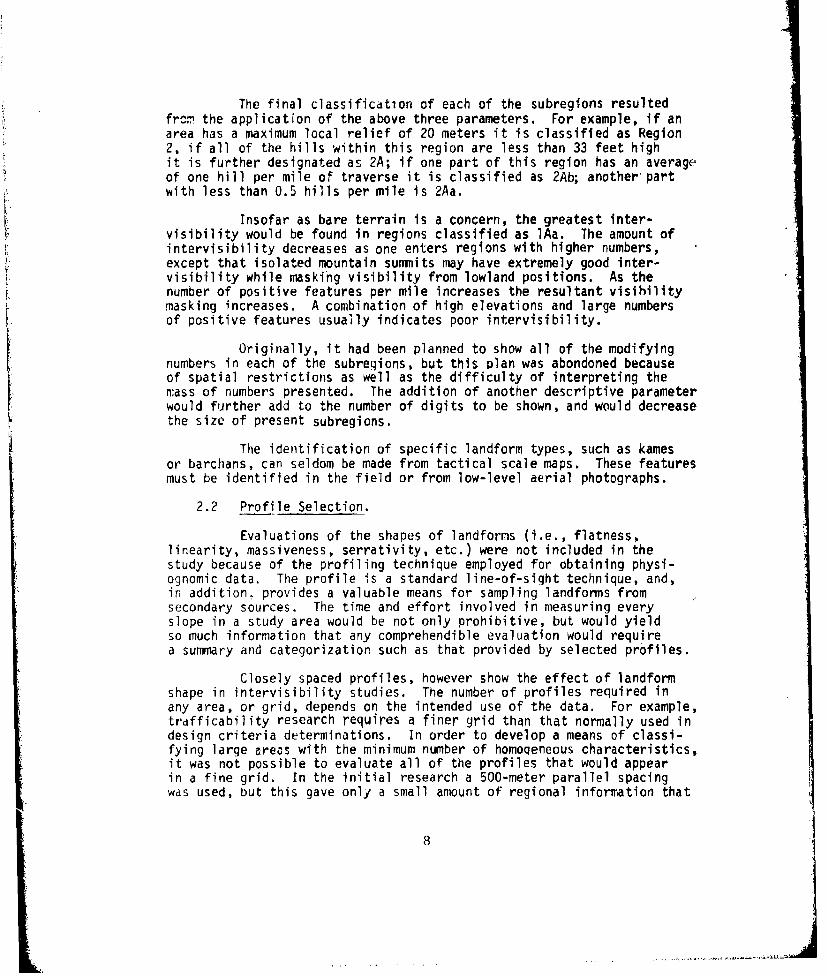
The final classification of each of the subregions resultedfr= the application of the above three parameters. For example, if anarea has a maximum local relief of 20 meters it is classified as Region2, if all of the hills within this region are less than 33 feet highit is further designated as 2A; if one part of this region has an averageof one hill per mile of traverse it is classified as 2Ab; another partwith less than 0.5 hills per mile is 2Aa.
Insofar as bare terrain is a concern, the greatest inter-visibility would be found in regions classified as lAa. The amount ofintervisibility decreases as one enters regions with higher numbers,except that isolated mountain summits may have extremely good inter-visibility while masking visibility from lowland positions. As thenumber of positive features per mile increases the resultant visibilitymasking increases. A combination of high elevations and large numbersof positive features usually indicates poor intervisibility.
Originally, it had been planned to show all of the modifyingnumbers in each of the subregions, but this plan was abondoned becauseof spatial restrictions as well as the difficulty of interpreting themass of numbers presented. The addition of another descriptive parameterwould further add to the number of digits to be shown, and would decreasethe size of present subregions.
The identification of specific landform types, such as kamesor barchans, can seldom be made from tactical scale maps. These featuresmust be identified in the field or from low-level aerial photographs.
2.2 Profile Selection.
Evaluations of the shapes of landforms (i.e., flatness,linearity, massiveness, serrativity, etc.) were not included in thestudy because of the profiling technique employed for obtaining physi-ognomic data. The profile is a standard line-of-sight technique, and,in addition, provides a valuable means for sampling landforms fromsecondary sources. The time and effort involved in measuring everyslope in a study area would be not only prohibitive, but would yieldso much information that any comprehendible evaluation would requirea summary and categorization such as that provided by selected profiles.
Closely spaced profiles, however show the effect of landformshape in intervisibility studies. The number of profiles required inany area, or grid, depends on the intended use of the data. For example,trdfficability research requires a finer grid than that normally used indesign criteria determinations. In order to develop a means of classi-fying large areas with the minimum number of homoqeneous characteristics,it was not possible to evaluate all of the profiles that would appearin a fine grid. In the initial research a 500-meter parallel spacingwas used, but this gave only a small amount of regional information that
8
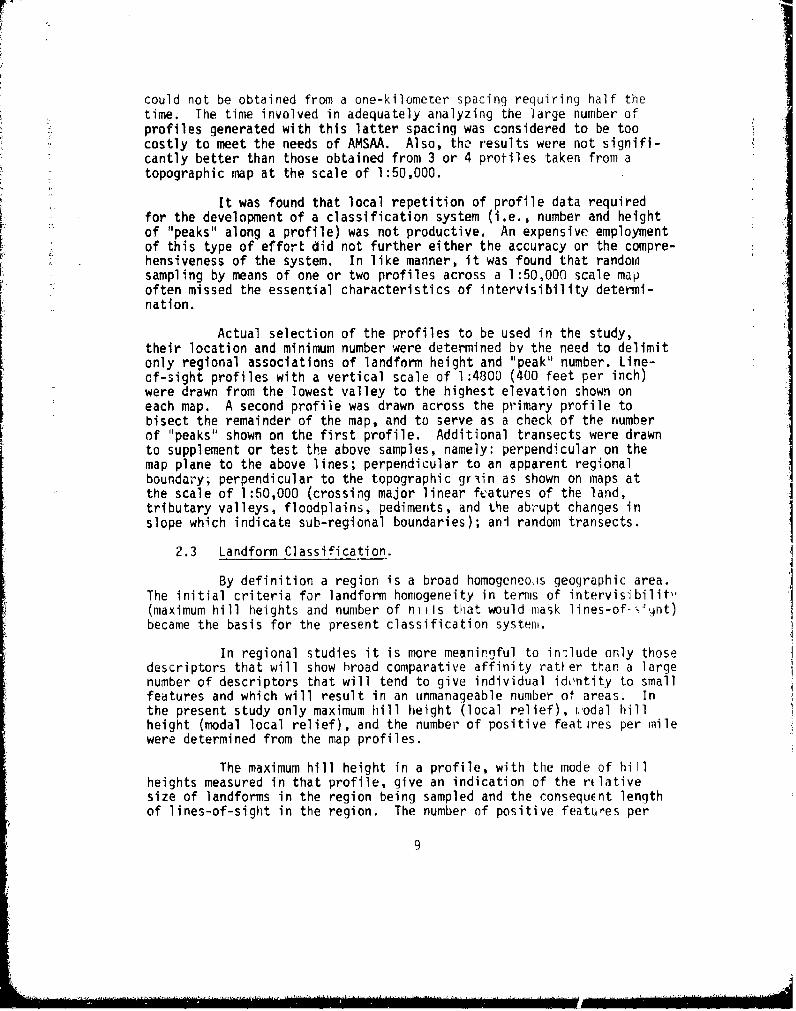
could not be obtained from a one-kilometer spacing requiring half thetime. The time involved in adequately analyzing the large number ofprofiles generated with this latter spacing was considered to be toocostly to meet the needs of AMSAA. Also, tho results were not signifi-cantly better than those obtained from 3 or 4 protiles taken from atopographic map at the scale of 1:50,000.
It was found that local repetition of profile data requiredfor the development of a classification system (i.e., number and height
F of "peaks" along a profile) was not productive. An expensive employmentof this type of effort did not further either the accuracy or the compre-hensiveness of the system. In like manner, it was found that randomsampling by means of one or two profiles across a 1:50,000 scale mapoften missed the essential characteristics of intervisibility determi-nation.
Actual selection of the profiles to be used in the study,their location and minimum number were determined bv the need to delimitonly regional associations of landform height and "peak" number. Line-cf-sight profiles with a vertical scale of 1:4800 (400 feet per inch)were drawn from the lowest valley to the highest elevation shown oneach map. A second profile was drawn across the primary profile tobisect the remainder of the map, and to serve as a check of the numberof "peaks" shown on the first profile. Additional transects were drawnto supplement or test the above samples, namely: perpendicular on themap plane to the above lines; perpendicular to an apparent regionalboundary; perpendicular to the topographic griin as shown on maps atthe scale of 1:50,000 (crossing major linear features of the land,tributary valleys, floodplains, pediments, and Pie abrupt changes inslope which indicate sub-regional boundaries); ani random transects.
2.3 Landform Classification.
By definition a region is a broad homogeneois geographic area.The initial criteria for landform homogeneity in terms of intervisibilit,'(maximum hill heights and number of nlils that would mask lines-of-,•.-nt)became the basis for the present classification system.
In regional studies it is more meaningful to in'lude only thosedescriptors that will show broad comparative affinity ratler than a largenumber of descriptors that will tend to give individual idontity to smallfeatures and which will result in an unmanageable number of areas. Inthe present study only maximum hill height (local relief), ,odal hillheight (modal local relief), and the number of positive featires per milewere determined from the map profiles.
The maximum hill height in a profile, with the mode of hillheights measured in that profile, give an indication of the rilativesize of landforms in the region being sampled and the consequent lengthof lines-of-sight in the region. The number of positive featues per
9

mile indicates the dnrzity of landforms or ruggedness of the t3pographyri iqg above the plain or valLy floor. The conversion of these datato positive featires per kilometer is shown in Table 1. To adequatelydifferentiate all elements of the landscape by numerical descriptors,class intervals were selected for the full range of measurements to bemade in the study area with tne parameters that had been selected,These numerical descriptors do not fuliy describe the individ,'- land-forms in the study area, but they do provide a means for dett inationof the global incidence if these parameters and show areas su .able fordetailed studies of representative types.
3. INSTRUCTIONS FOR CLASSIFYING LANDFORMS
3.1 Map selection.
The available coverage of tactical scale maps and aerialphotographs for the study area determines the detail that will appearin the i'inal product as well as the time that will be required in makinga complete analysis of these materials. The scale of these materials,the contour-interval of hypsometry, date and methods of surveys, pro-jection and method of compilation, and cartography vary widely fordifferent parts of the world and will influence results obtained.
Uniformity of results can be increased by use of the same series ofmaps for the entire study, such as Army Map Service Series M745 ata scale oi 1:50,6OC for the whole study area together with USAF airphoto coverage at 1:25,000. If complete coverage of these materials isnot available for the study area, other maps showing topography may besubstituted only after checking their agreement in contour demarkationi in areas of duplicated coverage.
The crudest topographic maps, those showing only spot elevations
and hachures, may be used with aerial photographs to determine regions ofmaximum hill height only. They do not have sufficient slope detail forthe other elements of the classification system.
Maps with elaborate detail, such as those at a scale of l:5,O00give a precision to regional boundaries that cannot be transferred tosmaller scale maps. The Fmall bends and turns are lost within the widthof a much more generalized boundary line through the area. Selection ofmap scale, therefore, should be related specifically to the use for whichthe work is intended. Maps of scales smaller than 1:100,000 (i.e.,1:250,000 etc.) are isually unsatisfactory for topographic analysis, butmay be used to show national or continental distributions of regionalfeatures which had been determined from large scale maps.
Normally, if a choice is available, selection should be (1)largest scale that gives nmnplete coverage of study area, (2) finestcontour interval, or greatest number o0 contour: per unit area, (3)photogrammetric, rather than compilatior from reconnaissance methods,and (4) hypsometry, not plastic shading.
10
I-,

3.2 MaD Analysis.
The established criteria and classification code (Table 1)dictate the order of activities during the analysis phase. Some supple-mental suggestions may prove useful and time-saving.
Cover each map sheet with tracing paper, and work over atracing table with a source of light under the map. After locating thehighest and lowest elevation points on the map, and drawing a connectingline, the initial profile can be plotted directly over the line. (Note:the lowest elevation is usually on the edge of the map at the end ofdrainage lines; the highest point is usually on the opposite edge of themap sheet). 1
The difference in elevation between the highest and lowestelevations shown on the initial profile is the initial regional classifier.ThIs figure is often misleading, especially if only one map sheet is com-pleted for the entire region. It can be corrected by comparison, withdata from adjoining sheets. A hill mass, for example, is often a partof a larger system, and may have to be re-classified. In other words,an entire hill mass with homogeneous characteristics should have oneclassifier for maximum hill height (local relief) regardless of thenumber of sheets on which it is depicted. If each large scale map areais plotted as a grid on a small scale national map, the overall distri,-bution of each region can be seen (Figure 4).
After the regional pattern of maximum hill heights has beendetermined for the study area, an analysis of the profiles for each mapsheet is conducted to find modal local relief and number of positivefeatures. The number of profiles required for each sheet is dependenton the complexity of relief shown on the sheet. A sheet showing verylittle relief of any type could be adequately sampled with a single pro-file. Where there is equal and linear distribution of landforms acrossthe sheet, one or two profiles may be sufficeint. The test for signifi-cance is seen in the amount of disagreement found in profiles in differentparts of the map. Where two profiles agree in classification, there isprobably no need for additional checking.
3.3 Profiling.
The initial profile is analyzed by counting the "peaks" shownon the line. For example, Figure 1 illustrates a profile with 3 suchpositive features. While this illustration is obviously in Region 6,because the "local relief" is in excess of 400 meters, two of the "peaks"are less than 35 meters in height and are initially classified in RegionC for the modal hill height. This small number of positive features isnot satisfactory without further checking. Obviously, several parallelprofiles are required to substantiate this classification. However, ifthey are in agreement, the region would be classified as 6C, and further6Ca because there are fewer than 0.8 positive features per kilometer.
11

Further study of the area illustrated in Figure I disclosesthat it is a rolling upland with deeply dissected valleys which have
eroded some of the borders leaving a rough "badlands" type of topogra-phy in several places. This typical situatiori requires several addi4.tional profiles at right angles to the initial profile in order toprovide an adequate sample of heights and number of hills per kilo-meter in the region.
A clear plastic template with elevation and distance ticksfor the scale being used will give a rapid result. The spacing ofcoordinate points along the profile is dependent on the purpose ofclassification; checking elevations at each 200 meters of horizontaldistance may be satisfactory for a reconnaissance type of evaluation,but it will not yield sufficient information for determination ofaccurate heights and numbers of positive features per kilometer. Thelatter requires a coordinate spacing at least 50 meters.
The profile can show only what is indicated in the hypsometryof the map. A contour interval of 10 meters will screen all featuresof a lesser height between these intervals. A classification systembased on "peaks" being identified as at least 3 meter (10 foot) changesin elevation requires photographic stereocomparography to provide theessential data. Otherwise, the basis should be changed.
The profile clearly shows regional homogeneity. Any questioncan usually be resolved with additional profiling. Where a single largepeak dominates a low hill mass, it is obviously in a different region,and should be delimited accordingly. Where a lowland area is interruptedby a mass of slightly rolling landforms, these "peaks" should be classifiedas hills clearly distinct from the lowland. The profiling must sampleall portions of the map sheet that appear to be different in any wayfrom the initial profile.
When profiling is complete for the map sheet under study, it
will be found that profile segments may have been classified to fallinto different regions and, consequently, the maximum hill height (localrelief) of the initial profile is no longer applicable. Each profilesegment will require a new determination of maximum hill height (localrelief).
In some situations the maximum hill height (local relief)will have to be extended beyond the initial profile to include partsof adjoining maps. This usually occurs in areas where the adjacent areais only slightly lower than the initial profile indicator. Where avery small region of a different classification has been delimited, itmay be included as a part of the higher region if it could not be seenon a small scale map (see Figure 2). In the latter situation, themodal hill height and number of positive features per mile should berecomputed to include all of the data for the new combined region.
12

"Peaks" along the profile are counted for positive featuresonly when their shortest slope is in excess of 3 meters (10 feet). How-ever, in the determination of modal hill height, all slopes are countedalong the profile (both upslopes and downslopes of all discernible"peaks"). Slopes of different angles between a given peak and an ad-jacent valley are counted as a single slope.
3.4 Regionalization.
In the present classification, the maximum hill height (localrelief) has been designated as the regional determinant and the modi-fiers (modal hill height and positive features per mile) are indicatorsof subregions because they divide the maximum hill height region intosmaller areas (see Figures 4 and 5). Either of these modifiers may beused as the scale criteria for a particular purpose as in Figure 5.
Figure 1 illustrates several abrupt changes in slope (i.e.points A and B) or nickpoints. Regional boundaries are establishedby connecting nickpoints which have been identified on the profilesand plotted as x points on the small scale national map. The contourline at a particular nickpoint is followed across the map to connectwith an adjacent nickpoint of the same or related slope to interpolateregional boundaries. For example, if a given region as delimited bynickpoints is shown on two adjacent profiles to be at least the 400meter elevation, the contour lines demarking that elevation would beused in determining the regional boundary on a given map sheet be-tween these profile points. This boundary, together with its segmentstaken from adjoining 1:50,000 scale sheets, would then be transferredto a smaller scale map (i.e., 1:250,000) to show the extent of thewhole region or subregion (see Figures 6, 7, and 8).
In some instances, it is necessary to move the line connectingnickpoints upslope or downslope from the indicated contour in order tomore accurately determine the regional boundary, but the configurationof the line should conform to the nearest higher contour shape.
Boundary lines are zones of transition from one type of land-form complex to another, and the indicated boundary may have been"smoothed" or generalized to fit a different scale map. For this reason,an ideal typical regional sample should be obtained in core areas ratherthan near boundary lines.
4. SUMMARY AND CONCLUSIONS
To determine criteria for regional landform boundaries and to drawmaps to include this information, it is necessary (1) to select pertinentlandforms,(2) to determine landform characteristics that have regionali.aning, (3) to devise a means for classifying these characteristicsand accurately locating them, (4) to develop a system of symbolization
13

to assist in the presentation of the areal differentiation of these land-forms, and (5) to rel&te these to specific problems requiring landforminput.
TIe present scheme was devised to show the application of land-form characteristics to intervisibility on a regional basis. In attemptingto describe landform features on this basis it is necessary to determinehow detailed the description must be in order to shown the relationshipof this feature to others of a similar type and to present the uniquecharacteristics that distinguish this feature from all others. In region-alization the primary requirement is to show broadened relationships,and therefore only a few descriptors are required to show individualdifferences. Selection of the proper descriptor categories tends toeliminate questionable or unlike features and results in homogeneousfeatures.
In the present study the features selected were maximum hillheight, modal hill height and number of positive features per mile.The combination of coded values for each of these features became theregional classification. Research is being conducted or, additionalcriteria for possible inclusion in the classification system. The testis whether these would add significantly to the understanding of therange of natural conditions in each region without greatly increasing
the number of subregions. Also, a determination should be made ofthe need for such additional information, and whether it could beanalyzed more efficiently on a separate map.
In the present study data, each of the above descriptors wastaken from individual line-of-sight profiles from 1:50,000 scale mapsfor the study area. The interpretation of profile data was assistedby coimpiling frequency curves for each of the above descriptors. Theprofiles are useful for a number of investigations in addition to Jintervisibility, such as those involving defilade, enfilade, slope andgradient.
A few regions contain a large fraction of the totdl area.Table II shows that six of the most frequently occurring landformregions comprise over 44 per r fit of the total area of the FederalRepublic of Germany. Terrain models compiled from data representativeof these regions would yield a large areal significance from a relativelyfew types.
Several smaller regions were combined in order to developthe larger regions. In some cases this resulted in double peakedhistograms for modal hill height. If necessary, these regions may bereclassified on larger scale maps for purposes of war gaming. Whentaking a terrain sample from such regions, care should be exercisedin the interpretation of the resulting slope data.
14

The Landform Classification System has been successfully appliedto several world environments (Thailand, Vietnam, Germany, and the UnitedStates). The system is especially useful in depicting analogous terrain"from various parts of the world. It gives a clear picture of landformdifferences applicable to intervisibility, mobility, fire problems,target acquisition, and other military uses. The data obtained facili-tate the development of line-of-sight models and representative terrainmodels. The system is a positive step forward in the development ofterrain quantification concepts.
IJ
15

5. BIBLIOGRAPHY
Anstey, Robert L., Visibility in a Tropical Forest, Special Report53, US Army Natick Labs, 1963.
Anstey, Robert L., "Visibility Data Processing for Target Identifi-cation," Proceedings, Project DUTY Syanposium, Denver, 1964.
Anstey, R. L., Physical Characteristics of Alluvial Fans, TechnicalReport ES-20, US Army Natick Labs, 1965.
Anstey, R. L., "Application of Quantified Terrain Data to VehicleDesign Criteria," Proceedings, 5th US Army Science Conference,West Point, 1966.
Hammond, E. H., "Small-Scale Continental Landform Maps," Annals,American Geographers, Vol. 44, No. 1, 1954.
Wood, W. F. and Snell, J. The Dispersion of Geonorphic DataAround Measures of Central Ten cy and Its Application, ResearchStudy Report EA 8, US Army Natick Labs, 1957.
Wood, W. F., and Snell, J. B. A Device and Method for AnalyzingLine-of-Sight, Technical RCport EP-lOl, US Army Natick Labs, 1958.
Wood, W. F., and Snell, J. B., Predictive Methods in.TopographicAnalyses 1, Technical Report EP-112, US Army Natick Labs, 1959.
Wood, W. F., and Snell, J. B., Predictive Methods in TopographicAnalyses II, Technical Report EP-114, US Army Natick Labs, 1959.
Wood, W. F., and Snell, J. B., A guantitative SUstem for ClassifyingLandforms, Technical Report EP-124, US Army Natick Labs, 1960.
16

LU.
0
LUU
0 IOCLu
zc
z c
0
o LL 0C 5
LU-vi NIVOV 1IA
S~UW NI NOIIVA313
17

CD
18U

w 10.4-. U4Iw
- aj~ za
toll.A
96 9
- 400
0d 0. Col .7
C6 C.'
ac CJ
0--kA0.
I 9C
4 0
*do ap lPtSE)q~j UU* *1I-; L

-. 2Ab
IA.
4Ab -
7 A-
*A IA lobn~ 3,.U
5Kb 3 ~ EIN
2A20 4Bes Available CNK,"

t ' 2Ab
35 0 5 50
Adld
311 ..p.e .
- Ab: SC Ab . 3- .
>~ ~ >2__
555D
4Sc Ab REGIONS5018.
P.. S Sb 508d '( P .. , .. ~.N. FRITZLAR AREA
?Ab 04AbD. .- ANSCACH AREA
5 D d I ~ b 4 6 D d5 0
a ___lb
Oo .6 Sd
6 /.d.~pp>5S0@~ 500 dI .
3C- / C £0
14021

c36
- 1. 2A6 Surma*o
2in. 3wt~
--- -
3Ad 44k 3 BEnm(k
~>~\2Ab Sit--.<
)A6~ 36 I~ol -a -1 --
4C.
/ ~40,~< /So
-K Kb b
~"7Ab 40, i
SO Edi f o 1
Figure~~~~~~~C 6.TranR46nlzto.FderlRpbi fGray3D~d Kb Sb 22 BetAviabeb

C41V44
I'mS
laa
0z
41, 10
i~. .........."II C
T.
enev
j it
......... . ...
Best Available C.(,-
23

INii06
EdoP
in z
0A
ik.LnC
Inan
24)
....... . ... ..7

Table 1. Class Intervals of Classification Desc-riptors.
MAXIMUM HILL HEIGHT .LOCAL RELIEF
DESCRIPTOR CLASS INTERVAL
1 0 -10 METERS 0-33 FEET2 10 -30 33 -993 30 -50 99 - 16554 50 -100 165-3305 100 -300 330 -9906 OVER 300 OVER 990
MODAL HILL HEIGHT (LOCAL RELIEF)
DESCRIPTOR CLASS INTERVAL
A 0- 10 METERS 0- 33 FEETB 10 -20 33- 66"C 20 -35 66- 115D 35 -50 115 -165E 50 -75 165 -248F 75 -100 248 -330G 100 - 125 330 - 413H 125 - 150 413 - 4951 150 -175 495 - 578J 175 -200 578 - 660K OVER 200 OVER 660
NUMBER OF POSITIVE FEATURES PER MILE
DESCRIPTOR CLASS INTERVAL
o 0 - 0.8 /KILOMETER 0 - 0.5 /MILEb 0.8 -1.6 0.5 - 1.0- 1.6 -2.4 1.0 - 1.5d 2.4 -3.2 1.5-2.0* 3.2 -4.0 2.0-2.5f OVER 4.0 OVER 2.5
25

Table I, Landform Breakdown.(W. Germany)
OCCURRENCE PERCENT
TERRAIN TYPE FREQUENCY AREA (kin2) AREA
IAa 14 16,688 7
2AL 11 33,164 13
3Bc 7 6,239 3
4Dc 10 9,298 4
5Dd 5 38,865 16
6Kc 2 4.946 2
49 109,200 45
FRACTION OF TOTAL COMPARTMENTS: 49/1.r4 : 32%
FRACTION OF TOTAL AREA: 109, 200/ 248, 014: 44%
26

APPENDIX A
AMSAA Sampling of Representative Terrain
MA4SAA selected sample areas to be digitized from the maps preparedunder the Natick Landform Classification System. In the original planthese samples were to be taken from each of the type regions developedin this study (i.e., a sample would be taken from region 5BDc, etc..A basic assumption was that a sample of a given size would be as validas the same size sample taken from any other part of the same region.Where complete coverage was not feasible, due to the amount of materialto be handled, the samples would be selected from that part of the
V region exhibiting the fewest unique features.
The sampling technique consisted of (1) determining subregions ofrequired homogeneous landform characteristics, (2) selecting repre-sentative sample areas for each of these regions, and (3) mapping thehypsometry of each of the sample areas.
The size of the sample was to be 12 km X 12 km. Each area wascovered by a series of 1 km X 1 km maps at the scale of 1:1250, havinga sheet size of 30" X 30" (see Figures 9 and 10); the contour intervalwas 1 meter. Drawing the contour lines on these maps involved stereo-comparagraphy of low-level aerial photography, preferably taken at 5000feet or lower. This photography is seldom available, and the resultingamount of detail to be shown within a subregion is dependent on existingphoto coverage, or it may be derived from large scale maps. Most of theavailable photography is from the altitude of 30,000 feet or higher.
Figure 9 shows the hypsometry for I sq. km in the Ansbach area ofGermany which waq classified as 5BDc under the present system (seeFigure 4-5). Figure 10 shows the hypsometry for 1 sq. km in the Aberdeenarea of Maryland which also is classified as 5BDc (see Figure 7). Acomparison of these two maps indicates general agreement in number ofcontours per unit of traverse across any part of either map. The slopeangles on both maps are similar, and the general physiognomy of theterrain is considered to be analogous. Other than the neat line, thesemaps show only contour lines which are read by digitizing machines andrecorded on magnetic tape as known elevations at known geographicalcoordinates. These data can be readily retrieved to construct terrainmodels or line-of-sight models for use in systems analysis of materiel.
Hypsometric maps show only the contours, they do not identify land-forms. They are not intended for mobility evaluation or for siting equip-ment or installations. No attempt was made to indicate abrupt changesin relief (boulder fields, stumps or downed trees) between contour lineson these maps even though these features are shown on the aerial photo-graphs.
27

Hypsometric maps at the scale of l:1250constitute representativesamples of subregions if they are taken from "cores" rather than fromregional borders. The incidence of unique conditions or atvpjca1.fea-tures in the data usually indicates that a regional boundary has beencrossed whether it has been accurately demarked or not, and thesedata should not be used in problems where representative topographyof a particular subregion is needed.
Complete agreement in details between representative samples, suchas that shown in Figures 9 and 10, may not occur in other parts of thesubregion. Problems encountered with general landfoyin conditions inone part of the subregion may be expected to occur commonly through-out the same subregion. Identical classification of landforms fromtwo separated areas is merely an indication of repetition of the samelandscape features selected for use in the classification system; itdoes not imply that all minor features in the two areas will conform.Additional classification digits are required to describe the characterof these additional aspects of the subregion. The regional classi-fication for topography in an extremely small area, such as one squaredecameter, may exactly match that for another small area, i.e., havethe same physical features in it. It is possible to classify areas ofthis scale for specific military needs using the technique developedin the present study.
The major advantage of the type of displays developed in the presentstudy is that relatively few areas require detailed mappinq or conversionto numbers by diqitizatlon machines to cover most of the terrain typesin a given country. One sample of topographic conditions from each ofthe subregions determined in this study would give a good representationof the total ranqe of land forms to be found in large diversified terri-tories such as the Federal Republic of Germany (Figure 6) or the North-eastern United States (Fiqures 7 and 8). Use of the data from analogsof the same subreqions in other countries, such as for South Vietnamin Western Thailand or Panama, would permit testing of equipment underidentical landform conditions without actually visiting politicallyinaccessible areas.
Digitization of sample hypsometric data from such analogous areaswill permit the utilization of representative topography from any worldarea for war qaming, equipment performance evaluation, machine studiesof materiel effectiveness, and other systems analyses. The hypsometricdata in the present study are particularly applicable to studies ofintervisability and the masking effect of terrain. They can also be usedfor rate of march, mobility, munition effects in defilade - enfilade sit-uations, field.of fire, logistics, and related military problems involv-inq the comparison of operations requirements with a possible environmen-tal limitation due to the masking effect of landforms or the battle-field cotifiguration.
28

I
.4II .1
/ - "/7 / // -½-�-� /7 gii
\\ / �7 -------- 7 ,,,// - II 'N
N' \ ,X' \\\\ (�/ / "
\� \\
/ \ � - II
a/
II / -
K 3/ N /
ill I I¶ I �(�( II I / /
/1 -c.'". ¶�¶ I, - /
* ' 'I� I�I'
iii �I, -�
/ \ !I i/� 7-
K' % \\\
/ -
I. I I, iI/
29

r
I�I1KTV1F�/r� >- VI 7/
(' /, ///
NN� �\ I //� /1//
�1/I ( '-5� N ----..-
K
K� � K- �7(,f N�
I-
/ / 7' Ji/ K ii
�S. A
* .'.".... N N.*A\\\./ LI
30

APPENDIX B
Planimetry of Landform Classification Regions Within West Germany
Warren K. Olson
The distribution of landform compartments as defined for West Ger-many under the Natick classification system has been investigated atUSAMSAA, using an electronic planimeter to determine the frequency ofoccurrence and percent Areal coverage for each landform type depictedin Fiqure 6. The Natiu system divides West Germany into 154 landformcompartments, 69 of which are unique combinations of identifiers per-taining to maximum local relief, modal local relief and number of posi-tive features per mile.
Table III indicates the areal distribution of landforms by maximumlocal relief only. It can be seen from the table that if Regions 1 and2 are taken to constitute "flat" terrain, approximately 28 percent ofWest Germany would fall into this category. Similarly, defining Regions3, 4 and 5 to represent moderately rolling to rolling terrain, resultsin 66 percent of the West German terrain being so classified. Theremaining 6 percent would be categorized as very rolling to ruggedterrain.
This coarse breakdown of terrain into categories for comparisonwith other systems may be further refined by including the descriptionsof amplitude (modal local relief) and frequency (positive features permile) in the generalization. These letter descriptors indicate the typeand magnitude of the oscillatory nature of the macro-terrain. As indi-cated in Figure 5, types Aa and Ab are generally flat regardless of theidentity of the maximum local relief descriptor. Nearly all compartmentsexhibiting ,a or Ab type relief are of classes 1 or 2. This trend isevident throughout Table IV, i.e., those regions exhibiting large maximumlocal reliefs are quite likely to have correspondingly large modal localreliefs. As a consequence of the construction of the classificationsystem, the modal local relief of a compartment must be no greater thanthe maximum local relief. There also appears to be a correlation betweenthe maximum local relief and the frequency with which positive featuresoccur (i.e., the frequency of the sine wave which, toQether with itsexpected amplitude, serve to characterize the expected oscillation withina given compartment).
The data presented in Table IV were used to construct Table II, inwhich the six most frequently occurring terrain types in West Germanyare listed. In some instances, compartments within one interval of themost commonly occurring class of modal local relief or positive featuresper mile were included in the computation of the area associated with
31

each of the six terrain type;i. This Jaw will be used in the future toisolate those types of terrain to be given the greatest emphasis in astudy designed to valid4 -te statistically th% ase of the Natick LandformClassification System in solving problems in military operations research.
TABLE III. PLANIMETRY SUMMARY BY REGION(MAXIMUM LOCAL RELIEF)
PERCENT NUMBER OF UNIQUE
REGION AREA COMPARThENTS DESCRIPTORS
1 9.2 17 2
2 18.5 19 6
3 12.6 34 144 14.7 41 18
5 38.7 32 19
6 6.3 11 10
TOTALS: 100.0% 154 69
32

TABLE IV. PLANIMETRY OF LANDFORM CLASSIFICATIONREGIONS WITHIN WEST GERMANY
DESCRIPTOR NUMBER AREA (KM2) TOTAL AREA
"REGION 1:
Aa 1 11065"2 3253 16744 3735 2056 1067 2938 599 1371
10 64811 7812 11913 2514 347
16,688
Ab 1 15472 40443 652
6,243
22,931
Percent Coverage of West Germany - 9.246%Number of Compartments - 17Number of Unique Descriptors - 2
33

TABLE IV. PLANIMETRY OF LANDFOIW1 CLASSIFICATIONREGIONS WITHIN WEST GERMANY (CONT)
DESCRIPTOR NUNBER AREA (LOQ12 TOTAL AREAREGION 2:Aa 1 1013
2 971
1,984Ab 1 10790
2 30583 7244 835 96386 59667188 15689 671
10 60711 41
33,164Ac 1 3311
2 5163 38444 372
8,043Ad 1 2598
2,598Bb 1 45
45
45,834
Percent of Grand Total Area 18.480%Number of Compartments = 19Number of Unique Descriptors 6
34

TABLE IV. PLANINETRY OF LANDFORM CLASSIFICATIONREGIONS WITHIN WEST GERMANY (CONT)
DESCRIPTOR NUMBER AREA (K142) TOTAL AREAREGION 3:
Ab 1 782 21493 422
2,649
Ac 1 1832 136
319
Ad 1 2632 10133 650
AD d 1 11981,2
1,198
Ba 1 2352 573
808
Bb 1 41802 1273 2544 233
4,794
Bc 1 19882 3573 1864 1065 10816 24797 42
6,239
BD e 1 122
35

TABLE IV. PLANIMETRY OF LANDFORM CLASSIFICATION
REGIONS WITHIN WEST GERMANY (CONT)
DESCRIPTOR NUMBER AREA (KM2 ) TOTAL AREA
REGION 3 (CONT):Cb 1 1560
2 36
1,596
Cc 1 3692 74
443
Cd 1 3212 333
654
Db 1 213
213 -
Dd 1 7519 2132 2439
9,958
Undefined 1 162 78
94 '
31,013
Percent of Grand Total Area = 12.505%Number of Compartments = 34Number of Unique Descriptors 14
36

TABLE IV. PLANIMETRY OF LANDFORM CLASSIFICATIONREGIONS WITHIN WEST GERMANY (CONT)
DESCRIPTOR NUMBER AREA (KM2 ) TOTAL AREAto REGION 4:
Aa 1 397
397
Ab 1 1642 15393 2564 2715 31
2,261
Ac 1 18862 12653 126
3,277
Ad 1 264
264
ABe 1 182
182
AE c 1 1809
1 ,809
Bb 1 4352 180
615
Bc 1 18252 17673 3964 39
4,027
Bd 1 18532 291
2,144
37

TABLE IV. PLANIMETRY OF L )FORM CLASSIFICATIONREGIONS WIMHIN WEST jERMANY (CONT)
DESCRIPTOR NUMBER AREA (KM2) TOTAL AREA
REGION 4 (CONT):
BD c 1 14902 1502
2,992
OD d 1 4681
4,681
Cc 1 4502 435
885Cd 1 52
52
Ce 1 1106
1,106
CD c 1 1064
1,064
Db 1 5752 5603 343
1,478
Dc 1 13852 23203 13514 1415 31
5,228
38

TABLE IV. PLANiMETRY OF LANDFORM CLASSIFICATION
REGIONS WITHIN WEST GERMANY (CONT)
DESCRIPTOR NUMBER ARELLK2j. TOTAL AREA
REGION 4 (CONT):BD c 1 1490
2 1502
2,992
BD d 1 4681
4,681
Cc 1 4502 435
885
Cd 1 52
52
Ce 1 1106
1 ,106
CD c 1 1064
1,064
1b 1 5752 5603 343
1,478Dc 1 1385
2 23203 13514 1415 31
5,228
38

TABLE IV. PLANIMETRY OF LANDFORM CLASSIFICATIONREGIONS WITHIN WEST GERMANY (CONT)
DESCRIPTOR NUMBER AREA (KM2) TOTAL AREA
REGION 4 (CONT):
Dd 1 6762 2743 16054. 3125 1203
4,070
36,632
Percent of Grand Total Area = 14.730%Number of Compartments = 41Number of Unique Descriptors 18
39

TABLE IV. PLANIMETRY OF LANDFOR14 CLASSIFICATION
REGIONS WITHIN WEST GEIMiA14Y (CONT)
DESCRIPTOR NUMBE AREA (Ak_ TOTAL AREA,
REGION 5:Bc 1 281
2 20
301
BD c 1 38232 1350
5,178
BD d 1i 2144
2,144
Cb 1 152
152
Cc 1 932 174
267
Cf 1 545545
CE b 1 13192
13,192
Dd 1 34852 8743 12472
16,831
De 1 126
126
DE c 1 9342 7753 3967
5,676
40

TABLE IV. PLANIMETRY OF LANDFORM CLASSIFICATION
REGIONS WITHIN WEST GEWANY (CONT)
EC TRL TOTAL AREA
REGION 5 (CONT):DE d I a286
2 13748
22,034
Eb 1 142
142
Ec 1 11852 8503 10378
12,413
Fc 1 27602 673 74
2,901
Fd 1 911
911
Gb 1 932 8320
8,413
Gd 1 1218
1,218
Ja 1 348
348
Kb 1 3190
3,190
95,982
Percent of Grand Total Area = 38.700%
Number of Compartments = 32
Number of Unique Descriptors = 19
41

I
TABLE IV. PLANIMETRY OF LANOFORM CLASSIFICATIONREGIONS WITHIN WEST GERMAY (CONT)
DESCRIPTOR NUER AREA (K%2) TOTAL AREA
REGION 6:
DEc 1 525
525
EC 1 778
778
EK b 1 482
482
EK c 1
869
869
EK d 1 2255
2,255
Gd 1 1809
1,809
GK b 1 1632
1,632
GK d 1 2243
2,243
Ka 1 183
183
Kc 1 48862 60
4,946
15,722
Percent of Grand Total Area = 6.339%Number of Compartments = 11Number of Unique Descriptors = 10
Grand Total Area = 248,014
42