Embed Size (px)
Citation preview
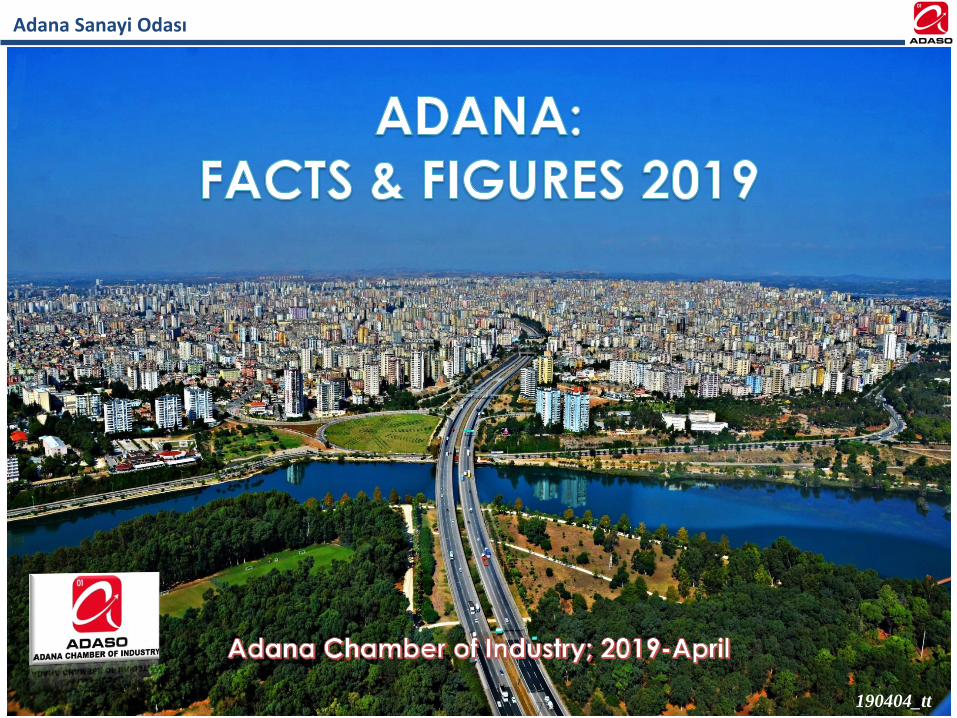
Adana Sanayi Odası
190404_tt
Adana Sanayi Odası
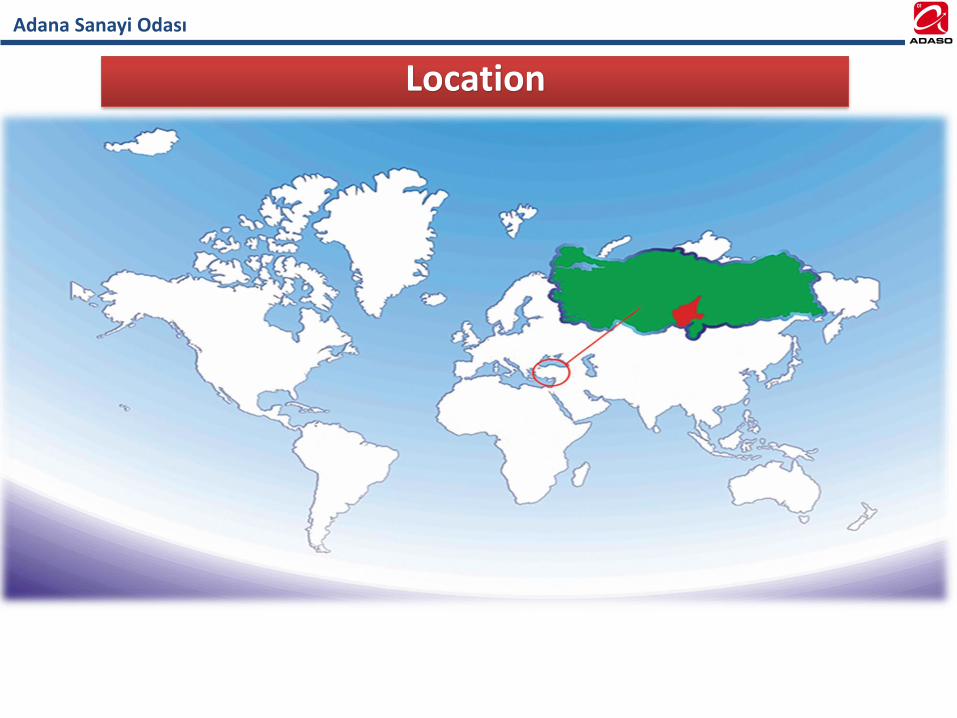
Location
Adana Sanayi Odası
Alt Başlık
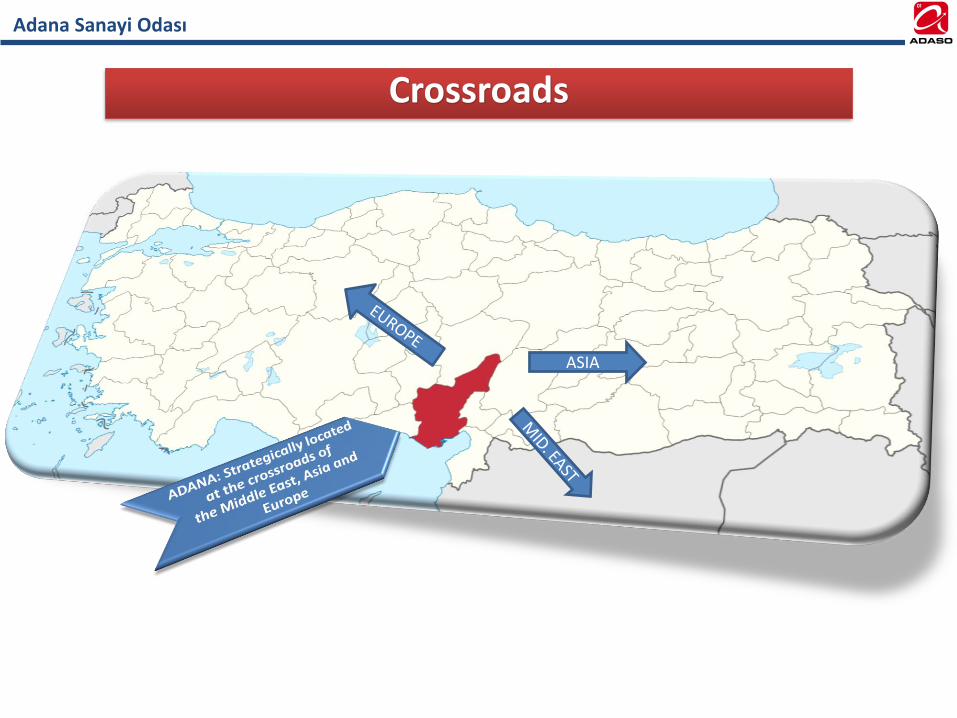
ASIA
Crossroads
Adana Sanayi Odası
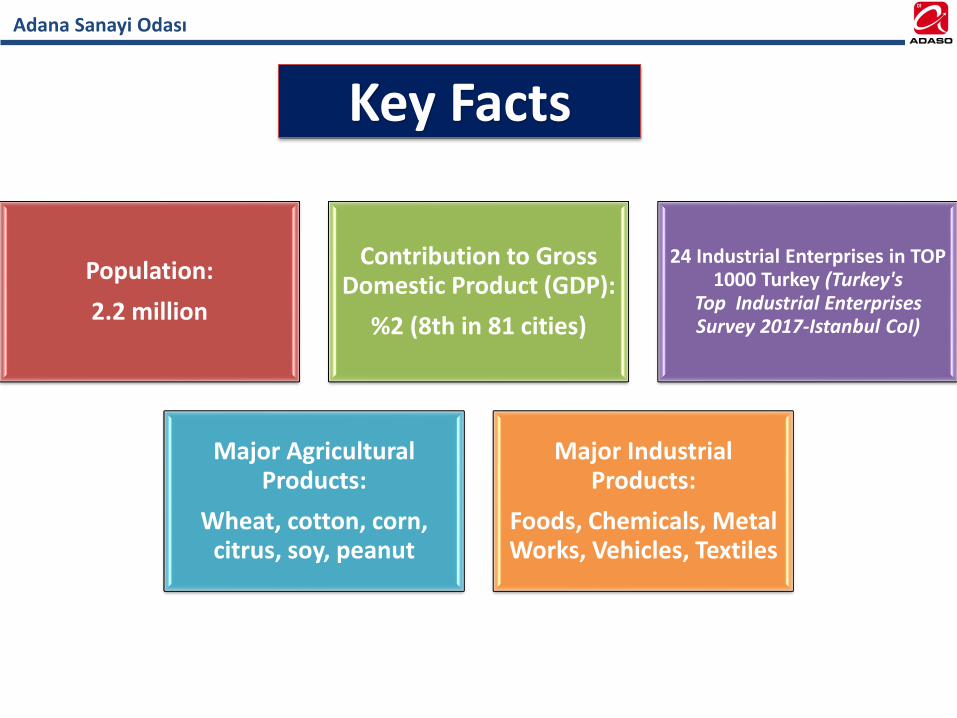
Population:
2.2 million
Contribution to Gross Domestic Product (GDP):
%2 (8th in 81 cities)
24 Industrial Enterprises in TOP 1000 Turkey (Turkey's
Top Industrial Enterprises Survey 2017-Istanbul CoI)
Major Agricultural Products:
Wheat, cotton, corn, citrus, soy, peanut
Major IndustrialProducts:
Foods, Chemicals, Metal Works, Vehicles, Textiles
Key Facts
Adana Sanayi Odası
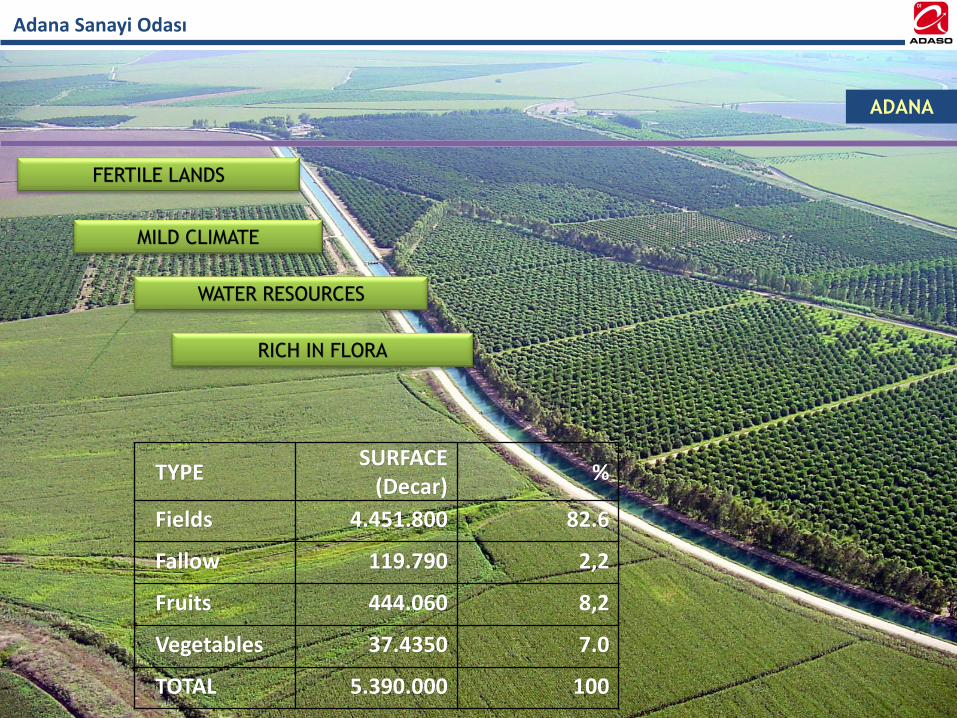
ADANA
FERTILE LANDS
WATER RESOURCES
MILD CLIMATE
RICH IN FLORA
TYPESURFACE
(Decar)%
Fields 4.451.800 82.6
Fallow 119.790 2,2
Fruits 444.060 8,2
Vegetables 37.4350 7.0
TOTAL 5.390.000 100
Adana Sanayi Odası
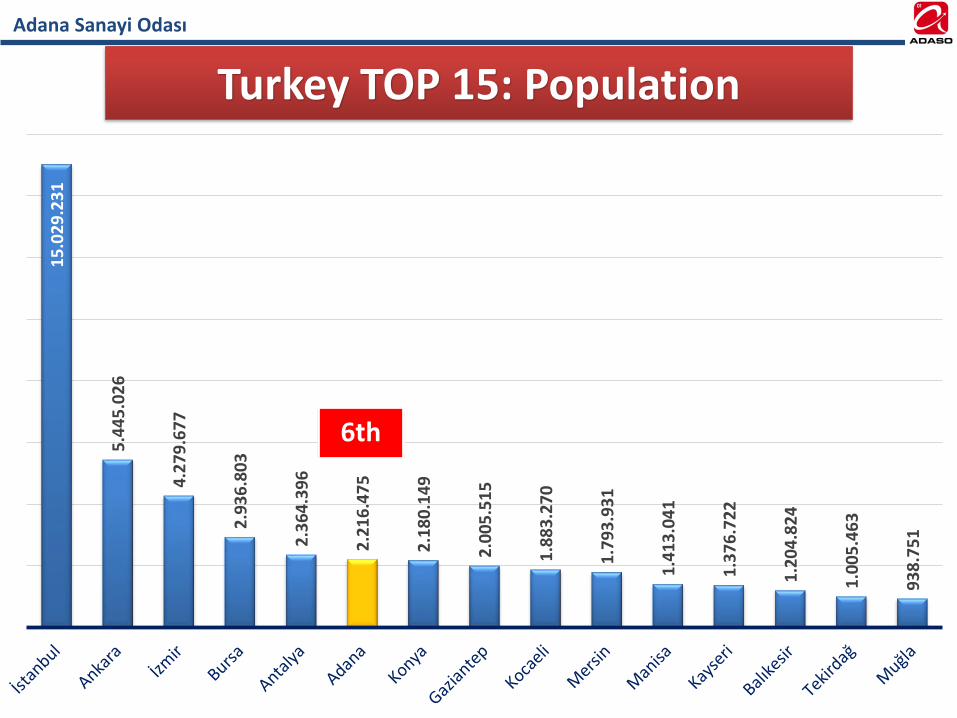
Turkey TOP 15: Population1
5.0
29
.23
1
5.4
45
.02
6
4.2
79
.67
7
2.9
36
.80
3
2.3
64
.39
6
2.2
16
.47
5
2.1
80
.14
9
2.0
05
.51
5
1.8
83
.27
0
1.7
93
.93
1
1.4
13
.04
1
1.3
76
.72
2
1.2
04
.82
4
1.0
05
.46
3
93
8.7
51
6th
Adana Sanayi Odası
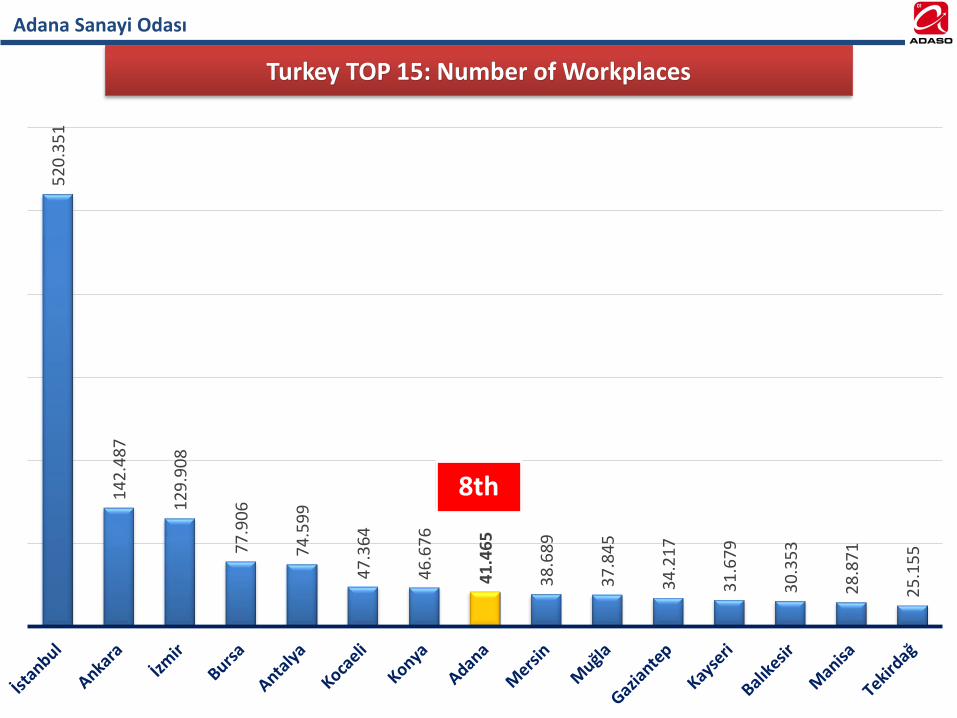
Turkey TOP 15: Number of Workplaces5
20
.35
1
14
2.4
87
12
9.9
08
77
.90
6
74
.59
9
47
.36
4
46
.67
6
41
.46
5
38
.68
9
37
.84
5
34
.21
7
31
.67
9
30
.35
3
28
.87
1
25
.15
5
8th
Adana Sanayi Odası
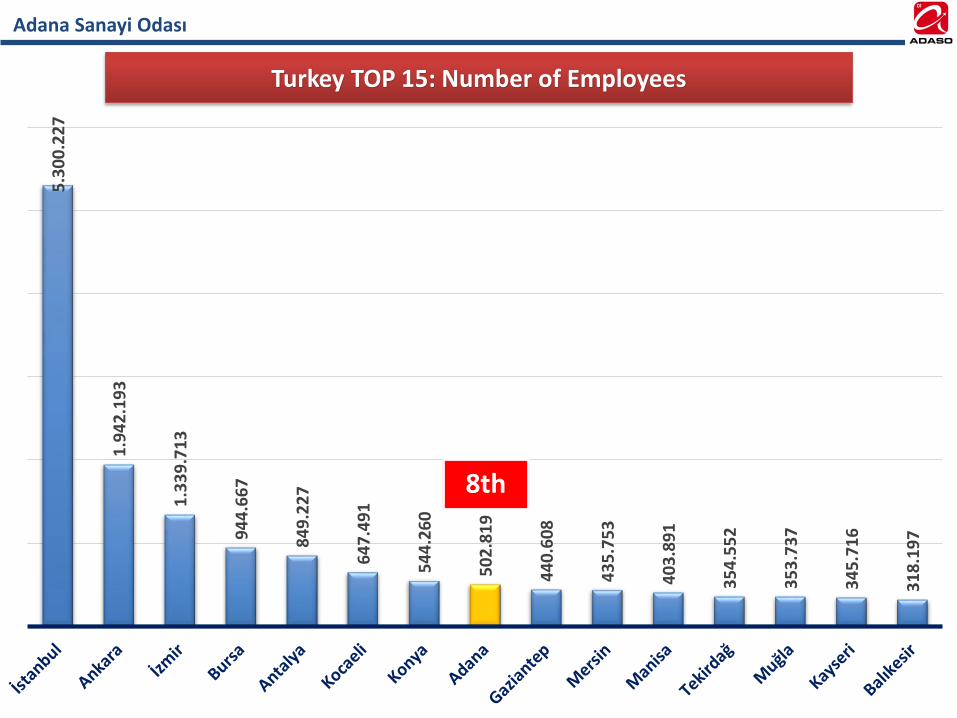
Turkey TOP 15: Number of Employees5
.30
0.2
27
1.9
42
.19
3
1.3
39
.71
3
94
4.6
67
84
9.2
27
64
7.4
91
54
4.2
60
50
2.8
19
44
0.6
08
43
5.7
53
40
3.8
91
35
4.5
52
35
3.7
37
34
5.7
16
31
8.1
97
8th
Adana Sanayi Odası
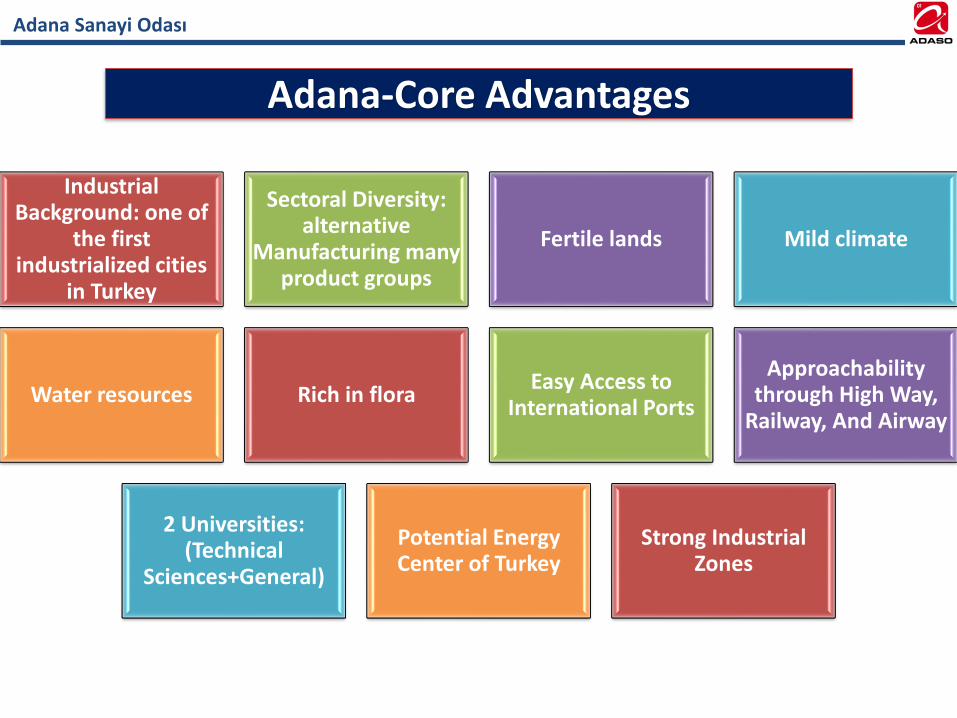
Adana-Core Advantages
IndustrialBackground: one of
the firstindustrialized cities
in Turkey
Sectoral Diversity: alternative
Manufacturing manyproduct groups
Fertile lands Mild climate
Water resources Rich in floraEasy Access to
International Ports
Approachability through High Way,
Railway, And Airway
2 Universities: (Technical
Sciences+General)
Potential EnergyCenter of Turkey
Strong IndustrialZones
Adana Sanayi Odası
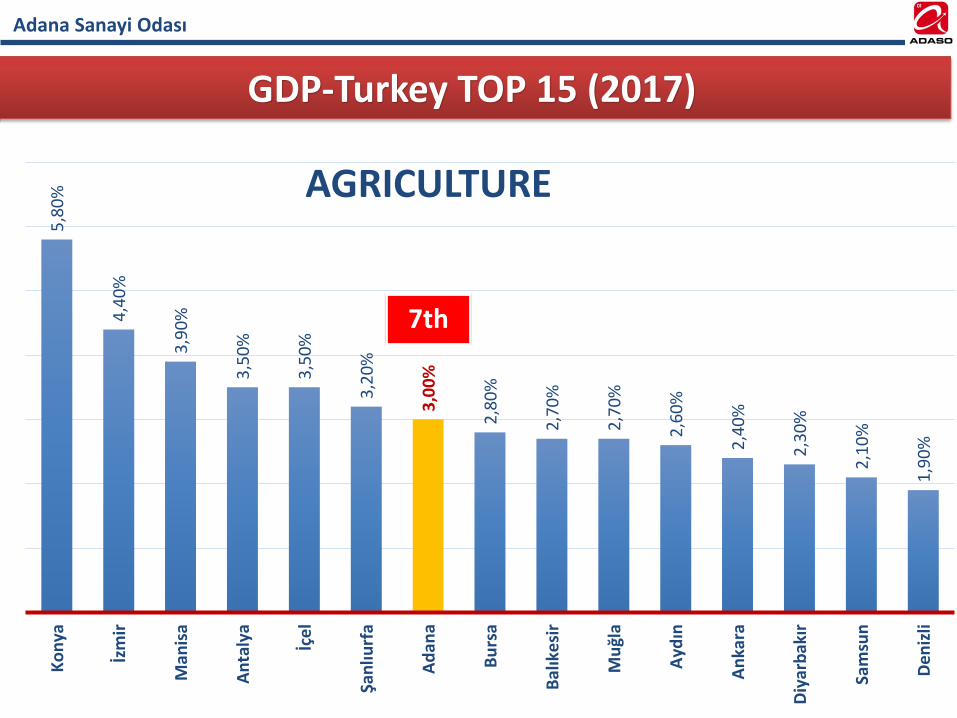
5,8
0%
4,4
0%
3,9
0%
3,5
0%
3,5
0%
3,2
0%
3,0
0%
2,8
0%
2,7
0%
2,7
0%
2,6
0%
2,4
0%
2,3
0%
2,1
0%
1,9
0%
Ko
nya
İzm
ir
Man
isa
An
taly
a
İçe
l
Şan
lıurf
a
Ad
ana
Bu
rsa
Bal
ıke
sir
Mu
ğla
Ayd
ın
An
kara
Diy
arb
akır
Sam
sun
Den
izli
AGRICULTURE
GDP-Turkey TOP 15 (2017)
7th
Adana Sanayi Odası2
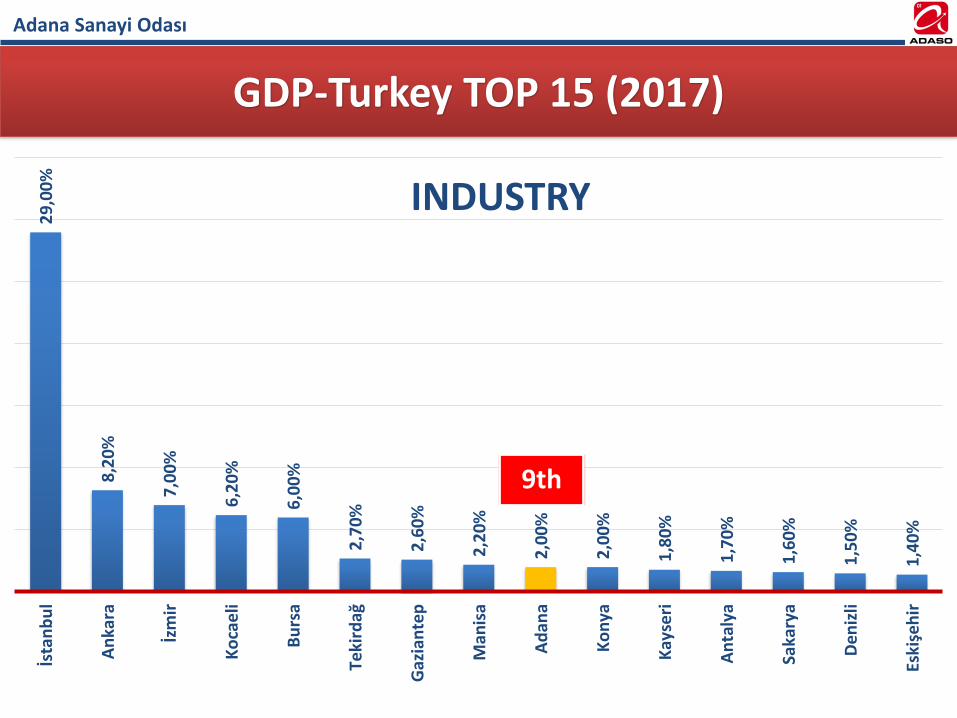
9,0
0%
8,2
0%
7,0
0%
6,2
0%
6,0
0%
2,7
0%
2,6
0%
2,2
0%
2,0
0%
2,0
0%
1,8
0%
1,7
0%
1,6
0%
1,5
0%
1,4
0%
İsta
nb
ul
An
kara
İzm
ir
Ko
cae
li
Bu
rsa
Teki
rdağ
Gaz
ian
tep
Man
isa
Ad
ana
Ko
nya
Kay
seri
An
taly
a
Saka
rya
Den
izli
Eski
şeh
ir
INDUSTRY
GDP-Turkey TOP 15 (2017)
9th
Adana Sanayi Odası3
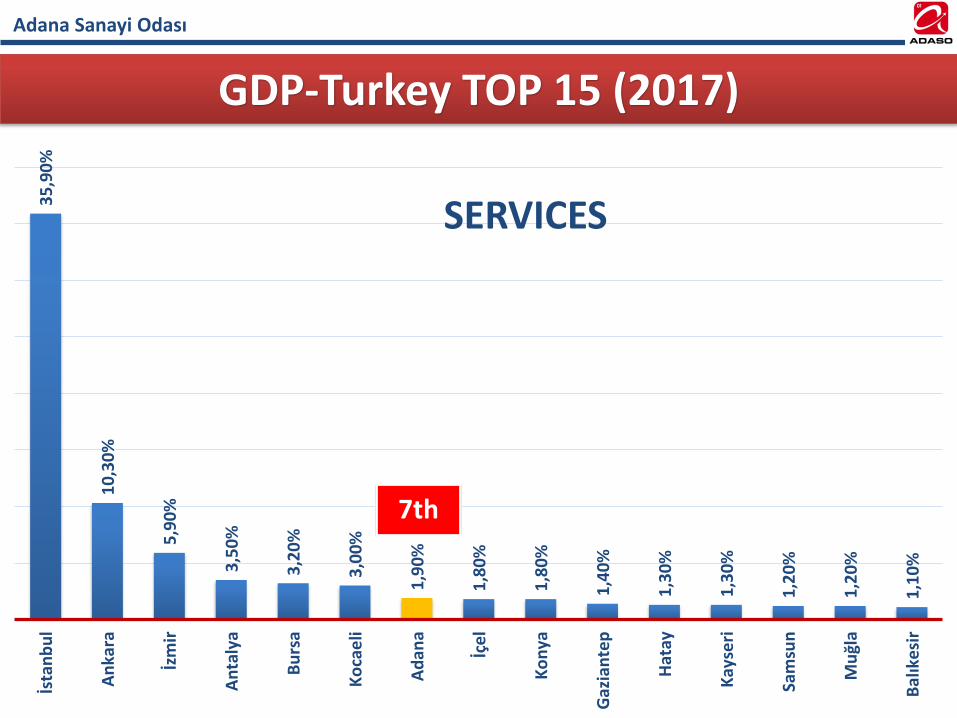
5,9
0%
10
,30
%
5,9
0%
3,5
0%
3,2
0%
3,0
0%
1,9
0%
1,8
0%
1,8
0%
1,4
0%
1,3
0%
1,3
0%
1,2
0%
1,2
0%
1,1
0%
İsta
nb
ul
An
kara
İzm
ir
An
taly
a
Bu
rsa
Ko
cae
li
Ad
ana
İçe
l
Ko
nya
Gaz
ian
tep
Hat
ay
Kay
seri
Sam
sun
Mu
ğla
Bal
ıke
sir
SERVICES
GDP-Turkey TOP 15 (2017)
7th
Adana Sanayi Odası
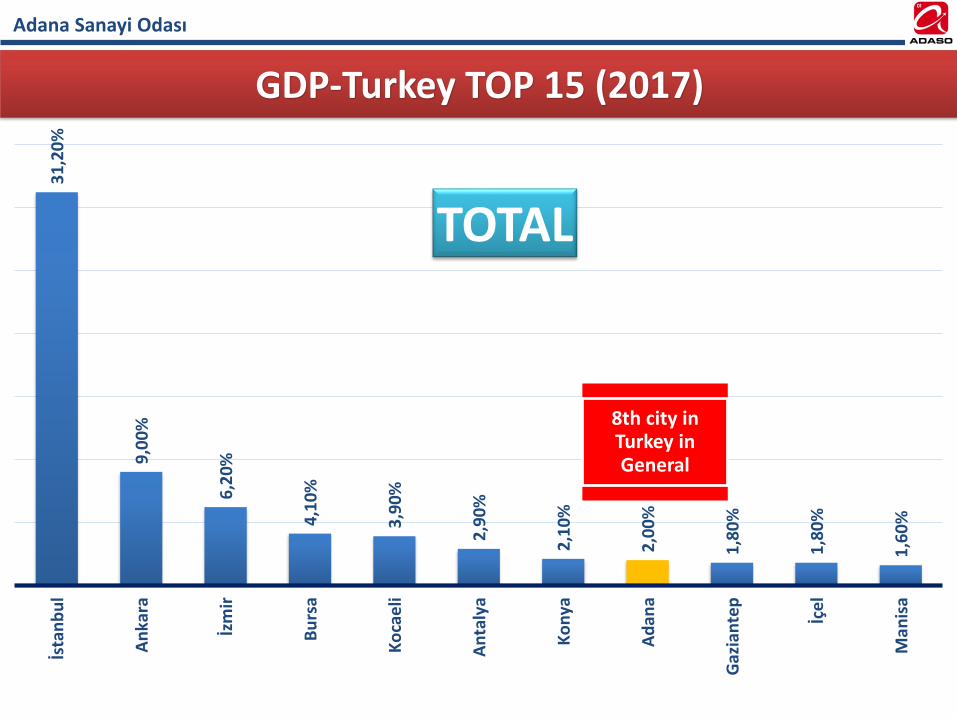
31
,20
%
9,0
0%
6,2
0%
4,1
0%
3,9
0%
2,9
0%
2,1
0%
2,0
0%
1,8
0%
1,8
0%
1,6
0%
İsta
nb
ul
An
kara
İzm
ir
Bu
rsa
Ko
cae
li
An
taly
a
Ko
nya
Ad
ana
Gaz
ian
tep
İçe
l
Man
isa
TOTAL
GDP-Turkey TOP 15 (2017)
8th city in Turkey in General
Adana Sanayi Odası
Adana Sanayi Odası
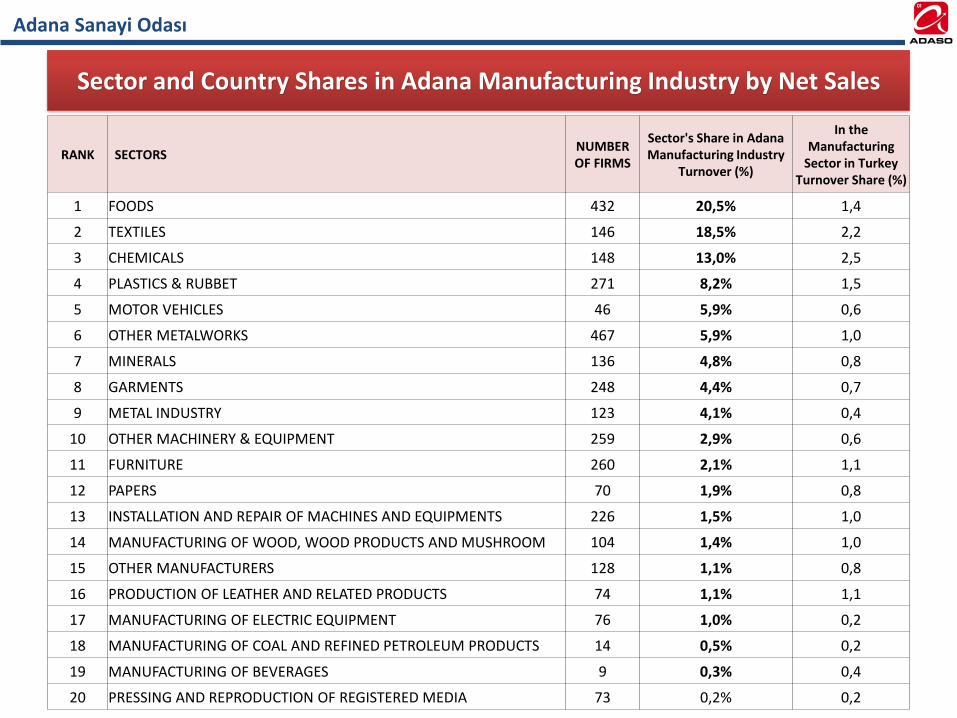
Sector and Country Shares in Adana Manufacturing Industry by Net Sales
RANK SECTORSNUMBER OF FIRMS
Sector's Share in Adana Manufacturing Industry
Turnover (%)
In the Manufacturing
Sector in TurkeyTurnover Share (%)
1 FOODS 432 20,5% 1,4
2 TEXTILES 146 18,5% 2,2
3 CHEMICALS 148 13,0% 2,5
4 PLASTICS & RUBBET 271 8,2% 1,5
5 MOTOR VEHICLES 46 5,9% 0,6
6 OTHER METALWORKS 467 5,9% 1,0
7 MINERALS 136 4,8% 0,8
8 GARMENTS 248 4,4% 0,7
9 METAL INDUSTRY 123 4,1% 0,4
10 OTHER MACHINERY & EQUIPMENT 259 2,9% 0,6
11 FURNITURE 260 2,1% 1,1
12 PAPERS 70 1,9% 0,8
13 INSTALLATION AND REPAIR OF MACHINES AND EQUIPMENTS 226 1,5% 1,0
14 MANUFACTURING OF WOOD, WOOD PRODUCTS AND MUSHROOM 104 1,4% 1,0
15 OTHER MANUFACTURERS 128 1,1% 0,8
16 PRODUCTION OF LEATHER AND RELATED PRODUCTS 74 1,1% 1,1
17 MANUFACTURING OF ELECTRIC EQUIPMENT 76 1,0% 0,2
18 MANUFACTURING OF COAL AND REFINED PETROLEUM PRODUCTS 14 0,5% 0,2
19 MANUFACTURING OF BEVERAGES 9 0,3% 0,4
20 PRESSING AND REPRODUCTION OF REGISTERED MEDIA 73 0,2% 0,2
Adana Sanayi Odası
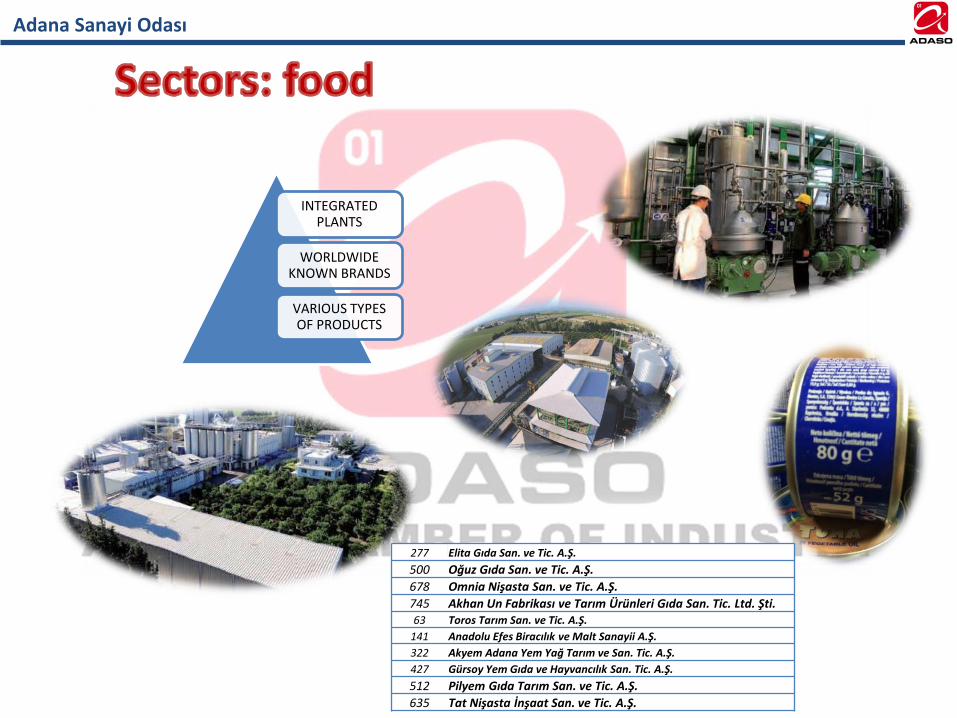
INTEGRATED PLANTS
WORLDWIDE KNOWN BRANDS
VARIOUS TYPES OF PRODUCTS
277 Elita Gıda San. ve Tic. A.Ş.
500 Oğuz Gıda San. ve Tic. A.Ş.
678 Omnia Nişasta San. ve Tic. A.Ş.
745 Akhan Un Fabrikası ve Tarım Ürünleri Gıda San. Tic. Ltd. Şti.63 Toros Tarım San. ve Tic. A.Ş.
141 Anadolu Efes Biracılık ve Malt Sanayii A.Ş.
322 Akyem Adana Yem Yağ Tarım ve San. Tic. A.Ş.
427 Gürsoy Yem Gıda ve Hayvancılık San. Tic. A.Ş.
512 Pilyem Gıda Tarım San. ve Tic. A.Ş.
635 Tat Nişasta İnşaat San. ve Tic. A.Ş.
Adana Sanayi Odası
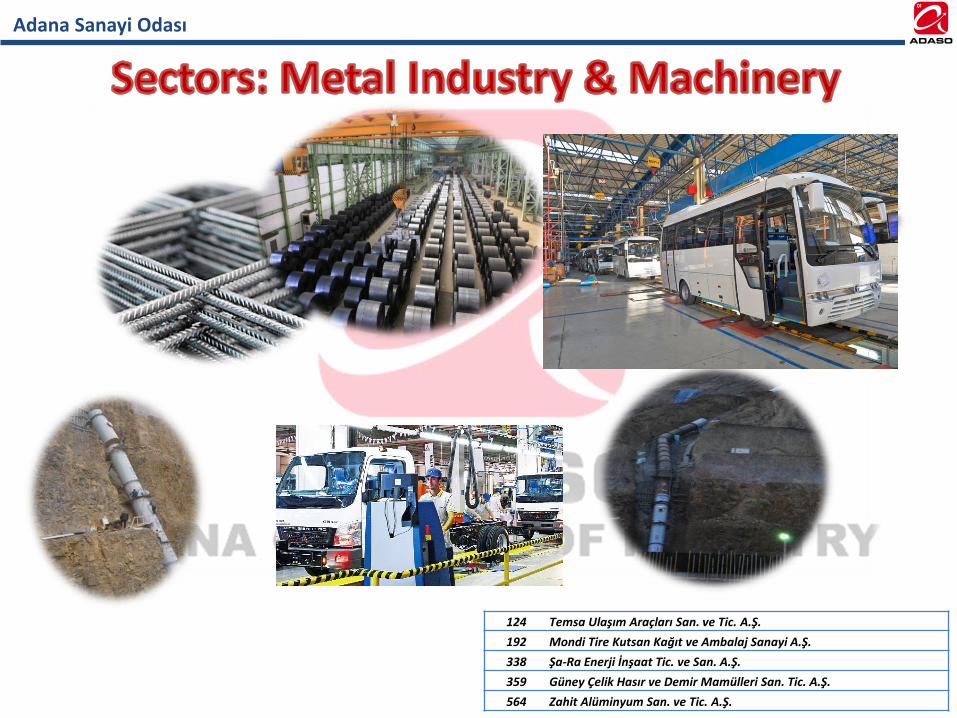
124 Temsa Ulaşım Araçları San. ve Tic. A.Ş.
192 Mondi Tire Kutsan Kağıt ve Ambalaj Sanayi A.Ş.
338 Şa-Ra Enerji İnşaat Tic. ve San. A.Ş.
359 Güney Çelik Hasır ve Demir Mamülleri San. Tic. A.Ş.
564 Zahit Alüminyum San. ve Tic. A.Ş.
Adana Sanayi Odası
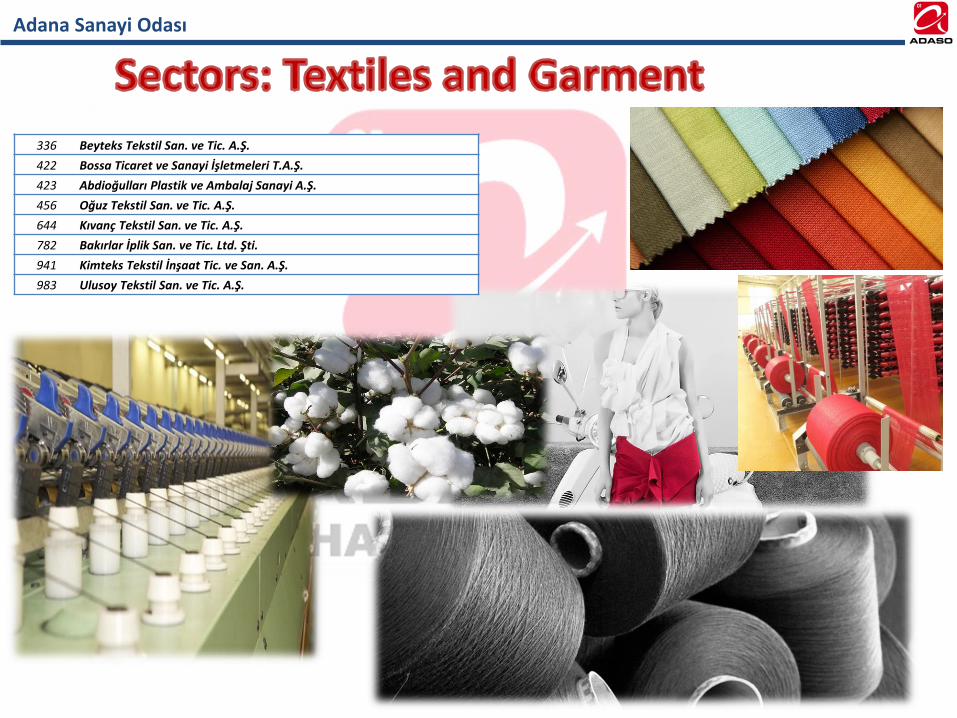
336 Beyteks Tekstil San. ve Tic. A.Ş.
422 Bossa Ticaret ve Sanayi İşletmeleri T.A.Ş.
423 Abdioğulları Plastik ve Ambalaj Sanayi A.Ş.
456 Oğuz Tekstil San. ve Tic. A.Ş.
644 Kıvanç Tekstil San. ve Tic. A.Ş.
782 Bakırlar İplik San. ve Tic. Ltd. Şti.
941 Kimteks Tekstil İnşaat Tic. ve San. A.Ş.
983 Ulusoy Tekstil San. ve Tic. A.Ş.
Adana Sanayi Odası
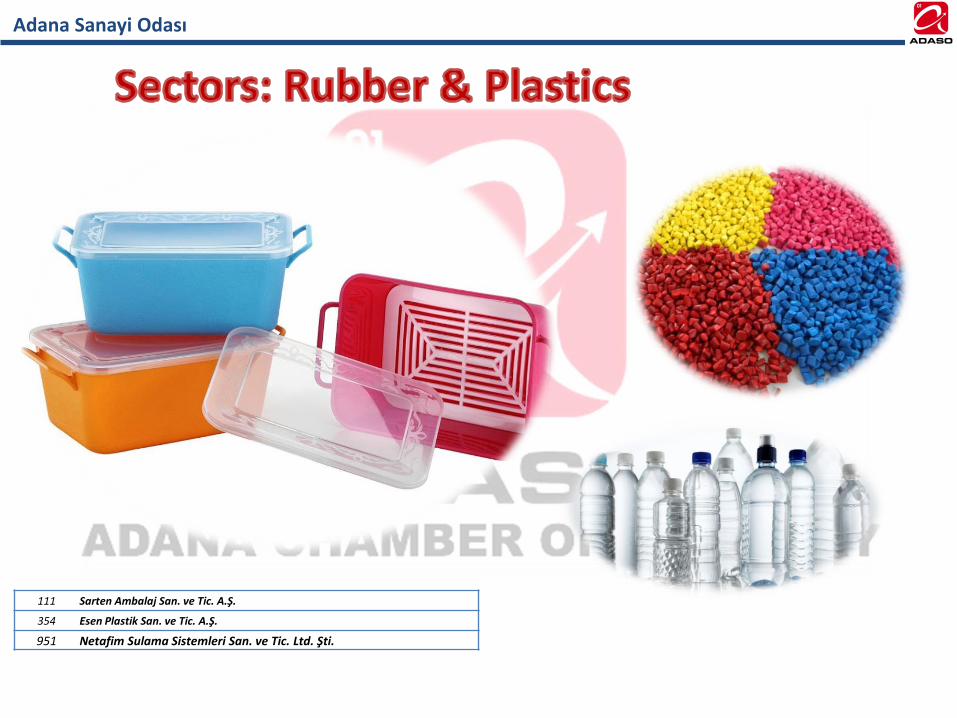
111 Sarten Ambalaj San. ve Tic. A.Ş.
354 Esen Plastik San. ve Tic. A.Ş.
951 Netafim Sulama Sistemleri San. ve Tic. Ltd. Şti.
Adana Sanayi Odası
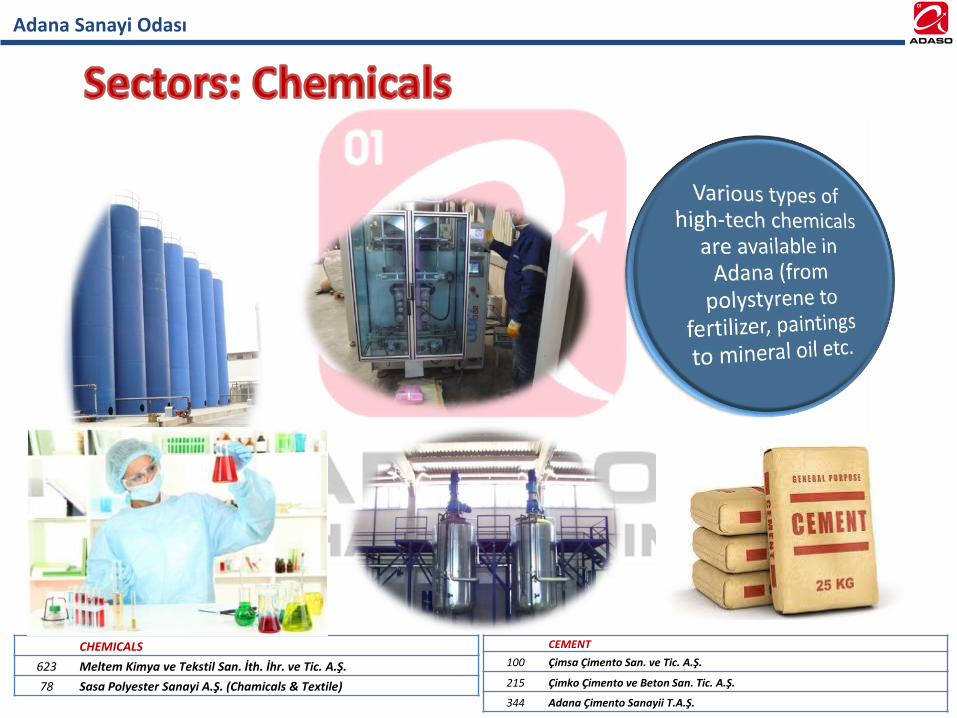
CHEMICALS
623 Meltem Kimya ve Tekstil San. İth. İhr. ve Tic. A.Ş.
78 Sasa Polyester Sanayi A.Ş. (Chamicals & Textile)
CEMENT
100 Çimsa Çimento San. ve Tic. A.Ş.
215 Çimko Çimento ve Beton San. Tic. A.Ş.
344 Adana Çimento Sanayii T.A.Ş.
Adana Sanayi Odası
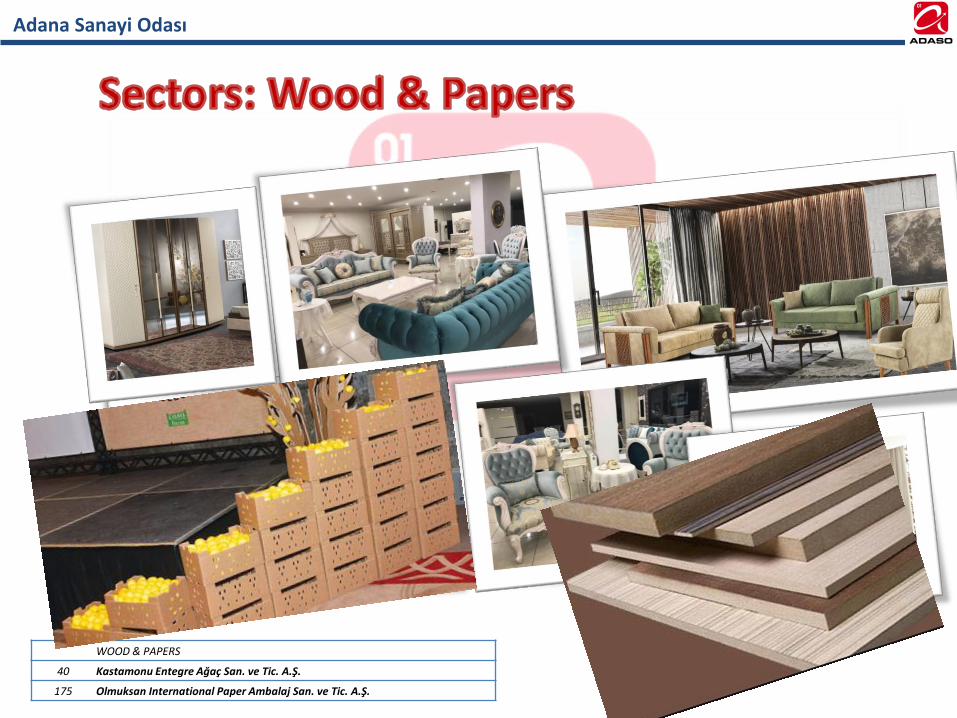
WOOD & PAPERS
40 Kastamonu Entegre Ağaç San. ve Tic. A.Ş.
175 Olmuksan International Paper Ambalaj San. ve Tic. A.Ş.
Adana Sanayi Odası
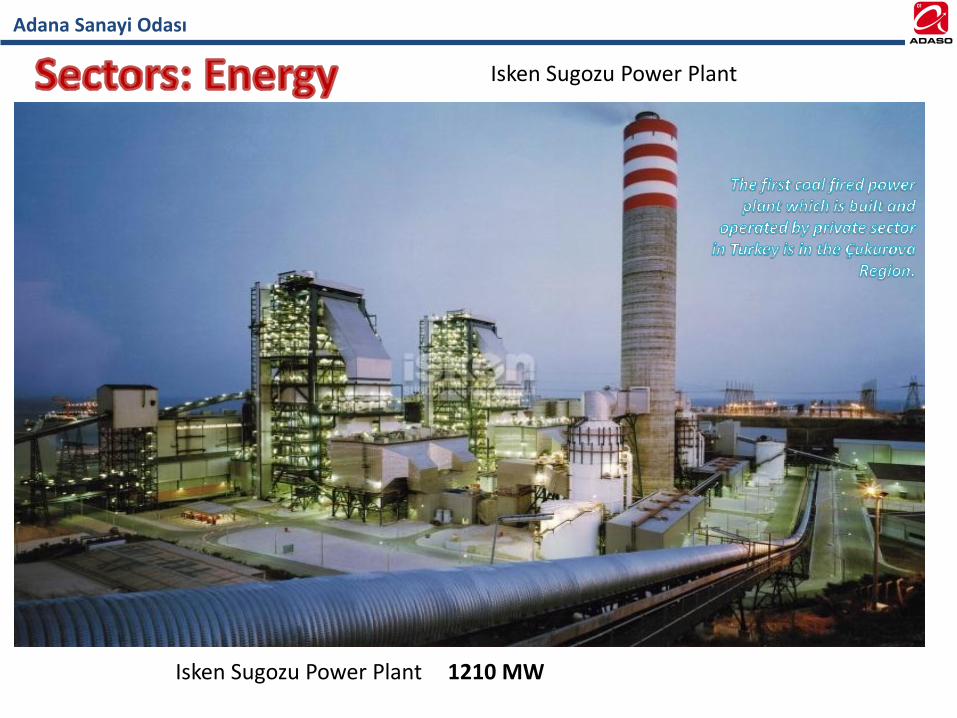
1210 MW
Isken Sugozu Power Plant
Isken Sugozu Power Plant
Adana Sanayi Odası
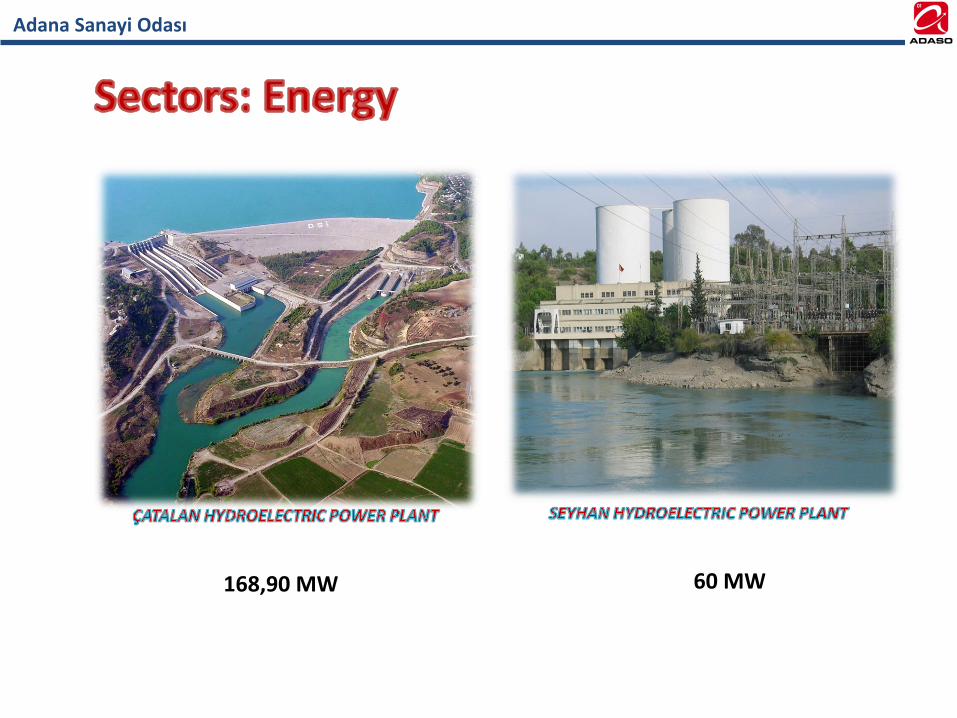
168,90 MW 60 MW
Adana Sanayi Odası
Adana Sanayi Odası
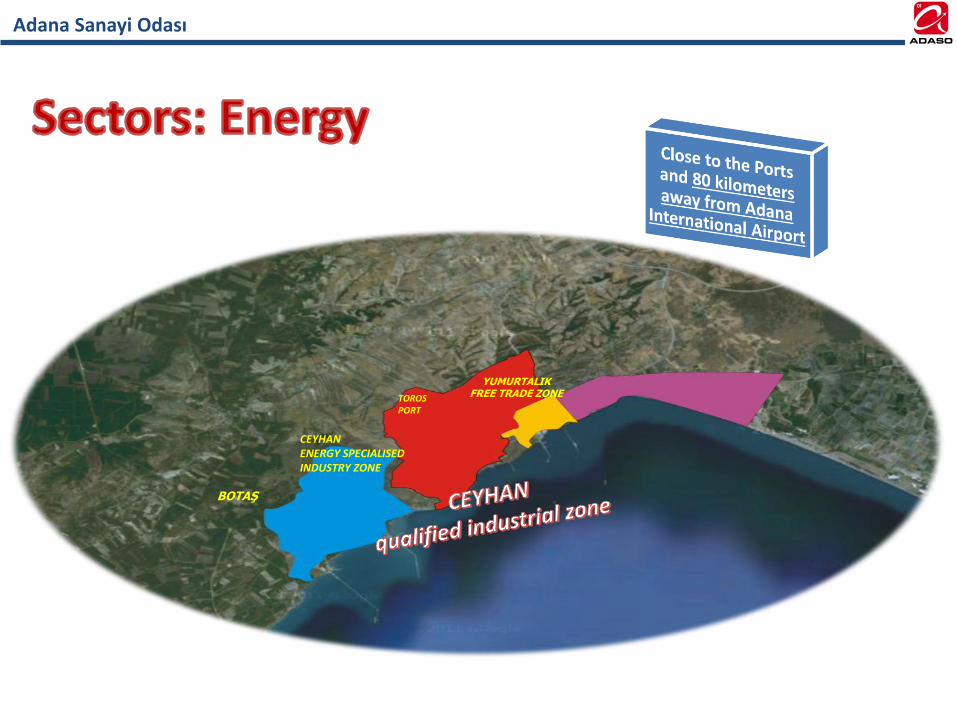
BOTAŞ
CEYHAN ENERGY SPECIALISED INDUSTRY ZONE
TOROS PORT
YUMURTALIKFREE TRADE ZONE
Adana Sanayi Odası
Adana Sanayi Odası
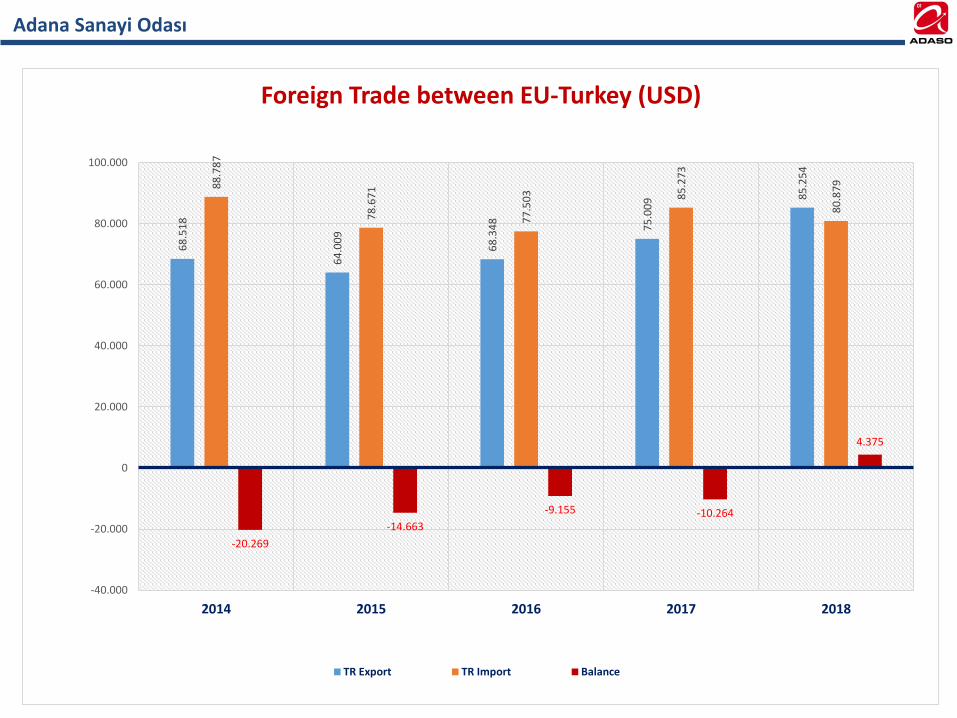
68
.51
8
64
.00
9
68
.34
8
75
.00
9 85
.25
4
88
.78
7
78
.67
1
77
.50
3 85
.27
3
80
.87
9
-20.269
-14.663
-9.155 -10.264
4.375
-40.000
-20.000
0
20.000
40.000
60.000
80.000
100.000
2014 2015 2016 2017 2018
Foreign Trade between EU-Turkey (USD)
TR Export TR Import Balance
Adana Sanayi Odası
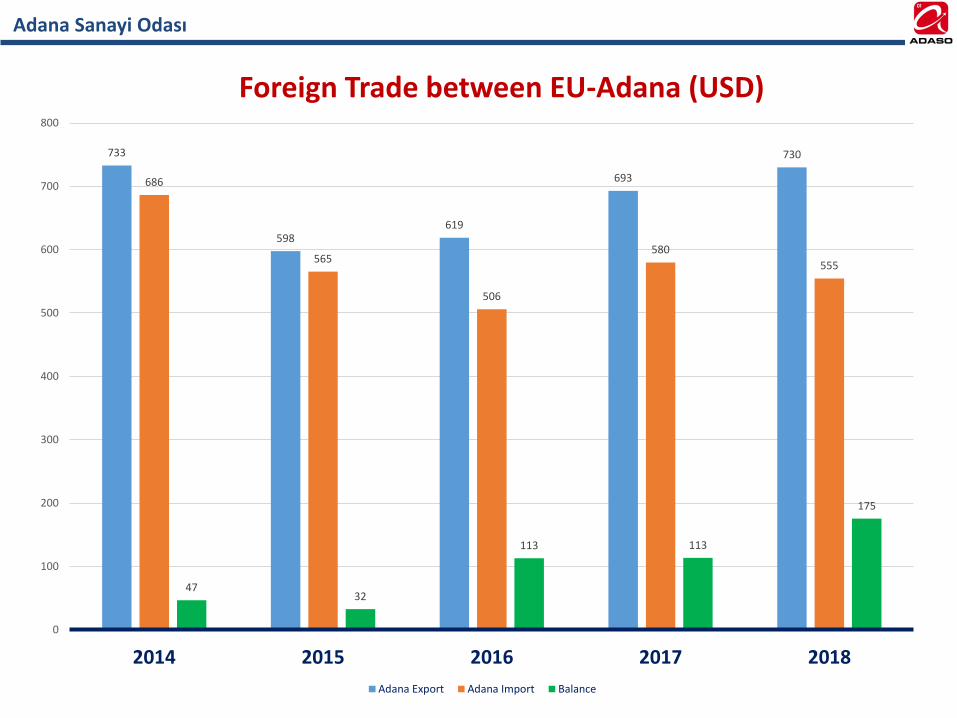
733
598619
693
730
686
565
506
580
555
4732
113 113
175
0
100
200
300
400
500
600
700
800
2014 2015 2016 2017 2018
Foreign Trade between EU-Adana (USD)
Adana Export Adana Import Balance
Adana Sanayi Odası
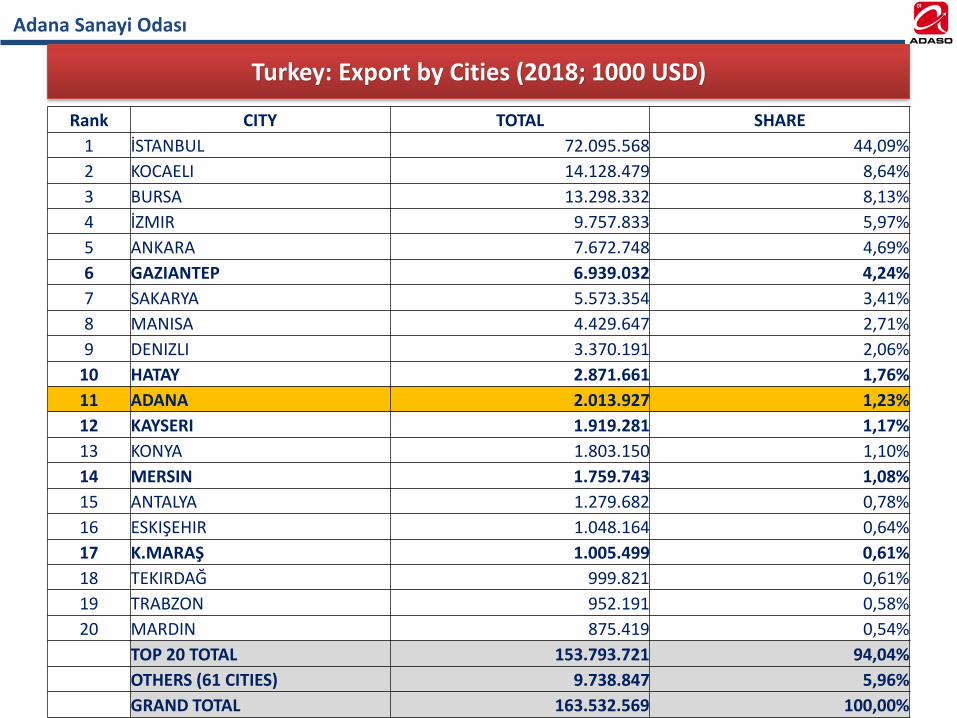
Rank CITY TOTAL SHARE
1 İSTANBUL 72.095.568 44,09%
2 KOCAELI 14.128.479 8,64%
3 BURSA 13.298.332 8,13%
4 İZMIR 9.757.833 5,97%
5 ANKARA 7.672.748 4,69%
6 GAZIANTEP 6.939.032 4,24%
7 SAKARYA 5.573.354 3,41%
8 MANISA 4.429.647 2,71%
9 DENIZLI 3.370.191 2,06%
10 HATAY 2.871.661 1,76%
11 ADANA 2.013.927 1,23%
12 KAYSERI 1.919.281 1,17%
13 KONYA 1.803.150 1,10%
14 MERSIN 1.759.743 1,08%
15 ANTALYA 1.279.682 0,78%
16 ESKIŞEHIR 1.048.164 0,64%
17 K.MARAŞ 1.005.499 0,61%
18 TEKIRDAĞ 999.821 0,61%
19 TRABZON 952.191 0,58%
20 MARDIN 875.419 0,54%
TOP 20 TOTAL 153.793.721 94,04%
OTHERS (61 CITIES) 9.738.847 5,96%
GRAND TOTAL 163.532.569 100,00%
Turkey: Export by Cities (2018; 1000 USD)
Adana Sanayi Odası
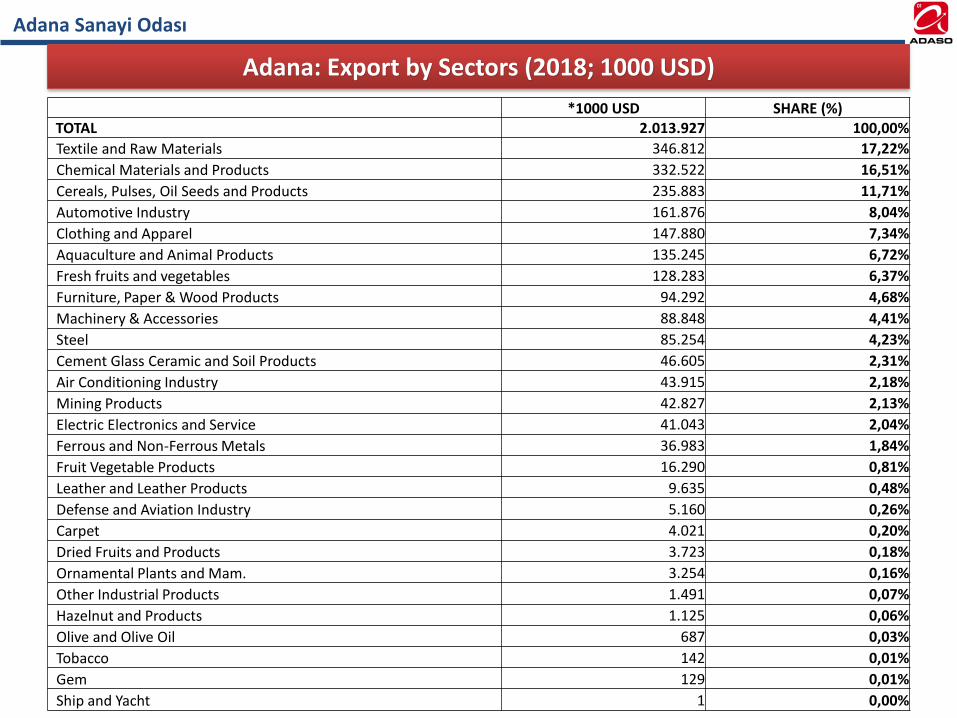
*1000 USD SHARE (%)TOTAL 2.013.927 100,00%
Textile and Raw Materials 346.812 17,22%
Chemical Materials and Products 332.522 16,51%
Cereals, Pulses, Oil Seeds and Products 235.883 11,71%
Automotive Industry 161.876 8,04%
Clothing and Apparel 147.880 7,34%
Aquaculture and Animal Products 135.245 6,72%
Fresh fruits and vegetables 128.283 6,37%
Furniture, Paper & Wood Products 94.292 4,68%
Machinery & Accessories 88.848 4,41%
Steel 85.254 4,23%
Cement Glass Ceramic and Soil Products 46.605 2,31%
Air Conditioning Industry 43.915 2,18%
Mining Products 42.827 2,13%
Electric Electronics and Service 41.043 2,04%
Ferrous and Non-Ferrous Metals 36.983 1,84%
Fruit Vegetable Products 16.290 0,81%
Leather and Leather Products 9.635 0,48%
Defense and Aviation Industry 5.160 0,26%
Carpet 4.021 0,20%
Dried Fruits and Products 3.723 0,18%
Ornamental Plants and Mam. 3.254 0,16%
Other Industrial Products 1.491 0,07%
Hazelnut and Products 1.125 0,06%
Olive and Olive Oil 687 0,03%
Tobacco 142 0,01%
Gem 129 0,01%
Ship and Yacht 1 0,00%
Adana: Export by Sectors (2018; 1000 USD)
Adana Sanayi Odası
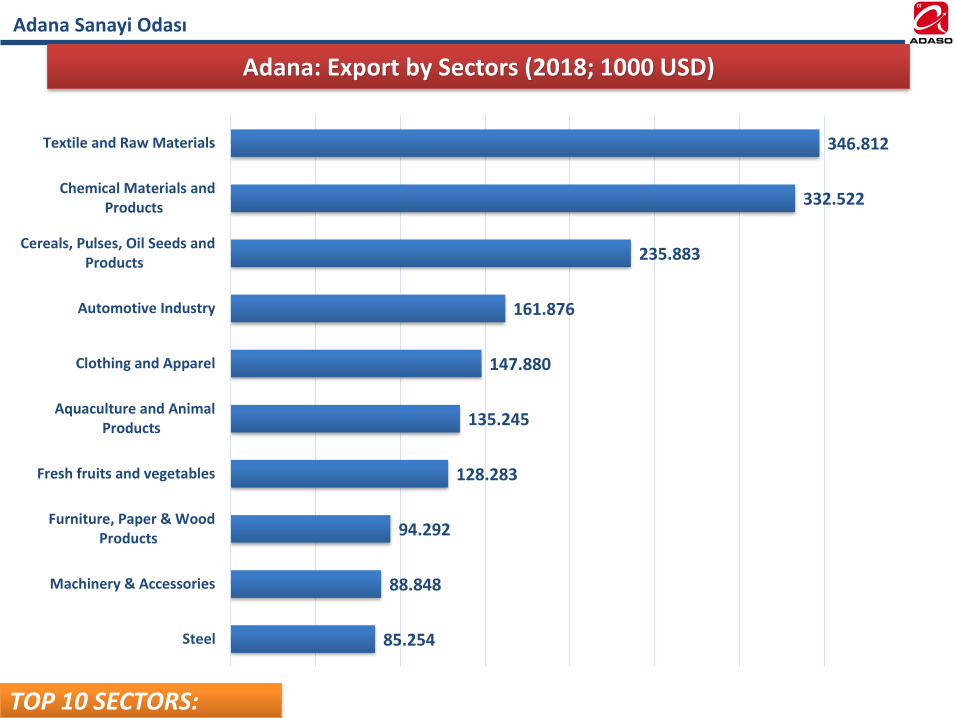
346.812
332.522
235.883
161.876
147.880
135.245
128.283
94.292
88.848
85.254
Textile and Raw Materials
Chemical Materials andProducts
Cereals, Pulses, Oil Seeds andProducts
Automotive Industry
Clothing and Apparel
Aquaculture and AnimalProducts
Fresh fruits and vegetables
Furniture, Paper & WoodProducts
Machinery & Accessories
Steel
TOP 10 SECTORS:
Adana: Export by Sectors (2018; 1000 USD)
Adana Sanayi Odası
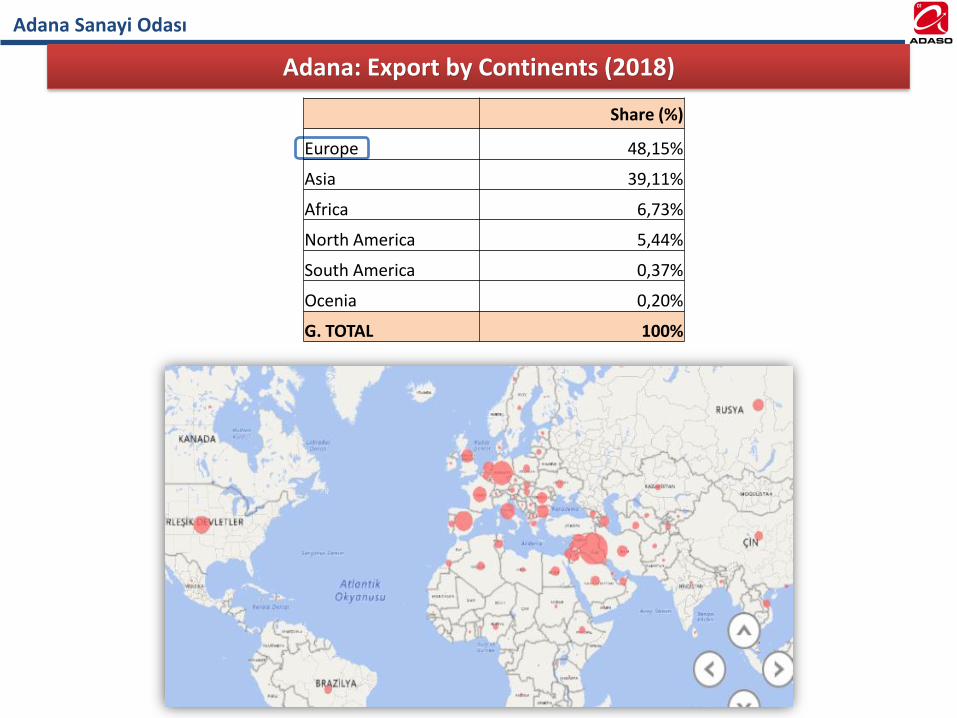
Share (%)
Europe 48,15%
Asia 39,11%
Africa 6,73%
North America 5,44%
South America 0,37%
Ocenia 0,20%
G. TOTAL 100%
Adana: Export by Continents (2018)
Adana Sanayi Odası
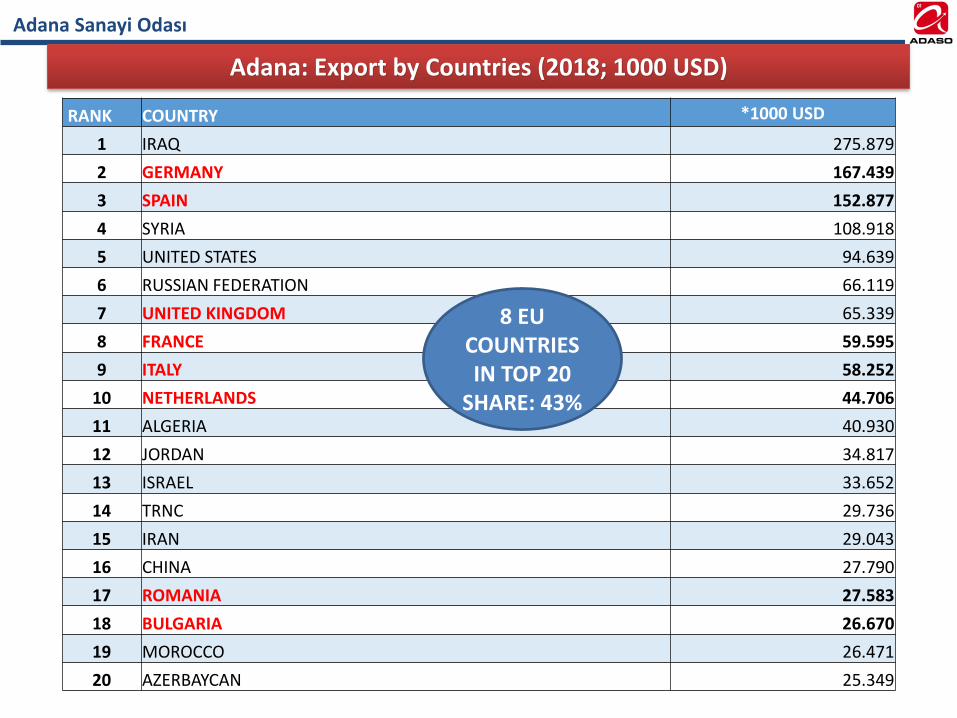
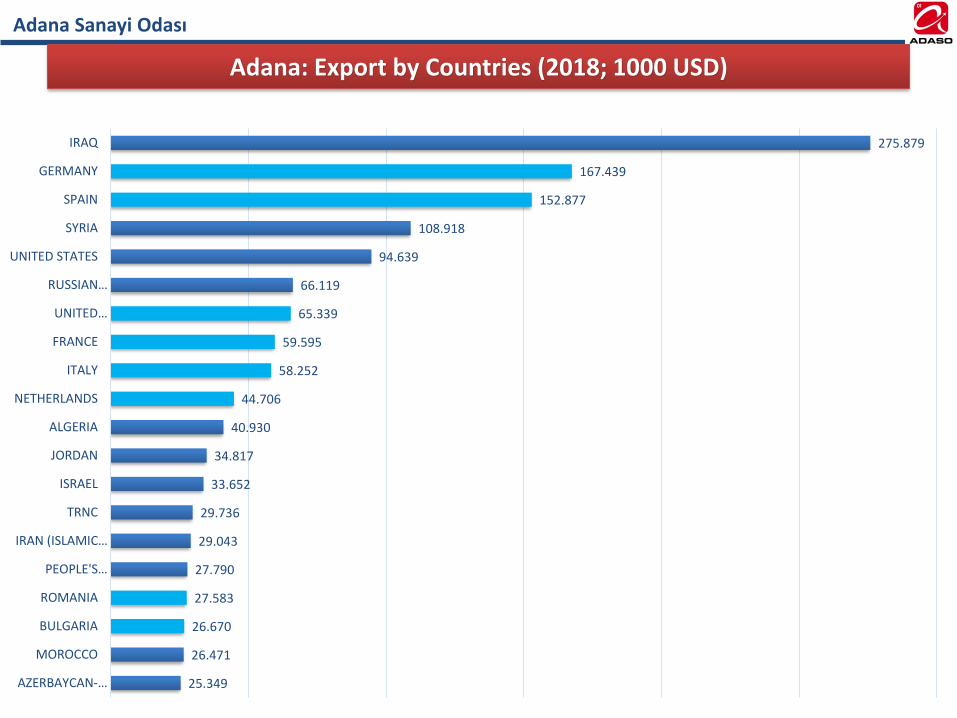
Adana: Export by Countries (2018; 1000 USD)
RANK COUNTRY *1000 USD
1 IRAQ 275.879
2 GERMANY 167.439
3 SPAIN 152.877
4 SYRIA 108.918
5 UNITED STATES 94.639
6 RUSSIAN FEDERATION 66.119
7 UNITED KINGDOM 65.339
8 FRANCE 59.595
9 ITALY 58.252
10 NETHERLANDS 44.706
11 ALGERIA 40.930
12 JORDAN 34.817
13 ISRAEL 33.652
14 TRNC 29.736
15 IRAN 29.043
16 CHINA 27.790
17 ROMANIA 27.583
18 BULGARIA 26.670
19 MOROCCO 26.471
20 AZERBAYCAN 25.349
8 EU COUNTRIES IN TOP 20
SHARE: 43%
Adana Sanayi Odası
275.879
167.439
152.877
108.918
94.639
66.119
65.339
59.595
58.252
44.706
40.930
34.817
33.652
29.736
29.043
27.790
27.583
26.670
26.471
25.349
IRAQ
GERMANY
SPAIN
SYRIA
UNITED STATES
RUSSIAN…
UNITED…
FRANCE
ITALY
NETHERLANDS
ALGERIA
JORDAN
ISRAEL
TRNC
IRAN (ISLAMIC…
PEOPLE'S…
ROMANIA
BULGARIA
MOROCCO
AZERBAYCAN-…
Adana: Export by Countries (2018; 1000 USD)
Adana Sanayi Odası
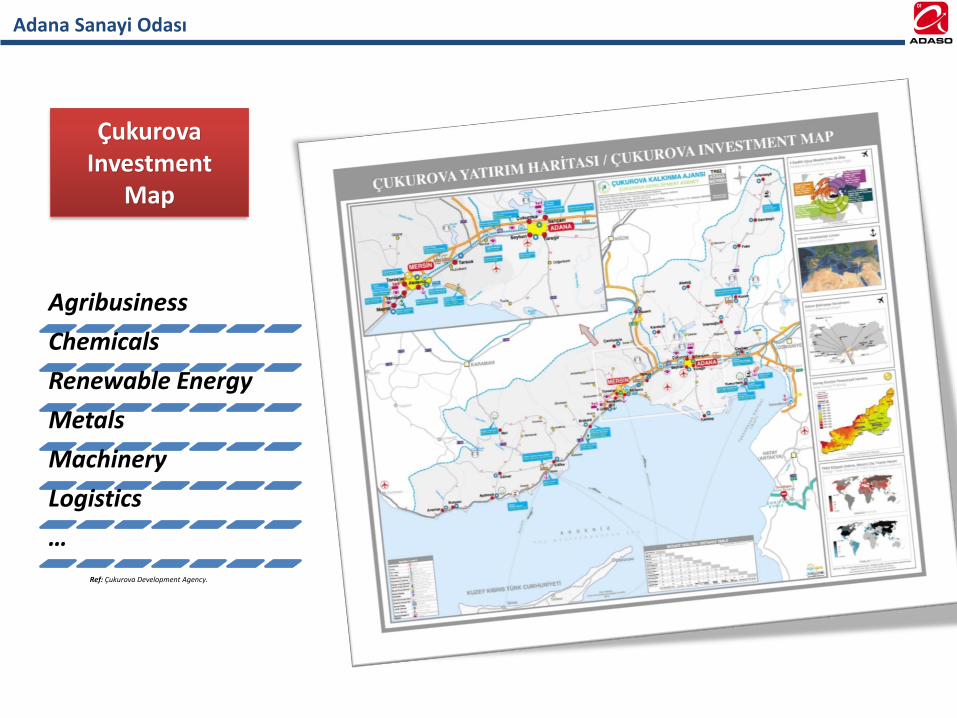
Çukurova Investment
Map
Ref: Çukurova Development Agency.
Agribusiness
Chemicals
Renewable Energy
Metals
Machinery
Logistics
…
Adana Sanayi Odası
Adana Sanayi Odası
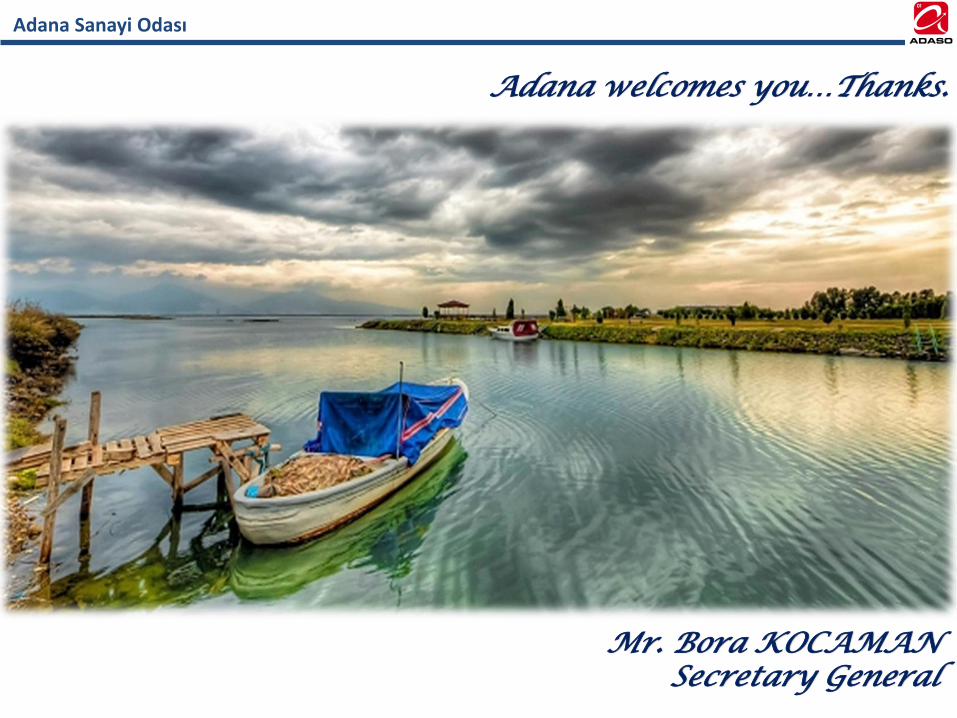
Adana welcomes you…Thanks.
Mr. Bora KOCAMANSecretary General