Embed Size (px)
Citation preview
www.pwc.com/hrconsulting
A global study by PwC into the value gained by a better talent fit
Adapt to surviveHow better alignment between talent and opportunity can drive economic growth
A global study by PwC, commissioned by LinkedIn

Contents Introduction 1
Key findings 3
What is adaptable talent? 4
Why are some countries more adaptable than others?
6
1. Adaptability could unlock up to USD130 billion in additional productivity
8
2. The skills gap will narrow with increased adaptability
10
3. Compromising on talent costs the global economy
12
4. Visibility from online professional networks leads to better hiring
14
Our recommendations
For individuals 20
For employers 22
For educators 23
For governments 24
Methodology 26
Contacts 29
1Adapt to survive – How better alignment between talent and opportunity can drive economic growth
Introduction
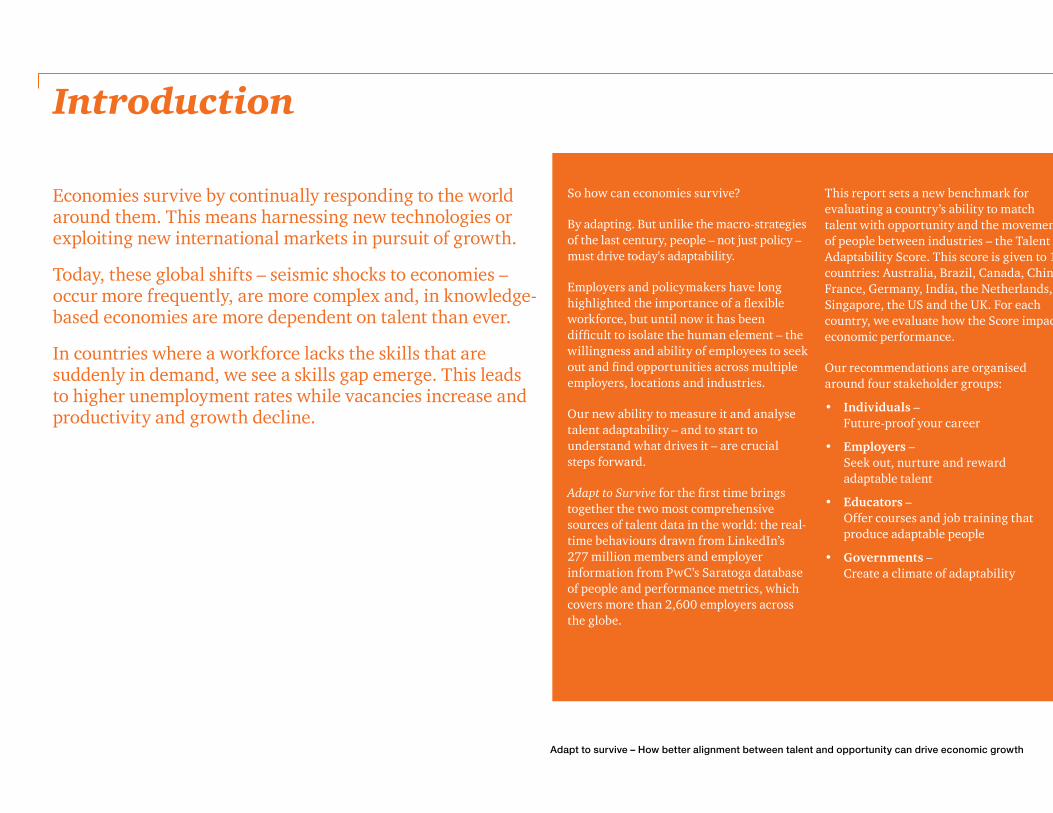
Economies survive by continually responding to the world around them. This means harnessing new technologies or exploiting new international markets in pursuit of growth.
Today, these global shifts – seismic shocks to economies – occur more frequently, are more complex and, in knowledge-based economies are more dependent on talent than ever.
In countries where a workforce lacks the skills that are suddenly in demand, we see a skills gap emerge. This leads to higher unemployment rates while vacancies increase and productivity and growth decline.
So how can economies survive?
By adapting. But unlike the macro-strategies of the last century, people – not just policy – must drive today's adaptability.
Employers and policymakers have long highlighted the importance of a flexible workforce, but until now it has been difficult to isolate the human element – the willingness and ability of employees to seek out and find opportunities across multiple employers, locations and industries.
Our new ability to measure it and analyse talent adaptability – and to start to understand what drives it – are crucial steps forward.
Adapt to Survive for the first time brings together the two most comprehensive sources of talent data in the world: the real-time behaviours drawn from LinkedIn’s 277 million members and employer information from PwC’s Saratoga database of people and performance metrics, which covers more than 2,600 employers across the globe.
This report sets a new benchmark for evaluating a country’s ability to match talent with opportunity and the movement of people between industries – the Talent Adaptability Score. This score is given to 11 countries: Australia, Brazil, Canada, China, France, Germany, India, the Netherlands, Singapore, the US and the UK. For each country, we evaluate how the Score impacts economic performance.
Our recommendations are organised around four stakeholder groups:
• Individuals – Future-proof your career
• Employers – Seek out, nurture and reward adaptable talent
• Educators – Offer courses and job training that produce adaptable people
• Governments – Create a climate of adaptability A global study commissioned by LinkedIn

2 A global study by PwC into the value gained by a better talent fit
3Adapt to survive – How better alignment between talent and opportunity can drive economic growth
Key findings
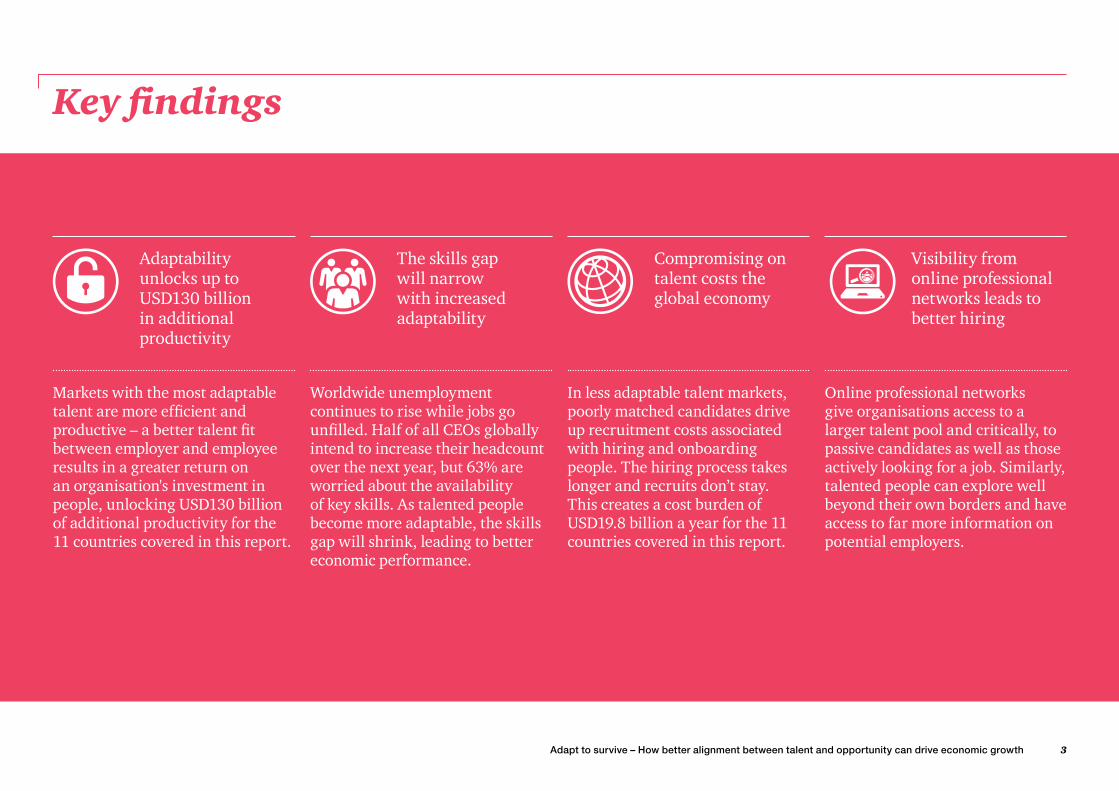
Adaptability unlocks up to USD130 billion in additional productivity
Markets with the most adaptable talent are more efficient and productive – a better talent fit between employer and employee results in a greater return on an organisation's investment in people, unlocking USD130 billion of additional productivity for the 11 countries covered in this report.
The skills gap will narrow with increased adaptability
Worldwide unemployment continues to rise while jobs go unfilled. Half of all CEOs globally intend to increase their headcount over the next year, but 63% are worried about the availability of key skills. As talented people become more adaptable, the skills gap will shrink, leading to better economic performance.
Online professional networks give organisations access to a larger talent pool and critically, to passive candidates as well as those actively looking for a job. Similarly, talented people can explore well beyond their own borders and have access to far more information on potential employers.
Visibility from online professional networks leads to better hiring
Compromising on talent costs the global economy
In less adaptable talent markets, poorly matched candidates drive up recruitment costs associated with hiring and onboarding people. The hiring process takes longer and recruits don’t stay. This creates a cost burden of USD19.8 billion a year for the 11 countries covered in this report.
4 A global study by PwC into the value gained by a better talent fit
What is adaptable talent?
1 See Appendix for the full methodology and measures used
The capacity of a market to match supply and demand efficiently depends on the ability and willingness of employers and employees to adapt to changing circumstances and align skills with available opportunities. If this alignment is less than perfect, a mismatch occurs and optimum productivity can’t be reached.
There are two essential ingredients to adaptability. First the ability of employers to look differently at sources of talent. This means investigating new geographies and sectors as sources of new talent as well as investing in existing employees, equipping them with the necessary skills and motivating them to adapt to meet new challenges. Secondly of course, this requires willing individuals who are prepared to embrace change and apply their skills somewhere new. In order to assess adaptability in a particular market we need to look at both sides of the equation.
We’ve used LinkedIn and PwC Saratoga data to assess the primary indicators of an adaptable market including the rate at which people switch between roles and sectors, the rate at which they’re promoted and the number of jobs left open in a market.1 The resulting Talent Adaptability Score, which measures the adaptability of the 11 countries we researched side by side, shows a wide variety in adaptability across geographic markets, with the Netherlands coming out on top and China and India ranking lowest.
5Adapt to survive – How better alignment between talent and opportunity can drive economic growth
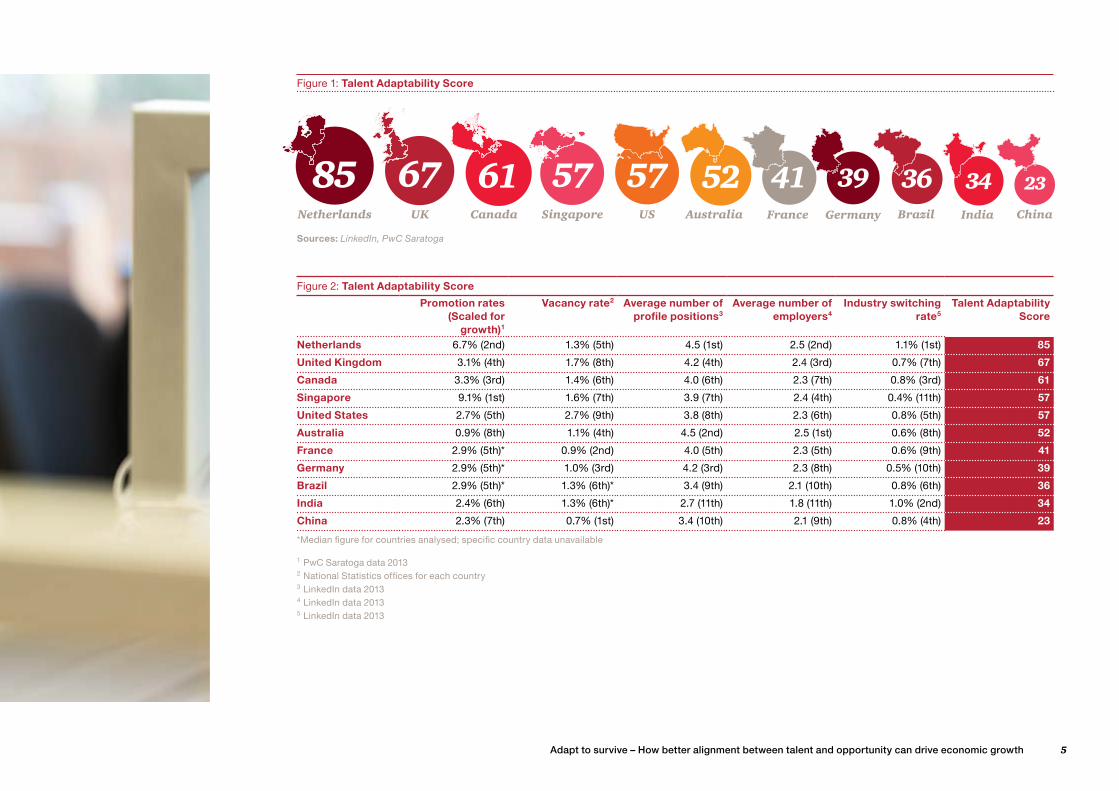
Figure 1: Talent Adaptability Score
Sources: LinkedIn, PwC Saratoga
Figure 2: Talent Adaptability Score
Promotion rates (Scaled for
growth)1
Vacancy rate2 Average number of profile positions3
Average number of employers4
Industry switching rate5
Talent Adaptability Score
Netherlands 6.7% (2nd) 1.3% (5th) 4.5 (1st) 2.5 (2nd) 1.1% (1st) 85
United Kingdom 3.1% (4th) 1.7% (8th) 4.2 (4th) 2.4 (3rd) 0.7% (7th) 67
Canada 3.3% (3rd) 1.4% (6th) 4.0 (6th) 2.3 (7th) 0.8% (3rd) 61
Singapore 9.1% (1st) 1.6% (7th) 3.9 (7th) 2.4 (4th) 0.4% (11th) 57
United States 2.7% (5th) 2.7% (9th) 3.8 (8th) 2.3 (6th) 0.8% (5th) 57
Australia 0.9% (8th) 1.1% (4th) 4.5 (2nd) 2.5 (1st) 0.6% (8th) 52
France 2.9% (5th)* 0.9% (2nd) 4.0 (5th) 2.3 (5th) 0.6% (9th) 41
Germany 2.9% (5th)* 1.0% (3rd) 4.2 (3rd) 2.3 (8th) 0.5% (10th) 39
Brazil 2.9% (5th)* 1.3% (6th)* 3.4 (9th) 2.1 (10th) 0.8% (6th) 36
India 2.4% (6th) 1.3% (6th)* 2.7 (11th) 1.8 (11th) 1.0% (2nd) 34
China 2.3% (7th) 0.7% (1st) 3.4 (10th) 2.1 (9th) 0.8% (4th) 23
*Median figure for countries analysed; specific country data unavailable
1 PwC Saratoga data 20132 National Statistics offices for each country 3 LinkedIn data 2013 4 LinkedIn data 2013 5 LinkedIn data 2013
Brazil India China
34 2336Netherlands UK Canada Singapore
57616785US Australia France Germany
394157 52
6 A global study by PwC into the value gained by a better talent fit
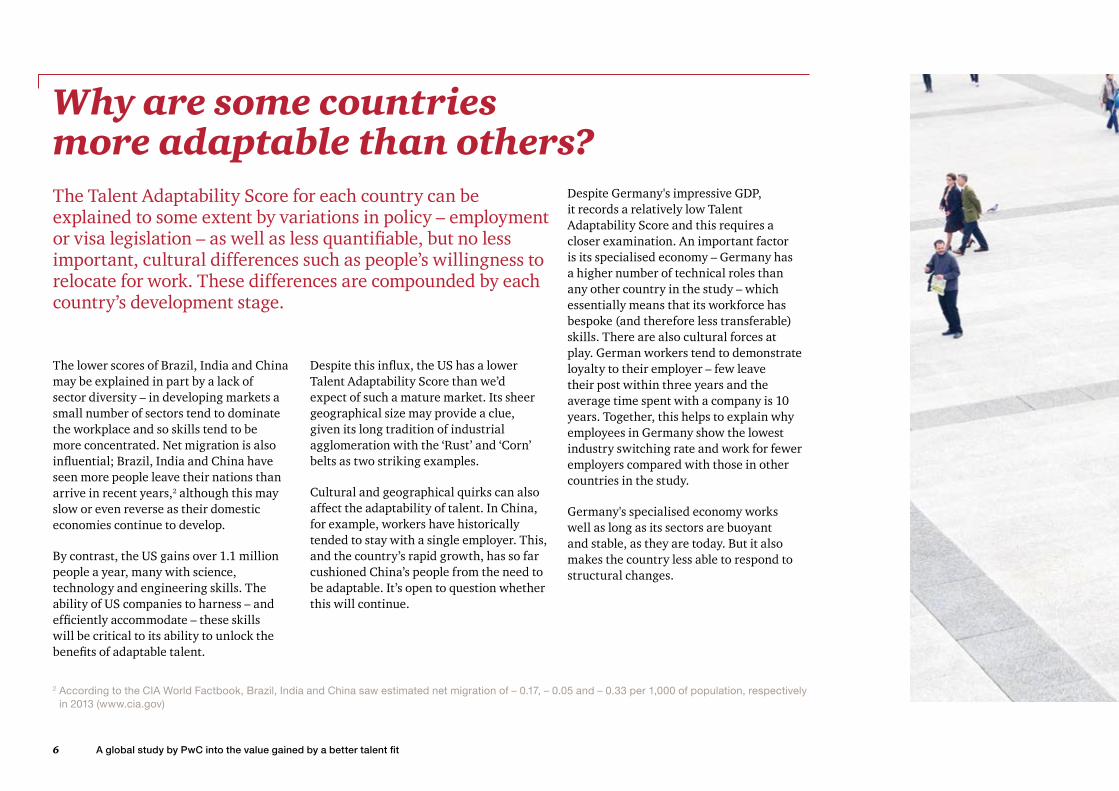
Why are some countries more adaptable than others?The Talent Adaptability Score for each country can be explained to some extent by variations in policy – employment or visa legislation – as well as less quantifiable, but no less important, cultural differences such as people’s willingness to relocate for work. These differences are compounded by each country’s development stage.
The lower scores of Brazil, India and China may be explained in part by a lack of sector diversity – in developing markets a small number of sectors tend to dominate the workplace and so skills tend to be more concentrated. Net migration is also influential; Brazil, India and China have seen more people leave their nations than arrive in recent years,2 although this may slow or even reverse as their domestic economies continue to develop.
By contrast, the US gains over 1.1 million people a year, many with science, technology and engineering skills. The ability of US companies to harness – and efficiently accommodate – these skills will be critical to its ability to unlock the benefits of adaptable talent.
Despite this influx, the US has a lower Talent Adaptability Score than we’d expect of such a mature market. Its sheer geographical size may provide a clue, given its long tradition of industrial agglomeration with the ‘Rust’ and ‘Corn’ belts as two striking examples.
Cultural and geographical quirks can also affect the adaptability of talent. In China, for example, workers have historically tended to stay with a single employer. This, and the country’s rapid growth, has so far cushioned China’s people from the need to be adaptable. It’s open to question whether this will continue.
Despite Germany's impressive GDP, it records a relatively low Talent Adaptability Score and this requires a closer examination. An important factor is its specialised economy – Germany has a higher number of technical roles than any other country in the study – which essentially means that its workforce has bespoke (and therefore less transferable) skills. There are also cultural forces at play. German workers tend to demonstrate loyalty to their employer – few leave their post within three years and the average time spent with a company is 10 years. Together, this helps to explain why employees in Germany show the lowest industry switching rate and work for fewer employers compared with those in other countries in the study.
Germany's specialised economy works well as long as its sectors are buoyant and stable, as they are today. But it also makes the country less able to respond to structural changes.
2 According to the CIA World Factbook, Brazil, India and China saw estimated net migration of – 0.17, – 0.05 and – 0.33 per 1,000 of population, respectively in 2013 (www.cia.gov)
7Adapt to survive – How better alignment between talent and opportunity can drive economic growth
“It’s key that we find and retain people who are open to new experiences within the company, both from a function but also location point of view; we hire people with a long term career trajectory in mind.”Jennifer Candee, Head of Global Talent Acquisition, SABMiller plc
8 A global study by PwC into the value gained by a better talent fit
1. Adaptability could unlock up to USD130 billion in additional productivity
More efficient talent markets result in a measurable impact on economic performance. Put simply, markets with the most adaptable talent tend to be more efficient and productive.
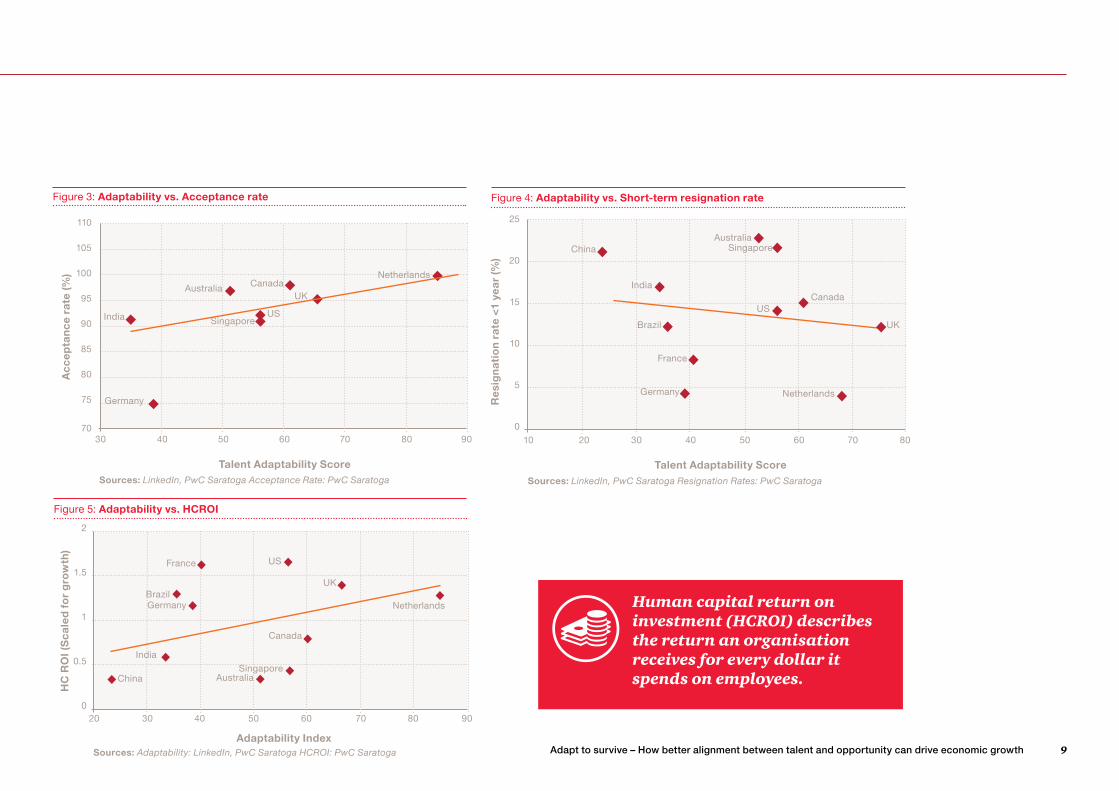
We found a strong correlation between the adaptability of the talent in a particular country and the performance of its companies (see Figure 5).
Our research shows that companies operating in markets with highly adaptable talent can typically attract and retain people more effectively. This is shown by a higher first-time acceptance rate of candidates (indicating a more efficient recruitment process and a better fit between employer and employee), and a lower short-term resignation rate (those resigning their post within 12 months).
The number of new recruits who resign within a year of appointment is huge in some countries – with short-term resignation rates running at over 20% in China.3
There are some cultural influences to consider – workers in both Australia and Singapore, for example, tend to travel and work abroad more frequently than others – but generally, employees that fit well to their role and their employer tend to stay for longer.
Well-matched employees perform better, because they’re more engaged and their skills and experience are well-suited to their role.
For organisations this amounts to a greater return on their investment in people measured here as Human Capital Return on Investment (HCROI). Our research suggests that up to USD130 billion of productivity could be released in the 11 markets we studied (including USD65.6 billion in China, USD29.3 billion in the US and USD11.7 billion in Brazil) if talent markets become more efficient.
In markets with the most adaptable talent, people are free and willing to move to wherever their skills are best suited, including moving up through – or sideways within – an organisation. For this reason we include promotion rates and positions held as two of the indicators of adaptable talent.
Employers shouldn’t overlook existing employees as there are benefits attached to promoting internally. These promotions are less costly and take less time to complete than external recruitment, but only if the candidates are the best fit for the job.
In the future, employers will rely on smart data analytics that will allow them to anticipate the future needs of their organisation as well as better understand its existing embedded skills. Equipped with this insight, their ability to invest in the right people management programmes to deliver against this need will provide a competitive advantage and will reduce avoidable workplace attrition.
3 PwC Saratoga data
9Adapt to survive – How better alignment between talent and opportunity can drive economic growth
Figure 4: Adaptability vs. Short-term resignation rate
Sources: LinkedIn, PwC Saratoga Resignation Rates: PwC Saratoga
Talent Adaptability Score
Res
ign
atio
n ra
te <
1 ye
ar (%
)
25
20
15
10
5
03010 60 70 804020 50
Canada
China
France
Germany Netherlands
UK
US
India
Brazil
SingaporeAustralia
Figure 5: Adaptability vs. HCROI
Sources: Adaptability: LinkedIn, PwC Saratoga HCROI: PwC Saratoga
HC
RO
I (S
cale
d f
or
gro
wth
)
2
1.5
1
0.5
020 5030 80 906040 70
Adaptability Index
Netherlands
UK
Canada
Australia
India
China
France
Singapore
Germany
US
Brazil
Figure 3: Adaptability vs. Acceptance rate
Acc
epta
nce
rat
e (%
)
110
105
100
95
90
85
80
75
705030 80 906040 70
Talent Adaptability ScoreSources: LinkedIn, PwC Saratoga Acceptance Rate: PwC Saratoga
India
UK
Netherlands
US
Canada
Singapore
Australia
Germany
Human capital return on investment (HCROI) describes the return an organisation receives for every dollar it spends on employees.
10 A global study by PwC into the value gained by a better talent fit
2. The skills gap will narrow with increased adaptability
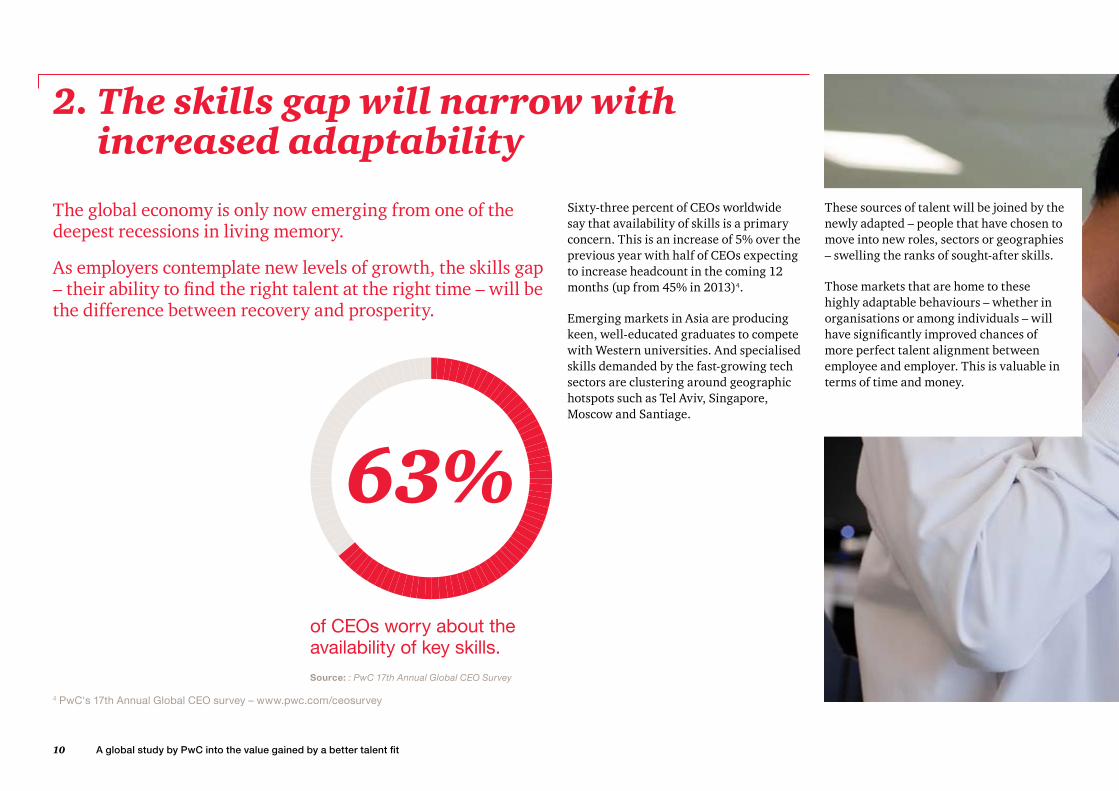
of CEOs worry about the availability of key skills.Source: : PwC 17th Annual Global CEO Survey
63%
The global economy is only now emerging from one of the deepest recessions in living memory.
As employers contemplate new levels of growth, the skills gap – their ability to find the right talent at the right time – will be the difference between recovery and prosperity.
Sixty-three percent of CEOs worldwide say that availability of skills is a primary concern. This is an increase of 5% over the previous year with half of CEOs expecting to increase headcount in the coming 12 months (up from 45% in 2013)4.
Emerging markets in Asia are producing keen, well-educated graduates to compete with Western universities. And specialised skills demanded by the fast-growing tech sectors are clustering around geographic hotspots such as Tel Aviv, Singapore, Moscow and Santiage.
These sources of talent will be joined by the newly adapted – people that have chosen to move into new roles, sectors or geographies – swelling the ranks of sought-after skills.
Those markets that are home to these highly adaptable behaviours – whether in organisations or among individuals – will have significantly improved chances of more perfect talent alignment between employee and employer. This is valuable in terms of time and money.
4 PwC's 17th Annual Global CEO survey – www.pwc.com/ceosurvey
11Adapt to survive – How better alignment between talent and opportunity can drive economic growth
“ Individuals are more connected, open minded, and willing. They can easily consider whether their company’s offerings – challenges, salary and benefits – are comparable to other opportunities in the market.”
German telecommunications companyPwC Social Media and Talent Acquisition survey, January 2014
12 A global study by PwC into the value gained by a better talent fit
5 Assuming a reduction in short-term resignations and increase in HCROI, based on adaptability index
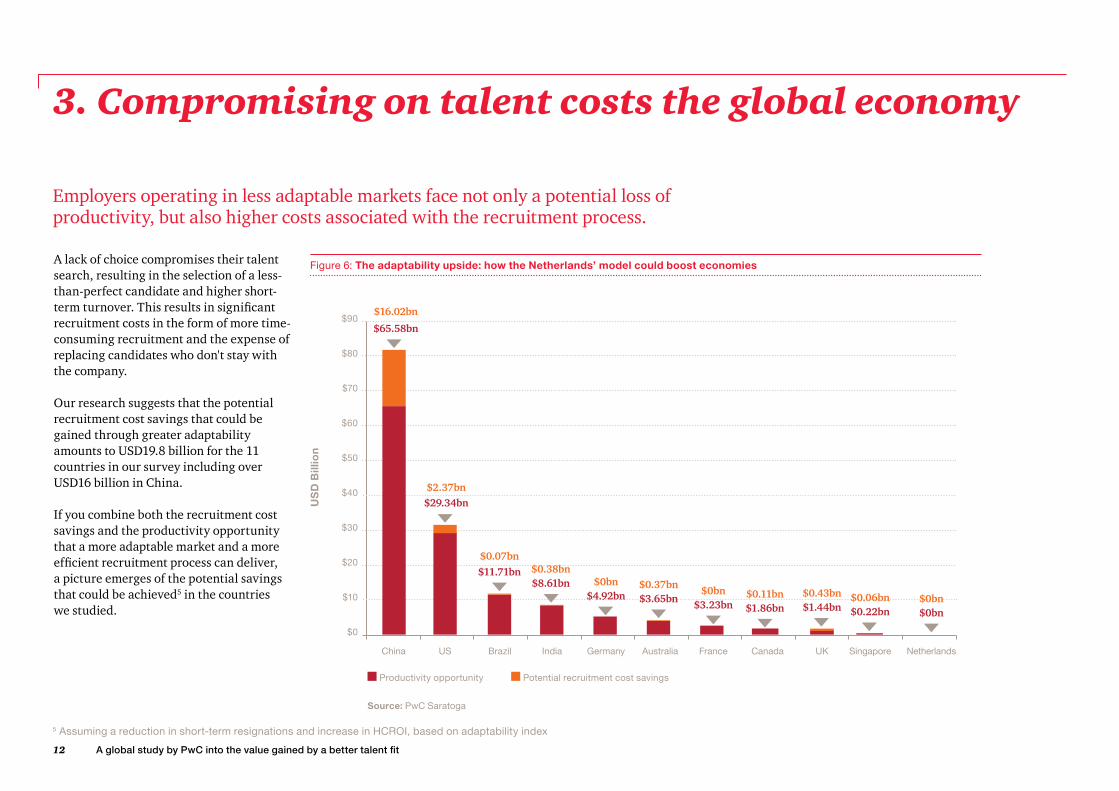
3. Compromising on talent costs the global economy
A lack of choice compromises their talent search, resulting in the selection of a less-than-perfect candidate and higher short- term turnover. This results in significant recruitment costs in the form of more time-consuming recruitment and the expense of replacing candidates who don't stay with the company.
Our research suggests that the potential recruitment cost savings that could be gained through greater adaptability amounts to USD19.8 billion for the 11 countries in our survey including over USD16 billion in China.
If you combine both the recruitment cost savings and the productivity opportunity that a more adaptable market and a more efficient recruitment process can deliver, a picture emerges of the potential savings that could be achieved5 in the countries we studied.
Figure 6: The adaptability upside: how the Netherlands’ model could boost economies
$90
$80
$70
$60
$50
$40
$30
$20
$10
$0
US
D B
illio
n
China US Brazil India Germany Australia France Canada UK Singapore Netherlands
Productivity opportunity Potential recruitment cost savings
Source: PwC Saratoga
$65.58bn
$16.02bn
$29.34bn$2.37bn
$11.71bn$0.07bn
$8.61bn$0.38bn
$4.92bn$0bn
$3.65bn$0.37bn
$3.23bn$0bn
$1.86bn$0.11bn
$1.44bn$0.43bn
$0.22bn$0.06bn
$0bn$0bn
Employers operating in less adaptable markets face not only a potential loss of productivity, but also higher costs associated with the recruitment process.
13Adapt to survive – How better alignment between talent and opportunity can drive economic growth
“ We can reach a greater diversity of candidates, and more of them. We are better able to maintain corporate labour realisation goals by keeping positions filled.”
Engineering company, US
PwC Social Media and Talent Acquisition survey, January 2014
“We use online professional networks extensively, and one of the biggest opportunities is to promote and share our brand values through our employees to their networks and beyond – in essence they become our talent brand ambassadors”Charlie Milne, Head of Recruitment Strategy & Sourcing, The Westpac Group.
14 A global study by PwC into the value gained by a better talent fit
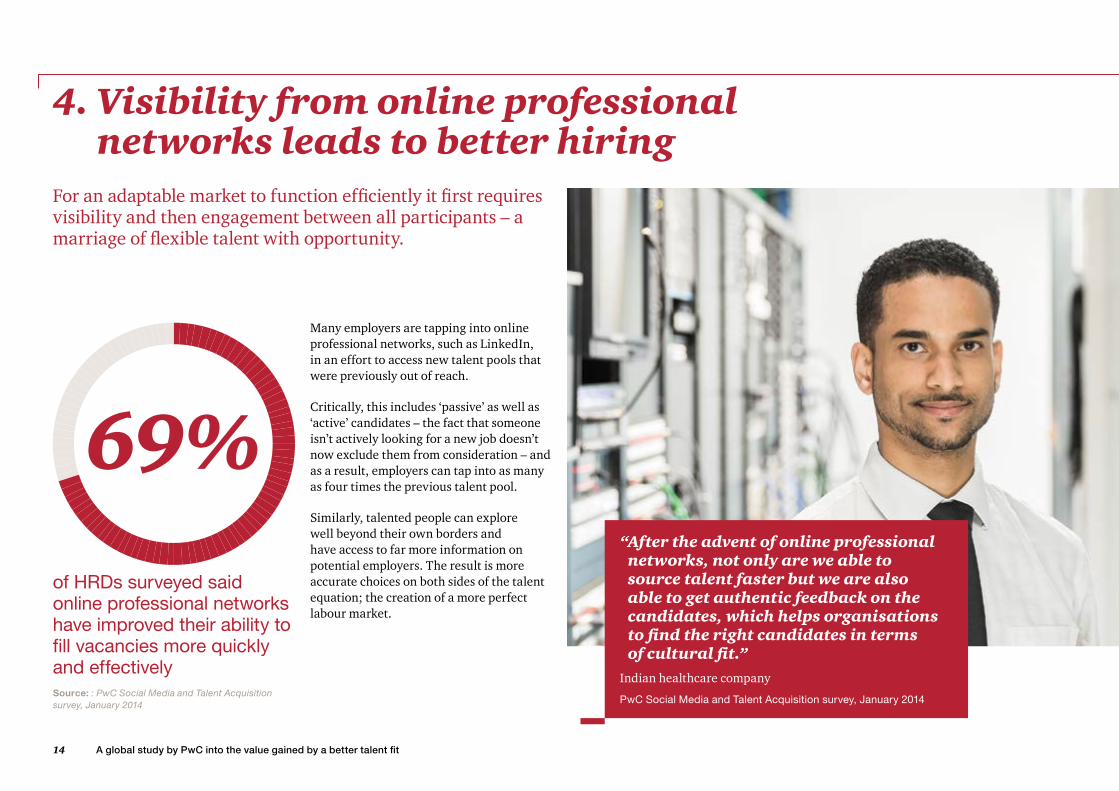
Many employers are tapping into online professional networks, such as LinkedIn, in an effort to access new talent pools that were previously out of reach.
Critically, this includes ‘passive’ as well as ‘active’ candidates – the fact that someone isn’t actively looking for a new job doesn’t now exclude them from consideration – and as a result, employers can tap into as many as four times the previous talent pool.
Similarly, talented people can explore well beyond their own borders and have access to far more information on potential employers. The result is more accurate choices on both sides of the talent equation; the creation of a more perfect labour market.
69%
4. Visibility from online professional networks leads to better hiring
For an adaptable market to function efficiently it first requires visibility and then engagement between all participants – a marriage of flexible talent with opportunity.
“ After the advent of online professional networks, not only are we able to source talent faster but we are also able to get authentic feedback on the candidates, which helps organisations to find the right candidates in terms of cultural fit.”
Indian healthcare company
PwC Social Media and Talent Acquisition survey, January 2014
of HRDs surveyed said online professional networks have improved their ability to fill vacancies more quickly and effectivelySource: : PwC Social Media and Talent Acquisition survey, January 2014
15Adapt to survive – How better alignment between talent and opportunity can drive economic growth
“ These platforms have provided us with the ability to engage with more prospective candidates in cost effective and convenient ways, and do so more frequently. We now spend more time and effort on being where the candidates are, rather than expecting prospective candidates to come to us. We are able to start demonstrating and educating people about our company, careers and employer value proposition very early on in the process, which helps to attract the talent we are looking for and then influence them to move towards applying.”
US insurance company
PwC Social Media and Talent Acquisition survey, January 2014
6 LinkedIn data 2013
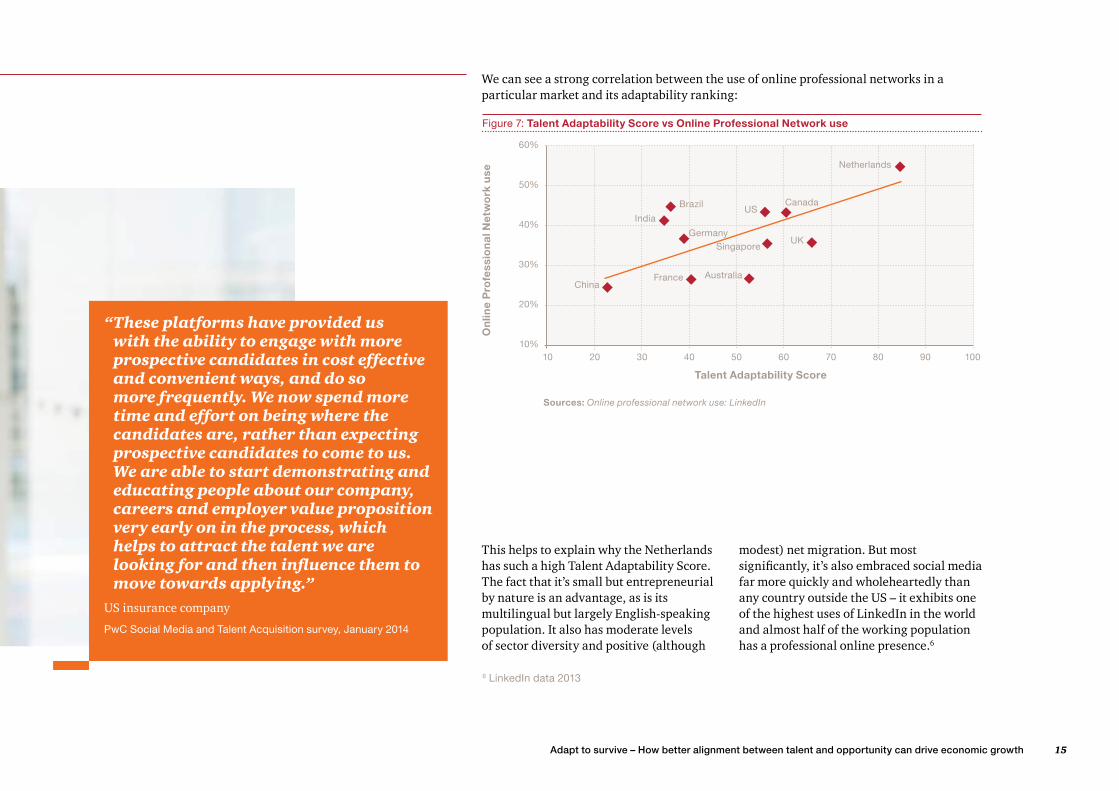
This helps to explain why the Netherlands has such a high Talent Adaptability Score. The fact that it’s small but entrepreneurial by nature is an advantage, as is its multilingual but largely English-speaking population. It also has moderate levels of sector diversity and positive (although
modest) net migration. But most significantly, it’s also embraced social media far more quickly and wholeheartedly than any country outside the US – it exhibits one of the highest uses of LinkedIn in the world and almost half of the working population has a professional online presence.6
We can see a strong correlation between the use of online professional networks in a particular market and its adaptability ranking:
Figure 7: Talent Adaptability Score vs Online Professional Network use
Sources: Online professional network use: LinkedIn
50%
60%
40%
30%
20%
10%10 4020 70 80 90 1005030 60
Talent Adaptability Score
On
line
Pro
fess
ion
al N
etw
ork
use
Netherlands
UK
CanadaUS
Singapore
Brazil
India
Germany
AustraliaFranceChina
16 A global study by PwC into the value gained by a better talent fit
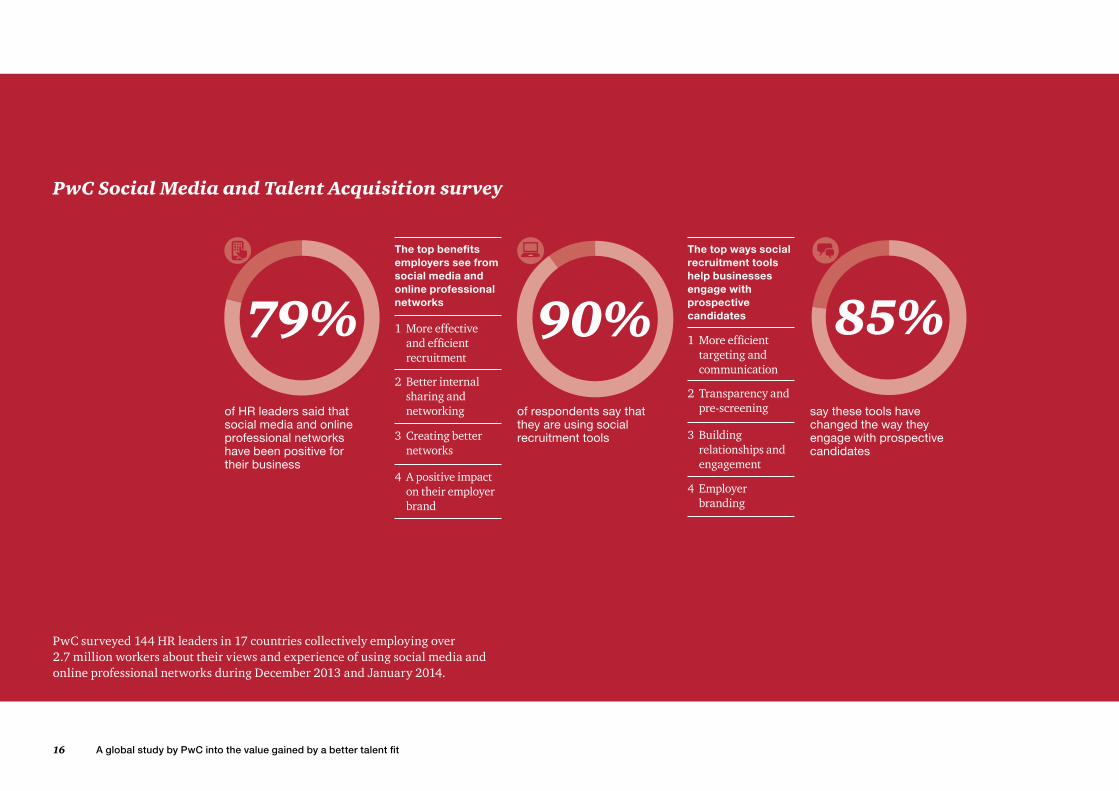
PwC surveyed 144 HR leaders in 17 countries collectively employing over 2.7 million workers about their views and experience of using social media and online professional networks during December 2013 and January 2014.
of HR leaders said that social media and online professional networks have been positive for their business
79%
of respondents say that they are using social recruitment tools
90%
say these tools have changed the way they engage with prospective candidates
85%
The top ways social recruitment tools help businesses engage with prospective candidates
1 More efficient targeting and communication
2 Transparency and pre-screening
3 Building relationships and engagement
4 Employer branding
The top benefits employers see from social media and online professional networks
1 More effective and efficient recruitment
2 Better internal sharing and networking
3 Creating better networks
4 A positive impact on their employer brand
PwC Social Media and Talent Acquisition survey
17Adapt to survive – How better alignment between talent and opportunity can drive economic growth
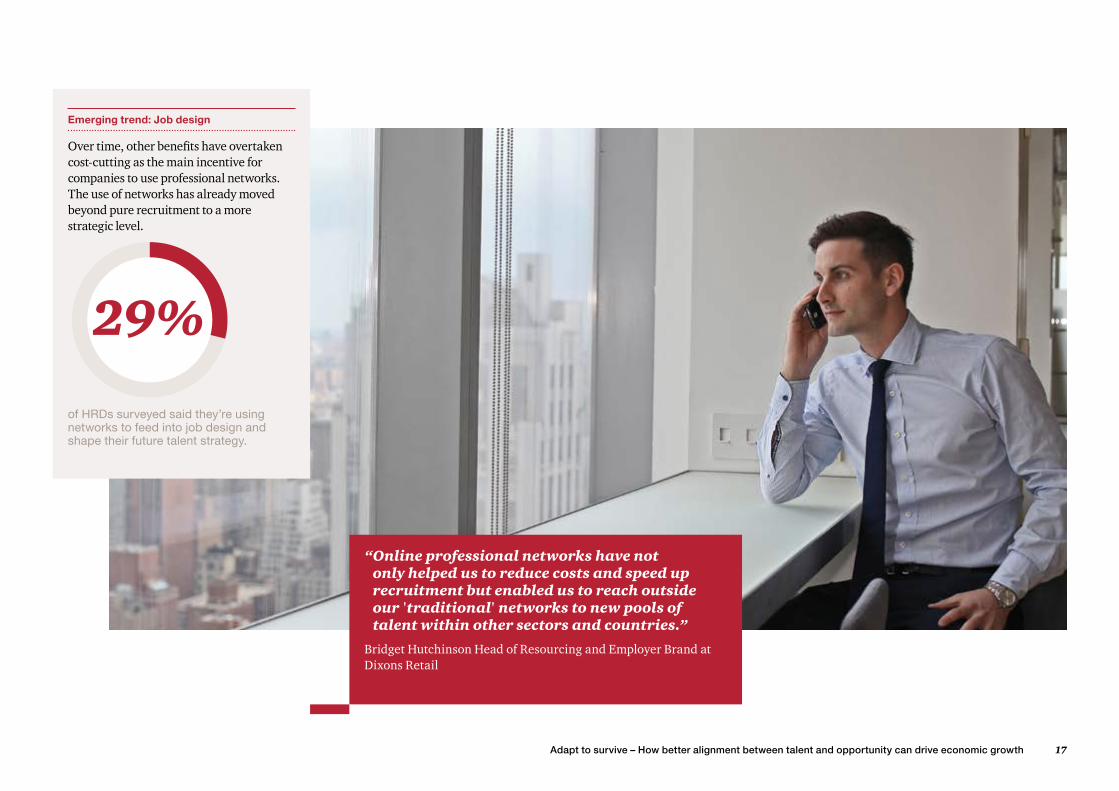
“ Online professional networks have not only helped us to reduce costs and speed up recruitment but enabled us to reach outside our 'traditional' networks to new pools of talent within other sectors and countries.”
Bridget Hutchinson Head of Resourcing and Employer Brand at Dixons Retail
Over time, other benefits have overtaken cost-cutting as the main incentive for companies to use professional networks. The use of networks has already moved beyond pure recruitment to a more strategic level.
of HRDs surveyed said they’re using networks to feed into job design and shape their future talent strategy.
29%
Emerging trend: Job design
18 A global study by PwC into the value gained by a better talent fit
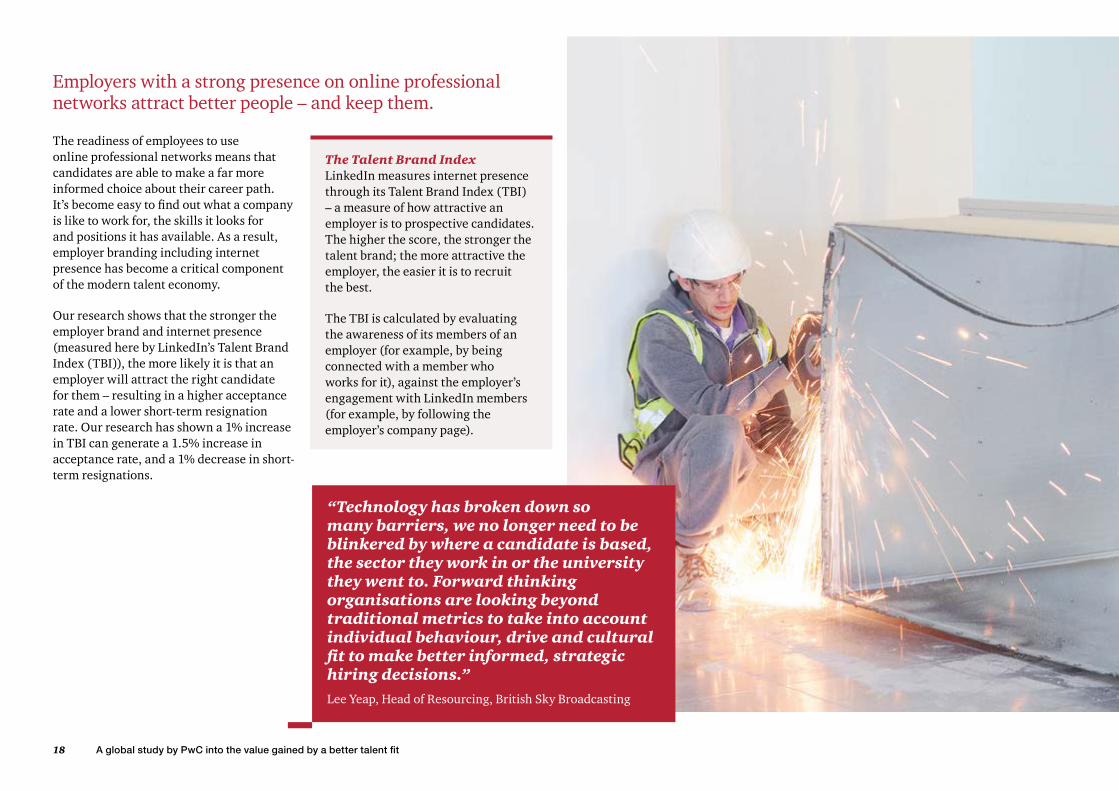
The readiness of employees to use online professional networks means that candidates are able to make a far more informed choice about their career path. It’s become easy to find out what a company is like to work for, the skills it looks for and positions it has available. As a result, employer branding including internet presence has become a critical component of the modern talent economy.
Our research shows that the stronger the employer brand and internet presence (measured here by LinkedIn’s Talent Brand Index (TBI)), the more likely it is that an employer will attract the right candidate for them – resulting in a higher acceptance rate and a lower short-term resignation rate. Our research has shown a 1% increase in TBI can generate a 1.5% increase in acceptance rate, and a 1% decrease in short- term resignations.
The Talent Brand IndexLinkedIn measures internet presence through its Talent Brand Index (TBI) – a measure of how attractive an employer is to prospective candidates. The higher the score, the stronger the talent brand; the more attractive the employer, the easier it is to recruit the best.
The TBI is calculated by evaluating the awareness of its members of an employer (for example, by being connected with a member who works for it), against the employer’s engagement with LinkedIn members (for example, by following the employer’s company page).
“Technology has broken down so many barriers, we no longer need to be blinkered by where a candidate is based, the sector they work in or the university they went to. Forward thinking organisations are looking beyond traditional metrics to take into account individual behaviour, drive and cultural fit to make better informed, strategic hiring decisions.”Lee Yeap, Head of Resourcing, British Sky Broadcasting
Employers with a strong presence on online professional networks attract better people – and keep them.
19Adapt to survive – How better alignment between talent and opportunity can drive economic growth
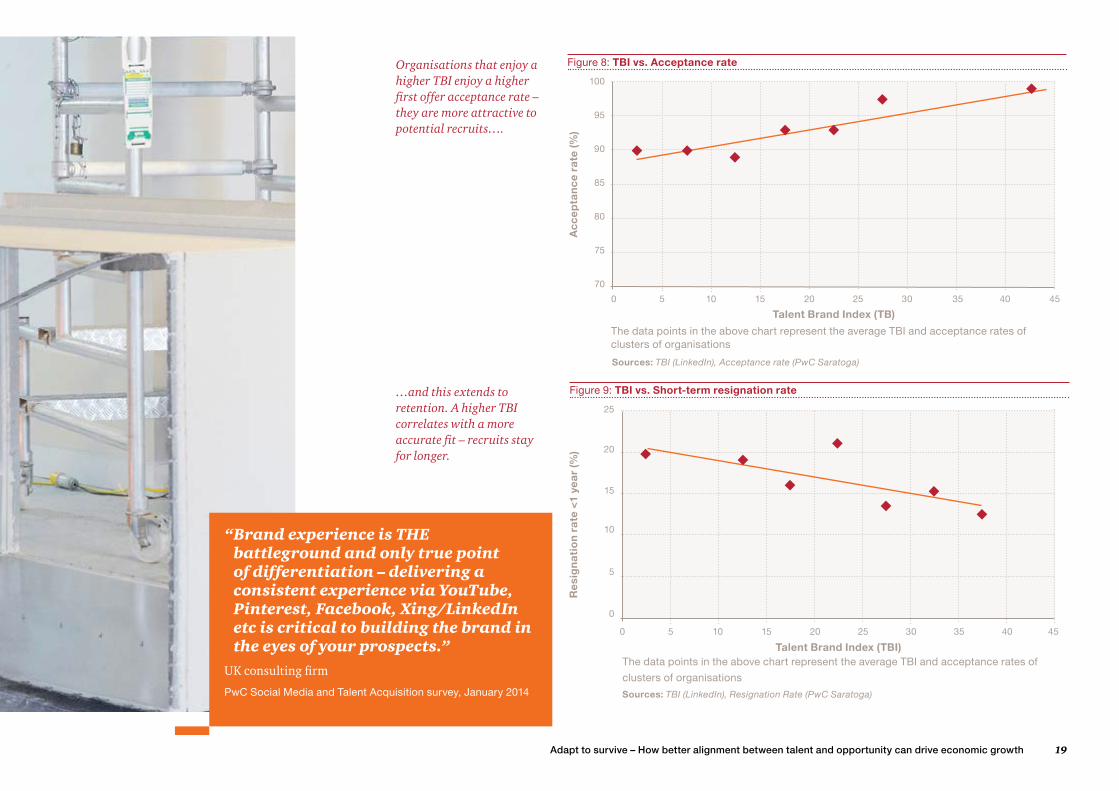
Figure 9: TBI vs. Short-term resignation rate
Sources: TBI (LinkedIn), Resignation Rate (PwC Saratoga)
Res
ign
atio
n ra
te <
1 ye
ar (%
)
25
20
15
10
5
0
Talent Brand Index (TBI)
“ Brand experience is THE battleground and only true point of differentiation – delivering a consistent experience via YouTube, Pinterest, Facebook, Xing/LinkedIn etc is critical to building the brand in the eyes of your prospects.”
UK consulting firm
PwC Social Media and Talent Acquisition survey, January 2014
0 155 30 35 40 452010 25
Figure 8: TBI vs. Acceptance rate
Sources: TBI (LinkedIn), Acceptance rate (PwC Saratoga)
Talent Brand Index (TB)
95
100
90
85
80
75
70
0 155 30 35 40 452010 25
Acc
epta
nce
rat
e (%
)
The data points in the above chart represent the average TBI and acceptance rates of clusters of organisations
The data points in the above chart represent the average TBI and acceptance rates of
clusters of organisations
Organisations that enjoy a higher TBI enjoy a higher first offer acceptance rate – they are more attractive to potential recruits….
…and this extends to retention. A higher TBI correlates with a more accurate fit – recruits stay for longer.
20 A global study by PwC into the value gained by a better talent fit
• Look for evidence – organisations are more transparent than ever. Find employers with a track record of training and development around soft and hard skills, and a corporate culture that embraces intelligent risk-taking by its employees.
• Advertise your adaptability – online professional networks have brought visibility to the talent market and allow people to showcase their talent as never before. Online professional networks are now the second most popular (as well as the fastest-growing) source of quality hires.7 The quality of your online presence has never mattered more.
• Anticipate the skills need – now and in the future. Transferable soft skills, such as languages, are valuable – 43% of the Millennial generation are already using a second language at work and a further 27% expect to do so in the future8 – but so too are hard skills. Keep them up to date through training and development and look for opportunities to pick up skills across departments in your company.
• Be bold – organisations will look for individuals who have a global mindset and are resilient, open to change, curious and proactive.
• Go beyond borders – career paths are no longer linear. The scenic route takes in more than the view. It allows you to absorb new skills, cultures and makes you more adaptable – and therefore desirable – to employers.
• Connect, build and maintain your professional network – identify and engage with people and organisations that can inspire or help you in your career today and in the future. Leverage your network to better understand the skills that are vital to learn now and over the next five years.
• Invest in education – employees who are willing to retrain themselves if it turns out certain skills are in demand (and their current skills aren’t so much) will find better jobs. Invest in education also means staying on top of new tools and technology, and take courses to learn more about them.
Key questions for individuals:?
• Are you thinking about your career options across borders and in other industries?
• Are you adequately investing in the skills you will need for the future?
• Do you have a presence on a professional network like LinkedIn, and is it strong and engaging enough to help you get where you want to be?
• Does your online profile showcase your adaptability – or seek to down-play it?
Recommendations for individualsFuture-proof your career
7 LinkedIn Global Recruitment Trends 20138 PwC's 'Millennials at work: Reshaping the workplace' report'
Individuals should take a longer term view of their careers. Seek out work environments that will help you to be more adaptable in the future. Remain open-minded about your career path and embrace change.
These aren’t simply concerns for the young. People at 40 still need to plan for almost two-thirds of their working life – they need to be as adaptable today as they were on graduation – perhaps more so, given the divergence between the skills they nurtured in the 1980s and those sought now.

21Adapt to survive – How better alignment between talent and opportunity can drive economic growth
22 A global study by PwC into the value gained by a better talent fit
Employers should focus on seven strategic imperatives which combined will help foster an adaptable culture and ensure good cultural fit:
• Support those who dare to adapt – define new boundaries, celebrate successes and learn from mistakes in a transparent way.
• Use talent analytics to identify the skills that are central to the business strategy today and in the future – challenge HR to prove its worth (and earn its seat at the boardroom table) by providing the insight that identifies ways to encourage adaptability, improves hiring and unlocks competitive advantage.
• Balance hard and soft skills – test for an absence of highly transferable attributes such as communication, problem-solving and collaboration skills. Recognise and nurture these attributes through tailored programmes such as coaching and mentoring, negotiation and conflict resolution training.
• Recalibrate rewards – traditional annual pay and performance management processes often fail to reward employees for being adaptable. Introduce ‘balanced scorecards’ that reflect the longer term needs of the business, not just the short-term shareholder value. For example, does the reward structure unintentionally penalise a sideways move or an overseas assignment, instead of recognising its longer term benefit?
• Embed adaptability into your people management programmes – make sure that analysis results in actions that efficiently encourage new and adaptable skills. Use the insights gained from data analytics to drive people programmes and inform learning and development.
• Broaden and balance your recruitment strategies – improve internal mobility – develop and nurture the people you already have – alongside external recruitment strategies that look wider and further for new talent.
Key questions for employers:?
• Are you using the visibility that online professional networks bring to rethink the talent pipeline?
• Are you rewarding – or penalising – adaptable talent in your organisation?
• Is your HR function ready to support a focus on talent adaptability?
Recommendations for employersSeek out, nurture and reward adaptable talent
Businesses have to adapt quickly to these emerging drivers. Strategic cycles are more compressed and interdependencies are more complex than at any other time.
Businesses need the ability to adapt to meet these emerging opportunities. And that requires adaptable people – many of whom are not in the right roles, the organisation or even in the same industry – yet.
• Maximise the benefits of online professional networks – explore the pool of passive candidates who may have the skills you need, but who aren't actively looking for a job. Make sure that the organisation's online presence and employer brand are well-managed, vibrant and attractive.
23Adapt to survive – How better alignment between talent and opportunity can drive economic growth
Recommendations for educatorsOffer courses and job training that produce adaptable people
There are five key considerations for educators:
• Promote and welcome business engagement in schools, colleges and universities – inspire students in their future career choices and use business engagement to smooth the transition from education to the world of work, ensuring individuals receive high quality, objective advice and information on potential career paths.
• Be responsive and agile – the needs of both business and students will change over time. Maximise the chances of matching people to the opportunities available today and in the future by improving the brokering process. Use online professional networks to better track the skills in demand by employers now, and start conversations with potential students early about the training required to get them hired once their courses are complete.
• Improve the dialogue with businesses – develop a mindset that sees education as central to the success of businesses. Develop courses that are demand-led and supported by employers and engage with trade bodies to look over the horizon at future needs. Create programmes that include on-the-job training for early skills development.
• Education for all – as the implications of an ageing workforce are felt, educators can play a critical role in aiding adaptability by inspiring older people to retrain and adapt to changes in the workplace. Think about ways to make learning less daunting to people who have been outside classrooms for decades. Introduce bite-sized or distance learning programmes in partnership with employers to improve participation.
• Blur the lines between education and employment – move from a ‘hard stop’ mentality, which sees people ‘leave behind’ their education for work and instead maintain a dialogue with students beyond graduation. Use this ‘after-sales service’ philosophy to re-engage and upsell skills to deliver a longer term benefit.
Key questions for educators:?
• How are you engaging with businesses to understand and meet their future talent needs?
• Are you using data analytics to help you predict future skill needs?
• Are you attracting employers and seeking their involvement in course design and delivery?
• Are you ready to help older learners re-skill and adapt for the future?
Educators should work more closely with employers and governments to help meet future workforce needs. This will unlock long-term benefits for students, but it will require planning and collaboration.
Institutions must seek out employers and find ways to add value to their students in ways that supplement careers' advice. This already happens today in part, but it’s patchy and uncoordinated, particularly among SMEs that are significant consumers of talent.
24 A global study by PwC into the value gained by a better talent fit
• Enable and encourage labour mobility. Mobility of labour across borders provides a greater opportunity for employers to find the right talent fit, and mobility depends on the right immigration policy. While there’s a careful balance to be made in regions with net skills migration – policies that encourage mobility of scarce and valued skills, power economies.
• Align education with the economic need. Government should encourage an environment in schools, universities and career guidance services that focus on matching skills to prospective careers. Retraining for new skills and careers should be actively supported and shouldn’t be left to individual institutions.
• Work with business and take a data-led approach to skills policies. A close collaboration between business and governments will help to identify current and potential future skills shortages in specific areas. Businesses need to get better at articulating their needs and data analytics can make these needs clearer and easier to act on. For example, the UK is experiencing a serious shortage of candidates with science, technology, engineering and mathematics (STEM) skills – 39% of UK employers say they are struggling to recruit employees with the advanced technical skills they need.10
• Reskill the ageing workforce. In the future we will all work longer, and as the global workforce ages and retirement ages increase, governments need to help older workers adapt. They need their contribution. In Europe, the working-age population will fall by 33 million by 2025 and Japan is currently losing 10,000 people11 a week from its working-age workforce.
Key questions for governments:?
• Will current education and skills policies encourage talent adaptability alongside development of skills currently in short supply?
• Are policies supporting adaptability and retraining for older workers?
• Is the government taking a lead in the debate about skills and immigration?
Recommendations for governmentsCreate the climate for adaptability
9 For a detailed analysis of CEOs’ views on the relationship between government and business, see PwC's recent report Government and the Global CEO: Fit for their futures10 Confederation of British Industry survey 201311 UN Population Division, World Population Prospects 2012
Governments should play an active role in shaping a national mindset that values, nurtures and rewards adaptability. They need to use the levers at their disposal, such as employment and immigration laws, as well as proactively shaping education and training systems.
PwC’s recent CEO survey found that, although 41% felt that creating a skilled workforce should be a top priority for governments, just 21% believe that their government has been effective so far.9 There are five strategic levers that will improve adaptability and are within the reach of governments:
• Lead the national dialogue about talent adaptability. Legislation to foster a flexible labour infrastructure can only go so far – what’s needed is for public leaders to actively encourage a national mindset that values, supports and nurtures adaptability. A public dialogue that involves public organisations, employers, universities and schools.
25Adapt to survive – How better alignment between talent and opportunity can drive economic growth
26 A global study by PwC into the value gained by a better talent fit
Methodology
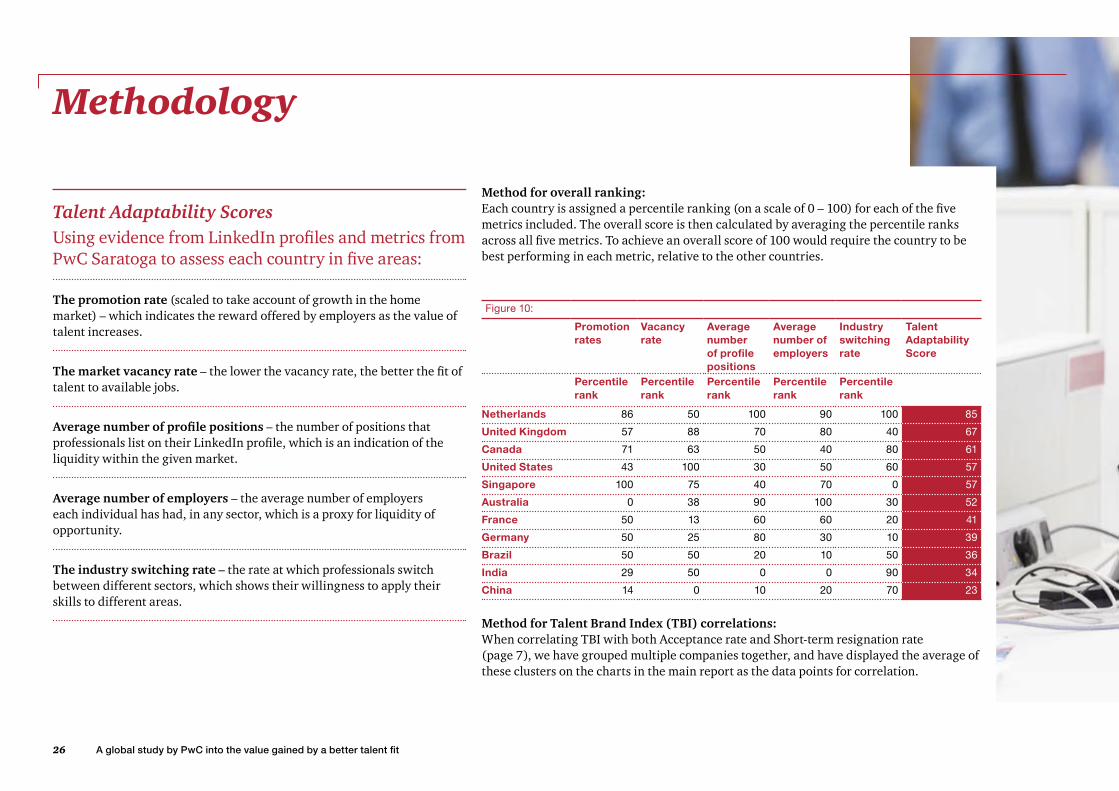
Talent Adaptability ScoresUsing evidence from LinkedIn profiles and metrics from PwC Saratoga to assess each country in five areas:
The promotion rate (scaled to take account of growth in the home market) – which indicates the reward offered by employers as the value of talent increases.
The market vacancy rate – the lower the vacancy rate, the better the fit of talent to available jobs.
Average number of profile positions – the number of positions that professionals list on their LinkedIn profile, which is an indication of the liquidity within the given market.
Average number of employers – the average number of employers each individual has had, in any sector, which is a proxy for liquidity of opportunity.
The industry switching rate – the rate at which professionals switch between different sectors, which shows their willingness to apply their skills to different areas.
Method for overall ranking:Each country is assigned a percentile ranking (on a scale of 0 – 100) for each of the five metrics included. The overall score is then calculated by averaging the percentile ranks across all five metrics. To achieve an overall score of 100 would require the country to be best performing in each metric, relative to the other countries.
Figure 10:
Promotion rates
Vacancy rate
Average number of profile positions
Average number of employers
Industry switching rate
Talent Adaptability Score
Percentile rank
Percentile rank
Percentile rank
Percentile rank
Percentile rank
Netherlands 86 50 100 90 100 85
United Kingdom 57 88 70 80 40 67
Canada 71 63 50 40 80 61
United States 43 100 30 50 60 57
Singapore 100 75 40 70 0 57
Australia 0 38 90 100 30 52
France 50 13 60 60 20 41
Germany 50 25 80 30 10 39
Brazil 50 50 20 10 50 36
India 29 50 0 0 90 34
China 14 0 10 20 70 23
Method for Talent Brand Index (TBI) correlations:When correlating TBI with both Acceptance rate and Short-term resignation rate (page 7), we have grouped multiple companies together, and have displayed the average of these clusters on the charts in the main report as the data points for correlation.
27Adapt to survive – How better alignment between talent and opportunity can drive economic growth
Acceptance rate The number of job offers extended that were accepted by candidates
Cost per hire External recruitment costs divided by the number of external recruits
Human capital return on investment (HCROI) The return an organisation receives for every dollar it spends on employees
Millennial generation Defined by PwC as those entering the workplace after June 2000
Promotion rate The number of internal promotions as a percentage of headcount
Short-term resignation rate The number of voluntary resignations within one year of the original date of appointment, excluding those taking early retirement or voluntary redundancy
Vacancy rate The average number of open vacancies divided by the population studied (e.g. organisational headcount, working-age population).
Glossary
Revenue – (Costs – Compensation and Benefits) Compensation and Benefits
28 A global study by PwC into the value gained by a better talent fit
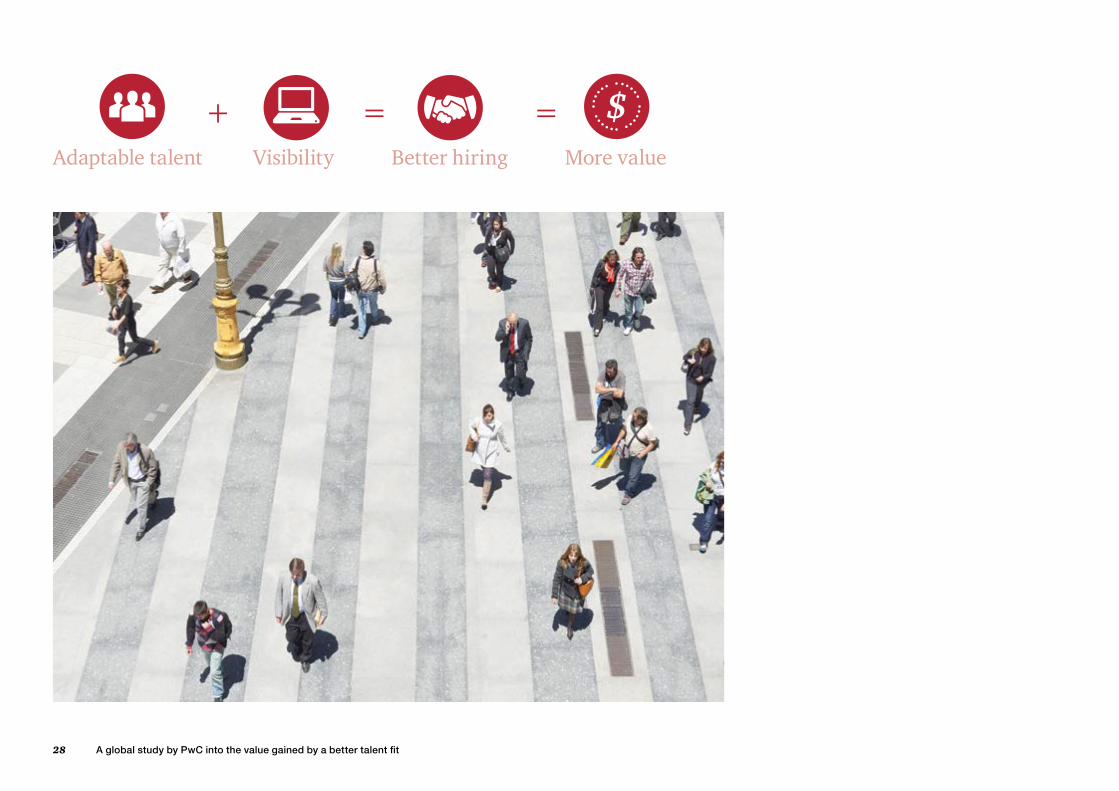
Adaptable talent Visibility Better hiring More value
$+ = =
29Adapt to survive – How better alignment between talent and opportunity can drive economic growth
Contacts
Key contactsMichael RendellHuman Resource consultingGlobal Network Leader+44 20 7212 [email protected]
Jennifer ChapmanPwC Saratoga+44 7795 452044 [email protected]
Justine BrownMarketingHuman Resource consulting+44 113 289 [email protected]
AustraliaJon Williams+61 (2) 8266 [email protected]
BrazilJoao Lins+55 11 3674 [email protected]
CanadaDiane Horton+1 416 687 [email protected]
ChinaLukia Xing+86 (10) 6533 [email protected]
FranceDaniel Giffard Bouvier +33 (1) 56 57 84 [email protected]
GermanyTill Lohman+49 40 [email protected]
IndiaPadmaja Alaganandan+91 80 4079 [email protected]
NetherlandsHenk van Cappelle+31 88 792 63 53 [email protected]
SingaporeAlywin S Teh+ 65 6236 [email protected]
UKLaura Hinton +44 (0) 20 7212 [email protected]
USScott Olsen+1 646 471 [email protected]
Ed Boswell+1 617 530 [email protected]
Toni Cusumano+1 415 307 [email protected]
www.pwc.com/hrconsulting
PwC helps organisations and individuals create the value they’re looking for. We’re a network of firms in 157 countries with more than 184,000 people who are committed to delivering quality in assurance, tax and advisory services. Tell us what matters to you and find out more by visiting us at www.pwc.com.
This publication has been prepared for general guidance on matters of interest only, and does not constitute professional advice. You should not act upon the information contained in this publication without obtaining specific professional advice. No representation or warranty (express or implied) is given as to the accuracy or completeness of the information contained in this publication, and, to the extent permitted by law, PwC does not accept or assume any liability, responsibility or duty of care for any consequences of you or anyone else acting, or refraining to act, in reliance on the information contained in this publication or for any decision based on it.
© 2014 PwC. All rights reserved. PwC refers to the PwC network and/or one or more of its member firms, each of which is a separate legal entity. Please see www.pwc.com/structure for further details.
Design Services 28522 (02/14).