Embed Size (px)
Citation preview
American Journal of EpidemiologyCopyright © 1998 by The Johns Hopkins University School of Hygiene and Public HealthAll rights reserved
Vol. 148, No. 5Printed in U.S.A.
Adaptation of a Food Frequency Questionnaire to Assess Diets of PuertoRican and Non-Hispanic Adults
Katherine L. Tucker, Lisa A. Bianchi, Janice Maras, and Odilia I. Bermudez
To study issues of diet and health among Hispanic adults living in the northeastern United States, theauthors adapted a version of the National Cancer Institute (NCI)/Block food frequency questionnaire. Foodsthat contributed to nutrient intake of Puerto Rican adults in the Hispanic Health and Nutrition ExaminationSurvey (HHANES) were ranked to identify items to be added to the food list. Portion sizes were comparedacross HHANES and the Second National Health and Nutrition Examination Survey (NHANES II) to assess theadequacy of the assumed values. Within line items, frequencies of consumption of individual foods wereranked and these data were used to adjust the weighting factors within the database. To test the revised form,24-hour recalls were collected from 90 elderly Hispanics and 35 elderly non-Hispanic whites. These data werecoded into the original and revised food frequency forms and nutrient intake results were compared with recallresults by paired f-test, and by Pearson and intraclass correlations. Added foods include plantains, avocado,mango, cassava, empanadas, and custard. Portion sizes differed significantly between HHANES and NHANESII, and were left open-ended. Estimated mean nutrient intakes and correlations with recall data were lower withthe original versus the revised form. The authors conclude that the use in minority populations of foodfrequency questionnaires developed for the general population is likely to result in biased estimates of intakeunless modifications are made in the questionnaires. Am J Epidemiol 1998; 148:507-18.
diet; epidemiologic methods; ethnic groups; questionnaires
With increased interest in the study of diet anddisease in minority populations, the question of theapplicability of existing food frequency questionnairesis of concern (1-3). Instruments in major use includethe Harvard/Willett food frequency questionnaire andthe National Cancer Institute (NCI)/Block health hab-its and history questionnaire. The Willett instrumentwas developed and validated with data from nurses (4)and subsequently expanded and validated in a popu-lation of male health professionals (5). The Blockinstrument was developed with data from the SecondNational Health and Nutrition Examination Survey(NHANES II) (6-9).
Because the food frequency method depends on apredetermined list of food items, it may be appropri-ately used only with the population for which it was
Received for publication January 15, 1997 and accepted forpublication February 19, 1998.
Abbreviations: HCRC, Hutchinson Cancer Research Center;HHANES, Hispanic Health and Nutrition Examination Survey; NCI,National Cancer Institute; NDS, Nutrition Data System (Minnesota);NHANES II, Second National Health and Nutrition Examination Sur-vey; USDA, US Department of Agriculture.
From the Jean Mayer USDA Human Nutrition Research Center onAging at Tufts University, Boston, MA.
Reprint requests to Dr. Katherine L. Tucker, Jean Mayer USDAHuman Nutrition Research Center on Aging at Tufts University, 711Washington Street, Boston, MA 02111.
developed or subsequently validated. Often, a compar-ison of dietary risk across sub-populations is of centralinterest. There is, therefore, a need for instrumentswhich will capture the diets of differing groups with-out differential bias in ability to describe and rankindividuals with regard to food and nutrient intake. Inthis paper, we describe the process we followed inorder to develop an instrument for the MassachusettsHispanic Elders Study, where diets of Hispanics, pri-marily of Puerto Rican origin, are assessed along withthose of neighborhood matched non-Hispanic whitesubjects.
MATERIALS AND METHODS
Instrument development
The development of a food frequency questionnairethat can simultaneously provide valid measures of dietfor Puerto Rican and non-Hispanic white subjectsposes several problems. First, the Puerto Rican dietdiffers significantly from what may be considereddominant dietary patterns in the United States andincludes foods not on any of the major existing instru-ments. Also of concern are the assumptions used forfood item weights within the nutrient database. Asingle line item in the questionnaire often includes
507
Dow
nloaded from https://academ
ic.oup.com/aje/article/148/5/507/77051 by guest on 15 February 2022
508 Tucker et al.
multiple foods, which are generally weighted by fre-quency of use in the population (e.g., apples areweighted more than applesauce or pears in that lineitem of the Block questionnaire) in order to obtainnutrient estimates. These relative weights may nottranslate appropriately to other population groups. Inaddition, typical portion sizes differ for major foodcontributors to intake.
We used the Hutchinson Cancer Research Center(HCRC) adaptation of the NCI/Block food frequencyform as a base for further adaptation. The HCRCversion of the Block is written in SAS (10), is linkedwith the Minnesota Nutrient Data System (NDS) (11),and allows complete flexibility in adaptation (12, 13).Following the methodology originally used by Block(1986) with NHANES II data, we analyzed 24-hourrecall data from the Puerto Rican subset (aged 19-74years) of the Hispanic Health and Nutrition Examina-tion Survey (HHANES) (14) to define foods that weremajor contributors to intake for the following nutri-ents: energy, fat, saturated fat, carbohydrate, protein,cholesterol, vitamins (A, C, E, thiamin, riboflavin,niacin, B6, B12, and folate), and minerals (calcium,magnesium, iron, and zinc). Because there are severalthousand individual food items in the HHANES data-base, with many variations of the same food type,foods were coded into food categories based on theexisting food frequency food list. Foods that could notbe accommodated into this list were assigned to addi-tional categories. Sample weights, provided within theHHANES data set, were used to adjust for nonre-sponse (14). The contribution of each food category tototal population intake of each nutrient was ranked,using the Rank procedure in SAS (10). Foods thatcontribute 0.5 percent or more to the intake of energyor any single nutrient were added to the food list, if notalready included. No foods already on the HCRC/Block questionnaire were removed.
Revision of the database
A second potential source of error may result fromassumptions on the weighting of food items in thenutrient database. Foods are grouped on the question-naire, based on similarity of food category and nutrientcontent. Each line item in the food frequency formcontains either a single food, or multiple similar foods.The nutrient data for each line item reflects a weightedaverage of this combination of foods. In the HCRCquestionnaire, these sub-foods are weighted accordingto their relative use in the general population. It islikely that relative use may differ in minority popula-tions. We therefore examined the relative frequenciesof intake of foods in the Puerto Rican adult sample ofHHANES within each food frequency line and com-
pared these with existing analysis weights. When thefrequencies of intake differed, weighting assumptionsin the nutrient database were revised to an intermedi-ate position by averaging the two percentage contri-butions to total frequency. Foods that contributed lessthan 5 percent to the frequency of consumption withinline item for either group were not included in thenutrient database. Because differences in food prepa-ration may also affect results, foods prepared withvery different recipes were considered and included inthese weights separately. If fat or other nutrient com-position differed and the food was commonly con-sumed by the Puerto Rican population, it was removedto a separate line item or an adjustment question aboutpreparation was included.
Nutrient data for the final listing of food and sub-food items were updated from the HCRC database,using the Minnesota Nutrient Data System (NDS)(11). Due to its affiliation with the HHANES dietarydata collection and processing, the NDS containsmany Hispanic foods, including those used by PuertoRicans. All of the most common foods required by ourfinal food list were available directly, or through theingredients of a recipe. If not already in the NDS,recipes for Hispanic foods were obtained from PuertoRican cookbooks and verified and/or adapted withdata from 24-hour recalls administered locally to His-panic elders.
Determination of methodology for portion sizeassessment
A third potential source of error in the estimation ofintake for a differing group, and particularly in com-paring intake across groups, is the usual portion sizereported. In the HCRC questionnaire, portion sizeoptions are given as small, medium, and large—withmedium set as the median gram weight of portion sizesin NHANES II, with 50 percent of the medium definedas small and 150 percent as large (15). We comparedportion sizes for foods recorded by 24-hour recall byPuerto Rican adults in HHANES with those inNHANES II using Mests and frequency plots in SAS.The distributions of portion size intake were usuallyskewed, and log-transformed variables were used fortwo sample Mests.
Because differences did exist, we decided to leavethe portion sizes open-ended. With the aid of three-dimensional food models (NASCO, Fort Atkinson,Wisconsin) and common household utensils, we askedsubjects to describe their usual portion size. This re-quired the development of a computer program forportion size entry which allowed the use of multiplesof differing measures, such as cups, tablespoons,slices, units, and so on. We adapted the HCRC form
Am J Epidemiol Vol. 148, No. 5, 1998
Dow
nloaded from https://academ
ic.oup.com/aje/article/148/5/507/77051 by guest on 15 February 2022
Puerto Rican Food Frequency Questionnaire 509
and program for optical scanning of intake frequencyand adjustment questions. This information was thenlinked to the food portion entry program and to ourrevised nutrient database, by building on and adaptingfrom the SAS program originally written at the HCRC.
Testing and calibration of the revised instrument
To confirm the completeness of the food list forHispanic subjects in Massachusetts, and to perform aninitial calibration of the questionnaire, we collected24-hour dietary recalls from 90 Hispanic men andwomen (50 percent Puerto Rican, 39 percent Domin-ican, and 11 percent other Hispanics (Cuban, Central,and South American)) aged 52-91 years, who wereparticipants in senior day care programs in Boston andLawrence, Massachusetts. Additional recalls were col-lected from 35 non-Hispanic white elders aged 60-88years, who lived in the same communities as theHispanic elders. We then coded the data from theserecalls into both the original HCRC/Block food fre-quency form and the newly developed form. In addi-tion, we analyzed the data coded into the new formwith both open-ended portion sizes and with standardportion sizes. The latter were set as small, medium, orlarge, using the original portions in the HCRC pro-gram. For foods not previously on the questionnaire,we based portion sizes on data from HHANES. Wherethe median portion size from HHANES differedgreatly from that in NHANES II, a new portion wasassigned as the average of the HCRC medium portionand the median portion in the HHANES data. Nutrientdata for analysis of all versions of the food frequencyform, as well as for the 24-hour recall analysis werefrom the same NDS nutrient database, version 25,1995 (11).
Intakes of energy and key nutrients, estimated by24-hour recall, were compared with those obtainedfrom each of the three food frequency methods—theoriginal HCRC questionnaire, the revised question-naire with fixed portion sizes, and the revised ques-tionnaire with open-ended portion sizes—using pairedMests in SAS (10). Where the distribution of thedifferences across methods differed significantly fromnormality, significance levels were assessed using theSign test in SAS (10). In addition to comparing themean intakes obtained with differing versions ofthe questionnaire with the 24-hour recall, we com-pared the means across ethnic groups (Hispanic vs.non-Hispanic white) within questionnaire type foreach of the nutrients (log-transformed due to skeweddistributions), using the General Linear Models(GLM) procedure in SAS (10) with adjustment for ageand sex. These analyses were also repeated with ad-ditional adjustment for total energy intake. Finally,
estimates of energy intake from each of the threequestionnaires were regressed on the 24-hour recallestimates to examine correspondence across the dis-tribution.
To test validity of rankings, both Pearson and intra-class correlations were examined across distributionsof log-transformed nutrient variables obtained fromthe 24-hour recall, and from each of the food fre-quency forms, using SAS (10). Initial results fromthese analyses were examined for content validity, andled to review of assumptions and programs for correc-tion of errors in the database and programs. Thisprocess did not lead to changes in the food list, but didaffect some of the recipes and weights for foods withinline items of the questionnaire. For example, we orig-inally used cookbook recipes for dishes such aschicken with rice, but found that the actual recipes thatwere used were much simpler. In addition, we foundthat the weight of a slice of fried plantain in actual use(average 30 g) differed from that listed in the Minne-sota database (74.5 g), and adjusted that accordingly.The changes that were made are not likely to bespecific to the elder population, and we believe thatthe questionnaire should be valid for younger PuertoRican adults as well. However, this should be testedwith a younger population.
RESULTS
Questionnaire development
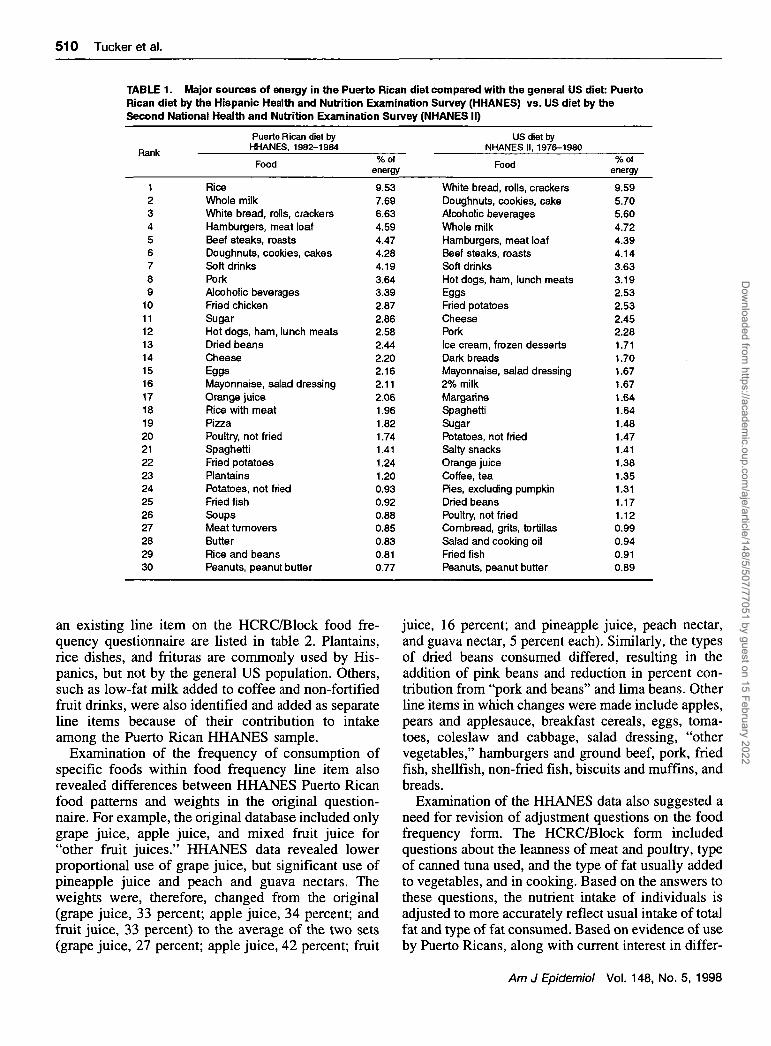
Examination of the HHANES Puerto Rican adultdata (with a sample of approximately 1,300 subjects)revealed several differences in dietary pattern whencompared with the overall US adult diet pattern. Table1 presents the results of the ranking of foods for thePuerto Rican population after grouping individualfoods into food groups similar to those constructed byBlock et al. (16) for NHANES II. The number oneranking food contributor for Puerto Rican adults livingin the New York-New Jersey area was rice, whichdoes not appear in the top 30 food contributors for theaverage US population. Other items which were moreimportant to the Puerto Rican diet, but not used by thegeneral population, include rice dishes, meat turnovers("empanadas" and other "frituras"), and plantains.Compared with the general population, Puerto Ricansalso appeared to consume considerably more friedchicken, dried beans, and pizza, but less fried potatoes,chips and snacks, pies, and corn-based products.
The process completed in table 1 was repeated formacronutrient components, vitamins, and minerals.Foods which contributed at least 0.5 percent to intakeof any nutrient among Puerto Rican adults in theHHANES, and which could not be clearly coded into
Am J Epidemiol Vol. 148, No. 5, 1998
Dow
nloaded from https://academ
ic.oup.com/aje/article/148/5/507/77051 by guest on 15 February 2022
510 Tucker et al.
TABLE 1. Major sources of energy in the Puerto Rican diet compared with the general US diet: PuertoRican diet by the Hispanic Health and Nutrition Examination Survey (HHANES) vs. US diet by theSecond National Health and Nutrition Examination Survey (NHANESII)
Rank
123456789
101112131415161718192021222324252627282930
Puerto Rican diet byHHANES, 1982-1984
Food
RiceWhole milkWhite bread, rolls, crackersHamburgers, meat loafBeef steaks, roastsDoughnuts, cookies, cakesSoft drinksPorkAlcoholic beveragesFried chickenSugarHot dogs, ham, lunch meatsDried beansCheeseEggsMayonnaise, salad dressingOrange juiceRice with meatPizzaPoultry, not friedSpaghettiFried potatoesPlantainsPotatoes, not friedFried fishSoupsMeat turnoversButterRice and beansPeanuts, peanut butter
%ol
energy9.537.696.634.594.474.284.193.643.392.872.862.582.442.202.162.112.061.961.821.741.411.241.200.930.920.880.850.830.810.77
US diet byNHANES II, 1976-1980
Food
White bread, rolls, crackersDoughnuts, cookies, cakeAlcoholic beveragesWhole milkHamburgers, meat loafBeef steaks, roastsSoft drinksHot dogs, ham, lunch meatsEggsFried potatoesCheesePorkIce cream, frozen dessertsDark breadsMayonnaise, salad dressing2% milkMargarineSpaghettiSugarPotatoes, not friedSalty snacksOrange juiceCoffee, teaPies, excluding pumpkinDried beansPoultry, not friedCombread, grits, tortillasSalad and cooking oilFried fishPeanuts, peanut butter
%Of
energy9.595.705.604.724.394.143.633.192.532.532.452.281.711.701.671.671.641.641.481.471.411.381.351.311.171.120.990.940.910.89
an existing line item on the HCRC/Block food fre-quency questionnaire are listed in table 2. Plantains,rice dishes, and frituras are commonly used by His-panics, but not by the general US population. Others,such as low-fat milk added to coffee and non-fortifiedfruit drinks, were also identified and added as separateline items because of their contribution to intakeamong the Puerto Rican HHANES sample.
Examination of the frequency of consumption ofspecific foods within food frequency line item alsorevealed differences between HHANES Puerto Ricanfood patterns and weights in the original question-naire. For example, the original database included onlygrape juice, apple juice, and mixed fruit juice for"other fruit juices." HHANES data revealed lowerproportional use of grape juice, but significant use ofpineapple juice and peach and guava nectars. Theweights were, therefore, changed from the original(grape juice, 33 percent; apple juice, 34 percent; andfruit juice, 33 percent) to the average of the two sets(grape juice, 27 percent; apple juice, 42 percent; fruit
juice, 16 percent; and pineapple juice, peach nectar,and guava nectar, 5 percent each). Similarly, the typesof dried beans consumed differed, resulting in theaddition of pink beans and reduction in percent con-tribution from "pork and beans" and lima beans. Otherline items in which changes were made include apples,pears and applesauce, breakfast cereals, eggs, toma-toes, coleslaw and cabbage, salad dressing, "othervegetables," hamburgers and ground beef, pork, friedfish, shellfish, non-fried fish, biscuits and muffins, andbreads.
Examination of the HHANES data also suggested aneed for revision of adjustment questions on the foodfrequency form. The HCRC/Block form includedquestions about the leanness of meat and poultry, typeof canned tuna used, and the type of fat usually addedto vegetables, and in cooking. Based on the answers tothese questions, the nutrient intake of individuals isadjusted to more accurately reflect usual intake of totalfat and type of fat consumed. Based on evidence of useby Puerto Ricans, along with current interest in differ-
Am J Epidemiol Vol. 148, No. 5, 1998
Dow
nloaded from https://academ
ic.oup.com/aje/article/148/5/507/77051 by guest on 15 February 2022

Puerto Rican Food Frequency Questionnaire 511
TABLE 2. Foods added to the Hutchinson Cancer ResearchCenter/Block food frequency questionnaire for assessment ofPuerto Rican diets
Food category and food name
Fruits and vegetablesMangoesAvocado, rawWinter squash (including butternut, hubbard)Other starchy roots/fruits (tannier, cassava, breadfruit)Green plantains, boiled or bakedGreen plantains, friedRipe plantains, boiled or bakedRipe plantains, fried
Mixed dishesRice with meatRice with chickenRice with pigeon peasRice with beansHomemade soups with meat/chickenMeat turnovers, fritters, egg rolls
BeveragesFortified fruit drinks (as separate line item)Non-fortified fruit drinksWhole milk in coffee or tea2% milk in coffee or teaSkim or 1% milk in coffee or tea
DessertsCustard, pudding, cheesecake
entiating mono- and polyunsaturated oils, we sepa-rated vegetable oil into olive oil and "other vegetableoil." We also noted that Puerto Rican recipes usuallyinclude the addition of corn oil to rice and to beans,which, given the large amount of these items con-sumed, could affect fat intake estimates. We thereforeadded questions about whether fat or oil was usedwhen cooking these items, and the type of fat or oil.
Portion size comparisons
A Mest comparison of log-transformed portion sizesfor 93 line items in the food frequency questionnairefor which there were data in both HHANES andNHANES II showed significant differences (p <0.05) across the two surveys for 55 items. Food items/groups for which the significance level was <0.01 andwith a frequency of use sample size of at least 100per group are presented in table 3. These data suggestthat Puerto Ricans tend to consume larger portions ofsome fruits, including banana and fruit juices, andsmaller portions of some vegetables, such as lettuceand tomato than the general population. They consumesignificantly larger portions of rice, beans, beef, pork,chicken, bread, and sweet baked goods, but smaller cupsof coffee and tea and glasses of milk. In some cases, the
TABLE 3. Portion sizes: Hispanic Health and Nutrition Examination Survey (HHANES) Puerto Ricansvs. Second National Health and Nutrition Examination Survey (NHANES II) US adults*
n vvii I leu I TO
BananaCitrus juicesOther fruit juicesTomatoesGreen saladSalad dressingRiceBeansEggsHamburgerBeefPorkFried chickenOther chickenSoupsDark breadCake, cookiesWhole milkLow-fat milkCoffeeTeaSugar
HHANES Puerto Ricanadults, 1982-1984
Mean (g) ± SEt
121 ±4.7254 ± 9.2222 ± 10.1
66 ± 2.744 ±2.016 ± 0.8
231 ± 5.7129 ±4.0
80.5 ± 1.8251 ± 17.4145 ± 7.3131 ±7.4101 ±4.098 ± 5.0
406 ± 20.642 ±1.568 ±3.7
160 ± 3.3108 ± 10.2170 ± 4.2252 ± 12.111.9 ± 0.3
Median
114256209
603710
20611792
206113988877
36052519347
140186
9.0
NHANES II US adults,1976-1980
Mean (g) ± SE
94 ± 1.4212 ± 2.3169 ± 5.394 ± 1.455 ± 0.813 ± 0.2
128 ± 2.8102 ± 2.2
78.2 ± 0.7160 ± 3.7120 ±1.792 ±2.063 ± 1.882 ± 1.4
305 ± 4.938 ±0.452 ± 0.6
185 ± 2.2193 ± 3.5363 ± 3.7312 ± 4.29.7 ± 0.2
Median
1021551557548
91268064
15784675166.
2983842
150165280280
7.5
* Items selected for inclusion based on sample sizes >100 in each group and significant f-tests, using log-transformed variables: p < 0.01. Means and medians are presented in their original scale,
t SE, standard error.
Am J Epidemiol Vol. 148, No. 5, 1998
Dow
nloaded from https://academ
ic.oup.com/aje/article/148/5/507/77051 by guest on 15 February 2022
512 Tucker et al.
apparent difference in portion size may be due to differ-ing coding assumptions used in NHANES II versusHHANES. For example, the median and mode portionsize for banana in NHANES II is 102 g, while inHHANES it is 114 g, which is also the amount in theUSDA Composition of Foods Handbook No. 8 (17).Because this is the assumed weight for one banana, themost common portion size, the Mest is significantlydifferent due to this assumption, not to differing actualpractice. Differences in most items, however, are proba-bly due to differences in food patterns across thesegroups.
We plotted the distribution of portion sizes for theHHANES and NHANES II data (not shown). Theseconfirmed differing patterns of portion size in severalfoods. Examples of two key foods were rice andchicken soup. For rice, the distribution of intake wasclearly shifted upward for Puerto Ricans in HHANEScompared with the general population in NHANES II,with modal points (in order of descending height) atapproximately 500, 300, and 700 g (Puerto Ricans)compared with 200 and 400 g (non-Hispanic whites).Similarly, portion sizes for chicken soup were clearlygreater and more varied among the Puerto Ricans(modal points at 120, 250, 190, 300, and 410 g),reflecting their use of this item as more of a main mealthan the more typical side cup of soup in the generalUS meal pattern (150 and 80 g). Use of standard
portion sizes would, therefore, systematically under-estimate both intake for the Hispanic group and truedifferences in intake across groups.
Questionnaire comparisons of mean estimation
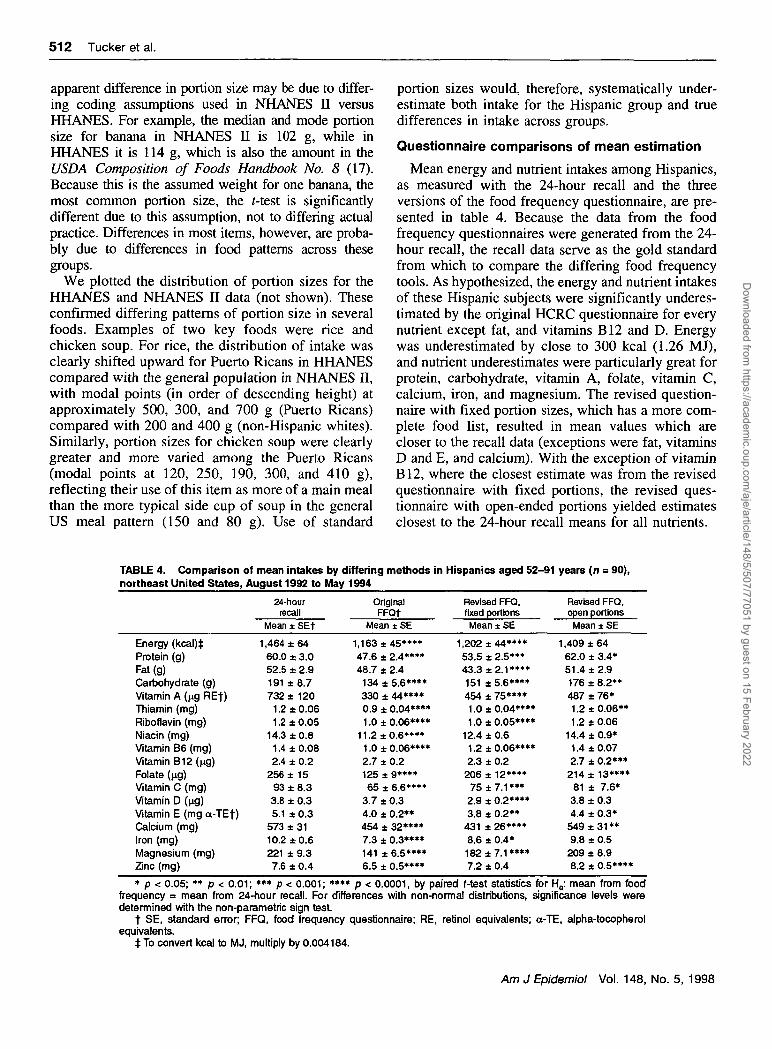
Mean energy and nutrient intakes among Hispanics,as measured with the 24-hour recall and the threeversions of the food frequency questionnaire, are pre-sented in table 4. Because the data from the foodfrequency questionnaires were generated from the 24-hour recall, the recall data serve as the gold standardfrom which to compare the differing food frequencytools. As hypothesized, the energy and nutrient intakesof these Hispanic subjects were significantly underes-timated by the original HCRC questionnaire for everynutrient except fat, and vitamins B12 and D. Energywas underestimated by close to 300 kcal (1.26 MJ),and nutrient underestimates were particularly great forprotein, carbohydrate, vitamin A, folate, vitamin C,calcium, iron, and magnesium. The revised question-naire with fixed portion sizes, which has a more com-plete food list, resulted in mean values which arecloser to the recall data (exceptions were fat, vitaminsD and E, and calcium). With the exception of vitaminB12, where the closest estimate was from the revisedquestionnaire with fixed portions, the revised ques-tionnaire with open-ended portions yielded estimatesclosest to the 24-hour recall means for all nutrients.
TABLE 4. Comparison of mean intakes by differing methods in Hispanics aged 52-91 years (n = 90),northeast United States, August 1992 to May 1994
Energy (kcal)$Protein (g)Fat (g)Carbohydrate (g)vitamin A (ng REt)Thiamin (mg)Riboflavin (mg)Niacin (mg)Vitamin B6 (mg)vitamin B12 (ng)Folate (jxg)Vitamin C (mg)Vitamin D (ng)Vitamin E (mg a-TEf)Calcium (mg)Iron (mg)Magnesium (mg)Zinc (mg)
24-hourrecall
Mean ± SEt
1,464 ± 6 460.0 ± 3.052.5 ± 2.9191 ± 8.7732± 120
1.2 ±0.061.2 ±0.05
14.3 ±0 .81.4 ±0 .082.4 ± 0.2
256 ± 1593 ± 8.3
3.8 ± 0.35.1 ±0.3
573 ± 3110.2 ±0.6221 ± 9.37.6 ± 0.4
OriginalFFQt
Mean ± SE
1,163 ± 4 5 * * * *47.6 ± 2.4****48.7 ± 2.4
134 ± 5.6****330 ± 44****0.9 ± 0.04****1.0 ± 0.06****
11.2 ± 0.6****1.0 ±0.06****2.7 ± 0.2125 ± 9** * *65 ± 6.6****
3.7 ±0.34.0 ± 0.2**454 ± 32** * *7.3 ± 0.3****141 ± 6.5****6.5 ± 0.5****
Revised FFQ,fixed portionsMean ± SE
1,202 ± 4 4 * * * *53.5 ± 2.5***43.3 ± 2 . 1 * * * *151 ± 5.6****454 ± 75*** *1.0 ±0.04****1.0 ±0 .05****
12.4 ±0.61.2 ±0.06****2.3 ± 0.2
206 ± 1 2 * * * *75 ± 7 . 1 * * *
2.9 ± 0.2****3.8 ± 0.2**
431 ± 26****8.6 ± 0.4*182 ± 7 . 1 * * * *7.2 ± 0.4
Revised FFQ,open portions
Mean ± SE
1,409 ± 6 462.0 ± 3.4*51.4 ± 2.9176 ± 8.2**487 ± 76*1.2 ±0 .06* *1.2 ±0.06
14.4 ±0 .9 *1.4 ±0.072.7 ± 0.2***
214 ± 13****81 ± 7.6*
3.8 ± 0.34.4 ± 0.3*
549 ± 31 * *9.8 ± 0.5
209 ± 8.98.2 ± 0.5****
* p < 0.05; ** p < 0.01; *** p < 0.001; *•** p < 0.0001, by paired f-test statistics for Ho: mean from foodfrequency = mean from 24-hour recall. For differences with non-normal distributions, significance levels weredetermined with the non-parametric sign test.
t SE, standard error; FFQ, food frequency questionnaire; RE, retinol equivalents; a-TE, alpha-tocopherolequivalents.
i To convert kcal to MJ, multiply by 0.004184.
Am J Epidemiol Vol. 148, No. 5, 1998
Dow
nloaded from https://academ
ic.oup.com/aje/article/148/5/507/77051 by guest on 15 February 2022

Puerto Rican Food Frequency Questionnaire 513
Because modifications in the questionnaire werebased mostly on Puerto Rican data, there was concernthat some validity may have been lost for use withnon-Hispanic whites. Table 5 presents the comparisonof the 24-hour recall data for the non-Hispanic whitecomparison group with the three versions of the foodfrequency. Although the original HCRC questionnaireoverestimated intake of some nutrients and underesti-mated intake of others for this group as well, thedifferences are smaller and less significant than thoseseen with the Hispanics. The difference in estimatedaverage energy intake was 32 kcal (0.13 MJ) fornon-Hispanic whites, compared with approximately300 kcal (1.26 MJ) for Hispanics. In relation to the24-hour recall estimates, the revised questionnairewith fixed portion sizes underestimated energy intake,carbohydrate, and vitamin A, more than the originalquestionnaire for non-Hispanic whites, but yieldedcloser estimates for fat and vitamin D. The revisedquestionnaire with open portions measured most nu-trients more accurately for non-Hispanic whites thandid the original or revised with fixed portions versionsof the questionnaire. The original questionnaire re-mained most accurate for protein and zinc. In contrastto concerns that the revisions may lessen accuracy forthe non-Hispanic whites, the new instrument appearsto perform at least as well and, for some nutrients,better than the original when open-ended portion sizesare used. In comparison with the 24-hour recalls, the
mean energy intake from the revised questionnairewith open-ended portions differs by only 11 kcal(0.05 MJ).
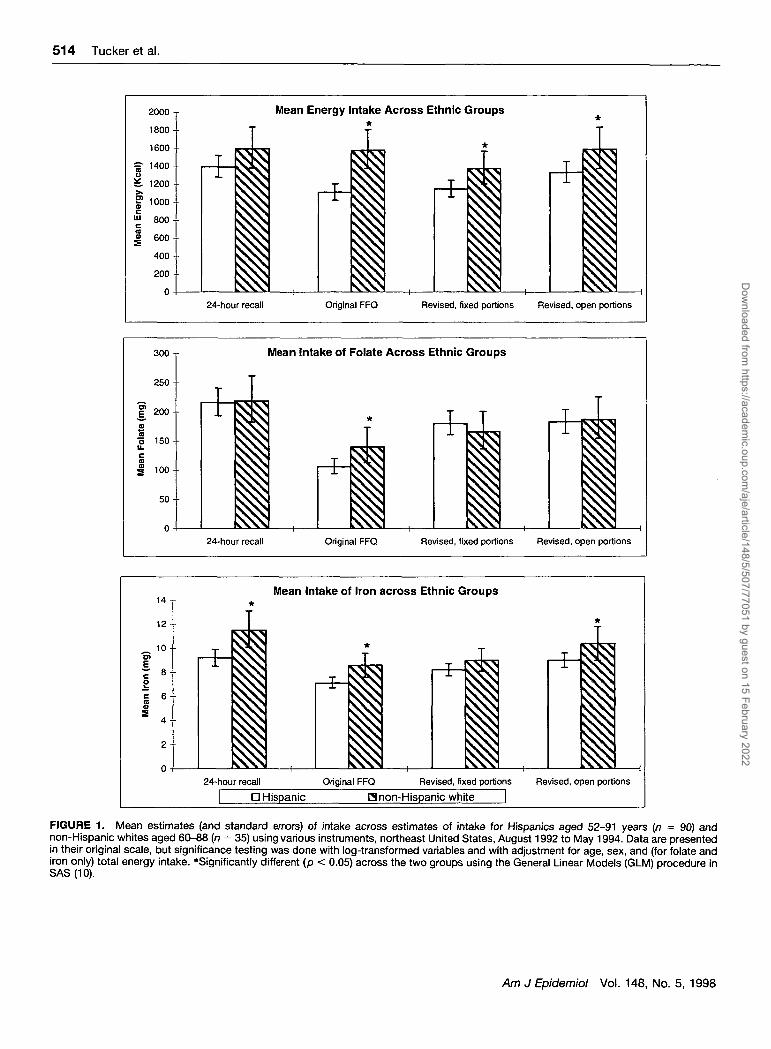
Figure 1 illustrates, as examples, the differences inmean estimation for energy, folate, and iron, bothacross methods and across the two ethnic groups. Ashypothesized, the actual small difference in energyintake between the Hispanic and non-Hispanic whitesamples was greatly exaggerated. A comparison ofmeans across tables shows that an average differenceof 200 kcal (0.84 MJ) across groups as measured bythe 24-hour recall, would be exaggerated with theoriginal questionnaire to a 470 kcal (1.97 MJ) differ-ence if the original food frequency form was used.With the revised questionnaire with open-ended por-tions, the difference is 256 kcal (1.07 MJ). Compari-son of nutrient intakes across ethnic groups with theoriginal questionnaire revealed significant differencesin all of the 18 nutrients measured, although only eightof the nutrients (vitamin A, thiamin, riboflavin, niacin,vitamin B12, iron, magnesium, and zinc) were signif-icantly different with the 24-hour recall. Use of therevised, open-ended questionnaire identified differ-ences in these eight nutrients, but also showed differ-ences in energy, protein, and calcium not seen with therecalls. When analyses were adjusted for energy in-take, vitamin A, riboflavin, niacin, vitamin B12, iron,and zinc intakes differed significantly across ethnicgroups by 24-hour recall. With the exception of mag-
TABLE 5. Comparison of mean intakes by differing methods in non-Hispanic whites aged 60-88 years(n = 35), northeast United States, August 1992 to May 1994
Energy (kcal)$Protein (g)Fat (g)Carbohydrate (g)Vitamin A (ng REf)Thiamin (mg)Riboflavin (mg)Niacin (mg)Vitamin B6 (mg)vitamin B12 (ng)Folate (ng)Vitamin C (mg)Vitamin D (ng)Vitamin E (mg a-TEf)Calcium (mg)Iron (mg)Magnesium (mg)Zinc (mg)
24-hourrecall
Mean ± SEt
1,527 ± 9 561.4 ±4.454.3 ± 5.7201 ± 11.3
1,188 ±2311.4 ±0.081.7 ±0.12
17.0 ± 1.31.5 ±0.13.9 ± 0.6
272 ±29112± 184.6 ± 0.54.6 ± 0.5
684 ±5913.5 ± 1.6261 ±228.5 ± 0.7
OriginalFFQt
Mean ± SE
1,559 ± 9 560.3 ± 3.967.2 ± 5.6**180 ± 10.8*959 ± 2501.2 ±0.08*1.7 ±0.16
16.1 ± 1.11.4 ±0.16.3 ± 1.5**
221 ± 23*83±115.6 ± 0.7*4.7 ± 0.4
647 ±6012.2 ± 1.1235 ± 188.5 ± 0.7
Revised FFQ,fixed portionsMean ± SE
1,364 ± 8 3 *57.2 ± 3.551.0 ±4.7171 ± 11.0***919 ± 2 7 0 * *1.2 ±0.07*1.5 ±0.14
15.1 ±0.91.3 ±0.15.0 ± 1.5
232 ± 26*98 ± 18
4.1 ±0.74.2 ± 0.4
590 ± 64*10.7 ±0.8238 ± 148.2 ± 0.6
Revised FFQ,open portionsMean ± SE
1,538 ± 10065.5 ± 4.557.1 ± 5.3191 ± 12.6
1,052 ±2871.4 ±0.091.8 ±0.16
17.3 ± 1.21.6 ±0.15.8 ±1.5*
247 ± 2489 ±115.2 ± 0.74.7 ± 0.4
705 ± 6912.7 ± 1.2278 ± 209.4 ± 0.8*
* p < 0.05; ** p < 0.01; *** p < 0.001; **** p < 0.0001, by paired f-test statistics for Ho: mean from foodfrequency = mean from 24-hour recall. For differences with non-normal distributions, significance levels weredetermined with the non-parametric sign test.
t SE, standard error; FFQ, food frequency questionnaire; RE, retinol equivalents; a-TE, alpha-tocopherolequivalents.
$To convert kcal to MJ, multiply by 0.004184.
Am J Epidemiol Vol. 148, No. 5, 1998
Dow
nloaded from https://academ
ic.oup.com/aje/article/148/5/507/77051 by guest on 15 February 2022
514 Tucker et al.
300
250
f 200
mo 150u.
100
50
0
14 y
1 2 - •
„ 10-o>
t 8o
i 6
2 4 -
2
Mean Energy Intake Across Ethnic Groups*
I24-hour recall Original FFQ Revised, fixed portions Revised, open portions
Mean Intake of Folate Across Ethnic Groups
I I• i24-hour recall Original FFQ Revised, fixed portions Revised, open portions
Mean Intake of Iron across Ethnic Groups
iii i I• * •
i24-hour recall Original FFQ Revised, fixed portions Revised, open portions
D Hispanic H non-Hispanic white
FIGURE 1. Mean estimates (and standard errors) of intake across estimates of intake for Hispanics aged 52-91 years (n = 90) andnon-Hispanic whites aged 60-88 {n = 35) using various instruments, northeast United States, August 1992 to May 1994. Data are presentedin their original scale, but significance testing was done with log-transformed variables and with adjustment for age, sex, and (for folate andiron only) total energy intake. *Significantly different (p < 0.05) across the two groups using the General Linear Models (GLM) procedure inSAS(10).
Am J Epidemiol Vol. 148, No. 5, 1998
Dow
nloaded from https://academ
ic.oup.com/aje/article/148/5/507/77051 by guest on 15 February 2022
Puerto Rican Food Frequency Questionnaire 515
nesium rather than zinc, this same set of nutrientsdiffered significantly using the revised, open-endedquestionnaire.
Questionnaire comparisons of ranking
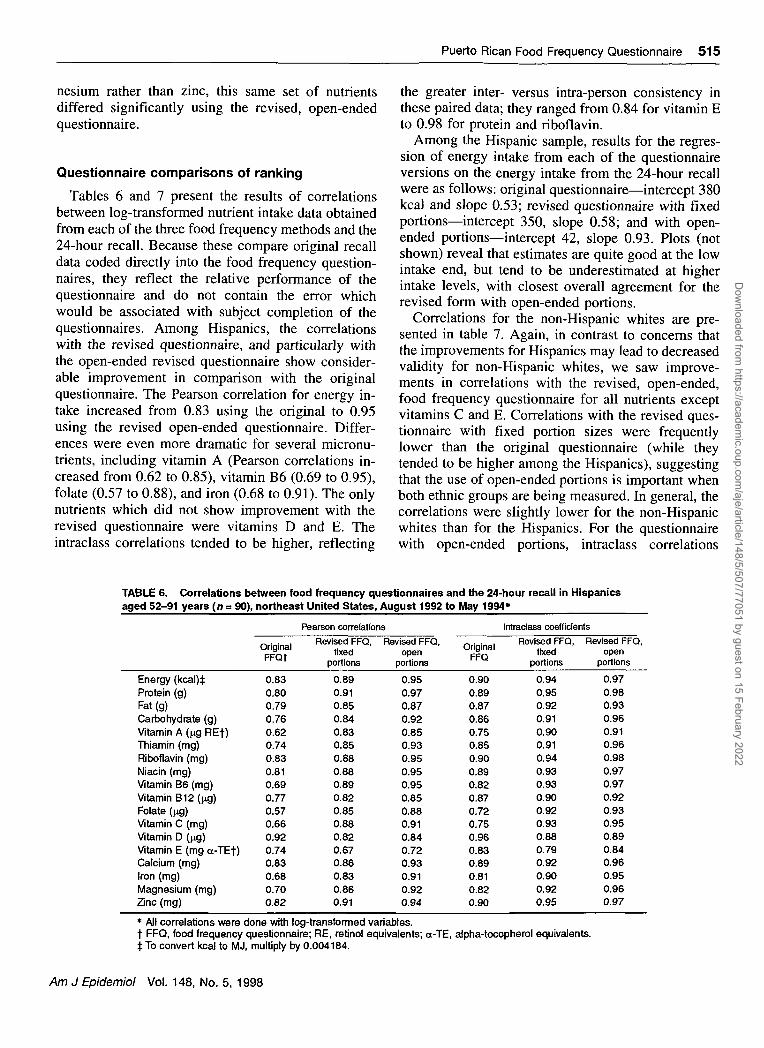
Tables 6 and 7 present the results of correlationsbetween log-transformed nutrient intake data obtainedfrom each of the three food frequency methods and the24-hour recall. Because these compare original recalldata coded directly into the food frequency question-naires, they reflect the relative performance of thequestionnaire and do not contain the error whichwould be associated with subject completion of thequestionnaires. Among Hispanics, the correlationswith the revised questionnaire, and particularly withthe open-ended revised questionnaire show consider-able improvement in comparison with the originalquestionnaire. The Pearson correlation for energy in-take increased from 0.83 using the original to 0.95using the revised open-ended questionnaire. Differ-ences were even more dramatic for several micronu-trients, including vitamin A (Pearson correlations in-creased from 0.62 to 0.85), vitamin B6 (0.69 to 0.95),folate (0.57 to 0.88), and iron (0.68 to 0.91). The onlynutrients which did not show improvement with therevised questionnaire were vitamins D and E. Theintraclass correlations tended to be higher, reflecting
the greater inter- versus intra-person consistency inthese paired data; they ranged from 0.84 for vitamin Eto 0.98 for protein and riboflavin.
Among the Hispanic sample, results for the regres-sion of energy intake from each of the questionnaireversions on the energy intake from the 24-hour recallwere as follows: original questionnaire—intercept 380kcal and slope 0.53; revised questionnaire with fixedportions—intercept 350, slope 0.58; and with open-ended portions—intercept 42, slope 0.93. Plots (notshown) reveal that estimates are quite good at the lowintake end, but tend to be underestimated at higherintake levels, with closest overall agreement for therevised form with open-ended portions.
Correlations for the non-Hispanic whites are pre-sented in table 7. Again, in contrast to concerns thatthe improvements for Hispanics may lead to decreasedvalidity for non-Hispanic whites, we saw improve-ments in correlations with the revised, open-ended,food frequency questionnaire for all nutrients exceptvitamins C and E. Correlations with the revised ques-tionnaire with fixed portion sizes were frequentlylower than the original questionnaire (while theytended to be higher among the Hispanics), suggestingthat the use of open-ended portions is important whenboth ethnic groups are being measured. In general, thecorrelations were slightly lower for the non-Hispanicwhites than for the Hispanics. For the questionnairewith open-ended portions, intraclass correlations
TABLE 6. Correlations between food frequency questionnaires and the 24-hour recall in Hispanicsaged 52-91 years (n = 90), northeast United States, August 1992 to May 1994*
Energy (kcal)tProtein (g)Fat (g)Carbohydrate (g)vitamin A (ng REf)Thiamin (mg)Riboflavin (mg)Niacin (mg)vitamin B6 (mg)Vitamin B12 (fig)Folate (ng)vitamin C (mg)vitamin D (ng)Vitamin E (mg ot-TEt)Calcium (mg)Iron (mg)Magnesium (mg)Zinc (mg)
OriginalFFQt
0.830.800.790.760.620.740.830.810.690.770.570.660.920.740.830.680.700.82
Pearson correlationsRevised FFQ,
fixedportions
0.890.910.850.840.830.850.880.880.890.820.850.880.820.670.860.830.860.91
Revised FFQ,open
portions
0.950.970.870.920.850.930.950.950.950.850.880.910.840.720.930.910.920.94
OriginalFFQ
0.900.890.870.860.750.850.900.890.820.870.720.750.960.830.890.810.820.90
Intraclass coefficientsRevised FFQ,
fixedportions
0.940.950.920.910.900.910.940.930.930.900.920.930.880.790.920.900.920.95
Revised FFQ,open
portions
0.970.980.930.960.910.960.980.970.970.920.930.950.890.840.960.950.960.97
* All correlations were done with log-transformed variables.t FFQ, food frequency questionnaire; RE, retinol equivalents; a-TE, alpha-tocopherol equivalents.j To convert kcal to MJ, multiply by 0.004184.
Am J Epidemiol Vol. 148, No. 5, 1998
Dow
nloaded from https://academ
ic.oup.com/aje/article/148/5/507/77051 by guest on 15 February 2022

516 Tucker et al.
TABLE 7. Correlations between food frequency questionnaires and the 24-hour recall in non-Hispanicwhites aged 60-88 years (n = 35), northeast United States, August 1992 to May 1994
Energy (kcal)tProtein (g)Fat (g)Carbohydrate (g)Vitamin A (^g REf)Thiamin (mg)Riboflavin (mg)Niacin (mg)Vitamin B6 (mg)Vitamin B12 (ng)Folate (ng)Vitamin C (mg)Vitamin D (pg)Vitamin E (mg a-Ef)Calcium (mg)Iron (mg)Magnesium (mg)Zinc (mg)
OriginalFFQt
0.800.770.810.840.670.700.700.590.700.640.770.760.650.850.750.650.820.75
Pearson correlations
Revised FFQ,fixed
portions
0.790.720.750.850.750.560.720.490.660.820.730.630.700.650.810.560.770.74
Revised FFQ,open
portions
0.920.910.840.920.770.700.860.710.780.910.840.720.760.700.830.660.880.88
OriginalFFQ
0.880.870.860.910.810.820.820.740.830.780.870.860.780.900.860.790.900.85
Intraclass coefficients
Revised FFQ,fixed
portions
0.880.840.840.910.850.720.830.650.790.890.830.770.800.770.890.710.870.85
Revised FFQ,open
portions
0.960.950.900.960.860.820.920.830.870.950.910.840.840.820.900.800.940.93
* All correlations were done with log-transformed variables.t FFQ, food frequency questionnaire; RE, retinol equivalents; a-TE, alpha-tocopherol equivalents.t To convert kcal to MJ, multiply by 0.004184.
ranged from 0.80 for iron to 0.96 for energy andcarbohydrate among non-Hispanic whites.
Regressions of the food frequency estimates on therecall estimates of energy intake for the non-Hispanicwhites resulted in the following: original question-naire—intercept 430 kcal and slope 0.74; revisedquestionnaire with fixed portions—intercept 419,slope 0.62; and revised open-ended questionnaire—intercept 108, slope 0.94. As with the Hispanics, plots(not shown) reveal underestimation of intake at thehigh intake range with closest agreement for the re-vised form with open-ended portions.
DISCUSSION
Examination of the dietary patterns of Puerto Ricanadults reveals several differences from the general USpopulation. They consume some foods which are notwidely consumed by others, and consume many foodsin differing patterns of frequency and portion size.These differences in dietary pattern invalidate the useof existing food frequency instruments with thisgroup. In order to obtain valid data on nutrient intakefrom a food frequency instrument, substantial modifi-cation was necessary, including the addition of foodsto the food list, adaptation of the nutrient database,weighting of individual contributors to line items, anda reassessment of portion sizes.
Because of significant differences in portion size formany food items, and because of irregular and wide
distributions of portion size, the instrument was testedusing both open-ended as well as fixed portion sizes.Results demonstrate significant gains in both meanestimation and correlational ranking with open-endedportions, compared with the fixed portion method.This finding differs from other reports of fixed versusopen portion sizes. Willett (18) has argued that theadded benefit of portion size on ranking of subjectsand correlation coefficients or regression coefficientsdoes not justify the expense of collecting the data. Hecites several studies (8, 19-21), which saw incrementsin correlations with diet records of only 0.05 or less.Samet et al. (22) found strong correlations betweeninstruments using fixed vs. open portions for vitaminA assessment and also concluded that standard portionsizes were appropriate for their population. However,as Willett (18) notes, this may not be true whendiffering portion sizes are culturally based. In theusual Puerto Rican diet, for example, rice—the majorsource of energy—is often consumed in very largeamounts at one meal, and may routinely exceed the"large" serving size, estimated in the HCRC question-naire, as 1.125 cups. As rice may be consumed severaltimes per day, any comparison of intakes across thesetwo groups would appear to show that the PuertoRicans were consuming significantly less energy andassociated nutrients than they actually were.
Our results support the use of open-ended portionsizes with this population. Substantial improvements
Am J Epidemiol Vol. 148, No. 5, 1998
Dow
nloaded from https://academ
ic.oup.com/aje/article/148/5/507/77051 by guest on 15 February 2022
Puerto Rican Food Frequency Questionnaire 517
in mean estimates and in correlations with the 24-hourrecall data source were seen for most nutrients. Withfurther testing of this revised questionnaire, it may bepossible to determine a wider range of standardizedportions which would allow more automation, or tolimit the open-ended portions to those key foods, suchas rice, soups, juices, and milk, for which there arelarge variations which affect results.
Because the data coded into the questionnaires camedirectly from the 24-hour recall with which it is beingcompared, this study tests only the relative validity ofthe final questionnaire. It does not include differenceswhich may be seen with actual implementation of thequestionnaire or with comparison of the questionnairewith multiple diet records in this group of Hispanics.However, our results for both the Hispanic and non-Hispanic white groups suggest that it should, at min-imum, perform significantly better than existing ques-tionnaires. The completion of usual portion size maybe a more complex task, and certainly demands morefrom respondents. Hunter et al. (23) observed highintra-individual variation in actual portion size andconcluded that individuals may, therefore, have diffi-culty in specifying usual portion size. To the extentthat this is true, the gains from collecting data onportion size will be diminished. Because of high re-spondent demands, it is likely that interviewer admin-istration will be required in order to obtain valid andcomplete portion size data. The target population forwhich this questionnaire was developed, Hispanic el-ders, contain large proportions with low educationlevels, making interviewer administration of the ques-tionnaire necessary.
Results from cross-group comparisons demonstratethat caution should be taken whenever food frequencydata are used to determine group differences in nutri-ent intake. The 24-hour recall has been validated forestimating mean intakes and comparing across groups(24). We found that use of the original questionnairewould suggest false differences for most of the nutri-ents. With the use of the revised, open-ended ques-tionnaire with energy adjustment, results of cross-group comparisons were the same as those seen withthe 24-hour recall for all but a few nutrients.
In summary, a systematic approach to the adaptationof a widely used food frequency instrument has led tothe development of a questionnaire with increasedvalidity for the specific population it is targeting with-out loss of validity for the comparison population.This required changes in the food list, food itemweights within the database, adjustments in or use ofopen-ended portion sizes and the addition of fat ad-justment questions and options. The large relativegains in validity clearly show that the use of general
instruments for minority populations with differingdiets may lead not only to error, but quite possibly tobiased results, reinforcing the need for new validitystudies with use in each new population.
ACKNOWLEDGMENTS
This project has been funded by the National Institute onAging under grant no. R01 AG10425 and, in part, by the USDepartment of Agriculture, Agricultural Research Serviceunder contract no. 53-3K06-01.
The authors acknowledge the programming contributionsof Alex Pedan for the analysis of HANES data; ThomasSchaetzel and Peter Zhu for the adaptation of the Hutchin-son Cancer Research Center SAS food frequency program,previously adapted from the NCI/Block questionnaire by AlWilliams with Alan Kristal at the Hutchinson Cancer ResearchCenter; Peter Zhu for the creation of the SAS SQL portion sizeentry program; and Gerard Dallal for statistical advice.
REFERENCES
1. Sempos CT. Invited commentary: Some limitations of semi-quantitative food frequency questionnaires. Am J Epidemiol1992;135:1127-32.
2. Briefel RR, Flegal KM, Winn DM, et al. Assessing the na-tion's diet: limitations of the food frequency questionnaire.J Am Diet Assoc 1992;92:959-62.
3. Loria CM, McDowell MA, Johnson CL, et al. Commentary:nutrient data for Mexican-American foods: are current dataadequate? J Am Diet Assoc 1991;91:919-22.
4. Willett WC, Sampson L, Stampfer MJ, et al. Reproducibilityand validity of a semi-quantitative food frequency question-naire. Am J Epidemiol 1985;122:51-65.
5. Rimm EB, Giovannucci EL, Meir JS, et al. Reproducibilityand validity of an expanded self-administered semi-quantita-tive food frequency questionnaire among male health profes-sionals. Am J Epidemiol 1992,135:1114-27.
6. National Center for Health Statistics. Dietary intake sourcedata: United States, 1976-80. Series 11. no. 231. Washington,DC: US GPO, 1983.
7. Block G, Hartman AM, Dresser CM, et al. A data-basedapproach to diet questionnaire design and testing. Am J Epi-demiol 1986;124:453-69.
8. Block G, Woods M, Potosky A, et al. Validation of a self-administered diet history questionnaire using multiple dietrecords. J Clin Epidemiol 1990; 12:1327-35.
9. Block G, Thompson FE, Hartman AM, et al. Comparison oftwo dietary questionnaires validated against multiple dietaryrecords collected during a 1-year period. J Am Diet Assoc1992;92:686-93.
10. SAS Institute Inc. SAS user guide: basics. Version 6 ed. Cary,NC: SAS Institute Inc, 1990.
11. Minnesota Nutrition Data System (NDS) software, developedby the Nutrition Coordinating Center (NCC), University ofMinnesota. Food database version 10A; nutrient database ver-sion 25. Minneapolis, MN: Nutrition Coordinating Center(NCC), University of Minnesota, 1995.
12. Kristal AR, Shattuck AL, Henry HJ, et al. Rapid assessment ofdietary intake of fat, fiber, and saturated fat: validity of aninstrument suitable for community intervention research andnutritional surveillance. Am J Health Promot 1990;4:288-95.
13. Thompson FE, Byers T, Kohlmeier L. Dietary assessmentresource manual. J Nutrition 1994;124:2245S-2317S.
Am J Epidemiol Vol. 148, No. 5, 1998
Dow
nloaded from https://academ
ic.oup.com/aje/article/148/5/507/77051 by guest on 15 February 2022
518 Tucker et al.
14. US Department of Health and Human Services, NationalCenter for Health Statistics. Hispanic Health and NutritionExamination Survey, 1982-1984. [Computer file]. 7th release.Washington, DC: US DHHS, NCHS, 1992.
15. US Department of Health and Human Services, NationalCenter for Health Statistics. Health and Nutrition ExaminationSurvey, 1976-1980. [Computer file no. 5704]. Washington,DC: US DHHS, NCHS.
16. Block G, Dresser CM, Hartman AM, et al. Nutrient sources inthe American diet: quantitative data from the NHANES IIsurvey. Am J Epidemiol 1985;122:27-39.
17. US Department of Agriculture, Human Nutrition InformationService. Handbook 8-9. Composition of foods: fruits and fruitjuices. Washington, DC: US GPO, 1982.
18. Willett WC. Future directions in the development of foodfrequency questionnaires. Am J Clin Nutr 1994;59(suppl):171S-174S.
19. Hankin JH, Rhoades GG, Glober GA. A dietary method for anepidemiologic study of gastrointestinal cancer. Am J Clin Nutr1975;28:1055-61.
20. Hernandez-Avila M, Master C, Hunter DJ. Influence of addi-tional portion size data on the validity of a semiquantitativefood frequency questionnaire. (Abstract). Am J Epidemiol1988;128:891.
21. Cohen NL, Laus MJ, Ferris AM. The contribution of portiondata to estimating nutrient intake by food frequency question-naire. Research bulletin no. 730. Arnherst, MA: MassachusettsAgricultural Experiment Station, University of Massachusetts,1990.
22. Samet JM, Humble CG, Skipper BE. Alternatives in thecollection and analysis of food frequency interview data. Am JEpidemiol 1984;120:572-81.
23. Hunter DJ, Sampson L, Stampfer MJ, et al. Variability inportion sizes of commonly consumed foods among a popula-tion of women in the United States. Am J Epidemiol 1988;127:1240-9.
24. Gersovitz M, Madden JP, Smickilas-Wright H. Validity of the24-hr dietary recall and seven-day record for group compari-sons. J Am Diet Assoc 1978;73:48-55.
Am J Epidemiol Vol. 148, No. 5, 1998
Dow
nloaded from https://academ
ic.oup.com/aje/article/148/5/507/77051 by guest on 15 February 2022