Embed Size (px)
Citation preview
adaptation, spatial variability, and phylogenetic characterizationof methanotrophic communities
in permafrost soils of the lena delta, siberia
Dissertation von Susanne Liebner
November 2007
Adaptation, spatial variability, and phylogenetic characterization of methanotrophic communities in
permafrost soils of the Lena Delta, Siberia
Dissertation zur
Erlangung des Grades eines Doktors der Naturwissenschaften
-Dr. rer. nat.-
dem Fachbereich Biologie/Chemie der Universität Bremen
vorgelegt von
Susanne Liebner
Potsdam, November 2007
Die Untersuchungen zur vorliegenden Dissertation wurden hauptsächlich am Alfred-Wegener-Institut für Polar- und Meeresforschung in Potsdam durchgeführt. Einzelne Analysen erfolgten zusätzlich am Max-Planck-Institut für Marine Mikrobiologie in Bremen.
1. Gutachter: Prof. Dr. Rudolf Amann 2. Gutachter: Dr. habil. Dirk Wagner
PREFACE & ACKNOWLEDGEMENTS
PrefaceThis work was integrated into the Russian-German joint venture project System Laptev Sea 2000. The focus of this project was to extent our knowledge about the Laptev Sea system in north-east Siberia obtained through previous Russian-German projects, such as the Laptev Sea System (1994-1997), and Taymyr (1994-1997). Studies on Quaternary environmental changes, Arctic coastal dynamics and recent periglacial processes including ecological studies on permafrost soils and ecosystems of the central Lena Delta were in the focus of the recent project(Schirrmeister et al., 2004). The present work contributes to the last aspect by investigating the field of methane fluxes in polygonal tundra environments of the Lena Delta. Field work and sampling of this study was conducted during the expeditions LENA 2002 and LENA 2005 (Samoylov Island, Lena Delta, Siberia) with a personal participation in the last expedition. The work was performed in the frame of the International Max Planck Research School for Marine Microbiology (MarMic) mainly at the Alfred Wegener Institute for Polar and Marine Research, Research Unit Potsdam. Some analyses were conducted at the Max Planck Institute for Marine Microbiology in Bremen. This study is presented in English as a cumulative Ph.D. thesis at the University of Bremen (Fachbereich 02). The thesis consists of a general introduction to the particular research field including the scientific background as well as aims and objectives of this study. The study area is described in an extra chapter. The main part of this thesis consists of three manuscripts with first authorship and a final synthesis representing the conclusions as well as critical remarks and future prospects of this work. AcknowledgementsMy particular thanks to Dr. habil. Dirk Wagner (AWI Potsdam) for promoting and encouraging me throughout all the years at AWI, for his indestructibly optimism and challenging personality and last but least for initializing my fascination for the microbial world. Special thanks also to Prof. Dr. Rudolf Amann and Dr. PD Jens Harder (MPI for Marine Microbiology) as members of my thesis committee for their scientific support and critics as well as for their contribution to the MarMic program. I also acknowledge the continuous interest and patience of the head of the AWI research department Prof. Dr. Hans-Wolfgang Hubberten concerning the demands of the GEOMICs group and that due to his support I was able to attend the expedition LENA 2005 and various national and international conferences. Also, I would like to mention that he as well as Christine Litz promoted my participation in the MarMic program. Many thanks in general to all people contributing to that program, in particular to Dr.Christiane Gloeckner as the MarMic coordinator and to the ‘MarMics’ Amelia Rotaru,
i
PREFACE & ACKNOWLEDGEMENTS
Alberto Robador, Joanna Sawicka, and Rita Dunker sharing the same fate and many inspiring informal after work sessions. The last also applies to Regina Schauer whose diploma thesis was of great additional value for my work. Tina Treude and Imke Busse (MPI for Marine Microbiology) kindly introduced me into the radiotracer experiments. Many thanks also to Torsten Sachs (AWI Potsdam) for critically revising major parts of my thesis. Antje Eulenburg and Paul Overduin (AWI Potsdam) were of much help for the pore water analysis. Torben Stührmann (MPI for Marine Microbiology) displayed an enormous patience explaining to me the world of ARB and was very helpful providing up to date information about the scientific world and many encouraging words. Also, I want to thank the crew of the Expedition LENA 2005, in particular Günter‘Molo’ Stoof (AWI Potsdam) for technical support as well as Alexander Yu. Dereviagin (Moscow State University), Mikhail N. Grigoriev (Permafrost Institute Yakutsk), Dmitri V. Melnitschenko (Hydro Base Tiksi), and Alexander Yu. Gukov (Lena Delta Reserve). Warmest thanks to Waldemar Schneider (AWI Potsdam) for his unique disposition to always question everything and everyone, for his experienced logistic abilities, and his sympathy. I thank all GEOMICs at the AWI Potsdam, that due to their pronounced ‘corporate identity’ always kept a warm, supporting and optimistic lab atmosphere meanwhile even in the complete absence of a technician. Particular thanks in this context to Heiko Baschek, Martin Karels, Katharina Koch, Daria Morozova, and Lars Ganzert. During the last years I was allowed to enjoy the company of numerous great AWI Ph.D. and diploma students always willing to extend the working day by either inspiring scientific discussions having a beer or just by having a beer. From time to time, some of them succeeded perfectly to lower the level beyond of what is possible. Larsen, Torsten, Dasha, Jürgen, Julia, Hugues, Katharina, Jule, Thomas, Andreas, Sebastian, and Christian: Thank’s a lot! Most of all I thank Marc for the way he is, especially to me, and my parents as well as my brother who always had faith in what I was doing although (or maybe because) I never managed to explain to them what I was actually working at. This work is dedicated to them.
ii
TABLE OF CONTENTS
Table of contents Preface……………………………………………………………………………….... Acknowledgements…………………………………………………………………... Table of contents……………………………………………………………………... List of abbreviations………………………………………………………………….. Summary………………………………………………………………………………. Zusammenfassung……………………………………………………………………
1. Introduction………………………………………………………………………. 1.1 Scientific background………………………………………………………... 1.2 Taxonomic, phylogenetic, and physiological characterization of MOB… 1.3 Molecular tools for the study of MOB……………………………………… 1.4 Eco-physiology and diversity of MOB……………………………………… 1.5 Estimating bacterial diversity and patterns of bacterial diversity……….. 1.6 Aims and objectives…………………………………………………………. 1.7 Overview of publications and manuscripts………………………………...
2. Study area………………………………………………………………………… 2.1 The Lena Delta as part of the continuous permafrost zone…………….. 2.2 Samoylov Island and its polygonal tundra environments………………...
3. Manuscript I: Abundance, distribution and potential activity of methane oxidizing bacteria in permafrost soils from the Lena Delta, Siberia……………..
4. Manuscript II: Diversity of aerobic methanotrophic bacteria in a perma-frost soil of the Lena Delta, Siberia…………………………………………………
5. Manuscript III: Composition and diversity of soil bacterial communities in polygonal tundra sites of the Lena Delta, Siberia, with particular focus on the Bacteroidetes phylum………………………………………………………………...
6. Synthesis………………………………………………………………………….
7. References………………………………………………………………………..
8. Appendix………………………………………………………………………….. 8.1 Manuscript IV: Temperature adaptation of microbial populations in different horizons of the active layer in permafrost soils from the Lena-Delta, Siberia……………………………………………………………………… 8.2 Q10-values of potential methane oxidation rates…………………………. 8.3 Sample list, field data, and sampling procedure during LENA 2005…… 8.4 Overview of clone libraries and affiliation of clones……………………… 8.5 Enrichment of MOB from a Siberian permafrost soil……………………..
i ii iii iv v vii
1 1 2 4 5 9 11 13
16 16 18
20 20
30 30
45 45
64
72
90 90 101101104108
iii
LIST OF ABBREVIATIONS
List of abbreviations
AMO ammonia monooxygenase amoA gene encoding the �-subunit of the AMO bp base pairs Cy3 fluorescent dye DAPI 4’,6-diamidino-2-phenylindole DDBJ DNA database of Japan DGGE denaturing gradient gel electrophoresis DOC dissolved organic carbon EMBL nucleotide sequence database FISH fluorescence in-situ hybridization GC-content content of guanine and cytosine GenBank international genetic database IPCC Intergovernmental Panel on Climate Change kb kilo base pairs MDH methanol dehydrogenase MMO methane monooxygenase mmoX gene encoding the hydroxylase component of the sMMO MOB (aerobic) methane oxidizing bacteria mRNA messenger RNA MUSCLE multiple sequence alignment algorithm mxaF gene encoding the �-subunit of the MDH NMS medium nitrate-mineral-salts medium OTU operational taxonomic unit PCR polymerase chain reaction PLFA phospholipid fatty acid pMMO particulate methane monooxygenase pmoA gene encoding the �-subunit of the pMMO qPCR quantitative (real time) PCR rRNA ribosomal RNA RT reverse transcriptase SIP stable isotope probing sMMO soluble methane monooxygenase TC total organic carbon TCC total cell counts TN total nitrogen T-RFLP terminal restriction fragment length polymorphism
iv
SUMMARY
Summary The Lena Delta, located in north-east Siberia in the zone of continuous permafrost, is the largest delta within the circum-arctic. Northern wetlands and wet polygonal tundra environments such as those in the Lena Delta are known to be significant natural sources of the effective greenhouse gas methane. The natural capacity of those Siberian wetlands that are underlain by permafrost to emit methane is currently of major concern in the context of global change, because Siberian permafrost is particularly susceptible to degradation. Permafrost degradation is suggested to impose huge amounts of yet stored carbon to the atmosphere and with this to cause a positive feedback on the natural methane source strength of Siberian wetlands and tundra. An understanding of the processes that determine methane emissions in these environments is therefore essential not only for present but also for future balancing and modeling of their methane fluxes, in particular with regard to the pronounced morphological heterogeneity of polygonal tundra habitats. The ability of aerobic methane oxidizing (methanotrophic) bacteria (MOB) to function as the primary sink for methane in terrestrial habitats sets the frame of this work. Its main objective was to study the ecology of MOB in morphological units that are representative for the polygonal tundra of the Lena Delta. The particular focus was on the adaptation, spatial variability, and phylogenetic characterization of MOB in relation to the changing environmental conditions of polygonal tundra environments. These aspects were therefore investigated at the examples of a low-centred polygon and a flood plain on Samoylov Island, a small island located in the central and presently active part of the Lena Delta. The community of MOB in polygonal tundra sites of the Lena Delta was observed to be specialized to the extreme temperature regime it is exposed to. Firstly, in sites where the abundance of MOB was not limited by the availability of oxygen, MOB contributed partly more than 10 % to the total number of microbial cells. Methanotrophic cell numbers were similar to those in northern peat lands and exceeded those obtained in environments with more moderate temperatures. Secondly, potential methane oxidation rates were highest at 4° C near the permafrost table indicating that a psychrophilic/psychrotolerant methanotrophic community dominates in deep active layer zones where temperatures are constantly < 2 °C. In contrast, near the surface where temperatures fluctuate at greater amplitude, the maximum methane oxidation potential appeared at 21 °C. Finally, the composition of the methanotrophic community in a polygon rim was restricted on the genus-level and displayed a (relative) dominance of representatives closely related to known psychrophilic and psychrotolerant strains. The majority of these representatives were thereby affiliated to two micro-diverse sequence clusters specific for the permafrost habitat investigated in this study. Additionally, a comparison between the species diversity of MOB near the surface and near the permafrost table within a polygon rim revealed no difference. This varied from the diversity of the entire soil bacterial
v
SUMMARY
community that was lower near the permafrost table than near the surface and was found to primarily decrease with increasing pressure of competition for the available resources. The diversity of MOB in polygonal tundra environments was therefore concluded to be determined by other factors than that of the entire soil bacterial community and to be independent of the extreme temperature gradient within the active layer. The abundance of MOB in permafrost soils of the Lena Delta varied depending on geo-morphological unit within the polygonal tundra and depending on soil depth. Compared to a polygon rim and flood plain, the abundance of MOB was two orders of magnitude lower in a water saturated polygon centre with low redox potentials despite higher methane concentrations there. Methanotrophic abundance also decreased towards the permafrost table although in-situ methane concentrations increased with soil depth. The spatial variations of methanotrophic abundance were reflected in potential rates of methane oxidation as well. These rates were again two orders of magnitude lower in a polygon centre than in a polygon rim and a flood plain, respectively. According to these results, the abundance of MOB in polygonal tundra sites was suggested to primarily depend on oxygen availability and redox potentials rather than on concentrations of methane. Based on the results of this work, polygonal tundra environments of the Lena Delta are very heterogeneous habitats for MOB. The predicted permafrost degradation and shift of dry/wet site ratios within the polygonal tundra would therefore lead to a change of methanotrophic abundance and potential activity in the Lena Delta. Also, a cold-specialized methanotrophic community as detected near the permafrost table is likely restricted in the flexibility to react to changing environmental conditions, in particular considering that also the diversity of MOB was found to be low on the genus-level.
vi
ZUSAMMENFASSUNG
ZusammenfassungDas Lena-Delta, das sich in Nord-Ost Sibirien in der Zone des dauerhaften Permafrostes befindet, ist das größte Delta der Zirkum-Arktis. Die Feuchtgebiete der nördlichen Hemisphäre sowie feuchte Standorte der polygonalen Tundra, wie sie im Lena-Delta zu finden sind, stellen signifikante Quellen für das bedeutende Treibhausgas Methan dar. Weite Teile Sibiriens sind durch Permafrost geprägt, der durch die in der sibirischen Arktis stärker als in anderen Erdteilen zunehmenden Oberflächentemperaturen derzeit in besonderem Maße gefährdet ist zu degradieren. Daher ist die Bedeutung sibirischer Feuchtgebiete und Tundren als natürliche Methanquellen ein Kernthema der Debatte um den Globalen Klimawandel. Es wird angenommen, dass durch Degradation von sibirischem Permafrost riesige Mengen gespeicherten Kohlenstoffs in die Atmosphäre gelangen, wodurch die klimarelevante Wirkung sibirischer Feuchtgebiete und Tundren verstärkt werden könnte. Das Verständnis der Prozesse, die die Methanemission in diesen Gebieten bestimmen, ist daher nicht nur essentiell für eine derzeitige, sondern auch für eine zukünftige Bilanzierung und Modellierung ihrer Methanflüsse. Die Fähigkeit aerober Methan oxidierender (methanotropher) Bakterien (MOB), in terrestrischen Habitaten als primäre Senke für Methan zu fungieren, bildete den Rahmen dieser Arbeit. Das Ziel der Arbeit war, die Ökologie von MOB, speziell deren Anpassung, räumliche Variabilität und Phylogenie, in Beziehung zu den wechselnden Umweltbedingungen innerhalb der polygonalen Tundra zu untersuchen. Die genannten Aspekte wurden daher in einem „low-centred Polygon“ sowie einer Überflutungsebene auf der Insel Samoylov, einer kleinen Insel im zentralen und derzeit aktiven Bereich des Lena-Deltas, studiert. Es konnte gezeigt werden, dass MOB der polygonalen Tundra des Lena-Deltas sehr gut an das extreme Temperaturregime angepasst sind. Erstens trugen MOB in Standorten, in denen ihre Abundanz nicht durch Sauerstoffmangel limitiert wurde, teilweise mehr als 10 % zur Gesamtzellzahl an Mikroorganismen bei. Die Zellzahlen von MOB waren dabei vergleichbar mit denen aus nördlichen Moorlandschaften und höher als jene aus gemäßigten Breiten. Zweitens waren potentielle Methanoxidationsraten nahe der Permafrosttafel, wo konstant Temperaturen < 2 °C herrschen, bei 4 °C am höchsten. Das deutet darauf hin, dass in tiefen Bodenschichten nahe der Permafrosttafel psychrophile und psychrotolerante MOB dominieren. Im Gegensatz dazu wurden nahe der Geländeoberfläche, wo weitaus größere Temperaturschwankungen auftreten als in den tieferen Bodenschichten, maximale potentielle Methanoxidationsraten bei 21 °C detektiert. Zusätzlich war die methanotrophe Gemeinschaft in einem Polygonwall aus nur sehr wenigen unterschiedlichen Gattungen zusammengesetzt. Sie wies eine relative Dominanz von Vertretern auf, die mit bekannten psychrophilen und psychrotrophen Arten nahe verwandt sind. Ein Großteil dieser Vertreter gehörte dabei zwei für den untersuchten Standort spezifischen Sequenzclustern an. Auch wies ein Vergleich der Diversität
vii
ZUSAMMENFASSUNG
von MOB auf Artenebene zwischen oberflächennahen und tiefen Bodenschichten trotz des extremen Temperaturgradienten im „active layer“ keinen Unterschied auf. Eine sich mit der Tiefe nicht ändernde Diversität variierte von den Ergebnissen zur Diversität der gesamten Bodenbakteriengemeinschaft, die mit zunehmender Tiefe offenbar insbesondere bedingt durch den steigenden Konkurrenzdruck um die verfügbaren Ressourcen abnahm. Demzufolge wird die Diversität von MOB in der polygonalen Tundra von anderen Faktoren bestimmt als die der gesamten Bodenbakteriengemeinschaft. Es konnte überdies gezeigt werden, dass die Abundanz von MOB im Lena-Delta in Abhängigkeit von Landschaftseinheit und Bodentiefe variierte. Im Vergleich zu einem Polygonwall und einer Überflutungsebene war die Abundanz in einem wassergesättigten Polygonzentrum mit niedrigen Redoxpotentialen trotz vergleichsweise höherer Methankonzentrationen um zwei Größenordnungen kleiner. Die Abundanz von MOB nahm außerdem mit zunehmender Bodentiefe ab, obwohl auch dort die Methankonzentrationen höher waren als nahe der Geländeoberfläche. Die räumlich variierende Abundanz von MOB zeigte sich auch in deren potentiellen Methanoxidationsraten, die in einem Polygonzentrum erneut um zwei Größenordnungen geringer waren als in einem Polygonwall bzw. einer Überflutungsebene. Demzufolge scheint die Abundanz von MOB in der polygonalen Tundra in erster Linie von der Sauerstoffverfügbarkeit und dem Redox-Regime, nicht jedoch von der Methankonzentration bestimmt zu werden. Basierend auf den Ergebnissen dieser Arbeit stellt die polygonale Tundra des Lena-Deltas ein sehr heterogenes Habitat für MOB dar. Im Zuge der prognostizierten Degradation von Permafrost und sich ändernder Verhältnisse von trockenen und feuchten Standorten würden sich demnach auch Abundanz und potentielle Aktivitäten von MOB im Lena Delta verändern. Zusätzlich ist eine sehr spezialisierte methanotrophe Gemeinschaft, wie sie nahe der Permafrosttafel gefunden wurde, in ihrer Flexibilität, auf Umweltänderungen zu reagieren, möglicherweise eingeschränkt. Diese Schlussfolgerung wurde insbesondere im Hinblick darauf gezogen, dass die methanotrophe Gemeinschaft auf Gattungsebene eine nur geringe Diversität aufwies.
viii
INTRODUCTION
1
1. Introduction 1.1 Scientific background Northern wetlands and tundra environments were estimated to emit between 17 and 42 Tg methane per year and to contribute about 25 % to the natural global methane emission annually (Fung et al., 1991; Whalen & Reeburgh, 1992; Cao et al., 1996; Christensen et al., 1996; Joabsson & Christensen, 2001). Within the Lena Delta, the wet polygonal tundra sites in contrast to the elevated and dry sites were also observed to be significant sources of methane using chamber measurements (Wagner et al., 2003; Kutzbach et al., 2004). A positive net methane flux from the wet polygonal tundra of the Lena Delta was as well estimated using eddy-covariance measurements (Wille et al., in press). The natural capacity of arctic wetlands to emit methane primarily results from inhibited decomposition processes during the harsh and extremely long arctic winter. In consequence, organic material accumulates. In summer, thawing of the uppermost permafrost leads to water saturated conditions in the active layer supporting microbially mediated methane formation (methanogenesis) as the terminal step in the anaerobic decomposition of organic matter. Given, that the global warming potential of methane on a molecular basis and a time horizon of 100 years is 23-fold that of carbon dioxide (Houghton et al., 2001), the greenhouse gas (GHG) budget of these environments is of global climatical importance. It was estimated that about 24 % of the Northern Hemisphere’s land is underlain by permafrost (Zhang et al., 1999). Because Arctic surface temperatures on average increased to a greater extent than those of the rest of the earth (IPCC, 2001), Arctic permafrost is particularly susceptible to degradation. Nelson and colleagues (2001) predicted a high potential of large areas of Siberian permafrost to be degraded which would primarily lead to a thickening of the seasonally thawed layer (active layer). In the period 1956-1990, the active layer in Russian permafrost already increased by on average 20 cm (IPCC, 2007). By the end of the 21st century, an increase of mean annual ground temperature by up to 6 °C and of active layer depth by up to 2 m is estimated for East Siberia (Stendel et al., 2007). Although the estimated size of the carbon pool in Arctic permafrost affected tundra varies between 190 and, in more recent studies, approximately 900 Gt, it accounts for at least 13-15 % of the global carbon pool in soils (Post et al., 1982; Zimov et al., 2006). Thawing of 10 % of the total Siberian permafrost carbon pool was suggested to initially release about 1 Pg carbon followed by respiration of about 40 Pg carbon to the atmosphere over a period of four decades (Dutta et al., 2006). This, in turn, will likely reinforce the methane source strength of Arctic wetlands (Wuebbles & Hayhoe, 2002). Aerobic methane oxidizing (methanotrophic) bacteria (MOB) primarily contribute to the consumption of methane in terrestrial environments (chapter 1.4). Through methane oxidation, the diffusive methane flux in wetlands might be reduced by 76 up to more than 90 % (Roslev & King, 1996; Le Mer & Roger, 2001). The ecology of
INTRODUCTION
2
MOB and their ability to react on warming induced permafrost degradation is therefore of importance for the GHG budget of arctic wetlands and tundra. Among several other environments (chapter 1.4), the methanotrophic community was studied in northern peat lands, eastern Antarctica, and Fennoscandian deep ground waters. These studies, reviewed by Trotsenko & Khmelenina (2005), showed that MOB are abundant and active also under very harsh environmental conditions of cold environments. Moreover, the diversity of MOB was found to be high in a Russian sub-arctic tundra (Kaluzhnaya et al., 2002) where the majority of known methanotrophic genera was detected but it was low in an arctic wetland on the island of Svalbard (Wartiainen et al., 2003) with only two genera of MOB recovered. Apart from a study reporting that MOB are viable also in deep Siberian permafrost sediments with ages of 1000-100,000 years (Khmelenina et al., 2001), our understanding of the ecology of MOB in Siberian permafrost soils in general and in particular of MOB within the polygonal tundra environments of the Lena Delta, however, remains very poor.
1.2 Taxonomic, phylogenetic, and physiological characterization of MOB MOB represent a subset of methylotrophic bacteria. The physiological group of methylotrophic bacteria is known to aerobically utilize a variety of one-carbon compounds more reduced than formic acids as carbon and energy source. In contrast, MOB are specialized to utilize methane as single carbon and energy source. Using their specific enzyme, methane monooxygenase (MMO), MOB oxidize methane to methanol and further on to formaldehyde. The last step is catalyzed by methanol dehydrogenase (MDH), an enzyme common for all methylotrophs. Formaldehyde is then assimilated into cellular carbon. Excess of formaldehyde is further oxidized to carbon dioxide via formate (Bowman, 1999). The important role of MOB as a sink for the effective greenhouse gas methane in terrestrial habitats, in particular in arctic wetlands, forms the focus of the present work. Except for that, the lack of substrate specificity of the MMO enables MOB to also oxidize a large number of xenobiotic compounds which exposes this group of bacteria to enormous interest in the field of bioremediation and biotechnology (Hanson & Hanson, 1996). The group of MOB comprises three families, Methylococcaceae, Methylocystaceae, and Beijerinckiaceae. The only exception is Crenothrix polyspora, a filamentous, sheathed microorganism recently discovered to be methanotrophic (Stoecker et al., 2006). Crenothrix polyspora belongs to the Crenotrichaceae (Methylococcales order) and has an unusual MMO. Methylococcaceae include the genera Methylobacter,Methylomonas, Methylomicrobium, Methylosarcina, Methylosphaera, Methylo-halobius, Methylosoma, Methylothermus, Methylococcus, and Methylocaldum. They belong to the gamma-subdivision of the Proteobacteria phylum and are termed type I MOB, except for the last two which are also known as type X MOB. Type X MOB can be distinguished from type I MOB by several physiological and biochemical features.
INTRODUCTION
3
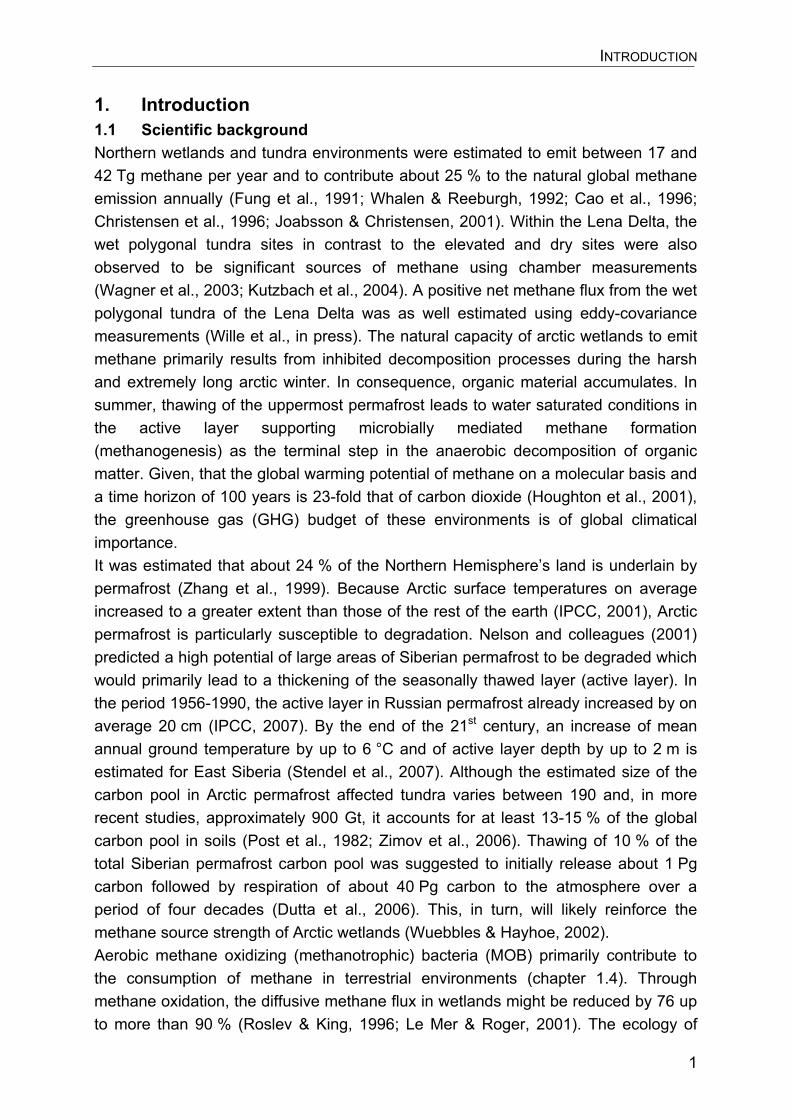
In contrast to type I MOB they, for example, possess enzymes of the Benson-Calvin cycle and higher GC-contents. In the following they will be included into the type I MOB. The families Methylocystaceae, and Beijerinckiaceae include the genera Methylosinus, Methylocystis, Methylocella, and Methylocapsa. Members of the Methylocystaceae and Beijerinckiaceae are termed type II MOB and belong to the alpha-subdivision of the Proteobacteria phylum (Bowman, 1999; Dedysh et al., 2000; 2001; 2002; 2004; Wise et al., 2001; Heyer et al., 2005; Tsubota et al., 2005; Rahalkar et al., 2007). The phylogenetic relation within the group of MOB is illustrated in Figure 1.1.
Figure 1.1 Phylogenetic trees showing the relation of a) 16S rRNA gene sequences and b) of pmoA gene sequences of known MOB. Trees represent maximum likelihood trees calculated according to the PhyML algorithm (Guindon & Gascuel, 2003) using a termini and a positional variable filter for Bacteria (a) and a 30 % filter for lengths of translated pmoA gene sequences (b). By now, almost 200 isolates of MOB from different sites are known (http://www.ncbi.nlm.nih.gov/Taxonomy/) suggesting that MOB are ubiquitous in many environments. Among those isolates are several extremophiles such as the thermophilic members of Methylococcus and Methylocaldum (type X MOB), the acidophilic genera Methylocella and Methylocapsa, and the halophilic and alkaliphilic representatives of the genus Methylomicrobium (Trotsenko & Khmelenina, 2002). Also, some psychrophilic and psychrotrophic MOB are known such as the type I MOB Methylobacter psychrophilus, isolated from Siberian tundra (Omelchenko et al., 1996), Methylobacter tundripaludum isolated from Arctic wetland soils (Wartiainen et al., 2006), Methylosphaera hansonii, isolated from Antarctic, marine salinity,
INTRODUCTION
4
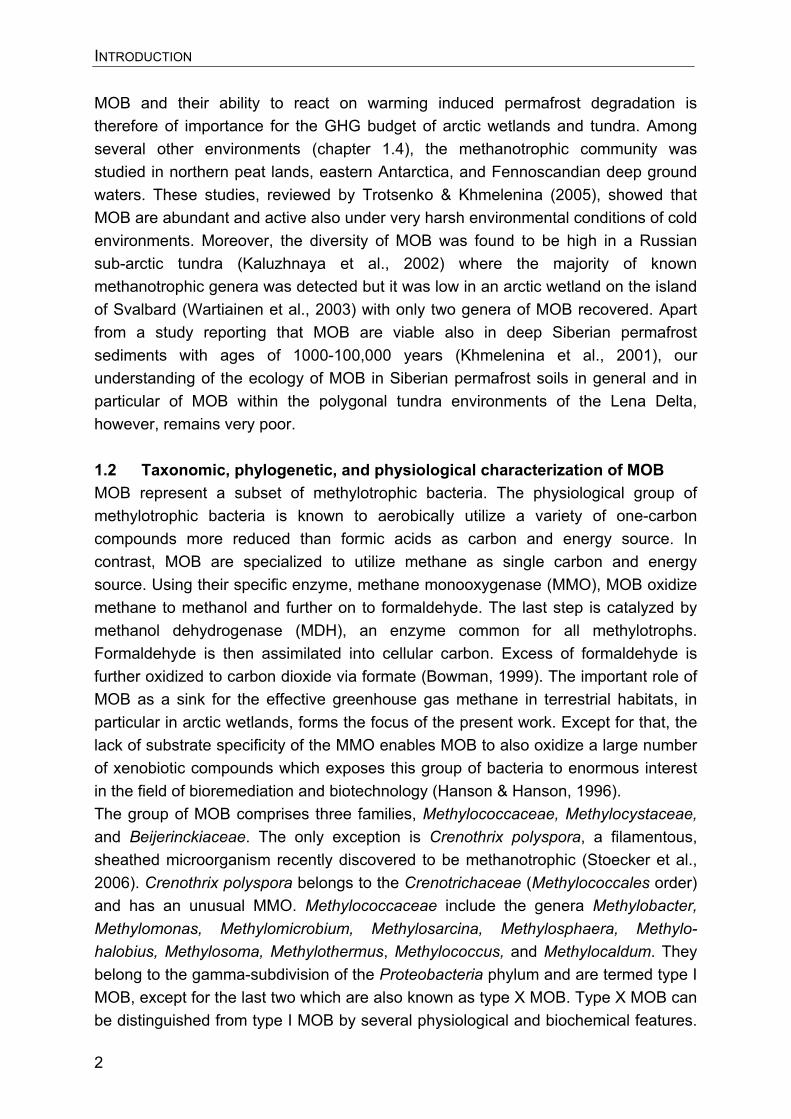
meromictic lakes (Bowman et al., 1997a), and Methylomonas scandinavica, isolated from deep igneous rock ground water (Kaluzhnaya et al., 1999). In addition, the acidophilic strains of the type II genera Methylocella and Methylocapsa were also reported to be psychrotrophs (Trotsenko & Khmelenina, 2005). Except for their phylogeny, type I and type II MOB can mainly be distinguished by their carbon assimilation pathway, the structure of their intracytoplasmic membranes, their resting stages, GC-content, the constitution of their methane monooxygenase, and by their phospholipid fatty acids (PLFAs). A comparison of characteristics of both groups is shown in Table 1.1. Table 1.1 Comparison of type I and type II MOB characteristics (modified from Hanson & Hanson, 1996; Bowman, 1999)
Characteristics Type I MOB Type II MOB Phylogenetic group
(Proteobacteria)Gamma Alpha
Carbon assimilation pathway Ribulose-mono-phosphate Serine
Intracytoplasmic membranes
Resting stages Azotobacter type Exospores or lipoidal cysts
GC-contents [mol %] 43-60 60-67 Soluble methane monooxygenase
Negativea Positive
Specific PLFAs 14.0, 16:1�7c, 16:1�5t 18:1�8c a except for some strains of Methylococcus & Methylomonas
1.3 Molecular tools for the study of MOB The restricted phylogenetic affiliation of MOB, the specificity of their key enzymes, and their characteristic patterns of major PLFAs set the basis for a comprehensive study of MOB and their ecology using molecular tools. For phylogenetic analysis of MOB, Wise and colleagues (1999) developed specific primer combination for the amplification of 16S rRNA genes of type I and type II MOB, respectively (for primer details see chapter 4) that were successfully used by several studies (e.g. Horz et al., 2001; Wartiainen et al., 2003; Rahalkar & Schink, 2007a). However, these primers were only recently found to fail the detection of the acidophilic genera Methylocella, and Methylocapsa, the thermophilic genus Methylocaldum, and the halophilic species Methylosphaera hansonii (Chen et al., 2007). Authors of this study therefore designed new 16S rRNA primers for methanotrophs. Aiming at a more functional approach, the composition and diversity of MOB communities can be investigated based on the detection of their key enzymes. Despite the phylogenetic distance between type I and type II MOB, almost all known MOB possess a pmoA gene, which encodes the �-subunit (PmoA) of the particulate methane monooxygenase
INTRODUCTION
5
(pMMO). The only exception is Methylocella palustris (Dedysh et al., 2000). The pmoA gene can therefore be used as a functional gene probe for MOB (McDonald & Murrell, 1999). Initially designed primers for the detection of pmoA genes were unspecific and also detected a large number of amoA genes which encode the �-subunit (AmoA) of the ammonia monooxygenase in autotrophic ammonia oxidizers (Holmes et al., 1995). The simultaneous amplification of pmoA and amoA genes is due to a close phylogenetic relatedness of both genes. Therefore, new primer sets were designed to detect novel, high-affinity methane oxidizers (Costello & Lidstrom, 1999) and to retrieve a large and unbiased diversity of MOB (Bourne et al., 2001). The details of these pmoA primers are also summarized in chapter 4. Recently, also microarrays were developed specificly for an analysis of pmoA gene diversities (Bodrossy et al., 2003). Additionally, MOB communities can be studied based on primers targeting the mmoX gene (Großkopf, 1994) and the mxaF gene (McDonald & Murrell, 1997). The mmoX gene encodes the �-subunit (MmoX) of the hydroxylase component of the soluble methane monooxygenase (sMMO). The sMMO is present in most type II MOB, in members of the Methylococcus, and in some Methylomonas species (Shigematsu et al., 1999) but not in most of the type I methanotrophs (Hanson & Hanson, 1996). The mxaF gene encodes the �-subunit of the methanol dehydrogenase, present in all methylotrophs and is therefore less suitable for a specific detection of MOB only. The unusual and specific PLFA patterns of MOB (Table 1.1) were discovered by Bowman and colleagues in 1991 and since then have been applied as useful fingerprints for the taxonomy and identification of MOB (Hanson & Hanson, 1996). The molecular tools discussed thus far only allow for a relative quantification of MOB. Through their application absolute cell numbers of MOB in-situ can not be obtained. Because of that, fluorescence in-situ hybridization (FISH) developed for the detection and enumeration of microbial cells directly in their habitat (Amann et al., 1990; 1995) was also applied on MOB. 16S rRNA gene targeting oligonucleotide probes were developed for discriminating between type I and type II MOB, respectively (Eller et al., 2001) as well as for a more specific detection of single methanotrophic species within the genera Methylosinus, Methylocystis, and Methylocapsa (Dedysh et al., 2003). The powerful tool of stable isotope probing (SIP) of lipids as well as of RNA and DNA (Radajewski et al., 2000; Kreuzer-Martin, 2007) was also applied to link identity and function of MOB (McDonald et al., 2005), in particular of communities in acidic forest soils (Radajewski et al., 2002), of the Movile Cave in Romania (Hutchens et al., 2004), and in oxic rice field soils (Lueders et al., 2004). 1.4 Eco-physiology and diversity of MOB The aerobic oxidation of methane by MOB primarily contributes to the consumption of methane in terrestrial habitats. It was estimated that the microbial conversion of methane into carbon dioxide accounts for 30 to 90 % of the methane produced in
INTRODUCTION
6
flooded rice fields (Bosse & Frenzel, 1997; 1998), for 13 to 38% of the methane in temperate and sub-arctic peat soils (Dunfiled et al., 1993), and for 15 to more than 90% of the diffusive methane flux in wetlands (Roslev & King, 1996; Le Mer & Roger, 2001). A long time it was believed, that the process of methane oxidation is restricted to the group of aerobic methane oxidizers. However, a couple of years ago it was proven that methane can also be oxidized anaerobically by micro-organisms in various marine habitats. Boetius and colleagues (2000) detected a consortium of methane oxidizing archaea and sulphate reducing bacteria at methane hydrate layers exposed to marine sea floor at the continental margin off the coast of Oregon. Since then, the process of anaerobic methane oxidation has been well studied in marine environments (e.g. Elvert et al., 2000; Orphan et al., 2001; Joye et al., 2004; Orcutt et al., 2005; Treude et al., 2003; 2005; 2007). Recently, anaerobic methane oxidation was also observed to occur in freshwater sediments (Raghoebarsing et al., 2006). These authors detected a consortium of archaea distantly related to the marine methanotrophic archaea and representatives of a completely unknown phylum that carried out methane oxidation coupled with denitrification in the complete absence of oxygen. Although the process of anaerobic methane oxidation could thus significantly contribute to the consumption of methane in terrestrial habitats as well (Strous & Jetten, 2004), it is so far the only instance of observed anaerobic methane oxidation connected to a non-marine habitat. Due to thermodynamic requirements of the involved micro-organisms it can, moreover, only be performed in the presence of very high methane and nitrate concentrations. Given the environmental conditions in permafrost soils (chapter 2), it is unlikely, that the anaerobic oxidation of methane significantly contributes to the consumption of methane in these habitats. As a result of the restricted phylogeny and physiology of MOB, aerobic methane consumption is not only sensitive to the community structure of MOB (Singh et al., 2007). It also allows for eco-physiological investigations of this group of bacteria that can directly be connected to the GHG budget of terrestrial environments (Schimel, 1995). Potential methane oxidation maxima correlated with maximum abundance of MOB at oxic/anoxic interfaces in soils and sediments with continuous methane fluxes towards the surface and methane concentrations higher than 1000 ppmv. In contrast, where methane concentrations are low and negative methane fluxes (exposure to atmospheric methane) occur maximum potential methane oxidation and abundance of MOB do not coincide (Bender & Conrad, 1994; 1995). Studies on the kinetics of potential methane oxidation rates in various environments revealed that the maximum rate constants of the indigenous MOB community depend on affinity of the environment (Bender & Conrad 1992; 1993). The half-saturation constants for methane oxidation of soils exposed to atmospheric methane ranged from 32 to 88 nM in the aqueous phase. In contrast, Ks values for methane oxidation in soils exposed to continuous upward fluxes of methane ranged from 2.2 to 2.5 μM and were even higher in lake-water underlain by anoxic, methanogenic sediment (Hanson
INTRODUCTION
7
& Hanson, 1996). As a result of different affinities of the indigenous MOB communities, MOB are not necessarily more abundant in habitats with high methane concentrations. In rice soils with pore water methane concentration of up to 1700 μM, MOB determined by FISH made up at maximum 5 % of the total microbial community (Eller et al., 2001). However, based on immuno-fluorescent methods, MOB contributed between 2.5 and 4.8 % to the total cell numbers also in high affinity, permanently ice-covered lakes from Antarctica (Galchenko, 1994). In northern peat- and wetlands with moderate methane concentrations, methanotrophic cell numbers, determined through PLFA analysis and immuno-fluorescent methods were in the range of 1 x 10⁵ to 5 x 10⁷ cells g-1 soil and contributed up to 23 % to the total cell counts (Vecherskaya et al., 1993; Sundh et al., 1995). In forest soils with atmospheric methane consumption, between 3 x 10⁴ and 2 x 10⁶ pmoA gene copies g-1 dry soil were detected using quantitative PCR (Kolb et al., 2005). This is comparable with MOB cell numbers detected via plate counts in freshwater sediments with high upwards methane fluxes (Saralov et al., 1984). According to this, the abundance of MOB does not increase proportional to an increase of methane concentrations in-situ. Still, comparing methanotrophic abundance of different environments appears to be difficult due to the high variability of methods applied for quantification. Beside an influence of substrate concentrations on the activity and abundance of MOB, these parameters were also investigated with regard to possible influences by other abiotic factors such as water level, oxygen concentrations, pH, and temperature. In wetland soils, for example, it was concluded that methane oxidation rates increase with lowering of the water table and extension of aerobic soil layers (Whalen & Reeburgh, 1990; Kutzbach et al., 2004). In contrast, a significant production and oxidation of methane was measured in water-saturated layers of boreal mire (Kettunen et al., 1999). Besides, MOB were shown to be micro-aerophilic and to outcompete other bacteria at very low oxygen concentrations (Bodegom et al., 2001). Also with regard to pH and temperature, studies showed contradicting results. As shown in chapter 1.2, several acidophilic, halophilic, alkaliphilic, psychrophilic, and thermophilic isolates of MOB are known suggesting that MOB are able to specialize to extreme pH values and temperatures. Concerning environmental samples, methane oxidation rates were observed to be similar independent of whether pH values varied between 3.5 and 8 (Borne et al, 1990). Also, Heyer and Suckow (1984) reported methane oxidation in peat samples at pH values between 3.7 and 4.4. Other studies, however, observed decreasing methane oxidation rates at low pH values even in acidic environments and concluded that the methanotrophic community in these environments must be neutrophilic (Dunfield et al., 1993; Bender & Conrad, 1995) and poorly adapted to low pH values. The influence of temperature variations on the activity of MOB is little investigated and is therefore not well understood. The only known study thus far focussed on
INTRODUCTION
8
samples of a northern peat-land and reported Q10 values of the indigenous MOB between 1.4 and 2.1 as well as a decrease of potential methane oxidation rates by more than two third between 0 and 10 °C compared to 25 °C (Dunfield et al., 1993). These authors concluded that the methane oxidizing community is poorly adapted to low temperature environments. In summary, the influence of environmental parameters on the eco-physiology of the methanotrophic community is extremely complex. Especially the impact of abiotic factors such as oxygen availability, pH and temperature on the abundance and activity of MOB is not well understood and varies between different environments. Studies on the diversity of MOB are closely related to those investigating their eco-physiology. In fact, many studies focussing on the diversity of MOB were concerned with the question on how the composition of the methanotrophic community is determined by certain environmental conditions. Especially due to the breakthrough of molecular techniques these studies generated a consistent picture on some factors that determine the competition between type I and type II MOB. The MOB community of peat bogs or acidic forest soils, for example, was restricted to members of type II MOB (McDonald et al., 1996; McDonald & Murrell, 1997, Radajewski et al., 2002). In addition, all known acidophilic isolates belong to the genera Methylocapsa or Methylocella, both type II MOB (Dedysh et al., 2000; 2001; 2002; 2004). The MOB community capable of the consumption of atmospheric methane, again, was studied in different forest and grassland soils and was found to exclude members of the type I group. Still, in particular due to an increased number of studies applying a functional approach, the community involved in the oxidation of atmospheric methane was found to be extremely complex. It was not only suggested to consist of type II MOB (Lau et al., 2007) but also of distinct, yet uncultivated clusters distant from type I and type II MOB (Henckel et al., 2000; Horz et al., 2005; Kolb et al., 2005; Ricke et al., 2005). One of these clusters is upland soil cluster alpha (USC�). Based on a genomic fosmid library, this cluster was detected to be closely related to Methylocapsa acidiphila (Ricke et al., 2005). A restriction of the methanotrophic community to type I MOB was obsevred in soda lakes (at pH 10) in Russia, where only members of the genera Methylomicrobium, Methylomonas, Methylobacter and Methylothermus were found to be active (Lin et al., 2004). In less extreme environments (concerning substrate concentrations and pH) such as landfill soils (Horz et al., 2001), rice field soils (Henckel, et al., 1999; Henckel et al., 2001), and freshwater sediments (Costello & Lidstrom, 1999; Pester et al., 2004; Rahalkar & Schink, 2007a), the diversity of MOB was observed to be much higher and not restricted to certain groups within the methanotrophic community. In these studies, type I, type II and also type X MOB were detected. Still, all these studies rather describe the composition than the diversity of the methanotrophic community. This complicates a comparison of the dimension of methanotrophic diversities within and between environments.
INTRODUCTION
9
1.5 Estimating bacterial diversity and patterns of bacterial diversity The vast majority of biomass on Earth is made up by prokaryotic cells. The total amount of their cellular carbon was estimated to be 4-6 x 1030 cells and 350-550 Pg (1Pg = 1015 g) of carbon, respectively (Whitman et al., 1998). In soils, the major group of prokaryotes is represented by members of the domain Bacteria with an immense number of cells (typically 109 bacterial cells g-1) and level of diversity (Dunbar et al., 2002; Tringe et al., 2005). According to DNA re-association kinetics and 16S rRNA gene sequence similarities, the number of bacterial species (per 100 gram of soil) was estimated to be in the range of 0.5-1 x 10⁴ species (Torsvik et al., 1996; Dunbar et al., 1999). A major goal of microbial ecologists is therefore to determine the microbial diversity on the one hand and to compare the microbial diversity of different environments on the other hand (Bohannan & Hughes, 2003). Describing microbial diversity primarily means species diversity. This, however, faces the controversial discussion on species definition in microbial ecology. One species definition uses information from SSU rDNA only and defines two strains with more than (usually) 97 % sequence similarity as the same species (Rosselló-Mora & Amann, 2001). This species definition underestimates the number of species obtained through DNA-DNA hybridization, where strains must show more than 70 % hybridization to be considered the same species (Pedrós-Alió, 2006). Still, species definition based on SSU rDNA is practicable and applicable and allows for high throughput screening of microbial diversity which is necessary considering its extreme dimension. Therefore, information from SSU rDNA definition is widely used in the field of microbial ecology but ‘species’ is mostly replaced by the term ‘operational taxonomic unit’ (OTU). Although OTU definitions usually capture species-like units, they can also be used to describe microbial diversity at any taxonomic level as long as their definition is clear and consistent (Bohannon & Hughes, 2003). Biological diversity in general includes a characterization of richness and evenness (Magurran, 2004). The most commonly used diversity index including richness as well as evenness is the ‘Shannon’s index’ or ‘H’ (Spellerberg & Fedor, 2003). This index originated from communication theory and was invented by the mathematician and engineer Claude Shannon (Shannon & Weaver, 1949). The ‘Simpson’s index’ or ‘D’ is widely used as an evenness measure (Magurran, 2004). It gives the probability of any two individuals drawn at random from an infinitely large community belonging to the same species (Simpson, 1949). In order to compare OTU richness among environments, parametric and nonparametric estimations are commonly applied. Parametric methods estimate the number of unobserved OTUs in a community by fitting sample data to models of relative OTU abundance such as the lognormal (Preston, 1948) and the Poisson lognormal (Bulmer, 1974) models. Drawbacks of parametric richness estimation in microbial ecology are i) they require huge datasets to evaluate the distribution parameters and ii) attempts to determine empirically if bacterial diversity is indeed lognormally distributed have failed (Dunbar
INTRODUCTION
10
et al., 2002). Another way to estimate OTU richness is based on nonparametric approaches. Nonparametric approaches do not assume particular OTU abundance models and estimate richness from small sample sizes (Hughes et al., 2001). The Chao1 estimator, for example, uses the number of singletons (OTUs represented by only one individual) and doubletons (OTUs represented by two individuals) to estimate the absolute number of OTUs within a sample (Chao, 1984). Because confidence intervals can be determined for the Chao1 estimator (Chao, 1987), it can be used to determine whether differences in diversities between environments are statistically significant. Another nonparametric richness estimator is the abundance-based coverage estimator (ACE) which incorporates data from all species with fewer than 10 individuals but not only singletons and doubletons (Chao & Lee, 1992). Because nonparametric estimations are only based on the OTUs observed in a sample (and with this are sensitive to PCR biases), they often do not account for very rare classes. Thus, for bacterial communities, nonparametric estimators tend to underestimate OTU diversity, in particular for low sample sizes (Hughes et al., 2001). Still, whereas parametric approaches are more useful to obtain absolute richness estimation, nonparametric approaches are more appropriate to compare the diversity of different environments (Bohannan & Hughes, 2003). Finally, also rarefaction analysis can be applied in microbial ecology in order to estimate the richness of communities. Rarefaction compares observed richness among sites independently of sample size. Rarefaction curves result from averaging randomizations of the observed accumulation curve (Heck et al., 1975). Based on assignments of OTUs and an estimation of their richness and evenness, the bacterial diversity of different environments can be compared. Through this, possible patterns of bacterial diversity can be discovered and related to certain environmental parameters. Fierer & Jackson (2006), for example, analyzed almost 100 soil samples from different latitudes applying restriction fragment length analysis and reported that bacterial diversity was determined by pH only but independent of temperature or latitude. In contrast, Lozupone & Knight (2007) analyzed sequences of more than 100 environments with regard to their phylogenetic distance and found a strong correlation between bacterial diversity and salinity but no correlation with pH. Also, bacterial diversity was found to be determined by sediment mineral chemistry and temperature, respectively, comparing four clone libraries from acidic (pH around 1.2) thermal springs (Mathur et al., 2007). Consequently, there is thus far no consistent picture on what determines bacterial diversity but it seems to depend on the environmental conditions, on the number of sites analyzed, and on the methods applied. Interpretations of ecological diversity indices applied to terminal restriction fragment length polymorphism (T-RFLP) data, for example, were assessed to provide inaccurate estimates of microbial diversities (Bent et al., 2007; Blackwood et al., 2007).
INTRODUCTION
11
1.6 Aims and objectives According to chapter 1.1, methanotrophic communities within the polygonal tundra environments of the Lena Delta are poorly investigated, although MOB play a key role for an understanding of present and future methane fluxes in these environments. The major goal of this study is therefore to investigate the ecology of MOB in polygonal tundra environments of the Lena Delta. Among all abiotic factors, the temperature gradient and the seasonal freeze-thaw cycles are the most extreme one in Siberian active layer profiles and it is known that low temperatures induce processes of microbial adaptation and specialization (Georlette et al., 2004). Besides, the temperature response of MOB is not well understood (chapter 1.4) and it is still unknown whether psychrophilic/psychrotolerant or cold-adapted mesophilic MOB are responsible for methane oxidation at low and subzero temperatures in permafrost sediments (Trotsenko & Khmelenina, 2005). The temperature response of potential methane oxidation rates is therefore an appropriate indication for the level of adaptation and specialization, respectively, within the methanotrophic community in polygonal tundra sites of the Lena Delta. Abundance and potential activity of MOB were reported to dependent on methane concentrations in-situ, water level and oxygen concentrations (chapter 1.4). The vertical and horizontal heterogeneity within polygonal tundra environments, in particular the horizontal gradient between dry polygon rims and wet polygon centres as well as the vertical gradients between zones near surface and near the permafrost table within the active layer are therefore likely to result in a spatial variability of the methanotrophic abundance. In addition, if MOB in Siberian permafrost soils are poorly adapted to the extreme temperature gradient within the active layer, their abundance might as well be limited by the temperature. Composition and diversity of microbial communities influence their stability. A methanotrophic community that is dominated by specialized members and at the same time displays a restricted diversity, for example, is less flexible to react to a changing environment. However, the composition and diversity of MOB in polygonal tundra sites of the Lena Delta are unknown. Also, it is not well understood, what determines the composition and diversity of MOB in general and if these parameters are influenced by the extreme environmental gradients characteristic for Siberian active layer profiles. As part of the entire soil bacterial community, MOB are influenced by the composition and diversity of other bacterial groups such as, for example, fermenting bacteria which deliver the substrates for the microbial methane formation. Also, an understanding of what determines the diversity of the taxonomically and physiologically narrow group of MOB in permafrost soils could be improved by investigating what determines overall soil bacterial diversity in these environments, in particular with regard to the extreme morphological heterogeneity of polygonal tundra habitats. However, little is known about the composition and diversity of the soil
INTRODUCTION
12
bacterial community in high arctic permafrost soils. Some studies revealed a highly abundant bacterial community represented by all known major soil bacterial groups (Zhou et al., 1997; Kobabe, et al., 2004; Steven et al., 2007). Other studies found an extremely diverse bacterial community in high Arctic permafrost and tundra soils from Norway and Canada partly even exceeding bacterial diversities in boreal forest soils (Neufeld & Mohn, 2005; Hansen et al., 2007). However, accordant data for the Lena Delta are missing. As factors that influence microbial diversity remain poorly understood (chapter 1.5), extrapolation from one permafrost environment to another is not possible. An additional aim of this study is therefore to investigate the composition and diversity of the entire soil bacterial community in polygonal tundra sites of the Lena Delta, in particular with regard to influences of vertical and horizontal gradients within a low-centred polygon. In summary, an understanding of the methanotrophic ecology in polygonal tundra sites of the Lena Delta is likely determined by the level of adaptation and spatial variability of MOB as well as by their phylogenetic characteristics in terms of structure and diversity. The following questions are therefore in the centre of this study:
� How does the methanotrophic community in polygonal tundra sites respond to different temperatures?
� How abundant are MOB in polygonal tundra sites? � Is the abundance of MOB spatially variable and what determines this
variability? � What is the composition and diversity of the methanotrophic community and
what determines its diversity in relation to that of the entire soil bacterial community?
� Which are dominant groups within the soil bacterial community possibly driving carbon cycling processes?
INTRODUCTION
13
1.7 Overview of publications and manuscripts
1st Publication (published in 2007 in Environmental Microbiology 9: 107-117): Abundance, distribution and potential activity of methane oxidizing bacteria in permafrost soils from the Lena Delta, Siberia
Authors: Susanne Liebner1) and Dirk Wagner1)
Aims: The aim of this study was to determine the abundance and distribution of MOB in morphologically characteristic sites within the polygonal tundra of Samoylov Island. These sites were mainly distinguished by water regime, micro-relief, grain-size and methane concentrations. Possible factors influencing the abundance and distribution of MOB within these sites were to be discovered. In addition, cell numbers of type I and type II MOB as well as factors that influence their competition were to be identified. Another emphasis of this study was to investigate the temperature response of the methanotrophic community, in particular with regard to the steep temperature gradients between the near surface and the near permafrost table of the active layer. For this purpose, vertical profiles of potential methane oxidation rates were determined at different temperatures ranging from 0-38 °C. Summary: Abundance and potential activity of MOB were up to two orders of magnitude lower in a depressed, water saturated site with oxygen limiting conditions than in a dry and seasonally flooded site, respectively. Absolute cell numbers of MOB in the last two sites varied between 3 x 10⁶ and 1 x 10⁸ cells per gram dry soil. In these two sites, type I MOB were up to one order of magnitude more abundant than type II MOB. The distribution between type I and type II MOB correlated with in-situ methane concentrations but not with in-situ temperatures. The temperature optimum of potential methane oxidation rates shifted from 21 °C near the surface to 4° C near the permafrost table which indicated a psychrophilic community of MOB in active layer depths where temperatures remain < 2 °C. Contribution of co-authors: Dirk Wagner carried out sampling and provided soil physical and chemical parameters of the flood plain. He also contributed with valuable discussion to the interpretation of the results and to the structure of the manuscript.
2nd Publication (submitted to Microbial Ecology): Diversity of aerobic methanotrophic bacteria in a permafrost soil of the Lena Delta, Siberia
Authors: Susanne Liebner1), Katja Rublack1), Torben Stuehrmann2), and Dirk Wagner1)
Aims: The study is based on the results of the first publication aiming at an investigation of methanotrophic composition and diversity and of whether both factors change depending on active layer depth within a polygon rim. Temperature optima of the potential methane oxidation rates within this profile were previously
INTRODUCTION
14
shown to shift between the near surface and the near permafrost table. Methanotrophic composition and diversity were to be determined based on the 16S rRNA as well as on the pmoA gene applying DGGE and cloning and subsequent sequencing and phylogenetic analysis. Summary: With this study we showed that the methanotrophic community detected is restricted to the genera Methylobacter and Methylosarcina with the first clearly dominating in terms of relative abundance. Despite the low number of methanotrophic genera present, we observed a distinct species-level diversity and two new clusters of MOB specific for the permafrost soil of this study. Members of these clusters were closely related to Methylobacter psychrophilus and Methylobacter tundripaludum, both isolated from arctic soils. A comparison between near surface and near permafrost table samples showed that the species-level diversity did not change with depth. This was in contrast to the abundance of MOB that vertically decreased. It was therefore concluded, that abundance and diversity of MOB in the studied profile are determined by different factors. Contribution of co-authors: Katja Rublack provided the pmoA sequences. TorbenStuehrmann built up the pmoA gene database and incorporated it into ARB. He also participated in the phylogenetic analysis of 16S rRNA and pmoA gene sequences. Dirk Wagner contributed with valuable discussion to the interpretation of the results and reworked parts of the manuscript.
3rd Publication (in preparation): Composition and diversity of soil bacterial communities in polygonal tundra sites of the Lena Delta, Siberia, with particular focus on the Bacteroidetesphylum
Authors: Susanne Liebner1), Jens Harder2), and Dirk Wagner1) Aims: With this study, the composition and diversity of the soil bacterial community within a low-centred polygon on Samoylov Island was to be investigated. Major bacterial groups possibly driving carbon cycling processes were to be recovered and quantified. Besides, the study aimed at investigating whether the spatial heterogeneity within low-centred polygons influences the diversity and composition of the bacterial community. For this purpose, four sites within the polygon, polygon rim, polygon centre, near the surface and near the permafrost table, were analyzed and compared with regard to their species-level diversities. Summary: The soil bacterial community studied here was represented by all major soil bacterial groups and displayed an immense level of species diversity. For the first time, we detected a variety of rare phyla in permafrost soils and found a dominance of the Bacteroidetes-Chlorobi super-phylum within the bacterial community. In particular the group of Bacteroidetes was extremely abundant and displayed a high number of micro-diverse sequence clusters. It was therefore suggested to primarily contribute to carbon cycling processes within the studied
INTRODUCTION
15
polygon. On the species-level, the soil bacterial diversity changed significantly depending on the site within the polygon, although abiotic factors such as pH and salinity that were reported elsewhere to primarily influence bacterial diversity, were similar in all sites. According to this, the bacterial diversity does not only change on broad environmental and geographical scales but also on small scales. Here, the soil bacterial diversity was influenced by concentrations of DOC, TC, nutrients, total bacterial abundance and temperature. We concluded that the species-level diversity of the soil bacterial community within the low-centred polygon is primarily influenced by the competition for the available resources. Contribution of co-authors: Jens Harder contributed to the experimental set-up and to the analysis of the results. Dirk Wagner contributed to the interpretation of the results and provided valuable corrections of the manuscript.
4th Publication (co-authorship, in preparation, manuscript in chapter 8.1) Temperature adaptation of microbial populations in different horizons of permafrost soils from the Lena Delta, Siberia
Authors: Kai Mangelsdorf3), Elke Finsel4), Susanne Liebner1), and Dirk Wagner1) Aims: The aim of this study was to investigate the cell membrane phospholipid inventory of microbial populations within different horizons of a Siberian active layer in order to examine whether these populations are adapted to the variable temperature regime of permafrost soils. For this purpose, active layer samples from a near surface and a near permafrost table horizon were incubated at 4 and 28 °C, respectively, and subsequently analyzed according to the quantity and quality of the phospholipid cell membrane’s composition of the indigenous microbial population. Summary: Samples of the permafrost near horizon were found to contain on average more unsaturated and short chain fatty acids than the samples of the near surface horizon. This pointed at a microbial population near the permafrost table that is more adapted to lower temperatures than the population near the surface. However, in both horizons incubation at 4 °C led to a similar shift to higher proportions of short chain fatty acids indicating that the adaptation of permafrost microbial populations within different active layer horizons to varying temperatures is regulated by the chain lengths of the cell membrane phospholipid fatty acids. Personal contribution: My personal contribution to this study consisted of valuable input to its concept and experimental set up.
List of author’s affiliations: 1)Alfred Wegener Institute for Polar and Marine Microbiology, Research Department Potsdam, Potsdam, Germany 2)Max Planck Institute for Marine Microbiology, Bremen, Germany 3)GeoForschungsZentrum Potsdam, Potsdam, Germany 4)Freie Universität Berlin, Berlin, Germany
STUDY AREA
16
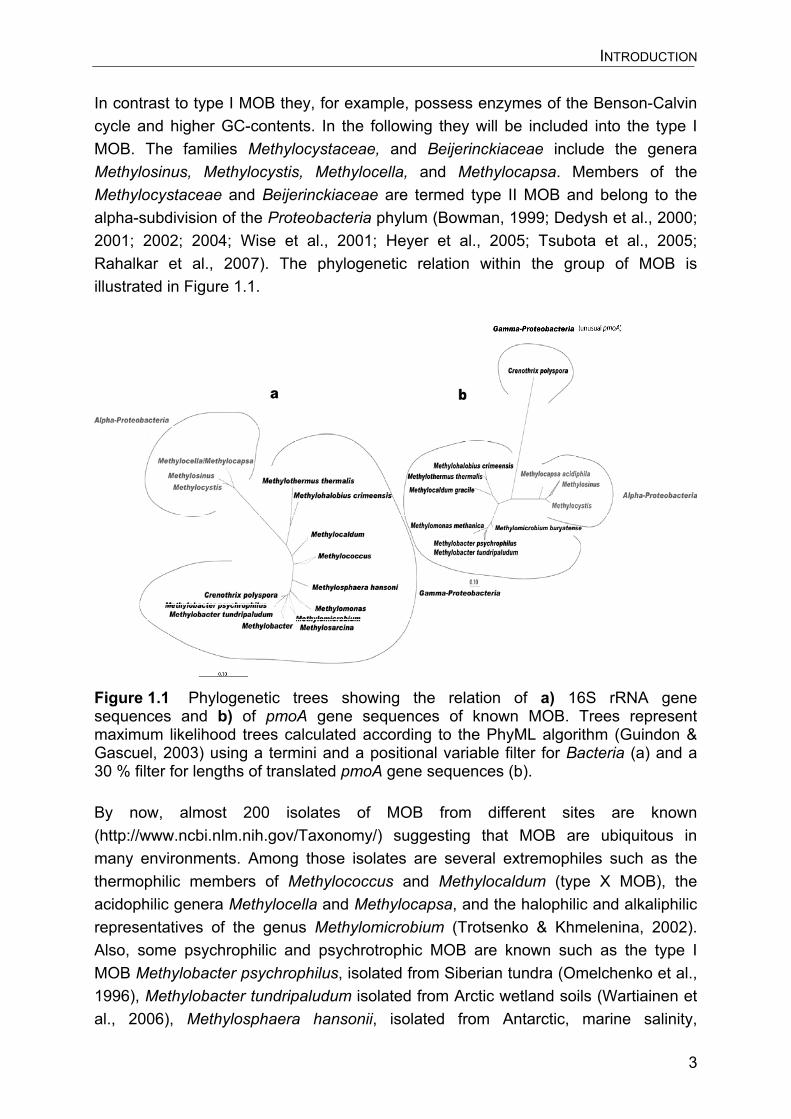
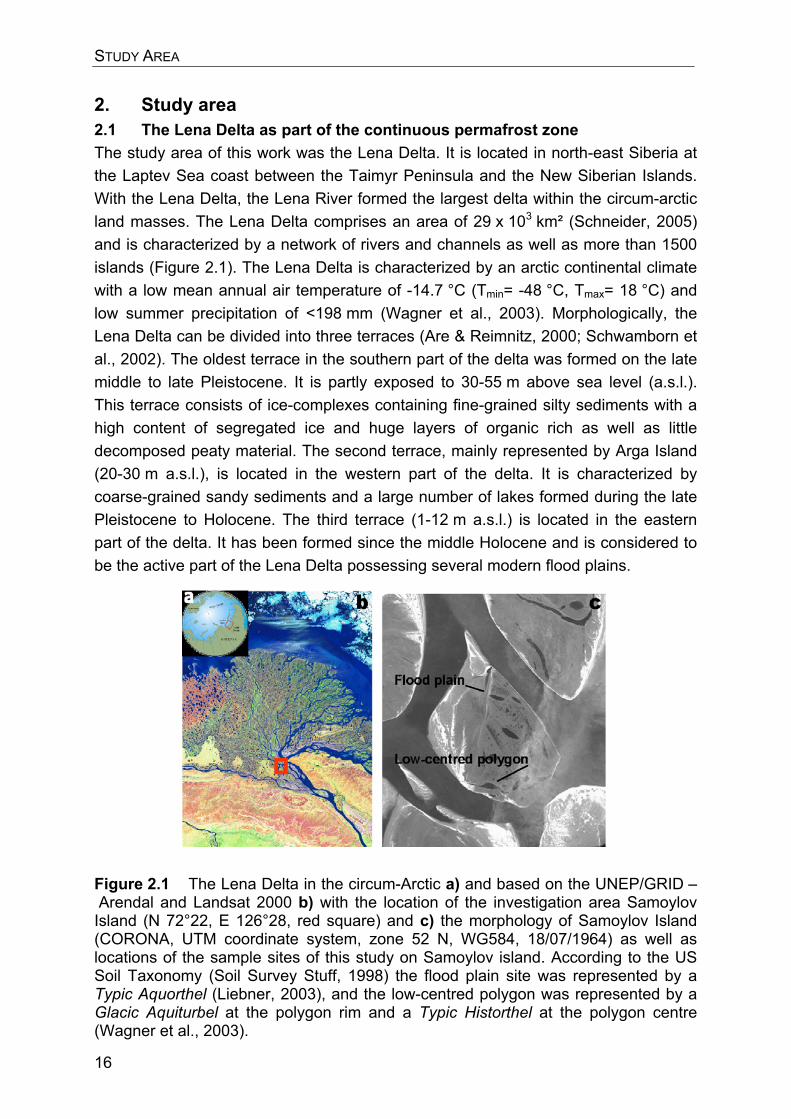
2. Study area 2.1 The Lena Delta as part of the continuous permafrost zone The study area of this work was the Lena Delta. It is located in north-east Siberia at the Laptev Sea coast between the Taimyr Peninsula and the New Siberian Islands. With the Lena Delta, the Lena River formed the largest delta within the circum-arctic land masses. The Lena Delta comprises an area of 29 x 103 km² (Schneider, 2005) and is characterized by a network of rivers and channels as well as more than 1500 islands (Figure 2.1). The Lena Delta is characterized by an arctic continental climate with a low mean annual air temperature of -14.7 °C (Tmin= -48 °C, Tmax= 18 °C) and low summer precipitation of <198 mm (Wagner et al., 2003). Morphologically, the Lena Delta can be divided into three terraces (Are & Reimnitz, 2000; Schwamborn et al., 2002). The oldest terrace in the southern part of the delta was formed on the late middle to late Pleistocene. It is partly exposed to 30-55 m above sea level (a.s.l.). This terrace consists of ice-complexes containing fine-grained silty sediments with a high content of segregated ice and huge layers of organic rich as well as little decomposed peaty material. The second terrace, mainly represented by Arga Island (20-30 m a.s.l.), is located in the western part of the delta. It is characterized by coarse-grained sandy sediments and a large number of lakes formed during the late Pleistocene to Holocene. The third terrace (1-12 m a.s.l.) is located in the eastern part of the delta. It has been formed since the middle Holocene and is considered to be the active part of the Lena Delta possessing several modern flood plains.
Figure 2.1 The Lena Delta in the circum-Arctic a) and based on the UNEP/GRID – Arendal and Landsat 2000 b) with the location of the investigation area Samoylov Island (N 72°22, E 126°28, red square) and c) the morphology of Samoylov Island (CORONA, UTM coordinate system, zone 52 N, WG584, 18/07/1964) as well as locations of the sample sites of this study on Samoylov island. According to the US Soil Taxonomy (Soil Survey Stuff, 1998) the flood plain site was represented by a Typic Aquorthel (Liebner, 2003), and the low-centred polygon was represented by a Glacic Aquiturbel at the polygon rim and a Typic Historthel at the polygon centre (Wagner et al., 2003).
STUDY AREA
17
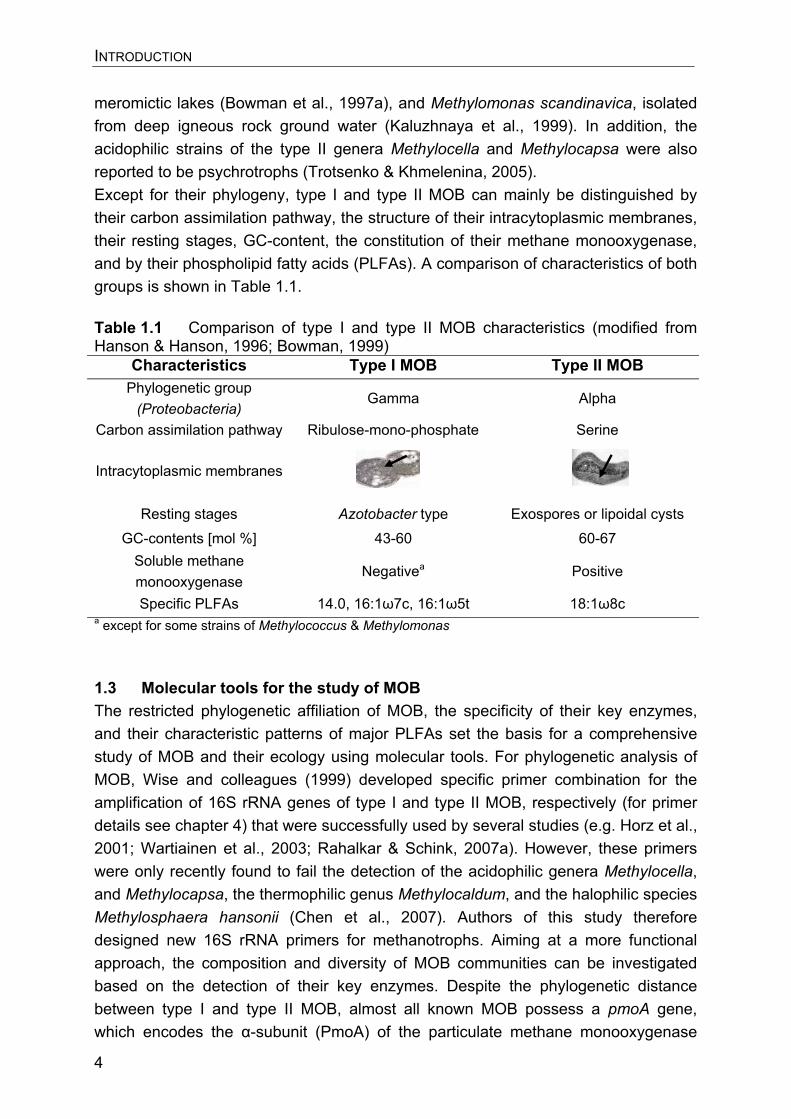
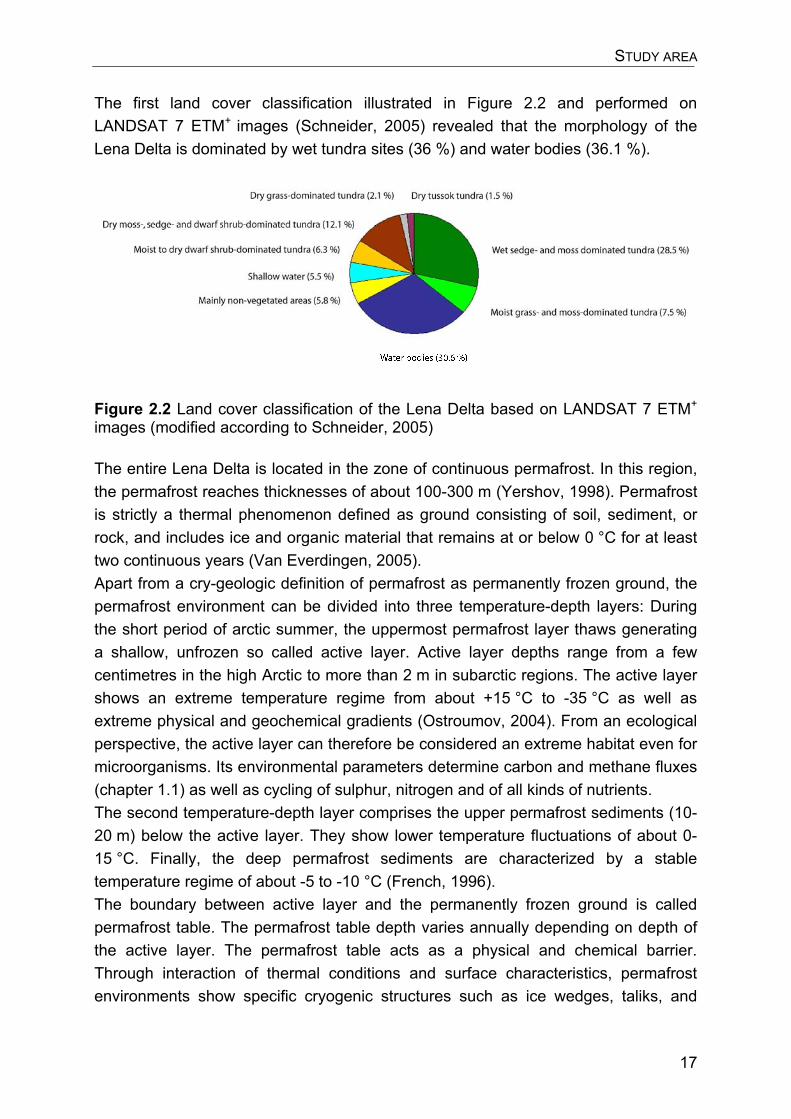
The first land cover classification illustrated in Figure 2.2 and performed on LANDSAT 7 ETM+ images (Schneider, 2005) revealed that the morphology of the Lena Delta is dominated by wet tundra sites (36 %) and water bodies (36.1 %).
Figure 2.2 Land cover classification of the Lena Delta based on LANDSAT 7 ETM+ images (modified according to Schneider, 2005) The entire Lena Delta is located in the zone of continuous permafrost. In this region, the permafrost reaches thicknesses of about 100-300 m (Yershov, 1998). Permafrost is strictly a thermal phenomenon defined as ground consisting of soil, sediment, or rock, and includes ice and organic material that remains at or below 0 °C for at least two continuous years (Van Everdingen, 2005). Apart from a cry-geologic definition of permafrost as permanently frozen ground, the permafrost environment can be divided into three temperature-depth layers: During the short period of arctic summer, the uppermost permafrost layer thaws generating a shallow, unfrozen so called active layer. Active layer depths range from a few centimetres in the high Arctic to more than 2 m in subarctic regions. The active layer shows an extreme temperature regime from about +15 °C to -35 °C as well as extreme physical and geochemical gradients (Ostroumov, 2004). From an ecological perspective, the active layer can therefore be considered an extreme habitat even for microorganisms. Its environmental parameters determine carbon and methane fluxes (chapter 1.1) as well as cycling of sulphur, nitrogen and of all kinds of nutrients. The second temperature-depth layer comprises the upper permafrost sediments (10-20 m) below the active layer. They show lower temperature fluctuations of about 0-15 °C. Finally, the deep permafrost sediments are characterized by a stable temperature regime of about -5 to -10 °C (French, 1996). The boundary between active layer and the permanently frozen ground is called permafrost table. The permafrost table depth varies annually depending on depth of the active layer. The permafrost table acts as a physical and chemical barrier. Through interaction of thermal conditions and surface characteristics, permafrost environments show specific cryogenic structures such as ice wedges, taliks, and
STUDY AREA
18
cryopegs as well as typical ground patterns of polygonal tundra environments (French, 1996). 2.2 Samoylov Island and its polygonal tundra environments The actual study site of the present work within the Lena Delta is Samoylov Island. With an age of 8000-9000 years, Samoylov is representative for the currently active part of the Lena Delta. Its size was estimated to be in the range of 5.5 to 6 km² (W. Schneider, personal communication). The island can be divided into a western and an eastern part. The west coastline of the island is periodically flooded and is characterized by current accumulation of fluvial and aeolian sediment. It can be distinguished into three flooding planes varying in frequency of flooding and type of vegetation. Eastern Samoylov is flooded only under extreme water level conditions of the Lena River and is characterized by massive coastal erosion. Moreover, the morphology of eastern Samoylov is dominated by the typical patterned ground of polygonal tundra, which covers at least 70 % of the island. Polygonal tundra environments are characterized by polygonal lakes, and high- and low-centred polygons with the first being a succession state of the last (French, 1996).
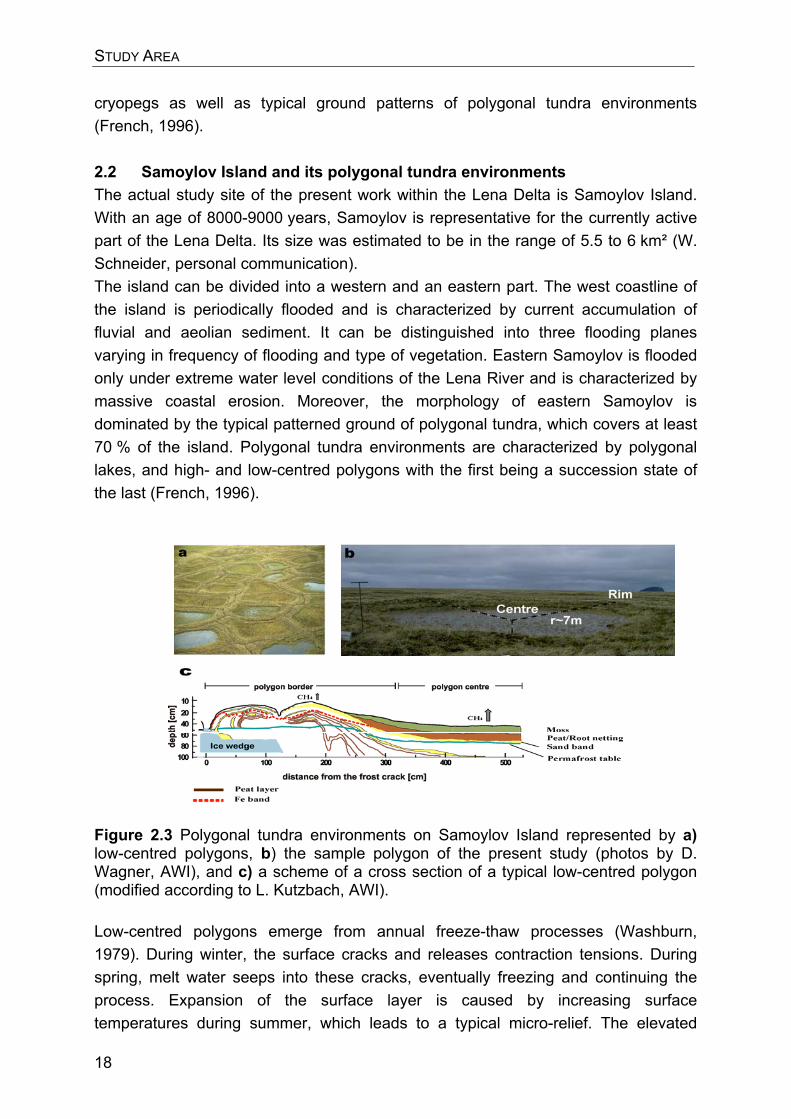
Figure 2.3 Polygonal tundra environments on Samoylov Island represented by a) low-centred polygons, b) the sample polygon of the present study (photos by D. Wagner, AWI), and c) a scheme of a cross section of a typical low-centred polygon (modified according to L. Kutzbach, AWI).
Low-centred polygons emerge from annual freeze-thaw processes (Washburn, 1979). During winter, the surface cracks and releases contraction tensions. During spring, melt water seeps into these cracks, eventually freezing and continuing the process. Expansion of the surface layer is caused by increasing surface temperatures during summer, which leads to a typical micro-relief. The elevated
STUDY AREA
19
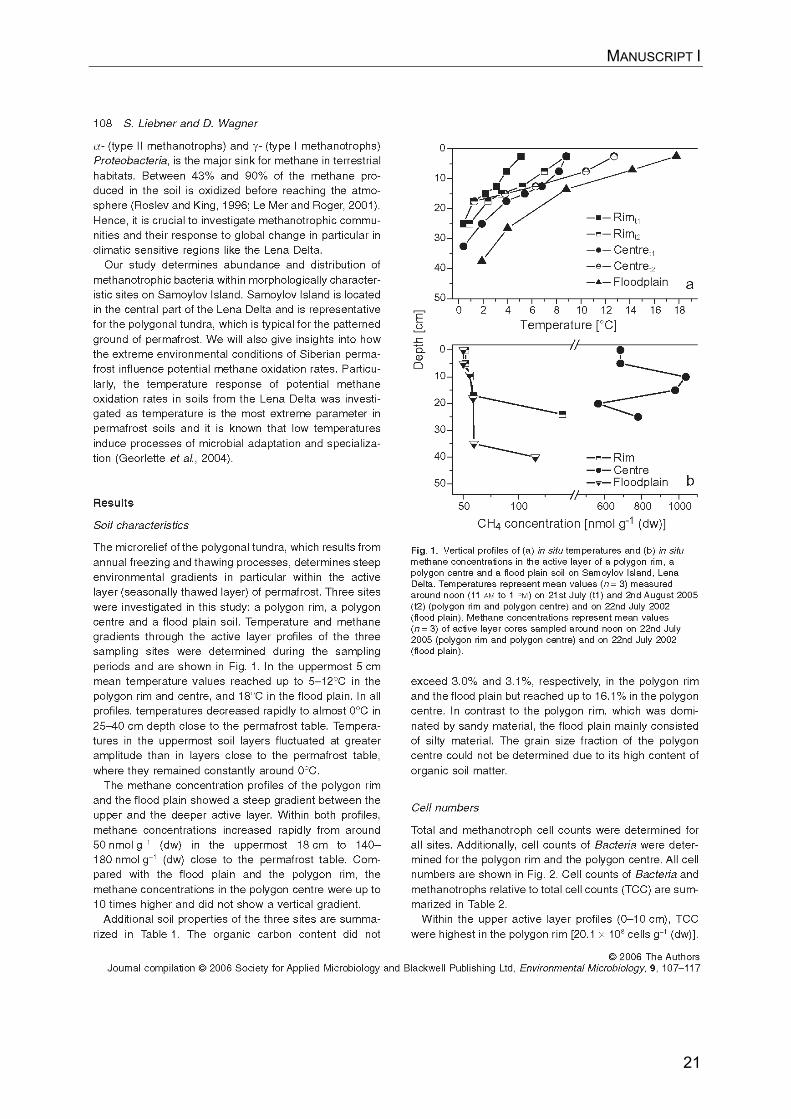
periphery is thereby termed polygon rim. Vertical concentrations of methane vary between the polygon rims and the polygon centres (chapter 3). Compared to the rim, methane concentrations are significantly higher within the active layer of the polygon centre where they vertically also fluctuate less than in the rim. The morphology of the typical patterned ground of polygonal tundra as well as a cross section illustrating a schematic low-centred polygon are illustrated in Figure 2.3a and 2.3c. One such low-centred polygon was in the focus of this study (Figure 2.3b). Another site investigated was located in the northern part of Samoylov on a flood plain. This flood plain represents the lowland areas on Samoylov Island. Location of the sample sites on Samoylov is shown in Figure 2.1c. A detailed description of the sample sites is given in chapter 3.
MANUSCRIPT I
20
3. Manuscript I (published in Environmental Microbiology)
MANUSCRIPT I
21
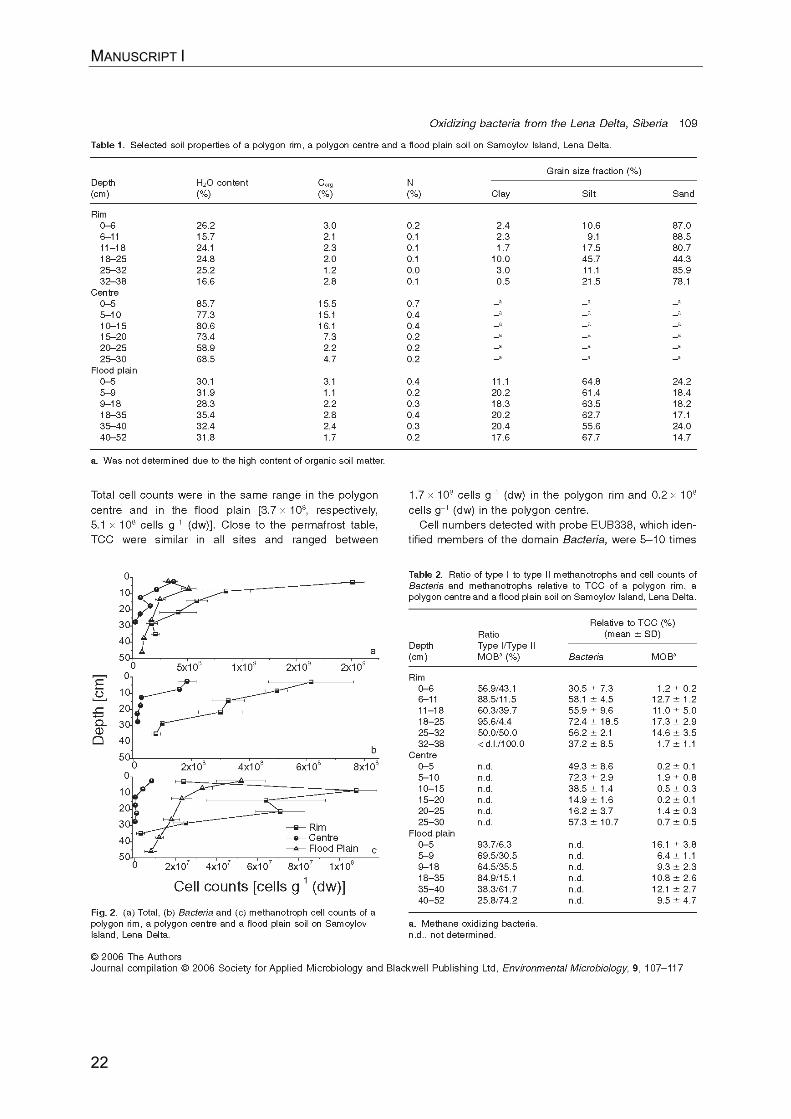
MANUSCRIPT I
22
MANUSCRIPT I
23
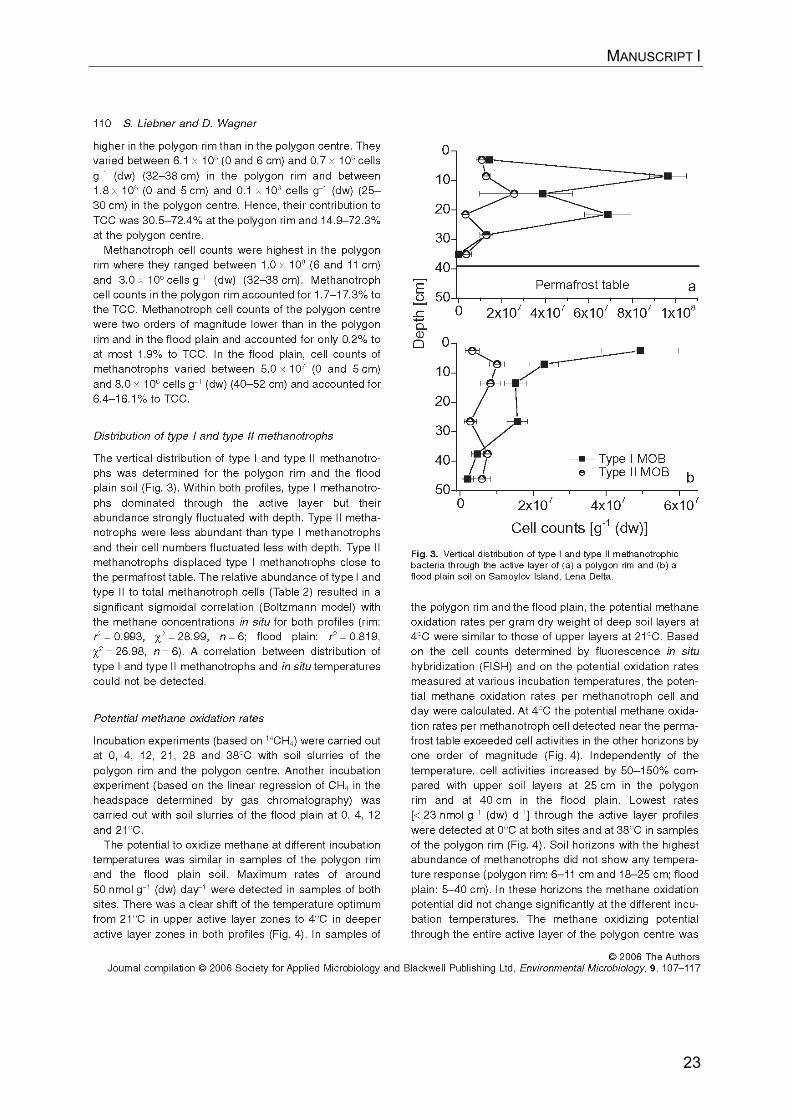
MANUSCRIPT I
24
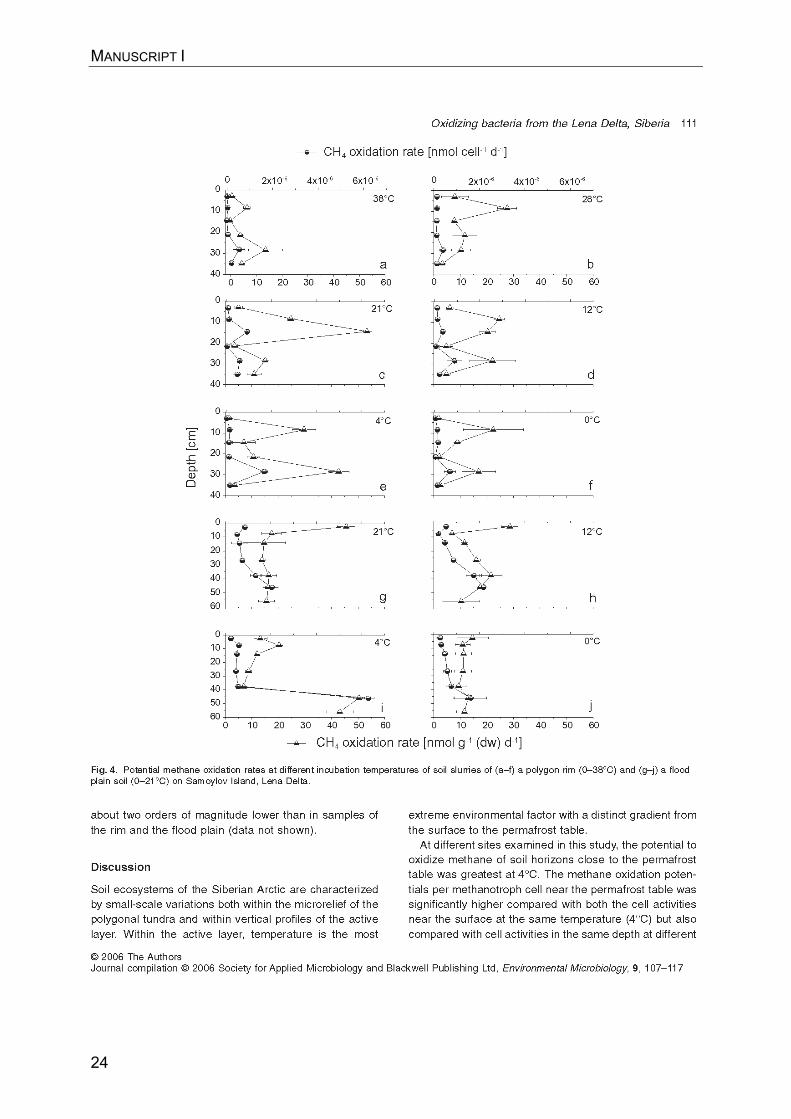
MANUSCRIPT I
25
MANUSCRIPT I
26
MANUSCRIPT I
27
MANUSCRIPT I
28
MANUSCRIPT I
29
MANUSCRIPT II
30
4. Manuscript II (submitted to Microbial Ecology, MECO-2007-0322) Diversity of aerobic methanotrophic bacteria in a permafrost soil of the Lena Delta, Siberia Susanne Liebner1*, Katja Rublack1, Torben Stuehrmann2, and Dirk Wagner1
1Alfred Wegener Institute for Polar and Marine Research, Research Department Potsdam, Telegrafenberg A43, 14473 Potsdam, Germany 2 Max Planck Institute for Marine Microbiology, Celsiusstrasse 1, 28359 Bremen, Germany *Fax: +49 331 288 2137, Tel: +49 331 288 2142, Email: [email protected]
With this study, we present first data on the diversity of aerobic methane oxidizing bacteria (MOB) in arctic permafrost environments of the Lena Delta, Siberia. Applying DGGE and cloning of 16S rRNA and pmoA gene fragments of active layer samples we found a general restriction of the methanotrophic diversity to sequences closely related to the genera Methylobacter and Methylosarcina. In contrast, we revealed a distinct species-level diversity. Based on phylogenetic analysis of the 16S rRNA gene, two new clusters of MOB specific for the permafrost soil of this study were found. In total, 8 out of 13 operational taxonomic units (OTU) detected belong to these clusters. Members of these clusters were closely related to Methylobacter psychrophilus and Methylobacter tundripaludum, both isolated from arctic environments. A dominance of MOB closely related to Methylobacter psychrophilus and Methylobacter tundripaludum was confirmed by an additional pmoA gene analysis. We used diversity indices such as the Shannon diversity index or the Chao1 richness estimator in order to compare the MOB community near the surface and near the permafrost table. We determined an equal diversity of the MOB community in both depths and suggest that it is not influenced by the extreme physical and geochemical gradients in the active layer.
IntroductionAerobic methanotrophic bacteria (MOB) primarily contribute to the consumption of methane in terrestrial environments. The microbial conversion of methane into carbon dioxide was estimated to account for 30 to 90 % in flooded rice fields [1, 2] for 13 to 38 % of the methane produced in temperate and sub-arctic peat soils [13], and for 15 to more than 90 % of the diffusive methane flux in wetlands [36, 47]. The group of MOB comprises the three families Methylococcaceae, Methylocystaceae, and Beijerinckiaceae [5, 9, 10, 11, 12]. The only exception is Crenothrix polyspora, a filamentous, sheathed micro-organism recently discovered to be methanotrophic [52].
MANUSCRIPT II
31
Members of the Methylococcaceae are termed type I MOB and belong to the �-subdivision of the Proteobacteria phylum. Members of the Methylocystaceae, and Beijerinckiaceae are termed type II MOB and belong to the �-subdivision of the Proteobacteria phylum [10, 11, 21]. The diversity and composition of MOB was investigated in several environments such as freshwater sediments [8, 42], in landfill soils [59], in rice field soils [22, 24], in habitats with atmospheric methane concentrations [29, 33, 35], and in peat bogs with very low pH values [39, 40]. Northern wetlands and tundra contribute about 20 % to the global natural methane emission annually [6, 7, 18]. Given, that the global warming potential of methane on a molecular basis and a time horizon of 100 years is 23-fold that of carbon dioxide [27], the ecology of the MOB community as the major sink for methane in these environments is of importance. Methanotrophic communities were found to be abundant and active also in cold environments such as for example northern peat lands, eastern Antarctica, and Fennoscandian deep ground waters [53]. It was reported that MOB are viable in deep Siberian permafrost sediments with ages of 1000-100,000 years as well [32]. In addition, based on the temperature response of potential methane oxidation rates, it was recently shown that methane oxidizing bacteria are well adapted to the temperature regime in permafrost soils of the Lena Delta [37]. However, our knowledge on MOB from high latitude environments in terms of diversity and composition remains very poor [56]. With this study, we present first data on the methanotrophic diversity (richness and evenness) in arctic tundra soils of the Lena Delta with steep gradients of temperature and methane. In addition to the 16S rRNA gene, we analyzed the phylogeny of the particulate methane monooxygenase gene (pmoA), known as a functional marker for MOB [40]. With this study we will show to what extent the methanotrophic diversity is influenced by the harsh environmental conditions in Siberian permafrost soils.
Materials and Methods Study site The study site is located in the eastern part of Samoylov Island (N 72°22, E 126°28) in the Lena Delta, Siberia. For a detailed description of the geomorphology of the Lena Delta refer to Schwamborn et al. [50]. During the expedition LENA 2005 (07th of July to 1st of September), active layer cores (ø 56 mm) of a low-centred polygon were sampled. The cores were frozen immediately after sampling and were kept frozen until further processing. For this study, we used core number 33, sampled on the 25th of August, 2005, at the rim of the polygon. In the lab, the core was sectioned under sterile conditions and samples of depths 6-11 cm (near surface) and 20-28 cm (near permafrost table) were selected for molecular analysis. Selection of these samples was according to a previously observed shift in the temperature optima of potential methane oxidation rates between the near surface and the near permafrost table within the active layer of the polygon rim [37].
MANUSCRIPT II
32
Soil and pore water analysis Vertical profiles of soil CH4 concentrations were obtained from the elevated rim of the polygon through extraction of CH4 from soil pore water by injection of 5 ml water into saturated NaCl solution, shaking the solution and subsequently analyzing the CH4 headspace concentration with gas chromatography. Soil temperature measurements (Greisinger GTH 100/2 equipped with Ni-Cr-Ni temperature sensor) were carried out in 5-cm increments from 0 to 38 cm soil depth before core sampling. The total carbon (TC) and total nitrogen (TN) contents were determined with an automatic element analyzer (Elementar VARIO EL III). The total organic carbon (TOC) content was measured on corresponding samples after HCl (10%) acid digestion to remove the carbonate on the same analyzer (Elementar VARIO EL III). The pH values were determined with the MultiLab 540 (WTW, Germany) in pore water, which was extracted applying Rhizons into undisturbed active layer samples according to the method of Seeberg-Elverfeldt and colleagues [51]. Cell counts of MOB were obtained based on fluorescence in-situ hybridization with the MOB specific probes Mg705/Mg84 (type I MOB) and Ma450 (type II MOB), respectively [15], according to a protocol described recently [37]. Extraction of total DNA Previous to the DNA extraction, the core sections were thoroughly homogenized. Afterwards, four parallels of each depth were used for extraction. Total genomic DNA was extracted with the UltraCleanTM Soil and the PowerSoilTM DNA Isolation Kit (Mo Bio Laboratories Inc., US) following to the manufacture’s protocol. Both kits combine heat, detergents and mechanical force against beads to lyse microbial cells. The released DNA is then bound to a silica spin filter and finally purified. The PowerSoilTM DNA Isolation Kit is intended for use with environmental samples containing a high humic acid content. Size of the genomic DNA was checked by electrophoresis on a 1 % agarose gel against a Lamda EcoRI/HindIII marker (ABgene, UK) with SYBR Gold staining. PCR amplification PCR amplification reactions were performed with a Thermal Cycler (iCycler, Bio-Rad, US). PCR reaction mixes (50 μl for DGGE, 25 μl for clone libraries) contained 1xPCR reaction buffer, 0.2 μM primer, 0.25 μM dNTPs, 1.25 U MasterTaq Polymerase (Eppendorf, Germany) and 5-30 ng Template (in a 1:10 dilution). All reactions were optimized against MgCl2 and PCR enhancer solution (Eppendorf, Germany). Primer details are listed in Table 1. PCR conditions were as follows: 94 °C for 3 min (initial denaturation), followed by 30 cycles (for DGGE) respectively 20 cycles (for clone libraries) of 94 °C for 30 s, 56 °C for 1 min, and 72 °C for 3 min, and by a final elongation at 72 °C for 10 min (DGGE) respectively 60 °min (for clone libraries). For the amplification of the pmoA gene, a nested PCR approach (A189 F / A682 R
MANUSCRIPT II
33
followed by A189 F / mb661 R / A650 R) as suggested by Horz et al. [29] was compared with a direct PCR approach (A189 F / mb661 R / A650 R). Because the nested approach did not improve DGGE or cloning efficiency but was likely to increase PCR bias and contamination by amoA gene sequences, the direct approach was chosen for the analysis. PCR products were checked by electrophoresis on a 2 % agarose gel against a 100 bp marker (MoBiTec, Germany) with SYBR Gold staining. For DGGE, PCR products were purified with a QIAquick PCR Purification Kit (Qiagen, Germany). For clone libraries, PCR products in plates (96 well plates, ABgene, UK) were purified by centrifugation (980 g at 4 °C) through Multi Screen 96 well plates (Millipore, US) on a column of SephadexTM G-50 Superfine powder (GE Healthcare Bio-Science, Sweden). Denaturing gradient gel electrophoresis (DGGE) PCR products were separated on an 8 % polyacrylamide gel in 1xTAE buffer using a D-Code System (Bio-Rad, US). The denaturing gradient ranged from 30 to 60 % respectively 40 to 70 % (100 % denaturant consisted of 7 M urea and 40 %, v/v, deionized formamide). Gradient gel electrophoresis ran constantly at 100 V for 14 h at 60 °C. The gels were stained for 30 min with SYBR Gold and visualized with a GeneFlash system (Syngene, UK). Distinct bands were excised with a sterile scalpel, eluted over night at 4 °C and re-amplified with primers without GC-clamp in 20-25 cycles. Products were purified as described and sequenced by MWG (Germany). Construction of clone libraries and sequencing The purified PCR products were ligated into the linear Plasmid Vector pCR4 supplied with the TOPO TA CloningR Kit for Sequencing (Invitrogen, Germany) and subsequently transformed into chemical competent E. coli cells via heat-shock following the manufacture’s protocol. Cells were incubated over night at 37 °C on agar plates containing 0.05 % Ampicillin. Only cells containing a Vector with insert were competent to grow with Ampicillin. Colonies of these cells were screened for correct size of the insert and directly sequenced. Sequencing was performed with the BigDye Terminator cycle sequencing kit, version 3.1 (Applied Biosystems, Germany) with vector primers. Sequence analysis Sequences of the 16S rRNA gene were automatically and manually edited with Sequencing Analysis 5.2 (Applied Biosystems) and checked for chimeras with Bellerophon [30] and with the Chimera-Check of the Ribosomal Database Project (Michigan State University). Contigs were assembled with Sequencher 4.7 (Gene
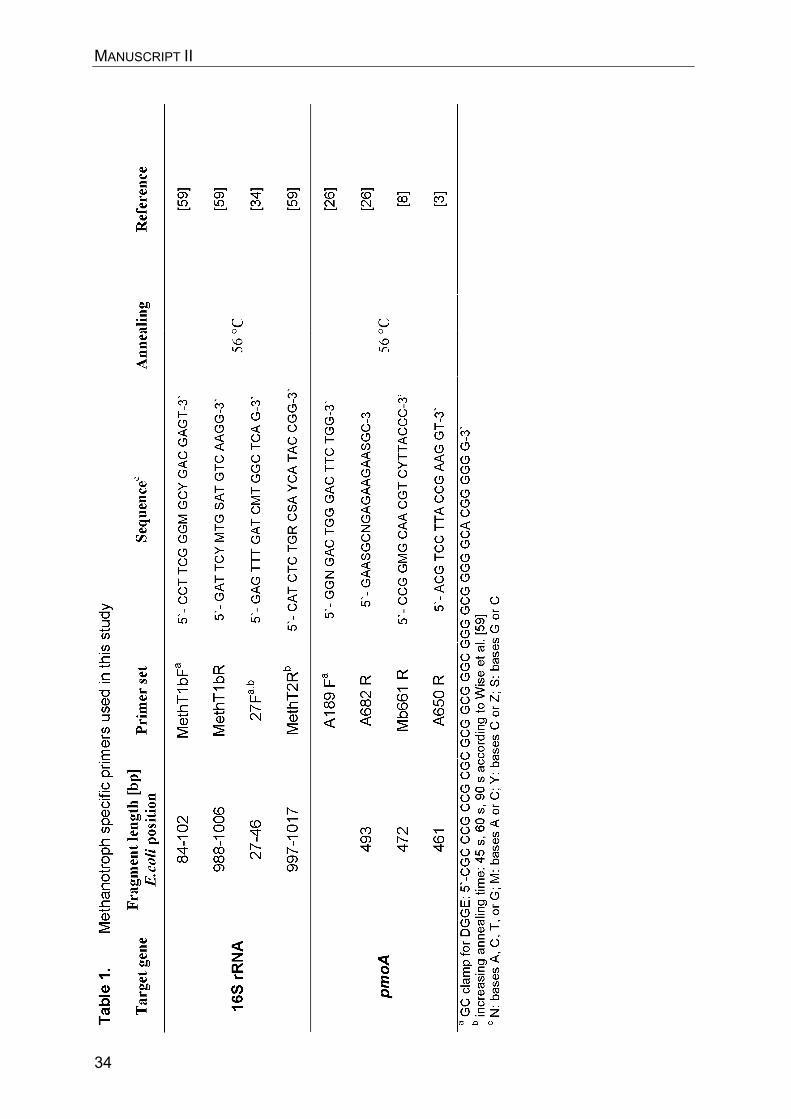
MANUSCRIPT II
34
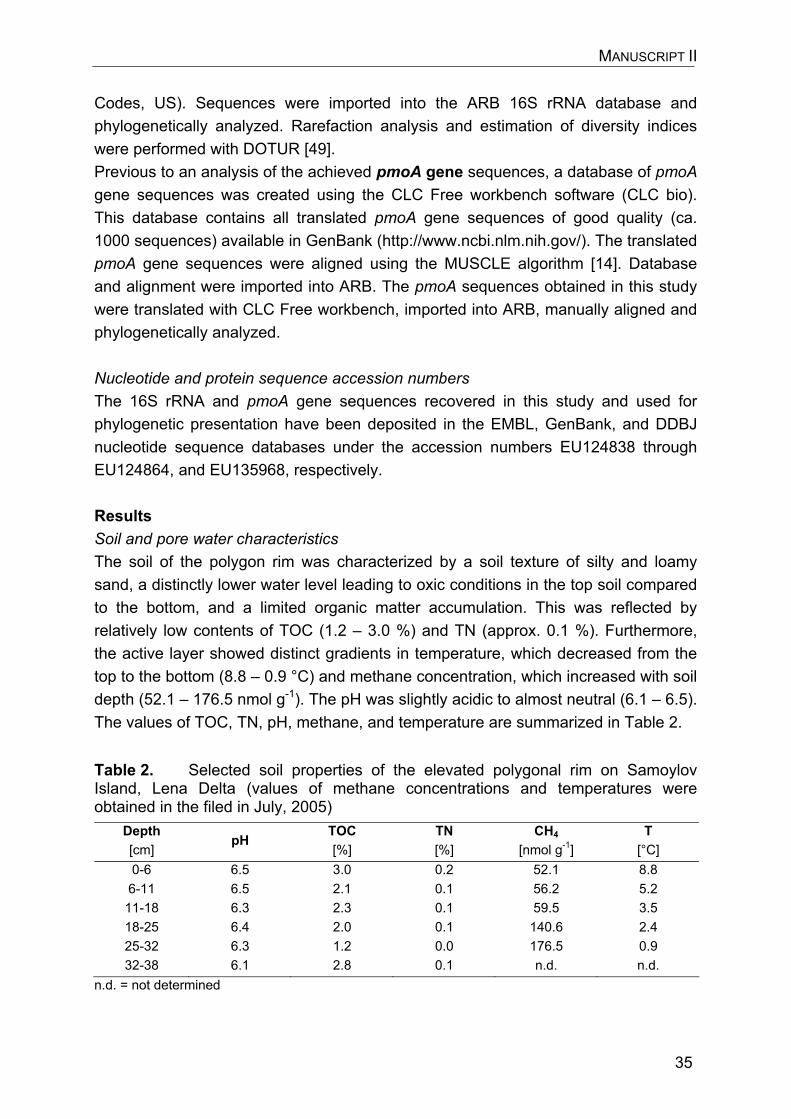
MANUSCRIPT II
35
Codes, US). Sequences were imported into the ARB 16S rRNA database and phylogenetically analyzed. Rarefaction analysis and estimation of diversity indices were performed with DOTUR [49]. Previous to an analysis of the achieved pmoA gene sequences, a database of pmoA gene sequences was created using the CLC Free workbench software (CLC bio). This database contains all translated pmoA gene sequences of good quality (ca. 1000 sequences) available in GenBank (http://www.ncbi.nlm.nih.gov/). The translated pmoA gene sequences were aligned using the MUSCLE algorithm [14]. Database and alignment were imported into ARB. The pmoA sequences obtained in this study were translated with CLC Free workbench, imported into ARB, manually aligned and phylogenetically analyzed. Nucleotide and protein sequence accession numbers The 16S rRNA and pmoA gene sequences recovered in this study and used for phylogenetic presentation have been deposited in the EMBL, GenBank, and DDBJ nucleotide sequence databases under the accession numbers EU124838 through EU124864, and EU135968, respectively. Results Soil and pore water characteristics The soil of the polygon rim was characterized by a soil texture of silty and loamy sand, a distinctly lower water level leading to oxic conditions in the top soil compared to the bottom, and a limited organic matter accumulation. This was reflected by relatively low contents of TOC (1.2 – 3.0 %) and TN (approx. 0.1 %). Furthermore, the active layer showed distinct gradients in temperature, which decreased from the top to the bottom (8.8 – 0.9 °C) and methane concentration, which increased with soil depth (52.1 – 176.5 nmol g-1). The pH was slightly acidic to almost neutral (6.1 – 6.5). The values of TOC, TN, pH, methane, and temperature are summarized in Table 2.
Table 2. Selected soil properties of the elevated polygonal rim on Samoylov Island, Lena Delta (values of methane concentrations and temperatures were obtained in the filed in July, 2005)
Depth [cm]
pHTOC[%]
TN[%]
CH4
[nmol g-1] T
[°C] 0-6 6.5 3.0 0.2 52.1 8.8 6-11 6.5 2.1 0.1 56.2 5.2 11-18 6.3 2.3 0.1 59.5 3.5 18-25 6.4 2.0 0.1 140.6 2.4 25-32 6.3 1.2 0.0 176.5 0.9 32-38 6.1 2.8 0.1 n.d. n.d.
n.d. = not determined
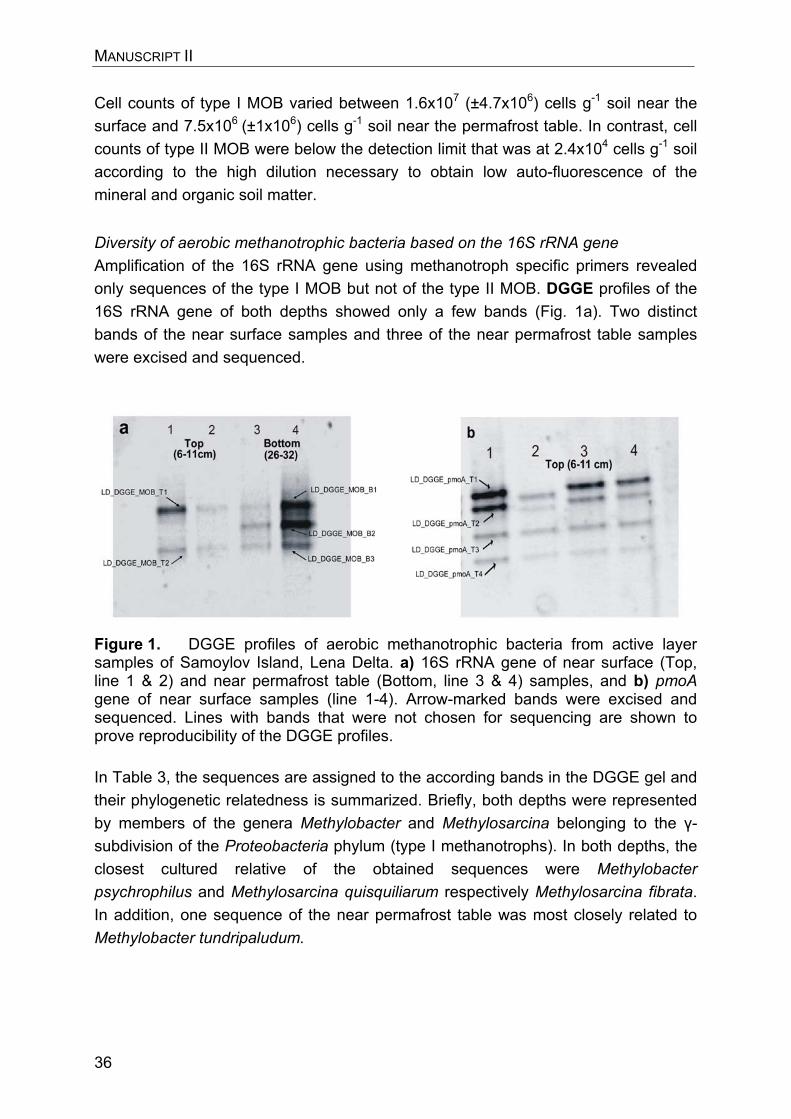
MANUSCRIPT II
36
Cell counts of type I MOB varied between 1.6x10⁷ (±4.7x10⁶) cells g-1 soil near the surface and 7.5x10⁶ (±1x10⁶) cells g-1 soil near the permafrost table. In contrast, cell counts of type II MOB were below the detection limit that was at 2.4x10⁴ cells g-1 soil according to the high dilution necessary to obtain low auto-fluorescence of the mineral and organic soil matter.
Diversity of aerobic methanotrophic bacteria based on the 16S rRNA gene Amplification of the 16S rRNA gene using methanotroph specific primers revealed only sequences of the type I MOB but not of the type II MOB. DGGE profiles of the 16S rRNA gene of both depths showed only a few bands (Fig. 1a). Two distinct bands of the near surface samples and three of the near permafrost table samples were excised and sequenced.
Figure 1. DGGE profiles of aerobic methanotrophic bacteria from active layer samples of Samoylov Island, Lena Delta. a) 16S rRNA gene of near surface (Top, line 1 & 2) and near permafrost table (Bottom, line 3 & 4) samples, and b) pmoA gene of near surface samples (line 1-4). Arrow-marked bands were excised and sequenced. Lines with bands that were not chosen for sequencing are shown to prove reproducibility of the DGGE profiles. In Table 3, the sequences are assigned to the according bands in the DGGE gel and their phylogenetic relatedness is summarized. Briefly, both depths were represented by members of the genera Methylobacter and Methylosarcina belonging to the �-subdivision of the Proteobacteria phylum (type I methanotrophs). In both depths, the closest cultured relative of the obtained sequences were Methylobacter psychrophilus and Methylosarcina quisquiliarum respectively Methylosarcina fibrata. In addition, one sequence of the near permafrost table was most closely related to Methylobacter tundripaludum.
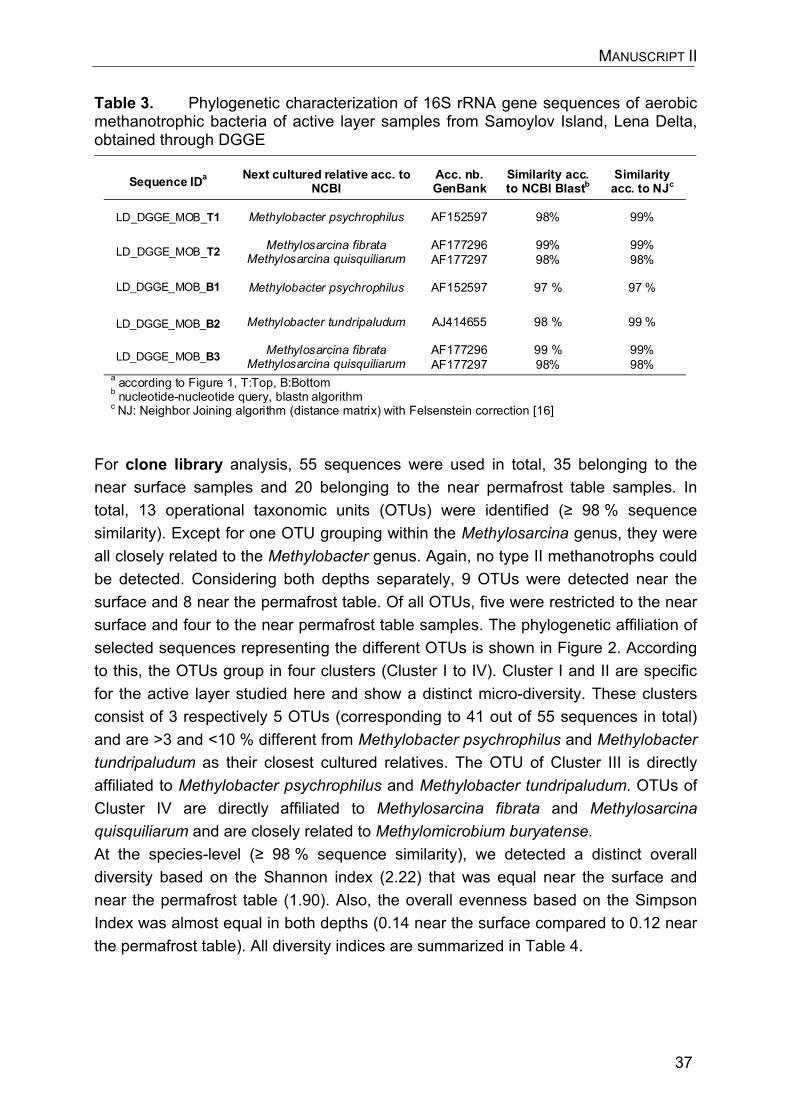
MANUSCRIPT II
37
Table 3. Phylogenetic characterization of 16S rRNA gene sequences of aerobic methanotrophic bacteria of active layer samples from Samoylov Island, Lena Delta, obtained through DGGE
Sequence IDa Next cultured relative acc. to NCBI
Acc. nb. GenBank
Similarity acc. to NCBI Blastb
Similarity acc. to NJc
LD_DGGE_MOB_T1 Methylobacter psychrophilus AF152597 98% 99%
LD_DGGE_MOB_T2 Methylosarcina fibrata Methylosarcina quisquiliarum
AF177296 AF177297
99% 98%
99% 98%
LD_DGGE_MOB_B1 Methylobacter psychrophilus AF152597 97 % 97 %
LD_DGGE_MOB_B2 Methylobacter tundripaludum AJ414655 98 % 99 %
LD_DGGE_MOB_B3 Methylosarcina fibrata Methylosarcina quisquiliarum
AF177296 AF177297
99 % 98%
99% 98%
a according to Figure 1, T:Top, B:Bottom b nucleotide-nucleotide query, blastn algorithm c NJ: Neighbor Joining algorithm (distance matrix) with Felsenstein correction [16]
For clone library analysis, 55 sequences were used in total, 35 belonging to the near surface samples and 20 belonging to the near permafrost table samples. In total, 13 operational taxonomic units (OTUs) were identified (� 98 % sequence similarity). Except for one OTU grouping within the Methylosarcina genus, they were all closely related to the Methylobacter genus. Again, no type II methanotrophs could be detected. Considering both depths separately, 9 OTUs were detected near the surface and 8 near the permafrost table. Of all OTUs, five were restricted to the near surface and four to the near permafrost table samples. The phylogenetic affiliation of selected sequences representing the different OTUs is shown in Figure 2. According to this, the OTUs group in four clusters (Cluster I to IV). Cluster I and II are specific for the active layer studied here and show a distinct micro-diversity. These clusters consist of 3 respectively 5 OTUs (corresponding to 41 out of 55 sequences in total) and are >3 and <10 % different from Methylobacter psychrophilus and Methylobactertundripaludum as their closest cultured relatives. The OTU of Cluster III is directly affiliated to Methylobacter psychrophilus and Methylobacter tundripaludum. OTUs of Cluster IV are directly affiliated to Methylosarcina fibrata and Methylosarcinaquisquiliarum and are closely related to Methylomicrobium buryatense. At the species-level (� 98 % sequence similarity), we detected a distinct overall diversity based on the Shannon index (2.22) that was equal near the surface and near the permafrost table (1.90). Also, the overall evenness based on the Simpson Index was almost equal in both depths (0.14 near the surface compared to 0.12 near the permafrost table). All diversity indices are summarized in Table 4.
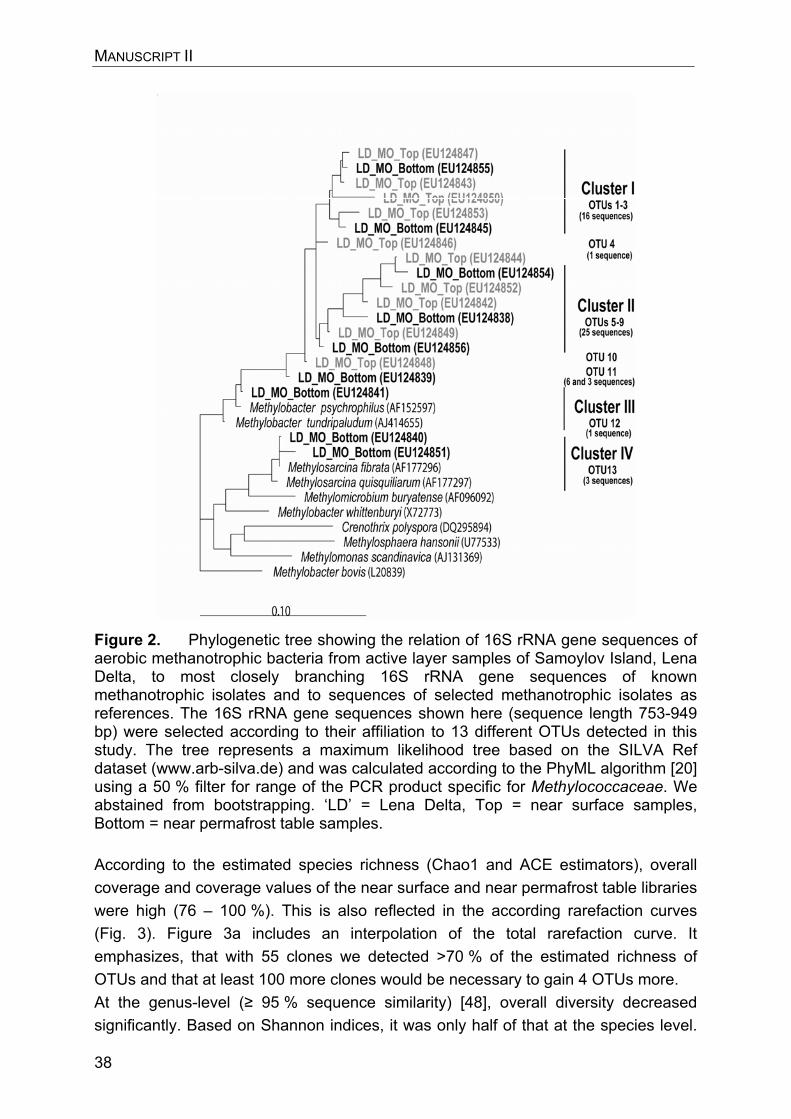
MANUSCRIPT II
38
Figure 2. Phylogenetic tree showing the relation of 16S rRNA gene sequences of aerobic methanotrophic bacteria from active layer samples of Samoylov Island, Lena Delta, to most closely branching 16S rRNA gene sequences of known methanotrophic isolates and to sequences of selected methanotrophic isolates as references. The 16S rRNA gene sequences shown here (sequence length 753-949 bp) were selected according to their affiliation to 13 different OTUs detected in this study. The tree represents a maximum likelihood tree based on the SILVA Ref dataset (www.arb-silva.de) and was calculated according to the PhyML algorithm [20] using a 50 % filter for range of the PCR product specific for Methylococcaceae. We abstained from bootstrapping. ‘LD’ = Lena Delta, Top = near surface samples, Bottom = near permafrost table samples. According to the estimated species richness (Chao1 and ACE estimators), overall coverage and coverage values of the near surface and near permafrost table libraries were high (76 – 100 %). This is also reflected in the according rarefaction curves (Fig. 3). Figure 3a includes an interpolation of the total rarefaction curve. It emphasizes, that with 55 clones we detected >70 % of the estimated richness of OTUs and that at least 100 more clones would be necessary to gain 4 OTUs more. At the genus-level (� 95 % sequence similarity) [48], overall diversity decreased significantly. Based on Shannon indices, it was only half of that at the species level.
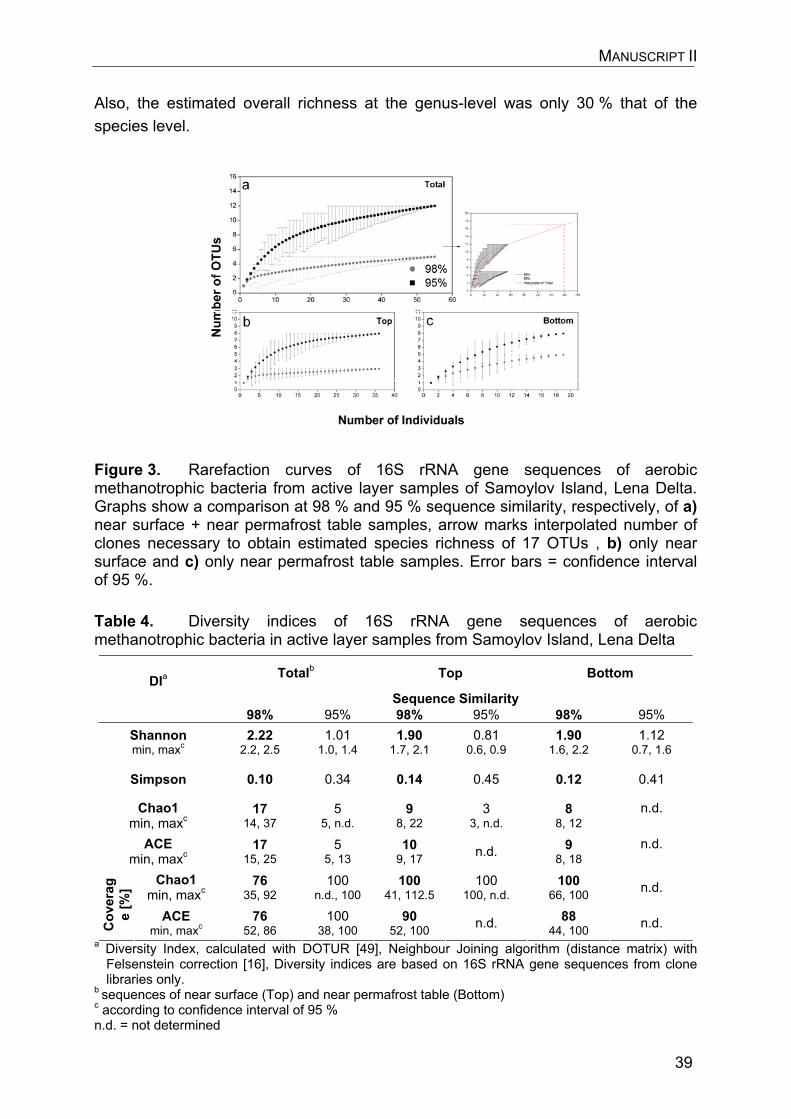
MANUSCRIPT II
39
Also, the estimated overall richness at the genus-level was only 30 % that of the species level.
Figure 3. Rarefaction curves of 16S rRNA gene sequences of aerobic methanotrophic bacteria from active layer samples of Samoylov Island, Lena Delta. Graphs show a comparison at 98 % and 95 % sequence similarity, respectively, of a)near surface + near permafrost table samples, arrow marks interpolated number of clones necessary to obtain estimated species richness of 17 OTUs , b) only near surface and c) only near permafrost table samples. Error bars = confidence interval of 95 %. Table 4. Diversity indices of 16S rRNA gene sequences of aerobic methanotrophic bacteria in active layer samples from Samoylov Island, Lena Delta
Totalb Top Bottom
Sequence Similarity DIa
98% 95% 98% 95% 98% 95% Shannonmin, maxc
2.222.2, 2.5
1.01 1.0, 1.4
1.901.7, 2.1
0.81 0.6, 0.9
1.901.6, 2.2
1.12 0.7, 1.6
Simpson 0.10 0.34 0.14 0.45 0.12 0.41
Chao1 min, maxc
1714, 37
5 5, n.d.
98, 22
3 3, n.d.
88, 12
n.d.
ACEmin, maxc
1715, 25
5 5, 13
109, 17 n.d. 9
8, 18 n.d.
Chao1
min, maxc 76
35, 92 100
n.d., 100 100
41, 112.5 100
100, n.d. 100
66, 100 n.d.
Cov
erag
e [%
]
ACEmin, maxc
7652, 86
100 38, 100
9052, 100 n.d. 88
44, 100 n.d. a Diversity Index, calculated with DOTUR [49], Neighbour Joining algorithm (distance matrix) with
Felsenstein correction [16], Diversity indices are based on 16S rRNA gene sequences from clone libraries only.
b sequences of near surface (Top) and near permafrost table (Bottom) c according to confidence interval of 95 % n.d. = not determined
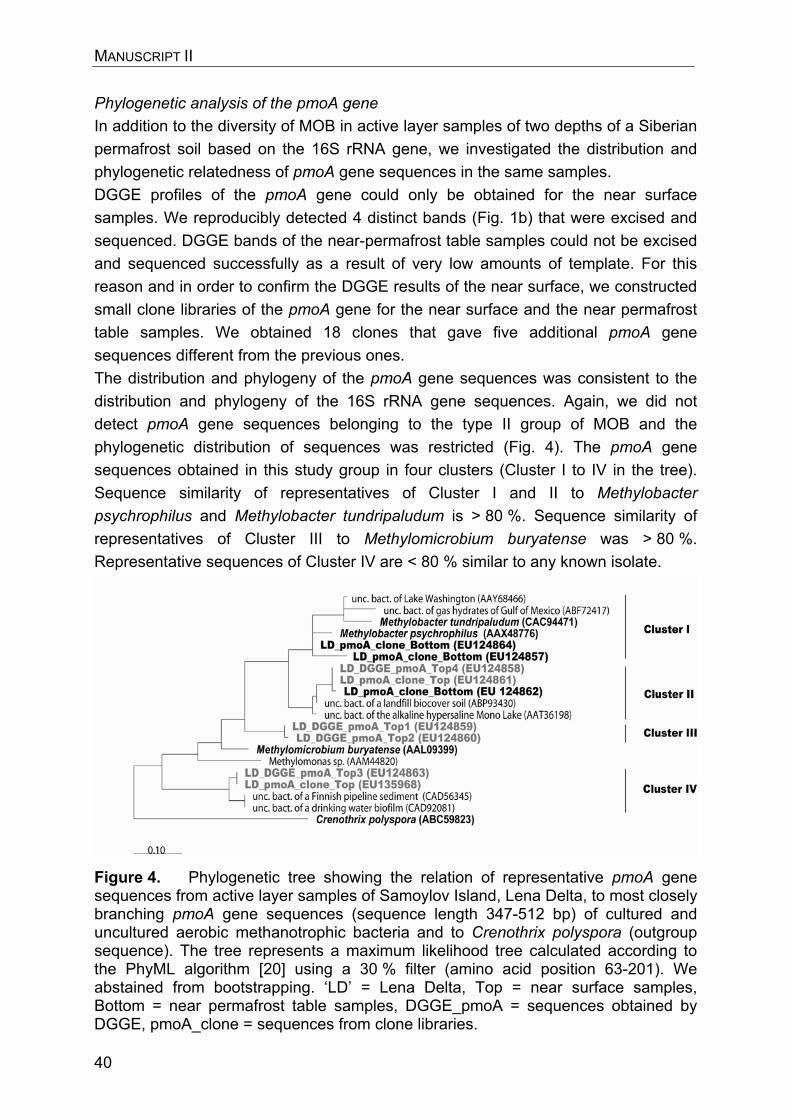
MANUSCRIPT II
40
Phylogenetic analysis of the pmoA gene In addition to the diversity of MOB in active layer samples of two depths of a Siberian permafrost soil based on the 16S rRNA gene, we investigated the distribution and phylogenetic relatedness of pmoA gene sequences in the same samples. DGGE profiles of the pmoA gene could only be obtained for the near surface samples. We reproducibly detected 4 distinct bands (Fig. 1b) that were excised and sequenced. DGGE bands of the near-permafrost table samples could not be excised and sequenced successfully as a result of very low amounts of template. For this reason and in order to confirm the DGGE results of the near surface, we constructed small clone libraries of the pmoA gene for the near surface and the near permafrost table samples. We obtained 18 clones that gave five additional pmoA gene sequences different from the previous ones. The distribution and phylogeny of the pmoA gene sequences was consistent to the distribution and phylogeny of the 16S rRNA gene sequences. Again, we did not detect pmoA gene sequences belonging to the type II group of MOB and the phylogenetic distribution of sequences was restricted (Fig. 4). The pmoA gene sequences obtained in this study group in four clusters (Cluster I to IV in the tree). Sequence similarity of representatives of Cluster I and II to Methylobacterpsychrophilus and Methylobacter tundripaludum is > 80 %. Sequence similarity of representatives of Cluster III to Methylomicrobium buryatense was > 80 %. Representative sequences of Cluster IV are < 80 % similar to any known isolate.
Figure 4. Phylogenetic tree showing the relation of representative pmoA gene sequences from active layer samples of Samoylov Island, Lena Delta, to most closely branching pmoA gene sequences (sequence length 347-512 bp) of cultured and uncultured aerobic methanotrophic bacteria and to Crenothrix polyspora (outgroup sequence). The tree represents a maximum likelihood tree calculated according to the PhyML algorithm [20] using a 30 % filter (amino acid position 63-201). We abstained from bootstrapping. ‘LD’ = Lena Delta, Top = near surface samples, Bottom = near permafrost table samples, DGGE_pmoA = sequences obtained by DGGE, pmoA_clone = sequences from clone libraries.
MANUSCRIPT II
41
Discussion Our results showed that members within the type I MOB were closely related to only two known genera, Methylobacter and Methylosarcina. This was consistently detected applying two different methods, DGGE and cloning. Given, that altogether 10 genera belong to the type I MOB [5, 25, 45, 54, 60], this points at a restricted diversity within the studied community of this group. In terms of relative abundance, representatives related to the Methylobacter genus were clearly dominant, whereas the number of representatives of the Methylosarcina genus was only marginal. In a related study on high arctic sediments based on DGGE profiles, the MOB community was also found to be restricted to only two genera [57]. In this study, members of the genera Methylobacter and Methylosinus and consequently both type I and type II MOB were detected. Similar to our study members of the Methylobacter genus were recovered to be dominant. A low diversity or a restriction to certain groups of MOB was reported also for non-arctic environments that exhibit extreme environmental conditions. The MOB community of peat bogs or acidic forest soils, for example, was restricted to members of type II MOB [39, 40, 43]. Besides, all known acidophilic isolates belong to the genera Methylocapsa and Methylocella, both type II MOB [9, 10, 11, 12]. The MOB community capable of the consumption of atmospheric methane was studied in different forest and grassland soils and was found to exclude members of the type I group. It was suggested to consist primarily of type II MOB [35] and also of distinct, uncultivated clades distant from type I and type II MOB [23, 29, 33, 46]. In all studies discussed, the MOB community is exposed to environmental extremes such as freeze-thaw cycles, low pH values or low substrate concentrations and was found to be restricted to certain taxonomic groups of MOB. In contrast to that, a wide range of MOB genera of both type I and type II MOB was reported for more moderate environments such as landfill soils [59], rice field soils [22, 24, 28], freshwater sediments [8, 42, 44] and sub-arctic tundra soils [31]. This points at a trend towards a restricted diversity or a selection for certain groups of MOB, respectively, in more extreme environments, which is in accordance with the results obtained in the present study. The absence of type II MOB in our study on the 16S rRNA as well as on the pmoA gene level confirms a previous study indicating a clear dominance of type I over type II MOB in active layer samples from Samoylov Island using PLFA analysis [55]. Our methodological approach is based on primer combinations that were designed to detect both 16S rRNA and pmoA gene sequences of known and unknown type I as well as type II MOB [3, 8, 59]. These primer combinations were used in several studies where type I and type II MOB were detected either based on the 16S rRNA gene [57], based on the pmoA gene [29, 42] or based on both genes [28, 44]. According to this, we would have detected type II MOB if their abundance was sufficiently high. However, the cell numbers of type II MOB determined in the studied
MANUSCRIPT II
42
permafrost soil were below the detection limit, while the cell counts for type I MOB were in the range of 107 cells g-1 soil. The unsuccessful amplification of type II MOB could therefore be due to a PCR bias against this group of MOB as an artefact caused by a too low abundance of type II MOB in our samples. Previous studies showed that true psychrophilic MOB can be only found within the subgroup of type I MOB [4, 41], which is in accordance with in-situ temperatures of permafrost environments. Considering this and the fact that type II MOB outcompete type I MOB only at either extremely low methane concentrations as discussed in the beginning or at distinctly heightened methane concentrations [38], it is evident that the environmental conditions of Siberian permafrost lead to the dominance of type I MOB over type II species. Based on 16S rRNA gene clone libraries, we found a distinct species-level diversity of the type I MOB within the active layer including two new clusters (Cluster I and II) of MOB that were specific for the permafrost soil studied here. More than 60 % of all OTUs and more than 70 % of all sequences detected belong to these clusters. Specific clusters for Siberian permafrost soils based on the 16S rRNA gene could already be detected for other groups of micro-organisms such as methanogenic archaea [19], which was interpreted as clusters formed by methanogens characterized by a specific adaptation to the harsh permafrost conditions. The closest cultured relatives of members of the clusters detected here were Methylobacter psychrophilus and Methylobacter tundripaludum. Methylobacterpsychrophilus was isolated from Siberian tundra and was characterized as a true psychrophile with an optimum growth temperature between 3.5 and 10 °C [41]. Methylobacter tundripaludum was isolated from an arctic wetland soil on the island of Svalbard, Norway, and was characterized as a psychrotroph [58]. The sequence similarity of representatives of Cluster I and II to Methylobacter psychrophilus and Methylobacter tundripaludum was less than 95 %. Considering the 16S rRNA sequence similarity only, these clusters can be distinguished from known genera [48]. Our additional analysis of the phylogeny and distribution of the pmoA gene revealed a remarkable congruence with the phylogeny of the 16S rRNA gene sequences. The pmoA cluster I coincided with the two specific 16S rRNA gene permafrost clusters (cluster I and II), whereas pmoA cluster II confirmed cluster III in the 16S rRNA tree. The first group of sequences was directly affiliated to the species Methylobacterpsychrophilus and Methylobacter tundripaludum. The second group of sequences was not directly affiliated to any known species, but the closest cultivated relatives were again Methylobacter psychrophilus and Methylobacter tundripaludum. Based on this, the majority of MOB detected in this study was found to be closely related to phsychrophilic and psychrotrophic MOB isolated from arctic environments. Besides, although it is difficult to deduce a straight phylogenetic relationship between the distinct clusters of environmental sequences detected, the similarity in the 16S rRNA
MANUSCRIPT II
43
and pmoA gene sequence clustering suggest that species of the same type I lineages were detected by both approaches. In addition, the comparison of the diversities obtained by analysis of both genes covered similar ranges. Based on our data, we were able to compare the diversity of the active layer MOB near the surface and near the permafrost table. This comparison was necessary as we were aiming at investigating whether the gradients of temperature and methane within the active layer influence the diversity of the MOB community. Although, compared to the near surface, the active layer zone close to the permafrost table was characterized by a negative redox-potential [17], by temperatures constantly below 2 °C, and significantly lower cell counts of MOB [37], diversity and estimated richness values were found to be almost equal in both depths. Thus, the gradients within the active layer do not seem to influence the diversity of the MOB although they do influence their abundance. This indicates that, firstly the gradients within the active layer are too weak to affect the diversity of the MOB community. Secondly, diversity and abundance must be regulated by different parameters. This is in accordance with results obtained from phospholipid biomarker analysis. The PLFA distribution of near surface and near permafrost horizons of the active layer showed that the microbial communities of both horizons do not incorporate significantly more unsaturated fatty acids under cooler conditions (chapter 8.1). This indicates a high level of adaptation to low temperatures of permafrost microbial communities in general.
ConclusionsWith this study, we present first data on the diversity of the MOB community in an arctic permafrost environment from north-east Siberia at a high phylogenetic resolution. Our results show that the MOB community studied here is specialized to the extreme environment it is exposed to. We showed that, in contrast to a distinct species-level diversity, the diversity of the MOB community at a higher taxonomic level is restricted to members closely related to only two known genera. The presented data support a trend reported in other studies towards a restricted diversity of MOB in more extreme environments. In the context of the climatic changes presently affecting the Siberian Arctic and its polygonal tundra landscapes, this could negatively affect the community of MOB and their function as a primary sink for methane in these regions. Acknowledgements The authors acknowledge J. Harder (Max Planck Institute for Marine Microbiology) for helpful discussions, and T. Sachs (Alfred Wegener Institute for Polar and Marine Research) for critical reading of the manuscript. Also, we want to thank the crew of the Expedition LENA 2005, in particular Waldemar Schneider for logistic and Günter ‘Molo’ Stoof for technical support (both Alfred Wegener Institute for Polar and Marine Research). Finally, we thank all our Russian partners, in particular Dimitry Yu.
MANUSCRIPT II
44
Bolshiyanov (Arctic Antarctic Research Institute), Alexander Yu. Dereviagin (Moscow State University), Mikhail N. Grigoriev (Permafrost Institute Yakutsk), Dmitri V. Melnitschenko (Hydro Base Tiksi) and Alexander Yu. Gukov (Lena Delta Reserve). This research was conducted on the frame of the International Max Planck Research School for Marine Microbiology (MarMic).
MANUSCRIPT III
45
5. Manuscript III (in preparation)
Composition and diversity of soil bacterial communities in polygonal tundra sites of the Lena Delta, Siberia, with particular focus on the Bacteroidetesphylum Susanne Liebner1, Jens Harder2, and Dirk Wagner1* 1Alfred Wegener Institute for Polar and Marine Microbiology, Research Department Potsdam, Potsdam, Germany 2Max Planck Institute for Marine Microbiology, Bremen, Germany *Fax: +49 331 288 2137, Tel: +49 331 288 2159, Email: [email protected]
Based on 16S rRNA gene clone libraries and fluorescence in-situ hybridization (FISH), composition and diversity of the soil bacterial community in a low-centred polygon on Samoylov Island, Lena Delta, was studied with regard to influences of the small-scale heterogeneity of polygonal tundra environments. The elevated polygon rim and the depressed, water saturated polygon centre as well as the near surface and the near permafrost table horizons where thereby compared in terms of their species-level diversities using indices such as the Shannon diversity index (H), the Chao1 and ACE richness estimators, and rarefaction analysis, respectively. Within the low-centred polygon, all major soil bacterial groups as well as some of the rare phyla such as OP8, OP5, OD1, and OP11 were identified. For the first time, the Bacteroidetes-Chlorobi super-phylum was recovered as the dominant member of the bacterial community in a permafrost soil. In particular the group of Bacteroidetes contributed up to > 40 % to all Bacteria affiliated cells and almost 20 % of all operational taxonomic units (OTUs) detected. Sequences affiliated to the Bacteroidetes phylum displayed a high number of micro-diverse clusters. The species-level diversity of the soil bacterial community varied within the low-centred polygon despite the small geographical distance and similar values of pH, and salinity representing factors that were in related studies suggested to determine bacterial diversity. Here, the bacterial diversity on the species-level was lower near the permafrost table compared to the near surface and in the polygon rim compared to the polygon centre. It was concluded, that within the low-centred polygon studied, the soil bacterial diversity decreased with increasing competition for the available resources.
MANUSCRIPT III
46
IntroductionMembers of the domain Bacteria display a major group of organisms in soils and an immense number of cells (typically 109 bacterial cells g-1 soil) and level of diversity, respectively (Dunbar et al., 2002; Tringe et al., 2005). According to DNA reassociation kinetics and 16S rRNA gene sequence similarities, the number of bacterial species (per 100 g of soil) was estimated to be in the range of 0.5-1 x 10⁴ (Torsvik et al., 1996; Dunbar et al., 1999). Bacteria primarily drive biogeochemical processes, such as C, N, and S cycles, and directly influence a wide range of ecosystem processes (Schimel, 1995). Their metabolic activity also influences sources and sinks of electron acceptors and electron donors. Numerous studies were therefore concerned with the composition and diversity of the bacterial community in soils from several environments. Based on more than 30 clone libraries and several other studies using cultivation-independent methods, alpha-, beta-, and gamma-Proteobacteria, Actinobacteria, Acidobacteria and to a lower extent Firmicutes, Bacteroidetes, and Planctomycetes were recently identified as the major soil bacterial phyla though their relative abundance was found to vary significantly depending on the study site (Janssen, 2006). Although it is known that the soil bacterial diversity is influenced by diverse biotic and abiotic factors (Buckley & Schmidt, 2002), it remains yet unclear whether general patterns of bacterial diversity do exist. Some studies suggested patterns of bacterial diversity determined by certain environmental parameters. Fierer & Jackson (2006), for example, reported that bacterial diversity was related to pH only but unrelated to temperature or latitude. In contrast, Lozupone & Knight (2007) found a strong correlation between bacterial diversity and salinity but no correlation with pH. On the one hand it is therefore of major importance to study soil bacterial communities in ecologically important environments. On the other hand, it points at a risk to extrapolate from the bacterial diversity and composition determined in one environment to that of another. The Lena Delta is part of the Siberian Arctic and is located in the zone of continuous permafrost. Due to the immense size of the organic carbon stored in Artic permafrost affected tundra (Post et al., 1982; Zimov et al., 2006) and the currently increased susceptibility of Siberian permafrost to degradation (Nelson et al., 2001), the Lena Delta and its wet tundra environments are of particular interest for the global climate. However, the microbial diversity and its influence on carbon dynamics and ecosystem stability in Arctic permafrost affected soils remain poorly understood (Wagner, 2008). Although several studies investigated the diversity of particular functional microbial groups such as, for example, methanogenic archaea (Høj et al., 2005; 2006; Ganzert et al., 2007) and methanotrophic bacteria (Kaluzhnaya et al., 2002; Wartiainen et al., 2003; Liebner et al., submitted) in arctic regions, accordant analysis concerning the whole bacterial community are rare. There are consistent data on permafrost communities composed of the major soil bacterial groups that on the phylum level displayed diversities similar to those of communities from lower
MANUSCRIPT III
47
latitude soils (Zhou et al., 1997; Kobabe et al., 2004; Steven et al., 2007). Studies that focussed on species diversities in high arctic permafrost and tundra soils were thus far only carried out in samples from Norway and Canada (Neufeld & Mohn, 2005; Hansen et al., 2007). However, there is lack of accordant data on the soil bacterial diversity in the Siberian arctic and in particular of that in the Lena Delta. Also, it remains to be investigated on how the enormous heterogeneity of arctic polygonal tundra environments affects the soil bacterial diversity. With our study we therefore aim at approaching the questions i) what is the diversity of the bacterial community in permafrost soils of the Lena Delta, Siberia, at the phylum as well as on the species level, ii) which are dominant bacterial groups within this community possibly driving carbon cycling processes, and iii) how do vertically and horizontally changing site characteristics influence the diversity and composition of the soil bacterial community. Experimental Procedure Study site and soil samples In this study, we investigated a low-centred polygon located on Samoylov Island (N 72°22, E 126°28), Lena Delta, in north-east Siberia. The geomorphology of Samoylov Island and of the whole Lena Delta was described elsewhere (Schwamborn et al., 2002). In summer 2005 (07th of July to 1st of September) during the expedition LENA 2005 (Schirrmeister et al., 2007), we sampled active layer cores (ø 56 mm) from the rim, centre and the transition zone of the low-centred polygon at intervals of 3-4 days. The cores were frozen immediately after sampling and were kept in frozen condition until further processing. Here, we used two cores (36 and 38) for molecular analysis, sampled on the 1st of September in 2005, at the rim and the centre of the polygon, respectively. Two additional cores (30 and 32), sampled on the 18th of August, 2005, were used for pore water analysis. The site characteristics of the low-centred polygon, its geophysical and geochemical parameters as well as temperature gradients within the active layer of the polygon were described recently (Liebner & Wagner, 2007). Briefly, the temperatures in the uppermost five centimetres of polygon rim and polygon centre reached up to 8-12 °C but decreased to around 0 °C near the permafrost table (20-40 cm soil depth). The elevated polygon rim was dominated by sandy material, the depressed centre by dead and living biomass (mostly roots of Carex aquatilis). The organic carbon content in the polygon rim did not exceed 3.0 % and varied only slightly with depth. Due to the high accumulation rates of fresh organic material, the organic carbon content reached up to 16.1 % near the surface of the polygon centre, but decreased with depth by two thirds. Finally, the polygon rim was characterized by aerobic conditions near the surface and anaerobic conditions near the permafrost table. In contrast to that, the polygon centre was water-saturated throughout the whole active layer.
MANUSCRIPT III
48
Pore water extraction and analysis Active layer cores of a polygon rim and a polygon centre were initially thawed and sectioned in slices of 1.5 cm thickness preventing loss of pore water. Slices were placed into Petri dishes and closed airtight leaving only a tiny access for inserting of a Rhizon (Soil moisture samplers, Rhizosphere Research Products, Wageningen, NL). Pore water extraction with Rhizons was carried out according to the method of Seeberg-Elverfeldt and colleagues (2005). Conductivity and pH were determined with the MultiLab 540 (WTW, Germany). Concentrations of anions and cations were measured with an ion chromatograph (DX320, DIONEX Corp., US) and an emission spectrometer (ICP-OES Optima 3000 XL, Perkin-Elmer Inc., US), respectively. Extraction of total DNA Previous to the extraction of total DNA, active layer cores of a polygon rim and a polygon centre were sectioned under sterile conditions in slices of 1 cm thickness. Depths 6-10 cm and 28-32 cm of the polygon rim and 6-8 cm and 24-26 cm of the polygon centre, respectively, were thoroughly homogenized and dispersed into aliquots of 6 x 0.5 g. Four aliquots of each depth were used for extraction of total DNA. The remaining aliquots were used for Fluorescence in-situ hybridization (FISH). Total genomic DNA was extracted with the BIO 101 Fast DNA SPIN Kit for Soil (Qbiogene, US) combining heat, detergents and mechanical force against beads to lyse microbial cells. Size of the genomic DNA was checked by electrophoresis on a 1 % agarose gel against a Lamda EcoRI/HindIII marker (ABgene, UK) with ethidium bromide staining. PCR amplification For PCR amplification reactions a Thermal Cycler (iCycler, Bio-Rad, US) was used. PCR reaction mixes (25 μl) contained 1xPCR reaction buffer, 0.2 μM primer, 0.25 μM dNTPs, 1.25 U MasterTaq Polymerase (Eppendorf, Germany) and 5-30 ng Template (in a 1:5 or 1:10 dilution). The universal bacterial primers GM3 (5´-AGAGTTTGATCMTGGC-3´) targeting Escherichia coli position 8-24 and GM4 (5´-TACCTTGTTACGACTT-3´) targeting Escherichia coli position 1492-1507 were used for amplification of nearly the whole bacterial 16S rRNA gene (Muyzer et al., 1995). PCR conditions were as follows: 94 °C for 5 min (initial denaturation), followed by 20 cycles of 94 °C for 1 min, 42 °C for 1 min (annealing), and 72 °C for 3 min, and by a final elongation at 72 °C for 60 °min. PCR products (in 96 well plates, ABgene, UK) were purified by centrifugation (980 g at 4 °C) through Multi Screen 96 well plates (Millipore, US) on a column of SephadexTM G-50 Superfine powder (GE Healthcare Bio-Science, Sweden).
MANUSCRIPT III
49
Construction of clone libraries and sequencing Purified PCR products were ligated into the linear Plasmid Vector pCR4 supplied with the TOPO TA CloningR Kit for Sequencing (Invitrogen, Germany) and subsequently transformed into chemical competent E. coli cells via heat-shock following the manufacture’s protocol. Cells were incubated over night at 37 °C on agar plates containing 0.05 % Ampicillin. Only cells containing a Vector with insert were competent to grow with Ampicillin. Colonies of these cells were screened for correct size of the insert and directly sequenced. Sequencing was performed with the BigDye Terminator cycle sequencing kit, version 3.1 (Applied Biosystems, Germany) with vector primers.
Sequence analysis Sequences were edited with Sequencing Analysis 5.2 (Applied Biosystems) and checked for chimeras with Bellerophon (Huber et al., 2004) and with the Chimera-Check of the Ribosomal Database Project (Michigan State University). Assembly of contigs was performed with Sequencher 4.7 (Gene Codes, US). Sequences were imported into the ARB 16S rRNA database and phylogenetically analyzed. Rarefaction analysis and estimation of diversity indices (Shannon diversity index ‘H’, Chao1 and ACE richness estimators, and the Simpson evenness index) were performed with DOTUR (Schloss & Handelsman, 2005). Sequences with > 700 nucleotides only were used for diversity analysis. Species-level diversities were based on a definition of species according to operational taxonomic units (OTUs). 16S rRNA gene sequences with � 97 % similarity were considered as one OTU. Nucleotide and protein sequence accession numbers The 16S rRNA gene sequences recovered in this study and used for phylogenetic presentation will be deposited in the EMBL, GenBank, and DDBJ nucleotide sequence databases. Fluorescence in-situ hybridization (FISH) FISH was performed on samples from two depths of both, polygon rim (7-8 cm, 34-35 cm) and polygon centre (6-7cm, 25-26 cm) to obtain a quantitative complementation of the clone library analysis. Probes targeting main soil bacterial groups were used. Probe details are summarized in Table 1. Fixation of soil samples, hybridization, DAPI staining, and determination of cell counts were carried out as described elsewhere (Liebner & Wagner, 2007).
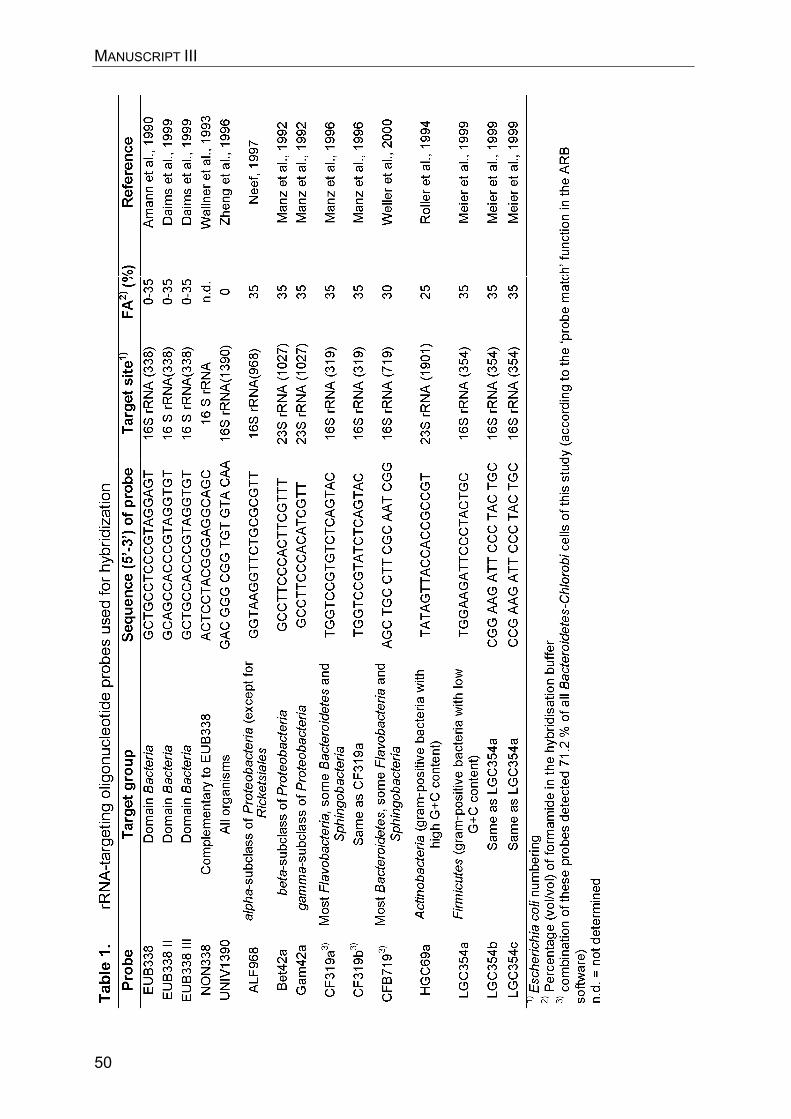
MANUSCRIPT III
50
MANUSCRIPT III
51
Results
Pore water geochemistry The pore water of a polygon rim and a polygon centre was analyzed with regard to concentrations of anion, cations, pH, conductivity, and dissolved organic carbon (DOC). All values are summarized in Table 2. Except for sulphate in the uppermost 5 cm of the polygon rim, concentrations of nitrate, sulphate and aluminium were constantly <2 mg l-1. In contrast, phosphate concentrations were between 5 and 10 mg l-1 in the uppermost 5 cm of both the polygon rim and the polygon centre. With increasing soil depth phosphate got consumed. In the polygon rim, pH values varied little between 6.0 and 6.5 (slightly acidic) with depth. In the polygon centre, pH values increased with depth from 5.6 (slightly acidic) in the uppermost centimetres to 7 (neutral) close to the permafrost table. Thus, the variations of mean pH values of both rim and centre were little. Within both profiles, the vertical gradients of conductivity and calcium ions were correlating and the concentrations of sodium ions varied only slightly. Chloride, calcium ions and conductivity were in the same orders of magnitude in both profiles. However, whereas they slightly decreased with depth in the rim profile, they increased with depth in the centre profile. Mean values of chloride, calcium ions and conductivity of both rim and centre, therefore, varied little with depth. The manganese concentrations were almost constantly < 1 mg l-1 in both profiles. Concentrations of dissolved iron were up to three times higher in the rim than in the centre. In the rim profile, they drastically increased reaching deeper, reduced soil layers. In the centre, iron concentrations varied only little. DOC concentrations were in the range of 57 to 288 mg carbon l-1 and decreased drastically below the uppermost three centimetres. They were considerably higher in the top layer of the polygon centre compared to that of the polygon rim. Phylum-level diversity and composition of the soil bacterial community The diversity of the soil bacterial community within a low-centred polygon on Samoylov Island was determined based on 424 sequences (partial and full length sequences with > 700 nucleotides). We compared the soil bacterial diversity with regard to horizontal and vertical gradients in a way that we compared the polygon rim with the polygon centre (sum of near surface and near permafrost table samples) and the near surface samples of the polygon rim and the polygon centre with the near permafrost table samples of both sites. In the following we will refer to the horizontal and vertical scales as ‘rim’, ‘centre’, ‘top’, and ‘bottom’. With ‘total’ we refer to the sum of all sequences.
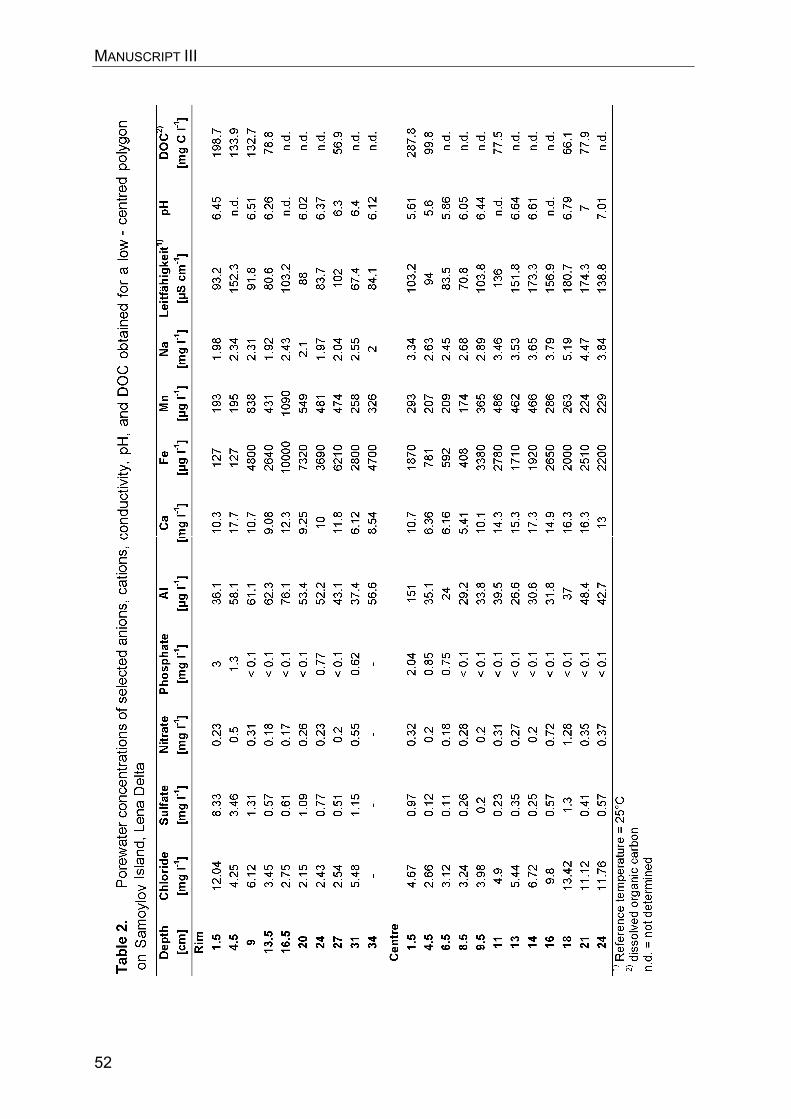
MANUSCRIPT III
52
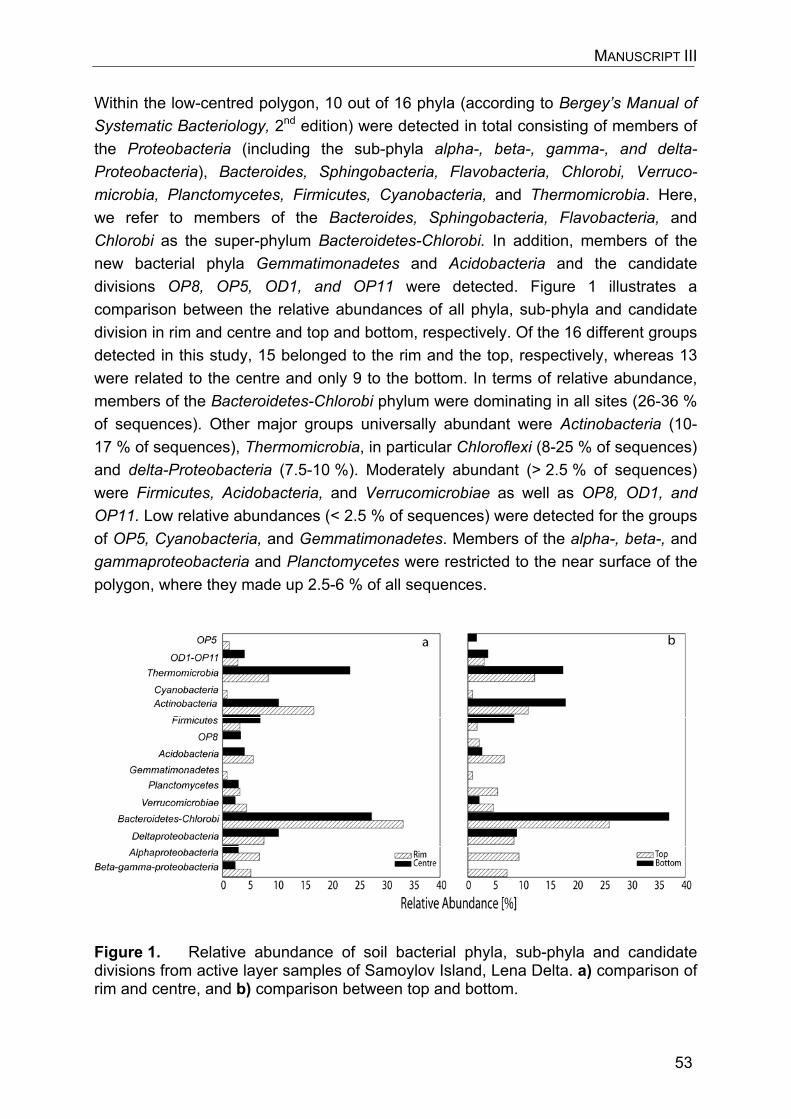
MANUSCRIPT III
53
Within the low-centred polygon, 10 out of 16 phyla (according to Bergey’s Manual of Systematic Bacteriology, 2nd edition) were detected in total consisting of members of the Proteobacteria (including the sub-phyla alpha-, beta-, gamma-, and delta-Proteobacteria), Bacteroides, Sphingobacteria, Flavobacteria, Chlorobi, Verruco-microbia, Planctomycetes, Firmicutes, Cyanobacteria, and Thermomicrobia. Here, we refer to members of the Bacteroides, Sphingobacteria, Flavobacteria, andChlorobi as the super-phylum Bacteroidetes-Chlorobi. In addition, members of the new bacterial phyla Gemmatimonadetes and Acidobacteria and the candidate divisions OP8, OP5, OD1, and OP11 were detected. Figure 1 illustrates a comparison between the relative abundances of all phyla, sub-phyla and candidate division in rim and centre and top and bottom, respectively. Of the 16 different groups detected in this study, 15 belonged to the rim and the top, respectively, whereas 13 were related to the centre and only 9 to the bottom. In terms of relative abundance, members of the Bacteroidetes-Chlorobi phylum were dominating in all sites (26-36 % of sequences). Other major groups universally abundant were Actinobacteria (10-17 % of sequences), Thermomicrobia, in particular Chloroflexi (8-25 % of sequences) and delta-Proteobacteria (7.5-10 %). Moderately abundant (> 2.5 % of sequences) were Firmicutes, Acidobacteria, and Verrucomicrobiae as well as OP8, OD1, and OP11. Low relative abundances (< 2.5 % of sequences) were detected for the groups of OP5, Cyanobacteria, and Gemmatimonadetes. Members of the alpha-, beta-, and gammaproteobacteria and Planctomycetes were restricted to the near surface of the polygon, where they made up 2.5-6 % of all sequences.
Figure 1. Relative abundance of soil bacterial phyla, sub-phyla and candidate divisions from active layer samples of Samoylov Island, Lena Delta. a) comparison of rim and centre, and b) comparison between top and bottom.
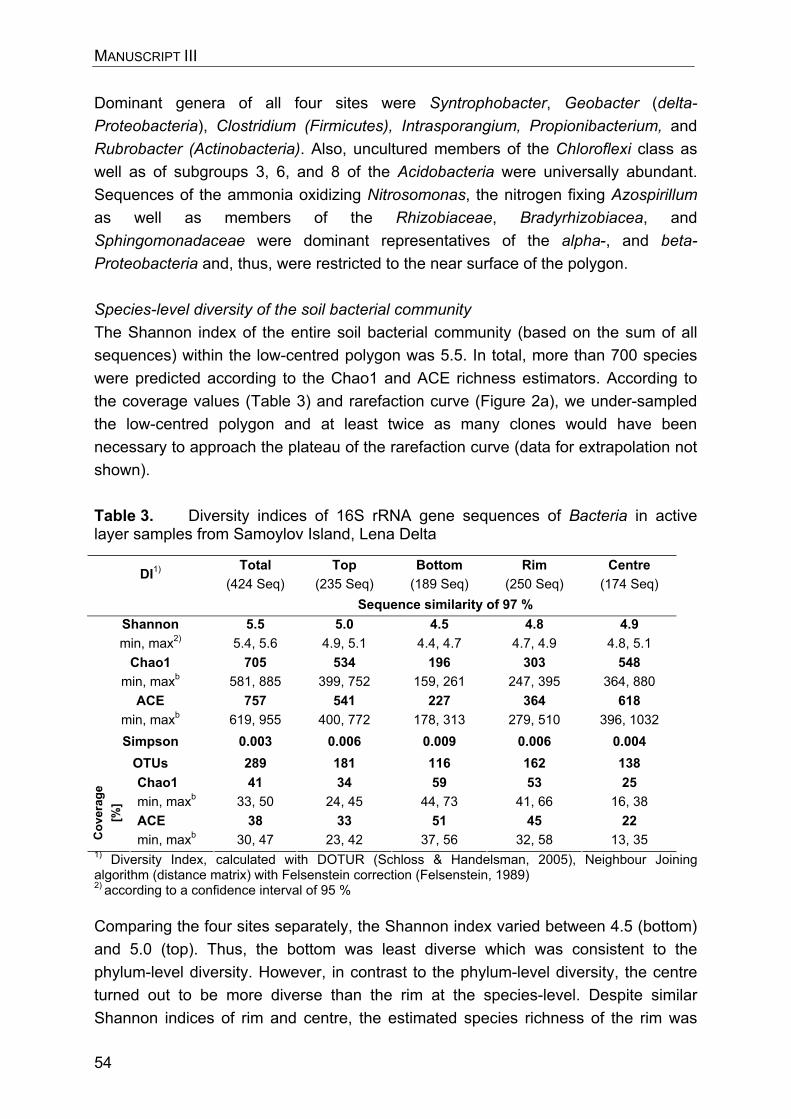
MANUSCRIPT III
54
Dominant genera of all four sites were Syntrophobacter, Geobacter (delta-Proteobacteria), Clostridium (Firmicutes), Intrasporangium, Propionibacterium, andRubrobacter (Actinobacteria). Also, uncultured members of the Chloroflexi class as well as of subgroups 3, 6, and 8 of the Acidobacteria were universally abundant. Sequences of the ammonia oxidizing Nitrosomonas, the nitrogen fixing Azospirillum as well as members of the Rhizobiaceae, Bradyrhizobiacea, and Sphingomonadaceae were dominant representatives of the alpha-, and beta-Proteobacteria and, thus, were restricted to the near surface of the polygon.
Species-level diversity of the soil bacterial community The Shannon index of the entire soil bacterial community (based on the sum of all sequences) within the low-centred polygon was 5.5. In total, more than 700 species were predicted according to the Chao1 and ACE richness estimators. According to the coverage values (Table 3) and rarefaction curve (Figure 2a), we under-sampled the low-centred polygon and at least twice as many clones would have been necessary to approach the plateau of the rarefaction curve (data for extrapolation not shown). Table 3. Diversity indices of 16S rRNA gene sequences of Bacteria in active layer samples from Samoylov Island, Lena Delta
Total
(424 Seq)Top
(235 Seq)Bottom
(189 Seq) Rim
(250 Seq) Centre
(174 Seq) DI1)
Sequence similarity of 97 % Shannonmin, max2)
5.55.4, 5.6
5.04.9, 5.1
4.54.4, 4.7
4.84.7, 4.9
4.94.8, 5.1
Chao1 min, maxb
705581, 885
534399, 752
196159, 261
303247, 395
548364, 880
ACEmin, maxb
757619, 955
541400, 772
227178, 313
364279, 510
618396, 1032
Simpson 0.003 0.006 0.009 0.006 0.004 OTUs 289 181 116 162 138 Chao1 min, maxb
4133, 50
3424, 45
5944, 73
5341, 66
2516, 38
Cov
erag
e [%
]
ACEmin, maxb
3830, 47
3323, 42
5137, 56
4532, 58
2213, 35
1) Diversity Index, calculated with DOTUR (Schloss & Handelsman, 2005), Neighbour Joining algorithm (distance matrix) with Felsenstein correction (Felsenstein, 1989) 2) according to a confidence interval of 95 % Comparing the four sites separately, the Shannon index varied between 4.5 (bottom) and 5.0 (top). Thus, the bottom was least diverse which was consistent to the phylum-level diversity. However, in contrast to the phylum-level diversity, the centre turned out to be more diverse than the rim at the species-level. Despite similar Shannon indices of rim and centre, the estimated species richness of the rim was
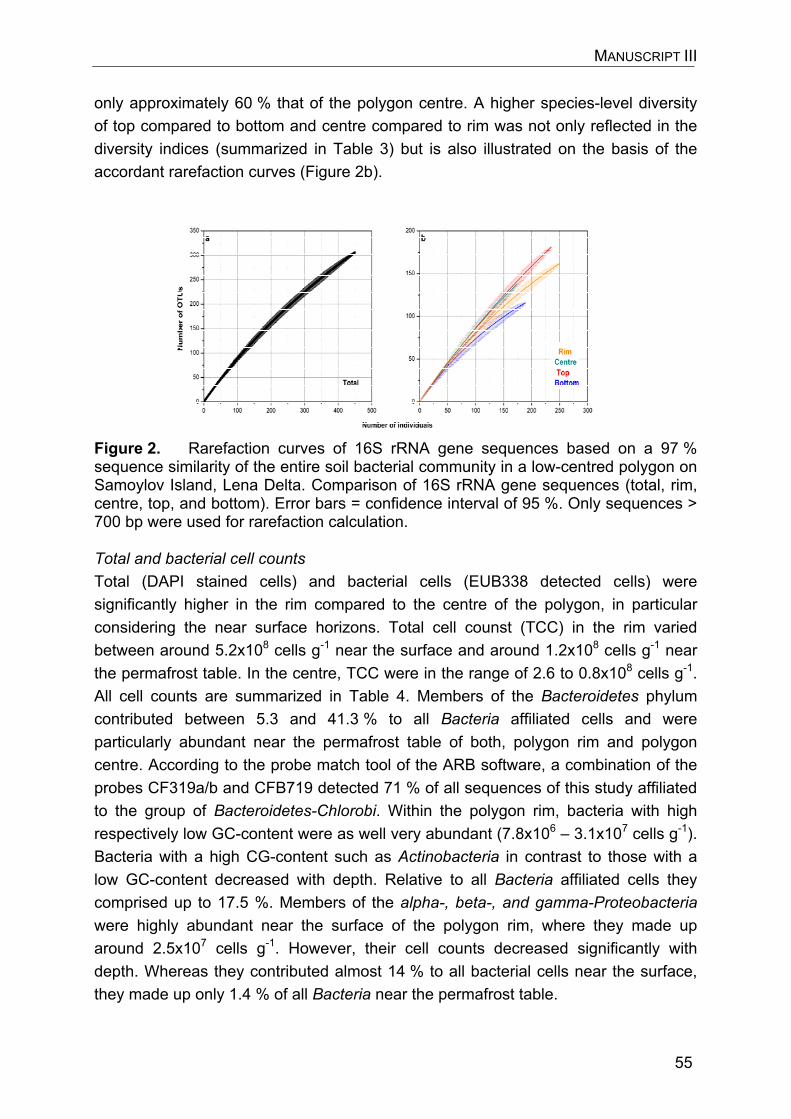
MANUSCRIPT III
55
only approximately 60 % that of the polygon centre. A higher species-level diversity of top compared to bottom and centre compared to rim was not only reflected in the diversity indices (summarized in Table 3) but is also illustrated on the basis of the accordant rarefaction curves (Figure 2b).
Figure 2. Rarefaction curves of 16S rRNA gene sequences based on a 97 % sequence similarity of the entire soil bacterial community in a low-centred polygon on Samoylov Island, Lena Delta. Comparison of 16S rRNA gene sequences (total, rim, centre, top, and bottom). Error bars = confidence interval of 95 %. Only sequences > 700 bp were used for rarefaction calculation. Total and bacterial cell counts Total (DAPI stained cells) and bacterial cells (EUB338 detected cells) were significantly higher in the rim compared to the centre of the polygon, in particular considering the near surface horizons. Total cell counst (TCC) in the rim varied between around 5.2x10⁸ cells g-1 near the surface and around 1.2x10⁸ cells g-1 near the permafrost table. In the centre, TCC were in the range of 2.6 to 0.8x10⁸ cells g-1. All cell counts are summarized in Table 4. Members of the Bacteroidetes phylum contributed between 5.3 and 41.3 % to all Bacteria affiliated cells and were particularly abundant near the permafrost table of both, polygon rim and polygon centre. According to the probe match tool of the ARB software, a combination of the probes CF319a/b and CFB719 detected 71 % of all sequences of this study affiliated to the group of Bacteroidetes-Chlorobi. Within the polygon rim, bacteria with high respectively low GC-content were as well very abundant (7.8x10⁶ – 3.1x10⁷ cells g-1). Bacteria with a high CG-content such as Actinobacteria in contrast to those with a low GC-content decreased with depth. Relative to all Bacteria affiliated cells they comprised up to 17.5 %. Members of the alpha-, beta-, and gamma-Proteobacteria were highly abundant near the surface of the polygon rim, where they made up around 2.5x10⁷ cells g-1. However, their cell counts decreased significantly with depth. Whereas they contributed almost 14 % to all bacterial cells near the surface, they made up only 1.4 % of all Bacteria near the permafrost table.
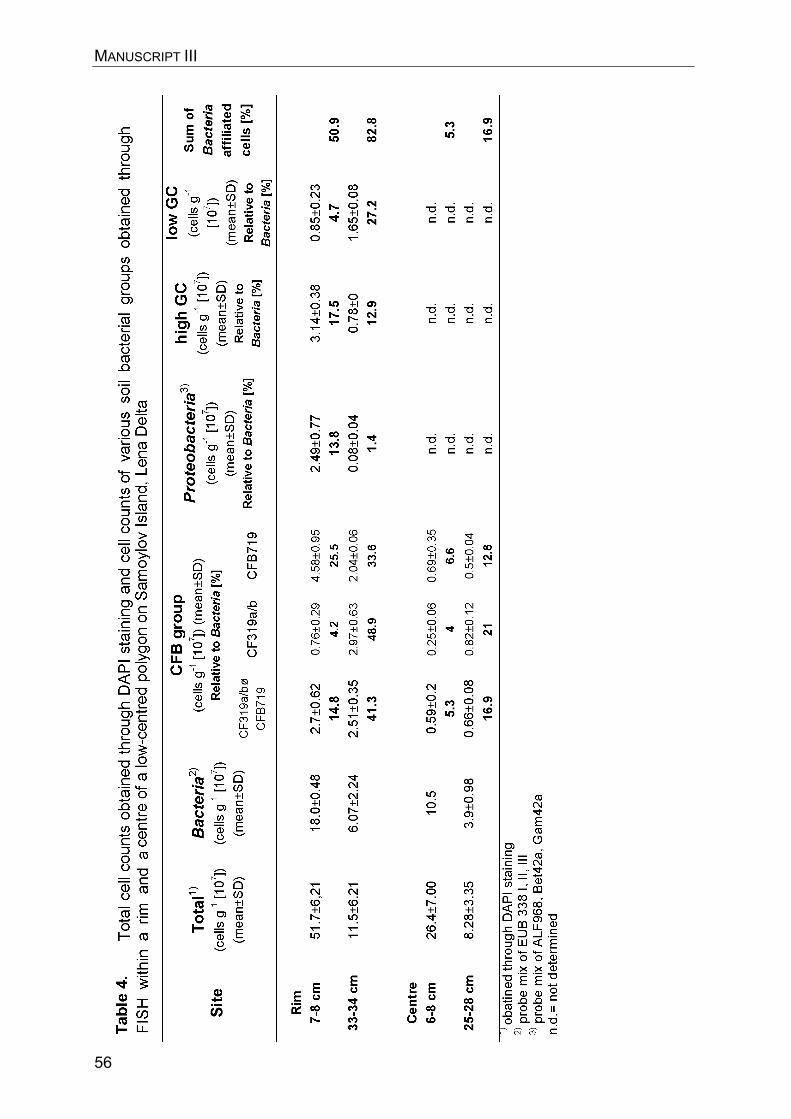
MANUSCRIPT III
56
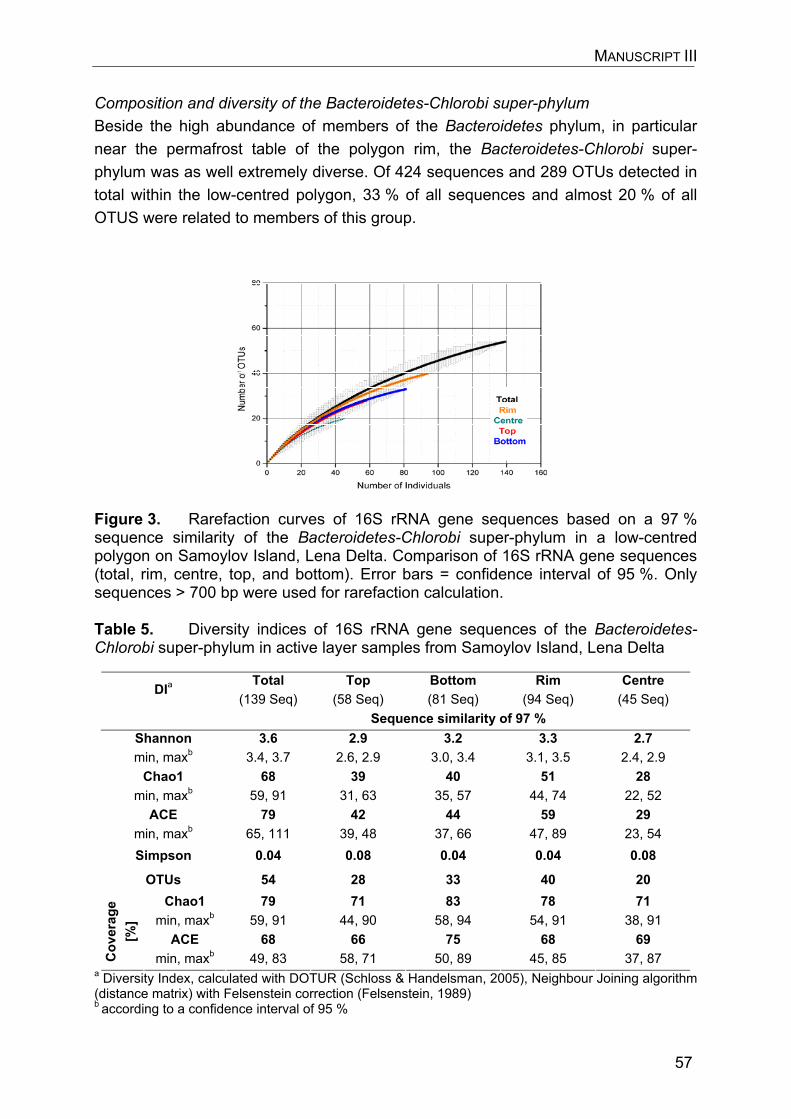
MANUSCRIPT III
57
Composition and diversity of the Bacteroidetes-Chlorobi super-phylum Beside the high abundance of members of the Bacteroidetes phylum, in particular near the permafrost table of the polygon rim, the Bacteroidetes-Chlorobi super-phylum was as well extremely diverse. Of 424 sequences and 289 OTUs detected in total within the low-centred polygon, 33 % of all sequences and almost 20 % of all OTUS were related to members of this group.
Figure 3. Rarefaction curves of 16S rRNA gene sequences based on a 97 % sequence similarity of the Bacteroidetes-Chlorobi super-phylum in a low-centred polygon on Samoylov Island, Lena Delta. Comparison of 16S rRNA gene sequences (total, rim, centre, top, and bottom). Error bars = confidence interval of 95 %. Only sequences > 700 bp were used for rarefaction calculation.
Table 5. Diversity indices of 16S rRNA gene sequences of the Bacteroidetes-Chlorobi super-phylum in active layer samples from Samoylov Island, Lena Delta
Total
(139 Seq)Top
(58 Seq)Bottom (81 Seq)
Rim (94 Seq)
Centre (45 Seq)
DIa
Sequence similarity of 97 % Shannonmin, maxb
3.63.4, 3.7
2.92.6, 2.9
3.23.0, 3.4
3.33.1, 3.5
2.72.4, 2.9
Chao1 min, maxb
6859, 91
3931, 63
4035, 57
5144, 74
2822, 52
ACEmin, maxb
7965, 111
4239, 48
4437, 66
5947, 89
2923, 54
Simpson 0.04 0.08 0.04 0.04 0.08
OTUs 54 28 33 40 20 Chao1
min, maxb 79
59, 91 71
44, 90 83
58, 94 78
54, 91 71
38, 91
Cov
erag
e [%
]
ACEmin, maxb
6849, 83
6658, 71
7550, 89
6845, 85
6937, 87
a Diversity Index, calculated with DOTUR (Schloss & Handelsman, 2005), Neighbour Joining algorithm (distance matrix) with Felsenstein correction (Felsenstein, 1989) b according to a confidence interval of 95 %
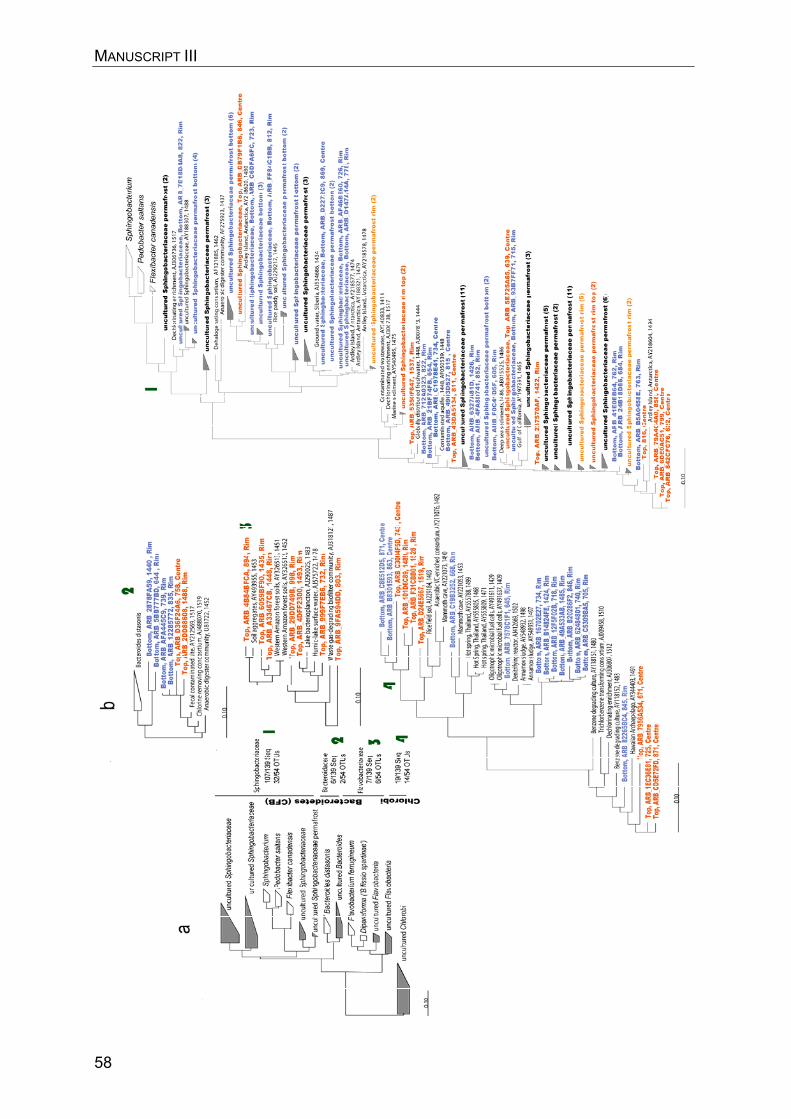
MANUSCRIPT III
58
MANUSCRIPT III
59
Figure 4. (previous page) Phylogenetic trees showing the relation of 16S rRNA gene sequences of the Bacteroidetes-Chlorobi super-phylum from active layer samples of Samoylov Island, Lena Delta, to most closely branching 16S rRNA gene sequences of known and unknown Bacteroidetes-Chlorobi members. a) General Bacteroidetes-Chlorobi tree representing groups containing sequences obtained in this study in grey, as well as number of sequences and OTUs. b) Subtrees of 1 Sphingobacteriaceae, 2 Bacteroidaceae, 3 Flavobacteriaceae, and 4 the Chlorobi subphylum. Trees represent maximum likelihood trees based on the SILVA Ref dataset (www.arb-silva.de) and were calculated according to the PhyML algorithm (Guindon & Gascuel, 2003) using a termini and a positional variable filter for Bacteria. We abstained from bootstrapping. Red = Top, Blue = Bottom, Orange = Rim, Bold (black) = permafrost sequences of this study, number in brackets reflect number of sequences. The distribution and phylogenetic relatedness of members of the Bacteroidetes-Chlorobi detected in this study is illustrated in the phylogenetic trees of Figure 4. These trees reflect the high number of micro-diverse sequence clusters within the group of Bacteroidetes-Chlorobi specific for the permafrost soil of this study. The Bacteroidetes-Chlorobi group was dominated by members of the family Sphingobacteriaceae (77 % of sequences and 60 % of OTUs assigned to the group of Bacteroidetes-Chlorobi). The closest known cultivates within the family Sphingobacteriaceae to the sequences detected here were members of the genus Sphingobacterium, as well as Pedobacter saltans and Flexiabacter canadensis. In addition to Sphingobacteriaceae, members of the Bacteroidaceae, and Flavobacteriaceae with Bacteroides distasonis and Flavobacterium ferrugineum as the closest known cultivates were detected. Also, members of several uncultured clusters within the Chlorobi phylum were detected. Discussion
Phylum-level diversity and composition of soil bacterial communities in a low-centred polygon on Samoylov Island, Lena Delta With our study on samples of polygonal tundra sites in the Lena Delta, Siberia, we could show that the bacterial community in permafrost soils is represented by all major soil bacterial groups including the new phyla Acidobacteria and Gemmatimonadetes. We also detected members of the candidate division OP8,OP5, OD1 and OP11 that (except for OD1) were to our knowledge recovered for the first time in permafrost soils. Based on both relative and absolute abundance, we showed that the bacterial community in permafrost soils of the Lena Delta was dominated by members of the Bacteroidetes phylum also known as CFB group (Cytophaga-Flavobacteria-Bacteroides) and to a lower extent by Actinobacteria. Within the Bacteroidetes, in particular sequences that were affiliated to the Sphingobacteriaceae comprised a high number of micro-diverse sequence clusters in all four sites within the low-centred polygon. Although Bacteroidetes are known to belong to the major groups of soil bacteria and were suggested to make up important
MANUSCRIPT III
60
members of microbial communities especially in cold habitats (Bowman et al., 1997b; Abell & Bowman, 2005), for example in Arctic and Antarctic Pack Ice (Brinkmeyer et al., 2003) there is, thus far, no study reporting a dominance of this group within the bacterial community in permafrost soils. Still, their outstanding abundance and diversity detected here is not surprising considering that known cultivates of the Sphingobacteriaceae were predominantly isolated from soils of various environments on the one hand (Steyn et al., 1998; Kim & Jung, 2007). On the other hand among those isolates are many that are cold adapted, psychrophiles or psychrotrophs. Sphingobactertium antarcticus, for example, is a psychrotroph isolated from the soils of Schirrmacher Oasis (Shivaji et al., 1991) and Pedobacter saltans or Flexibacter canadensis, both are cultivates closely branching to a majority of sequences of this study, were isolated from soils in Iceland and Canada, respectively. Striking physiological and biochemical features of members of the Sphingobacteriaceae are their ability to utilize a large number of carbohydrates and to produce a wide range of low molecular organic acids. Also, relative to other non-cold adapted strains, cold adapted Sphingobacteriaceae were often found to be enriched in either anteiso- or unsaturated cellular fatty acids (Steyn et al., 1998; Margesin et al., 2003) which are known to enhance the ability of microbial cells to adapt to low temperatures (Kaneda, 1991; Nichols et al., 1993; Weber et al., 2001). Similar features in terms of substrate utilization and cellular fatty acid composition apply for members of the Bacteroides as for example Bacteroides distasonis (Sakamoto & Benno, 2006), which branches closely to the sequences of our study that were affiliated to the Bacteroidaceae. We conclude that members of the Bacteroidetes, in particular the Sphingobacteriaceae, are especially capable to survive under the extreme condition in the active layer of Siberian permafrost soils. Their physiological and chemical features enable them to successfully compete with other soil bacterial groups. The high abundance and diversity of the Bacteroidetes indicate an important contribution of this group to the carbon cycle within permafrost soils by delivering a wide range of low molecular fatty acids. These fatty acids can then be used for example by fermenting bacteria such as the genera Clostridium, Intrasporangium, and Propionibacterium that were detected in most of the sites studied within the polygon. Sequences of the sub-phyla of alpha-, beta-, and gamma-Proteobacteria, and the phylum Planctomycetes were only detected near the surface of the low-centred polygon. Also, cell counts of the alpha-, beta-, and gamma-Proteobacteria decreased significantly towards deep active layer zones. Representative taxa of these groups such as for example the genus Azospirillum, the families Rhizobiaceae, andSphingomonadaceae and the order Nitrosomonadales gain energy via respiration and require high redox potentials (Eh). During arctic summer, the Eh values within low-centred polygons varied between -90 and 0 mV in the water saturated zone near the permafrost table but reached up to 300-400 mV in dry sites near the surface (Fiedler et al., 2004). Other studies reported that soil respiration (soil CO2 production)
MANUSCRIPT III
61
increased exponentially with Eh increase (Yu et al., 2007). In conclusion, the redox regime within soils seems to influence both the composition of the bacterial community and, as a result, also soil respiration rates. Due to continuing permafrost degradation, dry/wet site ratios will shift in arctic terrestrial permafrost environments in consequence of rising surface temperatures. We suggest that, with time, this will considerably influence overall bacterial community compositions and soil respiration rates.
Species-level diversity of the soil bacterial communities in relation to vertical and horizontal site properties of a low-centred polygon Considering the four sites investigated in this study, we obtained Shannon indices between 4.5 and 5.0 indicating an extremely diverse bacterial community. This is supported by related studies on high Arctic soils from Norway and Canada reporting bacterial diversities that partly even exceeded those of boreal forest soils (Neufeld & Mohn, 2005; Hansen et al., 2007). Our results also point at species-level diversities higher than shown for a wide range of soil habitats different in water regime, latitude, and land use (Fierer & Jackson, 2006). These authors compared species richness and diversity based on a molecular fingerprinting method (T-RFLP) and calculated minimum Shannon indices of around 2.4 for humid temperature forests and tropical forests/grassland and maximum Shannon indices of around 3.4 for humid temperate grasslands, dry forests and dry grassland/shrubland. Boreal forests and tundra, most similar to our site, had Shannon indices of between 3.0 and 3.2. The considerable distance of our Shannon indices compared to those obtained by Fierer & Jackson does thereby most likely not only reflect real variations of diversity but also the different methods used. Fingerprinting methods such as T-RFLP were assessed to be not very appropriate to determine species richness or diversity metrics as they grossly underestimate the actual richness of complex communities (Bent et al., 2007). With this study we were not only aiming at a general description of the bacterial diversity and composition in high arctic permafrost soils. We also wanted to understand how it is influenced by the pronounced micro-relief of polygonal tundra environments. Several studies dealt with the influence of depth gradients or landscape (surface soil) patterns on the soil bacterial community and suggested that its composition and biomass are influenced by the amount of resources (Fierer et al., 2003; Allison et al., 2007a, b). These studies, however, did not investigate an influence on the diversity of the bacterial community. In our study, we observed a significant shift of the bacterial diversity within the polygon on a horizontal (between rim and centre) and on a vertical (between near surface and near permafrost table) scale, respectively. Other studies reported that broad scale patterns of bacterial diversity are determined either by salinity (Lozupone & Knight, 2007), soil pH (Fierer & Jackson, 2006), or by sediment mineral chemistry and temperature, respectively
MANUSCRIPT III
62
(Mathur et al., 2007). Salinity and conductivity as well as pH values determined here varied only slightly vertically and horizontally. Thus, these parameters are not useful to explain the different levels of bacterial diversities observed on the small bio-geographical scale in our study. The striking factors distinguishing the more diverse polygon centre from the less diverse polygon rim were lower redox potentials (in consequence of water saturation within the profile), lower total and bacterial cell counts, and higher amounts of total organic carbon. Also, as a result of the high accumulation rates of organic material in the centre compared to the rim where erosion and accumulation are nearly balanced, the active layer in the polygon centre is of younger age. The more diverse near surface layer, in turn, can be distinguished from the less diverse near permafrost table layer by higher redox potentials, higher nutrient concentrations, in particular phosphate, higher DOC concentrations, and less extreme temperatures. Again, the more diverse site near the surface here is of younger age than deep active layer zones. Considering the contradicting trends with regard to the redox potential, the redox potential can not be applied to explain site specific differences within the bacterial diversity. We found that the top of the polygon rim is still more diverse without considering the groups of bacteria restricted to that site as a consequence of redox conditions (Shannon index 4.7 compared to 4.5; Chao1 estimated number of species of 345 compared to 196). We suggest that the redox potential rather influences composition and abundance of the soil bacterial community but not directly its diversity. In consequence, relative to sites within the low-centred polygon with lower diversities, we observed a positive influence on the soil bacterial diversity by high DOC and nutrient concentrations, moderate temperatures and low total and bacterial cell counts. This lead us to conclude that on the small bio-geographical scale within the low-centred polygon investigated, the availability of resources rather than single biotic or abiotic factors primarily determine the soil bacterial diversity. Age is likely an additional factor influencing the soil bacterial diversity within the low-centred polygon. It is feasible that due to external entry of new species the diversity near the surface is higher than in deeper and at the same time older active layer zones. Also, except for the uppermost centimetres, the soil bacterial community within the active layer of the polygon rim had considerably more time to select for successful groups and to exclude others less successful than the community in the polygon centre (considering similar depths). As we have shown, the group of Bacteroidetes was able to outcompete other bacterial groups likely due to its physiological and chemical features. This might explain why the diversity within the Bacteroidetes is therefore highest in the polygon rim and near the permafrost table, respectively although for the entire bacterial community it was shown to be the opposite. Also, a related study showed that the diversity of aerobic methanotrophic bacteria (MOB) in permafrost soils did vertically not change (Liebner et al., submitted). MOB have no competitor for
MANUSCRIPT III
63
substrate in the studied permafrost soil. Within both groups Bacteroidetes and MOB several micro-diverse sequence clusters were detected that, according to Acinas et al. (2004), arise by selective sweeps and persist because competitive mechanisms are too weak to purge diversity from within them. Related to this study it was suggested that although this micro-diversity could result from neutral selection it might as well reflect a community that is specialized to particular environmental conditions (Thompson et al., 2005). We hypothesize that persistent competition for the available resources primarily determines the diversity of bacterial communities in polygonal tundra soils of the Lena Delta in a way that high continuous pressure of competition lowers overall bacterial diversity. Conclusions Bacterial communities in permafrost affected soils such as those of the Lena Delta studied here are extremely diverse, although the harsh environmental conditions of permafrost affected tundra were long thought to be hostile even to microbial life (Wagner, 2008). According to our study, the extreme temperature regime and widely inhibited decomposition processes characteristic for permafrost soils do not cause a restricted bacterial diversity but rather seem to potentiate it. Besides, other soil bacterial groups than reported for more moderate terrestrial habitats were found to be dominant in polygonal tundra sites of the Lena Delta. In particular, members of the Bacteroidetes phylum known to be very abundant in cold marine habitats, for example, seem to be extremely capable to compete and survive under the harsh environmental conditions of Siberian permafrost soils as well. This group of bacteria might therefore primarily contribute to carbon cycling processes in cold habitats in general.
SYNTHESIS
64
6. Synthesis The present study accounts for the field of environmental microbiology. It contributes to our understanding of the methanotrophic ecology in polygonal tundra environments of the Lena Delta, Siberia. Because aerobic methane oxidizing bacteria (MOB) are the primary sink for the greenhouse gas methane in terrestrial environments, their ecology is an essential factor balancing present and future methane fluxes in these climatic important and morphologic interesting environments. The analysis of this work was performed on samples from a low-centred polygon, and from a flood plain, respectively. Low-centred polygons are representative for polygonal tundra environments in the high arctic and in particular for those of the Lena Delta. On the investigation site of this study, Samoylov Island, about 70 % of the Island’s surface is characterized by low- and high-centred polygons. The flood plain, in turn, represents the lowland areas on Samoylov Island. According to the aspects that were of particular interest in this study, namely adaptation, spatial variability, and phylogeny of the methanotrophic community in different sites of the polygonal tundra, the following conclusions can be drawn:
The methanotrophic community in polygonal tundra sites of the Lena Delta was shown to be specialized to the extreme temperature regime it is exposed to. This conclusion is based on a variety of different results: At first, in sites where the abundance of MOB was not limited by the availability of oxygen, methanotrophic cell counts (in July 2002 and August 2005, respectively) ranged between 3x10⁶ and 1x10⁸ cells g-1 dry soil and were similar to methanotrophic cell counts in northern peat lands (Vecherskaya et al., 1993; Sundh et al., 1995) or even exceeded those obtained in environments with more moderate temperatures such as meadow, paddy, and forest soils in Europe (Horz et al., 2002; Eller et al., 2004; Kolb et al., 2005). In these sites, MOB contributed partly more than 10 % to the total number of microbial cells. Secondly, in samples of a polygon rim and a flood plain potential methane oxidation rates at temperatures between 0-38 °C were highest at 4 °C in active layer zones close to the permafrost table where temperatures are constantly < 2 °C. In contrast, near the surface where temperatures fluctuate at greater amplitude, maximum potentials of methane oxidation were observed at 21 °C. A shift in the temperature optimum of potential methane oxidation rates between the near surface and the near permafrost table was as well reflected in the according Q10-values in a way that these values were > 2 between 0 and 4 °C in a polygon rim (chapter 8.2). At third, the diversity of MOB on the species level was equal near the surface and near the permafrost table within the profile of a polygon rim. This indicates that the methanotrophic diversity was not affected by the steep temperature gradient within the active layer. Besides, DGGE and cloning of the pmoA and the 16S rRNA genes, respectively, revealed that the community of MOB detected in this soil was restricted to only two known methanotrophic genera, Methylobacter and Methylosarcina. It displayed a (relative) dominance of representatives of two site
SYNTHESIS
65
specific sequence clusters closely related to the psychrophilic and psychrotolerant species Methylobacter psychrophilus and Methylobacter tundripaludum, respectively. A community of MOB that is specialized to extremely low temperatures as detected near the permafrost table is likely to be less flexible to react to a changing environment than a little specialized community, in particular in combination with the restricted diversity of MOB observed on the genus-level. Considering the susceptibility of Siberian permafrost to degradation and given the observed increase of Russian active layer depth (chapter 1.1), this might cause a negative impact on the methanotrophic community near the permafrost table to function as the primary sink for methane in the polygonal tundra environments of the Lena Delta in the future.
The abundance of MOB was suggested to be primarily regulated by the availability of methane and oxygen (chapter 1.4). The extreme temperature regime characteristic for Siberian permafrost soils is an additional factor that could influence the abundance of microbial communities in the polygonal tundra environments of the Lena Delta. However, as was shown, the methanotrophic community in these environments is well adapted to the extreme temperature regime it is exposed to. The temperature gradient within the active layer of the studied profiles did therefore neither limit the abundance of MOB nor did it lead to a spatial variability of it. It was shown that the permafrost affected tundra on Samoylov Island favoured methanotrophic abundance in sites with sufficient oxygen such as the elevated polygon rims or sites where flooding leads to periodical input of oxygen despite water saturation in the soil. In contrast to these sites and despite much higher methane concentrations in-situ, MOB were two orders of magnitude less abundant in a depressed polygon centre. In the polygon centre, the water level was above the surface, mixing of the soil phases was hampered, and redox potentials were comparably low. Unfavourable conditions for methanotrophs in the polygon centre are supported by related studies on polygonal tundra sites on Samoylov Island reporting significantly higher methane fluxes from the depressed centres of low-centred polygons than from the elevated rims (Wagner et al., 2003; Kutzbach et al., 2004). The spatial variations of methanotrophic abundance were also reflected in potential rates of methane oxidation. These rates were again two orders of magnitude lower in a polygon centre than in a polygon rim and a flood plain, respectively. Despite increasing methane concentrations, methanotrophic abundance also decreased towards the permafrost table. As a result of transport via plant roots, oxygen can still be present in deeper active layer zones. However, it gets limited towards the permafrost-table causing the decrease of MOB abundance. According to these results, the abundance of MOB in polygonal tundra sites of the Lena Delta was suggested to primarily depend on oxygen availability rather than on concentrations of methane. This is consistent to studies in other environments indicating that methanotrophic abundance and activity can not directly be linked to in-situ substrate concentrations (chapter 1.4). It supports previous observations
SYNTHESIS
66
indicating that in wetlands methane oxidation is rather determined by the water level and availability of oxygen (Whalen & Reeburgh, 1990; Kutzbach et al., 2004). Given this, polygonal tundra environments and in particular low-centred polygons must be regarded as very heterogeneous habitats for MOB. Due to degradation of permafrost it is likely that the occurrence of phenomena such as thermokarst will increase (Grosse et al., 2006) and the ratio of dry and wet sites of polygonal tundra environments will change. Consequently, this would also influence methanotrophic abundance and activity and with this the capacity of the methanotrophic community to function as a sink for methane. If the proportion of dry polygonal tundra sites in the Lena Delta will increase and overall redox potentials will rise, the methanotrophic community will be supported. If the proportion of wet polygonal tundra sites in the Lena Delta will increase and overall redox potentials will be lowered, the methanotrophic community will be inhibited. The study demonstrates that type I MOB dominate over type II MOB in polygonal tundra sites of the Lena Delta. This was shown based on both direct cell counts using FISH and on phylogenetic analysis of the pmoA and the 16S rRNA gene. It confirms a previously indicated dominance of type I over type II MOB in permafrost soils of the Lena Delta using PLFA analysis (Wagner et al., 2005). A dominance of type I MOB in these soils, firstly, is supported by the methane concentrations detected in-situ. These concentrations were higher than those in high affinity environments where MOB are exposed to atmospheric methane concentrations and lower than those in low affinity environments such as rice field soils. Both high and low affinity environments were reported to support type II MOB (Henckel et al., 2000a, b; Macalady et al., 2002; Horz et al., 2005; Kolb et al., 2005; Ricke et al., 2005; Lau et al., 2007). Secondly, all known true psychrophilic isolates (which do not include the psychrotrophic, acidophilic type II genera Methylocella and Methylocapsa) belong to the group of type I MOB (Omelchenko et al., 1996; Bowman et al., 1997a).
For a better understanding of the methanotrophic ecology, also the composition and diversity of the entire soil bacterial community in polygonal tundra sites of the Lena Delta was to be investigated in this study (chapter 1.6). The soil bacterial community within a low-centred polygon was observed to be composed of the major soil bacterial groups. Also, it was found to be extremely diverse on the species level. Its diversity exceeded that of soil habitats different in water regime, latitude, and land use (Fierer & Jackson, 2006). These results are consistent to related studies on the composition and diversity of the soil bacterial community in high arctic permafrost soils of different locations (Zhou et al., 1997; Neufeld & Mohn, 2005; Hansen et al., 2007; Steven et al., 2007). In addition to that, in the present study also some of the so called rare phyla such as OP8, OP5, OD1, and OP11 were detected for the first time in permafrost soils. OD1 and OD11 even displayed a moderate relative abundance within the low-centred polygon. Also, other than usual dominating groups of soil bacteria were identified to be prominent here. In particular, the group of
SYNTHESIS
67
Bacteroidetes was extremely abundant and diverse. Near the permafrost table of a polygon rim, members of the Bacteroidetes contributed > 40 % to all cells affiliated to the domain Bacteria. In addition, Bacteroidetes comprised almost 20 % of all OTUs recovered within the entire soil bacterial community. This group is known to be wide spread especially in cold, marine habitats (Bowman et al., 1997b; Brinkmeyer et al., 2003; Abell & Bowman, 2005). It was concluded that due to their physiological and chemical features members of the Bacteroidetes, in particular the Sphingobacteriaceae, are highly capable to survive under the extreme condition in the active layer of Siberian permafrost soils and to successfully compete with other soil bacterial groups. The high abundance and diversity of the Bacteroidetes indicate an important contribution of this group to the carbon cycle within permafrost soils. Bacteroidetes deliver a wide range of low molecular fatty acids that can be further used by fermenting bacteria such as the genera Clostridium, Intrasporangium, andPropionibacterium that were detected in most of the sites studied within the low-centred polygon. Whereas the diversity (on the species level) within the methanotrophic community was observed to be equal near the surface and near the permafrost table, the diversity within the entire soil bacterial community determined on the basis of 16S rRNA clone libraries decreased towards the permafrost table. Also, it was lower in the rim of a low-centred polygon than in the centre. With this, the diversity within the entire soil bacterial community must be influenced by different parameters than that of the methanotrophic community. An influence of the small scale heterogeneity within low-centred polygons on the diversity of the entire soil bacterial community was observed although parameters such as pH and salinity, identified through other studies to determine soil bacterial diversity (Fierer & Jackson, 2006; Lozupone & Knight, 2007), were similar in all sites investigated. The site specific variations of soil bacterial diversity in this study were attributed to the persistent competition for the resources available in a way that higher pressure of competition (less resources available) lowered overall bacterial diversity. This competition was found to be primarily influenced by concentrations of DOC, TC, and nutrients, by in-situ temperatures, total cell counts. There is no such competition for the group of MOB as they are the only (known) organisms responsible for the oxidation of methane in permafrost soils. In combination with their pronounced adaptation to the temperature gradient within the active layer this might explain that their diversity did not change with depth. With this, however, it remains also open what determines the diversity within the methanotrophic community in polygonal tundra environments of the Lena Delta.
SYNTHESIS
68
Conclusions
� The methanotrophic community in polygonal tundra environments of the Lena Delta is specialized to the extreme temperature regime it is exposed to, because: � In sites where the abundance of MOB is not limited by the availability of oxygen,
MOB contributed a significant part to the entire microbial community. Their cell numbers were similar to those in northern peat lands and exceeded those obtained in environments with more moderate temperatures.
� The diversity of MOB on the species-level in a polygon rim was not affected by the steep temperature gradient within the active layer.
� The composition of the methanotrophic community in a polygon rim was restricted on the genus-level and displayed a (relative) dominance of representatives closely related to known psychrophilic and psychrotolerant species.
� Potential methane oxidation rates in different sites on Samoylov Island were highest at 4 °C in active layer zones close to the permafrost table where temperatures are constantly < 2 °C. In contrast, near the surface where temperatures fluctuate at greater amplitude, the maximum methane oxidation potential appeared at 21 °C.
� Elevated polygon rims or flood plains with periodical input of oxygen are favourable sites for MOB. In contrast, depressed polygon centres with water levels above the surface, and comparably low redox potential provide poor conditions for MOB despite much higher in-situ methane concentrations. Thus, polygonal tundra environments of the Lena Delta provide heterogeneous conditions for MOB.
� The environmental conditions in polygonal tundra sites of the Lena Delta support the abundance of type I MOB compared to type II MOB. The dominance of type I MOB was suggested to be primarily due to the moderate methane concentrations und low temperatures in-situ.
� The soil bacterial community in polygonal tundra sites of the Lena Delta is dominated by members of the phylum Bacteroidetes as this group of bacteria is highly capable to survive and successfully compete under the harsh environmental conditions in Siberian active layer profiles. As a result of their outstanding diversity and abundance they are suggested to notably drive carbon cycling processes in permafrost soils.
� The diversity within the entire soil bacterial community changes within low-centred polygons. It is lower near the permafrost table compared to the surface and in the polygon rim compared to the centre, respectively. The diversity of the entire soil bacterial community in low-centred polygons is suggested to decrease with increasing pressure of competition for the available resources.
SYNTHESIS
69
Critical remarks and future work
Information obtained in the field of environmental microbiology is always method limited. With the present study it was not intended to contribute to methodological advancement but to apply methods that are already established in this field. Recently, a collection of papers was published reviewing molecular-based approaches to soil microbiology (Kreuzer-Martin, 2007; Mills et al., 2007; Nakatsu, 2007; Rogers et al., 2007; Thies, 2007; Zwolinski, 2007) including fluorescence in-situ hybridization (FISH), denaturing gradient gel electrophoresis (DGGE), cloning and sequencing as the molecular methods used in this study. As an example, FISH was successfully applied in the present study to compare in-situ cell counts of various bacterial groups between the different polygonal tundra sites investigated. This comparison was of major interest. However, FISH in soil samples is restricted through high auto-fluorescence of soil organic matter and therefore excludes automated cell counting on the one hand and requires high dilution of the soil samples on the other hand. In consequence, an enormous manual effort is needed to obtain reasonable values for standard deviations and detection limits. In order to obtain validated data on absolute cell numbers, the direct cell counts obtained through FISH were ideally to be confirmed using additional methods for the quantification of cell numbers such as quantitative (real time) PRC (qPCR) or dot blot hybridization. Another methodological limitation occurred concerning the specificity of the oligonucleotide probes and primers used for the detection of 16S rRNA gene regions specific for MOB. The probes and primers used were recently discovered to fail detection of the acidophilic genera Methylocella and Methylocapsa, the thermophilic genus Methylocaldum, and the halophilic species Methylosphaera hansonii (Chen et al., 2007). In the present study, universal primers for the detection of the pmoA gene (except for that of the strain Methylocella palustris) were therefore used as well. Also, occurrence of these groups of MOB is unlikely in the investigated low-centred polygon due to its pH values, temperature regime and salinity. Still, in order to reliably exclude their presence, specific primers and probes for Methylocella and Methylocapsa (Dedysh et al., 2003) and the methanotroph specific 16S rRNA gene primers recently designed by Chen and colleagues (2007) should be applied as well. Additionally, a statistical validation of the presented data needs to be discussed. Soils are very complex systems displaying an extremely high micro-heterogeneity. Low-centred polygons are representative for high-arctic polygonal tundra environments, in particular for those on Samoylov Island (chapter 2.2). Still, in order to extrapolate from the ecology of MOB in selected sites within the polygonal tundra to that of polygonal tundra environments of the Lena Delta in general, MOB within numerous low-centred polygons, and also within other units of polygonal tundra sites such as polygonal lakes and high-centred polygons need to be investigated. This illustrates the enormous demand in particular in terms of time, facilities and expenses
SYNTHESIS
70
required to obtain a comprehensive and validated understanding of the ecology of MOB in polygonal tundra environments of the Lena Delta in general and raises questions whether such broad problem is appropriate in the frame of a cumulative Ph.D. thesis. Despite these critical remarks, the outcomes of the present work revealed manifold interesting insights into the methanotrophic ecology in polygonal tundra sites of the Lena Delta that require further investigations; in particular considering the high level of specialization and the restricted diversity of MOB observed.
The temperature response of potential methane oxidation rates observed in this study indicated that in Siberian active layer profiles different communities are responsible for the oxidation of methane near the surface and near the permafrost table. This shift of community structure between near surface and near permafrost table samples could not be confirmed based on the phylogenetic analysis carried out in this study (chapter 4). Further analysis, in particular more pmoA gene sequences, are necessary to obtain a well founded understanding on whether the composition of MOB changes with active layer depth or if different members of the same community are responding near the surface than near the permafrost table. To approach this question, it is also necessary to identify which members of the methanotrophic community are actively oxidizing methane across the geochemical gradients of Siberian active layers. The active methanotrophic community could, for example, be detected by applying stable isotope probing (SIP), and reverse transcriptase (RT-PCR) of expressed mRNA of the pmoA gene, respectively. One has to keep in mind, though, that the last method requires preservation of mRNA which is difficult from a logistic point of view for samples from the Lena Delta. Through SIP also possible anaerobic methane oxidizers and zones with anaerobic methane oxidation as discussed in chapter 1.4 could be identified. The potential methane oxidation rates determined in this study allowed for an indirect estimation on how much methane gets oxidized in Siberian permafrost soils. Measuring methane oxidation rates in-situ, however, would allow for a more direct quantification of the capacity of the methanotrophic community in the polygonal tundra environments of the Lena Delta. In-situ quantifications of methane oxidation rates could, for example, be carried out through gas push-pull tests (Urmann et al., 2005) which would prevent disturbance of the soil matrix and manipulation of the methanotrophic community through incubation in the lab. This study showed that the methanotrophic community in the investigated polygonal tundra sites is well adapted to the extreme temperature regime in Siberian permafrost soils. Except for indications that the adaptation of microbial communities to the temperature regime in this habitat is regulated by the amount of short chain fatty acids within the cell membranes (chapter 8.1), the process of temperature adaptation of the methanotrophic community in permafrost soils of the Lena Delta remains poorly understood. Concerning this, culture dependant approaches are
SYNTHESIS
71
essential to isolate MOB from the habitat and to subsequent characterize their physiology, cellular fatty acid composition, and gene expression regulation. A culture dependant approach with active layer samples from Samoylov Island already revealed enrichments dominated by MOB closely related to Methylobacter psychrophilus (chapter 8.5). Further cultivation is in progress. Based on the restricted diversity and high level of specialization discovered in this work, the methanotrophic community in polygonal tundra environments of the Lena Delta might be poorly flexible to react to changing environmental conditions. However, an understanding on the stability of the methanotrophic community requires a screening of its abundance and diversity over time and space. The methanotrophic dynamic needs to be investigated in several sites within polygonal tundra environments during arctic summer and including the periods of thawing and refreezing. This could be achieved through, for example, a combination of qPCR with molecular fingerprinting methods such as terminal restriction fragment length polymorphisms (T-RFLP) and DGGE. Considering the currently rising surface temperatures and the thickening of the active layer in the Russian Arctic (chapter 1.1), the stability of the methanotrophic community will be of particular importance with regard to the capacity of the biological methane sink in the polygonal tundra environments of the Lena Delta in the future.
REFERENCES
72
7. References The references of manuscript Diversity of aerobic methanotrophic bacteria in a permafrost soil of the Lena Delta, Siberia are specified according to numbers and are therefore placed in front of the summarized list of references. References of chapter 4: 1. Bosse, U., and Frenzel, P. (1997) Activity and distribution of methane-oxidizing
bacteria in flooded rice soil microcosms and rice plants (Oryza sativa). ApplEnviron Microbiol 63: 1199-1207
2. Bosse, U., and Frenzel P. (1998) Methane emissions from rice-microcosms – the balance of production, accumulation and oxidation. Biogeochemistry 41:199-214
3. Bourne, D.G., McDonald, I.R., and Murrell, J.C. (2001) Comparison of pmoA PCR Primer sets as Tools for Investigating Methanotroph Diversity in Three Danish Soils. Appl Environ Microbiol 67: 3802-3809
4. Bowman, J.P., McCammon, S.A., and Skerratt, M.G. (1997) Methylosphaerahansonii gen. nov., sp. nov., a psychrophilic, group I methanotroph from Antarctic, marine salinity, meromictic lakes. Microbiology (UK) 143: 1451-1459
5. Bowman, J.P. (1999) The Methanotrophs – The families Methylococcaceae and Methylocystaceae In: The Prokaryotes (Dworkin, M. Edt), Springer, New York
6. Cao, M., Marshall, S., and Gregson, K. (1996) Global carbon exchange and methane emission from natural wetlands: application of a process-based model. J Geophys Res 101: 14399-14414
7. Christensen, T.R., Prentice, I.C., Kaplan, J., Haxeltine, A., and Sitch, S. (1996), Methane flux from northern wetlands and tundra: An ecosystem source modelling approach, Tellus Chem Phys Meteorology 48: 652-661
8. Costello A.M., and Lidstrom, M.E. (1999) Molecular characterization of Functional and Phylogenetic Genes from Natural Populations of Methanotrophs in Lake Sediments. Appl Environ Microbiol 65: 5066-5074
9. Dedysh, S.N., Liesack, W., Khmelenina, V.N., Suzina, N.E., Trotsenko, Y.A., Semrau, J.D., Bares, A.M., Panikov, N.S., and Tiedje, J.M. (2000) Methylocellapalustris gen. nov., sp. nov., a new methane oxidizing acidophilic bacterium from peat bogs, representing a novel subtype of serine-pathway methanotrophs. Int J Syst Evol Microbiol 50: 955–969
10. Dedysh, S.N., Horz, H.-P., Dunfield, P.E., and Liesack W (2001) A novel pmoA lineage represented by the acidophilic methanotrophic bacterium Methylocapsaacidiphila B2. Arch Microbiol 177: 117–121.
11. Dedysh, S.N., Khmelenina, V.N., Suzina, N.E., Trotsenko, Y.A., Semrau, J.D., Liesack, W., and Tiedje, J.M. (2002) Methylocapsa acidiphila gen. nov., sp. nov., a novel methane-oxidizing and dinitrogenfixing acidophilic bacterium from Sphagnum bog. Int J Syst Evol Microbiol 52: 251–261
12. Dedysh, S.N., Berestovskaya, Y.Y., Vasilieva, L.V., Belova, S.E., Khmelenina, V.N., Suzina, N.E., Trotsenko, Y.A., Liesack, W., and Zavarzin, G.A. (2004) Methylocella tundrae sp. nov., a novel methanotrophic bacterium from acidic tundra peatlands. Int J Syst Evol Microbiol 54: 151-156
13. Dunfield, P., Knowles, R., Dumont, and R., Moore, T. (1993) Methane Production and Consumption in Temperate and Subarctic Peat Soils: Response to Temperature and pH, Soil Biol Biochem 25: 321-326
REFERENCES
73
14. Edgar, R.C. (2004) MUSCLE: multiple sequence alignment with high accuracy and high throughput. Nucleic Acids Res 32: 1792-1797
15. Eller, G., Stubner, S., and Frenzel, P. (2001) Group-specific 16 rRNA targeted probes for detection of type I and type II methanotrophs by fluorescence in situ hybridisation. FEMS Microbiol Lett 198: 91-97
16. Felsenstein, J. (1989) PHYLIP-Phylogeny Inference Package (version 3.2). Cladistics 5: 164-166
17. Fiedler, S., Wagner, D., Kutzbach, L., and Pfeiffer, E.M. (2004) Element Redistribution along Redox Gradients of Low-Centred-Polygons, Lena Delta, Northern Siberia. Soil Sci Soc Am J 68: 1002-1011
18. Fung, I., John, J., Lerner, J., Matthews, E., Prather, M., Steele, L.P., and Fraser, P.J. (1991) Three-dimensional model synthesis of the global methane cycle. JGeophys Res 96: 13033-13065
19. Ganzert, L., Jurgens, G., Münster, U., and Wagner, D. (2007) Methanogenic communities in permafrost-affected soils of the Laptev Sea coast, Siberian Arctic, characterized by 16S rRNA gene fingerprints. FEMS Microbiol Ecol 59:476-488
20. Guindon, S., and Gascuel, O. (2003). A simple, fast, and accurate algorithm to estimate large phylogenies by maximum likelihood. Syst Biol 52: 696–704
21. Hanson, R.S., and Hanson, T.E. (1996) Methanotrophic Bacteria. Microbiol Rev 60: 439-471
22. Henckel, T., Frierich, M., and Conrad, R. (1999) Molecular Analyses of the Methane-Oxidizing Microbial Community in Rice Field Soil by Targeting the Genes of the 16S rRNA, Particulate Methane Monooxygenase, and Methanol Dehydrogenase. Appl Environ Microbiol 65: 1980-1990
23. Henckel, T., Jäckel, U., Schnell, S., and Conrad, R. (2000) Molecular Analysis of Novel Methanotrophic Communities in Forest Soils That Oxidize Atmospheric Methane. Appl Environ Microbiol 66: 1801-1808
24. Henckel, T., Jäckel, U., and Conrad, R. (2001) Vertical distribution of the methanotrophic community after drainage of rice field soil. FEMS Microbiol Ecol34: 279-291
25. Heyer, J., Berger, U., Hardt, M., and Dunfield, P.F. (2005) Methylohalobius crimeensis gen. nov., sp. nov., a moderately halophilic, methanotrophic bacterium isolated from hypersaline lakes of Crimea. Int J Syst Evol Microbiol 55: 1817-1826
26. Holmes, A.J., Costello, A., Lidstrom M.E., and Murrell J.C. (1995) Evidence that particulate methane monooxygenase and ammonia monooxygenase may be evolutionarily related. FEMS Microbiol Lett 132: 203-208
27. Houghton, J.T., Ding, Y., Griggs, D.J., Noguer, M., v.d. Linden, P.J., and Xiaosu, D. (Eds.) (2001), Climate Change 2001: The Scientific Basis. Contribution of Working Group I to the Third Assessment Report of the Intergovernmental Panel on Climate Change, 944 pp., Cambridge University Press, UK.
28. Horz, H.P., Yimga, M.T., and Liesack, W. (2001) Detection of methanotroph diversity on roots of submerged rice plants by molecular retrieval of pmoA,mmoX, mxaF, and 16 S rRNA and ribosomal DNA, including pmoA- based terminal restriction fragment length polymorphism profiling. Appl Environ Microbiol 67: 4177-4185
29. Horz, H.P., Rich, V., Avrahami, S., and Bohannan, B.J.M. (2005) Methane-Oxidizing Bacteria in a California Upland Grassland Soil: Diversity and Response to Stimulated Global Change. Appl Environ Microbiol 71: 2642-2652
REFERENCES
74
30. Huber, T., Faulkner, G., and Hugenholtz, P. (2004) Bellerophon; a program to detect chimeric sequences in multiple sequence alignments. Bioinformatics 20: 2317-2319
31. Kaluzhnaya, M.G., Makutina, V.A., Rusakova, T.G., Nikitin, D.V., Khmelenina, V.N., Dmitriev, V.V., and Trotsenko, Y.A. (2002) Methanotrophic communities in the soils of the Russian northern taiga and subarctic tundra. Microbiology 71: 223-227 (translated from Mikrobiologiya)
32. Khmelenina, V.N., Makutina, V.A., Kaluzhnaya, M.G., Rivkina, E.M., Gilichinsky, D.A., and Trotsenko, Y.A. (2001) Discovery of viable methanotrophic bacteria in permafrost sediments of northeast Siberia. Dokl Biol Sci 384: 235-237 (English translation)
33. Kolb, S., Knief, C., Dunfiled, P.F., and Conrad, R. (2005) Abundance and activity of uncultured methanotrophic bacteria in the consumption of atmospheric methane in two forest soils. Environ Microbiol 7: 1150-1161
34. Lane, D. J. (1991) 16S/23S rRNA Sequencing, p.115-175, In E. Stackebrandt and M. Goodfellow (ed.), Nucleic acid techniques in bacterial systematics. John Wiley & Sons Ltd., Chichester, United Kingdom
35. Lau, E., Ahmad, A., Steudler, P.A., and Cavanaugh, C.M. (2007) Molecular characterization of methanotrophic communities in forest soils that consume atmospheric methane. FEMS Microbiol Ecol 60: 490-500
36. Le Mer, J., and Roger, P. (2001) Production, oxidation, emission and consumption of methane by soils: A review. Eur J Soi Bio 37: 25-50
37. Liebner, S., and Wagner, D. (2007), Abundance, distribution and potential activity of methane oxidizing bacteria in permafrost soils from the Lena Delta, Siberia. Environ Microbiol 9: 107–117
38. Macalady J.L., McMillan A.M., Dickens A.F., Tyler S.C., and Scow K.M. (2002) Population dynamics of type I and II methanotrophic bacteria in rice soils. Environ Microbiol 4: 148-157
39. McDonald, I.R. Hall, G.H., Pickup, R.W., and Murrell J.C. (1996) Methane oxidation potentials and preliminary analysis of methanotrophs in a blanket bog peat using molecular ecology techniques. FEMS Microbiol Ecol 21: 197-211
40. McDonald, I.R., and Murrell, J.C. (1997) The particulate methane monooxygenase gene pmoA and its use as a functional gene probe for methanotrophs. FEMS Microboil Lett 156: 205-210
41. Omelchenko, M.B., Vasieleva, L.V., Zavarzin, G.A., Savelieva, N.D., Lysenko, A.M., Mityushina, L.L., Khmelenina, V.N., and Trotsenko, Y.A. (1996) A novel psychrophilic methanotroph of the genus Methylobacter. Microbiology 65: 339-343 (translated from Mikrobiologiya)
42. Pester, M., Friedrich, M.W., Schink, B., and Brune, A. (2004) pmoA-Based Analysis of Methanotrophs in a Littoral Lake Sediment Reveals a Diverse and Stable Community in a Dynamic Environment. Appl Environ Microbiol 70: 3138-3142
43. Radajewski, S., Webster, G., Reay, D.S., Morris, S.A., Ineson, P., Nedwell, D.B., Prosser, J.I., and Murrell, C.J. (2002) Identification of active methylotroph populations in an acidic forest soil by stable-isotope probing. Microbiology 148: 2331-2342
44. Rahalkar, M., and Schink, B. (2007) Comparison of Aerobic Methanotrophic Communities in Littoral and Profundal Sediments of Lake Constance by a Molecular Approach. Appl Environ Microbiol 73: 4389-4394
REFERENCES
75
45. Rahalkar, M., Bussmann, I., and Schink, B. (2007) Methylosoma difficile gen. nov., sp. nov., a novel methanotroph enriched by gradient cultivation from littoral sediment of Lake Constance. Int J Syst Evol Microbiol 57: 1073-1080
46. Ricke, P., Kube, M., Nakagawa, S., Erkel, C., Reinhardt, R., and Liesack, W. (2005) First Genome Data from Uncultured Upland Soil Cluster Alpha Methanotrophs Provide Further Evidence for a Close Phylogenetic Relationship to Methylocapsa acidophila B2 and for High-Affinity Methanotrophy Involving Particulate Methane Monooxygenase. Appl Environ Microbiol 71: 7472-7482
47. Roslev, P., and King, G.M. (1996) Regulation of methane oxidation in a freshwater wetland by water table changes and anoxia. FEMS Microbiol Ecol 19: 105-115
48. Schloss, P.D., and Handelsman, J. (2004) Status of the Microbial Census. Microbiol Mol Biol Rev 68: 686-691
49. Schloss, P.D., and Handelsman, J. (2005) Introducing DOTUR, a computer program for defining operational taxonomic units and estimating species richness. Appl Environ Microbiol 71: 1501-1506
50. Schwamborn, G., Rachold, V., and Grigoriev, M.N. (2002) Late Quaternary sedimentation history of the Lena Delta. Quaternary International 89: 119-134
51. Seeberg-Elverfeldt, J., Schlueter, M., Feseker, T., and Köllig, M. (2005) Rhizon sampling of porewaters near the sediment-water interface of aquatic systems. Limnology and Oceanography: Methods 3: 361-371
52. Stoecker, K., Bendinger, B., Schöning, B., Nielsen, P.H., Nielsen, J.L., Baranyi, C., Toenshoff, E.R., Daims, H., and Wagner, M. (2006) Cohn’s Crenothrix is a filamentous methane oxidizer with an unusual methane monooxygenase. PROC NATL ACAD SCI 14: 2363-2367
53. Trotsenko, Y.A., and Khmelenina, V.N. (2005) Aerobic methanotrophic bacteria of cold ecosystems. FEMS Microbio Ecol 53: 15-26
54. Tsubota, J., Eshinimaev, B.T., Khmelenina, V.N., and Trotsenko, Y.A. (2005) Methylothermus thermalis gen. nov., sp. nov., a novel moderately thermophilic obligate methanotroph from a hot spring in Japan. Int J Syst Evol Microbiol 55: 1877-1884
55. Wagner, D., Lipski, A., Embacher, A., and Gattinger, A. (2005) Methane fluxes in extreme permafrost habitats of the Lena Delta: effects of microbial community structure and organic matter quality. Environ Microbiol 7: 1582-1592
56. Wagner, D. (2008) Microbial Communities and Processes in Arctic Permafrost Environments. In: Microbiology of Extreme Soils (P. Dion and S.N. Chandra, eds.), Soil Biology 13: 133-154, Springer-Verlag Berlin
57. Wartiainen, I., Hestnes, A.G., and Svenning, M.M. (2003) Methanotrophic diversity in high arctic wetlands on the islands of Svalbard (Norway) — denaturing gradient gel electrophoresis analysis of soil DNA and enrichment cultures. Can J Microbiol 49: 602-612
58. Wartiainen, I., Hestnes, A.G., McDonald, I.R., and Svenning, M.M. (2006) Methylobacter tundripaludum sp. nov., a novel methanotrophic bacterium from Arctic wetland soil, Svalbard, Norway (78° N). Int J Syst Evol Microbiol 56: 109-113
59. Wise, M.G., McArthur, J.V., and Shimkets, L.J. (1999) Methanotroph Diversity in Landfill Soil: Isolation of Novel Type I and Type II Methanotrophs Whose Presence Was Suggested by Culture-Independent 16S Ribosomal DNA Analysis. Appl Environ Microbiol 65: 4887-4897
REFERENCES
76
60. Wise, M.G., McArthur, J.V., and Shimkets, L.J. (2001) Methylosarcina fibrata gen. nov. sp. nov. and Methylosarcina quisquiliarum sp. nov., novel type I methanotrophs. Int J Syst Evol Microbiol 51: 611-621
Summarized List of References: Abell, G.C.J., and Bowman, J.P. (2005) Ecological and bio-geographic relationships
of class Flavobacteria in the Southern Ocean. FEMS Microbiol Ecol 51: 265-277 Acinas, S.G., Klepac-Ceraj, V., Hunt, D.E., Pharino, C., Ceraj, I., Distel, D.L., and
Polz, M.F. (2004) Fine-scale phylogenetic architecture of a complex bacterial community. Nature 430: 551-554
Allison, V.J., Yermakov, Z., Miller, R.M., Jastrow, J.D., and Matamala, R. (2007a) Using landscape and depth gradients to decouple the impact of correlated environmental variables on soil microbial community composition. Soil Biol Biochem 39: 505-516
Allison, V.J., Yermakov, Z., Miller, R.M., Jastrow, J.D., and Matamala, R. (2007b) Assessing Soil Microbial Community Composition Across Landscapes: Do Surface Soils Reveal Patterns? Soil Sci Soc Am J 71: 730-734
Amann, R., Binder, B.J., Olson, R.J., Chisholm, S.W., Devereux, R., and Stahl, D.A. (1990) Combination of 16S rRNA-targeted oligonucleotide probes with flow cytometry for analyzing mixed microbial populations. Appl Environ Microbiol 56: 1919-1925
Amann, R., Ludwig, W., and Schleifer, K.H. (1995) Phylogenetic identification and in situ detection of individual microbial cells without cultivation. FEMS Microbiol Rev 59: 143-169
Anisimov, O.A., Nelson, F.E., and Pavlov, A.V. (1999) Predictive scenarios of permafrost development under conditions of global climate change in the XXI century. Earth Cryol 3: 15-25
Are, F., and Reimnitz, E. (2000) An overview of the Lena River Delta settings: geology, tectonics, geomorphology, and hydrology. J Coast Res 16: 1083-1093
Bender, M., and Conrad, R. (1992) Kinetics of CH4 oxidation in oxic soils exposed to ambient air or high CH4 mixing ratios. FEMS Microbiol Ecol 101: 261-270
Bender, M., and Conrad, R. (1993) Kinetics of methane oxidation in oxic soils. Chemosphere 26: 687-696
Bender, M., and Conrad, R. (1994) Methane oxidation activity in various soils and freshwater sediments: occurrence, characteristics, vertical profiles and distribution on grain size fractions. J Geophys Res 99: 16531-16540
Bender, M., and Conrad, R. (1995) Effect of methane concentrations and soil conditions on the induction of methane oxidation activity. Soil Biol Biochem 27: 1517-1527
Bent, S.J., Pierson, J.D., and Forney, L.J. (2007) Measuring Species Richness Based on Microbial Community Fingerprints: the Emperor Has no Clothes. ApplEnviron Microbiol 73: 2399-2401
Blackwood, C.B., Hudleston, D., Zak, D.R., and Buyer, J.S (2007) Interpreting Ecological Diversity Indices Applied to Terminal Restriction Fragment Length Polymorphism Data: Insights from Simulated Microbial Communities. Appl Environ Microbiol 73: 5276-5283
Bodegom, P.v., Stams, F., Mollema, L., Boeke, S., and Leffelaar, P. (2001) Methane oxidation and the competition for oxygen in the rice rhizosphere. Appl Environ Microbiol 67: 3586-3597
REFERENCES
77
Bodrossy, L., Stralis-Pavese, N., Murrell, J.C., Radajewski, S., Weilharter, A., and Sessitsch, A. (2003) Development and validation of a diagnostic microbial microarray for methanotrophs. Environ Microbiol 5: 566-582
Boetius, A., Ravenschlag, K., Schubert, C.J., Rickert, D., Widdel, F., Gieseke, A., Amann, R., Jørgensen, B.B., Witte, U., and Pfannuche, O. (2000) A marine microbial consortium apparently mediating anaerobic oxidation of methane. Nature 407: 623-626
Bohannan, B.J.M., and Hughes, J. (2003) New approaches to analyzing microbial biodiversity data. Curr Op Microbiol 6: 282-287
Borne, M., Dorr, H., and Levin, I. (1990) Methane consumption in aerated soils of the temperate zone. Tellus 42: 2-8
Bosse, U., and Frenzel, P. (1997) Activity and distribution of methane-oxidizing bacteria in flooded rice soil microcosms and rice plants (Oryza sativa). ApplEnviron Microbiol 63: 1199-1207
Bosse, U., and Frenzel P. (1998) Methane emissions from rice-microcosms – the balance of production, accumulation and oxidation. Biogeochem 41: 199-214
Bourne, D.G., McDonald, I.R., and Murrell, J.C. (2001) Comparison of pmoA PCR Primer sets as Tools for Investigating Methanotroph Diversity in Three Danish Soils. Appl Environ Microbiol 67: 3802-3809
Bowman, J.P., Skerratt, J.H., Nichols, P.D., and Sly, L.I. (1991) Phospholipid fatty acid and lipopolysaccharide fatty acid signature lipids in methane-utilizing bacteria. FEMS Microbiol Ecol 59: 2380-2387
Bowman, J.P., McCammon, S.A., and Skerratt, M.G. (1997a) Methylosphaera hansonii gen. nov., sp. nov., a psychrophilic, group I methanotroph from Antarctic, marine salinity, meromictic lakes. Microbiology (UK) 143: 1451-1459
Bowman, J.P., McCammon, S.A., Brown, M.V., Nichols, D.S., and McMeekin (1997b) Diversity and Association of Psychrophilic Bacteria in Antarctic Sea Ice. ApplEnviron Microbiol 63: 3068-3078
Bowman, J.P. (1999) The Methanotrophs – The families Methylococcaceae and Methylocystaceae In: The Prokaryotes (Dworkin, M. Edt), Springer, New York
Brinkmeyer, R., Knittel, K., Jürgens, J., Weyland, H., Amann, R., and Helmke, E. (2003) Diversity and Structure of Bacterial Communities in Arctic versus Antarctic Pack Ice. Appl Envion Microbiol 69: 6610-6619
Buckley, D.H., and Schmidt, T.M. (2002) Exploring the biodiversity of soil – a microbial rain forest. In: Biodiversity of Microbial Life, J.T. Staley, and A.L. Reysenbach (Eds.). Wiley-Liss, New York, pp: 183 208.
Bulmer, M.G. (1974) On fitting the Poisson lognormal distribution to species abundance data. Biometrics 30: 101-110
Cao, M., Marshall, S., and Gregson, K. (1996) Global carbon exchange and methane emission from natural wetlands: application of a process-based model. JGeophys Res 101: 14399-14414
Cavicchioli, R. (2006) Cold-adapted archaea. Nature 4: 331-343 Cavigelli, M.A., and Robertson, G.P. (2001) Role of denitrifier diversity in rates of
nitrous oxide consumption in a terrestrial ecosystem. Soil Biol Biochem 33: 297-310
Chao, A. (1984) Non-parametric estimation of the number of classes in a population. Scand J Stat 11: 265-270
Chao, A. (1987) Estimating the population size for capture-recapture data with unequal catchability. Biometrics 43: 783-791
Chao, A., and Lee, S.-M. (1992) Estimating the number of classes via sample coverage. J Am Stat Ass 87: 210-217
REFERENCES
78
Chen, Y., Dumont, M.G., Cébron, A., and Murrell, J.C. (2007) Identification of active methanotrophs in a landfill cover soil through detection of expression of 16S rRNA and functional genes. Environ Microbiol 9: 2855-2869
Christensen, T.R., Prentice, I.C., Kaplan, J., Haxeltine, A., and Sitch, S. (1996), Methane flux from northern wetlands and tundra: An ecosystem source modelling approach, Tellus Chem Phys Meteorology 48: 652-661
Christensen, T.R., Jonasson, S., Havstroem, M., and Livens, F.R. (1999) Carbon cycling and methane exchange in Estuarine tundra ecosystems. AMBIO 28: 239-244
Corradi, C., Kolle, O., Walter, K., Zimov, S.A., and Schulze, E.D. (2005) Carbon dioxide and methane exchange of a north-east Siberian tussock tundra. GlobalChange Biology 11: 1-16
Costello A.M., and Lidstrom, M.E. (1999) Molecular characterization of Functional and Phylogenetic Genes from Natural Populations of Methanotrophs in Lake Sediments. Appl Environ Microbiol 65: 5066-5074
Daims, H., Bruehl, A., Amann, R., Schleifer, K.H., and Wagner, M. (1999) The domain specific probe EUB338 is insufficient for the detection of all Bacteria, development and evaluation of a more comprehensive probe set. Syst Appl Microbiol, 22: 434-444
Davidson, E.A., Janssens, I.A., and Luo, Y. (2006) On the variability of respiration in terrestrial ecosystems: moving beyond Q10. Global Change Biology 12: 154-164
Dedysh, S.N., Liesack, W., Khmelenina, V.N., Suzina, N.E., Trotsenko, Y.A., Semrau, J.D., Bares, A.M., Panikov, N.S., and Tiedje, J.M. (2000) Methylocellapalustris gen. nov., sp. nov., a new methane oxidizing acidophilic bacterium from peat bogs, representing a novel subtype of serine-pathway methanotrophs. Int J Syst Evol Microbiol 50: 955–969
Dedysh, S.N., Horz, H.-P., Dunfield, P.E., and Liesack W (2001) A novel pmoA lineage represented by the acidophilic methanotrophic bacterium Methylocapsaacidiphila B2. Arch Microbiol 177: 117–121
Dedysh, S.N., Khmelenina, V.N., Suzina, N.E., Trotsenko, Y.A., Semrau, J.D., Liesack, W., and Tiedje, J.M. (2002) Methylocapsa acidiphila gen. nov., sp. nov., a novel methane-oxidizing and dinitrogenfixing acidophilic bacterium from Sphagnum bog. Int J Syst Evol Microbiol 52: 251–261
Dedysh, S.N., Dunfield, P.F., Derakshani, M., Stubner, S., Heyer, J., and Liesack, W. (2003) Differential detection of type II methanotrophic bacteria in acidic peatlands using newly developed 16S rRNA-targeted fluorescent oligonucleotide probes. FEMS Microbiol Ecol 43: 299-308
Dedysh, S.N., Berestovskaya, Y.Y., Vasilieva, L.V., Belova, S.E., Khmelenina, V.N., Suzina, N.E., Trotsenko, Y.A., Liesack, W., and Zavarzin, G.A. (2004) Methylocella tundrae sp.nov., a novel methanotrophic bacterium from acidic tundra peatlands. Intern J Syst Evol Microbiol 54: 151-156
Dunbar, J., Takala, S., Barns, S.M., Davis, J.A., and Kuske, C.R. (1999) Levels of Bacterial Community Diversity in Four Arid Soils Compared by Cultivation and 16S rRNA Gene Cloning. Appl Environ Microbiol 65: 1662-1669
Dunbar, J., Barns, S.M., Lawrence, O.T., and Kuske, C.R. (2002) Empirical and Theoretical Bacterial Diversity in Four Arizona Soils. Appl Environ Microbiol 68:3035-3045
Dunfield, P., Knowles, R., Dumont, R., and Moore, T.R. (1993) Methane production and consumption in temperate and subarctic peat soils: response to temperature and pH. Soil Biol Biochem 25: 321-326
REFERENCES
79
Dutta, K., Schuur, E.A.G., Neff, J.C., and Zimov, S.A. (2006) Potential carbon release from permafrost soils of Northeastern Siberia. Global Change Biology 12: 2336-2351
Edgar, R.C. (2004) MUSCLE: multiple sequence alignment with high accuracy and high throughput. Nucleic Acids Res 32: 1792-1797
Eller, G., Stubner, S., and Frenzel, P. (2001) Group-specific 16 rRNA targeted probes for detection of type I and type II methanotrophs by fluorescence in situ hybridisation. FEMS Microbiol Lett 198: 91-97
Eller, G., Krüger, M., and Frenzel, P. (2004) Comparing field and microcosm experiments: a case study on methano- and methylotrophic bacteria in paddy soil. FEMS Microbiol Ecol 51: 279-291
Elvert, M.E., Suess, J., Greinert, J., and Whiticar, M.J. (2000) Archaea mediating anaerobic methane oxidation in deep-sea sediments at cold seeps of the eastern Aleutian subduction zone. Organ Geochem 31: 1175-1187
Felsenstein, J. (1989) PHYLIP-Phylogeny Inference Package (version 3.2). Cladistics 5: 164-166
Fiedler, S., Wagner, D., Kutzbach, L., and Pfeiffer, E.M. (2004) Element Redistribution along Hydraulic and Redox Gradients of Low-Centred Polygons, Lena Delta, Northern Siberia. Soil Sci Soc Am J 68: 1002-1011
Fierer, N., Schimel, J.P., and Holden, P.A. (2003) Variations in microbial community composition through two soil depth profiles. Soil Biol Biochem 35: 167-176
Fierer, N., and Jackson, R.B. (2006) The biodiversity and biogeography of soil bacterial communities. PROC NATL ACAD SCI 103: 626-631
French, H.M. (1996) The Periglacial Environment. Longman, London Friborg, T., Soegaard, H., Christensen, T.R., Lloyd, C.R., and Panikov, N. (2003)
Siberian wetlands: where a sink is a source. Geophys Res Lett 30: 2129 Fung, I., John, J., Lerner, J., Matthews, E., Prather, M., Steele, L.P., and Fraser, P.J.
(1991) Three-dimensional model synthesis of the global methane cycle. JGeophys Res 96: 13033-13065
Galchenko, V.F. (1994) Sulfate reduction, methane production and methane oxidation in various water bodies of the Bunger Hills Oasis of Antarctica. Microbiology 63: 388-396 (translated from Mikrobiologya)
Ganzert, L., Jurgens, G., Münster, U., and Wagner, D. (2007) Methanogenic communities in permafrost-affected soils of the Laptev Sea coast, Siberian Arctic, characterized by 16S rRNA gene fingerprints. FEMS Microbiol Ecol 59:476-488
Georlette, D., Blaise, V., Collins, T., D’Amico, S., Gratia, E., Hoyoux, A., Marx, J.C., Sonan, G., Feller, G., and Gerdady, C. (2004) Some like it cold: biocatalysis at low temperatures. FEMS Microbiol Rev 28: 25-42
Grosse, G., Schirrmeister, L., and Malthus, T.J. (2006) Application of Landsat-7 satellite data and a DEM for the quantification of thermokarst-affected terrain types in the periglacial Lena-Anabar coastal lowland. Polar Res 25: 51-67
Großkopf, R. (1994) Entwicklung eines molekularen Nachweissystems (PCR) für methanoxidierende Bakterien basierend auf Gensequenzen der löslichern Methanmonooxygenase. Diploma thesis. Philipps-Universität Marburg, Marburg, Germany
Guindon, S., and Gascuel, O. (2003). A simple, fast, and accurate algorithm to estimate large phylogenies by maximum likelihood. Syst Biol 52: 696–704
Hansen, A.A., Herbert, R.A., Mikkelsen, K., Jensen, L.L., Kristoffersen, T., Tiedje, J.M., Lomstein, B.A., and Finster, K.W. (2007) Viability, diversity and
REFERENCES
80
composition of the bacterial communuity in a high Arctic permafrost soil from Spitsbergen, Northern Norway. Environ Microbiol 9: 2870-2884
Hanson, R.S., and Hanson, T.E. (1996) Methanotrophic Bacteria. Microbiol Rev 60: 439-471
Heck, K.L., Belle, G.v., and Simberloff, D. (1975) Explicit calculation of the rarefaction diversity measurement and the determination of sufficient sample size. Ecology 56: 1459-1461
Heijnen, C.E., Hok-A-Hin, C.H., and Van Veen, J.A. (1992) Improvments to the use of bentonite clay as a protective agent increasing survival levels of bacteria introduced into soil. Soil Biol Biochem 24: 533-538
Henckel, T., Frierich, M., and Conrad, R. (1999) Molecular Analyses of the Methane-Oxidizing Microbial Community in Rice Field Soil by Targeting the Genes of the 16S rRNA, Particulate Methane Monooxygenase, and Methanol Dehydrogenase. Appl Environ Microbiol 65: 1980-1990
Henckel, T., Roslev, P., and Conrad, R. (2000a) Effects of O2 and CH4 on presence and activity of the indigenous methanotrophic community in rice field soil. Environ Microbiol 2: 666-679
Henckel, T., Jäckel, U., Schnell, S., and Conrad, R. (2000b) Molecular Analysis of Novel Methanotrophic Communities in Forest Soils That Oxidize Atmospheric Methane. Appl Environ Microbiol 66: 1801-1808
Henckel, T., Jäckel, U., and Conrad, R. (2001) Vertical distribution of the methanotrophic community after drainage of rice field soil. FEMS Microbiol Ecol34: 279-291
Heyer, J., and Suckow, R. (1984) Ökologische Untersuchungen der Methanoxidation in einem sauren Moorsee. Limnologica 6: 247-266
Heyer, J., Berger, U., Hardt, M., and Dunfield, P.F. (2005) Methylohalobius crimeensis gen. nov., sp. nov., a moderately halophilic, methanotrophic bacterium isolated from hypersaline lakes of Crimea. Int J Syst Evol Microbiol 55: 1817-1826
Holmes, A.J., Costello, A., Lidstrom M.E., and Murrell J.C. (1995) Evidence that particulate methane monooxygenase and ammonia monooxygenase may be evolutionarily related. FEMS Microbiol Lett 132: 203-208
Horz, H.P., Yimga, M.T., and Liesack, W. (2001) Detection of methanotroph diversity on roots of submerged rice plants by molecular retrieval of pmoA, mmoX, mxaF, and 16 S rRNA and ribosomal DNA, including pmoA- based terminal restriction fragment length polymorphism profiling. Appl Environ Microbiol 67: 4177-4185
Horz, H.P., Raghubanshi, A.S., Heyer, J., Kammann, C., Conrad, and R., Dunfield, P.F. (2002) Activity and community structure of methane-oxidising bacteria in a wet meadow soil. FEMS Microbiol Ecol 41: 247-257
Horz, H.P., Rich, V., Avrahami, S., and Bohannan, B.J.M. (2005) Methane-Oxidizing Bacteria in a California Upland Grassland Soil: Diversity and Response to Stimulated Global Change. Appl Environ Microbiol 71: 2642-2652
Houghton, J.T., Ding, Y., Griggs, D.J., Noguer, M., v.d. Linden, P.J., and Xiaosu, D. (Eds.) (2001), Climate Change 2001: The Scientific Basis. Contribution of Working Group I to the Third Assessment Report of the Intergovernmental Panel on Climate Change, 944 pp., Cambridge University Press, UK.
Høj, L., Olsen, R.A., and Torsvik, V.L. (2005) Archaeal communities in High Arctic wetlands at Spitsbergen, Norway (78°N) as characterised by 16S rRNA gene fingerprinting. FEMS Microbiol Ecol 53: 89-101
REFERENCES
81
Høj, L., Rusten, M., Haugen, L.E., Olsen, R.A., and Torsvik, V.L. (2006) Effects of Water regime on archaeal community composition in Arctic soils. Environ Microbiol 8: 984-996
Huber, T., Faulkner, G., and Hugenholtz, P. (2004) Bellerophon; a program to detect chimeric sequences in multiple sequence alignments. Bioinformatics 20: 2317-2319
Hughes, J.B., Hellmann, J.J., Ricketts, T.H., and Bohannan, B.J. (2001) Counting the uncountable: statistical approaches to estimating microbial diversity. ApplEnviron Microbiol 67: 4399-4406
Hutchens, E., Radajewski, S., Dumont, M.G., McDonald, I.R., and Murrell, J.C. (2004) Analysis of methanotrophic bacteria in Movile Cave by stable isotope probing. Environ Microbiol 6: 111-120
IPCC (2001) Climate Change 2001: The Scientific Basis. URL: http://www.grida.no/climate/ipcc_tar/wg1/index.htm
IPCC (2007) Climate Change 2007: Contribution of Working Group I to the Fourth Assessment Report of the Intergovernmental Panel on Climate Change, The Physical Basis of Climate Change: http://www.ipcc-wg2.org/index.html
Iversen, N., and Blackburn, H. (1981) Seasonal Rates of Methane Oxidation in Anoxic Marine Sediments. Appl Environ Microbiol 41: 1295-1300
Janssen, P.H. (2006) Identifying the Dominant Soil Bacterial Taxa in Libraries of 16S rRNA and 16S rRNA Genes. Appl Environ Microbiol 72: 1719-1728
Joabsson, A., and Christensen, T.R. (2001) Methane emissions from wetlands and their relationship with vascular plants: an Arctic example. Global Change Biology 7: 919-932
Joye, S.B., Boetius, A., Orcutt, B.N., Montoya, J.P., Schulz, H.N., Erickson, M.J., and Logo, S.K. (2004) The anaerobic oxidation of methane and sulphate reduction in sediments from Gulf of Mexico cold seeps. Chem Geol 205: 219-238
Kaluzhnaya, M.G., Khmelenina, Kotelnikova, S., Holmquist, L., Pedersen, K., and Trotsenko, Y.A. (1999) Methylomonas scandinavica gen. nov., sp. nov., a new methanotrophic psychrotrophic bacterium isolated from deep igneous rock ground water of Sweden. Syst Appl Microbiol 22: 565-572
Kaluzhnaya, M.G., Makutina, V.A., Rusakova, T.G., Nikitin, D.V., Khmelenina, V.N., Dmitriev, V.V., and Trotsenko, Y.A. (2002) Methanotrophic communities in the soils of the Russian northern taiga and subarctic tundra. Microbiology 71: 223-227 (translated from Mikrobiologiya)
Kaneda, T. (1991) Iso- and anteiso-fatty acids in bacteria: biosynthesis, function, and taxonomic significance. Microbiology Reviews 55: 288-302
Kassens, H., Bauch, H., Dmitrenko, I., Eicken, H., Hubberten, H.-W., and Melles, M. (1999) Land-Ocean systems in the Siberian Arctic: dynamics and history. Springer-Verlag, Berlin
Kettunen, A., Kaitala, V., Lehtinen, A., Lohila, A., Alm, J., Silvola, J., and Martikainen, P.J. (1999) Methane production and oxidation potentials in relation to water table fluctuations in two boreal mires. Soil Biol Biochem 31: 1741-1749
Khmelenina, V.N., Makutina, V.A., Kaluzhnaya, M.G., Rivkina, E.M., Gilichinsky, D.A., and Trotsenko, Y.A. (2001) Discovery of viable methanotrophic bacteria in permafrost sediments of northeast Siberia. Dokl Biol Sci 384: 235-237 (English translation)
Kim, M.K., and Jung, H.-Y. (2007) Chitinophaga terrae sp. nov., isolated from soil. Int J Syst Evol Microbiol 57: 1721-1724
REFERENCES
82
Knief, C., and Dunfield, P.F. (2005) Response and adaptation of different methanotrophic bacteria to low methane mixing ratios. Environ Microbiol 7: 1307-1317
Knief, C., Kolb, S., Bodelier, P.L.E., Lipski, A., and Dunfield, P.F. (2006) The active methanotrophic community in hydromorphic soils changes in response to changing methane concentration. Environ Microbiol 8: 321-333
Kobabe, S., Wagner, D., and Pfeiffer, E.M. (2004) Characterisation of microbial community composition of a Siberian tundra soil by fluorescence in situ hybridisation. FEMS Microbiol Ecol 50: 13-23
Kolb, S., Knief, C., Dunfield, P.F., and Conrad, R. (2005) Abundance and activity of uncultured methanotrophic bacteria involved in the consumption of atmospheric methane in two forest soils. Environ Microbiol 7: 1150-1161
Kreuzer-Martin, H.W. (2007) Stable Isotope Probing: Linking Functional Activity to Specific Members of Microbial Communities. Soil Sci Soc Am J 71: 611-619
Krueger, M., Eller, G., Conrad, R., and Frenzel, P. (2002) Seasonal variation in pathways of CH4 production and in CH4 oxidation in rice fields determined by stable carbon isotopes and specific inhibitors. Global Change Biology 8: 265-280
Kutzbach, L., Wagner, D., and Pfeiffer, E.M. (2004) Effect of microrelief and vegetation on methane emission from wet polygonal tundra, Lena Delta, Northern Siberia. Biogeochemistry 69: 341-362
Kutzbach, L., Wille, C., and Pfeiffer, E.-M. (2007) The exchange of carbon dioxide between wet arctic tundra and the atmosphere at the Lena River Delta, northern Siberia. Biogeosci Disc 4: 1953-2005
Lane, D. J. (1991) 16S/23S rRNA Sequencing, p.115-175, In E. Stackebrandt and M. Goodfellow (ed.), Nucleic acid techniques in bacterial systematics. John Wiley & Sons Ltd., Chichester, United Kingdom
Lau, E., Ahmad, A., Steudler, P.A., and Cavanaugh, C.M. (2007) Molecular characterization of methanotrophic communities in forest soils that consume atmospheric methane. FEMS Microbiol Ecol 60: 490-500
Le Mer, J., and Roger, P. (2001) Production, oxidation, emission and consumption of methane by soils: A review. Eur J Soi Bio 37: 25-50
Liebner, S. (2003) Verbreitung und Aktivität der methanotrophen Mikroflora in arktischen Böden des Lena-Deltas, Sibirien. Diploma thesis, University of Potsdam, Potsdam, Germany
Liebner, S., and Wagner, D. (2007), Abundance, distribution and potential activity of methane oxidizing bacteria in permafrost soils from the Lena Delta, Siberia. Environ Microbiol 9: 107–117
Liebner, S., Rublack, K., Stuehrmann, T., and Wagner, D. (submitted) Diversity of aerobic methanotrophic bacteria in a permafrost soil of the Lena Delta, Siberia. Microb Ecol
Lin, J.L., Radajewski, S., Eshinimaev, B.T., Trotsenko, Y.A., McDonald, I.R., and Murrell, J.C. (2004) Molecular diversity of methanotrophs in Transbaikal soda lake sediments and identification of potential active populations by stable isotope probing. Environ Microbiol 6: 1049-1060
Lozupone, C.A., and Knight, R. (2007) Global patterns in bacterial diversity. PROCNATL ACAD SCI 104: 11436-11440
Lueders, T., Wagner, B., Claus, P., and Friedrich, M.W. (2004) Stable isotope probing of rRNA and DNA reveals a dynamic methylotroph community and trophic interactions with fungi and protozoa in oxic rice field soil. Environ Microbiol 6: 60-72
REFERENCES
83
Macalady, J.L., McMillan, A.M., Dickens, A.F., Tyler, S.C., and Scow, K.M. (2002) Population dynamics of type I and II methanotrophic bacteria in rice soils. Environ Microbiol 4: 148-157
Magurran, A.E. (2004) Measuring Biological Diversity. Blackwell Science Ltd, UK, 248 pp.
Manz, W., Amann R., Ludwig, W., Wagner, M., and Schleifer, K.H. (1992) Phylogenetic oligodeoxynucleotide probes for the major subclasses of Proteobacteria: problems and solutions. Syst Appl Microbiol 15: 593 - 600.
Manz, W., Amann, R., Ludwig, W., Vancanneyt, M., and Schleifer K.H. (1996) Application of a suite of 16S rRNA-specific oligonucleotide probes designed to investigate bacteria of the phylum cytophaga-flavobacter-bacteroides in the natural environment. Microbiology 142: 1097-1106.
Margesin, R., Spröer, C., Schumann, P., and Schinner, F. (2003) Pedobacter cryoconitis sp. nov., a facultative psychrophile from alpine glacier cryoconite. IntJ Syst Evol Microbiol 53: 1291-1296
Mathur, J., Bizzoco, R.W., Ellis, D.G., Lipson, D.A., Poole, A.W., Levine, R., and Kelley, S.T (2007) Effects of Abiotic Factors on the Phylogenetic Diversity of Bacterial Communities in Acidic Thermal Springs. Appl Environ Microbiol 73: 2612-2623
McDonald, I.R. Hall, G.H., Pickup, R.W., and Murrell J.C. (1996) Methane oxidation potentials and preliminary analysis of methanotrophs in a blanket bog peat using molecular ecology techniques. FEMS Microbiol Ecol 21: 197-211
McDonald, I.R., and Murrell, J.C. (1997) The Methanol Dehydrogenase Structural Gene mxaF and Its Use as a Functional Gene Probe for Methanotrophs and Methylotrophs. Appl Environ Microbiol 63: 3218-3224
McDonald, I.R., and Murrell, J.C. (1999) The particulate methane monooxygenase gene pmoA and its use as a functional gene probe for methanotrophs. FEMS Microbiol Lett 156: 205-210
McDonald, I.R., Radajewski, S., and Murrell, J.C. (2005) Stable isotope probing of nucleic acids in methanotrophs and methylotrophs: A review. Org Geochem 36: 779-787
Meier H., Amann R., Ludwig W., and Schleifer K.H. (1999) Specific oligonucleotide probes for in situ detection of a major group of gram-positive bacteria with low DNA G+C content. Syst Appl Microbiol 22: 186-196
Michaelis, L., and Menten, M.L. (1913) Die kinetik der invertin wirkung. Biochemische Zeitung 49: 334-336
Mills, D., K., Entry, J.A., Gillevet, P.M., and Mathee, K. (2007) Assessing Microbial Community Diversity Using Amplicon Length Heterogeneity Polymerase Chain Reaction. Soil Sci Soc Am J 71: 572-578
Morita, R.Y. (1995) Low-Temperature Environ-ments. Encyclopedia of Microbiology, (Vol.2), Academic Press, San Diego
Muyzer, G., Teske, A., Wirsen, C.O., and Jannasch, H.W. (1995) Phylogenetic relationship of Thiomicrospira species and their identification in deep-sea hydrothermal vent samples by denaturing gradient electrophoresis of 16S rDNA fragments. Arch Microbiol 164: 165-172
Müller, L.A. (1997) Oberflächenstrukturen und Eigenschaften von Permafrostböden im nordsibirischen Lena-Delta. Zeitschrift für Pflanzenrnährung und Bodenkunde 160: 497-503
Nakatsu, C.H. (2007) Soil Microbial Community Analysis Using Denaturing Gradient Gel Electrophoresis. Soil Sci Soc Am J 71: 562-571
REFERENCES
84
Neef, A. (1997). Anwendung der in situ Einzelzell-Identifizierung von Bakterien zur Populationsanalyse in komplexen mikrobiellen Biozönosen. Doctoral thesis, Technische Universität München
Nelson, F.E., Anisimov, O.A., and Shiklomanov, N.I. (2001) Subsidence risk from thawing permafrost. Nature 410: 889–890
Neufeld, J.D., and Mohn, W.W. (2005) Unexpectedly High Bacterial Diversity in Arctic Tundra Relative to Boreal Forest Soils, Revealed by Serial Analysis of Ribosomal Sequence Tags. Appl Environ Microbiol 71: 5710-5718
Nichols, D.S., Nichols, P.D., and McMeekin, T.A. (1993) Polyunsaturated fatty acids in Antarctic bacteria. Antarc Sci 5: 149-160
Omelchenko, M.B., Vasieleva, L.V., Zavarzin, G.A., Savelieva, N.D., Lysenko, A.M., Mityushina, L.L., Khmelenina, V.N., and Trotsenko, Y.A. (1996) A novel psychrophilic methanotroph of the genus Methylobacter. Microbiology 65: 339-343 (translated from Mikrobiologiya)
Orcutt, E., Boetius, A., Elvert, M., Samarkin, V., and Joye, S.B. (2005) Molecular biogeochemistry of sulphate reduction, methanogenesis and anaerobic oxidation of methane at Gulf of Mexico cold seeps. Geochim Cosmochim Acta 69: 4267-4281
Orphan, V.J., House, C.H., Hinrichs, K.-U., McKeegan, K.D., and DeLong, E.F. (2001) Methane-consuming Archaea revealed by directly coupled isotopic and phylogenetic analysis. Science 293: 484-487
Ostroumov, V. (2004) Physico-chemical processes in cryogenic soils. In: Cryosols, Kimble, J.M. (Edt), Springer, Berlin, pp 347-364
Pedrós-Alió, C. (2006) Marine microbial diversity: can it be determined? TRENDS in Microbiology 14: 257-263
Pernthaler, J., Gloeckner, F.O., Schoenhuber, W., and Amann, R. (2001) Fluorescence in situ hybridization (FISH) with rRNA-targeted oligonucleotide probes. Methods in Microbiology: Marine Microbiology 30: 207-226
Pester, M., Friedrich, M.W., Schink, B., and Brune, A. (2004) pmoA-Based Analysis of Methanotrophs in a Littoral Lake Sediment Reveals a Diverse and Stable Community in a Dynamic Environment. Appl Environ Microbiol 70: 3138-3142
Post, W.M., Emanuel, W.R., Zinke, P.J., and Stangenberger, A.G. (1982) Soil carbon pools and world life zones. Nature 298: 156-159
Preston, F.W. (1948) The commonness and rarity of species. Ecology 29: 254-283 Radajewski, S., Ineson, P., Parekh, N.R., and Murrell, J.C. (2000) Stable-isotope
probing as a tool in microbial ecology. Nature 403: 646-648 Radajewski, S., Webster, G., Reay, D.S., Morris, S.A., Ineson, P., Nedwell, D.B.,
Prosser, J.I., and Murrell, J.C. (2002) Identification of active methylotroph populations in an acidic forest soil by stable-isotope probing. Microbiology 148: 2331-2342
Raghoebarsing, A.A., Pol, A., van de Pas-Schoonen, K.T., Smolders, A.J.P., Ettwig, K.F., Rijpstra, W.I., Schouten, S., Damsté, J.S.S., Op den Camp, H.J.M., Jetten, M.S.M., and Strous, M. (2006) A microbial consortium couples anaerobic methane oxidation to dentrification. Nature 440: 918-921
Rahalkar, M., and Schink, B. (2007a) Comparison of Aerobic Methanotrophic Communities in Littoral and Profundal Sediments of Lake Constance by a Molecular Approach. Appl Environ Microbiol 73: 4389-4394
Rahalkar, M., Bussmann, I., and Schink, B. (2007b) Methylosoma difficile gen. nov., sp. nov., a novel methanotroph enriched by gradient cultivation from littoral sediment of Lake Constance. Int J Syst Evol Microbiol 57: 1073-1080
REFERENCES
85
Ricke, P., Kube, M., Nakagawa, S., Erkel, C., Reinhardt, R., and Liesack, W. (2005) First Genome Data from Uncultured Upland Soil Cluster Alpha Methanotrophs Provide Further Evidence for a Close Phylogenetic Relationship to Methylocapsa acidophila B2 and for High-Affinity Methanotrophy Involving Particulate Methane Monooxygenase. Appl Environ Microbiol 71: 7472-7482
Rogers, S.W., Moormann, T.B., and Ong, S.K. (2007) Fluorescence in Situ Hybridization and Micro-autoradiography Applied to Ecophysiology in Soil. SoilSci Soc Am J 71: 620-631
Roller, C., Wagner, M., Amann, R., Ludwig, W., and Schleifer, K.H. (1994). In situ probing of Gram-positive bacteria with high DNA G+C content using 23S rRNA- targeted oligonucleotides. Microbiology 140: 2849-2858
Roslev, P., and King, G.M. (1996) Regulation of methane oxidation in a freshwater wetland by water table changes and anoxia. FEMS Microbiol Ecol 19: 105-115
Rosselló-Mora, R., and Amann, R. (2001) The species concept for prokaryotes. FEMS Microbiol Rev 25: 39-67
Rothschild, L.J., and Mancinelli, R.L. (2001) Life in extreme environments. Nature 409: 1092-1101
Sakamoto, M., and Benno, Y. (2006) Reclassification of Bacteroides distasonis, Bacteroides goldsteinii and Bacteroides merdae as Parabacteroides distasonis gen. nov., comb. nov., Parabcteroides goldsteinii comb. nov. and Parabacteroides merdae comb. nov. Int J Syst Evol Microbiol 56: 1599-1605
Saralov, A.I., Krylova, I.N., Saralova, E.E., and Kusnetsov, S.I. (1984) Distribution and species composition of methane-oxidizing bacteria in lake water. Microbiology 53: 695-701
Schimel, J. (1995) Ecosystem consequences of microbial diversity and community structure. In: c. F.S. Chapin, and C. Korner (Eds.). Springer-Verlag, Berlin. pp: 239-254
Schimel, J.P., and Gulledge, J. (1998) Microbial community structure and global trace gases. Global Change Biology 4: 745-758
Schirrmeister, L., Grigoriev, M.N., Kutzbach, L., Wagner, D., and Bolshiyanov, D.Y. (2004) Russian-German Cooperation SYSTEM LAPTEV-SEA 2003: The Expedition Lena-Anabar 2003. Reports on Polar and Marine Research 484: Alfred Wegener Institute for Polar and Marine Research, Bremerhaven
Schirrmeister, L., Wagner, D., Grigoriev, M.N., and Bolshiyanov, D.Y. (2007) The Expedition LENA 2005. Reports on Polar and Marine Research 550, Alfred Wegener Institute for Polar and Marine Research, Bremerhaven
Schlichting, E., Blume, H.P., and Stahr, K. (eds) (1995) Bodenkundliches Praktikum: Pareys Studientexte 81. Berlin, Germany: Blackwell Wissensverlag
Schloss, P.D., and Handelsman, J. (2004) Status of the Microbial Census. MicrobiolMol Biol Rev 68: 686-691
Schloss, P.D., and Handelsman, J. (2005) Introducing DOTUR, a computer program for defining operational taxonomic units and estimating species richness. ApplEnviron Microbiol 71: 1501-1506
Schneider, J (2005) Bilanzierung von Methanemissionen in Tundrengebieten am Beispiel des Lena-Deltas, Nordostsibirien, auf der Basis von Fernerkundungsdaten und Geländeuntersuchungen. Diploma thesis, TU Dresden.
Schoeneberger, P.J., Wysocki, D.A., Benham, E.C., and Broderson, W.D. (eds) (2002) Field Book for Describing and Sampling Soils. Lincoln, NE, USA: Natural Resources Conservation Service, National Soil Survey centre
REFERENCES
86
Schwamborn, G., Rachold, V., and Grigoriev, M.N. (2002) Late Quaternary sedimentation history of the Lena Delta. Quaternary International, 89: 119-134
Seeberg-Elverfeldt, J., Schlueter, M., Feseker, T., and Köllig, M. (2005) Rhizon sampling of porewaters near the sediment-water interface of aquatic systems. Limnol Oceanogr: Methods 3: 361-371
Serreze, M.C., Walsh, J.E., Chapin III, F.S., Osterkamp, T., Dyurgerov, M., Romanovsky, V., Oechel, W.C., Morison, J., Zhang, T., and Barry, R.G. (2000) Observational evidence of recent change in the northern high-latitude environment. Climatic Change 46: 159-206
Shannon, C.E., and Weaver, W. (1949) The mathematical theory of communication. The University of Illinois Press, Urbana, 117 pp.
Shigematsu, T., Hanada, S., Eguchi, M., Kamagata, Y., Kanagawa, T., and Kurane, R. (1999) Soluble methane monooxygenase gene clusters from trichloro-ethylene-degrading Methylomonas sp. strains and detection of methanotrophs during in situ bioremediation. Appl Environ Microbiol 65: 5198-5206
Shivaji, S., Ray, M.K., Rao, N.S., Saisree, L., Jagannadham, M.V., Kumar, M.V., Reddy, G.S.N., and Bhargava, P.M. (1991) Sphingobacterium antarcticus sp. nov. a psychrotrophic bacterium from the soils of schirmacher Oasis, Antarctica.Int J Syst Bacteriol 42: 102-106
Simpson, E.H. (1949) Measurement of Diversity. Nature 163: 688 Singh, B.K., Tate, K.R., Kolipka, G., Hedley, C.B., Macdonald, C.A., Millard, P., and
Murrell, J.C. (2007) Effect of Afforestation and Reforestation of Pasture on the activity and Population Dynamics of Methanotrophic Bacteria. Appl Environ Microbiol 73: 5153-5161
Smith, L.C., MacDonald, G.M., Velichko, A.A., Beilman, W.D., Borisova, O.K., Frey, K.E., Kremenetski, K.V., and Sheng, Y. (2004) Siberian peatlands: a net carbon sink and global methane source since the early Holocene. Science 303: 353-356
Soil Survey Stuff (1998) Keys to soil taxonomy. Eighth Edition. Soil Conservation Service, USDA, Washington D.C., US
Spellerberg, I.F., and Fedor, P.J. (2003) A tribute to Claude Shannon (1916-2001) and a plea for a more rigorous use of species richness, species diversity and the ‘Shannon-Wiener’ Index. Global Ecol Biogeogr 12: 177-179
Stendel, M., Romanovsky, V.E., Christensen, J.H., and Sazonova, T. (2007) Using dynamical downscaling to close the gap between global change scenarios and local permafrost dynamics. Global Planetary Change 56: 203–214
Steven, B., Briggs, G., McKay, C.P., Pollard, W.H., Greer, C.W., and Whyte, L.G. (2007) Characterization of the microbial diversity in a permafrost sample from the Canadian high Arctic using culture-dependent and culture-independent methods. FEMS Microbiol Ecol 59: 513-523
Steyn, P.L., Segers, P., Vancanneyt, M., Sandra, P., Kersters, K., and Joubert, J.J. (1998) Classification of heparinolytic bacteria into a new genus, Pedobacter, comprising four species: Pedobacter heparinus comb. nov., Pedobacter piscium comb. nov., Pedobacter africanus sp. nov. and Pedobacter saltans sp. nov. Proposal of the family Sphingobacteriaceae fam. nov. Int J Syst Bacteriol 48: 165-177
Stoecker, K., Bendinger, B., Schöning, B., Nielsen, P.H., Nielsen, J.L., Baranyi, C., Toenshoff, E.R., Daims, H., and Wagner, M. (2006) Cohn’s Crenothrix is a filamentous methaneoxidizer with an unusual methane monooxygenase. PROCNATL ACAD SCI 14: 2363-2367
REFERENCES
87
Stotzky, G. (1966) Influence of clay minerals on microorganisms. III. Effect of particle size, cation exchange capacity and surface area on bacteria. Can J Microbiol 12: 1235-1246
Strous, M., and Jetten, S.M. (2004) Anaerobic oxidation of methane and ammonium. Ann Rev Microbiol 58: 99-117
Sundh, I., Borga, P., Nilsson, M., and Svensson, B.H. (1995) Estimation of cell number of methanotrophic bacteria in boreal peatlands based on analyses of species phospholipid fatty acids. FEMS Microbiol Ecol 18: 103-112
Thies, J.E. (2007) Soil Microbial Community Analysis using Terminal Restriction Fragment Length Polymorphisms. Soil Sci Soc Am J 71: 579-591
Thompson, J.R., Pacocha, S., Pharino, C., Klepac-Ceraj, V., Hunt, D.E., Benoit, J., Sarma-Rupavtarm, R., Distel, D.L., and Polz, M.F. (2005) Genotypic Diversity Within a Natural Coastal Bacterioplankton Population. Science 307: 1311-1313
Torsvik, V., Sørheim, R., and Goksøyr (1996) Total bacterial diversity in soil and sediment communities – a review. J Industr Microbiol 17: 170-178
Treude, T., Boetius, A., Knittel, K., Wallmann, K., and Jørgensen, B.B. (2003) Anaerobic oxidation of methane above gas hydrates at Hydrate Ridge, NE Pacific Ocean. Ma Ecol Progr Ser 264: 1-14
Treude, T., Krüger, M., Boetius, A., and Jørgensen, B.B. (2005) Environmental control on anaerobic oxidation of methane in the gassy sediments of Eckernförde Bay (German Baltic). Limnol Oceanogr 50: 1171-1786
Treude, T., Orphan, V., Knittel, K., Gieseke, A., House, C.H., and Boetius, A. (2007) Consumption of Methane and CO2 by Methanotrophic Microbail Mats from Gas Seeps of the Anoxic Black Sea. Appl Environ Microbiol 73: 2271-2283
Tringe, S.G., von Mering, C., Kobayashi, A., Salamov, A.A., Chen, K., Chang, H.W., Podar, M., Short, J.M., MAthur, E.J., Detter, J.C., Bork, P., Hugenholtz, P., and Rubin, E.M. (2005) Comparative Metagenomics of Microbial Communities. Science 308: 554-557
Trotsenko, Y.A., and Khmelenina, V.N (2002) Biology of extremophilic and extremotolerant Methanotrophs. Arch Microbiol 177: 123-131
Trotsenko, Y.A., and Khmelenina, V.N. (2005) Aerobic methanotrophic bacteria of cold ecosystems. FEMS Microbiol Ecol 53: 15-26
Tsubota, J., Eshinimaev, B.T., Khmelenina, V.N., and Trotsenko, Y.A. (2005) Methylothermus thermalis gen. nov., sp. nov., a novel moderately thermophilic obligate methanotroph from a hot spring in Japan. Int J Syst Evol Microbiol 55: 1877-1884
Urmann, K., Gonzales-Gil, G., Schroth, M., hofer, M., and Zeyer, J. (2005) New Field Method:. Gas Push-Pull Test for the In-Situ Quantification of Microbial Activities in the Vadose Zone. Environ Sci Technol 39: 304-310
Van Bodegom, P., Stams, F., Mollema, L., Boeke, S., and Leffelaar, P. (2001) Methane Oxidation and the Competition for Oxygen in the Rice Rhizosphere. Appl Environ Microbiol 67: 3586-3597
Van Everdingen, R. (2005) Multi-language glossary of permafrost and related ground-ice terms. National Snow and Ice Data Center/World Data Center for Glaciology. Boulder, Colorado, US
Vecherskaya, M.S., Galchenko, V.F., Sokolova, E.N., and Samarkin, V.A. (1993) Activity and species composition of aerobic methanotrophic communities in tundra soils. Curr Microbiol 27: 181-184
Wagner, D., Kobabe, S., Pfeiffer, E.M., and Hubberten, H.W. (2003) Microbial Controls on Methane Fluxes from a Polygonal Tundra of the Lena Delta, Siberia. Permafrost Periglacial Processes 14: 173-185
REFERENCES
88
Wagner, D., Lipski, A., Embacher, A., and Gattinger, A. (2005) Methane fluxes in extreme permafrost habitats of the Lena Delta: effects of microbial community structure and organic matter quality. Environ Microbiol 7: 1582-1592
Wagner, D. (2008) Microbial Communities and Processes in Arctic Permafrost Environments. In: Microbiology of Extreme Soils (P. Dion and S.N. Chandra, eds.), Soil Biol 13: 133-154, Springer-Verlag Berlin
Wallner, G., Amann, R., and Beisker, W. (1993) Optimizing fluorescent in situ hybridization with rRNA-targeted oligonucleotide probes for flow cytometric identification of microorganisms. Cytometry 14: 136-143
Walter, B.P., and Heimann M. (2000) A processed-based, climate-sensitive model to drive methane emissions from natural wetlands: Applications to five wetland sites, sensitivity to model parameters, and climate. Global Biochem Cycles 14: 745-765
Wartiainen, I., Hestnes, A.G., and Svenning, M.M. (2003) Methanotrophic diversity in high arctic wetlands on the islands of Svalbard (Norway) — denaturing gradient gel electrophoresis analysis of soil DNA and enrichment cultures. Can J Microbiol 49: 602-612
Wartiainen, I., Hestnes, A.G., McDonald, I.R., and Svenning, M.M. (2006) Methylobacter tundripaludum sp. nov., a novel methanotrophic bacterium from Arctic wetland soil, Svalbard, Norway (78° N). Int J Syst Evol Microbiol 56: 109-113
Washburn, A.L. (1979) Geocryology. A survey of periglacial processes and environments. London: Arnold. 406 S.
Weber, M.H.W., Klein, W., Mueller, L., Niess, U.M., and Marahiel, M.A. (2001) Role of the Bacillus subtilis fatty acid desaturase in membrane adaptation during cold shock. Molecular Microbiology 39: 1321-1329
Weller, R., Glöckner, F.O., and Amann, R. (2000) 16S rRNA-targeted oligonucleotide probes for the in situ detection of members of the phylum Cytophaga-Flavobacterium-Bacteroides. Syst Appl Microbiol 23: 107-114
Whalen, S. C., and Reeburgh, W. S. (1990) Consumption of atmospheric methane by tundra soils. Nature 346: 160-162
Whalen, S.C., and Reeburgh, W.S. (1992) Interannual variations in tundra methane emission: a 4-year time series at fixed sites. Global Biochem Cycles, 6, 139-159
Whitman, W.B., Coleman, D.C., and Wiebe, W.J. (1998) Prokaryotes: The unseen majority. Proc Natl Acad Sci 95: 6578-6583
Whittenbury, R., Philips, K., and Wilkinson, J.F. (1970) Enrichment, isolation and some properties of methane-utilizing bacteria. J Gen Microbiol 61: 205-218
Wille, C., Kutzbach, L., Sachs, T., Wagner, D., and Pfeiffer, E.-M. (in press) Methane emissions from Siberian arctic polygonal tundra: Eddy covariance measurements and modeling. Global Change Biology doi:
Wise, M.G., McArthur, J.V., and Shimkets, L.J. (1999) Methanotroph Diversity in Landfill Soil: Isolation of Novel Type I and Type II Methanotrophs Whose Presence Was Suggested by Culture-Independent 16S Ribosomal DNA Analysis. Appl Environ Microbiol 65: 4887-4897
Wise, M.G., McArthur, J.V., and Shimkets, L.J. (2001) Methylosarcina fibrata gen. nov. sp. nov. and Methylosarcina quisquiliarum sp. nov., novel type I methanotrophs. Int J Syst Evol Microbiol 51: 611-621
Wuebbles, J., and Hayhoe, K. (2002) Atmospheric methane and global change. Earth-Science Reviews 57: 177-210
Yershov, E.D. (1998) General geochryology. Cambridge University Press, Cambridge, pp. 580
REFERENCES
89
Yu, K., Boehme, F., Rinklebe, J., Neue, H.U., and DeLaune R.D. (2007) Major Biogeochemical Processes in Soils-A Microcosm Incubation from Reducing to Oxidizing conditions. Soil Sci Soc Am J 71: 1406-1417
Zarda, B., Hahn, D., Chatzinotas, A., Schoenhuber, W., Neef, A., Amann, R., and Zeyer, J. (1997) Analysis of bacterial community structure in bulk soil by in situ hybridization. Arch Microbiol 168: 185-192
Zhang, T., Barry, R.G., Knowles, K., Heginbotton, J.A., and Brown, J. (1999) Statistics and characteristics of permafrost and ground-ice distribution in the northern hemisphere. Polar Geography 23: 132-154
Zheng, D., Alm, E.W., Stahl, D.A., and Raskin L. (1996). Characterization of universal small-subunit rRNA hybridization probes for quantitative molecular microbial ecology studies. Appl Environ Microbiol 62: 4504-4513
Zhou, J., Davey, M.E., Figueras, J.B., Rivkina, E., Gilichinsky, D., and Tiedje, J.M. (1997) Phylogenetic diversity of a bacterial community determined from Siberian tundra soil DNA. Microbiology 143: 3913-3919
Zimov, S.A., Schuur, E.A.G., and Chapin III, F.S. (2006) Permafrost and the Global Carbon 733 Budget, Science 312: 1612-1613
Zwolinski, M.D. (2007) DNA Sequencing. Strategies for Soil Microbiology. Soil Sci Soc Am J 71: 592-600
APPENDIX
90
8. Appendix 8.1 Manuscript IV (co-authorship, in preparation)
Temperature adaptation of microbial populations in different horizons of the active layer in permafrost soils from the Lena-Delta, Siberia
Kai Mangelsdorf1, Elke Finsel2, Susanne Liebner3, Dirk Wagner3
1 GeoForschungsZentrum (GFZ) Potsdam, Telegrafenberg B423, 14473 Potsdam, Germany 2 Freie Universität Berlin, Kaiserswerther Str. 16/18, 14195 Berlin, Germany
3 Alfred-Wegener-Institute for Marine and Polar Research, Telegrafenberg, 14473 Potsdam, Germany
Corresponding author:
Kai Mangelsdorf Telegrafenberg B423
14473 Potsdam Germany
Tel.: +49 (0)331 288 1785 e-mail: [email protected]
AbstractThe cell membrane phospholipid (PL) inventory of microbial populations from a
permafrost region were analysed to examine as to how the microbial populations within different horizons of the active layer were adapted to the extreme variable temperature regime of the permafrost area. Thus, one surface-near and one permafrost-near soil sample were taken from the active layer on Samoylov Island in the southern central Lena Delta, Siberia and in each case incubated under 4 and 28°C. Subsequently, the phospholipid cell membrane composition of the indigenous microbial populations was qualitatively and quantitatively determined and compared. In both horizons the 4°C incubation is characterized by a shift to more short chain fatty acids in the PL inventory. A significant trend in the proportions of saturated and unsaturated fatty acids was not detected. Both a higher proportion of short chain and unsaturated fatty acids counterbalance the effect of decreasing cell membrane fluidity with decreasing environmental temperature. Thus, the adaptation of the permafrost microbial populations within the different horizons to varying ambient temperature conditions appears to be regulated by the chain length of the phospholipid fatty acids. However, the permafrost near horizon contains on average more unsaturated fatty acids than the surface near horizon and a higher proportion of short chain fatty acids. This suggests that lipid inventory of the microbial population nearer to the permanently frozen soil is more adapted to lower temperatures than the microbial community from the surface near horizon, which appears to show a higher flexibility toward higher temperature conditions.
1. Introduction Thanks to recent improvements in sensitivity of conventional biogeochemical and
microbiological analytical methods and the development of new approaches, microbial life has been detected in environments supposed for long to be hostile (Rothschild and Mancinelli,
APPENDIX
91
2001). The finding of microbial populations in environments like polar- and permafrost areas, hot surface springs and deep sea hydrothermal vents, hypersaline and deep water lakes, mines and oil reservoirs, the deep sea and the deep subsurface of the Earth changed the perspective on the limits of life drastically. In addition to pressure, salinity and alkalinity it is ambient temperature which is one of the most important environmental factors influencing the development of microbial life.
Permafrost is a common feature in polar regions covering more than 25 % of the land surface (Zhang et al., 1999), and can extend to several hundreds of meters depth (e.g. 600 – 800 m in East Siberia). Due to the relatively short summer season in the permafrost regions only the surface zone thaws. This so-called active layer is characterized by an extreme temperature regime from about +15°C to –35°C, in which a diverse range of microorganisms have been discovered. Permafrost soils are a significant source for the climate-relevant trace gas methane (Wagner et al., 2003; Kutzbach et al., 2004). Therefore, permafrost and its microbial communities (e.g. methane producers and consumers) are of specific interest in predicting how the carbon balance of northern ecosystem will respond to climate change. There are only a few studies on microbial diversity (structure and function) in permafrost environments, indicating the need for a comprehensive inventory of these habitats.
Microorganisms are able to inhabit environments with temperature conditions ranging from below 0°C up to 121 °C (Rothschild and Mancinelli, 2001; Kashefi and Lovley, 2003). Thus, microorganisms must show a high adaptability towards extreme variable ambient temperature conditions. Sinensky (1974) introduced the theory of homeoviscous adaptation. This concept states that microorganisms change their cell membrane lipid composition in order to maintain the cell membrane fluidity and functionality in response to ambient temperature changes. For the adaptation to low temperature conditions there are several mechanisms used by bacteria and archaea to alter their cell membrane composition accordingly (Russell and Fukunaga, 1990; Suutari and Laakso, 1994). Two of the often observed ones in bacteria are the increase of the degree of unsaturated and short chain phospholipid fatty acids (Suutari and Laakso, 1994) with decreasing environmental temperature. Sometimes but only rarely a raise in the degree of larger phospholipid head groups (Boggs, 1986) can be observed.In the current study we investigated temperature-dependent adaptation changes in the phospholipid cell membrane inventory of two microbial populations from different depth horizons of the active layer from a permafrost site. Both horizons were incubated at 4 and 28°C and changes in the phospholipid composition was monitored using a high performance liquid chromatography coupled to a mass spectrometer (HPLC-MS) and collisionally activated dissociation (CAD) experiments (MS-MS).
2. Study area The study area is Samoylov Island within the southern central Lena Delta in North
Siberia (Fig.1). The Lena Delta forms with 32000 km2 one of the largest delta regions of the artic ocean and is part of the Laptev Sea (Are and Reimnitz, 2000). Due to its spatial extension the Lena Delta is an important key area for the arctic water and climate system. The River Lena, being 4270 km long and transporting on average a water mass of 525 km3/a, belongs to the 8 biggest river systems on Earth. The high freshwater outflow dominates almost the whole delta and only the outer delta regions exhibit brackish and salt water. The delta system is characterized by numerous meandering channels forming more than 1500 islands and can be separated into three geomorphological parts (Schwarmborn et al., 1999). Fragments of the oldest terrace, formed during the middle to late Pleistocene, are preserved in the southern part of the delta. The western part (Arga Island), formed during the late Pleistocene to early Holocene, is characterized by coarse grained sandy sediments and contains numerous deep lakes. The eastern and nowadays active part exhibits several flooding
APPENDIX
92
plains of different elevation from mid-Holocene origin. The whole delta is located within the permafrost zone and the landscape is dominated by ice wedge polygons in different evolutional stages (Schwarmborn et al., 2002).
The Samoylov Island (72°22’N, 126°28’O) is located in the southern active part of the Lena Delta in one of the main channels, the Olenyok-channel. The island, formed during the mid-Holocene, comprises an area of 12 km2 with the highest elevation being 12 m above sea level. The western part (about 30%) of the island consists of flood plains with different heights and therefore, different flooding frequency and intensity. The eastern part (about 70%) is flooded only rarely during extreme high water events and is characterised by a distinct net of ice wedge polygons. In contrast to the sedimentation processes in the western part, the south eastern part is characterized by massive coastal erosion. Sediments range from silty sand in the eastern part to sandy material in the lower flood plains in the west (Akhmadeeva et al., 1999). The Lena Delta is affected by extreme seasonal climatic conditions characterized by long and strong winters from end of September to mid of June and a short and cool summer. The temperature range from -35 to +15°C, with average temperature in January of -30°C and in Juli of +7°C. The average temperature during the year is about -12°C. Vegetation period lasts only 60 days and average rainfall in this area with 190 mm is low.
3. Materials and Methods 3.1 Sample material
The investigated soil horizons are from the active layer of a low-centre-polygon (depression with a circular embankment, 77°22.2’N, 126°28.5’E) on Samoylov Island. The active layer is the upper part of the surface soil which is frozen in winter and thawed in summer. The polygon terrace is 10 m above sea level and is covered by mosses and tresses. The active layer was ca. 50 cm thick. The water level was below a depth of 38 cm and sediments below that depth show increasingly anaerobic conditions. To investigate the temperature dependent adaptive changes of the membrane lipids (phospholipids) of an aerobic microbial soil population from the active layer of a permafrost site we took two soil horizons from different depth. One surface near horizons from 11-18 cm and one permafrost near horizon from 32-38 cm (above water level). To avoid potential phospholipids from fresh plant material the upper 11 cm were discarded. Although the active layer is thawed in summer, there is still a temperature gradient from the surface to the permanently frozen ground.
3.2 Incubation of microbial soil population The two soil horizons were homogenised and two aliquots of 5 g of each horizon were
placed in different sterile serum flask. After addition of 5 ml MilliQ-water the flask was shaken for 20 s. To activate also the aerobic methanotrophs in the soil horizons we aerated the flasks with a gas mixture of synthethic air with 3% methane for 8 s. Finally, the soil samples were incubated on a shaker at 28 and 4°C for ca. 3 weeks. Depletion of methane was regularly tested by gas chromatography (GC). However, the decrease in methane was only small. Thus, aerobic methanotrophs known to be part of the soil community could not significantly be activated during this experiment.
3.3 Analytical procedure After incubation the soil material was extracted with an organic solvent mixture and
the organic extracts were separated by column chromatography into fractions of different polarity. The obtained phospholipid fraction was analysed for intact phospholipids using high performance liquid chromatography mass spectrometry (HPLC-MS). For the structural elucidation of individual phospholipids (e.g. fatty acyl side chains) collisionally activated dissociation (CAD) MS-MS experiments were performed. Details on the analytical
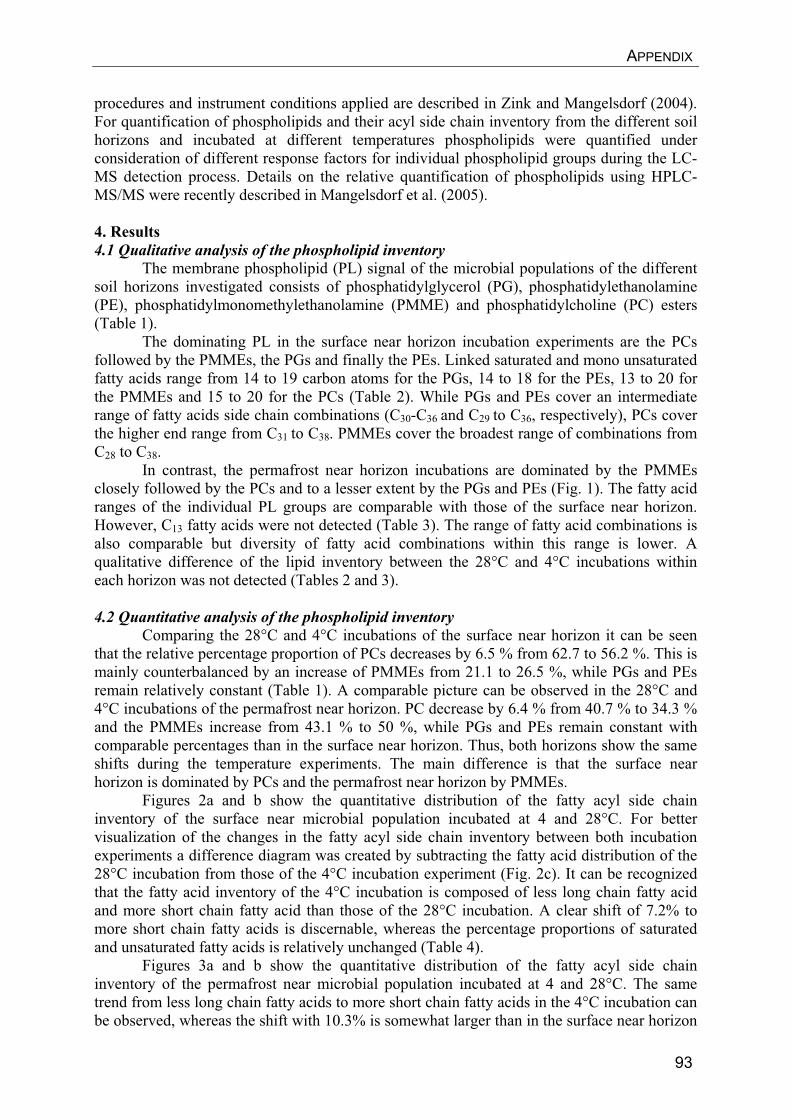
APPENDIX
93
procedures and instrument conditions applied are described in Zink and Mangelsdorf (2004). For quantification of phospholipids and their acyl side chain inventory from the different soil horizons and incubated at different temperatures phospholipids were quantified under consideration of different response factors for individual phospholipid groups during the LC-MS detection process. Details on the relative quantification of phospholipids using HPLC-MS/MS were recently described in Mangelsdorf et al. (2005).
4. Results 4.1 Qualitative analysis of the phospholipid inventory
The membrane phospholipid (PL) signal of the microbial populations of the different soil horizons investigated consists of phosphatidylglycerol (PG), phosphatidylethanolamine (PE), phosphatidylmonomethylethanolamine (PMME) and phosphatidylcholine (PC) esters (Table 1).
The dominating PL in the surface near horizon incubation experiments are the PCs followed by the PMMEs, the PGs and finally the PEs. Linked saturated and mono unsaturated fatty acids range from 14 to 19 carbon atoms for the PGs, 14 to 18 for the PEs, 13 to 20 for the PMMEs and 15 to 20 for the PCs (Table 2). While PGs and PEs cover an intermediate range of fatty acids side chain combinations (C30-C36 and C29 to C36, respectively), PCs cover the higher end range from C31 to C38. PMMEs cover the broadest range of combinations from C28 to C38.
In contrast, the permafrost near horizon incubations are dominated by the PMMEs closely followed by the PCs and to a lesser extent by the PGs and PEs (Fig. 1). The fatty acid ranges of the individual PL groups are comparable with those of the surface near horizon. However, C13 fatty acids were not detected (Table 3). The range of fatty acid combinations is also comparable but diversity of fatty acid combinations within this range is lower. A qualitative difference of the lipid inventory between the 28°C and 4°C incubations within each horizon was not detected (Tables 2 and 3).
4.2 Quantitative analysis of the phospholipid inventory Comparing the 28°C and 4°C incubations of the surface near horizon it can be seen
that the relative percentage proportion of PCs decreases by 6.5 % from 62.7 to 56.2 %. This is mainly counterbalanced by an increase of PMMEs from 21.1 to 26.5 %, while PGs and PEs remain relatively constant (Table 1). A comparable picture can be observed in the 28°C and 4°C incubations of the permafrost near horizon. PC decrease by 6.4 % from 40.7 % to 34.3 % and the PMMEs increase from 43.1 % to 50 %, while PGs and PEs remain constant with comparable percentages than in the surface near horizon. Thus, both horizons show the same shifts during the temperature experiments. The main difference is that the surface near horizon is dominated by PCs and the permafrost near horizon by PMMEs.
Figures 2a and b show the quantitative distribution of the fatty acyl side chain inventory of the surface near microbial population incubated at 4 and 28°C. For better visualization of the changes in the fatty acyl side chain inventory between both incubation experiments a difference diagram was created by subtracting the fatty acid distribution of the 28°C incubation from those of the 4°C incubation experiment (Fig. 2c). It can be recognized that the fatty acid inventory of the 4°C incubation is composed of less long chain fatty acid and more short chain fatty acid than those of the 28°C incubation. A clear shift of 7.2% to more short chain fatty acids is discernable, whereas the percentage proportions of saturated and unsaturated fatty acids is relatively unchanged (Table 4).
Figures 3a and b show the quantitative distribution of the fatty acyl side chain inventory of the permafrost near microbial population incubated at 4 and 28°C. The same trend from less long chain fatty acids to more short chain fatty acids in the 4°C incubation can be observed, whereas the shift with 10.3% is somewhat larger than in the surface near horizon
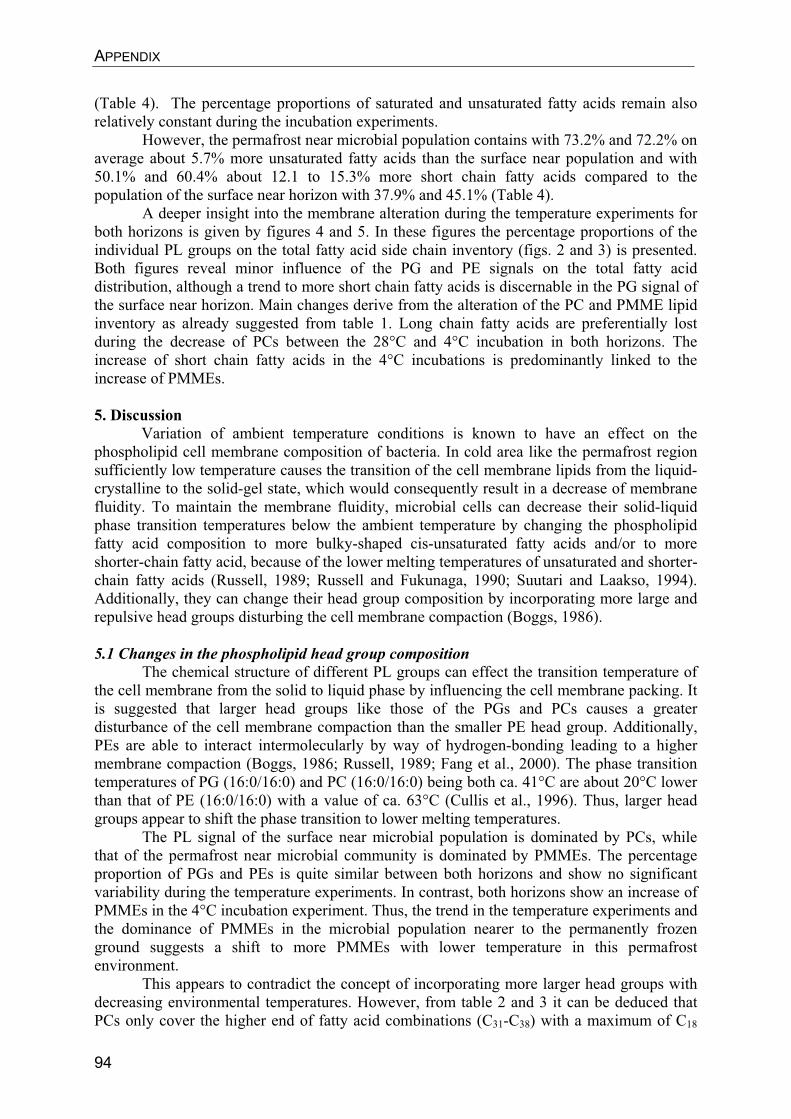
APPENDIX
94
(Table 4). The percentage proportions of saturated and unsaturated fatty acids remain also relatively constant during the incubation experiments.
However, the permafrost near microbial population contains with 73.2% and 72.2% on average about 5.7% more unsaturated fatty acids than the surface near population and with 50.1% and 60.4% about 12.1 to 15.3% more short chain fatty acids compared to the population of the surface near horizon with 37.9% and 45.1% (Table 4).
A deeper insight into the membrane alteration during the temperature experiments for both horizons is given by figures 4 and 5. In these figures the percentage proportions of the individual PL groups on the total fatty acid side chain inventory (figs. 2 and 3) is presented. Both figures reveal minor influence of the PG and PE signals on the total fatty acid distribution, although a trend to more short chain fatty acids is discernable in the PG signal of the surface near horizon. Main changes derive from the alteration of the PC and PMME lipid inventory as already suggested from table 1. Long chain fatty acids are preferentially lost during the decrease of PCs between the 28°C and 4°C incubation in both horizons. The increase of short chain fatty acids in the 4°C incubations is predominantly linked to the increase of PMMEs.
5. Discussion Variation of ambient temperature conditions is known to have an effect on the
phospholipid cell membrane composition of bacteria. In cold area like the permafrost region sufficiently low temperature causes the transition of the cell membrane lipids from the liquid-crystalline to the solid-gel state, which would consequently result in a decrease of membrane fluidity. To maintain the membrane fluidity, microbial cells can decrease their solid-liquid phase transition temperatures below the ambient temperature by changing the phospholipid fatty acid composition to more bulky-shaped cis-unsaturated fatty acids and/or to more shorter-chain fatty acid, because of the lower melting temperatures of unsaturated and shorter-chain fatty acids (Russell, 1989; Russell and Fukunaga, 1990; Suutari and Laakso, 1994). Additionally, they can change their head group composition by incorporating more large and repulsive head groups disturbing the cell membrane compaction (Boggs, 1986).
5.1 Changes in the phospholipid head group composition The chemical structure of different PL groups can effect the transition temperature of
the cell membrane from the solid to liquid phase by influencing the cell membrane packing. It is suggested that larger head groups like those of the PGs and PCs causes a greater disturbance of the cell membrane compaction than the smaller PE head group. Additionally, PEs are able to interact intermolecularly by way of hydrogen-bonding leading to a higher membrane compaction (Boggs, 1986; Russell, 1989; Fang et al., 2000). The phase transition temperatures of PG (16:0/16:0) and PC (16:0/16:0) being both ca. 41°C are about 20°C lower than that of PE (16:0/16:0) with a value of ca. 63°C (Cullis et al., 1996). Thus, larger head groups appear to shift the phase transition to lower melting temperatures.
The PL signal of the surface near microbial population is dominated by PCs, while that of the permafrost near microbial community is dominated by PMMEs. The percentage proportion of PGs and PEs is quite similar between both horizons and show no significant variability during the temperature experiments. In contrast, both horizons show an increase of PMMEs in the 4°C incubation experiment. Thus, the trend in the temperature experiments and the dominance of PMMEs in the microbial population nearer to the permanently frozen ground suggests a shift to more PMMEs with lower temperature in this permafrost environment.
This appears to contradict the concept of incorporating more larger head groups with decreasing environmental temperatures. However, from table 2 and 3 it can be deduced that PCs only cover the higher end of fatty acid combinations (C31-C38) with a maximum of C18
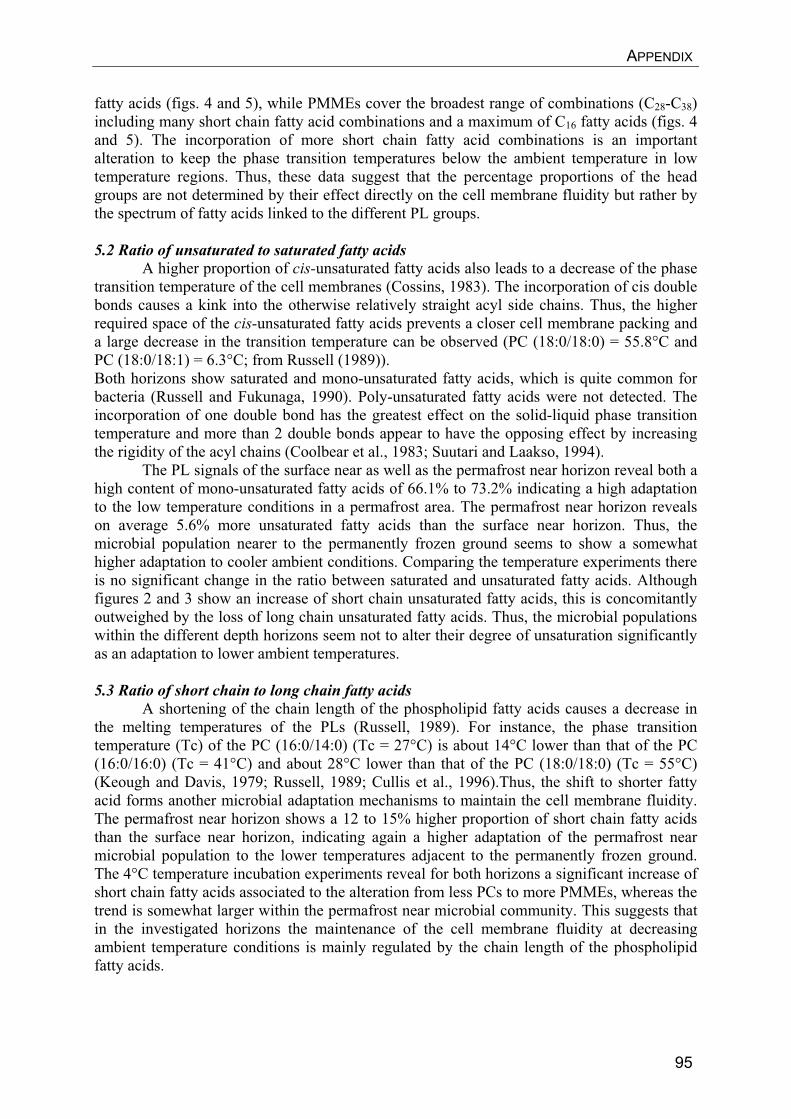
APPENDIX
95
fatty acids (figs. 4 and 5), while PMMEs cover the broadest range of combinations (C28-C38)including many short chain fatty acid combinations and a maximum of C16 fatty acids (figs. 4 and 5). The incorporation of more short chain fatty acid combinations is an important alteration to keep the phase transition temperatures below the ambient temperature in low temperature regions. Thus, these data suggest that the percentage proportions of the head groups are not determined by their effect directly on the cell membrane fluidity but rather by the spectrum of fatty acids linked to the different PL groups.
5.2 Ratio of unsaturated to saturated fatty acidsA higher proportion of cis-unsaturated fatty acids also leads to a decrease of the phase
transition temperature of the cell membranes (Cossins, 1983). The incorporation of cis double bonds causes a kink into the otherwise relatively straight acyl side chains. Thus, the higher required space of the cis-unsaturated fatty acids prevents a closer cell membrane packing and a large decrease in the transition temperature can be observed (PC (18:0/18:0) = 55.8°C and PC (18:0/18:1) = 6.3°C; from Russell (1989)). Both horizons show saturated and mono-unsaturated fatty acids, which is quite common for bacteria (Russell and Fukunaga, 1990). Poly-unsaturated fatty acids were not detected. The incorporation of one double bond has the greatest effect on the solid-liquid phase transition temperature and more than 2 double bonds appear to have the opposing effect by increasing the rigidity of the acyl chains (Coolbear et al., 1983; Suutari and Laakso, 1994).
The PL signals of the surface near as well as the permafrost near horizon reveal both a high content of mono-unsaturated fatty acids of 66.1% to 73.2% indicating a high adaptation to the low temperature conditions in a permafrost area. The permafrost near horizon reveals on average 5.6% more unsaturated fatty acids than the surface near horizon. Thus, the microbial population nearer to the permanently frozen ground seems to show a somewhat higher adaptation to cooler ambient conditions. Comparing the temperature experiments there is no significant change in the ratio between saturated and unsaturated fatty acids. Although figures 2 and 3 show an increase of short chain unsaturated fatty acids, this is concomitantly outweighed by the loss of long chain unsaturated fatty acids. Thus, the microbial populations within the different depth horizons seem not to alter their degree of unsaturation significantly as an adaptation to lower ambient temperatures.
5.3 Ratio of short chain to long chain fatty acids A shortening of the chain length of the phospholipid fatty acids causes a decrease in
the melting temperatures of the PLs (Russell, 1989). For instance, the phase transition temperature (Tc) of the PC (16:0/14:0) (Tc = 27°C) is about 14°C lower than that of the PC (16:0/16:0) (Tc = 41°C) and about 28°C lower than that of the PC (18:0/18:0) (Tc = 55°C) (Keough and Davis, 1979; Russell, 1989; Cullis et al., 1996).Thus, the shift to shorter fatty acid forms another microbial adaptation mechanisms to maintain the cell membrane fluidity. The permafrost near horizon shows a 12 to 15% higher proportion of short chain fatty acids than the surface near horizon, indicating again a higher adaptation of the permafrost near microbial population to the lower temperatures adjacent to the permanently frozen ground. The 4°C temperature incubation experiments reveal for both horizons a significant increase of short chain fatty acids associated to the alteration from less PCs to more PMMEs, whereas the trend is somewhat larger within the permafrost near microbial community. This suggests that in the investigated horizons the maintenance of the cell membrane fluidity at decreasing ambient temperature conditions is mainly regulated by the chain length of the phospholipid fatty acids.
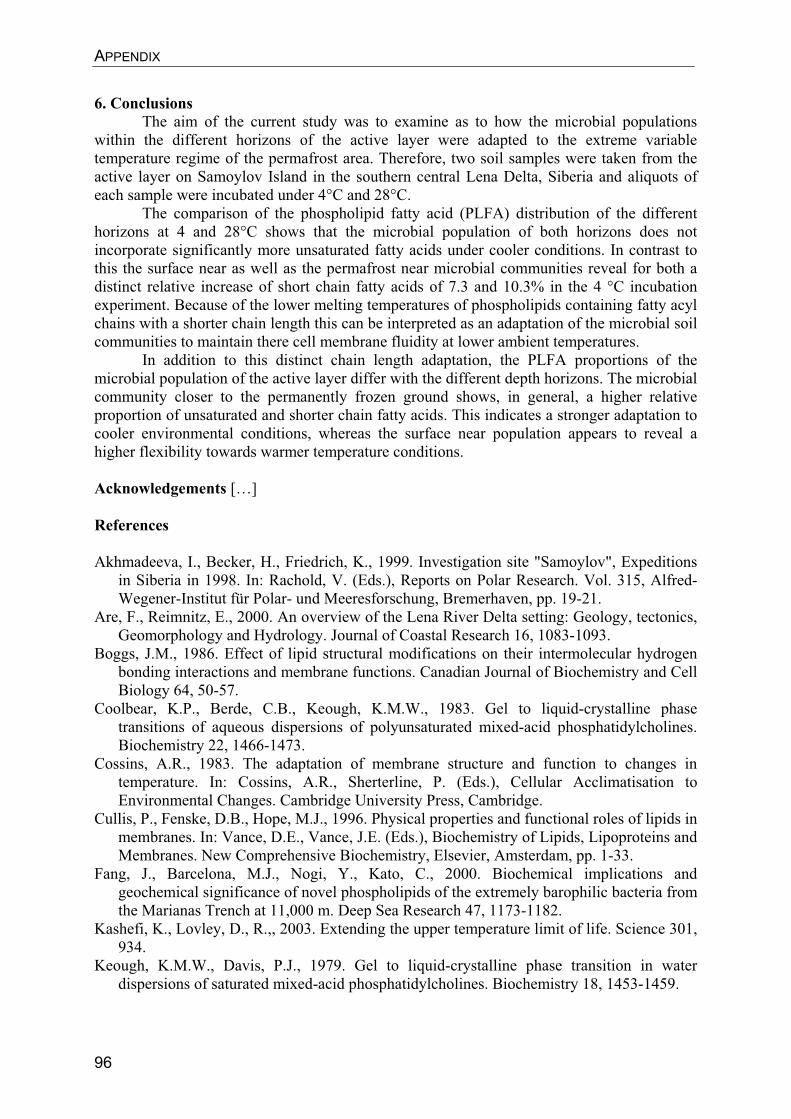
APPENDIX
96
6. Conclusions The aim of the current study was to examine as to how the microbial populations
within the different horizons of the active layer were adapted to the extreme variable temperature regime of the permafrost area. Therefore, two soil samples were taken from the active layer on Samoylov Island in the southern central Lena Delta, Siberia and aliquots of each sample were incubated under 4°C and 28°C.
The comparison of the phospholipid fatty acid (PLFA) distribution of the different horizons at 4 and 28°C shows that the microbial population of both horizons does not incorporate significantly more unsaturated fatty acids under cooler conditions. In contrast to this the surface near as well as the permafrost near microbial communities reveal for both a distinct relative increase of short chain fatty acids of 7.3 and 10.3% in the 4 °C incubation experiment. Because of the lower melting temperatures of phospholipids containing fatty acyl chains with a shorter chain length this can be interpreted as an adaptation of the microbial soil communities to maintain there cell membrane fluidity at lower ambient temperatures.
In addition to this distinct chain length adaptation, the PLFA proportions of the microbial population of the active layer differ with the different depth horizons. The microbial community closer to the permanently frozen ground shows, in general, a higher relative proportion of unsaturated and shorter chain fatty acids. This indicates a stronger adaptation to cooler environmental conditions, whereas the surface near population appears to reveal a higher flexibility towards warmer temperature conditions.
Acknowledgements […]
References
Akhmadeeva, I., Becker, H., Friedrich, K., 1999. Investigation site "Samoylov", Expeditions in Siberia in 1998. In: Rachold, V. (Eds.), Reports on Polar Research. Vol. 315, Alfred-Wegener-Institut für Polar- und Meeresforschung, Bremerhaven, pp. 19-21.
Are, F., Reimnitz, E., 2000. An overview of the Lena River Delta setting: Geology, tectonics, Geomorphology and Hydrology. Journal of Coastal Research 16, 1083-1093.
Boggs, J.M., 1986. Effect of lipid structural modifications on their intermolecular hydrogen bonding interactions and membrane functions. Canadian Journal of Biochemistry and Cell Biology 64, 50-57.
Coolbear, K.P., Berde, C.B., Keough, K.M.W., 1983. Gel to liquid-crystalline phase transitions of aqueous dispersions of polyunsaturated mixed-acid phosphatidylcholines. Biochemistry 22, 1466-1473.
Cossins, A.R., 1983. The adaptation of membrane structure and function to changes in temperature. In: Cossins, A.R., Sherterline, P. (Eds.), Cellular Acclimatisation to Environmental Changes. Cambridge University Press, Cambridge.
Cullis, P., Fenske, D.B., Hope, M.J., 1996. Physical properties and functional roles of lipids in membranes. In: Vance, D.E., Vance, J.E. (Eds.), Biochemistry of Lipids, Lipoproteins and Membranes. New Comprehensive Biochemistry, Elsevier, Amsterdam, pp. 1-33.
Fang, J., Barcelona, M.J., Nogi, Y., Kato, C., 2000. Biochemical implications and geochemical significance of novel phospholipids of the extremely barophilic bacteria from the Marianas Trench at 11,000 m. Deep Sea Research 47, 1173-1182.
Kashefi, K., Lovley, D., R.,, 2003. Extending the upper temperature limit of life. Science 301, 934.
Keough, K.M.W., Davis, P.J., 1979. Gel to liquid-crystalline phase transition in water dispersions of saturated mixed-acid phosphatidylcholines. Biochemistry 18, 1453-1459.
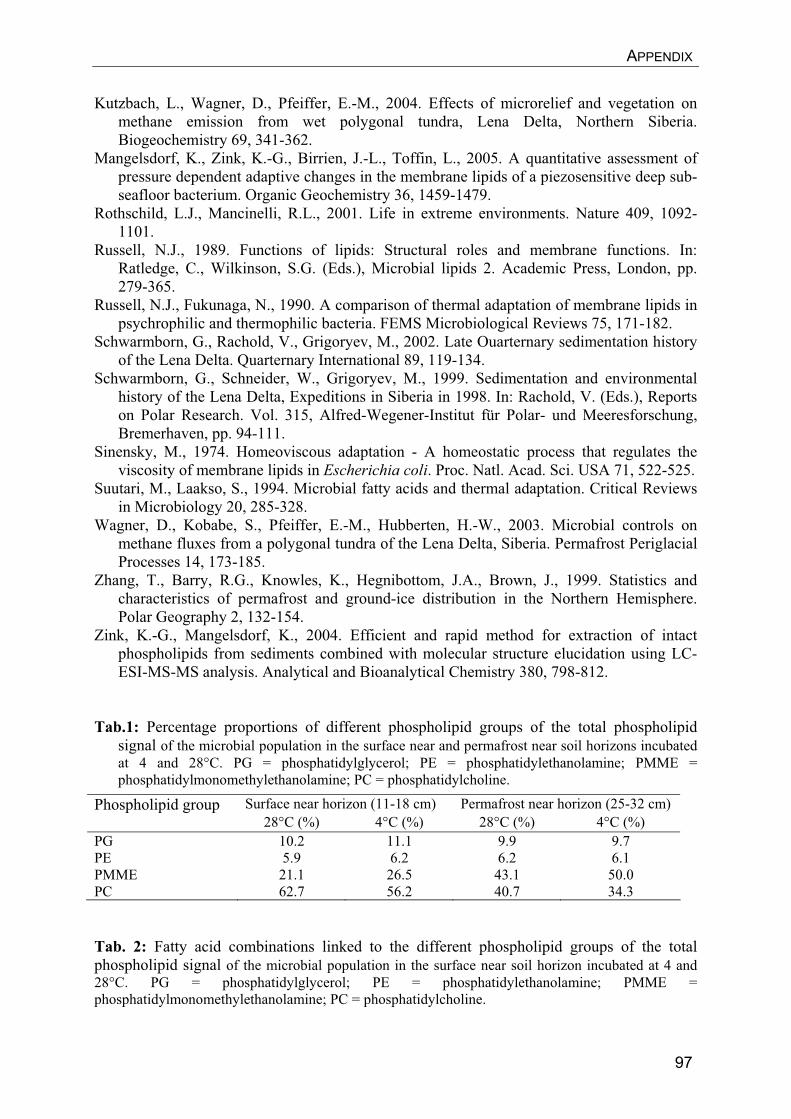
APPENDIX
97
Kutzbach, L., Wagner, D., Pfeiffer, E.-M., 2004. Effects of microrelief and vegetation on methane emission from wet polygonal tundra, Lena Delta, Northern Siberia. Biogeochemistry 69, 341-362.
Mangelsdorf, K., Zink, K.-G., Birrien, J.-L., Toffin, L., 2005. A quantitative assessment of pressure dependent adaptive changes in the membrane lipids of a piezosensitive deep sub-seafloor bacterium. Organic Geochemistry 36, 1459-1479.
Rothschild, L.J., Mancinelli, R.L., 2001. Life in extreme environments. Nature 409, 1092-1101.
Russell, N.J., 1989. Functions of lipids: Structural roles and membrane functions. In: Ratledge, C., Wilkinson, S.G. (Eds.), Microbial lipids 2. Academic Press, London, pp. 279-365.
Russell, N.J., Fukunaga, N., 1990. A comparison of thermal adaptation of membrane lipids in psychrophilic and thermophilic bacteria. FEMS Microbiological Reviews 75, 171-182.
Schwarmborn, G., Rachold, V., Grigoryev, M., 2002. Late Ouarternary sedimentation history of the Lena Delta. Quarternary International 89, 119-134.
Schwarmborn, G., Schneider, W., Grigoryev, M., 1999. Sedimentation and environmental history of the Lena Delta, Expeditions in Siberia in 1998. In: Rachold, V. (Eds.), Reports on Polar Research. Vol. 315, Alfred-Wegener-Institut für Polar- und Meeresforschung, Bremerhaven, pp. 94-111.
Sinensky, M., 1974. Homeoviscous adaptation - A homeostatic process that regulates the viscosity of membrane lipids in Escherichia coli. Proc. Natl. Acad. Sci. USA 71, 522-525.
Suutari, M., Laakso, S., 1994. Microbial fatty acids and thermal adaptation. Critical Reviews in Microbiology 20, 285-328.
Wagner, D., Kobabe, S., Pfeiffer, E.-M., Hubberten, H.-W., 2003. Microbial controls on methane fluxes from a polygonal tundra of the Lena Delta, Siberia. Permafrost Periglacial Processes 14, 173-185.
Zhang, T., Barry, R.G., Knowles, K., Hegnibottom, J.A., Brown, J., 1999. Statistics and characteristics of permafrost and ground-ice distribution in the Northern Hemisphere. Polar Geography 2, 132-154.
Zink, K.-G., Mangelsdorf, K., 2004. Efficient and rapid method for extraction of intact phospholipids from sediments combined with molecular structure elucidation using LC-ESI-MS-MS analysis. Analytical and Bioanalytical Chemistry 380, 798-812.
Tab.1: Percentage proportions of different phospholipid groups of the total phospholipid signal of the microbial population in the surface near and permafrost near soil horizons incubated at 4 and 28°C. PG = phosphatidylglycerol; PE = phosphatidylethanolamine; PMME = phosphatidylmonomethylethanolamine; PC = phosphatidylcholine.
Phospholipid group Surface near horizon (11-18 cm) Permafrost near horizon (25-32 cm) 28°C (%) 4°C (%) 28°C (%) 4°C (%)
PG 10.2 11.1 9.9 9.7 PE 5.9 6.2 6.2 6.1 PMME 21.1 26.5 43.1 50.0 PC 62.7 56.2 40.7 34.3
Tab. 2: Fatty acid combinations linked to the different phospholipid groups of the total phospholipid signal of the microbial population in the surface near soil horizon incubated at 4 and 28°C. PG = phosphatidylglycerol; PE = phosphatidylethanolamine; PMME = phosphatidylmonomethylethanolamine; PC = phosphatidylcholine.
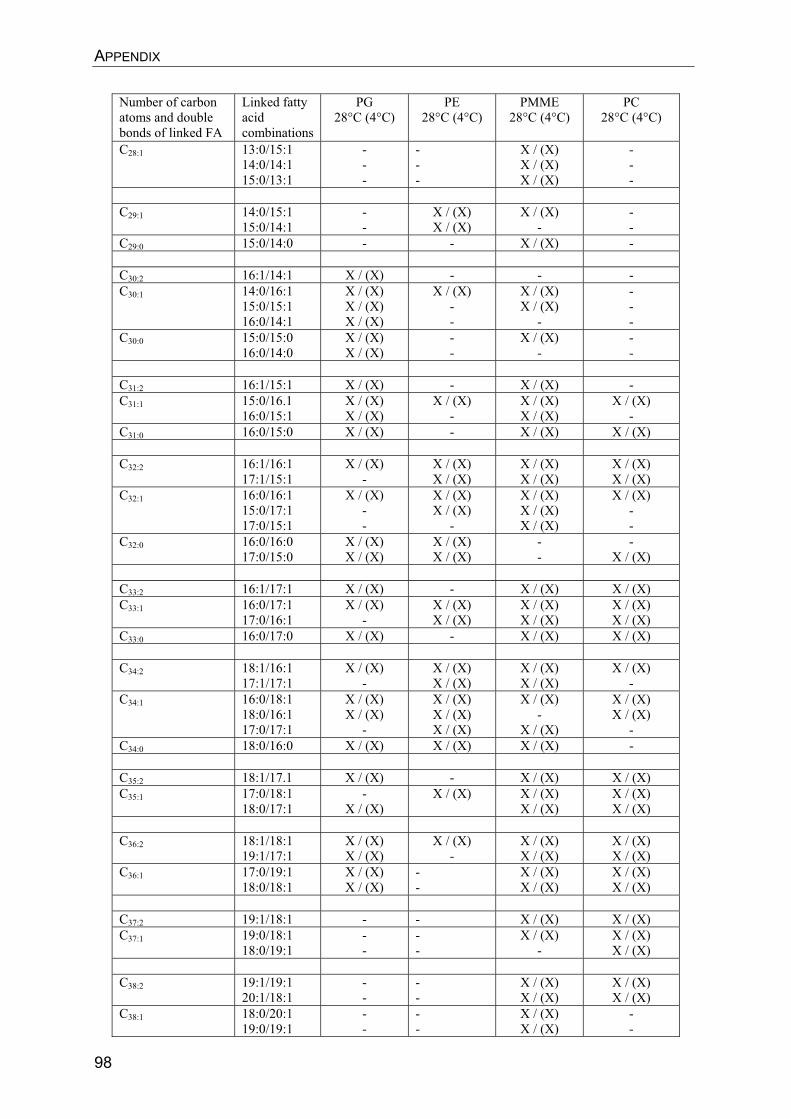
APPENDIX
98
Number of carbon atoms and double bonds of linked FA
Linked fatty acidcombinations
PG28°C (4°C)
PE28°C (4°C)
PMME28°C (4°C)
PC28°C (4°C)
C28:1 13:0/15:1 14:0/14:1 15:0/13:1
---
---
X / (X) X / (X) X / (X)
---
C29:1 14:0/15:1
15:0/14:1 --
X / (X) X / (X)
X / (X) -
--
C29:0 15:0/14:0 - - X / (X) - C30:2 16:1/14:1 X / (X) - - - C30:1 14:0/16:1
15:0/15:1 16:0/14:1
X / (X) X / (X) X / (X)
X / (X) --
X / (X) X / (X)
-
---
C30:0 15:0/15:0 16:0/14:0
X / (X) X / (X)
--
X / (X) -
--
C31:2 16:1/15:1 X / (X) - X / (X) - C31:1 15:0/16.1
16:0/15:1 X / (X) X / (X)
X / (X) -
X / (X) X / (X)
X / (X) -
C31:0 16:0/15:0 X / (X) - X / (X) X / (X) C32:2 16:1/16:1
17:1/15:1 X / (X)
-X / (X) X / (X)
X / (X) X / (X)
X / (X) X / (X)
C32:1 16:0/16:1 15:0/17:1 17:0/15:1
X / (X) --
X / (X) X / (X)
-
X / (X) X / (X) X / (X)
X / (X) --
C32:0 16:0/16:0 17:0/15:0
X / (X) X / (X)
X / (X) X / (X)
--
-X / (X)
C33:2 16:1/17:1 X / (X) - X / (X) X / (X) C33:1 16:0/17:1
17:0/16:1 X / (X)
-X / (X) X / (X)
X / (X) X / (X)
X / (X) X / (X)
C33:0 16:0/17:0 X / (X) - X / (X) X / (X) C34:2 18:1/16:1
17:1/17:1 X / (X)
-X / (X) X / (X)
X / (X) X / (X)
X / (X) -
C34:1 16:0/18:1 18:0/16:1 17:0/17:1
X / (X) X / (X)
-
X / (X) X / (X) X / (X)
X / (X) -
X / (X)
X / (X) X / (X)
-C34:0 18:0/16:0 X / (X) X / (X) X / (X) - C35:2 18:1/17.1 X / (X) - X / (X) X / (X) C35:1 17:0/18:1
18:0/17:1 -
X / (X) X / (X) X / (X)
X / (X) X / (X) X / (X)
C36:2 18:1/18:1
19:1/17:1 X / (X) X / (X)
X / (X) -
X / (X) X / (X)
X / (X) X / (X)
C36:1 17:0/19:1 18:0/18:1
X / (X) X / (X)
--
X / (X) X / (X)
X / (X) X / (X)
C37:2 19:1/18:1 - - X / (X) X / (X) C37:1 19:0/18:1
18:0/19:1 --
--
X / (X) -
X / (X) X / (X)
C38:2 19:1/19:1
20:1/18:1 --
--
X / (X) X / (X)
X / (X) X / (X)
C38:1 18:0/20:1 19:0/19:1
--
--
X / (X) X / (X)
--
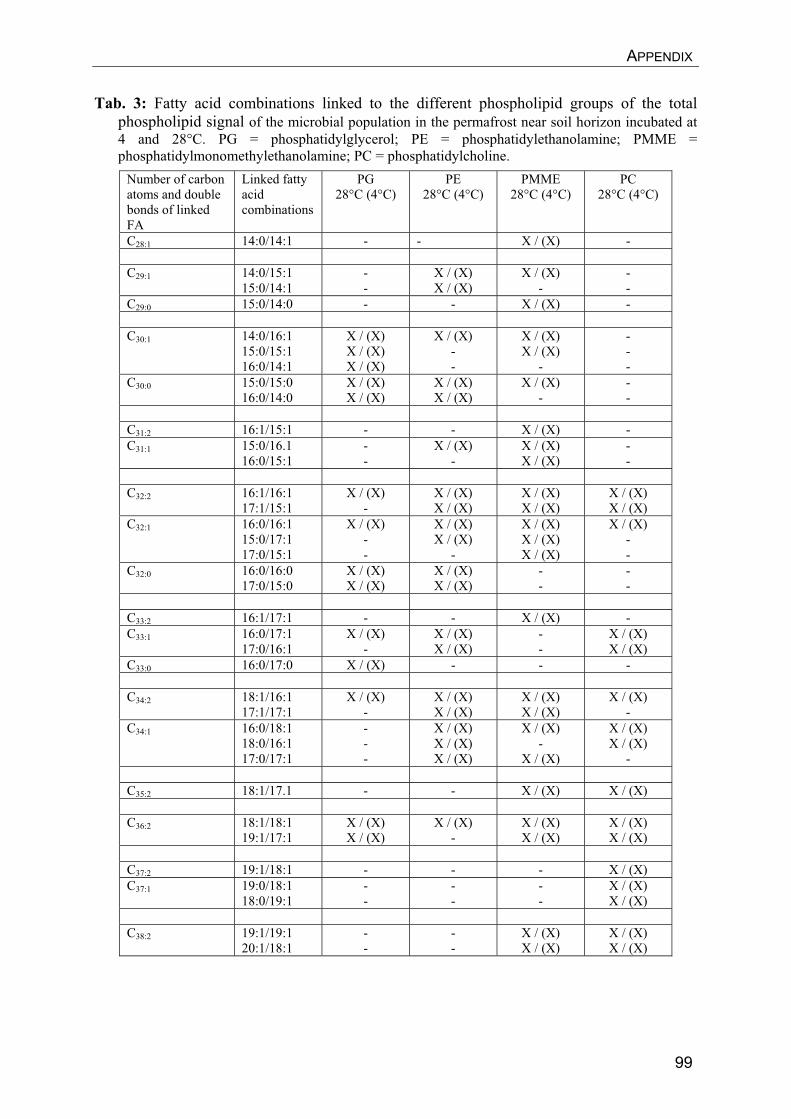
APPENDIX
99
Tab. 3: Fatty acid combinations linked to the different phospholipid groups of the total phospholipid signal of the microbial population in the permafrost near soil horizon incubated at 4 and 28°C. PG = phosphatidylglycerol; PE = phosphatidylethanolamine; PMME = phosphatidylmonomethylethanolamine; PC = phosphatidylcholine.
Number of carbon atoms and double bonds of linked FA
Linked fatty acidcombinations
PG28°C (4°C)
PE28°C (4°C)
PMME28°C (4°C)
PC28°C (4°C)
C28:1 14:0/14:1 - - X / (X) - C29:1 14:0/15:1
15:0/14:1 --
X / (X) X / (X)
X / (X) -
--
C29:0 15:0/14:0 - - X / (X) - C30:1 14:0/16:1
15:0/15:1 16:0/14:1
X / (X) X / (X) X / (X)
X / (X) --
X / (X) X / (X)
-
---
C30:0 15:0/15:0 16:0/14:0
X / (X) X / (X)
X / (X) X / (X)
X / (X) -
--
C31:2 16:1/15:1 - - X / (X) - C31:1 15:0/16.1
16:0/15:1 --
X / (X) -
X / (X) X / (X)
--
C32:2 16:1/16:1
17:1/15:1 X / (X)
-X / (X) X / (X)
X / (X) X / (X)
X / (X) X / (X)
C32:1 16:0/16:1 15:0/17:1 17:0/15:1
X / (X) --
X / (X) X / (X)
-
X / (X) X / (X) X / (X)
X / (X) --
C32:0 16:0/16:0 17:0/15:0
X / (X) X / (X)
X / (X) X / (X)
--
--
C33:2 16:1/17:1 - - X / (X) - C33:1 16:0/17:1
17:0/16:1 X / (X)
-X / (X) X / (X)
--
X / (X) X / (X)
C33:0 16:0/17:0 X / (X) - - - C34:2 18:1/16:1
17:1/17:1 X / (X)
-X / (X) X / (X)
X / (X) X / (X)
X / (X) -
C34:1 16:0/18:1 18:0/16:1 17:0/17:1
---
X / (X) X / (X) X / (X)
X / (X) -
X / (X)
X / (X) X / (X)
- C35:2 18:1/17.1 - - X / (X) X / (X) C36:2 18:1/18:1
19:1/17:1 X / (X) X / (X)
X / (X) -
X / (X) X / (X)
X / (X) X / (X)
C37:2 19:1/18:1 - - - X / (X) C37:1 19:0/18:1
18:0/19:1 --
--
--
X / (X) X / (X)
C38:2 19:1/19:1
20:1/18:1 --
--
X / (X) X / (X)
X / (X) X / (X)
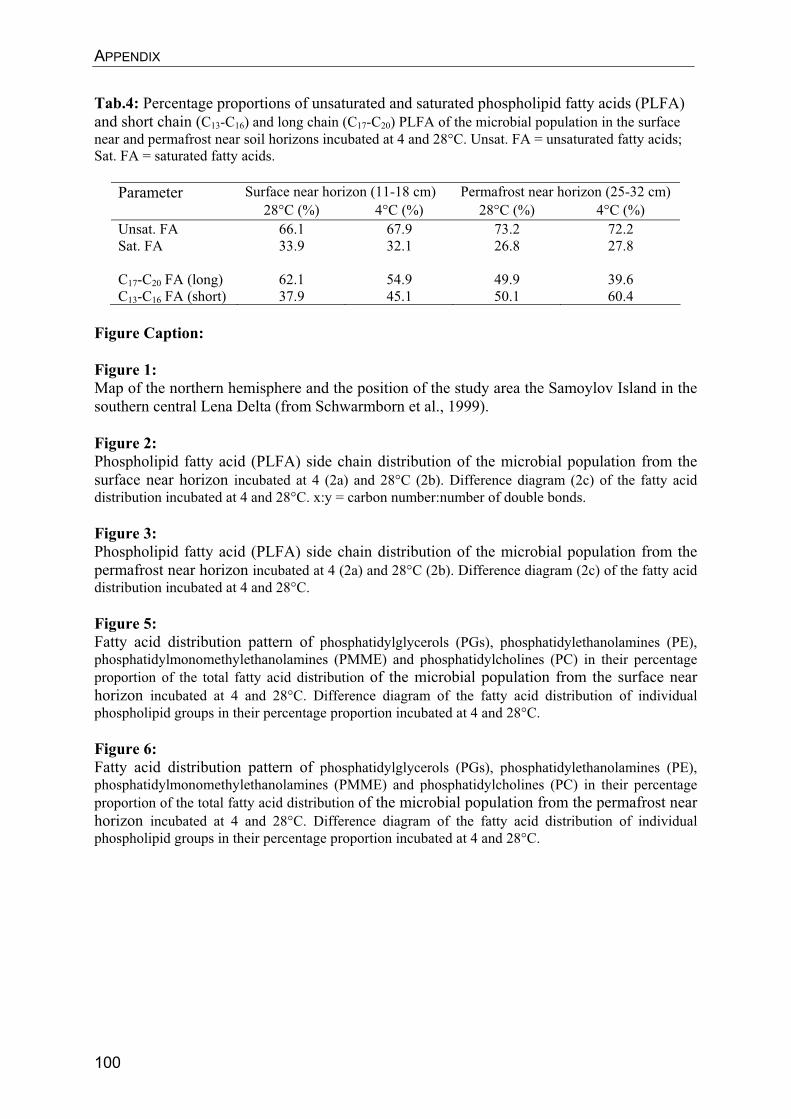
APPENDIX
100
Tab.4: Percentage proportions of unsaturated and saturated phospholipid fatty acids (PLFA) and short chain (C13-C16) and long chain (C17-C20) PLFA of the microbial population in the surface near and permafrost near soil horizons incubated at 4 and 28°C. Unsat. FA = unsaturated fatty acids; Sat. FA = saturated fatty acids.
Parameter Surface near horizon (11-18 cm) Permafrost near horizon (25-32 cm) 28°C (%) 4°C (%) 28°C (%) 4°C (%)
Unsat. FA 66.1 67.9 73.2 72.2 Sat. FA 33.9 32.1 26.8 27.8 C17-C20 FA (long) 62.1 54.9 49.9 39.6 C13-C16 FA (short) 37.9 45.1 50.1 60.4
Figure Caption:
Figure 1: Map of the northern hemisphere and the position of the study area the Samoylov Island in the southern central Lena Delta (from Schwarmborn et al., 1999).
Figure 2: Phospholipid fatty acid (PLFA) side chain distribution of the microbial population from the surface near horizon incubated at 4 (2a) and 28°C (2b). Difference diagram (2c) of the fatty acid distribution incubated at 4 and 28°C. x:y = carbon number:number of double bonds.
Figure 3: Phospholipid fatty acid (PLFA) side chain distribution of the microbial population from the permafrost near horizon incubated at 4 (2a) and 28°C (2b). Difference diagram (2c) of the fatty acid distribution incubated at 4 and 28°C.
Figure 5: Fatty acid distribution pattern of phosphatidylglycerols (PGs), phosphatidylethanolamines (PE), phosphatidylmonomethylethanolamines (PMME) and phosphatidylcholines (PC) in their percentage proportion of the total fatty acid distribution of the microbial population from the surface near horizon incubated at 4 and 28°C. Difference diagram of the fatty acid distribution of individual phospholipid groups in their percentage proportion incubated at 4 and 28°C.
Figure 6: Fatty acid distribution pattern of phosphatidylglycerols (PGs), phosphatidylethanolamines (PE), phosphatidylmonomethylethanolamines (PMME) and phosphatidylcholines (PC) in their percentage proportion of the total fatty acid distribution of the microbial population from the permafrost near horizon incubated at 4 and 28°C. Difference diagram of the fatty acid distribution of individual phospholipid groups in their percentage proportion incubated at 4 and 28°C.
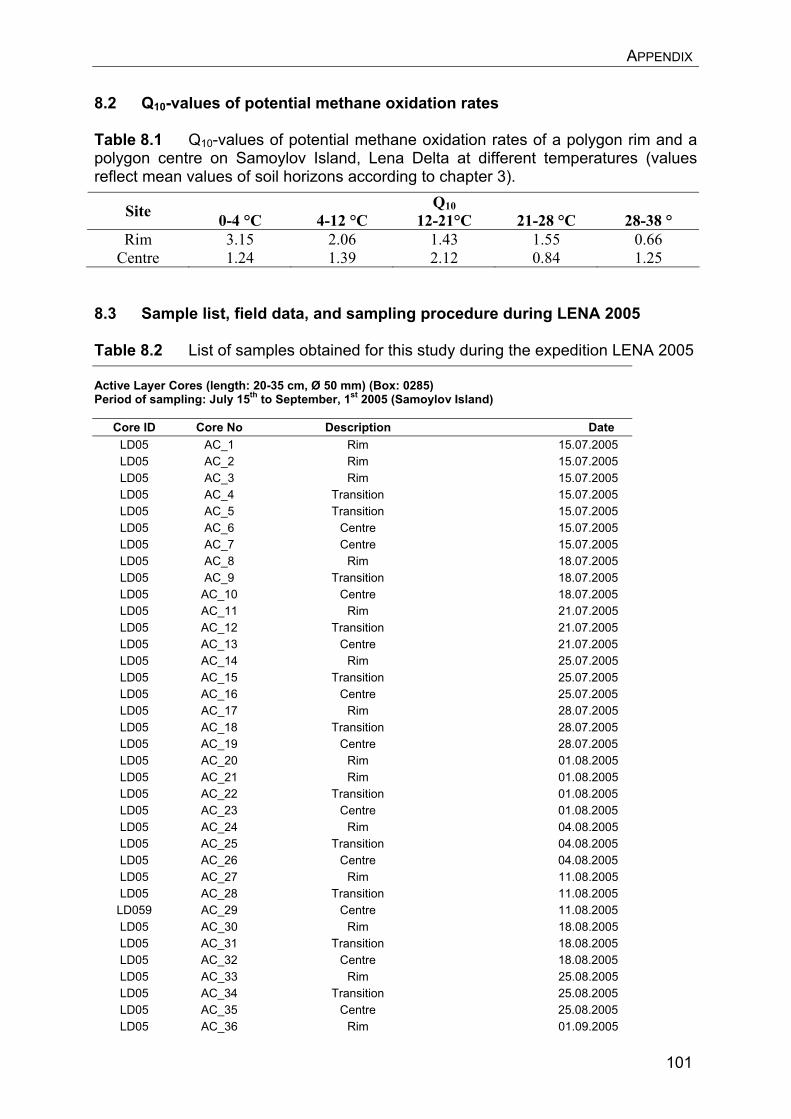
APPENDIX
101
8.2 Q10-values of potential methane oxidation rates Table 8.1 Q10-values of potential methane oxidation rates of a polygon rim and a polygon centre on Samoylov Island, Lena Delta at different temperatures (values reflect mean values of soil horizons according to chapter 3).
Q10Site 0-4 °C 4-12 °C 12-21°C 21-28 °C 28-38 ° Rim 3.15 2.06 1.43 1.55 0.66
Centre 1.24 1.39 2.12 0.84 1.25 8.3 Sample list, field data, and sampling procedure during LENA 2005 Table 8.2 List of samples obtained for this study during the expedition LENA 2005
Active Layer Cores (length: 20-35 cm, Ø 50 mm) (Box: 0285) Period of sampling: July 15th to September, 1st 2005 (Samoylov Island)
Core ID Core No Description Date LD05 AC_1 Rim 15.07.2005 LD05 AC_2 Rim 15.07.2005 LD05 AC_3 Rim 15.07.2005 LD05 AC_4 Transition 15.07.2005 LD05 AC_5 Transition 15.07.2005 LD05 AC_6 Centre 15.07.2005 LD05 AC_7 Centre 15.07.2005 LD05 AC_8 Rim 18.07.2005 LD05 AC_9 Transition 18.07.2005 LD05 AC_10 Centre 18.07.2005 LD05 AC_11 Rim 21.07.2005 LD05 AC_12 Transition 21.07.2005 LD05 AC_13 Centre 21.07.2005 LD05 AC_14 Rim 25.07.2005 LD05 AC_15 Transition 25.07.2005 LD05 AC_16 Centre 25.07.2005 LD05 AC_17 Rim 28.07.2005 LD05 AC_18 Transition 28.07.2005 LD05 AC_19 Centre 28.07.2005 LD05 AC_20 Rim 01.08.2005 LD05 AC_21 Rim 01.08.2005 LD05 AC_22 Transition 01.08.2005 LD05 AC_23 Centre 01.08.2005 LD05 AC_24 Rim 04.08.2005 LD05 AC_25 Transition 04.08.2005 LD05 AC_26 Centre 04.08.2005 LD05 AC_27 Rim 11.08.2005 LD05 AC_28 Transition 11.08.2005
LD059 AC_29 Centre 11.08.2005 LD05 AC_30 Rim 18.08.2005 LD05 AC_31 Transition 18.08.2005 LD05 AC_32 Centre 18.08.2005 LD05 AC_33 Rim 25.08.2005 LD05 AC_34 Transition 25.08.2005 LD05 AC_35 Centre 25.08.2005 LD05 AC_36 Rim 01.09.2005
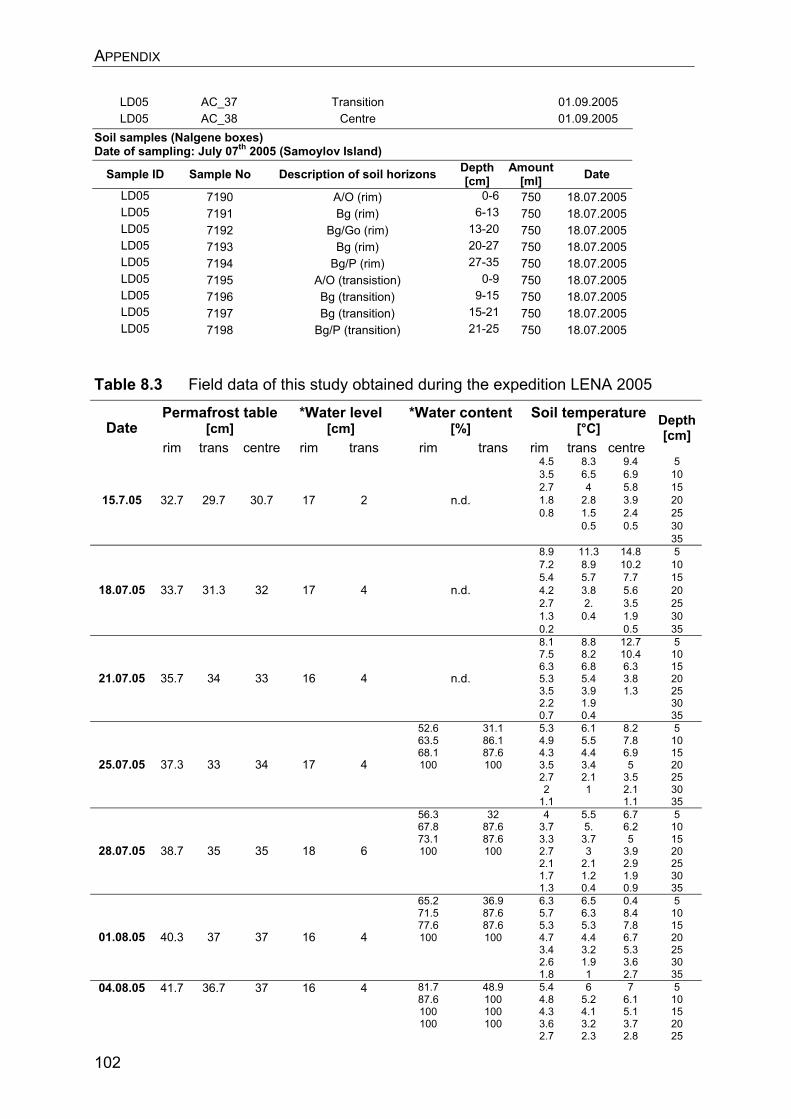
APPENDIX
102
LD05 AC_37 Transition 01.09.2005 LD05 AC_38 Centre 01.09.2005
Soil samples (Nalgene boxes) Date of sampling: July 07th 2005 (Samoylov Island)
Sample ID Sample No Description of soil horizons Depth [cm]
Amount [ml] Date
LD05 7190 A/O (rim) 0-6 750 18.07.2005 LD05 7191 Bg (rim) 6-13 750 18.07.2005 LD05 7192 Bg/Go (rim) 13-20 750 18.07.2005 LD05 7193 Bg (rim) 20-27 750 18.07.2005 LD05 7194 Bg/P (rim) 27-35 750 18.07.2005 LD05 7195 A/O (transistion) 0-9 750 18.07.2005 LD05 7196 Bg (transition) 9-15 750 18.07.2005 LD05 7197 Bg (transition) 15-21 750 18.07.2005 LD05 7198 Bg/P (transition) 21-25 750 18.07.2005
Table 8.3 Field data of this study obtained during the expedition LENA 2005
Permafrost table [cm]
*Water level [cm]
*Water content [%]
Soil temperature [°C]Date
rim trans centre rim trans rim trans rim trans centre
Depth [cm]
4.5 8.3 9.4 5 3.5 6.5 6.9 10 2.7 4 5.8 15 1.8 2.8 3.9 20 0.8 1.5 2.4 25
0.5 0.5 30
15.7.05 32.7 29.7 30.7 17 2 n.d.
35 8.9 11.3 14.8 5 7.2 8.9 10.2 10 5.4 5.7 7.7 15 4.2 3.8 5.6 20 2.7 2. 3.5 25 1.3 0.4 1.9 30
18.07.05 33.7 31.3 32 17 4 n.d.
0.2 0.5 35 8.1 8.8 12.7 5 7.5 8.2 10.4 10 6.3 6.8 6.3 15 5.3 5.4 3.8 20 3.5 3.9 1.3 25 2.2 1.9 30
21.07.05 35.7 34 33 16 4 n.d.
0.7 0.4 35 52.6 31.1 5.3 6.1 8.2 5 63.5 86.1 4.9 5.5 7.8 10 68.1 87.6 4.3 4.4 6.9 15 100 100 3.5 3.4 5 20
2.7 2.1 3.5 25 2 1 2.1 30
25.07.05 37.3 33 34 17 4
1.1 1.1 35
56.3 32 4 5.5 6.7 5 67.8 87.6 3.7 5. 6.2 10 73.1 87.6 3.3 3.7 5 15 100 100 2.7 3 3.9 20
2.1 2.1 2.9 25 1.7 1.2 1.9 30
28.07.05 38.7 35 35 18 6
1.3 0.4 0.9 35
65.2 36.9 6.3 6.5 0.4 5 71.5 87.6 5.7 6.3 8.4 10 77.6 87.6 5.3 5.3 7.8 15 100 100 4.7 4.4 6.7 20
3.4 3.2 5.3 25 2.6 1.9 3.6 30
01.08.05 40.3 37 37 16 4
1.8 1 2.7 35
81.7 48.9 5.4 6 7 5 87.6 100 4.8 5.2 6.1 10 100 100 4.3 4.1 5.1 15 100 100 3.6 3.2 3.7 20
04.08.05 41.7 36.7 37 16 4
2.7 2.3 2.8 25
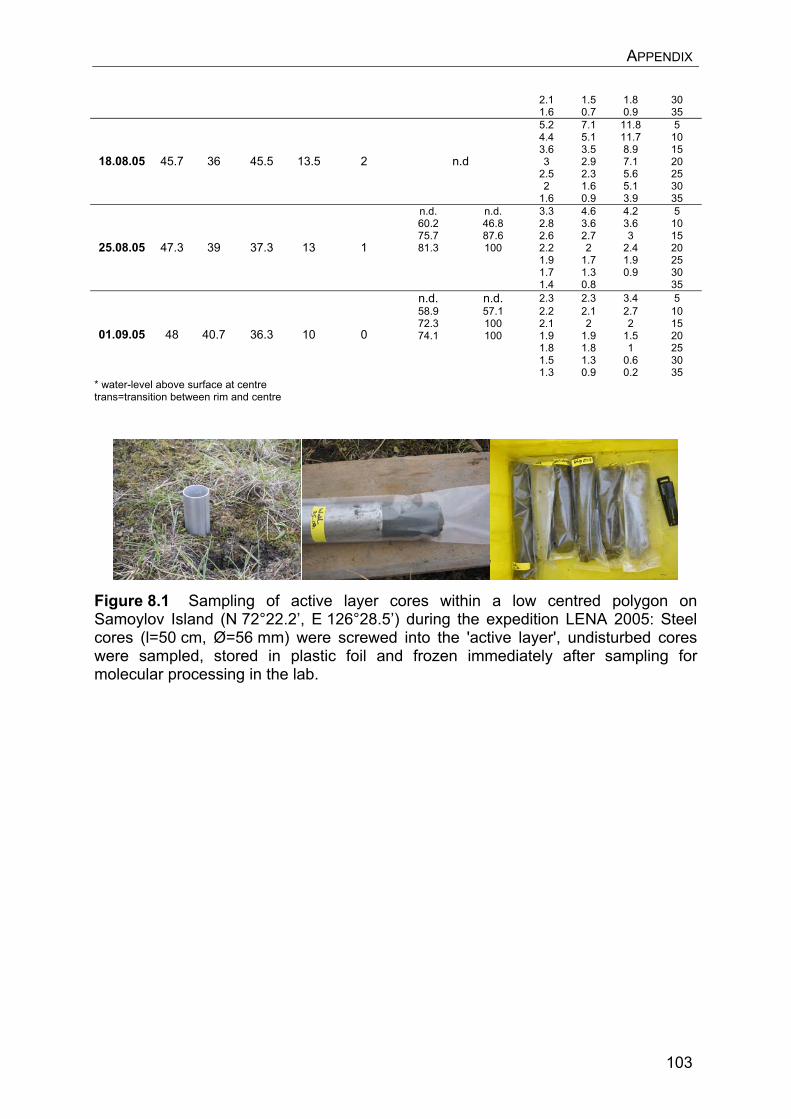
APPENDIX
103
2.1 1.5 1.8 30 1.6 0.7 0.9 35 5.2 7.1 11.8 5 4.4 5.1 11.7 10 3.6 3.5 8.9 15 3 2.9 7.1 20
2.5 2.3 5.6 25 2 1.6 5.1 30
18.08.05 45.7 36 45.5 13.5 2 n.d
1.6 0.9 3.9 35 n.d. n.d. 3.3 4.6 4.2 5 60.2 46.8 2.8 3.6 3.6 10 75.7 87.6 2.6 2.7 3 15 81.3 100 2.2 2 2.4 20
1.9 1.7 1.9 25 1.7 1.3 0.9 30
25.08.05 47.3 39 37.3 13 1
1.4 0.8 35
n.d. n.d. 2.3 2.3 3.4 5 58.9 57.1 2.2 2.1 2.7 10 72.3 100 2.1 2 2 15 74.1 100 1.9 1.9 1.5 20
1.8 1.8 1 25 1.5 1.3 0.6 30
01.09.05 48 40.7 36.3 10 0
1.3 0.9 0.2 35
* water-level above surface at centre trans=transition between rim and centre
Figure 8.1 Sampling of active layer cores within a low centred polygon on Samoylov Island (N 72°22.2’, E 126°28.5’) during the expedition LENA 2005: Steel cores (l=50 cm, Ø=56 mm) were screwed into the 'active layer', undisturbed cores were sampled, stored in plastic foil and frozen immediately after sampling for molecular processing in the lab.
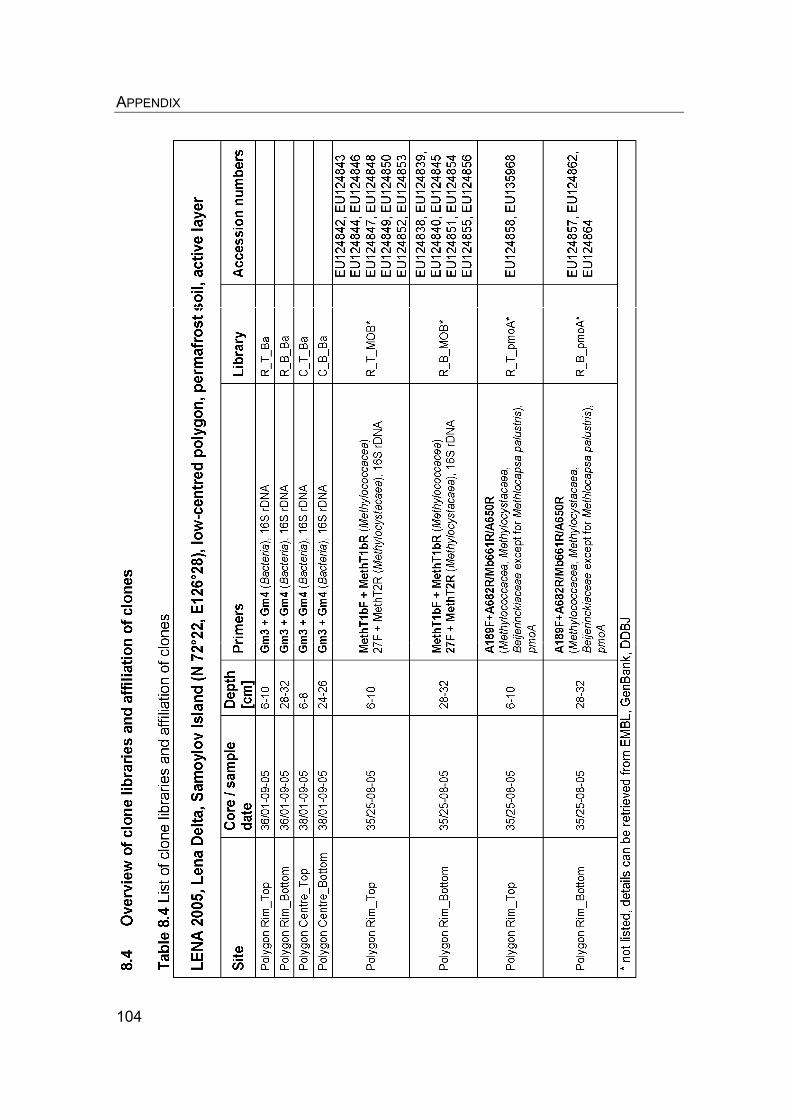
APPENDIX
104
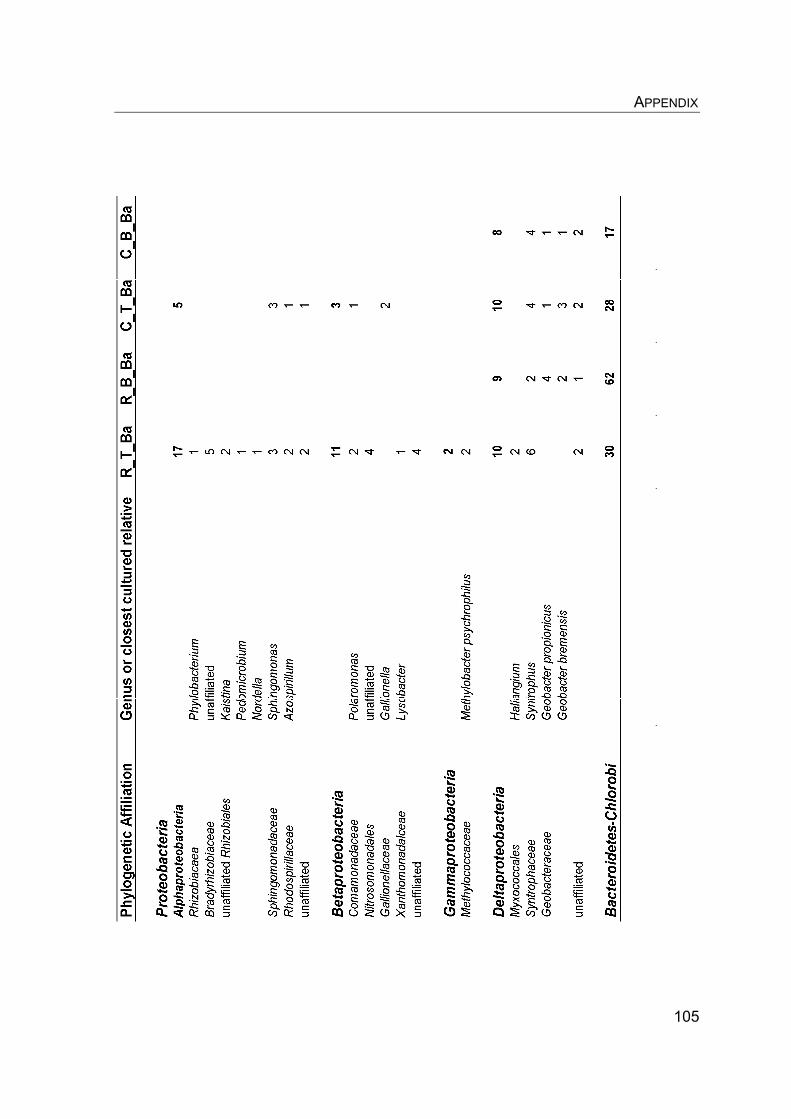
APPENDIX
105
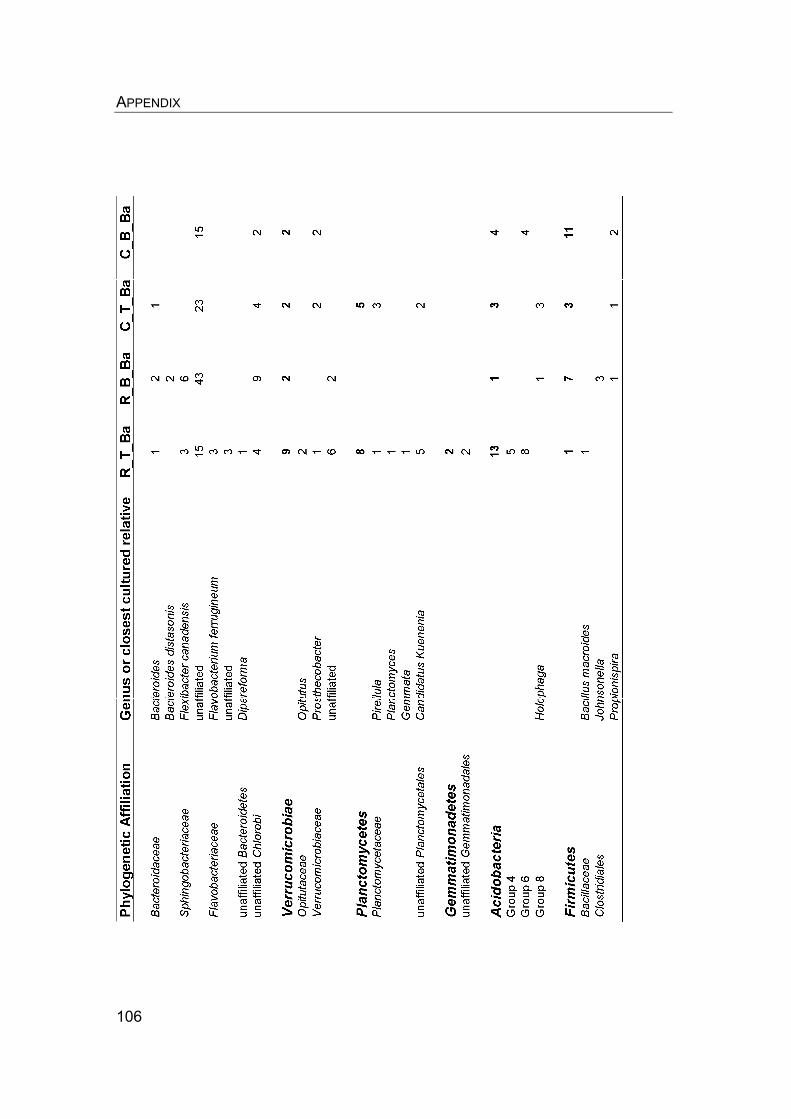
APPENDIX
106
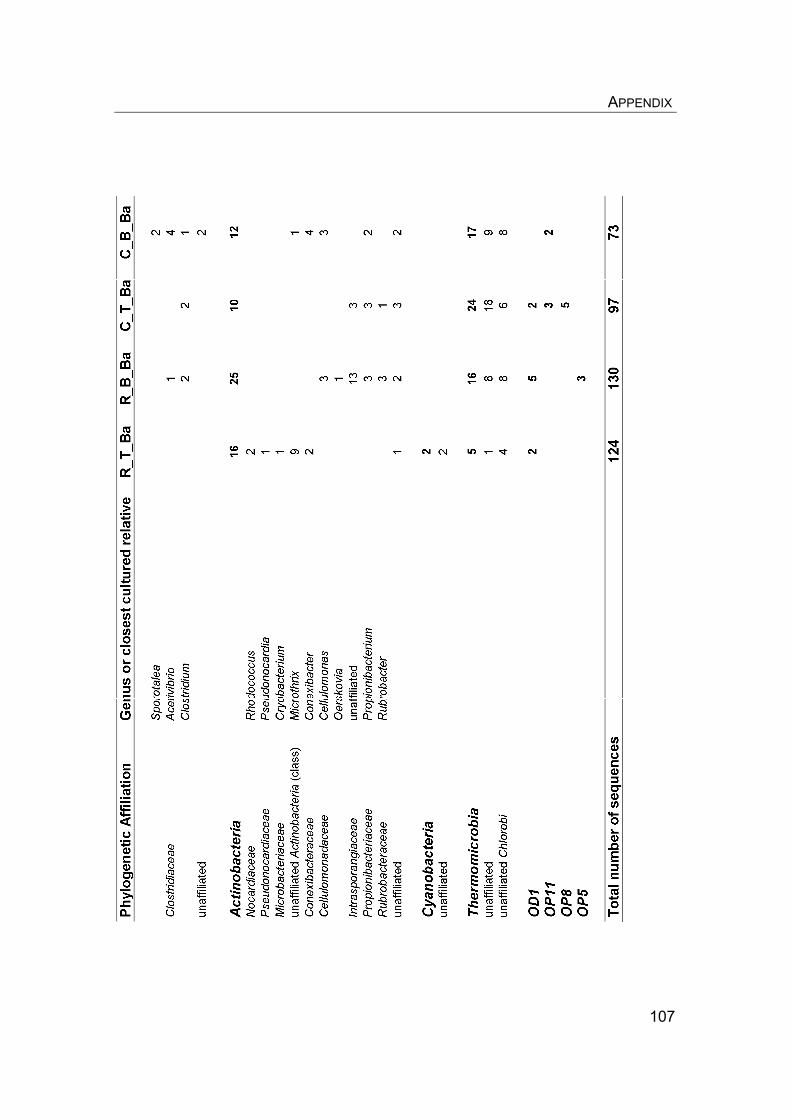
APPENDIX
107
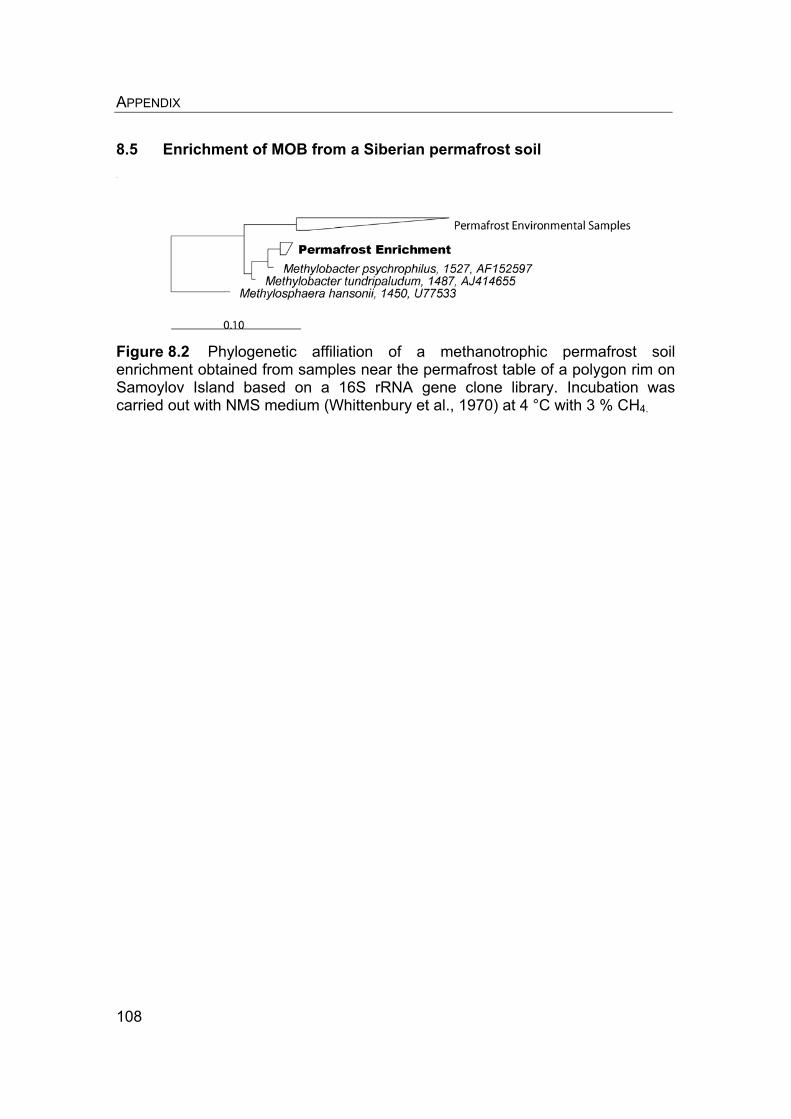
APPENDIX
108
8.5 Enrichment of MOB from a Siberian permafrost soil
Figure 8.2 Phylogenetic affiliation of a methanotrophic permafrost soil enrichment obtained from samples near the permafrost table of a polygon rim on Samoylov Island based on a 16S rRNA gene clone library. Incubation was carried out with NMS medium (Whittenbury et al., 1970) at 4 °C with 3 % CH4.