Embed Size (px)
Citation preview
J Physiol 599.3 (2021) pp 771–790 771
The
Jou
rnal
of
Phys
iolo
gy
Adaptation to a low carbohydrate high fat diet is rapid butimpairs endurance exercise metabolism and performancedespite enhanced glycogen availability
Louise M. Burke1,2 , Jamie Whitfield1 , Ida A. Heikura1,2 , Megan L. R. Ross1,2, Nicolin Tee2 ,Sara F. Forbes2 , Rebecca Hall1,2 , Alannah K. A. McKay2,3,4, Alice M. Wallett2,5
and Avish P. Sharma2,6
1Exercise and Nutrition Research Program, Mary MacKillop Institute for Health Research, Australian Catholic University, Melbourne, Australia2Australian Institute of Sport, Canberra, Australia3School of Human Sciences (Exercise and Sport Science), University of Western Australia, Crawley, Australia4Western Australian Institute of Sport, Mt, Claremont, Western Australia, Australia5University of Canberra Research Institute for Sport and Exercise, Canberra, Australia6Griffith Sports Physiology and Performance, School of Allied Health Sciences, Griffith University, Southport, Australia
Edited by: Scott Powers & Karyn Hamilton
Linked articles: This article is highlighted in a Perspectives article by Melby. To read this article, visithttps://doi.org/10.1113/JP280552.
Key points
� Brief (5–6 days) adaptation to a low carbohydrate high fat diet in elite athletes increased exercisefat oxidation to rates previously observed with medium (3–4 weeks) or chronic (>12 months)adherence to this diet, with metabolic changes being washed out in a similar time frame.
� Increased fat utilisation during exercise was associated with a 5–8% increase in oxygen cost atspeeds related to Olympic Programme races.
� Acute restoration of endogenous carbohydrate (CHO) availability (24 h high CHO diet,pre-race CHO) only partially restored substrate utilisation during a race warm-up. Fat oxidationcontinued to be elevated above baseline values although it was lower than achieved by 5–6 days’keto adaptation; CHO oxidation only reached 61% and 78% of values previously seen at exerciseintensities related to race events.
� Acute restoration of CHO availability failed to overturn the impairment of high-intensityendurance performance previously associated with low carbohydrate high fat adaptation,potentially due to the blunted capacity for CHO oxidation.
Abstract We investigated substrate utilisation during exercise after brief (5–6 days) adaptation toa ketogenic low-carbohydrate (CHO), high-fat (LCHF) diet and similar washout period. Thirteenworld-class male race walkers completed economy testing, 25 km training and a 10,000 m race
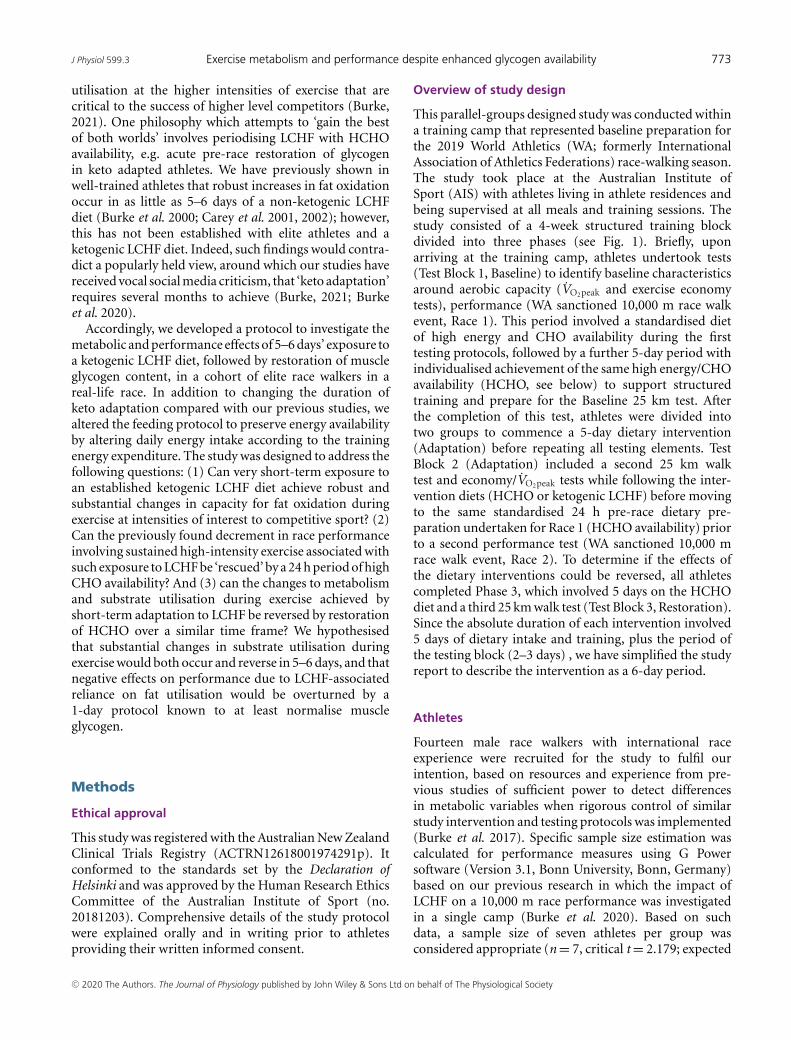
Louise Burke holds a Chair in Sports Nutrition at the Mary MacKillop Institute for Health Researchat Australian Catholic University. Prior to assuming this as a full-time role, she was Head of SportsNutrition (1990–2018) and Chief of Nutrition Strategy (2018–2020) at the Australian Institute of Sport.She was the team dietitian for the Australian Olympic Team for the five Summer Olympic Games from1996 to 2012. Her research focuses on the effects of exercise and nutrition strategies on the performanceof elite athletes. Jamie Whitfield received his PhD from the University of Guelph in 2017 and is nowa Postdoctoral Research Fellow within the Mary MacKillop Institute for Health Research. His researchaims to gain a better understanding of how dietary and exercise interventions can alter skeletal musclemetabolism, and can therefore be used to improve outcomes along the health spectrum – from pathologyto performance.
L. M. Burke and J. Whitfield contributed equally to this work
C© 2020 The Authors. The Journal of Physiology published by John Wiley & Sons Ltd on behalf of The Physiological Society DOI: 10.1113/JP280221
This is an open access article under the terms of the Creative Commons Attribution License, which permits use, distributionand reproduction in any medium, provided the original work is properly cited.
772 L. M. Burke and others J Physiol 599.3
(Baseline), with high CHO availability (HCHO), repeating this (Adaptation) after 5–6 days’ LCHF(n = 7; CHO: <50 g day−1, protein: 2.2 g kg−1 day−1; 80% fat) or HCHO (n = 6; CHO: 9.7 g kg−1
day−1; protein: 2.2 g kg−1 day−1) diet. An Adaptation race was undertaken after 24 h HCHOand pre-race CHO (2 g kg−1) diet, identical to the Baseline race. Substantial (>200%) increasesin exercise fat oxidation occurred in the LCHF Adaptation economy and 25 km tests, reachingmean rates of �1.43 g min−1. However, relative VO2 (ml min−1 kg−1) was higher (P < 0.0001),by �8% and 5% at speeds related to 50 km and 20 km events. During Adaptation race warm-upin the LCHF group, rates of fat and CHO oxidation at these speeds were decreased and increased,respectively (P < 0.001), compared with the previous day, but were not restored to Baseline values.Performance changes differed between groups (P = 0.009), with all HCHO athletes improvingin the Adaptation race (5.7 (5.6)%), while 6/7 LCHF athletes were slower (2.2 (3.4)%). Substrateutilisation returned to Baseline values after 5–6 days of HCHO diet. In summary, robust changesin exercise substrate use occurred in 5–6 days of extreme changes in CHO intake. However,adaptation to a LCHF diet plus acute restoration of endogenous CHO availability failed to restorehigh-intensity endurance performance, with CHO oxidation rates remaining blunted.
(Received 22 May 2020; accepted after revision 14 July 2020; first published online 22 July 2020)Corresponding author L. M. Burke: Exercise and Nutrition Research Program, Mary MacKillop Institute for HealthResearch, 215 Spring St, Melbourne 3000, Australia. Email: [email protected]
Introduction
According to current sports nutrition guidelines, theperformance of sustained high-intensity endurance sportsis best supported by conditions of high carbohydrate(CHO) availability (Thomas et al. 2016), defined asmatching the finite body CHO stores to event-specificmuscle and central nervous system fuel needs (Burke et al.2018a). High CHO availability (HCHO) can be achievedvia targeted dietary CHO intake over the 24–36 h priorto the race to normalise or super-compensate muscleglycogen concentrations (Burke et al. 2011), supplementedby a pre-race CHO-rich meal to restore liver glycogencontent and provide ongoing release of glucose fromthe gut within the race (Coyle, 1991). In events lastinglonger than 90 min, the provision of additional CHOsubstrate from foods/fluids consumed during exercisebecomes more important (Stellingwerff & Cox, 2014).Contemporary views around everyday nutritional supportfor the high-volume endurance training necessary to pre-pare for such events also promote HCHO availability,at least for key workouts in which high-intensity/qualityperformance or race simulation is desired (Burke et al.2011, 2018a). Yet, competitive endurance athletes do notalways achieve these goals, for reasons that are eitheraccidental or intentional (Heikura et al. 2018).
A deliberate contrast to these guidelines is the revivedinterest in adaptation to low CHO, high fat (LCHF)diets, due to observations that athletes can achieve sub-stantial increases to their already enhanced capacity foroxidising fat during exercise, including an increase inthe exercise intensity at which maximal rates of fatoxidation occur (for review, see Burke, 2021). The specificmulti-system physiological responses to keto adaptation
are contentious, as are the timelines required to achievethem (Lindseth, 2017; Burke et al. 2020). However, inthe context of exercise performance, the key adaptationsappear to be increased delivery, uptake and subsequentoxidation of free fatty acids (for review see Burke,2021). The current model of interest, involving chronicadherence to a ketogenic version of the diet (<50 gday−1 CHO, 15–20% energy from protein and 75–80%fat) has been enthusiastically proposed via social, lay andpeer-reviewed media to provide universal benefits to theperformance of endurance and ultra-endurance sports(Noakes et al. 2014; Burke, 2015; Volek et al. 2015).However, rigorously controlled studies from our grouphave reported detriments to the real-life performances ofhigh-intensity endurance events in elite athletes following3–4 weeks of a LCHF diet, in comparison to training/racingwith HCHO availability (Burke et al. 2017). Indeed, sub-stantial increases in fat utilisation are associated withan increased oxygen cost of exercise, particularly inhigh-intensity (>70% VO2peak) domains (Burke et al. 2017;Shaw et al. 2019, 2020). Whereas the aerobic reserve canaccommodate this trade-off during moderate intensityexercise, oxygen availability may become a limiting factorfor energy production at higher intensities, contributingto a reduction in performance.
Although the concept of ‘tapping into unlimited fuelstores’ remains an intriguing proposition for gaininga competitive advantage in endurance/ultra-endurancesport, it presupposes that adequate fuel is available forevent demands across the characteristic exercise intensitiesas well as duration. Our continued investigation ofthe ketogenic LCHF diet has focused on better under-standing the mechanisms of adaptation and, potentially,overcoming the inherent limitations of reliance on fat
C© 2020 The Authors. The Journal of Physiology published by John Wiley & Sons Ltd on behalf of The Physiological Society
J Physiol 599.3 Exercise metabolism and performance despite enhanced glycogen availability 773
utilisation at the higher intensities of exercise that arecritical to the success of higher level competitors (Burke,2021). One philosophy which attempts to ‘gain the bestof both worlds’ involves periodising LCHF with HCHOavailability, e.g. acute pre-race restoration of glycogenin keto adapted athletes. We have previously shown inwell-trained athletes that robust increases in fat oxidationoccur in as little as 5–6 days of a non-ketogenic LCHFdiet (Burke et al. 2000; Carey et al. 2001, 2002); however,this has not been established with elite athletes and aketogenic LCHF diet. Indeed, such findings would contra-dict a popularly held view, around which our studies havereceived vocal social media criticism, that ‘keto adaptation’requires several months to achieve (Burke, 2021; Burkeet al. 2020).
Accordingly, we developed a protocol to investigate themetabolic and performance effects of 5–6 days’ exposure toa ketogenic LCHF diet, followed by restoration of muscleglycogen content, in a cohort of elite race walkers in areal-life race. In addition to changing the duration ofketo adaptation compared with our previous studies, wealtered the feeding protocol to preserve energy availabilityby altering daily energy intake according to the trainingenergy expenditure. The study was designed to address thefollowing questions: (1) Can very short-term exposure toan established ketogenic LCHF diet achieve robust andsubstantial changes in capacity for fat oxidation duringexercise at intensities of interest to competitive sport? (2)Can the previously found decrement in race performanceinvolving sustained high-intensity exercise associated withsuch exposure to LCHF be ‘rescued’ by a 24 h period of highCHO availability? And (3) can the changes to metabolismand substrate utilisation during exercise achieved byshort-term adaptation to LCHF be reversed by restorationof HCHO over a similar time frame? We hypothesisedthat substantial changes in substrate utilisation duringexercise would both occur and reverse in 5–6 days, and thatnegative effects on performance due to LCHF-associatedreliance on fat utilisation would be overturned by a1-day protocol known to at least normalise muscleglycogen.
Methods
Ethical approval
This study was registered with the Australian New ZealandClinical Trials Registry (ACTRN12618001974291p). Itconformed to the standards set by the Declaration ofHelsinki and was approved by the Human Research EthicsCommittee of the Australian Institute of Sport (no.20181203). Comprehensive details of the study protocolwere explained orally and in writing prior to athletesproviding their written informed consent.
Overview of study design
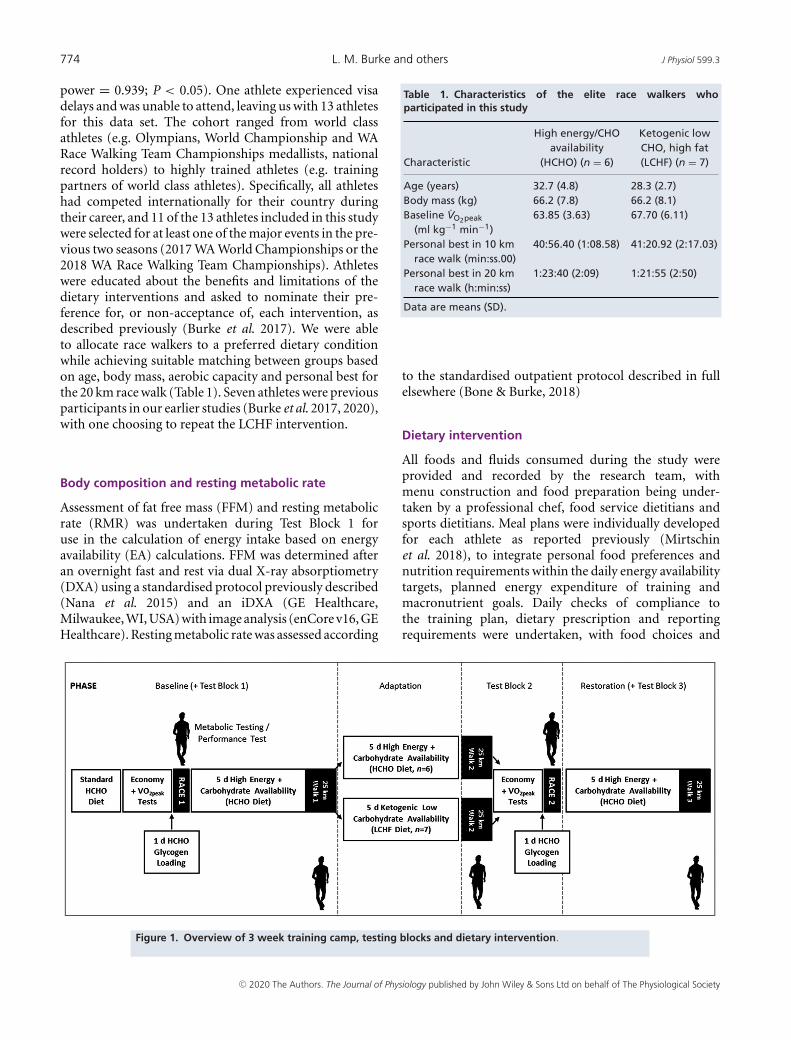
This parallel-groups designed study was conducted withina training camp that represented baseline preparation forthe 2019 World Athletics (WA; formerly InternationalAssociation of Athletics Federations) race-walking season.The study took place at the Australian Institute ofSport (AIS) with athletes living in athlete residences andbeing supervised at all meals and training sessions. Thestudy consisted of a 4-week structured training blockdivided into three phases (see Fig. 1). Briefly, uponarriving at the training camp, athletes undertook tests(Test Block 1, Baseline) to identify baseline characteristicsaround aerobic capacity (VO2peak and exercise economytests), performance (WA sanctioned 10,000 m race walkevent, Race 1). This period involved a standardised dietof high energy and CHO availability during the firsttesting protocols, followed by a further 5-day period withindividualised achievement of the same high energy/CHOavailability (HCHO, see below) to support structuredtraining and prepare for the Baseline 25 km test. Afterthe completion of this test, athletes were divided intotwo groups to commence a 5-day dietary intervention(Adaptation) before repeating all testing elements. TestBlock 2 (Adaptation) included a second 25 km walktest and economy/VO2peak tests while following the inter-vention diets (HCHO or ketogenic LCHF) before movingto the same standardised 24 h pre-race dietary pre-paration undertaken for Race 1 (HCHO availability) priorto a second performance test (WA sanctioned 10,000 mrace walk event, Race 2). To determine if the effects ofthe dietary interventions could be reversed, all athletescompleted Phase 3, which involved 5 days on the HCHOdiet and a third 25 km walk test (Test Block 3, Restoration).Since the absolute duration of each intervention involved5 days of dietary intake and training, plus the period ofthe testing block (2–3 days) , we have simplified the studyreport to describe the intervention as a 6-day period.
Athletes
Fourteen male race walkers with international raceexperience were recruited for the study to fulfil ourintention, based on resources and experience from pre-vious studies of sufficient power to detect differencesin metabolic variables when rigorous control of similarstudy intervention and testing protocols was implemented(Burke et al. 2017). Specific sample size estimation wascalculated for performance measures using G Powersoftware (Version 3.1, Bonn University, Bonn, Germany)based on our previous research in which the impact ofLCHF on a 10,000 m race performance was investigatedin a single camp (Burke et al. 2020). Based on suchdata, a sample size of seven athletes per group wasconsidered appropriate (n = 7, critical t = 2.179; expected
C© 2020 The Authors. The Journal of Physiology published by John Wiley & Sons Ltd on behalf of The Physiological Society
774 L. M. Burke and others J Physiol 599.3
power = 0.939; P < 0.05). One athlete experienced visadelays and was unable to attend, leaving us with 13 athletesfor this data set. The cohort ranged from world classathletes (e.g. Olympians, World Championship and WARace Walking Team Championships medallists, nationalrecord holders) to highly trained athletes (e.g. trainingpartners of world class athletes). Specifically, all athleteshad competed internationally for their country duringtheir career, and 11 of the 13 athletes included in this studywere selected for at least one of the major events in the pre-vious two seasons (2017 WA World Championships or the2018 WA Race Walking Team Championships). Athleteswere educated about the benefits and limitations of thedietary interventions and asked to nominate their pre-ference for, or non-acceptance of, each intervention, asdescribed previously (Burke et al. 2017). We were ableto allocate race walkers to a preferred dietary conditionwhile achieving suitable matching between groups basedon age, body mass, aerobic capacity and personal best forthe 20 km race walk (Table 1). Seven athletes were previousparticipants in our earlier studies (Burke et al. 2017, 2020),with one choosing to repeat the LCHF intervention.
Body composition and resting metabolic rate
Assessment of fat free mass (FFM) and resting metabolicrate (RMR) was undertaken during Test Block 1 foruse in the calculation of energy intake based on energyavailability (EA) calculations. FFM was determined afteran overnight fast and rest via dual X-ray absorptiometry(DXA) using a standardised protocol previously described(Nana et al. 2015) and an iDXA (GE Healthcare,Milwaukee, WI, USA) with image analysis (enCore v16, GEHealthcare). Resting metabolic rate was assessed according
Table 1. Characteristics of the elite race walkers whoparticipated in this study
Characteristic
High energy/CHOavailability
(HCHO) (n = 6)
Ketogenic lowCHO, high fat(LCHF) (n = 7)
Age (years) 32.7 (4.8) 28.3 (2.7)Body mass (kg) 66.2 (7.8) 66.2 (8.1)Baseline VO2peak
(ml kg−1 min−1)63.85 (3.63) 67.70 (6.11)
Personal best in 10 kmrace walk (min:ss.00)
40:56.40 (1:08.58) 41:20.92 (2:17.03)
Personal best in 20 kmrace walk (h:min:ss)
1:23:40 (2:09) 1:21:55 (2:50)
Data are means (SD).
to the standardised outpatient protocol described in fullelsewhere (Bone & Burke, 2018)
Dietary intervention
All foods and fluids consumed during the study wereprovided and recorded by the research team, withmenu construction and food preparation being under-taken by a professional chef, food service dietitians andsports dietitians. Meal plans were individually developedfor each athlete as reported previously (Mirtschinet al. 2018), to integrate personal food preferences andnutrition requirements within the daily energy availabilitytargets, planned energy expenditure of training andmacronutrient goals. Daily checks of compliance tothe training plan, dietary prescription and reportingrequirements were undertaken, with food choices and
Figure 1. Overview of 3 week training camp, testing blocks and dietary intervention.
C© 2020 The Authors. The Journal of Physiology published by John Wiley & Sons Ltd on behalf of The Physiological Society
J Physiol 599.3 Exercise metabolism and performance despite enhanced glycogen availability 775
portion sizes being adjusted at meals eaten in the laterpart of the day if actual training deviated from the plan.
Since a similar workload (training/testing protocols)was undertaken by each athlete in preparation for thefirst part of Test Block 1, we provided a standardised dietintended to provide high energy/CHO availability, basedon our previous studies (Burke et al. 2017), of 56 kcal(225 kJ) kg−1 body mass (BM) and 8.5 g CHO kg−1 BMday−1 over this short time period. Once estimations ofFFM and RMR were completed, provision of daily energyintake was then undertaken according to EA estimations.Our goal was to provide diets with EA of �40 kcal(168 kJ) kg−1 FFM day−1 where EA was defined andimplemented according to the original principle of Loucks(2004) as:
Energy intake – (Energy cost of exercise; equal to netincrease in energy expenditure above sedentary rates overthe period of exercise)/FFM (kg)
This involved variation for each individual and each dayaccording to the specific training load, including real-timeadjustments due to differences between planned and actualactivities. The dietary treatments investigated in the pre-sent study are summarised below:
High-energy, high-CHO availability (HCHO). Theprinciple of this diet was to provide optimal CHOavailability for all training sessions (Burke et al. 2018a),with an adjustment from protocols in previous studies(Burke et al. 2017) of manipulating energy and CHOintake according to the fuel cost of training. Dailyvariability in energy intake from the baseline diet of56 kcal (225 kJ) kg−1 BM and �8.5 g kg−1 BM CHOwas calculated according to the EA equation, andachieved by manipulating CHO, protein and fat intakein a standardised ratio (65% CHO, 15% protein, 20%fat). CHO intake was spread across all meals, as wellas snacks intended for consumption pre-, during- andpost-training. Protein intake was targeted at 2–2.2 g kg−1
day−1.
Ketogenic low-carbohydrate, high-fat diet (LCHF). Thisdiet was matched to the (high) EA of HCHO(�40 kcal kg−1 FFM day−1), with very restricted CHOintake (0.5 g kg−1 day−1 or <50 g day−1), matchedprotein intake (�2–2.2 g kg−1 day−1) and the remaining(75–80%) energy as fat. This is similar to the LCHFdiets implemented in our previous studies (Burke et al.2017; Mirtschin et al. 2018) and was based on thedietary philosophies and meal plans of current LCHFthought-leaders (Volek & Phinney 2012). The stricterachievement of individual and daily EA goals was relianton adjustment of fat intake since both CHO and proteintargets were fixed.
Test meal. Each of the test protocols (incremental testingof economy and VO2peak, the 10,000 m race, and thestandardised 25 km race walking session) was preceded bya standardised test meal that varied only according to theintervention. The same CHO-rich meal providing 2 g kg−1
CHO was consumed 2 h prior to the commencement ofeach of the test protocols in the Baseline and Restorationtrials, and during the Adaptation Test Block in the case ofthe HCHO group. Meanwhile, the LCHF group receivedan energy-matched meal that was high-fat and low-CHOon these occasions.
Incremental testing (economy and VO2peak)
During Test Blocks 1 and 2 (Baseline and Adaptation),athletes completed an incremental exercise test toexhaustion on a custom-built motorised treadmill(Australian Institute of Sport, Bruce, Australia) todetermine exercise economy and VO2peak while racewalking, as previously reported (Burke et al. 2017). Briefly,walking economy was assessed during four submaximalstages, each lasting 4 min and increasing in speed by 1 kmh−1 each stage. Starting speeds were selected at either 11or 12 km h−1 based on each individual’s capacity; 20 kmpersonal best times were compared with the 2019 WAWorld Championship qualifying standard of 1 h 22 min30 s, with athletes faster than this mark commencing at12 km h−1 and increasing to 15 km h−1 at the final stage.The speeds of the second and fourth stage correspondedapproximately to each individual athlete’s walking pace forthe 50 and 20 km race walk event, respectively. This testcommenced 2 h following the intake of the standardisedtest meal as outlined above.
Each stage was followed by 1 min rest for thecollection of capillary (fingertip) blood samples to assessblood lactate (Lactate Pro 2, Akray, Japan), ketonebodies (β-hydroxybutyrate (βHB); FreeStyle Optium Neo,Abbott Diabetes Care, Doncaster, Victoria, Australia) andglucose (FreeStyle Optium Neo) concentrations, as wellas ratings of perceived exertion (RPE, 6–20 Borg Scale).Heart rate (HR) was measured continuously throughoutthe test (Polar Heart Rate Monitor, Polar Electro, Kempele,Finland). Expired gas was collected and analysed using acustom-built indirect calorimetry system described pre-viously (Saunders et al. 2010), with the final 60 s of gascollected accepted as steady state and used to calculaterespiratory exchange ratio (RER) and O2 uptake. Aself-selected warm-up of 10 min duration preceded thetest, which was maintained across trials.
Upon completion of the final submaximal walkingstage, athletes rested for 5 min before completing aramp (speed and then gradient) test to volitional fatigue.Treadmill speed was increased by 0.5 km h−1 every 30s until the speed corresponding to the individual’s final
C© 2020 The Authors. The Journal of Physiology published by John Wiley & Sons Ltd on behalf of The Physiological Society
776 L. M. Burke and others J Physiol 599.3
submaximal stage was reached (14 or 15 km h−1), withtreadmill gradient increased by 0.5% every 30 s thereafteruntil exhaustion. Expired gas was collected and analysedthroughout, maximal HR recorded, and capillary bloodsamples collected 1 min after completion.
10,000 m race
During the Baseline and Adaptation Test Blocks, athletescompeted in a 10,000 m race held on a synthetic 400m outdoor athletics track (Canberra, ACT, Australia).To provide an incentive for a maximal effort, prizemoney was awarded to place getters as well as thoseathletes who achieved the highest percentage of their20 km walking personal best when the times of the tworaces were combined. Each race commenced at 09.00h and was conducted under WA rules, which involvedofficiating by technical judges, invitation for participationby competitors external to the study, a feed zone allowingwater intake on the outside lanes of the track in hotconditions, the pit-lane rule for technique infringementsand photo-finish electronic timing. Photo-finish timingwas used to provide official race times. Capillary bloodsamples were collected immediately before the start of therace and as each competitor completed the race.
The goals of the race nutrition plan were tostandardise the individualised competition practices ofeach participant. Therefore, each athlete repeated asimilar training load during the 48 h prior to each race(economy/aerobic capacity test schedule and personaltraining) and consumed the same HCHO diet over the24 h pre-race period, as well as the consuming thesame CHO-rich (2 g kg BM−1) pre-race meal 2 h priorto competition. The use of caffeine as a performancesupplement by some participants was permitted underthe following conditions: it was documented in pre-racediaries, came from a reliable source (e.g. the same sportssupplement) and was repeated in an identical protocolfor both races. Due to the hot environmental conditions,the WA policy to allow a water station in an outside lanewas implemented for both races. The athletes were able tochoose freely to deviate from the inside track and obtainwater or ice for consumption and cooling during the race;all made use of this resource.
Warm-up for the 10,000 m race was undertakenaccording to our previous studies (Burke et al. 2017),whereby each athlete chose his own protocol, based ontheir real-life experiences, and replicated this for each race.In the case of athletes allocated to the LCHF diet, thewarm-up was commenced in the laboratory to allow theimpact of the 1-day CHO restoration protocol on substrateutilisation and exercise economy during exercise to bemeasured. Between 90 and 45 min pre-race (standardisedfor each athlete across races), these athletes completed
a two-stage incremental exercise test involving a 2 minwarm-up at 10 km h−1 and two 4-min stages (separatedby 1 min at rest) at speeds corresponding to 50 and 20 kmrace walk events (i.e. 12 and 14 or 13 and 15 km h−1
depending on ability). HR was measured continuouslyduring the test, and expired gas was collected and analysed,with the final 60 s of gas collected accepted as steadystate and used to calculate RER and O2 uptake. Capillaryblood samples were collected prior to warm-up, andimmediately after each stage to determine blood lactate,glucose and ketone concentration. Following completionof the test, athletes transferred to the athletics track(�500 m walk) and completed the remainder of their racepreparations, which were recorded and replicated acrosstrials.
Standardised 25 km long walk
At the end of each of the test blocks, athletes completeda 25 km walk, 2 h after consuming a standardised mealthat met the conditions of their dietary intervention. Thetraining session was conducted as a hybrid laboratory-fieldtest, with 0–1, 6–7, 12–13, 18–19 and 24–25 km beingundertaken on a treadmill in the laboratory and theremainder of the walk completed outdoors on a loopcourse (�5 km) which included two aid stations toallow nutrition support to be received every �2 km asoccurs in WA events. Athletes completed the treadmillportions of the walk at the speed corresponding to thesecond stage of the submaximal walking test (12 or13 km h−1), which approximated their 50 km race pace.Each negotiated an individualised but similar pace target(�12 km h−1) for the outside portion of the walk withthe goal that each athlete would adhere to this pace for allthree of his walks. Expired gas was collected during eachtreadmill segment for assessment of RER to determinerates of substrate oxidation and O2 uptake. Capillary bloodwas collected for measurement of glucose, lactate andketone concentrations immediately prior to beginningthe session, and upon completion of each treadmillsegment, using the protocols previously documented.HR and RPE were assessed at the end of each treadmillsection.
The standardised pre-exercise meal (previouslydescribed) was consumed 2 h prior to the commencementof the session. During the walk, handlers providedfluids and sports food choices that had previously beendiscussed with each participant to mimic race feedingpractices. Athletes were offered sports gels and waterto achieve an hourly intake of �600 ml of fluid and�60 g CHO in the Baseline and Restoration (bothgroups) and Adaptation (HCHO group). Meanwhile, inthe LCHF Adaptation trial, athletes received non-caloricfluid (electrolyte-supplemented water) and LCHF cookiesto match the energy intake from their other trial.
C© 2020 The Authors. The Journal of Physiology published by John Wiley & Sons Ltd on behalf of The Physiological Society
J Physiol 599.3 Exercise metabolism and performance despite enhanced glycogen availability 777
Blood sampling and serum free fatty acid analysis
Prior to (fasted and post-prandial pre-exercise, ‘0 km’),during (1 km and 13 km), and immediately post (25 km)the 25 km-long walk, blood was collected via an indwellingforearm cannula into 2.5 ml Vacuette SST tubes (GreinerBio-One, Kremsmunster, Austria), allowed to clot for30 min then centrifuged at 1500 g, 4°C, 10 min. Thecollected serum was frozen and later analysed for freefatty acid (FFA) concentration using a colorimetric assayaccording to the manufacturer’s instructions (NEFA-c kit,Novachem Pty Ltd, Heidelberg West, Victoria, Australia).
Calculation of respiratory exchange ratio andsubstrate oxidation data
Respiratory exchange ratio was calculated fromsteady-state expired gases collected over 1 min periodsduring the economy test and maximal aerobic capacity(VO2peak) protocol. Rates of CHO and fat oxidation (gmin−1) were calculated from VCO2 and VO2 values usingnon-protein RER values (Peronnet & Massicotte, 1991).These equations are based on the premise that VO2 andVCO2 accurately reflect tissue O2 consumption and CO2
production, and that indirect calorimetry is a valid methodfor quantifying rates of substrate oxidation in well-trainedathletes during strenuous exercise of up to�85% of VO2peak
(Romijn et al. 1993). We did not correct our calculationsfor the contribution of ketone oxidation to substrate usein order to contextualise our findings with previous workperformed by our group (Stellingwerff et al. 2006; Burkeet al. 2017) as well as other reports of substrate utilisation inultra-endurance athletes who chronically consume LCHFdiets (Volek et al. 2016; Webster et al. 2016). However, weacknowledge that there may be a small (but systematic)error in the use of conventional equations to calculatefat and CHO oxidation from gas exchange information(Frayn, 1983).
Training
During each of the harmonisation and intervention peri-ods, athletes were required to complete a 25–40 km-longwalk, interval training session (8–12 × 1 km on a 6 mincycle completed on a standard 400 m athletics track)and tempo hill session (14 km with �450 m elevationgain). The remaining training consisted of low intensitywalking sessions (6–12 km each), and a strength trainingsession. The daily energy cost of training (exercise energyexpenditure; EEE), which represented the additionalenergy cost attributed to exercise during a training/testsession period rather than the total energy expenditureduring the period (Burke et al. 2018b), was calculated
by subtracting resting metabolic rate from session energyexpenditure.
Statistical analyses
Results are expressed as means (SD). Data from dietaryintake, economy tests, long walks and race performances(Figs 2–6, Tables 2–3) were analysed using a two-wayanalysis of variance (ANOVA) within dietary groups. Ifsignificance was detected, a Bonferroni post hoc test wasapplied. Student’s t test was used to analyse differencesbetween subject groups (Table 1), and performances inBaseline and Adaptation races (Fig. 7). Significance was setat P < 0.05 (‘NS’ indicates not significant). All statisticalanalyses were performed, and graphs were produced usingGraphPad Prism (version 8.3.1, GraphPad Software Inc.,
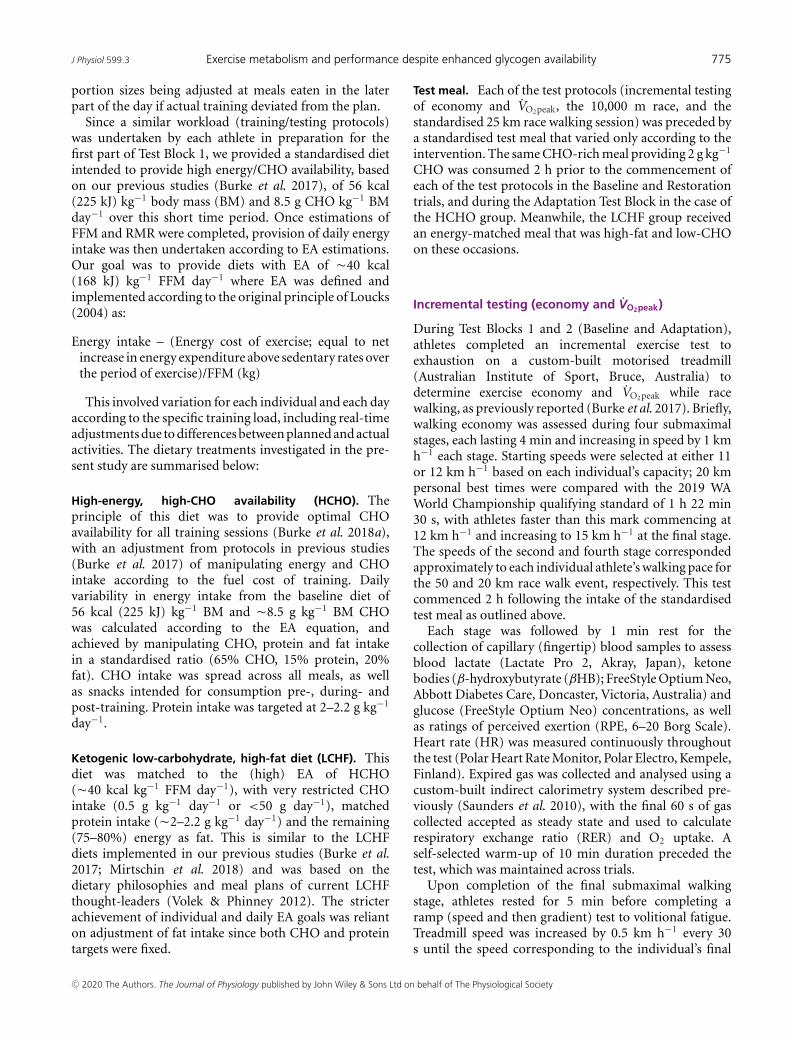
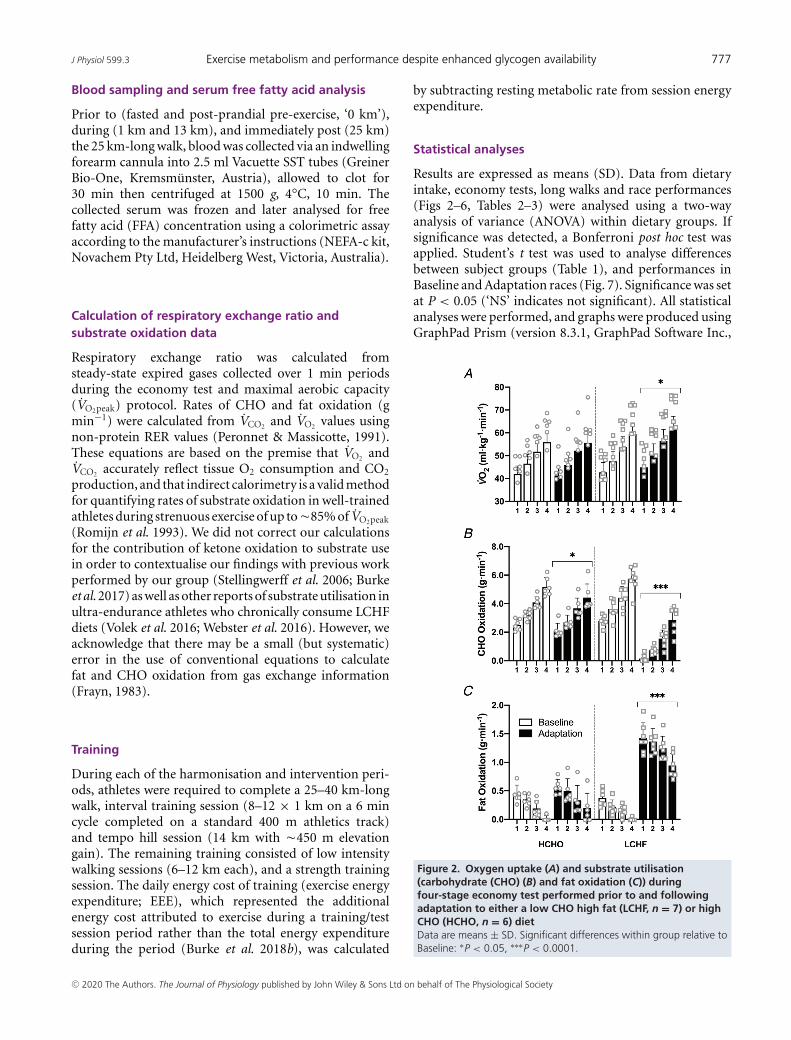
Figure 2. Oxygen uptake (A) and substrate utilisation(carbohydrate (CHO) (B) and fat oxidation (C)) duringfour-stage economy test performed prior to and followingadaptation to either a low CHO high fat (LCHF, n = 7) or highCHO (HCHO, n = 6) dietData are means ± SD. Significant differences within group relative toBaseline: ∗P < 0.05, ∗∗∗P < 0.0001.
C© 2020 The Authors. The Journal of Physiology published by John Wiley & Sons Ltd on behalf of The Physiological Society
778 L. M. Burke and others J Physiol 599.3
La Jolla, CA, USA). All data collected in this study are pre-sented in the figures and tables; raw data are available onrequest to the corresponding author.
Results
Diet and training compliance
All athletes demonstrated compliance to their assigneddietary treatment and the monitoring of their food intakeand training sessions. Table 2 summarises the results ofthe assessment of actual dietary intake, with the summaryof mean daily intakes allowing the display of overalldifferences between diets. Assessments of exercise energyexpenditure (EEE) showed a daily mean of �1600 kcal(6720 kJ) for HCHO group across all phases. Over-
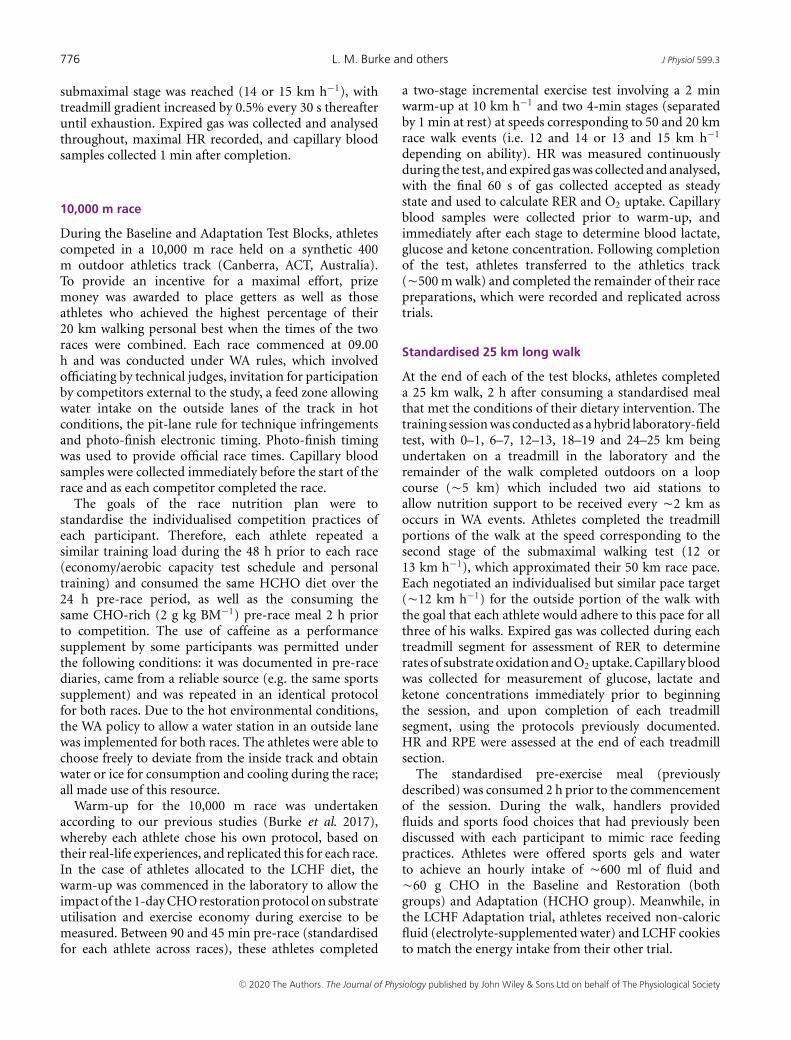
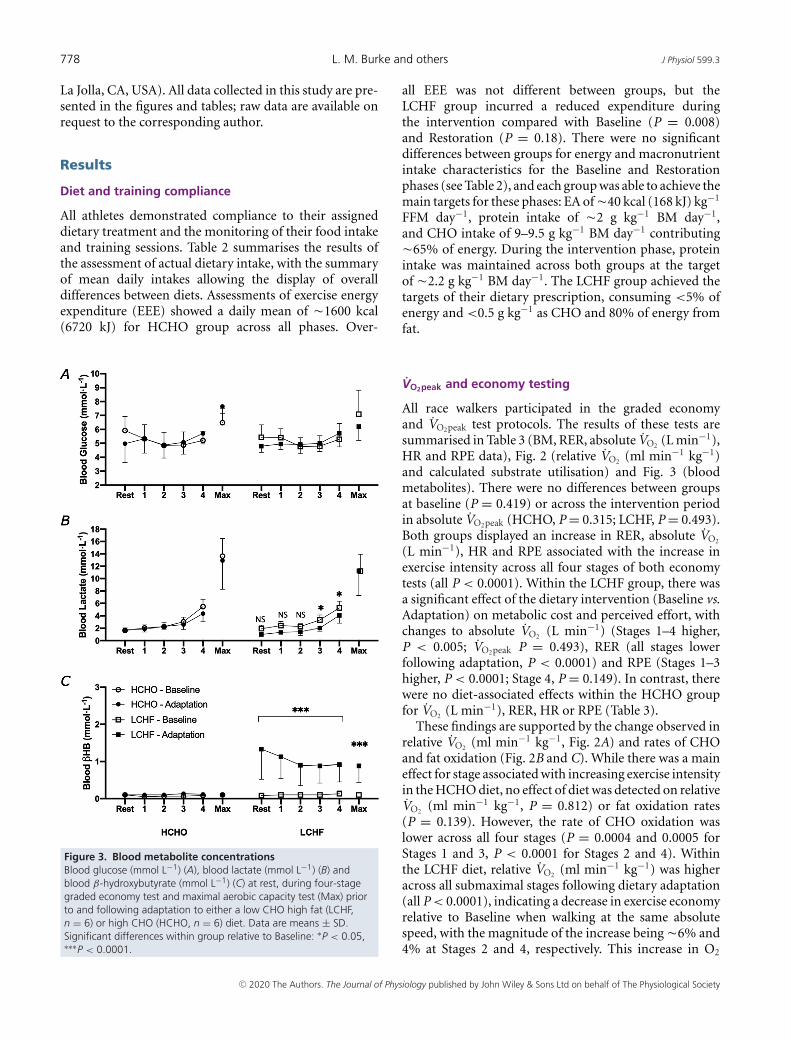
Figure 3. Blood metabolite concentrationsBlood glucose (mmol L−1) (A), blood lactate (mmol L−1) (B) andblood β-hydroxybutyrate (mmol L−1) (C) at rest, during four-stagegraded economy test and maximal aerobic capacity test (Max) priorto and following adaptation to either a low CHO high fat (LCHF,n = 6) or high CHO (HCHO, n = 6) diet. Data are means ± SD.Significant differences within group relative to Baseline: ∗P < 0.05,∗∗∗P < 0.0001.
all EEE was not different between groups, but theLCHF group incurred a reduced expenditure duringthe intervention compared with Baseline (P = 0.008)and Restoration (P = 0.18). There were no significantdifferences between groups for energy and macronutrientintake characteristics for the Baseline and Restorationphases (see Table 2), and each group was able to achieve themain targets for these phases: EA of �40 kcal (168 kJ) kg−1
FFM day−1, protein intake of �2 g kg−1 BM day−1,and CHO intake of 9–9.5 g kg−1 BM day−1 contributing�65% of energy. During the intervention phase, proteinintake was maintained across both groups at the targetof �2.2 g kg−1 BM day−1. The LCHF group achieved thetargets of their dietary prescription, consuming <5% ofenergy and <0.5 g kg−1 as CHO and 80% of energy fromfat.
VO2peak and economy testing
All race walkers participated in the graded economyand VO2peak test protocols. The results of these tests aresummarised in Table 3 (BM, RER, absolute VO2 (L min−1),HR and RPE data), Fig. 2 (relative VO2 (ml min−1 kg−1)and calculated substrate utilisation) and Fig. 3 (bloodmetabolites). There were no differences between groupsat baseline (P = 0.419) or across the intervention periodin absolute VO2peak (HCHO, P = 0.315; LCHF, P = 0.493).Both groups displayed an increase in RER, absolute VO2
(L min−1), HR and RPE associated with the increase inexercise intensity across all four stages of both economytests (all P < 0.0001). Within the LCHF group, there wasa significant effect of the dietary intervention (Baseline vs.Adaptation) on metabolic cost and perceived effort, withchanges to absolute VO2 (L min−1) (Stages 1–4 higher,P < 0.005; VO2peak P = 0.493), RER (all stages lowerfollowing adaptation, P < 0.0001) and RPE (Stages 1–3higher, P < 0.0001; Stage 4, P = 0.149). In contrast, therewere no diet-associated effects within the HCHO groupfor VO2 (L min−1), RER, HR or RPE (Table 3).
These findings are supported by the change observed inrelative VO2 (ml min−1 kg−1, Fig. 2A) and rates of CHOand fat oxidation (Fig. 2B and C). While there was a maineffect for stage associated with increasing exercise intensityin the HCHO diet, no effect of diet was detected on relativeVO2 (ml min−1 kg−1, P = 0.812) or fat oxidation rates(P = 0.139). However, the rate of CHO oxidation waslower across all four stages (P = 0.0004 and 0.0005 forStages 1 and 3, P < 0.0001 for Stages 2 and 4). Withinthe LCHF diet, relative VO2 (ml min−1 kg−1) was higheracross all submaximal stages following dietary adaptation(all P < 0.0001), indicating a decrease in exercise economyrelative to Baseline when walking at the same absolutespeed, with the magnitude of the increase being �6% and4% at Stages 2 and 4, respectively. This increase in O2
C© 2020 The Authors. The Journal of Physiology published by John Wiley & Sons Ltd on behalf of The Physiological Society
J Physiol 599.3 Exercise metabolism and performance despite enhanced glycogen availability 779
consumption was associated with the increased relianceon fat as a metabolic substrate, as fat oxidation ratesincreased across all four stages (P < 0.0001), peaking at1.43 g min−1 in the first stage (11–12 km h−1), while CHOoxidation displayed a reciprocal decrease across all stages(P < 0.0001).
Figure 3 summarises circulating concentrations ofmetabolites (glucose, lactate and ketones) obtained viacapillary blood samples measured during the economytest, representing resting values 2 h following astandardised meal, concentrations at the end of eachstage and at the conclusion of the incremental test.There was a main effect of stage on blood glucoseconcentrations, reflecting exercise intensity, but this wasunaltered by adaptation to diet in either the HCHO(P = 0.694) or LCHF (P = 0.308) group (Fig. 3A). Bloodlactate concentrations increased with exercise intensityacross both dietary treatments (P < 0.0001), with similarpatterns in both pre- and post-treatment trials forthe HCHO group (Fig. 3B). In contrast, blood lactateconcentrations at the two highest intensity stages weresuppressed following Adaptation in the LCHF group(Stage 3, P = 0.030; Stage 4, P = 0.048). Blood ketonelevels in the HCHO group were maintained at lowconcentrations (0.0–0.1 mmol L−1), with no differencesacross the economy test for both pre- and post-treatment.However, the LCHF group displayed significant increasesin blood ketone concentrations following the dietary inter-
vention (P = 0.008), which were highest at rest (1.2(0.79) mmol L−1). Despite declining over the subsequenteconomy stages, ketone concentrations remained elevatedat all stages in comparison to the Baseline (all P < 0.0001).
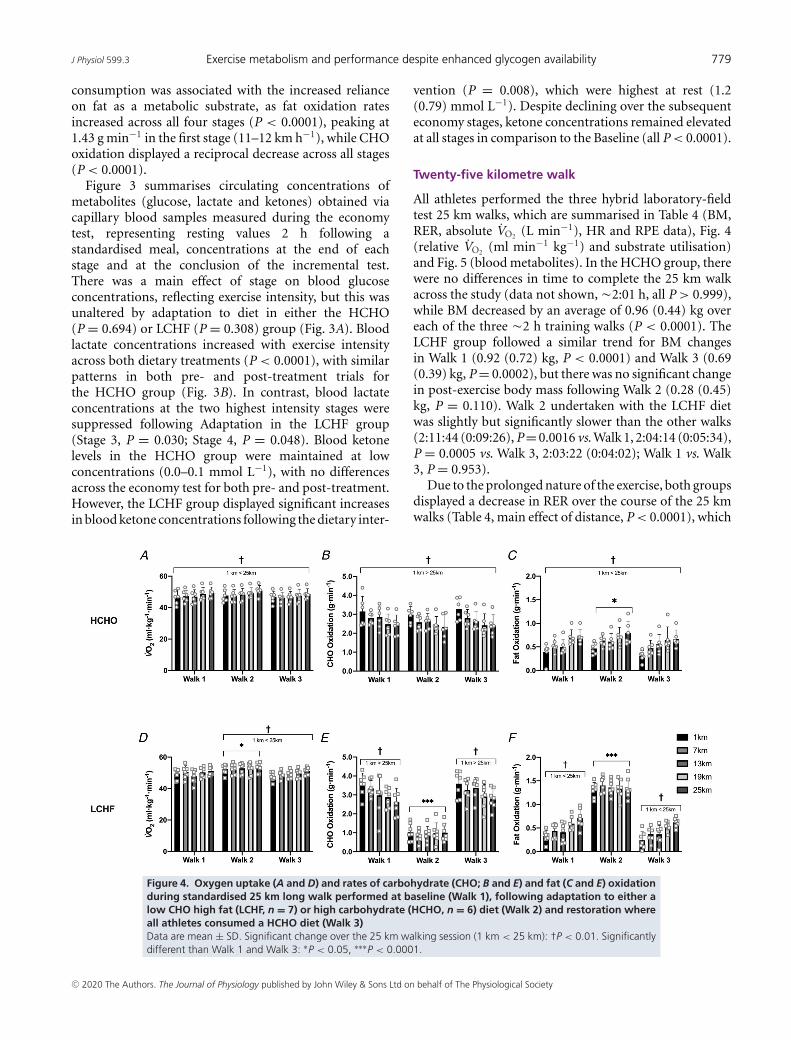
Twenty-five kilometre walk
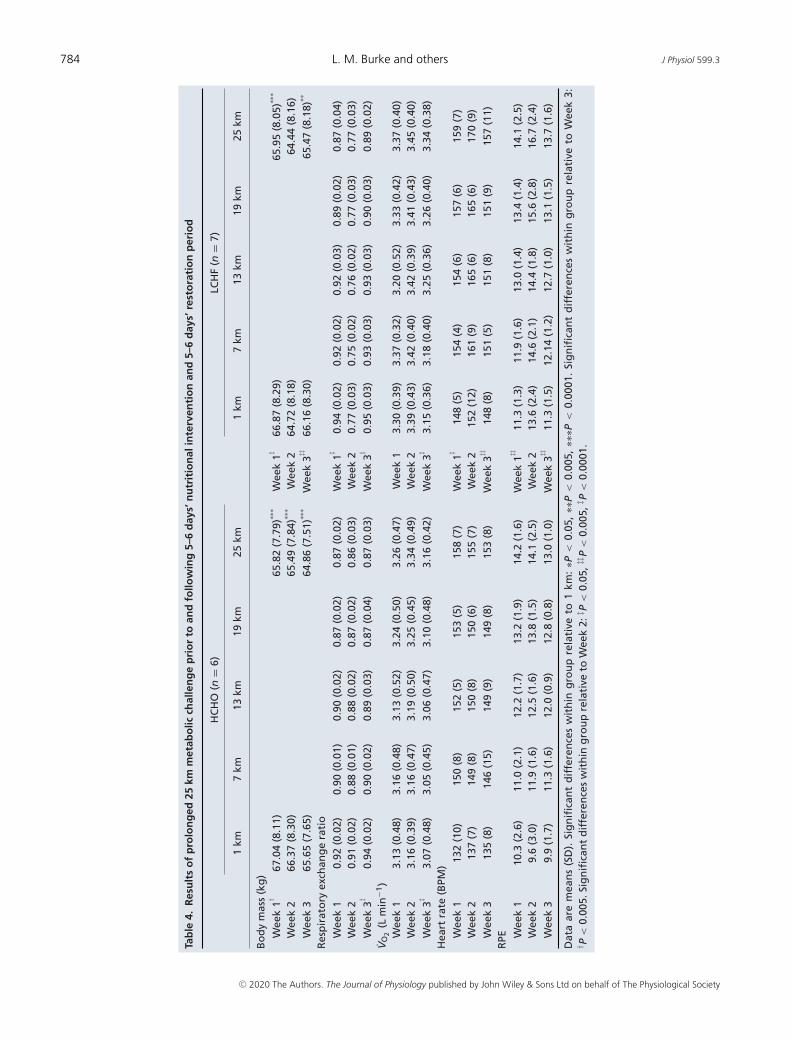
All athletes performed the three hybrid laboratory-fieldtest 25 km walks, which are summarised in Table 4 (BM,RER, absolute VO2 (L min−1), HR and RPE data), Fig. 4(relative VO2 (ml min−1 kg−1) and substrate utilisation)and Fig. 5 (blood metabolites). In the HCHO group, therewere no differences in time to complete the 25 km walkacross the study (data not shown, �2:01 h, all P > 0.999),while BM decreased by an average of 0.96 (0.44) kg overeach of the three �2 h training walks (P < 0.0001). TheLCHF group followed a similar trend for BM changesin Walk 1 (0.92 (0.72) kg, P < 0.0001) and Walk 3 (0.69(0.39) kg, P = 0.0002), but there was no significant changein post-exercise body mass following Walk 2 (0.28 (0.45)kg, P = 0.110). Walk 2 undertaken with the LCHF dietwas slightly but significantly slower than the other walks(2:11:44 (0:09:26), P = 0.0016 vs. Walk 1, 2:04:14 (0:05:34),P = 0.0005 vs. Walk 3, 2:03:22 (0:04:02); Walk 1 vs. Walk3, P = 0.953).
Due to the prolonged nature of the exercise, both groupsdisplayed a decrease in RER over the course of the 25 kmwalks (Table 4, main effect of distance, P < 0.0001), which
Figure 4. Oxygen uptake (A and D) and rates of carbohydrate (CHO; B and E) and fat (C and E) oxidationduring standardised 25 km long walk performed at baseline (Walk 1), following adaptation to either alow CHO high fat (LCHF, n = 7) or high carbohydrate (HCHO, n = 6) diet (Walk 2) and restoration whereall athletes consumed a HCHO diet (Walk 3)Data are mean ± SD. Significant change over the 25 km walking session (1 km < 25 km): †P < 0.01. Significantlydifferent than Walk 1 and Walk 3: ∗P < 0.05, ∗∗∗P < 0.0001.
C© 2020 The Authors. The Journal of Physiology published by John Wiley & Sons Ltd on behalf of The Physiological Society
780 L. M. Burke and others J Physiol 599.3
was associated with a significant increase in both absoluteand relative VO2 (Table 4 and Fig. 4A and D), respectively)and a gradual reduction in CHO (Fig. 4B, P = 0.001;Fig. 4E, P = 0.0001) and increase in fat oxidation (Fig.4C, P < 0.0001; Fig. 4F, P < 0.0001). Within the HCHOgroup, there were no differences between Walks 1–3 in
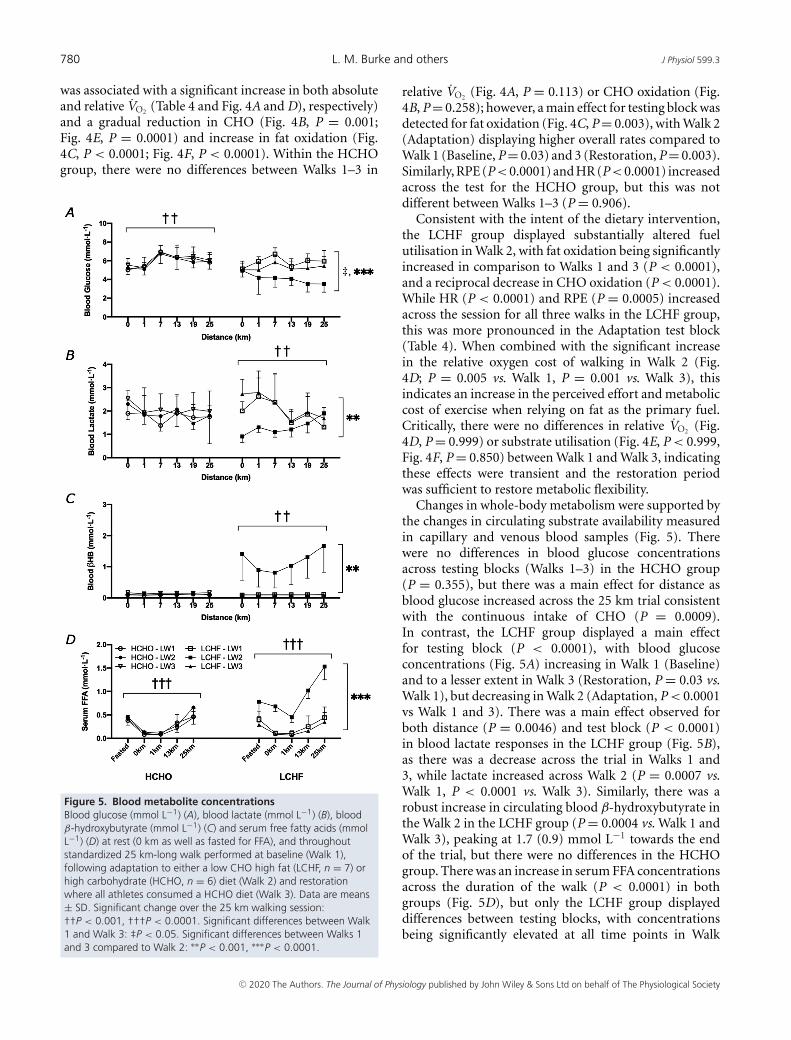
Figure 5. Blood metabolite concentrationsBlood glucose (mmol L−1) (A), blood lactate (mmol L−1) (B), bloodβ-hydroxybutyrate (mmol L−1) (C) and serum free fatty acids (mmolL−1) (D) at rest (0 km as well as fasted for FFA), and throughoutstandardized 25 km-long walk performed at baseline (Walk 1),following adaptation to either a low CHO high fat (LCHF, n = 7) orhigh carbohydrate (HCHO, n = 6) diet (Walk 2) and restorationwhere all athletes consumed a HCHO diet (Walk 3). Data are means± SD. Significant change over the 25 km walking session:††P < 0.001, †††P < 0.0001. Significant differences between Walk1 and Walk 3: ‡P < 0.05. Significant differences between Walks 1and 3 compared to Walk 2: ∗∗P < 0.001, ∗∗∗P < 0.0001.
relative VO2 (Fig. 4A, P = 0.113) or CHO oxidation (Fig.4B, P = 0.258); however, a main effect for testing block wasdetected for fat oxidation (Fig. 4C, P = 0.003), with Walk 2(Adaptation) displaying higher overall rates compared toWalk 1 (Baseline, P = 0.03) and 3 (Restoration, P = 0.003).Similarly, RPE (P<0.0001) and HR (P<0.0001) increasedacross the test for the HCHO group, but this was notdifferent between Walks 1–3 (P = 0.906).
Consistent with the intent of the dietary intervention,the LCHF group displayed substantially altered fuelutilisation in Walk 2, with fat oxidation being significantlyincreased in comparison to Walks 1 and 3 (P < 0.0001),and a reciprocal decrease in CHO oxidation (P < 0.0001).While HR (P < 0.0001) and RPE (P = 0.0005) increasedacross the session for all three walks in the LCHF group,this was more pronounced in the Adaptation test block(Table 4). When combined with the significant increasein the relative oxygen cost of walking in Walk 2 (Fig.4D; P = 0.005 vs. Walk 1, P = 0.001 vs. Walk 3), thisindicates an increase in the perceived effort and metaboliccost of exercise when relying on fat as the primary fuel.Critically, there were no differences in relative VO2 (Fig.4D, P = 0.999) or substrate utilisation (Fig. 4E, P < 0.999,Fig. 4F, P = 0.850) between Walk 1 and Walk 3, indicatingthese effects were transient and the restoration periodwas sufficient to restore metabolic flexibility.
Changes in whole-body metabolism were supported bythe changes in circulating substrate availability measuredin capillary and venous blood samples (Fig. 5). Therewere no differences in blood glucose concentrationsacross testing blocks (Walks 1–3) in the HCHO group(P = 0.355), but there was a main effect for distance asblood glucose increased across the 25 km trial consistentwith the continuous intake of CHO (P = 0.0009).In contrast, the LCHF group displayed a main effectfor testing block (P < 0.0001), with blood glucoseconcentrations (Fig. 5A) increasing in Walk 1 (Baseline)and to a lesser extent in Walk 3 (Restoration, P = 0.03 vs.Walk 1), but decreasing in Walk 2 (Adaptation, P < 0.0001vs Walk 1 and 3). There was a main effect observed forboth distance (P = 0.0046) and test block (P < 0.0001)in blood lactate responses in the LCHF group (Fig. 5B),as there was a decrease across the trial in Walks 1 and3, while lactate increased across Walk 2 (P = 0.0007 vs.Walk 1, P < 0.0001 vs. Walk 3). Similarly, there was arobust increase in circulating blood β-hydroxybutyrate inthe Walk 2 in the LCHF group (P = 0.0004 vs. Walk 1 andWalk 3), peaking at 1.7 (0.9) mmol L−1 towards the endof the trial, but there were no differences in the HCHOgroup. There was an increase in serum FFA concentrationsacross the duration of the walk (P < 0.0001) in bothgroups (Fig. 5D), but only the LCHF group displayeddifferences between testing blocks, with concentrationsbeing significantly elevated at all time points in Walk
C© 2020 The Authors. The Journal of Physiology published by John Wiley & Sons Ltd on behalf of The Physiological Society
J Physiol 599.3 Exercise metabolism and performance despite enhanced glycogen availability 781
2 after the LCHF diet compared to Walks 1 and 3(P < 0.0001).
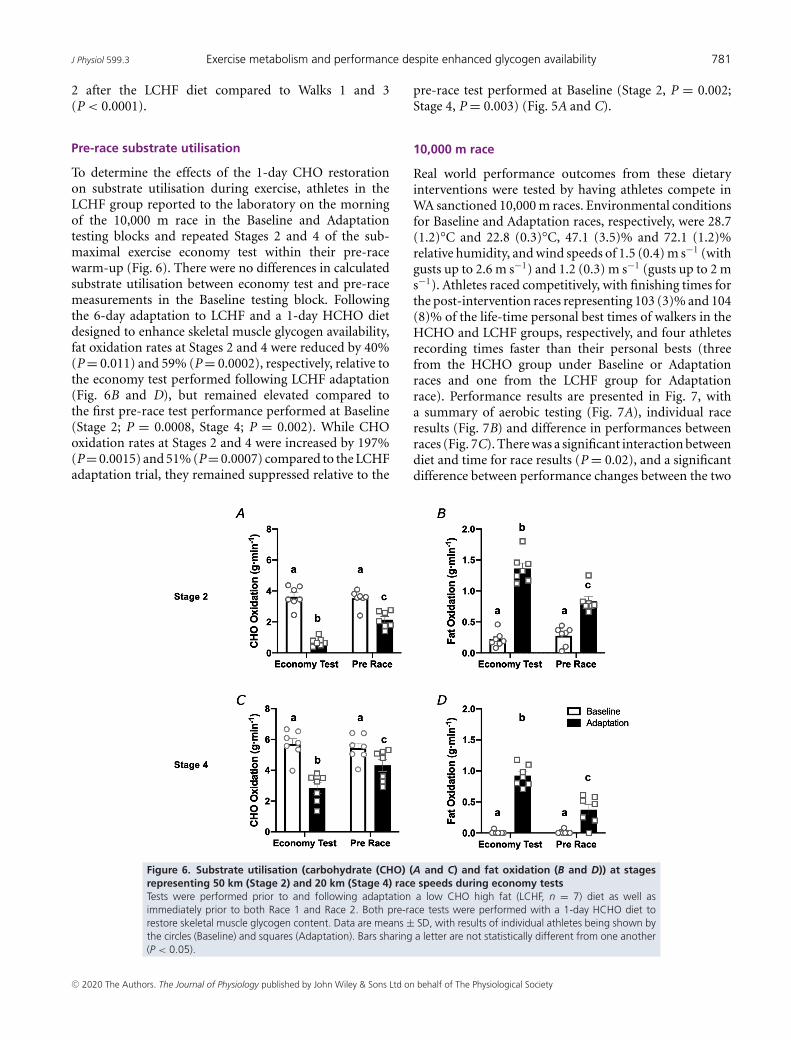
Pre-race substrate utilisation
To determine the effects of the 1-day CHO restorationon substrate utilisation during exercise, athletes in theLCHF group reported to the laboratory on the morningof the 10,000 m race in the Baseline and Adaptationtesting blocks and repeated Stages 2 and 4 of the sub-maximal exercise economy test within their pre-racewarm-up (Fig. 6). There were no differences in calculatedsubstrate utilisation between economy test and pre-racemeasurements in the Baseline testing block. Followingthe 6-day adaptation to LCHF and a 1-day HCHO dietdesigned to enhance skeletal muscle glycogen availability,fat oxidation rates at Stages 2 and 4 were reduced by 40%(P = 0.011) and 59% (P = 0.0002), respectively, relative tothe economy test performed following LCHF adaptation(Fig. 6B and D), but remained elevated compared tothe first pre-race test performance performed at Baseline(Stage 2; P = 0.0008, Stage 4; P = 0.002). While CHOoxidation rates at Stages 2 and 4 were increased by 197%(P = 0.0015) and 51% (P = 0.0007) compared to the LCHFadaptation trial, they remained suppressed relative to the
pre-race test performed at Baseline (Stage 2, P = 0.002;Stage 4, P = 0.003) (Fig. 5A and C).
10,000 m race
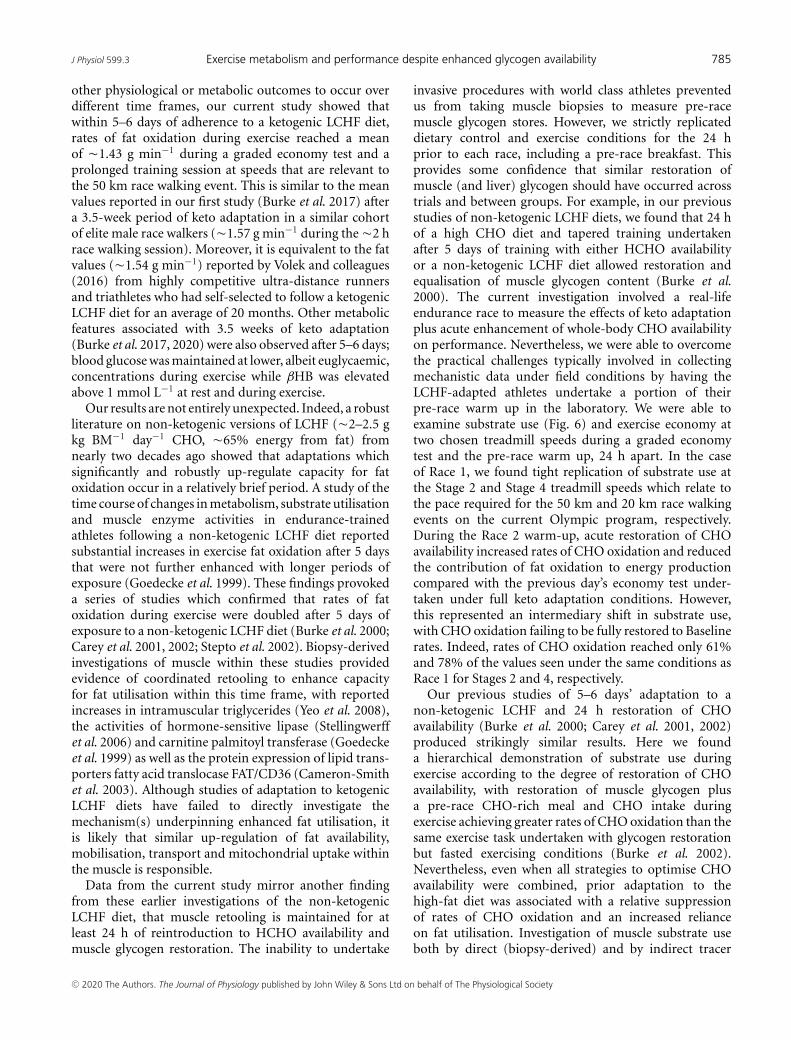
Real world performance outcomes from these dietaryinterventions were tested by having athletes compete inWA sanctioned 10,000 m races. Environmental conditionsfor Baseline and Adaptation races, respectively, were 28.7(1.2)°C and 22.8 (0.3)°C, 47.1 (3.5)% and 72.1 (1.2)%relative humidity, and wind speeds of 1.5 (0.4) m s−1 (withgusts up to 2.6 m s−1) and 1.2 (0.3) m s−1 (gusts up to 2 ms−1). Athletes raced competitively, with finishing times forthe post-intervention races representing 103 (3)% and 104(8)% of the life-time personal best times of walkers in theHCHO and LCHF groups, respectively, and four athletesrecording times faster than their personal bests (threefrom the HCHO group under Baseline or Adaptationraces and one from the LCHF group for Adaptationrace). Performance results are presented in Fig. 7, witha summary of aerobic testing (Fig. 7A), individual raceresults (Fig. 7B) and difference in performances betweenraces (Fig. 7C). There was a significant interaction betweendiet and time for race results (P = 0.02), and a significantdifference between performance changes between the two
Figure 6. Substrate utilisation (carbohydrate (CHO) (A and C) and fat oxidation (B and D)) at stagesrepresenting 50 km (Stage 2) and 20 km (Stage 4) race speeds during economy testsTests were performed prior to and following adaptation a low CHO high fat (LCHF, n = 7) diet as well asimmediately prior to both Race 1 and Race 2. Both pre-race tests were performed with a 1-day HCHO diet torestore skeletal muscle glycogen content. Data are means ± SD, with results of individual athletes being shown bythe circles (Baseline) and squares (Adaptation). Bars sharing a letter are not statistically different from one another(P < 0.05).
C© 2020 The Authors. The Journal of Physiology published by John Wiley & Sons Ltd on behalf of The Physiological Society
782 L. M. Burke and others J Physiol 599.3
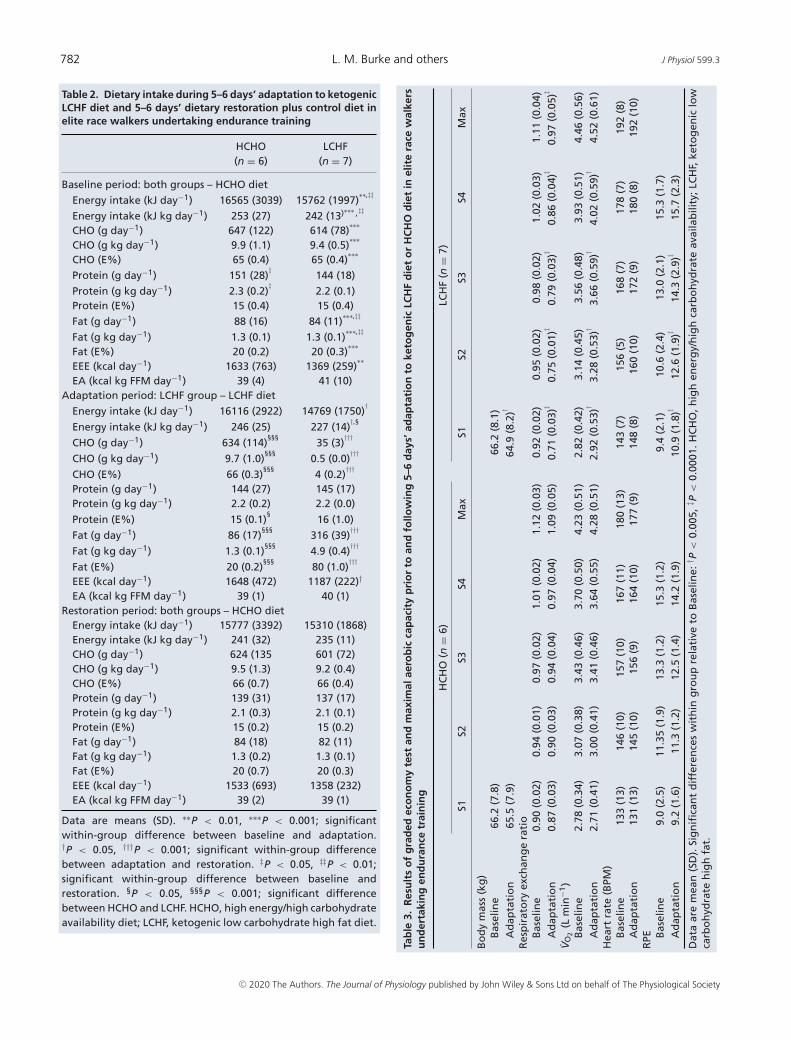
Table 2. Dietary intake during 5–6 days’ adaptation to ketogenicLCHF diet and 5–6 days’ dietary restoration plus control diet inelite race walkers undertaking endurance training
HCHO(n = 6)
LCHF(n = 7)
Baseline period: both groups – HCHO diet
Energy intake (kJ day−1) 16565 (3039) 15762 (1997)∗∗,‡‡
Energy intake (kJ kg day−1) 253 (27) 242 (13)∗∗∗ ,‡‡
CHO (g day−1) 647 (122) 614 (78)∗∗∗
CHO (g kg day−1) 9.9 (1.1) 9.4 (0.5)∗∗∗
CHO (E%) 65 (0.4) 65 (0.4)∗∗∗
Protein (g day−1) 151 (28)‡
144 (18)
Protein (g kg day−1) 2.3 (0.2)‡
2.2 (0.1)Protein (E%) 15 (0.4) 15 (0.4)
Fat (g day−1) 88 (16) 84 (11)∗∗∗,‡‡
Fat (g kg day−1) 1.3 (0.1) 1.3 (0.1)∗∗∗,‡‡
Fat (E%) 20 (0.2) 20 (0.3)∗∗∗
EEE (kcal day−1) 1633 (763) 1369 (259)∗∗
EA (kcal kg FFM day−1) 39 (4) 41 (10)Adaptation period: LCHF group – LCHF diet
Energy intake (kJ day−1) 16116 (2922) 14769 (1750)†
Energy intake (kJ kg day−1) 246 (25) 227 (14)†,§
CHO (g day−1) 634 (114)§§§
35 (3)†††
CHO (g kg day−1) 9.7 (1.0)§§§
0.5 (0.0)†††
CHO (E%) 66 (0.3)§§§
4 (0.2)†††
Protein (g day−1) 144 (27) 145 (17)Protein (g kg day−1) 2.2 (0.2) 2.2 (0.0)
Protein (E%) 15 (0.1)§
16 (1.0)
Fat (g day−1) 86 (17)§§§
316 (39)†††
Fat (g kg day−1) 1.3 (0.1)§§§
4.9 (0.4)†††
Fat (E%) 20 (0.2)§§§
80 (1.0)†††
EEE (kcal day−1) 1648 (472) 1187 (222)†
EA (kcal kg FFM day−1) 39 (1) 40 (1)Restoration period: both groups – HCHO diet
Energy intake (kJ day−1) 15777 (3392) 15310 (1868)Energy intake (kJ kg day−1) 241 (32) 235 (11)CHO (g day−1) 624 (135 601 (72)CHO (g kg day−1) 9.5 (1.3) 9.2 (0.4)CHO (E%) 66 (0.7) 66 (0.4)Protein (g day−1) 139 (31) 137 (17)Protein (g kg day−1) 2.1 (0.3) 2.1 (0.1)Protein (E%) 15 (0.2) 15 (0.2)Fat (g day−1) 84 (18) 82 (11)Fat (g kg day−1) 1.3 (0.2) 1.3 (0.1)Fat (E%) 20 (0.7) 20 (0.3)EEE (kcal day−1) 1533 (693) 1358 (232)EA (kcal kg FFM day−1) 39 (2) 39 (1)
Data are means (SD). ∗∗P < 0.01, ∗∗∗P < 0.001; significantwithin-group difference between baseline and adaptation.†P < 0.05, †††P < 0.001; significant within-group differencebetween adaptation and restoration. ‡P < 0.05, ‡‡P < 0.01;significant within-group difference between baseline andrestoration. §P < 0.05, §§§P < 0.001; significant differencebetween HCHO and LCHF. HCHO, high energy/high carbohydrateavailability diet; LCHF, ketogenic low carbohydrate high fat diet.
Tab
le3.
Res
ult
so
fg
rad
edec
on
om
yte
stan
dm
axim
alae
rob
icca
pac
ity
pri
or
toan
dfo
llow
ing
5–6
day
s’ad
apta
tio
nto
keto
gen
icLC
HF
die
to
rH
CH
Od
iet
inel
ite
race
wal
kers
un
der
taki
ng
end
ura
nce
trai
nin
g
HC
HO
(n=
6)LC
HF
(n=
7)
S1S2
S3S4
Max
S1S2
S3S4
Max
Bo
dy
mas
s(k
g)
Bas
elin
e66
.2(7
.8)
66.2
(8.1
)A
dap
tati
on
65.5
(7.9
)64
.9(8
.2)†
Res
pir
ato
ryex
chan
ge
rati
oB
asel
ine
0.90
(0.0
2)0.
94(0
.01)
0.97
(0.0
2)1.
01(0
.02)
1.12
(0.0
3)0.
92(0
.02)
0.95
(0.0
2)0.
98(0
.02)
1.02
(0.0
3)1.
11(0
.04)
Ad
apta
tio
n0.
87(0
.03)
0.90
(0.0
3)0.
94(0
.04)
0.97
(0.0
4)1.
09(0
.05)
0.71
(0.0
3)‡
0.75
(0.0
1)‡
0.79
(0.0
3)‡
0.86
(0.0
4)‡
0.97
(0.0
5)‡
VO
2(L
min
−1)
Bas
elin
e2.
78(0
.34)
3.07
(0.3
8)3.
43(0
.46)
3.70
(0.5
0)4.
23(0
.51)
2.82
(0.4
2)3.
14(0
.45)
3.56
(0.4
8)3.
93(0
.51)
4.46
(0.5
6)A
dap
tati
on
2.71
(0.4
1)3.
00(0
.41)
3.41
(0.4
6)3.
64(0
.55)
4.28
(0.5
1)2.
92(0
.53)
†3.
28(0
.53)
†3.
66(0
.59)
†4.
02(0
.59)
†4.
52(0
.61)
Hea
rtra
te(B
PM)
Bas
elin
e13
3(1
3)14
6(1
0)15
7(1
0)16
7(1
1)18
0(1
3)14
3(7
)15
6(5
)16
8(7
)17
8(7
)19
2(8
)A
dap
tati
on
131
(13)
145
(10)
156
(9)
164
(10)
177
(9)
148
(8)
160
(10)
172
(9)
180
(8)
192
(10)
RPE B
asel
ine
9.0
(2.5
)11
.35
(1.9
)13
.3(1
.2)
15.3
(1.2
)9.
4(2
.1)
10.6
(2.4
)13
.0(2
.1)
15.3
(1.7
)A
dap
tati
on
9.2
(1.6
)11
.3(1
.2)
12.5
(1.4
)14
.2(1
.9)
10.9
(1.8
)‡12
.6(1
.9)‡
14.3
(2.9
)‡15
.7(2
.3)
Dat
aar
em
ean
(SD
).Si
gn
ifica
nt
dif
fere
nce
sw
ith
ing
rou
pre
lati
veto
Bas
elin
e:† P
<0.
005,
‡ P<
0.00
01.H
CH
O,h
igh
ener
gy/
hig
hca
rbo
hyd
rate
avai
lab
ility
;LC
HF,
keto
gen
iclo
wca
rbo
hyd
rate
hig
hfa
t.
C© 2020 The Authors. The Journal of Physiology published by John Wiley & Sons Ltd on behalf of The Physiological Society
J Physiol 599.3 Exercise metabolism and performance despite enhanced glycogen availability 783
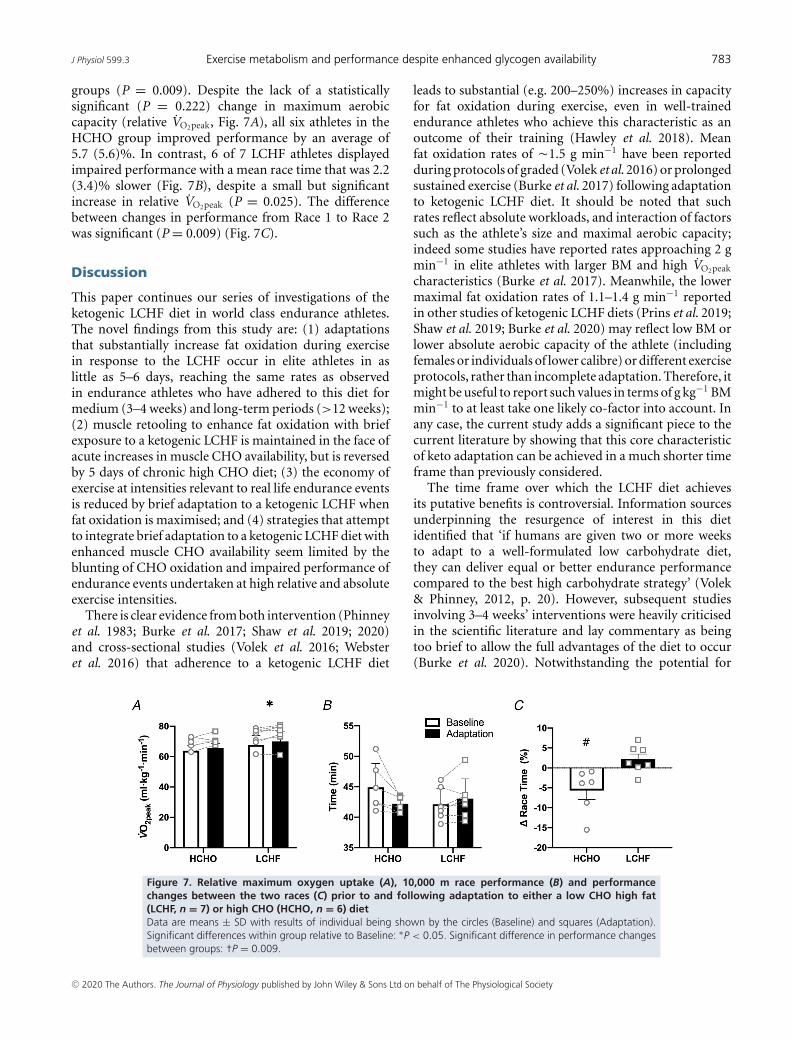
groups (P = 0.009). Despite the lack of a statisticallysignificant (P = 0.222) change in maximum aerobiccapacity (relative VO2peak, Fig. 7A), all six athletes in theHCHO group improved performance by an average of5.7 (5.6)%. In contrast, 6 of 7 LCHF athletes displayedimpaired performance with a mean race time that was 2.2(3.4)% slower (Fig. 7B), despite a small but significantincrease in relative VO2peak (P = 0.025). The differencebetween changes in performance from Race 1 to Race 2was significant (P = 0.009) (Fig. 7C).
Discussion
This paper continues our series of investigations of theketogenic LCHF diet in world class endurance athletes.The novel findings from this study are: (1) adaptationsthat substantially increase fat oxidation during exercisein response to the LCHF occur in elite athletes in aslittle as 5–6 days, reaching the same rates as observedin endurance athletes who have adhered to this diet formedium (3–4 weeks) and long-term periods (>12 weeks);(2) muscle retooling to enhance fat oxidation with briefexposure to a ketogenic LCHF is maintained in the face ofacute increases in muscle CHO availability, but is reversedby 5 days of chronic high CHO diet; (3) the economy ofexercise at intensities relevant to real life endurance eventsis reduced by brief adaptation to a ketogenic LCHF whenfat oxidation is maximised; and (4) strategies that attemptto integrate brief adaptation to a ketogenic LCHF diet withenhanced muscle CHO availability seem limited by theblunting of CHO oxidation and impaired performance ofendurance events undertaken at high relative and absoluteexercise intensities.
There is clear evidence from both intervention (Phinneyet al. 1983; Burke et al. 2017; Shaw et al. 2019; 2020)and cross-sectional studies (Volek et al. 2016; Websteret al. 2016) that adherence to a ketogenic LCHF diet
Figure 7. Relative maximum oxygen uptake (A), 10,000 m race performance (B) and performancechanges between the two races (C) prior to and following adaptation to either a low CHO high fat(LCHF, n = 7) or high CHO (HCHO, n = 6) dietData are means ± SD with results of individual being shown by the circles (Baseline) and squares (Adaptation).Significant differences within group relative to Baseline: ∗P < 0.05. Significant difference in performance changesbetween groups: †P = 0.009.
leads to substantial (e.g. 200–250%) increases in capacityfor fat oxidation during exercise, even in well-trainedendurance athletes who achieve this characteristic as anoutcome of their training (Hawley et al. 2018). Meanfat oxidation rates of �1.5 g min−1 have been reportedduring protocols of graded (Volek et al. 2016) or prolongedsustained exercise (Burke et al. 2017) following adaptationto ketogenic LCHF diet. It should be noted that suchrates reflect absolute workloads, and interaction of factorssuch as the athlete’s size and maximal aerobic capacity;indeed some studies have reported rates approaching 2 gmin−1 in elite athletes with larger BM and high VO2peak
characteristics (Burke et al. 2017). Meanwhile, the lowermaximal fat oxidation rates of 1.1–1.4 g min−1 reportedin other studies of ketogenic LCHF diets (Prins et al. 2019;Shaw et al. 2019; Burke et al. 2020) may reflect low BM orlower absolute aerobic capacity of the athlete (includingfemales or individuals of lower calibre) or different exerciseprotocols, rather than incomplete adaptation. Therefore, itmight be useful to report such values in terms of g kg−1 BMmin−1 to at least take one likely co-factor into account. Inany case, the current study adds a significant piece to thecurrent literature by showing that this core characteristicof keto adaptation can be achieved in a much shorter timeframe than previously considered.
The time frame over which the LCHF diet achievesits putative benefits is controversial. Information sourcesunderpinning the resurgence of interest in this dietidentified that ‘if humans are given two or more weeksto adapt to a well-formulated low carbohydrate diet,they can deliver equal or better endurance performancecompared to the best high carbohydrate strategy’ (Volek& Phinney, 2012, p. 20). However, subsequent studiesinvolving 3–4 weeks’ interventions were heavily criticisedin the scientific literature and lay commentary as beingtoo brief to allow the full advantages of the diet to occur(Burke et al. 2020). Notwithstanding the potential for
C© 2020 The Authors. The Journal of Physiology published by John Wiley & Sons Ltd on behalf of The Physiological Society
784 L. M. Burke and others J Physiol 599.3
Tab
le4.
Res
ult
so
fp
rolo
ng
ed25
kmm
etab
olic
chal
len
ge
pri
or
toan
dfo
llow
ing
5–6
day
s’n
utr
itio
nal
inte
rven
tio
nan
d5–
6d
ays’
rest
ora
tio
np
erio
d
HC
HO
(n=
6)LC
HF
(n=
7)
1km
7km
13km
19km
25km
1km
7km
13km
19km
25km
Bo
dy
mas
s(k
g)
Wee
k1†
67.0
4(8
.11)
65.8
2(7
.79)
∗∗∗
Wee
k1‡
66.8
7(8
.29)
65.9
5(8
.05)
∗∗∗
Wee
k2
66.3
7(8
.30)
65.4
9(7
.84)
∗∗∗
Wee
k2
64.7
2(8
.18)
64.4
4(8
.16)
Wee
k3
65.6
5(7
.65)
64.8
6(7
.51)
∗∗∗
Wee
k3‡‡
66.1
6(8
.30)
65.4
7(8
.18)
∗∗
Res
pir
ato
ryex
chan
ge
rati
o
Wee
k1
0.92
(0.0
2)0.
90(0
.01)
0.90
(0.0
2)0.
87(0
.02)
0.87
(0.0
2)W
eek
1‡0.
94(0
.02)
0.92
(0.0
2)0.
92(0
.03)
0.89
(0.0
2)0.
87(0
.04)
Wee
k2
0.91
(0.0
2)0.
88(0
.01)
0.88
(0.0
2)0.
87(0
.02)
0.86
(0.0
3)W
eek
20.
77(0
.03)
0.75
(0.0
2)0.
76(0
.02)
0.77
(0.0
3)0.
77(0
.03)
Wee
k3‡
0.94
(0.0
2)0.
90(0
.02)
0.89
(0.0
3)0.
87(0
.04)
0.87
(0.0
3)W
eek
3‡0.
95(0
.03)
0.93
(0.0
3)0.
93(0
.03)
0.90
(0.0
3)0.
89(0
.02)
VO
2(L
min
−1)
Wee
k1
3.13
(0.4
8)3.
16(0
.48)
3.13
(0.5
2)3.
24(0
.50)
3.26
(0.4
7)W
eek
13.
30(0
.39)
3.37
(0.3
2)3.
20(0
.52)
3.33
(0.4
2)3.
37(0
.40)
Wee
k2
3.16
(0.3
9)3.
16(0
.47)
3.19
(0.5
0)3.
25(0
.45)
3.34
(0.4
9)W
eek
23.
39(0
.43)
3.42
(0.4
0)3.
42(0
.39)
3.41
(0.4
3)3.
45(0
.40)
Wee
k3‡
3.07
(0.4
8)3.
05(0
.45)
3.06
(0.4
7)3.
10(0
.48)
3.16
(0.4
2)W
eek
3‡3.
15(0
.36)
3.18
(0.4
0)3.
25(0
.36)
3.26
(0.4
0)3.
34(0
.38)
Hea
rtra
te(B
PM)
Wee
k1
132
(10)
150
(8)
152
(5)
153
(5)
158
(7)
Wee
k1‡
148
(5)
154
(4)
154
(6)
157
(6)
159
(7)
Wee
k2
137
(7)
149
(8)
150
(8)
150
(6)
155
(7)
Wee
k2
152
(12)
161
(9)
165
(6)
165
(6)
170
(9)
Wee
k3
135
(8)
146
(15)
149
(9)
149
(8)
153
(8)
Wee
k3‡‡
148
(8)
151
(5)
151
(8)
151
(9)
157
(11)
RPE W
eek
110
.3(2
.6)
11.0
(2.1
)12
.2(1
.7)
13.2
(1.9
)14
.2(1
.6)
Wee
k1‡‡
11.3
(1.3
)11
.9(1
.6)
13.0
(1.4
)13
.4(1
.4)
14.1
(2.5
)W
eek
29.
6(3
.0)
11.9
(1.6
)12
.5(1
.6)
13.8
(1.5
)14
.1(2
.5)
Wee
k2
13.6
(2.4
)14
.6(2
.1)
14.4
(1.8
)15
.6(2
.8)
16.7
(2.4
)
Wee
k3
9.9
(1.7
)11
.3(1
.6)
12.0
(0.9
)12
.8(0
.8)
13.0
(1.0
)W
eek
3‡‡11
.3(1
.5)
12.1
4(1
.2)
12.7
(1.0
)13
.1(1
.5)
13.7
(1.6
)
Dat
aar
em
ean
s(S
D).
Sig
nifi
can
td
iffe
ren
ces
wit
hin
gro
up
rela
tive
to1
km:∗P
<0.
05,∗∗
P<
0.00
5,∗∗
∗P<
0.00
01.
Sig
nifi
can
td
iffe
ren
ces
wit
hin
gro
up
rela
tive
toW
eek
3:† P
<0.
005.
Sig
nifi
can
td
iffe
ren
ces
wit
hin
gro
up
rela
tive
toW
eek
2:‡ P
<0.
05,‡
‡ P<
0.00
5,‡ P
<0.
0001
.
C© 2020 The Authors. The Journal of Physiology published by John Wiley & Sons Ltd on behalf of The Physiological Society
J Physiol 599.3 Exercise metabolism and performance despite enhanced glycogen availability 785
other physiological or metabolic outcomes to occur overdifferent time frames, our current study showed thatwithin 5–6 days of adherence to a ketogenic LCHF diet,rates of fat oxidation during exercise reached a meanof �1.43 g min−1 during a graded economy test and aprolonged training session at speeds that are relevant tothe 50 km race walking event. This is similar to the meanvalues reported in our first study (Burke et al. 2017) aftera 3.5-week period of keto adaptation in a similar cohortof elite male race walkers (�1.57 g min−1 during the �2 hrace walking session). Moreover, it is equivalent to the fatvalues (�1.54 g min−1) reported by Volek and colleagues(2016) from highly competitive ultra-distance runnersand triathletes who had self-selected to follow a ketogenicLCHF diet for an average of 20 months. Other metabolicfeatures associated with 3.5 weeks of keto adaptation(Burke et al. 2017, 2020) were also observed after 5–6 days;blood glucose was maintained at lower, albeit euglycaemic,concentrations during exercise while βHB was elevatedabove 1 mmol L−1 at rest and during exercise.
Our results are not entirely unexpected. Indeed, a robustliterature on non-ketogenic versions of LCHF (�2–2.5 gkg BM−1 day−1 CHO, �65% energy from fat) fromnearly two decades ago showed that adaptations whichsignificantly and robustly up-regulate capacity for fatoxidation occur in a relatively brief period. A study of thetime course of changes in metabolism, substrate utilisationand muscle enzyme activities in endurance-trainedathletes following a non-ketogenic LCHF diet reportedsubstantial increases in exercise fat oxidation after 5 daysthat were not further enhanced with longer periods ofexposure (Goedecke et al. 1999). These findings provokeda series of studies which confirmed that rates of fatoxidation during exercise were doubled after 5 days ofexposure to a non-ketogenic LCHF diet (Burke et al. 2000;Carey et al. 2001, 2002; Stepto et al. 2002). Biopsy-derivedinvestigations of muscle within these studies providedevidence of coordinated retooling to enhance capacityfor fat utilisation within this time frame, with reportedincreases in intramuscular triglycerides (Yeo et al. 2008),the activities of hormone-sensitive lipase (Stellingwerffet al. 2006) and carnitine palmitoyl transferase (Goedeckeet al. 1999) as well as the protein expression of lipid trans-porters fatty acid translocase FAT/CD36 (Cameron-Smithet al. 2003). Although studies of adaptation to ketogenicLCHF diets have failed to directly investigate themechanism(s) underpinning enhanced fat utilisation, itis likely that similar up-regulation of fat availability,mobilisation, transport and mitochondrial uptake withinthe muscle is responsible.
Data from the current study mirror another findingfrom these earlier investigations of the non-ketogenicLCHF diet, that muscle retooling is maintained for atleast 24 h of reintroduction to HCHO availability andmuscle glycogen restoration. The inability to undertake
invasive procedures with world class athletes preventedus from taking muscle biopsies to measure pre-racemuscle glycogen stores. However, we strictly replicateddietary control and exercise conditions for the 24 hprior to each race, including a pre-race breakfast. Thisprovides some confidence that similar restoration ofmuscle (and liver) glycogen should have occurred acrosstrials and between groups. For example, in our previousstudies of non-ketogenic LCHF diets, we found that 24 hof a high CHO diet and tapered training undertakenafter 5 days of training with either HCHO availabilityor a non-ketogenic LCHF diet allowed restoration andequalisation of muscle glycogen content (Burke et al.2000). The current investigation involved a real-lifeendurance race to measure the effects of keto adaptationplus acute enhancement of whole-body CHO availabilityon performance. Nevertheless, we were able to overcomethe practical challenges typically involved in collectingmechanistic data under field conditions by having theLCHF-adapted athletes undertake a portion of theirpre-race warm up in the laboratory. We were able toexamine substrate use (Fig. 6) and exercise economy attwo chosen treadmill speeds during a graded economytest and the pre-race warm up, 24 h apart. In the caseof Race 1, we found tight replication of substrate use atthe Stage 2 and Stage 4 treadmill speeds which relate tothe pace required for the 50 km and 20 km race walkingevents on the current Olympic program, respectively.During the Race 2 warm-up, acute restoration of CHOavailability increased rates of CHO oxidation and reducedthe contribution of fat oxidation to energy productioncompared with the previous day’s economy test under-taken under full keto adaptation conditions. However,this represented an intermediary shift in substrate use,with CHO oxidation failing to be fully restored to Baselinerates. Indeed, rates of CHO oxidation reached only 61%and 78% of the values seen under the same conditions asRace 1 for Stages 2 and 4, respectively.
Our previous studies of 5–6 days’ adaptation to anon-ketogenic LCHF and 24 h restoration of CHOavailability (Burke et al. 2000; Carey et al. 2001, 2002)produced strikingly similar results. Here we founda hierarchical demonstration of substrate use duringexercise according to the degree of restoration of CHOavailability, with restoration of muscle glycogen plusa pre-race CHO-rich meal and CHO intake duringexercise achieving greater rates of CHO oxidation than thesame exercise task undertaken with glycogen restorationbut fasted exercising conditions (Burke et al. 2002).Nevertheless, even when all strategies to optimise CHOavailability were combined, prior adaptation to thehigh-fat diet was associated with a relative suppressionof rates of CHO oxidation and an increased relianceon fat utilisation. Investigation of muscle substrate useboth by direct (biopsy-derived) and by indirect tracer
C© 2020 The Authors. The Journal of Physiology published by John Wiley & Sons Ltd on behalf of The Physiological Society
786 L. M. Burke and others J Physiol 599.3
techniques demonstrate a down-regulation of endogenous(i.e. muscle glycogen) rather than exogenous CHO use(Burke et al. 2000, 2002; Carey et al. 2001). Mechanisms forwhat we had initially considered to be ‘glycogen sparing’but subsequently recognised as ‘glycogen impairment’include a decrease in glycogenolysis and a reduction inthe active form of pyruvate dehydrogenase (Stellingwerffet al. 2006).
Examination of changes in CHO metabolism inketo-adapted athletes is less well developed, although thereis consistent evidence of a reduction in muscle glycogenoxidation (Phinney et al. 1983, Volek et al. 2016, Websteret al. 2016). Phinney and co-workers (1983) reported thatglycogen utilisation was reduced 4-fold, and blood glucoseutilisation, 3-fold, during moderate intensity (62–64%VO2peak) cycling after a 4-week ketogenic LCHF diet.Meanwhile, Webster et al. (2016) reported lower rates ofmuscle glycogen oxidation and hepatic glucose productionat rest and during cycling at �70% VO2peak in keto-adaptedultra-endurance athletes compared to a cohort consuminghigher CHO diets. They hypothesised that this representsreduced liver glycogen breakdown without compensationby an absolute increase in gluconeogenesis. Furthermore,it has recently been shown that athletes who adhereto a ketogenic-LCHF diet for longer periods (i.e. >6months) display impaired glucose tolerance during anoral glucose tolerance test as a result of decreased GLUT4and insulin receptor substrate 1 (IRS1) protein content(Webster et al. 2020). Until future studies investigate tissuemetabolite and enzyme activities underpinning changesin muscle and whole-body CHO metabolism, we can onlyspeculate whether keto adaptation produces differences tothe changes seen in response to a non-ketogenic LCHFdiet. Although our current study does not provide suchinformation, it contributes new knowledge by showingthat gross changes in substrate utilisation and metabolismduring exercise in response to keto adaptation are reversedby 5 days of reintroduction of a HCHO diet. Our analysisof data from the 25 km training sessions shows thatcharacteristics that were perturbed during the Adaptationsession after 5–6 days of adherence to the LCHF diet(e.g. blood metabolites (Fig. 6), rates of CHO and fatoxidation (Fig. 5), heart rates and perception of effort(Table 4), and chosen pace for the ‘outside portion’ ofthe training session all had reverted to Baseline valuesafter 5 days of return to HCHO. This demonstrates thatde-adaptation probably follow a similar time course toadaptation; although our data cannot inform the processesthat occur between 1 and 5 days of each exposure, itseems that robust modifications are in place by this lattertime point. Furthermore, it is likely that the changes inmetabolic cost and perceived effort of exercise are likelyrelated to the immediate patterns of substrate use ratherthan reflecting a legacy of previous well-being and trainingcapacity.
We approached the most important metric in ourstudy, athletic performance, using the authenticity ofreal-life races. The 10,000 m track race was chosen becauseit reduces the variability in environmental and courseconditions encountered in road events; it can be racedat peak level on two occasions over the duration of thestudy; the pace is relevant to the current Olympic racewalking events (i.e. it is similar to 20 km event speeds andrecognises the pace sustained over critical phases towardsthe end of the 50 km event; Huebsch 2017) and because wehave gained robust and reproducible outcomes from ourprevious studies (Burke et al. 2017, 2020). Even thoughthis event is not glycogen limited, its relevance to longerraces is exemplified by the strong correlation between10 km personal best times and marathon performancein specialist distance runners (Noakes et al. 1990). Theperformance changes from Race 1 to Race 2 in the currentstudy were significantly different and manifested as auniform and significant improvement in race times inthe HCHO group and a strong trend to performanceimpairment in the LCHF group, with only one participantrecording a faster race outcome in Race 2 followingthe LCHF adaptation/enhanced CHO availability inter-vention. We acknowledge that different environmentalconditions and the ‘training camp effect’ (Saunders et al.2010) potentially contributed to the performance changesfrom Race 1 to Race 2. However, these should have affectedboth groups equally, and favourably. The �8% differencein performance changes between the HCHO and LCHFgroups was strikingly similar to our previous findings(Burke et al. 2017, 2020), providing additional confidencearound these results.
We have previously attributed at least part of theperformance impairment with the LCHF diet to areduction in exercise economy (increased oxygen costof exercise), noting that a high exercise economy isa hallmark of most elite endurance athletes (Joyneret al. 2020) and a target of a variety of strategies toincrease endurance performance (Santos-Concejero et al.2020). Here, it is underpinned by an understanding ofthe stoichiochemistry of the pathways of CHO and fatoxidation (for review, see Burke, 2021). However, otherlaboratories which have confirmed the loss of economyassociated with adaptation to ketogenic LCHF diets,particularly at exercise intensities >75% VO2peak, havesuggested that it is greater than can be accounted for viathis explanation (Shaw et al. 2019) and other factors maybe in play, including a change in the oral microbiome anddownstream changes in the enterosalivary nitrate–nitricoxide pathway (Murtaza et al. 2019 or uncoupling ofmitochondrial respiration (Leckey et al. 2018).
The results of our study suggest that acute restoration ofmuscle CHO availability is unable to rescue the impairedperformance of endurance exercise undertaken at highrelative and absolute intensities otherwise associated with
C© 2020 The Authors. The Journal of Physiology published by John Wiley & Sons Ltd on behalf of The Physiological Society
J Physiol 599.3 Exercise metabolism and performance despite enhanced glycogen availability 787
the ketogenic LCHF diet (Burke et al. 2017, 2020). Asimilar outcome was reported by Havemann et al. (2006)in relation to short-term exposure to a non-ketogenicLCHF diet followed by strategies to optimise end-ogenous CHO availability during a performance trial(glycogen loading, pre-race CHO-rich meal and CHOintake during a prolonged endurance event). In this study,well-trained subjects completed a 100 km cycling timetrial with a crossover application of the fat-adaptation,glycogen-restoration strategy or a chronic HCHO diet.While overall time trial showed a non-significant trend(3 min 43 s) towards faster time in the HCHO trial,the effects on performance were amplified with higherintensity exercise in the form of sprints integrated withinthe ‘race’. Although there was no significant effect on 4 kmsprints performance at �80% of peak workload (Wpeak),the power output during 1 km sprints at �90% Wpeak wassignificantly reduced with LCHF+HCHO, in associationwith markers suggestive of increased sympathetic driveand muscle recruitment (Havemann et al. 2006). Eventhose subjects who recorded a faster 100 km time showedreduced capacity in the 1 km sprints. The authors theorisedthat an impairment of CHO oxidation secondary to fatadaptation prevented the contribution of this importantpathway to the fuel cost of the high-intensity workloads.
Other strategies to periodise keto adaptation andrestored CHO availability for an enhanced performanceoutcome have been studied (Webster et al. 2018; Burkeet al. 2020) or observed in the practices of elite athletes(Woo & Olonan 2019). In a previous investigation (Burkeet al. 2020), we were unable to find any evidence that peri-odising LCHF using a similar model to altitude training(e.g. 3.5 weeks’ adaptation to LCHF followed by 2.5 weeks’return to taper and race preparation with high CHOavailability) left a legacy of enhanced metabolism andperformance in a 20 km race walking event (�80 minduration). Indeed, based on the results of the currentstudy, the gross effects of the LCHF on exercise fuelutilisation would have been washed out during this period.Meanwhile, a case history (Webster et al. 2018) in which ahighly successful ultra-endurance triathlete reintroducedexogenous CHO availability before or during a seriesof performance tasks reported a 2.8% improvement in20 km cycling TT time, no change in 30 s sprint power,a small improvement in 4 min sprint power (1.6%),and a small reduction in 100 km TT time (1.1%). Theintervention included the reintroduction of exogenousCHO availability (60 g h−1) during eight training sessionsundertaken at higher intensity over a 3-week period aswell as CHO support immediately before or during theperformance tasks. The authors concluded that this was‘likely beneficial & during high-intensity, endurance-typeexercise (4–30 min) but likely did not benefit short-sprintor prolonged endurance performance.’ Exogenous CHOavailability appeared to have a small effect on fat utilisation
during the 100 km TT but increased rates of CHOoxidation (Webster et al. 2018). However, the mechanismof performance benefits observed in the higher intensityexercise could not be distinguished between alterationsin fuel use, the effects of enhanced training support, orcentral nervous system effects of CHO mouth rinsingduring the performance trials (Burke & Maughan, 2015).Indeed, others have noted that exposure of CHO to oralreceptors enhances performance of higher intensity end-urance exercise when endogenous CHO availability is low,with an enhanced central motor drive potentially being themain influencing mechanism (Ataide-Silva et al. 2016). Ofcourse, since this case history did not include strategies toincrease endogenous CHO stores, or to compare outcomeson a fully CHO-supported training and performanceprotocol, it cannot provide information about optimaldietary support for various types of exercise. Together,the available literature suggests that there are advantagesof high CHO availability for higher intensity endurancetasks, but that it is difficult to fully integrate the maximaleffects of keto adaptation and high CHO availability onperformance.
In conclusion, we have shown that in highly trainedendurance athletes, high rates of fat oxidation occur withas little as 5–6 days of adaptation to a ketogenic LCHF dietbut reduce the economy of exercise at intensities relevantto real life endurance events, even when CHO availability isincreased to provide an additional substrate. This adds toprevious studies of periodisation of CHO availability witha non-ketogenic LCHF diet, with novel elements includingthe use of elite athletes, rigorous implementation ofdietary control with standardisation of energy availability,the measurement of performance via a real-life sportingevent, and the focus on higher exercise intensities thatare critical for the success of high performance enduranceathletes. We acknowledge some potential limitations ofthe study design; non-random allocation to treatment toenhance placebo effects, differences between subjects interms of pre-race warm up and supplement use (althoughstandardised within subjects for both races), and thepossibility that the acute effects on race results weremuddied by a chronic effect of the LCHF on trainingoutcomes. Nevertheless, we feel that the majority of thesemethodological limitations were justified due to theirability to strengthen the real-world application of results.Our findings suggest that muscle retooling to increase fatutilisation is maintained in the face of acute increases inmuscle CHO availability, and appears to blunt capacity formuscle CHO oxidation. Muscle adaptations are reversedby reintroduction of the chronic high CHO diet in asimilar time frame. Strategies that attempt to integratebrief adaptation to a ketogenic LCHF diet with enhancedmuscle CHO availability seem limited by the blunting ofCHO oxidation and continue to impair performance ofendurance events undertaken at high relative and absolute
C© 2020 The Authors. The Journal of Physiology published by John Wiley & Sons Ltd on behalf of The Physiological Society
788 L. M. Burke and others J Physiol 599.3
exercise intensities. Further work to periodise or integratethe benefits of keto adaptation and high CHO availabilityis required, but it appears that maximal capacity for eachoxidative pathway may not be simultaneously available.Therefore, endurance athletes who are contemplatingthe use of LCHF should undertake an audit of eventcharacteristics and personal experiences to evaluate theimportance of maximal rates of CHO oxidation to theirgoals: balancing the risk of impaired performance ofhigher intensity exercise with the potential benefits ofhaving extended fuel stores for more moderate intensityexercise in the scenario of an unavoidable depletion ofcarbohydrate stores.
References
Ataide-Silva T, Ghiarone T, Bertuzzi R, Stathis CG, LeandroCG & Lima-Silva AE (2016). CHO mouth rinse amelioratesneuromuscular response with lower endogenous CHOstores. Med Sci Sports Exerc 48, 1810-1820.
Bone JL & Burke LM (2018). No difference in young adultathletes’ resting energy expenditure when measured underinpatient or outpatient conditions. Int J Sport Nutr ExercMetab 28, 464-467.
Burke LM (2015). Re-examining high-fat diets for sportsperformance: did we call the ‘nail in the coffin’ too soon?Sports Med 15(Suppl 1), S33-S49.
Burke LM (2021) Ketogenic low-CHO, high-fat diet: the futureof elite endurance sport? J Physiol 599, 819-843.
Burke LM, Angus DJ, Cox GR, Cummings NK, Febbraio MA,Gawthorn K, Hawley JA, Minehan M, Martin DT &Hargreaves M (2000). Effect of fat adaptation and CHOrestoration on metabolism and performance duringprolonged cycling. J Appl Physiol 89, 2413-2422.
Burke LM, Hawley JA, Angus DJ, Cox GR, Clark SA, CummingsNK, Desbrow B & Hargreaves M (2002). Adaptations toshort-term high-fat diet persist during exercise despite highCHO availability. Med Sci Sports Exerc 34, 83-91.
Burke LM, Hawley JA, Jeukendrup A, Morton JP, StellingwerffT & Maughan RJ (2018a). Toward a common understandingof diet-exercise strategies to manipulate fuel availability fortraining and competition preparation in endurance sport.Int J Sport Nutr Exerc Metab 28, 451-463
Burke LM, Hawley JA, Wong SH & Jeukendrup AE (2011).Carbohydrates for training and competition. J Sports Sci29(Suppl 1), S17-S27.
Burke LM, Lundy B, Fahrenholtz IL & Melin AK (2018b).Pitfalls of conducting and interpreting estimates of energyavailability in free-living athletes. Int J Sport Nutr ExercMetab 28, 350-363
Burke LM & Maughan RJ (2015). The Governor has a sweettooth – mouth sensing of nutrients to enhance sportsperformance. Eur J Sport Sci 15, 29-40.
Burke LM, Ross ML, Garvican-Lewis LA, Welvaert M, HeikuraIA, Forbes SG, Mirtschin JG, Cato LE, Strobel N, Sharma AP& Hawley JA (2017). Low carbohydrate, high fat diet impairsexercise economy and negates the performance benefit fromintensified training in elite race walkers. J Physiol 595,2785-2807.
Burke LM, Sharma AP, Heikura IA, Forbes SF, Holloway M,McKay AKA, Bone JL, Leckey JJ, Welvaert M & Ross ML(2020). Crisis of confidence averted: Impairment of exerciseeconomy and performance in elite race walkers by ketogeniclow carbohydrate, high fat (LCHF) diet is reproducible. PLoSOne 5, e0234027.
Cameron-Smith D, Burke LM, Angus DJ, Tunstall RJ, Cox GR,Bonen A, Hawley JA & Hargreaves M (2003). A short-term,high-fat diet up-regulates lipid metabolism and geneexpression in human skeletal muscle. Am J Clin Nutr 77,313-318.
Carey AL, Staudacher HM, Cummings NK, Stepto NK,Nikolopoulos V, Burke LM & Hawley JA (2001).Effects of fat adaptation and CHO restoration on prolongedendurance exercise. J Appl Physiol 91, 115-122.
Coyle EF (1991). Timing and method of increasedcarbohydrate intake to cope with heavy training,competition and recovery. J Sports Sci 9(Spec No), 29-51.
Frayn KN (1983). Calculation of substrate oxidation rates invivo from gaseous exchange. J Appl Physiol Respir EnvironExerc Physiol 55, 628-634.
Goedecke JH, Christie C, Wilson G, Dennis SC, Noakes TD,Hopkins WG & Lambert EV (1999). Metabolic adaptationsto a high-fat diet in endurance cyclists. Metabolism 48,1509-1517.
Havemann L, West SJ, Goedecke JH, Macdonald IA, St ClairGibson A, Noakes TD & Lambert EV (2006). Fat adaptationfollowed by CHO loading compromises high-intensitysprint performance. J Appl Physiol 100, 194-202.
Hawley JA, Lundby C, Cotter JD & Burke LM (2018).Maximizing cellular adaptations to endurance exercise inskeletal muscle. Cell Metab 27, 962-976.
Heikura IA, Stellingwerff T & Burke LM (2018). Self-reportedperiodization of nutrition in elite female and male runnersand race walkers. Front Physiol 9, 1732.
Huebsch T (2017). The eye opening splits of the 50 km racewalking world champions. Canadian Running, 13 August2017. https://runningmagazine.ca/50k-2017-iaaf-world-championships/.
Loucks AB (2004). Energy balance and body composition insports and exercise. J Sports Sci 22, 1-14
Joyner MJ, Hunter SK, Lucia A & Jones AM (2020). Physiologyand fast marathons. J Appl Physiol 128, 1065-1068.
Leckey JJ, Hoffman NJ, Parr EB, Devlin BL, Trewin AJ, SteptoNK, Morton JP, Burke LM & Hawley JA (2018). High dietaryfat intake increases fat oxidation and reduces skeletal musclemitochondrial respiration in trained humans. FASEB J 32,2979-2991.
Lindseth I (2017). Methodological issues question the validityof observed performance impairment of a low carbohydrate,high fat diet. J Physiol 595, 2989.
Mirtschin JG, Forbes SF, Cato LE, Heikura IA, Strobel N, HallR & Burke LM (2018). Organisation of dietary control fornutrition-training intervention involving periodized carbo-hydrate (CHO) availability and ketogenic low CHO high fat(LCHF) diet. Int J Sport Nutr Exerc Metab 28, 480-489.
Murtaza N, Burke LM, Vlahovich N, Charlesson B, O’NeillHM, Ross ML, Campbell KL, Krause L & Morrison M(2019). Analysis of the effects of dietary pattern on the oralmicrobiome of elite endurance athletes. Nutrients 11, E614.
C© 2020 The Authors. The Journal of Physiology published by John Wiley & Sons Ltd on behalf of The Physiological Society
J Physiol 599.3 Exercise metabolism and performance despite enhanced glycogen availability 789
Nana A, Slater GJ, Stewart AD & Burke LM (2015).Methodology review: using dual-energy X-rayabsorptiometry (DXA) for the assessment of bodycomposition in athletes and active people. Int J Sport NutrExerc Metab 25, 198-215.
Noakes TD, Myburgh KH & Schall R (1990). Peak treadmillrunning velocity during the VO2max test predicts runningperformance. J Sports Sci 8, 35-45.
Noakes T, Volek JS & Phinney SD (2014). Low-CHO diets forathletes: what evidence? Br J Sports Med 48, 1077-1078.
Peronnet F & Massicotte D (1991). Table of nonproteinrespiratory quotient: an update. Can J Sport Sci 16,23-29.
Phinney SD, Bistrian BR, Evans WJ, Gervino E & BlackburnGL (1983). The human metabolic response to chronicketosis without caloric restriction: preservation ofsubmaximal exercise capability with reduced carbohydrateoxidation. Metabolism 32, 769-776.
Prins PJ, Noakes TD, Welton GL, Haley SJ, Esbenshade NJ,Atwell AD, Scott KE, Abraham J, Raabe AS, Buxton JD &Ault DL (2019). High rates of fat oxidation induced by alow-carbohydrate, high-fat diet, do not impair 5-kmrunning performance in competitive recreational athletes. JSport Sci Med 18, 738-750.
Romijn JA, Coyle EF, Sidossis LS, Gastaldelli A, Horowitz JF,Endert E & Wolfe RR (1993). Regulation of endogenous fatand carbohydrate metabolism in relation to exerciseintensity and duration. Am J Physiol 265, E380-E391.
Santos-Concejero J, Gonzalez-Mohıno F, Gonzalez-Rave JM,Perrey S, Dewolf AH, Yates BA, Usaj A, Debevec T,Gonzalez-Rayas JM, Rayas-Gomez AL, Gonzalez-Yanez JM,Lepers R, Stapley P, Louis J, Proessl F, Nikolaidis PT,Knechtle B, Muniz-Pumares D, Hunter B, Bottoms L,Bontemps B, Valenzuela PL, Boullosa D, Del Coso J,Blagrove RC, Hayes PR, Millet GP, Malatesta D, de AlmeidaCosta Campos Y, Pereira Guimaraes M, Macedo Vianna J,Fernandes da Silva S, Silva Marques de Azevedo PH, ParisHL, Leist MA, Lige MT, Malysa W, Oumsang AS, Sinai EC,Hansen RK, Secher NH, Volianitis S, Hottenrott L,Hottenrott K, Gronwald T, Senefeld JW, Fernandes RJ,Vilas-Boas JP, Riveros-Rivera A, Boning D, Craighead DH,Kipp S, Kram R, Zinner C, Sperlich B, Holmberg HC,Muniz-Pardos B, Sutehall S, Angeloudis K, Guppy FM,Bosch A, Pitsiladis Y, Andrade DC, Del Rio R,Ramirez-Campillo R, Lopes TR, Silva BM, Ives SJ, WeyandPG, Brietzke C, Franco-Alvarenga PE, Meireles dos Santos T,Pires FO, Layec G, Hoogkamer W, Balestrini CS, Goss CS,Gabler MC, Escalera A, Bielko SA & Chapman RF (2020).Commentaries on Viewpoint: Physiology and fastmarathons. J Appl Physiol 128, 1069-1085.
Saunders PU, Ahlgrim C, Vallance B, Green DJ, Robertson EY,Clark SA, Schumacher YO & Gore CJ (2010). An attempt toquantify the placebo effect from a three-week simulatedaltitude training camp in elite race walkers. Int J SportsPhysiol Perform 5, 521-34.
Shaw DM, Merien F, Braakhuis A, Maunder E & Dulson DK(2019). Effect of a Ketogenic Diet on Submaximal ExerciseCapacity and Efficiency in Runners. Med Sci Sports Exerc 51,2135-2146.
Stellingwerff T & Cox GR (2014). Systematic review:Carbohydrate supplementation on exercise performance orcapacity of varying durations. Appl Physiol Nutr Metabol 39,998-1011.
Stellingwerff T, Spriet LL, Watt MJ, Kimber NE, Hargreaves M,Hawley JA & Burke LM (2006). Decreased PDH activationand glycogenolysis during exercise following fat adaptationwith CHO restoration. Am J Physiol Endocrinol Metab 290,E380-E388.
Stepto NK, Carey AL, Staudacher HM, Cummings NK, BurkeLM & Hawley JA (2002). Effect of short-term fat adaptationon high-intensity training. Med Sci Sports Exerc 34, 449-455.
Thomas DT, Erdman KA & Burke LM (2016). AmericanCollege of Sports Medicine Joint Position Statement.Nutrition and athletic performance. Med Sci Sports Exerc 48,543-568.
Volek JS, Freidenreich DJ, Saenz C, Kunces LJ, Creighton BC,Bartley JM, Davitt PM, Munoz CX, Anderson JM, MareshCM, Lee EC, Schuenke MD, Aerni G, Kraemer WJ & PhinneySD (2016). Metabolic characteristics of keto-adaptedultra-endurance runners. Metabolism 65, 100-110.
Volek JS, Noakes T & Phinney SD (2015). Rethinking fat as afuel for endurance exercise. Eur J Sport Sci 15,13-20.
Volek J & Phinney S (2012). The Art and Science of LowCarbohydrate Performance. Beyond Obesity LLC.
Webster CC, Noakes TD, Chacko SK, Swart J, Kohn TA &Smith JA (2016). Gluconeogenesis during enduranceexercise in cyclists habituated to a long-term low CHOhigh-fat diet. J Physiol 594, 4389-4405.
Webster CC, Swart J, Noakes TD & Smith JA (2018). Acarbohydrate ingestion intervention in an elite athlete whofollows a LCHF Diet. Int J Sports Physiol Perform 13, 957-960.
Webster CC, van Boom KM, Armino N, Larmuth K, NoakesTD, Smith JA & Kohn TA (2020). Reduced glucose toleranceand skeletal muscle GLUT4 and IRS1 content in cyclistshabituated to a long-term low-carbohydrate, high-fat diet.Int J Sport Nutr Exerc Metab, doi: 10.1123/ijsnem.2019-0359.
Woo G & Olonan Z (2019). Animal-Based, Ketogenic UltraRunner Crushes 100 Mile World Record ft. Zach Bitter.Updated October 4, 2019.http://blog.hvmn.com/podcast/episode-129-ft-zach-bitter.
Yeo WK, Lessard SJ, Chen ZP, Garnham AP, Burke LM, RivasDA, Kemp BE & Hawley JA (2008). Fat adaptation followedby CHO restoration increases AMPK activity in skeletalmuscle from trained humans. J Appl Physiol 105,1519-1526.
Additional information
Data availability statement
The data that support the findings of this study are availablefrom the corresponding author upon reasonable request.
Competing interests
None of the authors of this paper has a competing interest.
C© 2020 The Authors. The Journal of Physiology published by John Wiley & Sons Ltd on behalf of The Physiological Society
790 L. M. Burke and others J Physiol 599.3
Author contributions
This study was conducted at the Australian Institute of Sport,Canberra, Australia. Conception and design of the experimentswas undertaken by L.M.B., J.W., I.A.H., A.K.A.M., M.L.R.R.and A.P.S. Collection, assembly, analysis and interpretation ofdata was undertaken by L.M.B., J.W., I.A.H., M.L.R.R., N.T.,S.G.F., R.H., A.K.A.M., A.M.W. and A.P.S. Drafting the article orrevising it critically for important intellectual content was under-taken by L.M.B. and JW. All authors have read and approved thefinal version of this manuscript and agree to be accountable forall aspects of the work in ensuring that questions related to theaccuracy or integrity of any part of the work are appropriatelyinvestigated and resolved. All persons designated as authorsqualify for authorship, and all those who qualify for authorshipare listed.
Funding
This study was funded by a Grant from Australian CatholicUniversity Research Fund (ACURF, 2017000034). J.W. issupported by a Natural Sciences and Engineering ResearchCouncil of Canada (NSERC) Postdoctoral Fellowship.
Acknowledgements
We thank the small army of researchers who assisted in achievingthis project: Brent Vallance, Fernando Lopez, Louise Cato,Monica Florez, Sarina Lococo, Ola Luczak, Jessica Rothwell,Toni Franklin, Bryce Anderson, Sophie Cashel, Demi Faulkner,Joanne Mirtschin, Renee Krikowa, Kate Gemmell, EricaStephens, Aki Kawamura, Margot Rogers, Jess Ferroni, BronwenCharlesson, Bronwen Lundy, Dr Daniel Friedman, Dr MatthewMooney, and the Trippas White team. The Australian Instituteof Sport provided the facilities and supportive environment forthis work. Most of all we thank the athletes who commit blood,sweat, tears and time to becoming our co-researchers.
Keywords
athletic performance, ketogenic diet, sports nutrition
Supporting information
Additional supporting information may be found online in theSupporting Information section at the end of the article.
Statistical Summary Document
C© 2020 The Authors. The Journal of Physiology published by John Wiley & Sons Ltd on behalf of The Physiological Society