Embed Size (px)
Citation preview
Adapting Discrete-event Simulation Tools to Support Tactical
Forecasting in the Automotive Industry
Adrian Steinemanna, Joachim Taiberb, Georges Fadelc, Konrad Wegenera and Andreas Kunza*
aETH Zurich, IWF, Zurich, Switzerland; bThe Holcombe Department of Electrical and Computer Engineering, Clemson University, CU-ICAR, Greenville, South Carolina, USA; cDepartment of Mechanical Engineering, Clemson University, Clemson, South Carolina, USA
The automotive industry is an example of flow production and manufacturing efficiency. Its performance is based on taking the right decisions on strategic, tactical, and operational processes. Discrete-event simulation is the tool of choice to verify such strategic decisions. As the usage of the tool is complex, the task of verifying suitable solutions is accomplished by simulation experts and limited to high priority projects. For the optimization of operational processes, companies established lean initiatives with real-time monitoring systems to measure production processes and to reveal bottlenecks. The improvement process is often based on trial-and-error and could be heavily supported with discrete-event simulation. Based on a use case of an assembly line in the automotive industry, we propose an approach in which running production environments benefit from simulation experiments without any intensive support by simulation experts. Besides introducing a new work procedure, the goal is to extend the current tool set and to simplify the usage of discrete-event simulation tools for daily application by production engineers by providing new visualization and interaction interfaces to support decisions on tactical measures and thus, prevent system instabilities and blocked line conditions. Finally, first results are also described in the conclusion of this article.
Keywords: Manufacturing, Discrete-Event Simulation, Line Balancing,
Monitoring, Visualization, Interaction
Introduction
As described in [7], [21] and [26], the success of a company is influenced by its vertical range of manufacturing and the integration level of suppliers. Here, the production quality’s importance raised to a core competence of a company. In order to sustain the production quality, companies invest in a continuous modernization of their production facilities. The live and recent history performances of production are monitored (in the sense of supervised) based on the implementation of key performance indicators (KPI), overall equipment effectiveness (OEE), average production cost per product, product cycle time, or level of quality and yield. Together with a minimal capability threshold, the facility assessment also indicates the need for reinvestment in order to maintain the targeted quality standard.
As shown in Figure 1, a production facility can be characterized based on the above performance indicators and their assessment. The figure shows the recurrent
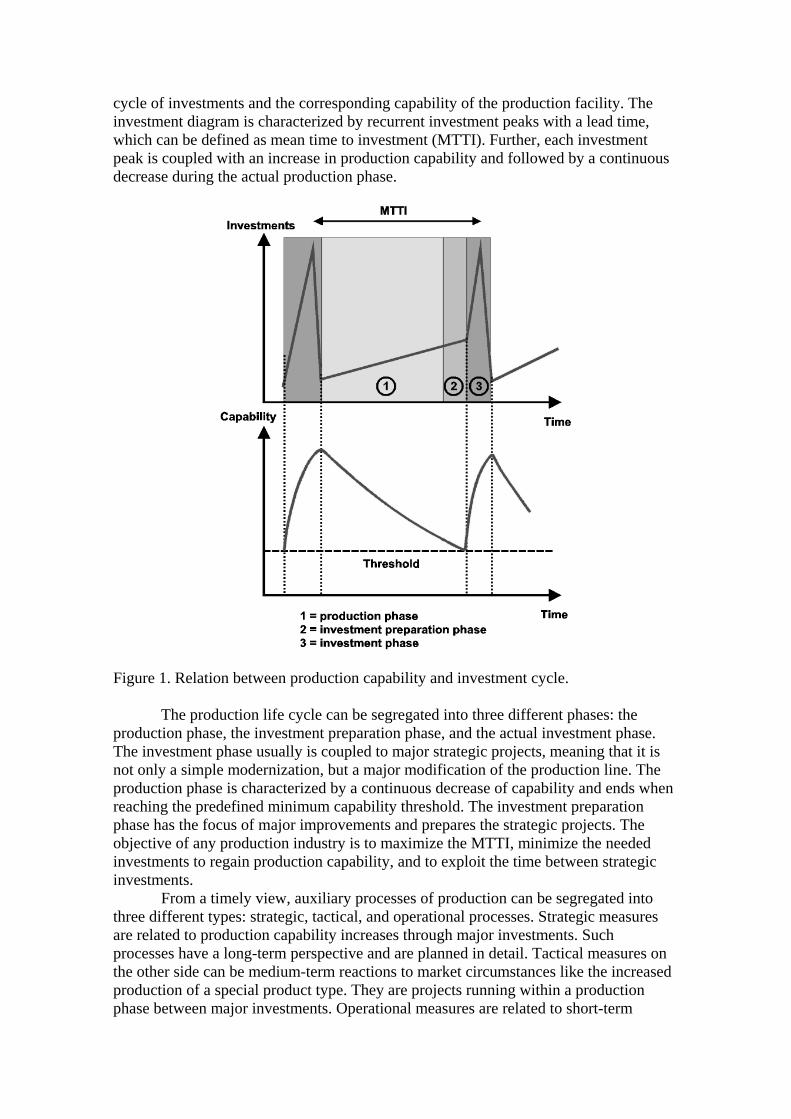
cycle of investments and the corresponding capability of the production facility. The investment diagram is characterized by recurrent investment peaks with a lead time, which can be defined as mean time to investment (MTTI). Further, each investment peak is coupled with an increase in production capability and followed by a continuous decrease during the actual production phase.
Figure 1. Relation between production capability and investment cycle. The production life cycle can be segregated into three different phases: the
production phase, the investment preparation phase, and the actual investment phase. The investment phase usually is coupled to major strategic projects, meaning that it is not only a simple modernization, but a major modification of the production line. The production phase is characterized by a continuous decrease of capability and ends when reaching the predefined minimum capability threshold. The investment preparation phase has the focus of major improvements and prepares the strategic projects. The objective of any production industry is to maximize the MTTI, minimize the needed investments to regain production capability, and to exploit the time between strategic investments.
From a timely view, auxiliary processes of production can be segregated into three different types: strategic, tactical, and operational processes. Strategic measures are related to production capability increases through major investments. Such processes have a long-term perspective and are planned in detail. Tactical measures on the other side can be medium-term reactions to market circumstances like the increased production of a special product type. They are projects running within a production phase between major investments. Operational measures are related to short-term
reactions on the production lines. Today, car manufacturers focus on assembly, while the majority of the components that enter the assembly originate from the supply chain. Any distortion in the supply chain thus can be related to changes or rearrangements of the daily production sequence in order to optimize its processing. Both, tactical and operational measures are needed to exploit the production phase as good as possible.
Regarding the tasks, these production processes can be segregated into planning, forecasting, monitoring, and optimization topics. These tasks do not only differ regarding their objective, but also regarding the different tools and the heterogeneous know-how of the involved personnel. Production planners focus on production priorities for the upcoming weeks or months, gather information about the facility in relation to production constraints, and prepare the upcoming production schedule. Topics related to forecasting of upcoming events are related to simulation experts and the usage of specialized tools. These experts work with abstractions of the real facility to support planning experts determining the right measures. The monitoring of the production usually is assigned to production experts. The tools are based on the readout of status information out of the production systems and enable the control of the equipment effectiveness. According to the implemented resolution of these monitoring tools, the production experts perform incremental step optimization through trial-and-error. As soon as the optimization requires measures, which surpasses operational improvements or process adjustments through work content shifts, optimization projects are originated based on methods like Six Sigma or Lean Manufacturing. These projects usually are supported by optimization experts in close collaboration with the production engineers.
In this heterogeneous environment, people are confronted with the challenge of an information exchange across diverging know-how and tools. Sometimes, even differences in languages, time zones, and culture aggravate the situation. This results in a complex working environment with challenges for the involved persons.
In the early phases of factory planning projects, planning and simulation engineers are important for the project team and take the comprehensive responsibility of leading the way towards efficient production structures with their expertise in optimization methods and simulation paradigms. Besides these strategic projects related to early phases of the production process life cycle, discrete-event simulation (DES) is used for major adaptations of existing assembly lines and for specific optimizations related to real-time production. A discrete-event simulation is required, since KPIs only show performance status information, but do not readily provide analytical information as to the root causes of any off-target performance. For the DES, planning and simulation engineers are involved as experts with a well-defined task. The team goes through a process of getting familiar with the specific use case, collecting data for the simulation, updating existing models or building up new ones, and verifying and validating them before running the actual optimization experiments. In the end, the team reports the results and makes suggestions on how to proceed. As this process is time-consuming and costly, many companies limit the usage of simulation resources to high priority projects. Nevertheless, the benefit of simulation is evident and thoroughly discussed in the literature. However, for smaller tactical approaches these DES tools cannot be used anymore, since decisions have to be taken by line responsibles, which neither have access nor the expertise to use complex DES simulation software under time pressure. Thus, the proposed system tries to close the gap between the two main stakeholders production planner and line responsible. Since they are typically not collocated due to the globalized character of large companies, this gap can only be bridged by a more intuitive handling of a tailored interface to a production planning program, and by the remote help of the production planner.
Thus, the overall idea introduced in this paper is to extend the usage of a simulation tool to all three phases of a production (see Figure 1). This will be possible by a flexible and adapted interface that is tailored for entering only relevant live data, but also for updating the initial starting values of the simulation with more current data acquired from the running process. This is an important step towards the Digital Factory, since it establishes the link between design and through-life technical validation and referencing.
The remainder of this article describes how to simplify the usage of DES tools, such that they become a part of the improvement process and can be applied by production engineers on a daily basis. This would support their decisions on tactical measures like sequencing and work content distribution and thus, prevent system instabilities, blocked line conditions, and improve the overall capacity of the production facility during its production phase, as they could occur e.g. in the automotive industry. It is important to not introduce a new tool to the complete company, but to modify the procedure in such a way that data generated for the tactical planning can also be used further downstream the production. For our proposed approach, we studied the existing working procedures, before we did experimentations with the line responsibles using the developed system.
Based on this in-depth analysis of a use case in the automotive industry, i.e. the engine final assembly of passenger cars, we propose an approach that supports production engineers to take tactical and operational decisions. Therefore, we aim to extend their current tool set with a customized environment based on simulation, visualization, interaction, and remote collaboration possibilities. This would extend today’s state of the art with a new system supporting production engineers in their daily work with simulation capabilities without being simulation experts. In section ”Overall Approach”, we present our overall approach with its four components. In section ”Use Case Description”, we discuss the use case and the relevant processes. Section “Simulation Model Design” presents the details on the design of the simulation model, while sections “Interconnection Software” & “Visualization Client” discuss the software architecture and design. In the end, section “Connecting Single Display Groupware and Blender” presents a prototypical interface and section “Conclusion and Outlook” concludes the paper and points out our future work.
Related Work
In literature, many different methodologies can be found which discuss different approaches to conduct such simulation based optimization projects like the work of Acél [1]. In the end, most methodologies resemble the above mentioned general outline, while keeping their specialities. Nevertheless, the benefit of simulation is evident and thoroughly discussed in literature. Rabelo et al. [19] provide background on discrete-event simulation and describe its main focus, i.e. the design of new facilities, the evaluation of system improvements, as well as planning and scheduling decisions. They suggest considering performance, robustness, and stability as measures during an optimization process. In addition, Sanchez [22] discusses the value of robust design and stresses the importance of simulation sensitivity analysis, together with model verification and validation. Whereas Carson et al. [6] and Swisher et al. [29] cover the field of simulation optimization. Besides a discussion on measures and achievements improving production throughput, Alden et al. [3] address an approach promoting methodical consistency across an organization. This allows disparate user groups, i.e. simulation engineers and production engineers, to access identical analysis capabilities
and thus, to create comparable simulation results. In their book, Bayer et al. [4] give a comprehensive overview on the application of simulation in the automotive industry. However, despite a high acceptance of simulation tools, they mention drawbacks like insufficient standards, which hinder the efficient implementation of simulation technology. Furthermore, Wood et al. [31] discuss possibilities to reduce human errors in simulation and the importance of standardization to ensure the quality of the results.
In literature, simulation, whether it is related to the automotive industry or specific on optimization, is applied over the whole span from strategic to operational tasks and is always used as a tool for experts. No approach can be found to apply tools as a support for tactical decisions by non-experts, such as e.g. line responsibles.
Contribution
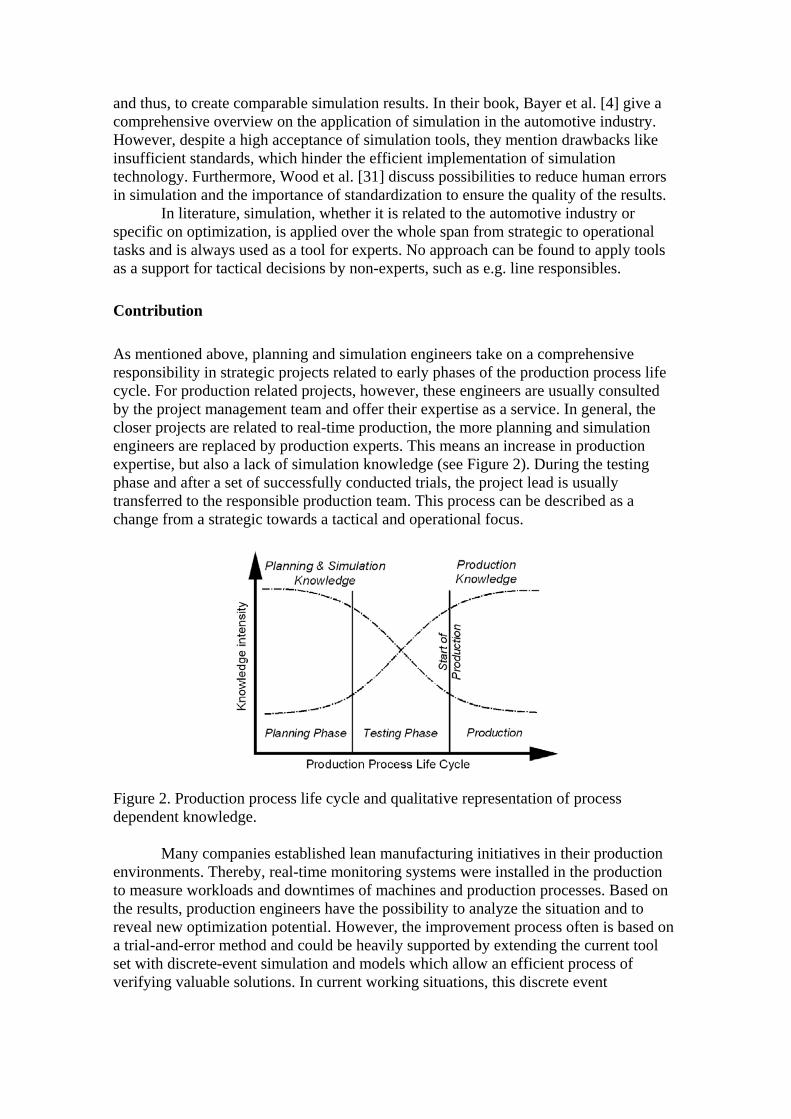
As mentioned above, planning and simulation engineers take on a comprehensive responsibility in strategic projects related to early phases of the production process life cycle. For production related projects, however, these engineers are usually consulted by the project management team and offer their expertise as a service. In general, the closer projects are related to real-time production, the more planning and simulation engineers are replaced by production experts. This means an increase in production expertise, but also a lack of simulation knowledge (see Figure 2). During the testing phase and after a set of successfully conducted trials, the project lead is usually transferred to the responsible production team. This process can be described as a change from a strategic towards a tactical and operational focus.
Figure 2. Production process life cycle and qualitative representation of process dependent knowledge.
Many companies established lean manufacturing initiatives in their production
environments. Thereby, real-time monitoring systems were installed in the production to measure workloads and downtimes of machines and production processes. Based on the results, production engineers have the possibility to analyze the situation and to reveal new optimization potential. However, the improvement process often is based on a trial-and-error method and could be heavily supported by extending the current tool set with discrete-event simulation and models which allow an efficient process of verifying valuable solutions. In current working situations, this discrete event

simulation cannot be accessed by the line responsibles due to missing expertise, but also due to a missing adapted interface for the visualisation of the simulation results.
Overall Approach
Today, the usage of discrete-event simulation tools (DES) is mostly limited to high priority strategic projects, due to the need for the continuous involvement of simulation engineers, but not yet for an optimization of operational processes. Instead, companies established lean manufacturing initiatives with real-time monitoring systems to measure production processes and to reveal bottlenecks. Although many companies installed these monitoring systems to track all occurrences in their production systems, the optimization processes are mostly limited to trial-and-error procedures without any simulation support for the involved production engineers. Based on the analysis of today’s best practices related to simulation, we see the potential of developing an approach, such that running production environments directly benefit from simulation experiments without an intensive support by simulation experts. Our approach distinguishes between high-priority projects requiring extensive and accurate simulation results supported by experts, and constraints out of the daily routine of a production environment where also restricted simulation models are able to support the existing optimization processes. Our approach simplifies the usage of DES tools in such a way that they can be applied by production engineers on a daily basis. This supports their decisions on tactical measures like product sequencing and work content distribution and thus, prevents system instabilities and blocked line conditions.
Overall, we focus on the development of a support environment called SAMSON (Simulation Applications for Mechatronic Systems-Engineering over Networks). SAMSON should establish using DES tools further downstream the production line not only by introducing a new procedure, but also by providing suitable interaction and visualization interfaces to the line responsibles. Its main characteristics are:
• Adaptive simulation models, which can interoperate with the installed monitoring tools and use them as a data source.
• User-friendly interaction methods to support ease of use. • Suitable visualization capabilities to enable virtual walkthroughs.
First of all, our approach requires an in-depth analysis of the specific use case. This analysis needs to identify the critical production processes, their parameters, the constraints on these processes, and the general objectives of the company as related to these processes. The next step is to adapt existing simulation models to the specified environment and to tune them towards a tactical forecasting of the identified objectives. Finding the right level of detail and leading the simulation model towards an adequate and robust solution is a cyclical process. The implementation procedure thus consists of the description of the project to clarify the purpose of the simulation, the acquisition of data out of the monitored production system, the development of the model itself, and its verification. Once this process is concluded, it is possible to restrict the number of variables, and thus to provide the possibility of executing simulation experiments on a non-expert level, to connect this tool to an optimization engine, and to analyze its results for identifying valuable improvement scenarios. However, the in-depth analysis and the adaption of the simulation model are only the first of a number of steps needed to reach the objective of efficiently supporting production engineers.
The second keystone of our approach is an intuitive interaction concept and front-end application as known from Single Display Groupware (SDG) environments such as Microsoft Surface [15], ThinSight [10], or MightyTrace [11]. These tabletop systems replace the interaction using keyboard and mouse by the usage of pens, Tangible User Interfaces (TUI), and direct touch. Furthermore, they adapt the Graphical User Interface (GUI) to match their multi-user capability and the intended ease of use. As discussed by Stewart et al. [28] and Shen et al. [23], this allows concentrating on the discussion without being distracted by handling the system. Based on the interaction concept of such SDG environments, our goal is to develop an application which is designed, in our specific case, along the process of balancing production lines considering the given production steps and their assignments to various stations. Thus, the simulation suite used by the simulation engineers operates in the background and provides just the needed information directly to the newly designed front-end application that only provides a subset of the simulation suite’s input capabilities, which are relevant to the production engineer. Together with intuitive interaction devices, it is thus adapted to the requirements of tactical decisions for the production line.
The third component of SAMSON is the virtual representation of the actual production floor. This representation needs to be implemented as an interactive environment which shows all relevant occurrences and events of the production line (e.g. carriers, products …). Using a game engine like the one of Blender [5], simulation tool events can be translated into movements within a virtual environment, and thus the simulation runs can be augmented into a spatially correct representation. In addition, the game engine offers the possibility to perform virtual walkthroughs of the production floor. This supports the usual inspection walkways of production engineers and thus enables the possibility to compare simulated situations with well-known occurrences from everyday routine. Since the production engineers are not used to the abstract user interface and data representation of DES software, this eases detailed discussions on the introduction of new products, the distribution of new work content, or line balancing measures by concretizing the results of simulations, conceptual trials, and experiments.
Bringing the intuitive interaction concept, the front-end application, and the visualization together, we have a collaboration environment in which several users interact with a system offering direct control to a simplified simulation front-end and an interactive virtual environment. This is in particular important since in the automotive sector the required expertise is globally distributed. The SAMSON hardware equipment is similar to known systems like BUILD-IT [20]. The components are a tabletop multi interaction device for navigation within the bird’s view of a 3D-world and the configuration of simulation experiments, and a viewer’s perspective in this virtual environment being visualized on a vertical screen. For instance, it would be possible to place a virtual camera in the scenario in such a way that both sides see a certain position of the production line, which might be very relevant for the ongoing discussion. Especially for the globally distributed production in the automotive industry, such scenarios are very helpful, since the required expertise could be easily connected from another location without impeding the short-term decision process within the tactical planning scenario.
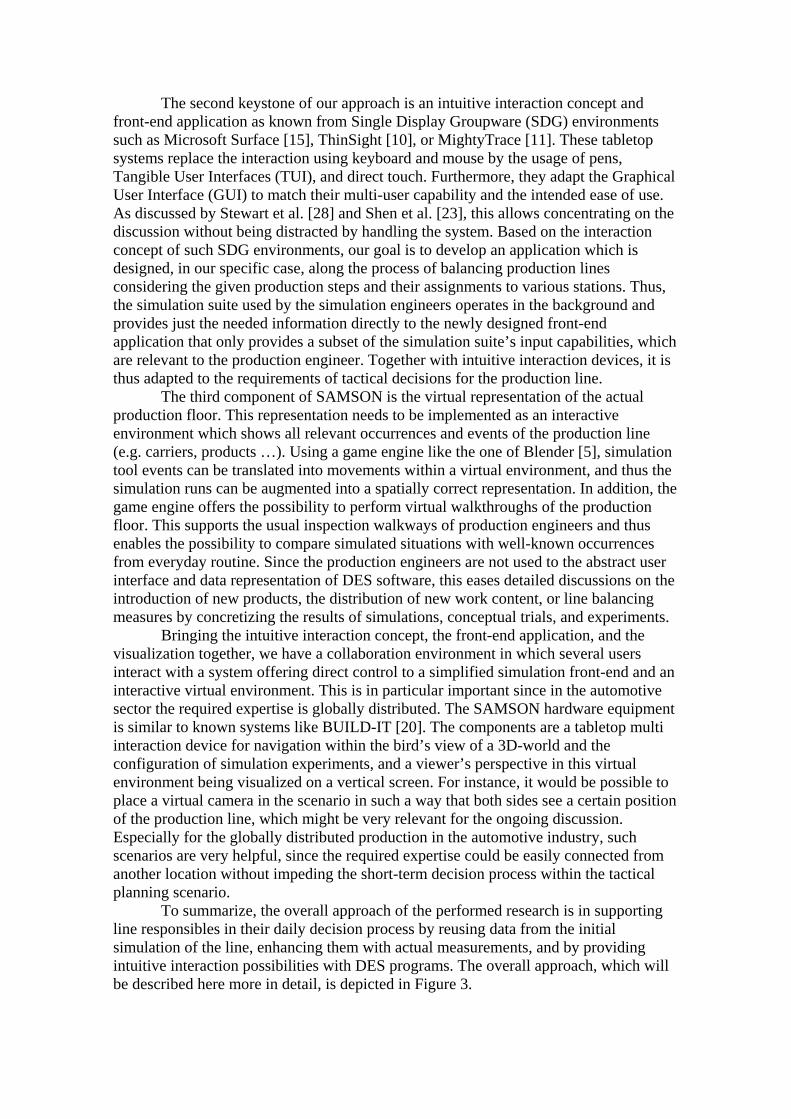
To summarize, the overall approach of the performed research is in supporting line responsibles in their daily decision process by reusing data from the initial simulation of the line, enhancing them with actual measurements, and by providing intuitive interaction possibilities with DES programs. The overall approach, which will be described here more in detail, is depicted in Figure 3.
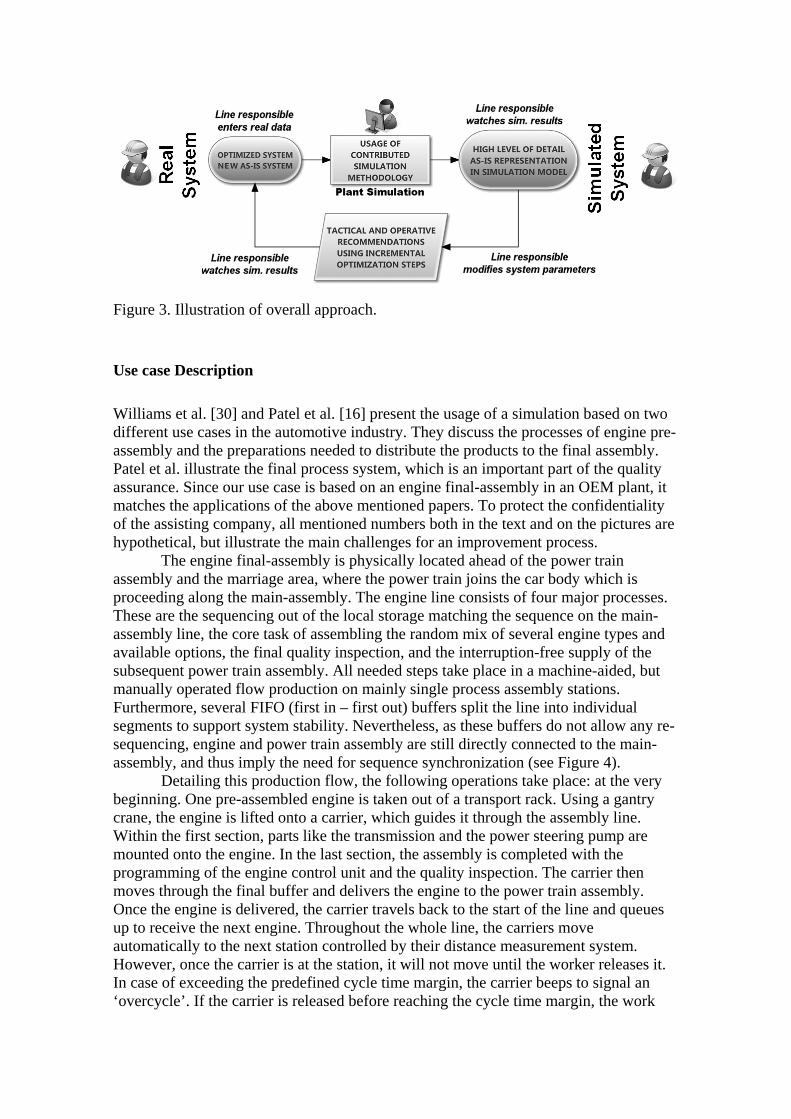
Figure 3. Illustration of overall approach.
Use case Description
Williams et al. [30] and Patel et al. [16] present the usage of a simulation based on two different use cases in the automotive industry. They discuss the processes of engine pre-assembly and the preparations needed to distribute the products to the final assembly. Patel et al. illustrate the final process system, which is an important part of the quality assurance. Since our use case is based on an engine final-assembly in an OEM plant, it matches the applications of the above mentioned papers. To protect the confidentiality of the assisting company, all mentioned numbers both in the text and on the pictures are hypothetical, but illustrate the main challenges for an improvement process.
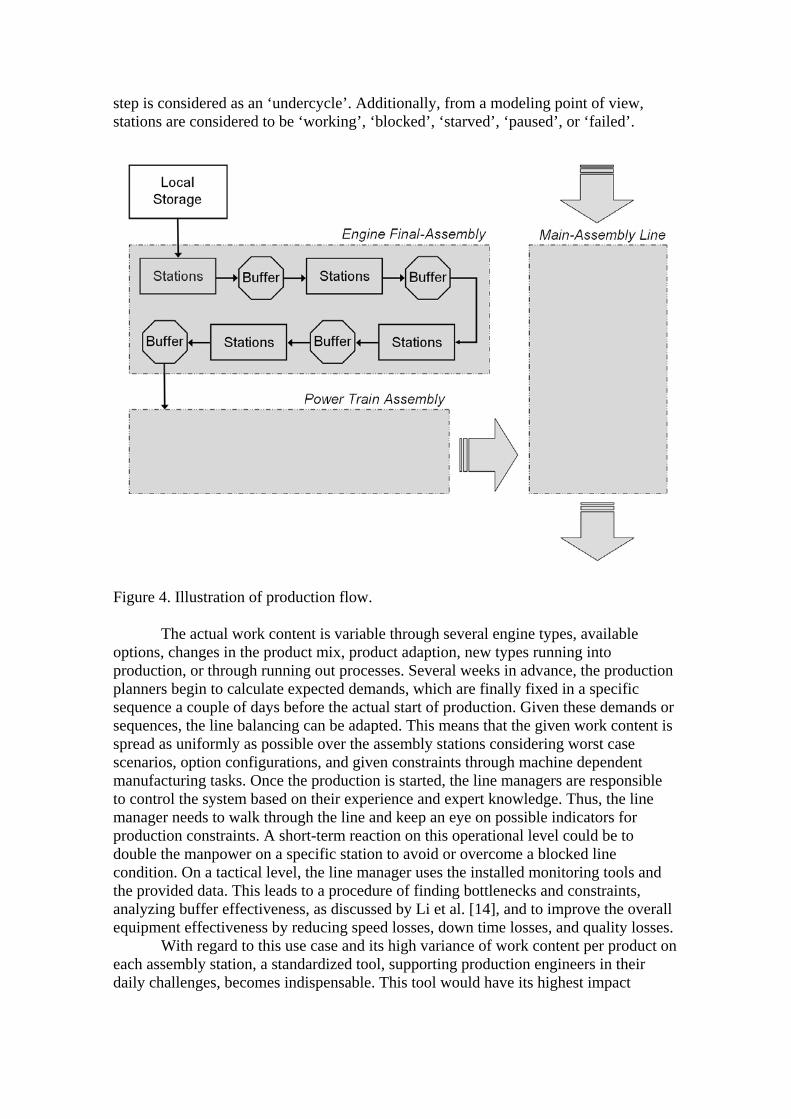
The engine final-assembly is physically located ahead of the power train assembly and the marriage area, where the power train joins the car body which is proceeding along the main-assembly. The engine line consists of four major processes. These are the sequencing out of the local storage matching the sequence on the main-assembly line, the core task of assembling the random mix of several engine types and available options, the final quality inspection, and the interruption-free supply of the subsequent power train assembly. All needed steps take place in a machine-aided, but manually operated flow production on mainly single process assembly stations. Furthermore, several FIFO (first in – first out) buffers split the line into individual segments to support system stability. Nevertheless, as these buffers do not allow any re-sequencing, engine and power train assembly are still directly connected to the main-assembly, and thus imply the need for sequence synchronization (see Figure 4).
Detailing this production flow, the following operations take place: at the very beginning. One pre-assembled engine is taken out of a transport rack. Using a gantry crane, the engine is lifted onto a carrier, which guides it through the assembly line. Within the first section, parts like the transmission and the power steering pump are mounted onto the engine. In the last section, the assembly is completed with the programming of the engine control unit and the quality inspection. The carrier then moves through the final buffer and delivers the engine to the power train assembly. Once the engine is delivered, the carrier travels back to the start of the line and queues up to receive the next engine. Throughout the whole line, the carriers move automatically to the next station controlled by their distance measurement system. However, once the carrier is at the station, it will not move until the worker releases it. In case of exceeding the predefined cycle time margin, the carrier beeps to signal an ‘overcycle’. If the carrier is released before reaching the cycle time margin, the work
step is considered as an ‘undercycle’. Additionally, from a modeling point of view, stations are considered to be ‘working’, ‘blocked’, ‘starved’, ‘paused’, or ‘failed’.
Figure 4. Illustration of production flow. The actual work content is variable through several engine types, available
options, changes in the product mix, product adaption, new types running into production, or through running out processes. Several weeks in advance, the production planners begin to calculate expected demands, which are finally fixed in a specific sequence a couple of days before the actual start of production. Given these demands or sequences, the line balancing can be adapted. This means that the given work content is spread as uniformly as possible over the assembly stations considering worst case scenarios, option configurations, and given constraints through machine dependent manufacturing tasks. Once the production is started, the line managers are responsible to control the system based on their experience and expert knowledge. Thus, the line manager needs to walk through the line and keep an eye on possible indicators for production constraints. A short-term reaction on this operational level could be to double the manpower on a specific station to avoid or overcome a blocked line condition. On a tactical level, the line manager uses the installed monitoring tools and the provided data. This leads to a procedure of finding bottlenecks and constraints, analyzing buffer effectiveness, as discussed by Li et al. [14], and to improve the overall equipment effectiveness by reducing speed losses, down time losses, and quality losses.
With regard to this use case and its high variance of work content per product on each assembly station, a standardized tool, supporting production engineers in their daily challenges, becomes indispensable. This tool would have its highest impact

evaluating line balancing configurations and supporting engineers on tactical decisions to prevent system instabilities.
Simulation Model Design
As mentioned before, many simulation projects are related to high priority strategic projects and are conducted with the continuous involvement of simulation engineers. Nevertheless, as the resulting models are specifically designed to support a limited optimization task (e.g. restructuring of an assembly line), in most cases they do not support the daily use by production engineers. On the one hand, the models are not designed to simulate generic work content shifts or sequencing variances, and on the other hand they only implement parameter settings on an expert level for extensive and accurate simulation runs. Thus, once such a high priority simulation project is completed, the models need to be simplified to an adequate level of detail and modified towards the main use case of the daily business on a non-expert level. Otherwise, the models could not be used to offer a better basis of decision-making during daily operations and the efforts of model building would remain limited to the high priority projects. This change of objective would also heavily impact the prevailing analysis and improvement processes. Production engineers could analyze daily challenges (cf. below listed items) themselves without spending lots of resources for simulation projects:
• Different viewpoints and possibility to better understand and get a feeling for the behavior of the line itself and to recognize the main reasons of particular events.
• Use provided information from production planners to simulate line balancing configurations based on the upcoming production demands.
• Find ways to raise system stability and robustness against blocked line conditions through flexible distribution of work content.
• Evaluate new line concepts to minimize constraints influencing overall equipment effectiveness.
Using the software tool ‘Plant Simulation’ [17], we focused on a model design reflecting the actual situation on the line. First of all, it is crucial to determine the model’s appropriate level of detail depending on the intended application. This is the key to find the right balance between potential and simplicity of a simulation model.
Analyzing the prevalent situation shows that the essential use cases are tactical decisions on sequencing and line balancing by work content distribution. They have the goal to fulfil the scheduled production volume and deliver the engines to the power train assembly within the predefined tact time using as little resources as possible.
The engine final-assembly offers all the data needed to feed a discrete-event simulation model. On the one side, this is planning data which can be used as an input for tactical forecasting experiments. This data covers production volumes and demands known up to one month ahead of schedule, real production sequences, engine type specific work content distributions, option lists, buffer sizes, and production volume targets. Al-Aomar [2] classifies this data as controllable factors contributing to variation in simulation outputs. On the other hand, the installed monitoring system provides live-data which is used as initial and boundary conditions or for verification of the tactical forecasting model. Here, examples are real-time status information of all assembly stations and present buffer levels during start-up, running conditions, and shut down.
The intended application of sequence variation and line balancing through work content distribution requires a representation at a high level of detail. Based on the

discussed data set, we decided to implement a model which represents every single station and all existing buffers. However, the work content on each station is summarized and strictly limited to production time input with an underlying distribution which ensures the model’s flexibility (see Figure 5).
Figure 5. Simulation model of engine line showing the production flow. Our goal was to represent the line behavior as detailed as possible. Thus, we put
a lot of effort on its modeling. On the one hand, the system behavior is reflected in a method set handling the carriers’ movements entering and exiting stations or buffers. On the other hand, the work time variance on each station is represented by an engine type and option sensitive distribution based on historical data records, described as random factors by Al-Aomar [2]. The movement handling methods together with the work time distribution build the core of the simulation model.
Subsequently, a proper verification process is needed taking historical product sequences, adjusting the system variables, and running trials comparing the results with the real values of buffers, production volumes, process lead times, and exit rates towards the power train assembly.
In the end, projected demands, product mixes, and lists of engine types and options can be used as input data. Furthermore, the simulation model allows adjusting the system variables like the number of carriers, travel times between stations and through buffers, buffer capacities, or shift models to fine-tune the model and to replicate the historical data on hand. The goal is to support production engineers during tactical fine-tuning procedures of their production line by a robust basis for decision-making.
Therefore, we implemented graphical user interfaces (GUI) (see Figure 6) which includes a subset of changeable parameters. This selection covers the essential inputs like settings for product sequences or demands, system variables like number of carriers, or travel times between stations, and network settings for the intercommunication with further SAMSON elements. As the simulation model design strictly separates the underlying system behavior and the modifiable variables, it
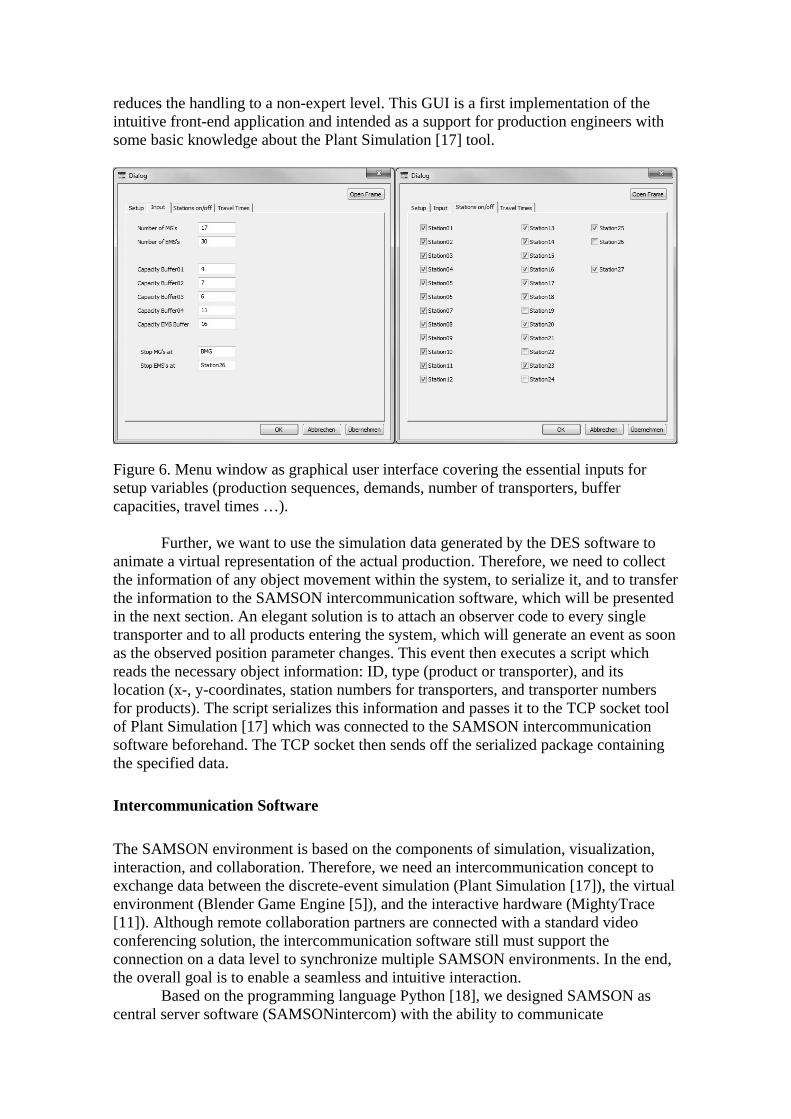
reduces the handling to a non-expert level. This GUI is a first implementation of the intuitive front-end application and intended as a support for production engineers with some basic knowledge about the Plant Simulation [17] tool.
Figure 6. Menu window as graphical user interface covering the essential inputs for setup variables (production sequences, demands, number of transporters, buffer capacities, travel times …).
Further, we want to use the simulation data generated by the DES software to
animate a virtual representation of the actual production. Therefore, we need to collect the information of any object movement within the system, to serialize it, and to transfer the information to the SAMSON intercommunication software, which will be presented in the next section. An elegant solution is to attach an observer code to every single transporter and to all products entering the system, which will generate an event as soon as the observed position parameter changes. This event then executes a script which reads the necessary object information: ID, type (product or transporter), and its location (x-, y-coordinates, station numbers for transporters, and transporter numbers for products). The script serializes this information and passes it to the TCP socket tool of Plant Simulation [17] which was connected to the SAMSON intercommunication software beforehand. The TCP socket then sends off the serialized package containing the specified data.
Intercommunication Software
The SAMSON environment is based on the components of simulation, visualization, interaction, and collaboration. Therefore, we need an intercommunication concept to exchange data between the discrete-event simulation (Plant Simulation [17]), the virtual environment (Blender Game Engine [5]), and the interactive hardware (MightyTrace [11]). Although remote collaboration partners are connected with a standard video conferencing solution, the intercommunication software still must support the connection on a data level to synchronize multiple SAMSON environments. In the end, the overall goal is to enable a seamless and intuitive interaction.
Based on the programming language Python [18], we designed SAMSON as central server software (SAMSONintercom) with the ability to communicate
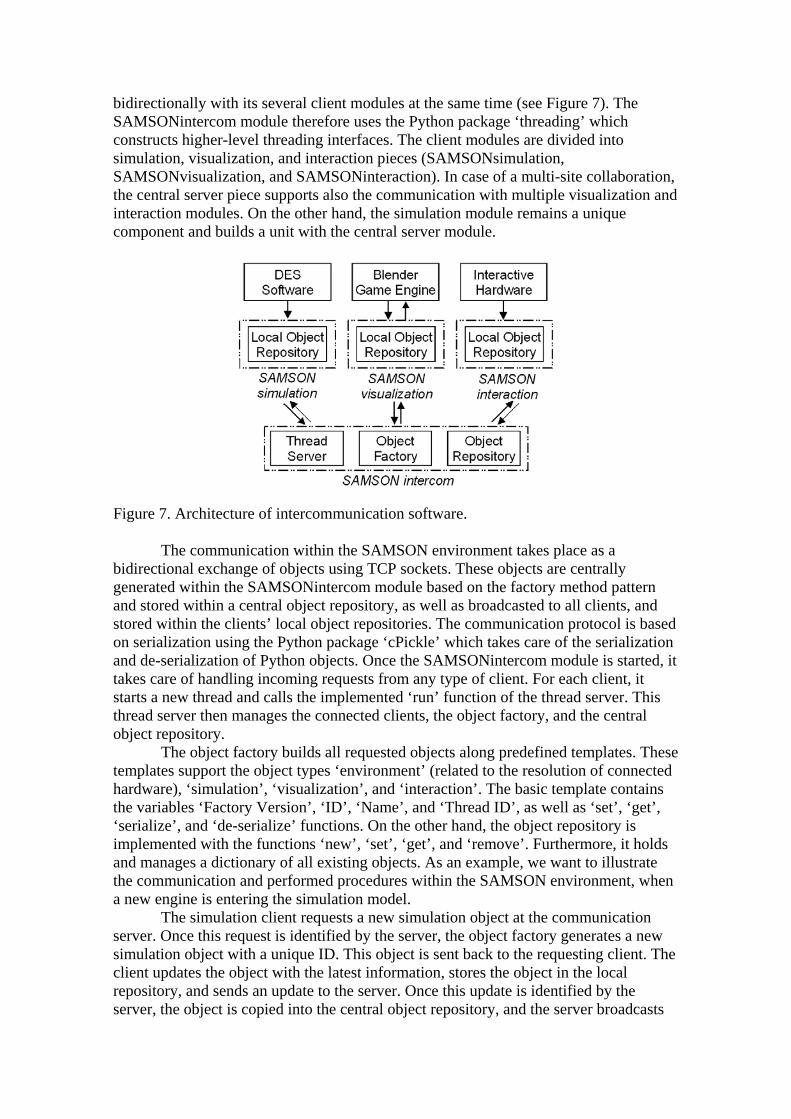
bidirectionally with its several client modules at the same time (see Figure 7). The SAMSONintercom module therefore uses the Python package ‘threading’ which constructs higher-level threading interfaces. The client modules are divided into simulation, visualization, and interaction pieces (SAMSONsimulation, SAMSONvisualization, and SAMSONinteraction). In case of a multi-site collaboration, the central server piece supports also the communication with multiple visualization and interaction modules. On the other hand, the simulation module remains a unique component and builds a unit with the central server module.
Figure 7. Architecture of intercommunication software. The communication within the SAMSON environment takes place as a
bidirectional exchange of objects using TCP sockets. These objects are centrally generated within the SAMSONintercom module based on the factory method pattern and stored within a central object repository, as well as broadcasted to all clients, and stored within the clients’ local object repositories. The communication protocol is based on serialization using the Python package ‘cPickle’ which takes care of the serialization and de-serialization of Python objects. Once the SAMSONintercom module is started, it takes care of handling incoming requests from any type of client. For each client, it starts a new thread and calls the implemented ‘run’ function of the thread server. This thread server then manages the connected clients, the object factory, and the central object repository.
The object factory builds all requested objects along predefined templates. These templates support the object types ‘environment’ (related to the resolution of connected hardware), ‘simulation’, ‘visualization’, and ‘interaction’. The basic template contains the variables ‘Factory Version’, ‘ID’, ‘Name’, and ‘Thread ID’, as well as ‘set’, ‘get’, ‘serialize’, and ‘de-serialize’ functions. On the other hand, the object repository is implemented with the functions ‘new’, ‘set’, ‘get’, and ‘remove’. Furthermore, it holds and manages a dictionary of all existing objects. As an example, we want to illustrate the communication and performed procedures within the SAMSON environment, when a new engine is entering the simulation model.
The simulation client requests a new simulation object at the communication server. Once this request is identified by the server, the object factory generates a new simulation object with a unique ID. This object is sent back to the requesting client. The client updates the object with the latest information, stores the object in the local repository, and sends an update to the server. Once this update is identified by the server, the object is copied into the central object repository, and the server broadcasts
the update to all other connected clients. Finally, these clients store the object in their local repository and eventually trigger some internal functions dependent on the received update.
Visualization Client
We decided to use the Blender Game Engine to build up the virtual environment. Blender [15] is a free open source 3D content creation suite which supports modeling, rendering, and animation. It also includes a game engine supporting collision detection, dynamics simulation, and a Python scripting API. Based on this API, we implemented the SAMSONvisualization module as a master script which is connected to the corresponding and previously designed virtual model. First, this master script starts the TCP communication with the SAMSONintercom server module. Usually, TCP sockets are implemented as blocking sockets. Thus, the execution of a script stops at the point where the socket is instructed to receive data and waits for the communication from the connected counterpart. As the Blender Game Engine works with an internal tick rate and repeatedly triggers the implemented Python scripts, any software running within a Blender session has to be developed as absolutely non-blocking. Otherwise, the executed Python scripts containing ‘while true loops’ or blocking sockets would lead to an interruption in the execution routine and freeze the Game Engine.
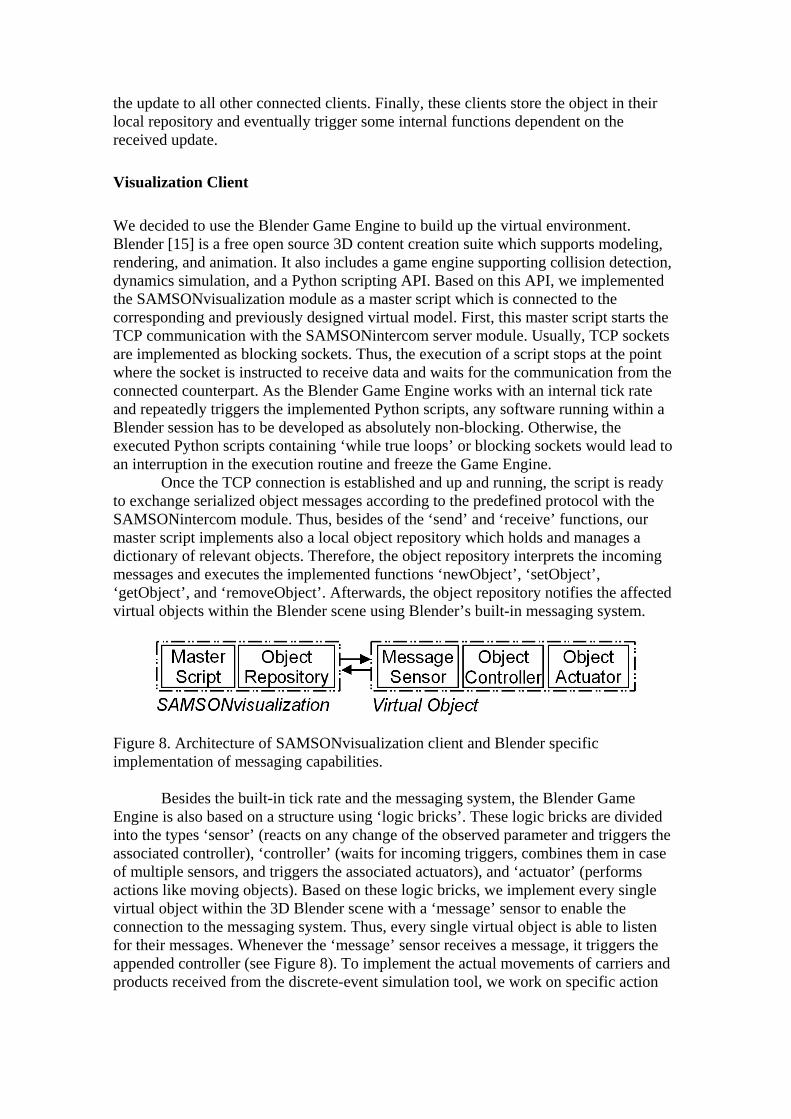
Once the TCP connection is established and up and running, the script is ready to exchange serialized object messages according to the predefined protocol with the SAMSONintercom module. Thus, besides of the ‘send’ and ‘receive’ functions, our master script implements also a local object repository which holds and manages a dictionary of relevant objects. Therefore, the object repository interprets the incoming messages and executes the implemented functions ‘newObject’, ‘setObject’, ‘getObject’, and ‘removeObject’. Afterwards, the object repository notifies the affected virtual objects within the Blender scene using Blender’s built-in messaging system.
Figure 8. Architecture of SAMSONvisualization client and Blender specific implementation of messaging capabilities.
Besides the built-in tick rate and the messaging system, the Blender Game
Engine is also based on a structure using ‘logic bricks’. These logic bricks are divided into the types ‘sensor’ (reacts on any change of the observed parameter and triggers the associated controller), ‘controller’ (waits for incoming triggers, combines them in case of multiple sensors, and triggers the associated actuators), and ‘actuator’ (performs actions like moving objects). Based on these logic bricks, we implement every single virtual object within the 3D Blender scene with a ‘message’ sensor to enable the connection to the messaging system. Thus, every single virtual object is able to listen for their messages. Whenever the ‘message’ sensor receives a message, it triggers the appended controller (see Figure 8). To implement the actual movements of carriers and products received from the discrete-event simulation tool, we work on specific action
scripts. These scripts would be triggered by the controller and thus implement the ability to initiate predefined actions like moving a carrier to the next station.
Connecting Single display Groupware and Blender
Since the publication of the first multi-touch system using frustrated total internal reflection (FTIR) [9] to track interactions, and subsequent adaptations like [25], the attention for the field of Single Display Groupware (SDG) and multi-touch interaction started to rise. Lately, former SDG systems with multi-interaction capabilities like DiamondTouch [8], reacTable [12], or Microsoft Surface [15] were followed by two promising systems, i.e. ThinSight [10], and MightyTrace [11]. Both integrate their tracking technology into commercial liquid crystal displays (LCD), and thus drastically reduce space requirements. Some recently published work like [32] also conveys a trend to support industrial-oriented tasks. Within the SAMSON environment, we aim to support both, local and remote collaboration and to benefit from existing hardware infrastructure for multi-user interaction. Further, we aim to support separated teams with a virtual line representation in the connected environment, its available interactive surfaces, and all occurring interactions. On the other hand, typical engineering sessions cover a large number of grabbing and displacing interactions to rearrange a scene. Thus, we concentrate on a combination of a 2D and 3D scene representation.
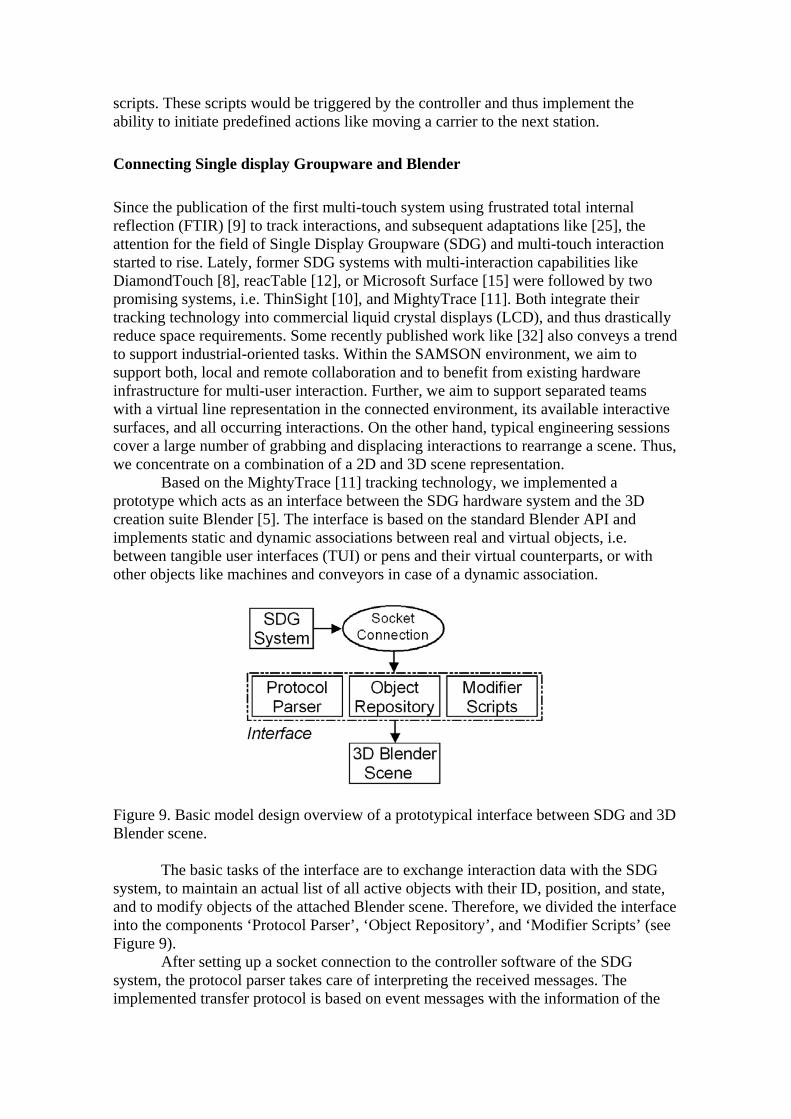
Based on the MightyTrace [11] tracking technology, we implemented a prototype which acts as an interface between the SDG hardware system and the 3D creation suite Blender [5]. The interface is based on the standard Blender API and implements static and dynamic associations between real and virtual objects, i.e. between tangible user interfaces (TUI) or pens and their virtual counterparts, or with other objects like machines and conveyors in case of a dynamic association.
Figure 9. Basic model design overview of a prototypical interface between SDG and 3D Blender scene.
The basic tasks of the interface are to exchange interaction data with the SDG
system, to maintain an actual list of all active objects with their ID, position, and state, and to modify objects of the attached Blender scene. Therefore, we divided the interface into the components ‘Protocol Parser’, ‘Object Repository’, and ‘Modifier Scripts’ (see Figure 9).
After setting up a socket connection to the controller software of the SDG system, the protocol parser takes care of interpreting the received messages. The implemented transfer protocol is based on event messages with the information of the
event type (device activated, position update, state update, device deactivated), the device ID, the device’s state (button pressed, hovering), and the device’s position on the interactive surface.
The object repository is responsible to keep track of the pens and TUIs on the SDG system, and to store their positions, states, and associations with virtual objects within the 3D scene. Additionally, the repository can be extended to hold a history of performed interactions, and thus to support modifier scripts with a need to interpret previously performed interactions. Finally, the modifier scripts implement the direct connection to the attached Blender scene. Therefore, they offer functions to associate or disassociate TUIs and virtual objects. This association can be either static or dynamic.
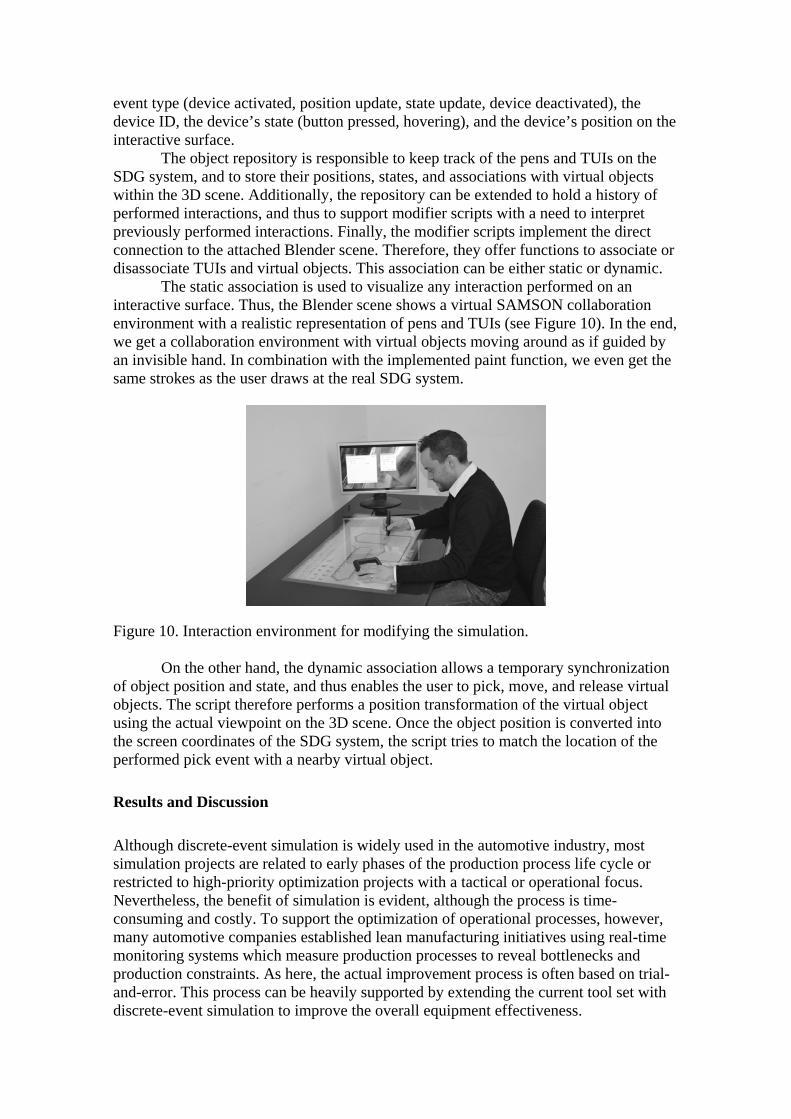
The static association is used to visualize any interaction performed on an interactive surface. Thus, the Blender scene shows a virtual SAMSON collaboration environment with a realistic representation of pens and TUIs (see Figure 10). In the end, we get a collaboration environment with virtual objects moving around as if guided by an invisible hand. In combination with the implemented paint function, we even get the same strokes as the user draws at the real SDG system.
Figure 10. Interaction environment for modifying the simulation. On the other hand, the dynamic association allows a temporary synchronization
of object position and state, and thus enables the user to pick, move, and release virtual objects. The script therefore performs a position transformation of the virtual object using the actual viewpoint on the 3D scene. Once the object position is converted into the screen coordinates of the SDG system, the script tries to match the location of the performed pick event with a nearby virtual object.
Results and Discussion
Although discrete-event simulation is widely used in the automotive industry, most simulation projects are related to early phases of the production process life cycle or restricted to high-priority optimization projects with a tactical or operational focus. Nevertheless, the benefit of simulation is evident, although the process is time-consuming and costly. To support the optimization of operational processes, however, many automotive companies established lean manufacturing initiatives using real-time monitoring systems which measure production processes to reveal bottlenecks and production constraints. As here, the actual improvement process is often based on trial-and-error. This process can be heavily supported by extending the current tool set with discrete-event simulation to improve the overall equipment effectiveness.
First trials with the procedure and the interaction components showed very promising results, since both – the planning engineers as well as the line responsibles – could see the benefit of further detailing the simulation model and of providing intuitive interfaces to interact with it. Unlike in the strategical planning of production lines, the goal was not to rearrange assembly stations, but to recognize and overcome possible bottlenecks by the possibilities at hand, i.e. resequencing, additional workers, etc. Based on the realized hardware interfaces and on the further detaillation of the initial simulation model, it was already possible to make simulation prior to the decision e.g. regarding the sequencing of products to be assembled. It showed that the system and its operability fits well into daily work process of line responsibles.
Conclusion and Outlook
We presented the SAMSON environment, which is based on the integration of restricted simulation models for a non-expert level, and which aims to support simulation experiments within the improvement process performed by production engineers. The fundamental components of SAMSON are the interoperability with the installed monitoring tools using them as a data source, the user-friendly interaction methods to support the ease of use, suitable visualization capabilities to enable virtual walkthroughs, and the possibility for live collaboration with remote team members. In combination with the adequate improvement methodology, this environment opens up significant improvement potential through continuous process modifications. The usage of TUIs allows an easy interaction with the underlying visualization since the device’s inherent function is easily detectable by its shape. Being used within a virtual environment allows replacing abstract placeholders (like in Plant Simulation) by easy-to-recognize visualisations of the real machine, which is in particular important for the line responsibles. By this, the overall interaction with the underlying programs becomes easier and faster, as well as less error-prone.
To conclude our paper, we want to point out our next steps. The SAMSON intercommunication software builds the core of the environment and is based on the Python programming language [18]. As the seamless integration is an important issue, we plan to compare the discrete-event simulation tool Plant Simulation [17] with the open source project SimPy [24]. SimPy is an object-oriented and process-based discrete-event simulation language based on standard Python and thus represents the counterpart to SimTalk used within Plant Simulation [17]. Since the DES tool connected to SAMSON only runs in the background, we do not depend on any front-end GUI at all. Furthermore, we will concentrate on the development of the actions scripts to animate the basic movements of the virtual objects within the Blender scene to represent the actions received from the discrete-event simulation. In addition, we will focus on the intuitive front-end application mentioned in section 2, which represents an important part in the work flow of the line balancing through work content distribution. On the other hand, we plan to extend the prototype for the connection with SDG systems to work also with the Blender Game Engine. Thereby, we plan to implement the TUIO protocol [13] for the communication between connected hardware systems and the visualization software. Once the whole SAMSON environment is up and running, we will conduct several user studies to measure how well the process of line balancing is supported, and how good users rate the system.
Although the problem of changing expertise along a production process was described in the above paper at the use case of an automotive company, it can be generalized also for other application fields. For the proof of concept, we investigated

another case study in a mail-order company, which was about to extend his capacity by additional automated stations, buffers, conveyor belts, etc. This case study shows again in perfection the usual state-of-the-art approach: The company wants to ensure the need for extensive investments and initiates a high priority project with extended involvement of experts. The goal is to fortify the decision basis with simulation activities in order to predict the impact of the intended changes. The state-of-the-art approach of course is to use standard simulation methodology and create a simulation model reflecting the real system on the needed level of detail. This model is used as a basis to simulate the intended changes and compare the simulation results with the current system. After the analysis of the results, the simulation expert presents recommendations which will lead to certain layout changes. This process works very good for the intended objective, but it has several drawbacks. The recommendations need to be explained based on diagrams in order to transport the content of the results. This represents a very limited manner of communication. In addition, the recommendations usually are transported to the team within a meeting which does not create the awareness of being a part of the process for all involved stakeholders. This could lead to a rejection of the results. Nevertheless, the worst drawback is the loss of the simulation expertise after this close-down meeting. The simulation model is left on a level of detail which is beneficial for the high priority project, but does not support the daily challenges of the production engineer after the layout changes. In addition to it, simulation still is not part of the daily routine and thus is not able to support incremental optimization steps. This case study is an exemplary study showing the issues of an optimization project following the state of the art methodology and working out the requirements of the needed changes to the way of working.
Although this case study is not yet elaborated in such detail, it shows already the same problems as with the automotive use case. Planning experts are only available in the beginning, while for the later operation of the production line their expertise is not available and partly got lost. Again, the proposed system could help here to overcome this problem, since it fosters the collaboration between the different stakeholders and their expertise.
This user study will also be used to investigate the relationships between observed events (KPI values) and its root causes, and to capture them in model(s), If also the supply chain is integrated in these models, they could then be used for choosing appropriate countermeasures.
Acknowledgments
The authors would like to acknowledge the efforts and the commitment of Mark Peter Staiger, Simulation Engineer at BMW Group. He constantly supported model design and assisted with his simulation knowledge. Furthermore, we want to thank Russell Roman, Donnie Pittman, and their team at BMW Group most sincerely for their support and the readiness to share their expert knowledge of production. Furthermore, we want to point out the implementation efforts and valuable input of Raphael Das Gupta. During his bachelor thesis, he extended the existing prototype between Blender and the SDG system MightyTrace, and implemented the dynamic association of objects.

References
[1] Acél, P., 1996, “Methode zur Durchführung betrieblicher Simulationen”, PhD Thesis ETH Zurich
[2] Al-Aomar, R., 2002, “General methodology 1: a robust simulation-based multicriteria optimization methodology”, Proc. of the 34. Conference on Winter Simulation: Exploring New Frontiers, San Diego, pp. 1931-1939.
[3] Alden, J. M., Burns, L. D., Costy, T., Hutton, R. D., Jackson, C. A., Kim, D. S., Kohls, K. A., Owen, J. H., Turnquist, M. A., and Veen, D. J., 2006, “General Motors Increases Its Production Throughput”, in Interfaces 36, pp. 6-25.
[4] Bayer, J., Collisi, T., and Wenzel, S. (Edts.), “Simulation in der Automobilproduktion”, Springer-Verlag, XIV, 2003.
[5] Blender – Open Source 3D Content Creation Suite, http://www.blender.org/ (accessed Sep. 30, 2009).
[6] Carson, Y., Maria, A., 1997, “Simulation Optimization: Methods and Applications”, Proc. of the 29. Conference on Winter Simulation, Atlanta, ed. by Andradóttir, S., Healy, K.J., Withers, D.H., Nelson, B.L., IEEE Computer Society, Washington, pp. 118-126.
[7] Dietl, H., Royer, S.,and Uwe Stratmann. S., “Value creation architectures and competitive advantage: Lessons from the European automobile industry”. California Management Review, 51(3):26, May 2009
[8] Dietz, P., Leigh, D., 2001, “DiamondTouch: A Multi-User Touch Technology”, Proc. of the 14. Annual ACM Symposium on User Interface Software and Technology, ACM, New York, pp. 219 – 226.
[9] Han, J. Y., 2005, “Low-Cost Multi-Touch Sensing through Frustrated Total Internal Reflection“, Proc. of the 18. Annual ACM Symposium on User Interface Software and Technology, ACM, New York, pp. 115 – 118.
[10] Hodges, S., Izadi, S., Butler, A., Rrustemi, A., and Buxton, B., 2007, “ThinSight: Versatile Multi-touch Sensing for Thin Form-factor Displays“, Proc. of the 20. Annual ACM Symposium on User Interface Software and Technology, ACM, New York, pp. 259 – 268.
[11] Hofer, R., Kaplan, P., and Kunz, A., 2008, “MightyTrace: Multiuser Tracking Technology on LC-Displays“,Proc. of the 26. Annual SIGCHI Conference on Human Factors in Computing Systems, ACM, New York, pp. 215 – 218.
[12] Jordà, S., Geiger, G., Alonso, M., and Kaltenbrunner, M., 2007, “The reacTable: Exploring the Synergy between Live Music Performance and Tabletop Tangible Interfaces”, Proc. of the 1. International Conference on Tangible and Embedded Interaction, ACM, New York, pp. 139 – 146.
[13] Kaltenbrunner, M., Bovermann, T., Bencina, R., and Costanza, E., 2005, “TUIO: A Protocol for Table-Top Tangible User Interfaces”, 6. International Workshop on Gesture in Human-Computer Interaction and Simulation.
[14] Li, L.; Chang, Q.; Ni, J.; Xiao, G., and Biller, S., 2007, „Bottleneck Detection of Manufacturing Systems Using Data Driven Method”, Proc. of the 2007 IEEE International Symposium on Assembly and Manufacturing, pp. 76-81.
[15] Microsoft Corp. – Microsoft Surface, http://www.microsoft.com/surface/ (accessed Mar. 26, 2009).
[16] Patel, V., Ashby, J., and Ma, J., 2002, “Manufacturing 3: discrete event simulation in automotive final process system”, Proc. of the 34. Conference on Winter Simulation: Exploring New Frontiers, San Diego, pp. 1030-1034.
[17] Plant Simulation – Siemens PLM Software. http://www.plm.automation.siemens.com/en_us/products/tecnomatix/plant_design/plant_simulation.shtml (accessed Sep. 26, 2009)
[18] Python – Python Programming Language, http://www.python.org/ (accessed Mar. 26, 2009).
[19] Rabelo, L., Helal, M., Jones, A., Min, J., Son, Y., and Deshmukh, A., 2003, “New manufacturing modeling methodology: a hybrid approach to manufacturing enterprise simulation“, Proc. of the 35. Conference on Winter Simulation: Driving innovation, New Orleans, pp. 1125-1133.
[20] Rauterberg, M., Fjeld, M., Krueger, H., Bichsel, M., Leonhardt, U., and Meier, M., 1998, “BUILD-IT: A Planning Tool for Construction and Design”, CHI 98 Conference Summary on Human Factors in Computing Systems, ACM, New York, pp. 177 – 178.
[21] Rudberg, M., Olhager, J., “Manufacturing networks and supply chains: an operations strategy perspective”, Omega 31(1), 2003, pp. 29-39
[22] Sanchez, S. M., 2000, “Design of experiments: robust design: seeking the best of all possible worlds”, Proc. of the 32. Conference on Winter Simulation, Orlando, Society for Computer Simulation International, San Diego, pp. 69-76.
[23] Shen, C., Ryall, K., Forlines, C., Esenther, A., Vernier, F., Everitt, K., Wu, M., Wigdor, D., Morris, M., Hancock, M., and Tse, E., 2009, ”Collaborative Tabletop Research and Evaluation: Interfaces and Interactions for Direct-Touch Horizontal Surfaces”, in Interactive Artifacts and Furniture Supporting Collaborative Work and Learning, ed. by Dillenbourg, P., Huang, J., Cherubini, M. Springer Science and Business Media, pp. 111-128,
[24] SimPy – Simulation in Python. Object-oriented, process-based discrete-event simulation language based on Python. http://simpy.sourceforge.net/ (accessed Sep. 25, 2009)
[25] Smith, J.D., Graham, T.C.N., Holman, D., and Borchers, J., 2007, “Low-Cost Malleable Surfaces with Multi-Touch Pressure Sensitivity“,2. Annual IEEE International Workshop on Horizontal Interactive Human-Computer Systems, pp. 205 – 208.
[26] Steinemann, A. “Interactive Collaboration for Mechatronic Systems Engineering”, PhD Thesis ETH Zurich, 2012
[27] Steinemann, A., Taiber, J., Fadel, G., Wegener, K., Kunz, A. “Adapting Discrete-Event Simulation Tools to Support Tactical Forecasting in the Automotive Industry”, Ninth International Symposium on Tools and Methods of Competitive Engineering, 2012, pp. 319 - 332
[28] Stewart, J., Raybourn, E. M., Bederson, B., and Druin, A., 1998, “When two Hands are Better Than one: Enhancing Collaboration Using Single Display Groupware“, CHI 98 conference summary on Human factors in computing systems, Los Angeles, ACM Press, pp. 287 - 288.
[29] Swisher, J. R., Hyden, P. D., Jacobson, S. H., and Schruben, L. W., 2000, “Simulation optimization: a survey of simulation optimization techniques and procedures“, Proc. of the 32. Conference on Winter Simulation, Orlando, Society for Computer Simulation International, San Diego, pp. 119-128.
[30] Williams, E. J., Orlando, D. E., 1998, “Simulation applied to final engine drop assembly“, Proc. of the 30. Conference on Winter Simulation, Washington, ed by Medeiros, D. J., Watson, E. F., Carson, J. S., Manivannan, M. S., IEEE Computer Society Press, Los Alamitos, pp. 943-950.

[31] Wood, D., Harger, E. A., 2003, “Simulation in automotive industries: reducing human error in simulation in General Motors”, Proc. of the 35. Conference on Winter Simulation: Driving innovation, New Orleans, pp. 1199-1203.
[32] Zufferey, G., Jermann, P., Lucchi, A., and Dillenbourg, P., 2009, “TinkerSheets: Using Paper Forms to Control and Visualize Tangible Simulations“, Proc. of the 3. International Conference on Tangible and Embedded Interaction, pp. 377 – 384.