Embed Size (px)
Citation preview
*For correspondence: jan.
Competing interests: The
authors declare that no
competing interests exist.
Funding: See page 19
Received: 03 November 2016
Accepted: 18 April 2017
Published: 02 May 2017
Reviewing editor: Wenying
Shou, Fred Hutchinson Cancer
Research Center, United States
Copyright Swings et al. This
article is distributed under the
terms of the Creative Commons
Attribution License, which
permits unrestricted use and
redistribution provided that the
original author and source are
credited.
Adaptive tuning of mutation rates allowsfast response to lethal stress inEscherichia coliToon Swings1, Bram Van den Bergh1, Sander Wuyts1, Eline Oeyen1,Karin Voordeckers1,2, Kevin J Verstrepen1,2, Maarten Fauvart1,3,Natalie Verstraeten1, Jan Michiels1*
1Centre of Microbial and Plant Genetics, KU Leuven - University of Leuven, Leuven,Belgium; 2VIB Laboratory for Genetics and Genomics, Vlaams Instituut voorBiotechnologie, Leuven, Belgium; 3Smart Systems and Emerging Technologies Unit,Imec (Interuniversity Micro-Electronics Centre), Leuven, Belgium
Abstract While specific mutations allow organisms to adapt to stressful environments, most
changes in an organism’s DNA negatively impact fitness. The mutation rate is therefore strictly
regulated and often considered a slowly-evolving parameter. In contrast, we demonstrate an
unexpected flexibility in cellular mutation rates as a response to changes in selective pressure. We
show that hypermutation independently evolves when different Escherichia coli cultures adapt to
high ethanol stress. Furthermore, hypermutator states are transitory and repeatedly alternate with
decreases in mutation rate. Specifically, population mutation rates rise when cells experience
higher stress and decline again once cells are adapted. Interestingly, we identified cellular mortality
as the major force driving the quick evolution of mutation rates. Together, these findings show how
organisms balance robustness and evolvability and help explain the prevalence of hypermutation in
various settings, ranging from emergence of antibiotic resistance in microbes to cancer relapses
upon chemotherapy.
DOI: 10.7554/eLife.22939.001
IntroductionTheory predicts that the optimal mutation rate depends on several different factors, including
genome size and effective population size. For example, unicellular organisms, such as viruses and
bacteria, exhibit per-base mutation rates that are inversely correlated with their population and
genome sizes, whereas multicellular organisms with much larger genomes and smaller effective pop-
ulation sizes may have higher per-base mutation rates (Lynch, 2010; Lynch et al., 2016). While
mutations are necessary to adapt to new and stressful environments (Barrick and Lenski, 2013;
Wiser et al., 2013), random changes in an organism’s DNA are rarely beneficial, but more often
neutral or slightly deleterious (Elena and Lenski, 2003a; Perfeito et al., 2007; Eyre-Walker and
Keightley, 2007). Consequently, mutation rates are strictly balanced by the trade-off between the
need for mutations to adapt and the concomitant increase in genetic load (Sniegowski and Raynes,
2013; Lynch, 2011; Wielgoss et al., 2013; Desai and Fisher, 2011). This trade-off between adapt-
ability and adaptedness is believed to be responsible for the low genomic mutation rates usually
observed in organisms, while a further decrease in mutation rate is restricted by the energy needed
to increase and maintain high replication fidelity (de Visser, 2002; Sung et al., 2016;
Sniegowski et al., 2000; Ram and Hadany, 2014). Furthermore, the power of random drift will limit
selection on even lower mutation rates when additional increases in replication fidelity are
Swings et al. eLife 2017;6:e22939. DOI: 10.7554/eLife.22939 1 of 24
RESEARCH ARTICLE
insufficiently advantageous. Due to this drift-barrier, mutation rates are believed to evolve to an
equilibrium where the strength of selection matches the power of drift (Lynch et al., 2016).
An organism’s cellular mutation rate is generally considered to be near-constant (Lynch, 2010;
Drake, 1991), yet the optimal mutation rate has been reported to depend on the environment
(Elena and de Visser, 2003b; Rando and Verstrepen, 2007). Wild-type bacteria grown under opti-
mal conditions typically have low mutation rates in the order of 10�3 mutations per genome per gen-
eration (Lee et al., 2012; Drake et al., 1998). Under these conditions, hypermutators with weakly
(10-fold) or strongly (100–10.000-fold) increased mutation rates occur only sporadically (de Visser,
2002; Marinus, 2010). Despite low frequencies of hypermutators in laboratory populations
(Boe et al., 2000), a much higher prevalence is observed in natural bacterial populations (Gross and
Siegel, 1981; Hall and Henderson-Begg, 2006), such as clinical isolates of pathogenic E. coli
(Matic et al., 1997; Denamur et al., 2002; LeClerc et al., 1996), Pseudomonas aeruginosa
(Marvig et al., 2013, 2015; Oliver, 2015; Ferroni et al., 2009), Salmonella (LeClerc et al., 1996),
Staphylococcus aureus (Iguchi et al., 2016) among others (Negri et al., 2002; Gould et al., 2007;
Rajanna et al., 2013) and in nearly all A. baumannii strains adapting to severe tigecycline stress
(Hammerstrom et al., 2015). In addition, high frequency of hypermutation is also documented in
eukaryotic pathogens including the malaria-causing parasite Plasmodium falciparum (Lee and
Fidock, 2016; Gupta et al., 2016) and the fungal pathogen Candida glabrata (Healey et al., 2016).
Moreover, hypermutation plays an important role in cancer development and proliferation, as it
helps to overcome different barriers to tumor progression (Wang et al., 2016; Bielas et al., 2006;
Roberts and Gordenin, 2014). These observations suggest the natural occurrence of situations in
which higher mutation rates confer a selectable advantage. This is especially obvious in harsh envi-
ronments, where near-lethal stress requires swift adaptation of at least some individuals to avoid
complete extinction of the population (Bell and Gonzalez, 2011). Adaptation sufficiently rapid to
save a population from extinction is called evolutionary rescue. This phenomenon is widely studied
eLife digest A cell’s DNA can acquire errors over the course of its lifetime. These errors, known
as mutations, are often harmful and can cripple the cell. However, some mutations are needed to
enable a cell or organism to adapt to changes in its environment. Since there is a trade-off between
acquiring beneficial mutations versus harmful ones, cells carefully balance how often they acquire
new mutations.
Cells have several mechanisms that limit the number of mutations by correcting errors in DNA.
Occasionally these repair mechanisms may fail so that a small number of cells in a population
accumulate mutations more quickly than other cells. This process is known as “hypermutation” and
it enables some cells to rapidly adapt to changing conditions in order to avoid the entire population
from becoming extinct.
So far, studies on hypermutation have largely been carried out under conditions that are mildly
stressful to the cells, which only cause low frequency of hypermutation. However, little is known
about the role of this process in cells under near-lethal levels of stress, for example, when drugs
target bacteria or cancer cells in the human body.
Swings et al. studied hypermutation in populations of a bacterium called Escherichia coli exposed
to levels of alcohol that cause the bacteria to experience extreme stress. The experiments show that
hypermutation occurs rapidly in these conditions and is essential for bacteria to adapt to the level of
alcohol and avoid extinction. Populations of bacteria in which hypermutation did not occur were
unable to develop tolerance to the alcohol and perished. Further experiments show that an
individual population of bacteria can alter the rate of mutation (that is, how often new mutations
arise) several times as a result of changing stress levels.
The findings of Swings et al. suggest that hypermutation can rapidly arise in populations of cells
that are experiencing extreme stress. Therefore, this process may pose a serious risk in the
development of drug resistant bacteria and cancer cells. In the future, developing new drugs that
target hypermutation may help to fight bacterial infections and cancer.
DOI: 10.7554/eLife.22939.002
Swings et al. eLife 2017;6:e22939. DOI: 10.7554/eLife.22939 2 of 24
Research article Genomics and Evolutionary Biology Microbiology and Infectious Disease
in the light of climate change and adaptation of declining populations to new environments
(Lindsey et al., 2013). It occurs when a population under stress lacks sufficient phenotypic plasticity
and can only avoid extinction through genetic change (Gonzalez et al., 2013). Evolutionary rescue
depends on different factors such as the population size, genome size, mutation rate, degree of
environmental change and history of the stress (Gonzalez et al., 2013; Gonzalez and Bell, 2013).
By increasing the supply of mutations, hypermutation might also be crucial to enable evolutionary
rescue for populations under near-lethal stress.
Despite the high prevalence of hypermutation in clinical settings, current knowledge is lacking on
the long-term fate of mutators and their specific role in survival under near-lethal stress conditions.
Previous studies exploring the costs and benefits of mutators mostly focused on mild stresses. Both
experimental evidence and theory show that mutators can readily increase in frequency in a popula-
tion through second-order selection. In this case, a mutator hitchhikes along with a sporadically
occurring, beneficial mutation that thrives under natural selection (Gentile et al., 2011;
Woods et al., 2011; Giraud et al., 2001; Shaver et al., 2002; Mao et al., 1997; Sniegowski et al.,
1997). This process relies on different elements, such as initial mutator frequency (Tenaillon et al.,
1999), the relative timing of the emergence of one or multiple beneficial mutations (Tanaka et al.,
2003), the degree of environmental change or selection strength (Mao et al., 1997; Pal et al.,
2007), the mutational spectrum (Couce et al., 2013) and the strength of the specific mutator
(Loh et al., 2010). Although hypermutation can readily spread in a population by means of hitchhik-
ing when adaptation is required, long-term evolution experiments also show selection against hyper-
mutation (Lynch, 2011; Trobner and Piechocki, 1984). These results demonstrate that the actual
mutation rate of a population is prone to change by evolution. However, our current knowledge on
the long-term dynamics of hypermutation and the mechanisms underlying changes in mutation rate
remains fragmentary. Specifically, conditions under which the spread of mutators is inhibited or the
increased mutation rate is reversed, remain largely unexplored (Raynes and Sniegowski, 2014).
The aim of the current study was to better understand the dynamics of hypermutation under
near-lethal, complex stress. Therefore, we used E. coli exposed to high ethanol stress as a model
system (Goodarzi et al., 2010; Nicolaou et al., 2012). Here, multiple mutations epistatically interact
and diverse evolutionary trajectories can lead to adaptation to high ethanol concentrations
(Voordeckers et al., 2015). In our study, we found an unexpected flexibility in cellular mutation
rates as a response to changes in selective pressure. First, we used a defined collection of mutators
with distinct mutation rates to identify a range of optimal mutation rates to enable rapid growth
under high ethanol stress. Next, experimental evolution revealed an essential role for hypermutation
for de novo adaptation to high ethanol stress. While hypermutation quickly and recurrently arose
concurrent with increases in ethanol concentrations, mutation rates rapidly declined again once cells
were adapted to the stress. Interestingly, we identified cellular mortality as the major force that
drives fast evolution of mutation rates. In summary, our results shed new light on the dynamics of
mutation rate evolution and help explain why maintaining high mutation rates is limited in time.
Results
Hypermutation enables rapid growth under high ethanol stressLittle is known on the role of hypermutators under complex, near-lethal stress conditions. In these
conditions, growth rates are low and the probability to accumulate an adaptive mutation is strongly
limited. We postulate that mutator mutants yield variable benefits under these conditions, depend-
ing on their mutation rates. To verify this hypothesis, a collection of E. coli mutants displaying a
range of mutation rates (Figure 1—figure supplement 1) was grown in 5% EtOH. At this concentra-
tion, ethanol almost completely inhibits growth and drastically reduces the carrying capacity of a
wild-type culture, indicating extreme stress (Figure 1—figure supplement 2).
Growth rate and lag time reflect the fitness of a strain in a specific environment
(Stepanyan et al., 2015; Hammerschmidt et al., 2014). These growth parameters are contingent
upon the initial population size. On the one hand, the effect of a rare beneficial mutation on growth
rate and lag time is mitigated by a large initial population size (Mao et al., 1997). On the other
hand, the effect of a beneficial mutation on the growth dynamics is amplified by a small initial popu-
lation size, as this limits the generation of beneficial mutants. Therefore, we tested growth of wild-
Swings et al. eLife 2017;6:e22939. DOI: 10.7554/eLife.22939 3 of 24
Research article Genomics and Evolutionary Biology Microbiology and Infectious Disease
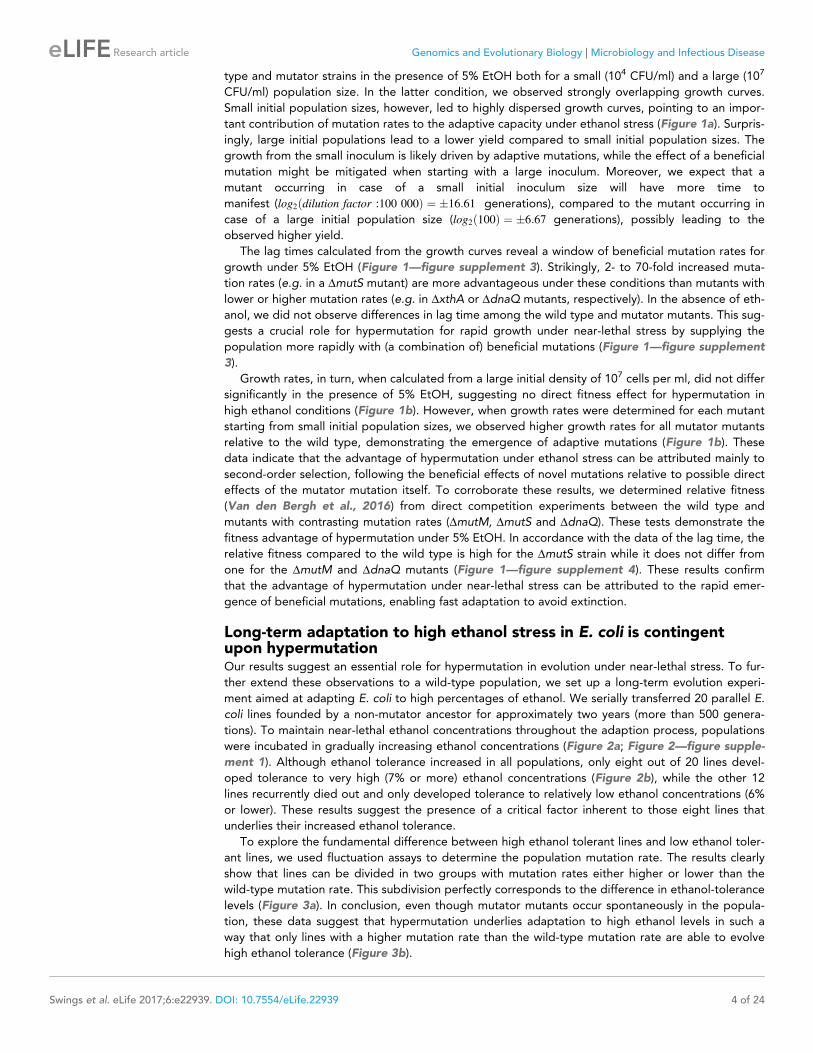
type and mutator strains in the presence of 5% EtOH both for a small (104 CFU/ml) and a large (107
CFU/ml) population size. In the latter condition, we observed strongly overlapping growth curves.
Small initial population sizes, however, led to highly dispersed growth curves, pointing to an impor-
tant contribution of mutation rates to the adaptive capacity under ethanol stress (Figure 1a). Surpris-
ingly, large initial populations lead to a lower yield compared to small initial population sizes. The
growth from the small inoculum is likely driven by adaptive mutations, while the effect of a beneficial
mutation might be mitigated when starting with a large inoculum. Moreover, we expect that a
mutant occurring in case of a small initial inoculum size will have more time to
manifest (log2 dilution factor :100 000ð Þ ¼ �16:61 generations), compared to the mutant occurring in
case of a large initial population size (log2 100ð Þ ¼ �6:67 generations), possibly leading to the
observed higher yield.
The lag times calculated from the growth curves reveal a window of beneficial mutation rates for
growth under 5% EtOH (Figure 1—figure supplement 3). Strikingly, 2- to 70-fold increased muta-
tion rates (e.g. in a DmutS mutant) are more advantageous under these conditions than mutants with
lower or higher mutation rates (e.g. in DxthA or DdnaQ mutants, respectively). In the absence of eth-
anol, we did not observe differences in lag time among the wild type and mutator mutants. This sug-
gests a crucial role for hypermutation for rapid growth under near-lethal stress by supplying the
population more rapidly with (a combination of) beneficial mutations (Figure 1—figure supplement
3).
Growth rates, in turn, when calculated from a large initial density of 107 cells per ml, did not differ
significantly in the presence of 5% EtOH, suggesting no direct fitness effect for hypermutation in
high ethanol conditions (Figure 1b). However, when growth rates were determined for each mutant
starting from small initial population sizes, we observed higher growth rates for all mutator mutants
relative to the wild type, demonstrating the emergence of adaptive mutations (Figure 1b). These
data indicate that the advantage of hypermutation under ethanol stress can be attributed mainly to
second-order selection, following the beneficial effects of novel mutations relative to possible direct
effects of the mutator mutation itself. To corroborate these results, we determined relative fitness
(Van den Bergh et al., 2016) from direct competition experiments between the wild type and
mutants with contrasting mutation rates (DmutM, DmutS and DdnaQ). These tests demonstrate the
fitness advantage of hypermutation under 5% EtOH. In accordance with the data of the lag time, the
relative fitness compared to the wild type is high for the DmutS strain while it does not differ from
one for the DmutM and DdnaQ mutants (Figure 1—figure supplement 4). These results confirm
that the advantage of hypermutation under near-lethal stress can be attributed to the rapid emer-
gence of beneficial mutations, enabling fast adaptation to avoid extinction.
Long-term adaptation to high ethanol stress in E. coli is contingentupon hypermutationOur results suggest an essential role for hypermutation in evolution under near-lethal stress. To fur-
ther extend these observations to a wild-type population, we set up a long-term evolution experi-
ment aimed at adapting E. coli to high percentages of ethanol. We serially transferred 20 parallel E.
coli lines founded by a non-mutator ancestor for approximately two years (more than 500 genera-
tions). To maintain near-lethal ethanol concentrations throughout the adaption process, populations
were incubated in gradually increasing ethanol concentrations (Figure 2a; Figure 2—figure supple-
ment 1). Although ethanol tolerance increased in all populations, only eight out of 20 lines devel-
oped tolerance to very high (7% or more) ethanol concentrations (Figure 2b), while the other 12
lines recurrently died out and only developed tolerance to relatively low ethanol concentrations (6%
or lower). These results suggest the presence of a critical factor inherent to those eight lines that
underlies their increased ethanol tolerance.
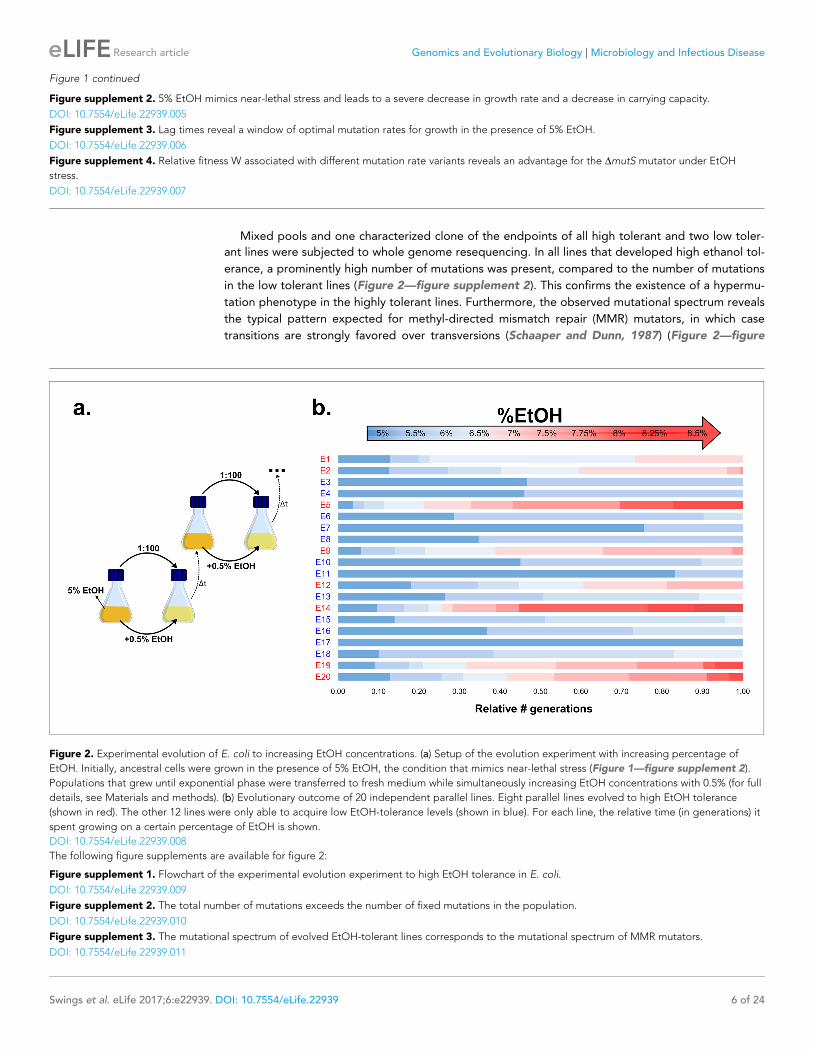
To explore the fundamental difference between high ethanol tolerant lines and low ethanol toler-
ant lines, we used fluctuation assays to determine the population mutation rate. The results clearly
show that lines can be divided in two groups with mutation rates either higher or lower than the
wild-type mutation rate. This subdivision perfectly corresponds to the difference in ethanol-tolerance
levels (Figure 3a). In conclusion, even though mutator mutants occur spontaneously in the popula-
tion, these data suggest that hypermutation underlies adaptation to high ethanol levels in such a
way that only lines with a higher mutation rate than the wild-type mutation rate are able to evolve
high ethanol tolerance (Figure 3b).
Swings et al. eLife 2017;6:e22939. DOI: 10.7554/eLife.22939 4 of 24
Research article Genomics and Evolutionary Biology Microbiology and Infectious Disease
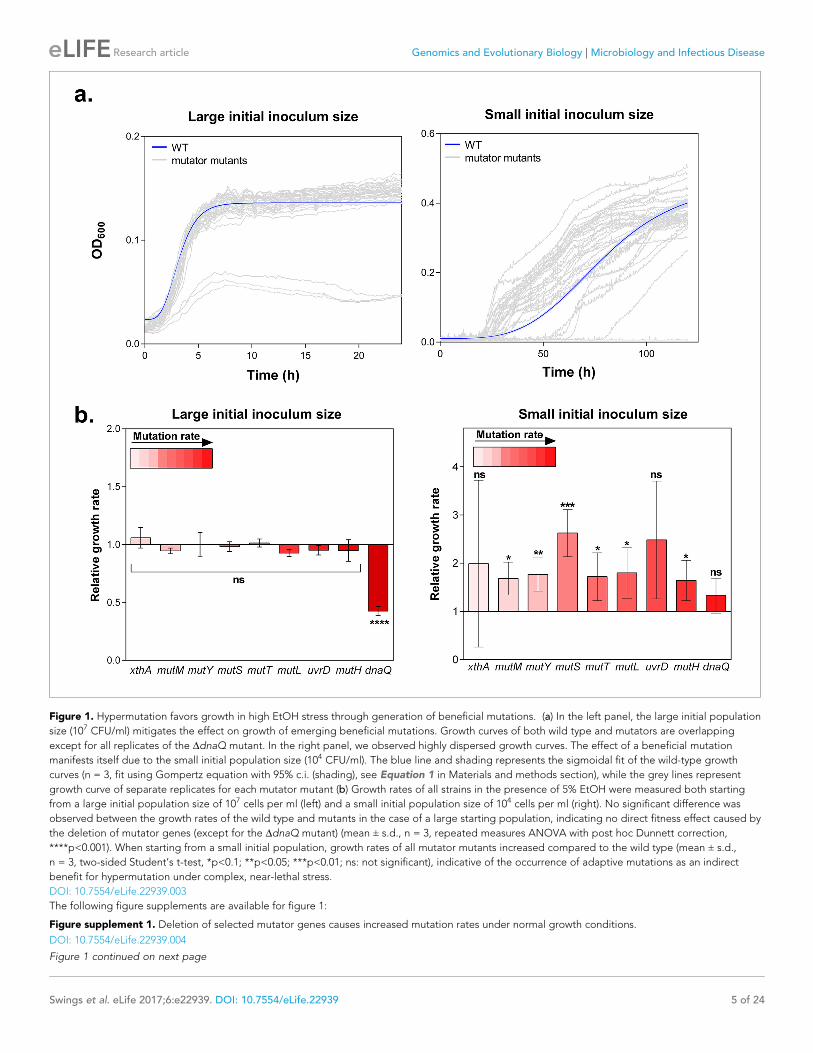
Figure 1. Hypermutation favors growth in high EtOH stress through generation of beneficial mutations. (a) In the left panel, the large initial population
size (107 CFU/ml) mitigates the effect on growth of emerging beneficial mutations. Growth curves of both wild type and mutators are overlapping
except for all replicates of the DdnaQ mutant. In the right panel, we observed highly dispersed growth curves. The effect of a beneficial mutation
manifests itself due to the small initial population size (104 CFU/ml). The blue line and shading represents the sigmoidal fit of the wild-type growth
curves (n = 3, fit using Gompertz equation with 95% c.i. (shading), see Equation 1 in Materials and methods section), while the grey lines represent
growth curve of separate replicates for each mutator mutant (b) Growth rates of all strains in the presence of 5% EtOH were measured both starting
from a large initial population size of 107 cells per ml (left) and a small initial population size of 104 cells per ml (right). No significant difference was
observed between the growth rates of the wild type and mutants in the case of a large starting population, indicating no direct fitness effect caused by
the deletion of mutator genes (except for the DdnaQ mutant) (mean ± s.d., n = 3, repeated measures ANOVA with post hoc Dunnett correction,
****p<0.001). When starting from a small initial population, growth rates of all mutator mutants increased compared to the wild type (mean ± s.d.,
n = 3, two-sided Student’s t-test, *p<0.1; **p<0.05; ***p<0.01; ns: not significant), indicative of the occurrence of adaptive mutations as an indirect
benefit for hypermutation under complex, near-lethal stress.
DOI: 10.7554/eLife.22939.003
The following figure supplements are available for figure 1:
Figure supplement 1. Deletion of selected mutator genes causes increased mutation rates under normal growth conditions.
DOI: 10.7554/eLife.22939.004
Figure 1 continued on next page
Swings et al. eLife 2017;6:e22939. DOI: 10.7554/eLife.22939 5 of 24
Research article Genomics and Evolutionary Biology Microbiology and Infectious Disease
Mixed pools and one characterized clone of the endpoints of all high tolerant and two low toler-
ant lines were subjected to whole genome resequencing. In all lines that developed high ethanol tol-
erance, a prominently high number of mutations was present, compared to the number of mutations
in the low tolerant lines (Figure 2—figure supplement 2). This confirms the existence of a hypermu-
tation phenotype in the highly tolerant lines. Furthermore, the observed mutational spectrum reveals
the typical pattern expected for methyl-directed mismatch repair (MMR) mutators, in which case
transitions are strongly favored over transversions (Schaaper and Dunn, 1987) (Figure 2—figure
Figure 1 continued
Figure supplement 2. 5% EtOH mimics near-lethal stress and leads to a severe decrease in growth rate and a decrease in carrying capacity.
DOI: 10.7554/eLife.22939.005
Figure supplement 3. Lag times reveal a window of optimal mutation rates for growth in the presence of 5% EtOH.
DOI: 10.7554/eLife.22939.006
Figure supplement 4. Relative fitness W associated with different mutation rate variants reveals an advantage for the DmutS mutator under EtOH
stress.
DOI: 10.7554/eLife.22939.007
Figure 2. Experimental evolution of E. coli to increasing EtOH concentrations. (a) Setup of the evolution experiment with increasing percentage of
EtOH. Initially, ancestral cells were grown in the presence of 5% EtOH, the condition that mimics near-lethal stress (Figure 1—figure supplement 2).
Populations that grew until exponential phase were transferred to fresh medium while simultaneously increasing EtOH concentrations with 0.5% (for full
details, see Materials and methods). (b) Evolutionary outcome of 20 independent parallel lines. Eight parallel lines evolved to high EtOH tolerance
(shown in red). The other 12 lines were only able to acquire low EtOH-tolerance levels (shown in blue). For each line, the relative time (in generations) it
spent growing on a certain percentage of EtOH is shown.
DOI: 10.7554/eLife.22939.008
The following figure supplements are available for figure 2:
Figure supplement 1. Flowchart of the experimental evolution experiment to high EtOH tolerance in E. coli.
DOI: 10.7554/eLife.22939.009
Figure supplement 2. The total number of mutations exceeds the number of fixed mutations in the population.
DOI: 10.7554/eLife.22939.010
Figure supplement 3. The mutational spectrum of evolved EtOH-tolerant lines corresponds to the mutational spectrum of MMR mutators.
DOI: 10.7554/eLife.22939.011
Swings et al. eLife 2017;6:e22939. DOI: 10.7554/eLife.22939 6 of 24
Research article Genomics and Evolutionary Biology Microbiology and Infectious Disease
supplement 3a). We therefore scanned the population sequence data for mutations in genes
involved in DNA replication and repair. We found different mutS mutations in six out of eight highly
ethanol-tolerant lines (lines E1, 3, 9, 12, 19 and 20). In the remaining highly tolerant lines E5 and
E14, as well as in E9, we found fixed mutations in mutL, while line E9 additionally acquired a muta-
tion in mutH, strongly suggesting a deficient MMR pathway (mutS,L,H) as the main cause of
increased mutation rates under near-lethal ethanol stress (Figure 2—figure supplement 3b). In
Figure 3. Increased mutation rate underlies evolution of high EtOH tolerance. (a) The population mutation rate of
parallel evolved lines relative to the wild type mutation rate is shown (mean ± 95% c.i., see
Materials and methods). Two different groups can clearly be distinguished according to the higher than wild-type (
) or lower than wild-type ( ) mutation rate. This subdivision is in accordance with the difference in endpoint
EtOH tolerance levels (Figure 2b). All mutation rates were significantly different from the wild type (p<0.001; two-
sided Student’s t-test on the absolute number of mutational events as calculated by FALCOR, assuming equal cell
densities [see Materials and methods]) (b) For correlation analysis, all parallel lines were subdivided in two groups
according to their higher or lower than wild type mutation rate. Spearman correlation analysis resulted in a highly
significant positive correlation (p<0.001). Lines with a mutation rate lower or equal than the wild-type mutation
rate are therefore correlated with lower ethanol tolerance, whereas lines with a higher mutation rate than the wild-
type mutation rate are correlated with high ethanol tolerance. In conclusion, these data suggest that
hypermutation is necessary for adaptation to high EtOH stress.
DOI: 10.7554/eLife.22939.012
Swings et al. eLife 2017;6:e22939. DOI: 10.7554/eLife.22939 7 of 24
Research article Genomics and Evolutionary Biology Microbiology and Infectious Disease
addition, mutations in other possible mutator genes (xthA, mutY and uvrD) appeared later on in evo-
lution (i.e. after the occurrence of the MMR mutations).
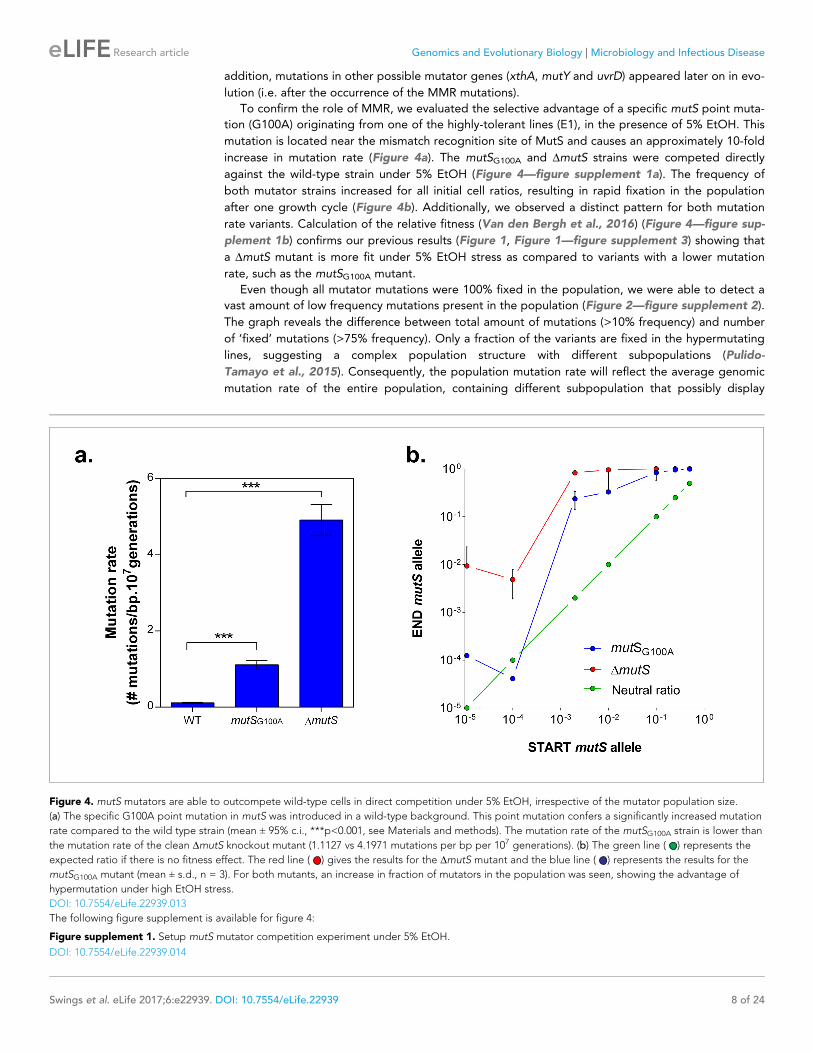
To confirm the role of MMR, we evaluated the selective advantage of a specific mutS point muta-
tion (G100A) originating from one of the highly-tolerant lines (E1), in the presence of 5% EtOH. This
mutation is located near the mismatch recognition site of MutS and causes an approximately 10-fold
increase in mutation rate (Figure 4a). The mutSG100A and DmutS strains were competed directly
against the wild-type strain under 5% EtOH (Figure 4—figure supplement 1a). The frequency of
both mutator strains increased for all initial cell ratios, resulting in rapid fixation in the population
after one growth cycle (Figure 4b). Additionally, we observed a distinct pattern for both mutation
rate variants. Calculation of the relative fitness (Van den Bergh et al., 2016) (Figure 4—figure sup-
plement 1b) confirms our previous results (Figure 1, Figure 1—figure supplement 3) showing that
a DmutS mutant is more fit under 5% EtOH stress as compared to variants with a lower mutation
rate, such as the mutSG100A mutant.
Even though all mutator mutations were 100% fixed in the population, we were able to detect a
vast amount of low frequency mutations present in the population (Figure 2—figure supplement 2).
The graph reveals the difference between total amount of mutations (>10% frequency) and number
of ‘fixed’ mutations (>75% frequency). Only a fraction of the variants are fixed in the hypermutating
lines, suggesting a complex population structure with different subpopulations (Pulido-
Tamayo et al., 2015). Consequently, the population mutation rate will reflect the average genomic
mutation rate of the entire population, containing different subpopulation that possibly display
Figure 4. mutS mutators are able to outcompete wild-type cells in direct competition under 5% EtOH, irrespective of the mutator population size.
(a) The specific G100A point mutation in mutS was introduced in a wild-type background. This point mutation confers a significantly increased mutation
rate compared to the wild type strain (mean ± 95% c.i., ***p<0.001, see Materials and methods). The mutation rate of the mutSG100A strain is lower than
the mutation rate of the clean DmutS knockout mutant (1.1127 vs 4.1971 mutations per bp per 107 generations). (b) The green line ( ) represents the
expected ratio if there is no fitness effect. The red line ( ) gives the results for the DmutS mutant and the blue line ( ) represents the results for the
mutSG100A mutant (mean ± s.d., n = 3). For both mutants, an increase in fraction of mutators in the population was seen, showing the advantage of
hypermutation under high EtOH stress.
DOI: 10.7554/eLife.22939.013
The following figure supplement is available for figure 4:
Figure supplement 1. Setup mutS mutator competition experiment under 5% EtOH.
DOI: 10.7554/eLife.22939.014
Swings et al. eLife 2017;6:e22939. DOI: 10.7554/eLife.22939 8 of 24
Research article Genomics and Evolutionary Biology Microbiology and Infectious Disease
above- or below-average mutation rates. This may already explain the discrepancy between the 20-
fold increased endpoint mutation rate of line E1 (Figure 3a) and the 10-fold increased clonal muta-
tion rate caused by the mutSG100A mutation identified in that same line (Figure 4a). Furthermore,
these data suggest that mutation rate can vary along with population structure throughout the evo-
lution rather than being a fixed rate after the occurrence and spread of one mutator mutation.
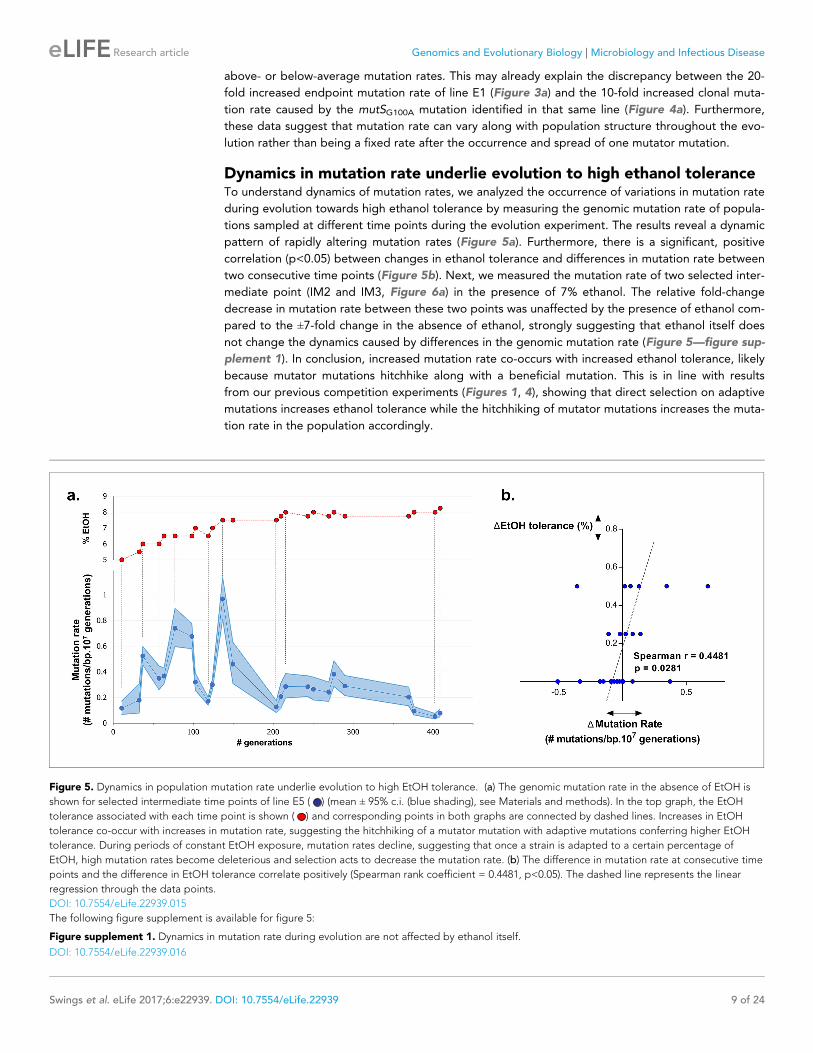
Dynamics in mutation rate underlie evolution to high ethanol toleranceTo understand dynamics of mutation rates, we analyzed the occurrence of variations in mutation rate
during evolution towards high ethanol tolerance by measuring the genomic mutation rate of popula-
tions sampled at different time points during the evolution experiment. The results reveal a dynamic
pattern of rapidly altering mutation rates (Figure 5a). Furthermore, there is a significant, positive
correlation (p<0.05) between changes in ethanol tolerance and differences in mutation rate between
two consecutive time points (Figure 5b). Next, we measured the mutation rate of two selected inter-
mediate point (IM2 and IM3, Figure 6a) in the presence of 7% ethanol. The relative fold-change
decrease in mutation rate between these two points was unaffected by the presence of ethanol com-
pared to the ±7-fold change in the absence of ethanol, strongly suggesting that ethanol itself does
not change the dynamics caused by differences in the genomic mutation rate (Figure 5—figure sup-
plement 1). In conclusion, increased mutation rate co-occurs with increased ethanol tolerance, likely
because mutator mutations hitchhike along with a beneficial mutation. This is in line with results
from our previous competition experiments (Figures 1, 4), showing that direct selection on adaptive
mutations increases ethanol tolerance while the hitchhiking of mutator mutations increases the muta-
tion rate in the population accordingly.
Figure 5. Dynamics in population mutation rate underlie evolution to high EtOH tolerance. (a) The genomic mutation rate in the absence of EtOH is
shown for selected intermediate time points of line E5 ( ) (mean ± 95% c.i. (blue shading), see Materials and methods). In the top graph, the EtOH
tolerance associated with each time point is shown ( ) and corresponding points in both graphs are connected by dashed lines. Increases in EtOH
tolerance co-occur with increases in mutation rate, suggesting the hitchhiking of a mutator mutation with adaptive mutations conferring higher EtOH
tolerance. During periods of constant EtOH exposure, mutation rates decline, suggesting that once a strain is adapted to a certain percentage of
EtOH, high mutation rates become deleterious and selection acts to decrease the mutation rate. (b) The difference in mutation rate at consecutive time
points and the difference in EtOH tolerance correlate positively (Spearman rank coefficient = 0.4481, p<0.05). The dashed line represents the linear
regression through the data points.
DOI: 10.7554/eLife.22939.015
The following figure supplement is available for figure 5:
Figure supplement 1. Dynamics in mutation rate during evolution are not affected by ethanol itself.
DOI: 10.7554/eLife.22939.016
Swings et al. eLife 2017;6:e22939. DOI: 10.7554/eLife.22939 9 of 24
Research article Genomics and Evolutionary Biology Microbiology and Infectious Disease
Cellular mortality is the underlying force driving evolution of mutationratesRemarkably, the mutation rate decreases quickly in the long-term evolution experiment during peri-
ods when the concentration of ethanol is kept constant (Figure 5a). This fast decrease can either be
explained by reversion of mutator mutations or by the accumulation of compensatory suppressor
mutations (Wielgoss et al., 2013). We tested the former by targeted sequencing of the mutations
that were acquired in the MMR genes in intermediate points before and after the decrease in muta-
tion rate. No such reversions of mutator mutations were found. These results therefore suggest that
suppressor mutations have accumulated in the ethanol-tolerant mutator lines. To unravel the benefit
of a lower mutation rate and the cost of hypermutation when high ethanol tolerance is reached and
thus selective pressure for ethanol tolerance is not further increased, we selected intermediate time
points (IM1, IM2 and IM3) with contrasting mutation rates (Figure 6a). These intermediate points
were used to determine cell viability under high ethanol stress and to extract relevant growth param-
eters by fitting a bacterial growth equation to the growth dynamics (See Materials and methods).
Cell death was determined both by quantifying viable cells and by live-dead staining. Surprisingly,
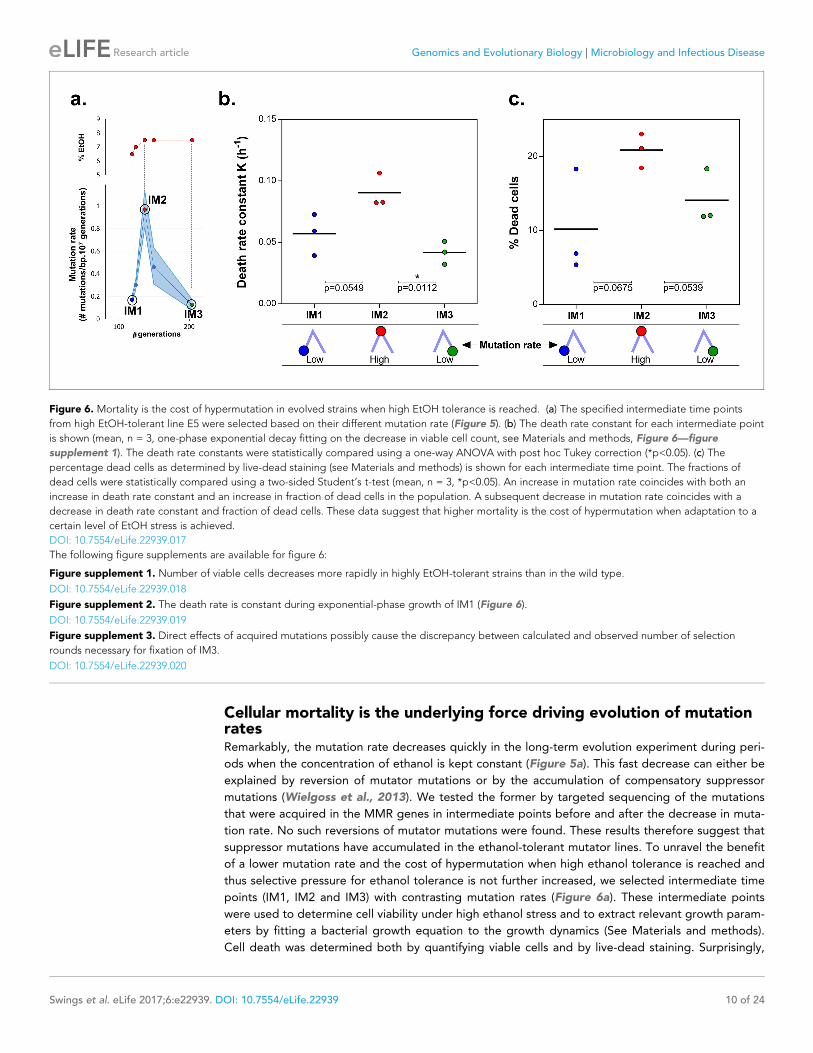
Figure 6. Mortality is the cost of hypermutation in evolved strains when high EtOH tolerance is reached. (a) The specified intermediate time points
from high EtOH-tolerant line E5 were selected based on their different mutation rate (Figure 5). (b) The death rate constant for each intermediate point
is shown (mean, n = 3, one-phase exponential decay fitting on the decrease in viable cell count, see Materials and methods, Figure 6—figure
supplement 1). The death rate constants were statistically compared using a one-way ANOVA with post hoc Tukey correction (*p<0.05). (c) The
percentage dead cells as determined by live-dead staining (see Materials and methods) is shown for each intermediate time point. The fractions of
dead cells were statistically compared using a two-sided Student’s t-test (mean, n = 3, *p<0.05). An increase in mutation rate coincides with both an
increase in death rate constant and an increase in fraction of dead cells in the population. A subsequent decrease in mutation rate coincides with a
decrease in death rate constant and fraction of dead cells. These data suggest that higher mortality is the cost of hypermutation when adaptation to a
certain level of EtOH stress is achieved.
DOI: 10.7554/eLife.22939.017
The following figure supplements are available for figure 6:
Figure supplement 1. Number of viable cells decreases more rapidly in highly EtOH-tolerant strains than in the wild type.
DOI: 10.7554/eLife.22939.018
Figure supplement 2. The death rate is constant during exponential-phase growth of IM1 (Figure 6).
DOI: 10.7554/eLife.22939.019
Figure supplement 3. Direct effects of acquired mutations possibly cause the discrepancy between calculated and observed number of selection
rounds necessary for fixation of IM3.
DOI: 10.7554/eLife.22939.020
Swings et al. eLife 2017;6:e22939. DOI: 10.7554/eLife.22939 10 of 24
Research article Genomics and Evolutionary Biology Microbiology and Infectious Disease
all tested intermediate points showed a very fast decrease in viable cell count when entering the sta-
tionary phase (Figure 6—figure supplement 1). This decrease in viable cells is explained by a genu-
ine increased death rate in the population since cells are in stationary phase. We fitted this decrease
in viable cells with an exponential decay function and extracted the death rate constant (See Meth-
ods). The fitting data demonstrate an association between an increase in mutation rate and an
increase in death rate constant (Figure 6b). In addition, death rates significantly decline as mutation
rates decrease. These results were confirmed by live-dead staining and subsequent flow cytometry
analysis (Figure 6c). Moreover, a constant death rate was measured throughout the growth cycle of
the strain (Figure 6—figure supplement 2). Intermediate evolved strains with increased ethanol tol-
erance are thus characterized by high death rates which are dependent on the mutation rates. Likely,
these strains have accumulated a high genetic load throughout the evolution experiment. Our data
now suggest that a further buildup of genetic load and a higher chance to acquire a lethal mutation
cause increased mortality, which results in a selective pressure per se. Strains with lower mutation
rates resulting from compensatory mutations can increase their fitness due to decreased death rates.
To corroborate these data, we used time to grow and optical density data from the initial evolution
experiment to calculate the relative fitness of IM3 (low mutation rate) compared to IM2 (high muta-
tion rate) in the presence of 7.5% ethanol. We used the relative fitness to calculate the theoretical
number of selection rounds necessary for IM3 to fix in a population of IM2 and compared it to the
actual number of selection rounds (Figure 6—figure supplement 3). The discrepancy between those
two values suggests that fixation happened faster than theoretically possible given the calculated
relative fitness. Additional mutations that occurred between IM2 and IM3 might affect the speed of
selection. Further buildup of genetic load and a continuous higher chance of acquiring a lethal muta-
tion, will speed up the elimination of the high mutation rate genotype (IM2) and enhance the fixation
rate of the low mutation rate genotype (IM3).
To confirm the role of cellular mortality as modulator of mutation rates, we selected an evolved
intermediate point of line E9, with a high mutation rate resulting from fixed MMR mutations (Fig-
ure 2—figure supplement 3). Next, we re-evolved this population for 150 generations on the same
percentage of ethanol, without further increasing this concentration when adaptation occurs, to
mimic and prolong plateau conditions experienced in the original evolution experiment. We
observed a fast decrease in population mutation rate (Figure 7a). Live-dead staining on both initial
and endpoints, shows a decrease in cellular mortality linked to the decrease in mutation rate
(Figure 7b). Further, we increased the mutation rate again by deleting the mutS gene (Figure 7c).
By monitoring the number of viable cells, we observed a much higher death rate for the strain with
increased mutation rate (END DmutS) (Figure 7d). Moreover, the strain with a low mutation rate rap-
idly outcompetes the DmutS strain in direct competition under 7% EtOH (Figure 7—figure supple-
ment 1). Again, we used the relative fitness to calculate the theoretical number of selection rounds
needed for the END strain to outcompete the END DmutS strain (Figure 7—figure supplement 2).
In contrast to Figure 6—figure supplement 3 the calculated rounds now correspond to the actual
observed rounds. Here, both strains are isogenic apart from the mutS deletion, so the fitness only
reflects the benefit of the anti-mutator (an intact mutS gene) that leads to a lower mutation rate and
lower mortality. In summary, these results show that mutation rate and mortality are crucial factors
to explain the fast increase of genotypes with a low mutation rate and mortality when the strain is
already adapted to the environment.
DiscussionBy using experimental evolution, we observed rapid emergence of hypermutation during de novo
adaptation to near-lethal ethanol stress. While mutators only sporadically occur in laboratory evolu-
tion experiments using mild stress conditions (Sniegowski et al., 1997; Barrick et al., 2009;
Sandberg et al., 2014), all highly ethanol-tolerant lines in our study acquired a hypermutation phe-
notype. We provide evidence that lethal environments trigger a shift in the optimal balance between
keeping a constant genetic load and mutational supply towards a higher supply rate. Despite the
burden of additional, possibly lethal mutations, the increased mutational supply enables fast adapta-
tion of at least some individuals and rescues the population from extinction (Bell and Gonzalez,
2011; Lindsey et al., 2013; Gonzalez et al., 2013; Gonzalez and Bell, 2013). Unexpectedly, by
measuring the mutation rate at different time points during evolution, we found a highly dynamic
Swings et al. eLife 2017;6:e22939. DOI: 10.7554/eLife.22939 11 of 24
Research article Genomics and Evolutionary Biology Microbiology and Infectious Disease
mutation rate that recurrently increases as a response to enhanced ethanol pressure and decreases
again once cells are adapted to the stress.
The rise of hypermutation during adaptation to near-lethal ethanol stress is possibly linked to the
idea of second-order selection as suggested by the growth rate and lag time measured for a
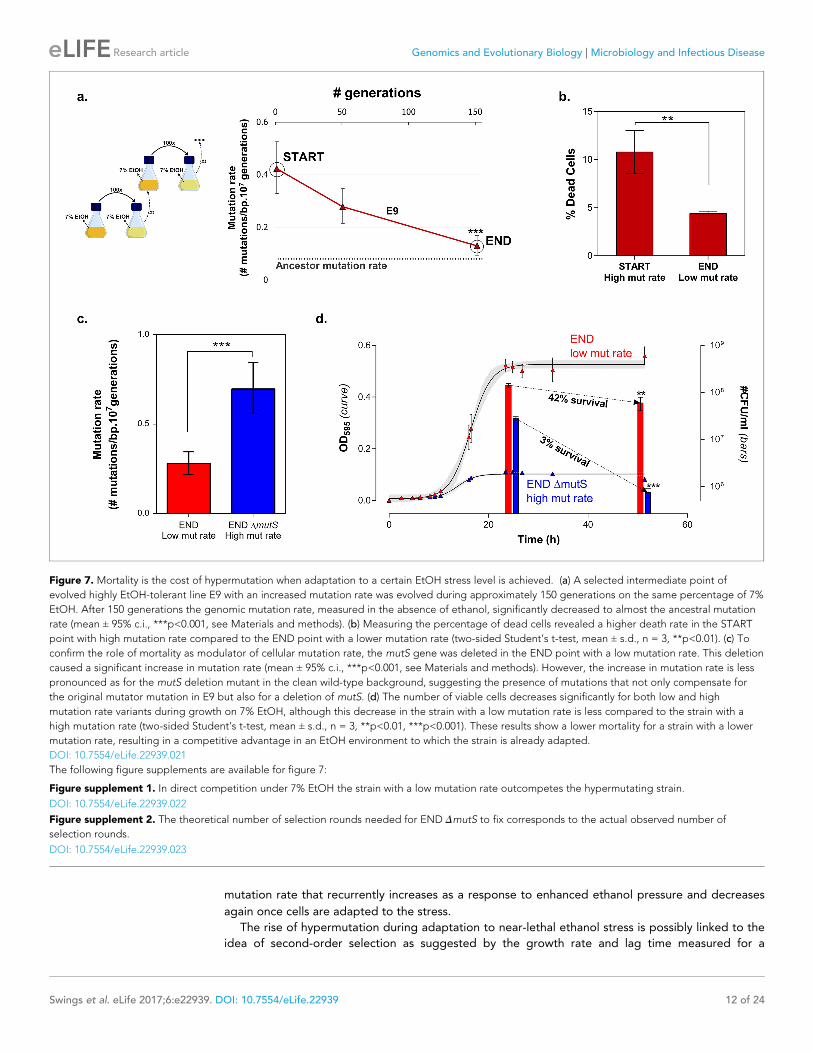
Figure 7. Mortality is the cost of hypermutation when adaptation to a certain EtOH stress level is achieved. (a) A selected intermediate point of
evolved highly EtOH-tolerant line E9 with an increased mutation rate was evolved during approximately 150 generations on the same percentage of 7%
EtOH. After 150 generations the genomic mutation rate, measured in the absence of ethanol, significantly decreased to almost the ancestral mutation
rate (mean ± 95% c.i., ***p<0.001, see Materials and methods). (b) Measuring the percentage of dead cells revealed a higher death rate in the START
point with high mutation rate compared to the END point with a lower mutation rate (two-sided Student’s t-test, mean ± s.d., n = 3, **p<0.01). (c) To
confirm the role of mortality as modulator of cellular mutation rate, the mutS gene was deleted in the END point with a low mutation rate. This deletion
caused a significant increase in mutation rate (mean ± 95% c.i., ***p<0.001, see Materials and methods). However, the increase in mutation rate is less
pronounced as for the mutS deletion mutant in the clean wild-type background, suggesting the presence of mutations that not only compensate for
the original mutator mutation in E9 but also for a deletion of mutS. (d) The number of viable cells decreases significantly for both low and high
mutation rate variants during growth on 7% EtOH, although this decrease in the strain with a low mutation rate is less compared to the strain with a
high mutation rate (two-sided Student’s t-test, mean ± s.d., n = 3, **p<0.01, ***p<0.001). These results show a lower mortality for a strain with a lower
mutation rate, resulting in a competitive advantage in an EtOH environment to which the strain is already adapted.
DOI: 10.7554/eLife.22939.021
The following figure supplements are available for figure 7:
Figure supplement 1. In direct competition under 7% EtOH the strain with a low mutation rate outcompetes the hypermutating strain.
DOI: 10.7554/eLife.22939.022
Figure supplement 2. The theoretical number of selection rounds needed for END DmutS to fix corresponds to the actual observed number of
selection rounds.
DOI: 10.7554/eLife.22939.023
Swings et al. eLife 2017;6:e22939. DOI: 10.7554/eLife.22939 12 of 24
Research article Genomics and Evolutionary Biology Microbiology and Infectious Disease
collection of mutator mutants under 5% ethanol stress (Figure 1; Figure 1—figure supplement 3).
In addition, it has been reported previously that random occurrence of mutator mutations in the
population is facilitated by a wider and less deleterious-mutation-biased distribution of fitness
effects in changing environments (Hietpas et al., 2013). As a consequence of the lowered relative
mutational load, populations in harsh environments may thus consist of cells with various mutation
rates as they tolerate more hypermutators, possibly offering a valid additional explanation for the
increased mutation rate observed in the ethanol tolerant lines (Figure 3). However, we observed
that mutator mutations are fixed in the end point populations (Figure 2—figure supplement 3) and
that non-mutator lines are not able to adapt to high tolerance levels (Figure 3), rather pointing to
the former hypothesis of second-order selection or even a combination of the two explanations. In
this scenario, the initial emergence of mutators is facilitated in populations exposed to severe stress
(Hietpas et al., 2013) followed by hitchhiking of the mutator mutation along a physically linked
(combination of) beneficial mutation(s) where selection act on (Woods et al., 2011). Additionally,
this would mean that mutator mutations do not have a direct selective advantage themselves, but
instead are only beneficial through enabling rapid adaptation by increasing the mutational supply
rate. However, the following elements in our results might also suggest potential direct effects of
the mutator mutations. First, mainly point mutations were identified in the mismatch repair genes
(Figure 2—figure supplement 3) although inactivation of a gene is more likely to occur, given the
high competitive benefit of the DmutS strain compared to the mutSG100A strain in the presence of
5% ethanol (Figure 4—figure supplement 1). This would suggest selection of specific changes in
the mechanism of the mismatch repair pathway. Second, both the DmutS and the mutSG100A strains
still increase in frequency when competed against the wild type in a ratio of 1:1000 or lower (Fig-
ure 4). Given the 10- to 50-fold increased mutation rate, a mutator subpopulation at a ratio of
1:1000 or lower should be too small to have an increased chance of acquiring a beneficial mutation
compared to the wild-type subpopulation. These data suggest direct beneficial effects of MMR
mutations (Cooper et al., 2012; Torres-Barcelo et al., 2013; Nowosielska and Marinus, 2008)
that, combined with second-order selection, can explain our observations. In addition, we confirmed
that any increase in mutation rate, irrespective of the disrupted cellular system, can confer a selective
benefit. Therefore, these direct effects, which are usually the result of disruptions of one specific sys-
tem or even of one specific gene, may influence which specific mutator mutations eventually spread,
but will only have a limited effect on the initial selection of hypermutation compared to the direct
effect of linked beneficial mutations. However, at later stages these direct effects possibly affect the
fate of hypermutators by lowering the cost of the extended buildup of genetic load.
Surprisingly, in addition to the increase in mutation rate, we found that hypermutator states are
transitory and mutation rates decrease again once cells are adapted to the stressful environment.
Current knowledge of the mechanisms underlying these changes in mutation rate remains largely
fragmentary (Raynes and Sniegowski, 2014). In this study, we identified cellular mortality as major
modulator of the population mutation rate. A higher mutation rate is linked to a higher mortality,
probably due to the extended buildup of genetic load and increased probability of acquiring a lethal
mutation. However, mutation rate is not the only factor affecting the mortality. Some direct effects
of already accumulated mutations might explain the inconsistency between the 2-fold difference in
mortality between IM2 and IM3 with a 10-fold difference in mutation rate (Figure 6) and the more
than 10-fold difference in mortality between END and END DmutS with only a 2.5-fold difference in
mutation rate (Figure 7). Notwithstanding this non-linearity, differences in mortality confer a select-
able pressure that favors strains with lower mutation rates when cells are adapted to the environ-
ment. Selection of lower mutation rate genotypes that arise in an adapted population of high
mutation rate genotypes is probably enhanced by the faster decrease of the high mutation rate gen-
otypes compared to the low mutation rate genotypes due to their differences in mortality. There-
fore, these findings might explain the recurrent mutation rate alterations observed in our evolution
experiment. Nevertheless, the speed of mutation rate alterations clearly differs from an earlier
report, showing that a single gradual decrease in mutation rate, due to invasion of a mutY anti-muta-
tor in a mutT mutator line, occurred over a relatively long time span of at least 1000 generations
(Wielgoss et al., 2013). While it was difficult to observe fitness benefits of anti-mutators under these
less restrictive stress conditions, we here report the observation of much higher benefits under near-
lethal ethanol conditions, allowing rapid, mortality-driven changes of the mutation rate.
Swings et al. eLife 2017;6:e22939. DOI: 10.7554/eLife.22939 13 of 24
Research article Genomics and Evolutionary Biology Microbiology and Infectious Disease
Finally, by analyzing growth characteristics of a panel of mutators, we observed a range of muta-
tion rates enabling fast growth under near-lethal ethanol stress. These results substantiate the theo-
retical modelling work of Bjedov et al. that predicts the highest fixation probability for a 10- to 100-
fold increased mutation rate and decreasing fixation probabilities for weaker or stronger mutators
(Bjedov et al., 2003) (Figure 1—figure supplement 3). Furthermore, our work extends the findings
by Loh et al. showing that different PolA mutants with altered mutation rates predominate after
serial passage in a fluctuating environment (Loh et al., 2010). In contrast to this study, we used
genes of several distinct cellular pathways to enhance mutagenesis. That way, we were able to dem-
onstrate that even minor alterations in mutation rate, irrespective of the targeted cellular system,
can confer a competitive advantage under near-lethal, complex stress.
Both these observations corroborate the idea that moderate mutators will be more easily
selected for, because their benefit is higher than low mutation rate variants and their long-term cost
is lower than high mutation rate variants. The identification of mostly point mutations leading to
amino acid changes and not to nonsense mutations in the MMR genes during evolution similarly sug-
gests selection for mild increases in the mutation rate (such as shown for the mutSG100A mutant).
Interestingly, the occurrence of hypermutation under extreme stress is not only limited to prokar-
yotes, such as E. coli. Previously, hypermutators were also observed in S. cerevisiae during evolution
under ethanol stress (Voordeckers et al., 2015), in the malaria-causing parasite Plasmodium falcipa-
rum (Lee and Fidock, 2016; Gupta et al., 2016), the fungal pathogen Candida glabrata
(Healey et al., 2016) and in temozolomide-treated, relapsed glioblastoma tumors (Wang et al.,
2016). These examples demonstrate the relevance of hypermutation in eukaryotes exposed to
severe stress. However, the lower emergence of mutators compared to our study may be explained
by the ploidy of eukaryotic cells and their larger genetic arsenal (Thompson et al., 2006), which
allows for more alternative adaptive routes to cope with stress.
Even though we mainly focused on increased mutation rates in this study, the 12 slowly-mutating,
low ethanol tolerant lines might be an interesting starting point for further research. The lack of
hypermutation in these lines seems to impede further adaptation to high ethanol concentrations.
Sequence analysis of two of these lines revealed the presence of mutations in rpoZ (subunit of the
RNA polymerase) and infB (protein chain initiation factor) in lines E4 and E17, respectively. Since eth-
anol is toxic through its effect on transcription and translation (Haft et al., 2014), disruption of the
transcription or translation machinery due to these mutations might cause increased sensitivity to
higher ethanol levels. This would prevent further growth and the possibility of acquiring a mutator
allele or any other mutation. Although we have no evidence supporting that the rpoZ and infB muta-
tions are causal for the decreased mutation rate, these mutations are interesting and might explain
the lack in further adaptive improvement in lines E4 and E17 (Figure 3a).
In conclusion, while an organism’s mutation rate is generally considered a slowly-evolving param-
eter, we demonstrate an unexpected flexibility in cellular mutation rates matching changes in selec-
tive pressure to avoid extinction under near-lethal stress. Bacteria undergoing antibiotic treatment
or cancer cells exposed to chemotherapy are prime examples of cells exposed to stressful condi-
tions. Therefore, hypermutation should be considered a risk for both the development of multidrug
resistance in pathogenic bacteria (Hammerstrom et al., 2015; Jolivet-Gougeon et al., 2011; Blaz-
quez, 2003; Chopra et al., 2003) and cancer relapses as recently shown (Wang et al., 2016). Tar-
geting hypermutation could pave the way not only for the development of novel anti-cancer
therapies, but also for containing the spread of multidrug tolerant pathogens and even for the gen-
eration of robust, stress-resistant strains for use in various industrial processes.
Materials and methods
Bacterial strains and culture conditionsE. coli SX4, SX25, SX43 and SX43 Dvenus, all derived from BW25993 (Datsenko and Wanner, 2000),
were used in this study. SX4 is characterized by a genomic tsr-venus fusion inserted in the lacZ gene
under control of the lac-promoter (Yu et al., 2006). SX43 is a derivative of SX4 in which the kanamy-
cin-resistance cassette (KmR) was removed by Flp-mediated recombination (Van den Bergh et al.,
2016; Cherepanov and Wackernagel, 1995). The tsr-venus fusion results in a polarly localized fluo-
rescent Venus tag. E. coli SX25 expresses a genomic venus marker inserted in the lacZ gene under
Swings et al. eLife 2017;6:e22939. DOI: 10.7554/eLife.22939 14 of 24
Research article Genomics and Evolutionary Biology Microbiology and Infectious Disease
control of the lac-promoter (Yu et al., 2006). SX43 Dvenus is a non-fluorescent variant constructed
by P1vir transduction (Thierauf et al., 2009) using the lacI::KmR Keio mutant (Keio collection number
JW0336) (Van den Bergh et al., 2016; Baba et al., 2006) as donor. All strains were grown in an
orbital shaker at 200 rpm and 37˚C in liquid lysogeny broth (LB) medium or on LB agar plates.
Construction of deletion mutantsTarget genes to increase the genomic mutation rate were selected based on their various roles in
DNA replication and repair (Supplementary file 1A). Hypermutating variants of the ancestor were
generated by P1vir transduction (Thierauf et al., 2009) to the SX43 ancestor using the correspond-
ing Keio deletion mutants as donor strains (Baba et al., 2006) (RRID:SCR_002303). Transductants
were subsequently selected on kanamycin resistance. Correct deletion of the target genes in positive
colonies was confirmed by PCR (Supplementary file 1B). The mutS deletion was introduced using
the protocol described by Datsenko and Wanner (Datsenko and Wanner, 2000). In short, a kanamy-
cin-resistance cassette flanked by FRT sites was amplified from the pKD4 plasmid using primers with
homologous ends complementary to the flanking sequences of the mutS gene (Supplementary file
1B). This PCR product was electroporated in the ancestor in which the l-red genes for homologous
recombination were expressed from the pKD46 plasmid. Positive colonies were selected on kanamy-
cin resistance and correct deletion of the mutS gene was assessed by PCR.
Determination of near-lethal EtOH percentageTo assess the percentage of EtOH needed to expose cells to near-lethal stress, the growth dynamics
of wild-type E. coli in different levels (0–5% (v/v)) of EtOH were studied. Data were fitted to a Gom-
pertz equation for bacterial growth dynamics (see Equation 1) to extract relevant growth parame-
ters (Figure 1—figure supplement 2). 5% EtOH was considered a breakpoint concentration as an
abruptly increased doubling time and decreased carrying capacity is observed under these condi-
tions. To ensure the proper percentages of ethanol added to the medium we used the Alcolyser
beer analyzing system (Anton Paar GmbH, Austria).
Determination of lag time and growth rateLag times and growth rates of selected mutants were determined using the Bioscreen C system for
automated monitoring of microbial growth (Bioscreen C MBR, Oy Growth Curves AB Ltd., Finland)
(RRID:SCR_007172). Cells were grown in 10 � 10 well Honeycomb microplates with shaking at 37˚Cand optical density at A600nm was automatically measured every 15 min. Growth in each well was
monitored for five days. First, the optical density of each preculture was equalized to approximate
equal numbers of cells for all mutants. Next, dilution series were made ranging from 10�1 to 10�4.
To test the effect of different starting amounts of cells on the lag time in the presence of EtOH, 20
ml of each dilution was used to inoculate 180 ml of LB medium supplemented with 5% EtOH. These
dilutions correspond to the different inoculum sizes as shown in Figure 1 and Figure 1—figure sup-
plement 3. For every mutant all dilutions were tested in biological triplicate. Additionally, each well
was covered with 100 ml of mineral oil (BioReagent, Sigma-Aldrich, MO, USA) to prevent evaporation
of EtOH as previously described (Zaslaver et al., 2006). As previously shown (Kaplan et al., 2008;
Zaslaver et al., 2004; Ronen et al., 2002) mineral oil has no significant effect on growth or aeration.
Growth curves were fitted using the widely accepted Gompertz equation as previously described
(Zwietering et al., 1990). In this equation, y0 is the starting density, yM is the carrying capacity of
the population, SGR is the specific growth rate (h�1) and LT is the lag time (h). Log10 of the optical
density values (595 nm) were used to fit with this equation and subsequently extract all growth
parameters.
y xð Þ ¼ y0 þ yM � e�e
2:718�SGRyMð Þ� LT�xð Þþ1ð Þh i
(1)
Equation 1: Gompertz equation for fitting of bacterial growth dynamics.
Competition assayTo determine the relative fitness of a mutant compared to the wild type, we conducted direct com-
petition experiments. All mutator mutants carried the Venus fusion that could be detected by
Swings et al. eLife 2017;6:e22939. DOI: 10.7554/eLife.22939 15 of 24
Research article Genomics and Evolutionary Biology Microbiology and Infectious Disease
excitation at 530 nm, while the ancestor SX43 Dvenus was not fluorescent. The relative fitness of all
mutants was assayed in triplicate. Both non-fluorescent ancestor and fluorescent mutator mutants
were revived from a glycerol stock stored at �80˚C and grown overnight at 200 rpm and 37˚C.These overnight cultures were first diluted to an A595nm of 0.5 to obtain an equal cell quantity for all
cultures prior to the competition experiment. Next, equal amounts of ancestor and mutant were
diluted 1000x in 50 ml LB medium, containing 5% EtOH. To avoid EtOH evaporation, cultures were
grown in flaks with a rubber-sealed screw cap. To start the competition experiment with different
mutator versus ancestor ratios, corresponding amounts of both strains were mixed. The initial ratios
were verified by flow cytometry using a BD Influx cell sorter equipped with a 488 nm laser (200 mW)
and standard filter sets (530/40 nm for Venus detection). To assess relative fitness, mixed popula-
tions were incubated for 48 hr in the presence of 5% EtOH. Ratios of both ancestor and wild type
were subsequently determined by flow cytometry. For each sample at least 100.000 cells were
counted and each cell was tallied as ancestor or mutator based on their fluorescence intensity. Loss
of fluorescence in the mutator mutants was accounted for by measuring fluorescence and loss of
fluorescence in the individually grown ancestor and all mutator mutants. First, the fraction false posi-
tive non-fluorescent mutators was quantified for each mutant. This fraction was subsequently used
to correct the measured mutator versus wild type ratios to account for non-fluorescent mutators.
As the results of this test reflect ratios of ancestor and mutant in the population before and after
growth on 5% EtOH, the proportion of a less fit population is expected to decline relative to the
other. Therefore, we calculated the relative fitness, W, as previously described (Equation 2)
(Van den Bergh et al., 2016). This equation is based on a discrete time-recurrence equation that
describes the spread of mutant in a haploid population thereby defining relative fitness based on dif-
ferences in survival between two strains (Van den Bergh et al., 2016; Otto and Day, 2007). This
equation allows to calculate the relative fitness, WA, of a mutant A compared to its competitor,
based on the difference between the final detected proportion (Aend) and the initial proportion
(Astart) of the mutant in the population, given a certain number of selection rounds n. Significance of
difference from 1, where the mutant has no benefit over the wild type, was determined using a
repeated measures ANOVA with post hoc Dunnett correction. An F-test was used to assess the dif-
ference in variance between the groups that were statistically compared. In order to confirm marker
neutrality, we competed the fluorescent ancestor (SX43) and non-fluorescent ancestor (SX43 Dvenus)
against each other both in the absence and presence of EtOH. No significant difference from one
was observed using a one-sample Student’s t-test (data not shown). Additionally, the neutrality of
the Venus marker was already confirmed in a previous study (Van den Bergh et al., 2016).
WA ¼1
ð ð1�Aend Þ�AstartÞðAend�ð1�AstartÞ
h ið1nÞ
(2)
Equation 2: Relative fitness of mutant A compared to its competitor
Experimental evolutionThe 20 parallel populations of the evolution experiment originated from independent colonies of the
ancestral strains SX4 or SX25. Odd lines were founded by SX4, while even lines were founded by
SX25 to enable detection of cross-contamination between parallel lines. All strains were initially
grown in LB medium containing 5% EtOH. This percentage was found to mimic near-lethal stress
(Figure 1—figure supplement 2). The culture volume during the evolution experiment was 50 ml
and dilution was 100-fold at each transfer. Ethanol tolerance of a population was measured as the
ability to grow in liquid medium in the presence of a certain percentage of ethanol to an optical den-
sity of at least 0.2. Intermediate time points, sampled every transfer to fresh medium, were stored in
a �80˚ glycerol stock. Growth in exponential phase was maintained throughout the evolution experi-
ment to select for growth rate and lag time only and to minimize potential, unwanted effects and
genomic changes due to stress that would additionally be experienced by nutrient limitation. Two
different parameters were used to monitor the evolution of the independent lines. First, the optical
density was measured. A strain with an A595nm around 0.2 was assumed to be in exponential phase.
Second, the time needed for the strain to achieve exponential growth at an A595nm around 0.2 was
used to determine the degree of adaptation. When the population reached exponential growth
within 24 hr, we assumed it was fully adapted to a certain percentage of EtOH. We transferred the
Swings et al. eLife 2017;6:e22939. DOI: 10.7554/eLife.22939 16 of 24
Research article Genomics and Evolutionary Biology Microbiology and Infectious Disease
population to new LB medium containing 0.5% more EtOH than in the previous step. By increasing
the percentage of EtOH during the adaptation of the populations, the near-lethal stress was main-
tained. In later stages of the evolution experiment at very high EtOH concentrations of 7.5% or
more, an increase of 0.5% was found to be excessive. Therefore, we increased the percentage with
0.25% EtOH starting from 7.5% EtOH tolerance. If the strain needed more than 24 hr but less than
14 days to reach exponential growth, we assumed that it was not yet completely adapted to a cer-
tain concentration of EtOH. Therefore, we transferred the strain to new LB medium containing the
same percentage of EtOH as in the previous step. If the strain needed more than 14 days to grow,
we assumed this population died out. Therefore, we revived the previously stored time point and
used it to restart the evolving line in new LB medium with 0.5% EtOH less than the tolerance level of
this time point (Figure 2—figure supplement 1). The minimal optical density of 0.2 upon transfer
resulted in an average final cell density of 5.4 � 108 CFU/ml in a volume of 50 ml. For each passage,
we consequently transferred 500 ml or approximately 2.73 � 108 CFUs (N0). The average number of
generations (g) for each growth cycle, estimated based on the optical density reached upon transfer,
is 6.67. Taking these values together, we can calculate an estimated effective population size (Ne) of
1.82 � 109 using the formula (Lenski et al., 199191) Ne = gN0. Finally, the number of generations
are estimates calculated with a previously described equation, assuming equal growth of the entire
population based on optical density and time (Wiser et al., 2013) (Equation 3). In this equation
CFUi is the number of viable cells at the start of each cycle, while CFUe is the number of viable cells
at the end of each cycle and c is the total number of cycles. The number of viable cells was esti-
mated using optical density (A595nm) values. This calculation does not specifically take into account
the death rate of the cells. However, since the optical density reflects both living and death cells in
the culture, calculating the number of generations using the OD values is more accurate compared
to calculations based on CFU counts. Indeed, when using the viable cell count data of IM1, IM2 and
IM3 (Figure 5), we found a 1.27-fold (±0.29) underestimation of the number of generations when
using the number of viable cells as compared to using OD values.
X
n
c¼1
log2CFUe
CFUi
� �
(3)
Equation 3: Estimation of the number of generations per cycle based on the initial and final num-
ber of viable cells.
Fluctuation assayThe genomic mutation rate of strains of interest was estimated using a Luria-Delbruck fluctuation
assay. This assay is commonly used to determine the spontaneous mutation rate at different loci in
the genome, where mutations cause easily-scored phenotypic changes. Acquiring rifampicin resis-
tance through mutations in the rpoB gene was used as a measurable marker. This protocol was
adapted from the one described by Jeffrey Barrick (http://barricklab.org/twiki/bin/view/Lab/Proto-
colsFluctuationTests). The selected strains were revived from a glycerol stock stored at �80˚C and
grown overnight in an orbital shaker at 200 rpm and 37˚C. All strains were tested in at least two
independent biological replicates. The number of cells in each culture was determined using an opti-
cal density versus cell count standard curve and was subsequently equalized over all tested strains.
Next, the equalized cultures were diluted 100 times in fresh LB medium and grown in an orbital
shaker at 200 rpm and 37˚C for 2–3 hr until the optical density at 595 nm reached 0.2–0.4. At this
optical density the final cell density in solution did not exceed 2–4 � 108 CFU/ml. These precondi-
tioned strains were then diluted in LB medium to a density of 5000 cells per ml, which is denoted as
the master inoculum mix. The master inoculum mix was divided in replicate cultures of 200 ml in sep-
arate Eppendorf tubes or a 96-well plate. For each strain at least 30 replicate parallel cultures,
divided over minimum two biological repeats were used to determine the number of spontaneous
mutants. These cultures were grown for 24 hr and plated on LB agar supplemented with 100 mg/ml
rifampicin to determine the number of spontaneous mutants that arose during the growth period.
Additionally, for each biological repeat, at least four cultures were grown for 24 hr, diluted and
plated on LB agar to determine the total number of viable colonies. The colonies on the non-selec-
tive LB agar plates were counted after 24 hr, while colonies on the selective, rifampicin plates were
first counted after 48 hr and again after 72 hr. The number of mutants divided by the total number
Swings et al. eLife 2017;6:e22939. DOI: 10.7554/eLife.22939 17 of 24
Research article Genomics and Evolutionary Biology Microbiology and Infectious Disease
of cells gives a mutation rate estimate of the tested strain. The occurrence of rifampicin resistance
conferring mutations in the rpoB is extrapolated to estimate the global genomic mutation rate. In
recent years, many improvements were made to the statistical estimation of mutation rates based
on the number of mutants and the total number of cells. We used the Ma-Sandri-Sarkar Maximum
Likelihood Estimation method as implemented in the Fluctuation Analysis Calculator (FALCOR,
http://www.keshavsingh.org/protocols/FALCOR.html) (Hall et al., 2009). For the statistical analysis
on the mutation rate estimates, 95% confidence intervals, calculated by the FALCOR, were com-
pared. In the case of confidence interval overlap, mutation rates were statistically compared using a
two-sided Student’s t-test on the normally distributed absolute number of mutational event as calcu-
lated by FALCOR (Hall et al., 2009). To ensure correct comparison of the mutation rates, we verified
that the population densities at the time of plating on rifampicin did not differ significantly. If this
was not the case, the test was repeated. The statistical difference between the population densities
was measured using a one-way ANOVA with post-hoc Tukey correction. We found no significant dif-
ference for any intermediate point compared to the average density and to the density of the other
time points. We therefore avoid possible population density effects (Krasovec et al., 2014).
To study the change of mutation rates during adaptive evolution, we performed a correlation
analysis between the difference in mutation rate and the difference in EtOH tolerance at each time
point. Since EtOH tolerance during evolution only increases by 0.25% or 0.5%, we considered the
difference in EtOH tolerance as a discrete ordinal variable. Therefore, we used the non-parametric
Spearman method to determine the significance of the correlation between the difference in EtOH
and the difference in mutation rate between consecutive time-points (Graphpad Prism 6, CA, USA).
Whole-genome sequencing and identification of mutationsHigh-quality genomic DNA was isolated from overnight cultures of the ancestor and end points of
evolved lines (DNeasy Blood and Tissue kit, Qiagen). We isolated genomic DNA from both mixed
pools and one characterized clone of each high ethanol tolerant line and two low ethanol tolerant
lines. Both Figure 2—figure supplement 2 and Figure 2—figure supplement 3 represent the
results from the analysis of the pooled sequence data. Concentration and purity of the DNA
were determined using Nanodrop analysis (Thermo Fisher Scientific, MA, USA), gel electrophoresis
and Qubit analysis (Thermo Fisher Scientific). Libraries were prepared at GeneCore (EMBL,
Heidelberg, Germany) (RRID:SCR_004473) using the NEBNext kit with an average insert size of 200
bp. The DNA libraries were multiplexed and subjected to 100-cycle paired-end massive parallel
sequencing with the Illumina HiSeq2000 (RRID:SCR_010233) (GeneCore, EMBL,
Heidelberg, Germany). CLC Genomics Workbench version 7.6 (RRID:SCR_011853) (https://www.qia-
genbioinformatics.com) was used for analysis of the sequences. Following quality assessment of the
raw data, reads were trimmed using quality scores of the individual bases. The quality limit was set
to 0.01, and the maximum allowed number of ambiguous bases was set to 2. Reads shorter than 15
bases were discarded from the set. The trimmed reads were mapped (mismatch cost = 2; insertion
cost = 3; deletion cost = 3; length fraction = 0.8; similarity fraction = 0.8) to the E. coli MG1655 ref-
erence genome (NC_000913.1) using the CLC Assembly Cell 4.0 algorithm yielding an average cov-
erage of approximately 150x. Finally, mutations in all samples were detected using the CLC Fixed
Ploidy Variant Detector. To exclude mutations in the SX4 ancestor compared to the MG1655 refer-
ence genome, we compared the mutations of all evolved lines with the SX4 ancestor.
Mortality assayTo assess the rate at which cells die during growth, we made growth curves using optical density
measurements with concurrent viable cell determination. The ancestor and selected evolved inter-
mediate time points were directly inoculated from a frozen glycerol stock in 50 ml LB medium con-
taining no EtOH, 5% EtOH, or 6.5% EtOH. Each strain was tested in triplicate. All flasks were
subsequently grown at 200 rpm and at 37˚C. At 30 different time points during a 90 hr timespan the
optical density was measured and samples were taken for CFU determination. For each sample, a
dilution series was made and appropriate dilutions were plated on LB agar plates using an EddyJet2
spiral plater (IUL Instruments, Spain). Agar plates were grown 48 hr at 37˚C and the CFU/ml was
determined using the Flash and Go automatic colony counter (IUL Instruments). During growth, the
number of CFU/ml initially increases exponentially but then flattens and decreases again. The colony
Swings et al. eLife 2017;6:e22939. DOI: 10.7554/eLife.22939 18 of 24
Research article Genomics and Evolutionary Biology Microbiology and Infectious Disease
count data corresponding to the decrease in CFU/ml were fitted using an exponential decay function
(Equation 4) in GraphPad Prism 6. In this function, k is the death rate constant. For all samples, this
constant was determined. Statistical significance of the difference between the death rate constants
of two consecutive evolved time points was determined using a two-tailed Student’s t-test.
y¼ ymax � yminð Þ � e�k�x þ ymin (4)
Equation 4: Exponential decay function with k the decay constant
Live-dead stainingTo measure the amount of dead cells at a certain time point in a population we used the LIVE/DEAD
BacLight Bacterial viability kit (Thermo Fisher Scientific). The selected strains were revived from a fro-
zen glycerol stock and grown overnight in an orbital shaker at 200 rpm and 37˚C. Overnight cultures
were diluted to an A595nm of 0.5. Next, 1 ml propidiumiodide (20 mM, Thermo Fisher Scientific) per 1
ml diluted culture was added, vortexed to mix the propidiumiodide homogeneously and incubated
in the dark at room temperature for 10 min. Propidiumiodide can only penetrate the cell when the
membrane is disrupted, as is the case in dead cells, and can be detected by excitation at 620 nm.
Therefore, the amount of dead cells in a population could be determined by flow cytometry. All
strains were tested at least in triplicate. To measure the number of dead cells throughout the differ-
ent growth phases, the selected strain was inoculated at different time points ranging from 48 hr to
10 hr prior to flow cytometry analysis. The amount of dead cells was determined as previously
described. Statistical significance was determined using a two-sided Student’s t-test.
AcknowledgementsTS is a fellow of the Agency for Innovation by Science and Technology (IWT). The research was sup-
ported by the KU Leuven Research Council (PF/10/010; PF/10/07; IDO/09/010; IDO/13/008; CREA/
13/019; DBOF/12/035; DBOF/14/049), Interuniversity Attraction Poles-Belgian Science Policy Office
IAP-BELSPO) (IAP P7/28), ERC (241426), Human Frontier Science Program (HFSP) (RGP0050/2013),
FWO (G047112N, KAN2014 1.5.222.14), Flanders Institute for Biotechnology (VIB) and the European
Molecular Biology organization (EMBO). We thank S. Xie for providing the ancestor strains.
Additional information
Funding
Funder Grant reference number Author
Agentschap voor Innovatiedoor Wetenschap en Techno-logie
Strategic Basic ResearchFellowship,121525
Toon Swings
Fonds Wetenschappelijk On-derzoek
PostdoctoralFellowship,12O1917N
Bram Van den Bergh
Fonds Wetenschappelijk On-derzoek
PostdoctoralFellowship,1249117N
Karin Voordeckers
Onderzoeksraad, KU Leuven PF/10/010 Kevin J VerstrepenJan Michiels
H2020 European ResearchCouncil
241426 Kevin J Verstrepen
Human Frontier Science Pro-gram
RGP0050/2013 Kevin J Verstrepen
Vlaams Instituut voor Biotech-nologie
Kevin J Verstrepen
European Molecular BiologyOrganization
Kevin J Verstrepen
Onderzoeksraad, KU Leuven IDO/09/010 Kevin J VerstrepenJan Michiels
Swings et al. eLife 2017;6:e22939. DOI: 10.7554/eLife.22939 19 of 24
Research article Genomics and Evolutionary Biology Microbiology and Infectious Disease
Onderzoeksraad, KU Leuven DBOF/12/035 Kevin J VerstrepenJan Michiels
Onderzoeksraad, KU Leuven DBOF/14/049 Kevin J VerstrepenJan Michiels
Onderzoeksraad, KU Leuven CREA/13/019 Maarten Fauvart
Fonds Wetenschappelijk On-derzoek
KAN2014 1.5.222.14 Maarten Fauvart
Federaal Wetenschapsbeleid Interuniversity AttractionPoles Programme P7/28
Jan Michiels
Fonds Wetenschappelijk On-derzoek
G047112N Jan Michiels
Onderzoeksraad, KU Leuven IDO/13/008 Jan Michiels
The funders had no role in study design, data collection and interpretation, or the decision tosubmit the work for publication.
Author contributions
TS, Conceptualization, Data curation, Formal analysis, Supervision, Validation, Investigation, Visuali-
zation, Methodology, Writing—original draft, Writing—review and editing, T.S. conceptualized the
study, designed and performed the experiments, analyzed the data and wrote the manuscript;
BVdB, Conceptualization, Supervision, Methodology, Project administration, Writing—review and
editing, B.V.D.B. discussed the results and edited the manuscript; SW, Data curation, Investigation,
S.W. helped in performing the experiments; EO, Data curation, Investigation, E.O. helped in per-
forming the experiments; KV, Conceptualization, Funding acquisition, Project administration, Writ-
ing—review and editing, K.V. conceptualized the study, discussed the results and edited the
manuscript; KJV, Conceptualization, Funding acquisition, Project administration, Writing—review
and editing, K.J.V. conceptualized the study, discussed the results and edited the manuscript; MF,
Conceptualization, Supervision, Funding acquisition, Project administration, Writing—review and
editing, M.F. conceptualized the study, designed the experiments, discussed the results and edited
the manuscript; NV, Conceptualization, Supervision, Funding acquisition, Investigation, Methodol-
ogy, Project administration, Writing—review and editing, N.V. conceptualized the study, designed
the experiments, discussed the results and edited the manuscript; JM, Conceptualization, Supervi-
sion, Funding acquisition, Investigation, Methodology, Project administration, Writing—review and
editing, J.M. conceptualized the study, designed the experiments, discussed the results and edited
the manuscript
Author ORCIDs
Toon Swings, http://orcid.org/0000-0002-1225-3377
Natalie Verstraeten, http://orcid.org/0000-0002-9548-4647
Jan Michiels, http://orcid.org/0000-0001-5829-0897
Additional filesSupplementary files. Supplementary file 1. Addtional tables with primer sequences and selected mutator genes.
DOI: 10.7554/eLife.22939.024
Major datasets
The following dataset was generated:
Author(s) Year Dataset title Dataset URL
Database, license,and accessibilityinformation
Swings T, Michiels J 2016 Highly ethanol tolerant Escherichiacoli with hypermutationphenotype
https://www.ncbi.nlm.nih.gov/bioproject/PRJNA344553
Publicly available atthe NCBI SRArepository (accessionno: PRJNA344553)
Swings et al. eLife 2017;6:e22939. DOI: 10.7554/eLife.22939 20 of 24
Research article Genomics and Evolutionary Biology Microbiology and Infectious Disease
ReferencesBaba T, Ara T, Hasegawa M, Takai Y, Okumura Y, Baba M, Datsenko KA, Tomita M, Wanner BL, Mori H. 2006.Construction of Escherichia coli K-12 in-frame, single-gene knockout mutants: the Keio collection. MolecularSystems Biology 2:2006.0008. doi: 10.1038/msb4100050, PMID: 16738554
Barrick JE, Lenski RE. 2013. Genome dynamics during experimental evolution. Nature Reviews Genetics 14:827–839. doi: 10.1038/nrg3564, PMID: 24166031
Barrick JE, Yu DS, Yoon SH, Jeong H, Oh TK, Schneider D, Lenski RE, Kim JF. 2009. Genome evolution andadaptation in a long-term experiment with Escherichia coli. Nature 461:1243–1247. doi: 10.1038/nature08480,PMID: 19838166
Bell G, Gonzalez A. 2011. Adaptation and evolutionary rescue in metapopulations experiencing environmentaldeterioration. Science 332:1327–1330. doi: 10.1126/science.1203105, PMID: 21659606
Bielas JH, Loeb KR, Rubin BP, True LD, Loeb LA. 2006. Human cancers express a mutator phenotype. PNAS 103:18238–18242. doi: 10.1073/pnas.0607057103, PMID: 17108085
Bjedov I, Tenaillon O, Gerard B, Souza V, Denamur E, Radman M, Taddei F, Matic I. 2003. Stress-inducedmutagenesis in bacteria. Science 300:1404–1409. doi: 10.1126/science.1082240, PMID: 12775833
Blazquez J. 2003. Hypermutation as a factor contributing to the acquisition of antimicrobial resistance. ClinicalInfectious Diseases 37:1201–1209. doi: 10.1086/378810, PMID: 14557965
Boe L, Danielsen M, Knudsen S, Petersen JB, Maymann J, Jensen PR. 2000. The frequency of mutators inpopulations of Escherichia coli. Mutation Research/Fundamental and Molecular Mechanisms of Mutagenesis448:47–55. doi: 10.1016/S0027-5107(99)00239-0, PMID: 10751622
Cherepanov PP, Wackernagel W. 1995. Gene disruption in Escherichia coli: tcr and KmR cassettes with theoption of Flp-catalyzed excision of the antibiotic-resistance determinant. Gene 158:9–14. doi: 10.1016/0378-1119(95)00193-A, PMID: 7789817
Chopra I, O’Neill AJ, Miller K. 2003. The role of mutators in the emergence of antibiotic-resistant bacteria. DrugResistance Updates 6:137–145. doi: 10.1016/S1368-7646(03)00041-4, PMID: 12860461
Cooper LA, Simmons LA, Mobley HL. 2012. Involvement of mismatch repair in the reciprocal control of motilityand adherence of uropathogenic Escherichia coli. Infection and Immunity 80:1969–1979. doi: 10.1128/IAI.00043-12, PMID: 22473602
Couce A, Guelfo JR, Blazquez J. 2013. Mutational spectrum drives the rise of mutator bacteria. PLoS Genetics 9:e1003167. doi: 10.1371/journal.pgen.1003167, PMID: 23326242
Datsenko KA, Wanner BL. 2000. One-step inactivation of chromosomal genes in Escherichia coli K-12 using PCRproducts. PNAS 97:6640–6645. doi: 10.1073/pnas.120163297, PMID: 10829079
de Visser JA. 2002. The fate of microbial mutators. Microbiology 148:1247–1252. doi: 10.1099/00221287-148-5-1247, PMID: 11988499
Denamur E, Bonacorsi S, Giraud A, Duriez P, Hilali F, Amorin C, Bingen E, Andremont A, Picard B, Taddei F,Matic I. 2002. High frequency of mutator strains among human uropathogenic Escherichia coli isolates. Journalof Bacteriology 184:605–609. doi: 10.1128/JB.184.2.605-609.2002, PMID: 11751844
Desai MM, Fisher DS. 2011. The balance between mutators and nonmutators in asexual populations. Genetics188:997–1014. doi: 10.1534/genetics.111.128116, PMID: 21652523
Drake JW. 1991. A constant rate of spontaneous mutation in DNA-based microbes. PNAS 88:7160–7164.doi: 10.1073/pnas.88.16.7160, PMID: 1831267
Drake JW, Charlesworth B, Charlesworth D, Crow JF. 1998. Rates of spontaneous mutation. Genetics 148:1667–1686. PMID: 9560386
Elena SF, Lenski RE. 2003a. Evolution experiments with microorganisms: the dynamics and genetic bases ofadaptation. Nature Reviews Genetics 4:457–469. doi: 10.1038/nrg1088, PMID: 12776215
Elena SF, de Visser JA. 2003b. Environmental stress and the effects of mutation. Journal of Biology 2:12. doi: 10.1186/1475-4924-2-12, PMID: 12831400
Eyre-Walker A, Keightley PD. 2007. The distribution of fitness effects of new mutations. Nature ReviewsGenetics 8:610–618. doi: 10.1038/nrg2146, PMID: 17637733
Ferroni A, Guillemot D, Moumile K, Bernede C, Le Bourgeois M, Waernessyckle S, Descamps P, Sermet-Gaudelus I, Lenoir G, Berche P, Taddei F. 2009. Effect of mutator P. aeruginosa on antibiotic resistanceacquisition and respiratory function in cystic fibrosis. Pediatric Pulmonology 44:820–825. doi: 10.1002/ppul.21076, PMID: 19598278
Gentile CF, Yu SC, Serrano SA, Gerrish PJ, Sniegowski PD, Chao L, Cox EC. 2011. Competition between high-and higher-mutating strains of Escherichia coli. Evolution 7:125–134. doi: 10.2307/2408181, PMID: 21227974
Giraud A, Matic I, Tenaillon O, Clara A, Radman M, Fons M, Taddei F. 2001. Costs and benefits of high mutationrates: adaptive evolution of bacteria in the mouse gut. Science 291:2606–2608. doi: 10.1126/science.1056421,PMID: 11283373
Gonzalez A, Bell G. 2013. Evolutionary rescue and adaptation to abrupt environmental change depends uponthe history of stress. Philosophical Transactions of the Royal Society B: Biological Sciences 368:20120079.doi: 10.1098/rstb.2012.0079
Gonzalez A, Ronce O, Ferriere R, Hochberg ME. 2013. Evolutionary rescue: an emerging focus at theintersection between ecology and evolution. Philosophical Transactions of the Royal Society B: BiologicalSciences 368:20120404. doi: 10.1098/rstb.2012.0404, PMID: 23209175
Swings et al. eLife 2017;6:e22939. DOI: 10.7554/eLife.22939 21 of 24
Research article Genomics and Evolutionary Biology Microbiology and Infectious Disease
Goodarzi H, Bennett BD, Amini S, Reaves ML, Hottes AK, Rabinowitz JD, Tavazoie S. 2010. Regulatory andmetabolic rewiring during laboratory evolution of ethanol tolerance in E. coli. Molecular Systems Biology 6:378.doi: 10.1038/msb.2010.33, PMID: 20531407
Gould CV, Sniegowski PD, Shchepetov M, Metlay JP, Weiser JN. 2007. Identifying mutator phenotypes amongfluoroquinolone-resistant strains of Streptococcus pneumoniae using fluctuation analysis. Antimicrobial Agentsand Chemotherapy 51:3225–3229. doi: 10.1128/AAC.00336-07, PMID: 17664329
Gross MD, Siegel EC. 1981. Incidence of mutator strains in Escherichia coli and coliforms in nature. MutationResearch Letters 91:107–110. doi: 10.1016/0165-7992(81)90081-6, PMID: 7019693
Gupta DK, Patra AT, Zhu L, Gupta AP, Bozdech Z. 2016. DNA damage regulation and its role in drug-relatedphenotypes in the malaria parasites. Scientific Reports 6:23603. doi: 10.1038/srep23603, PMID: 27033103
Haft RJ, Keating DH, Schwaegler T, Schwalbach MS, Vinokur J, Tremaine M, Peters JM, Kotlajich MV, PohlmannEL, Ong IM, Grass JA, Kiley PJ, Landick R. 2014. Correcting direct effects of ethanol on translation andtranscription machinery confers ethanol tolerance in bacteria. PNAS 111:E2576–E2585. doi: 10.1073/pnas.1401853111, PMID: 24927582
Hall BM, Ma CX, Liang P, Singh KK. 2009. Fluctuation analysis CalculatOR: a web tool for the determination ofmutation rate using Luria-Delbruck fluctuation analysis. Bioinformatics 25:1564–1565. doi: 10.1093/bioinformatics/btp253, PMID: 19369502
Hall LM, Henderson-Begg SK. 2006. Hypermutable bacteria isolated from humans–a critical analysis.Microbiology 152:2505–2514. doi: 10.1099/mic.0.29079-0, PMID: 16946246
Hammerschmidt K, Rose CJ, Kerr B, Rainey PB. 2014. Life cycles, fitness decoupling and the evolution ofmulticellularity. Nature 515:75–79. doi: 10.1038/nature13884, PMID: 25373677
Hammerstrom TG, Beabout K, Clements TP, Saxer G, Shamoo Y. 2015. Acinetobacter baumannii repeatedlyevolves a Hypermutator phenotype in response to Tigecycline that effectively surveys evolutionary trajectoriesto resistance. PLoS One 10:e0140489. doi: 10.1371/journal.pone.0140489, PMID: 26488727
Healey KR, Zhao Y, Perez WB, Lockhart SR, Sobel JD, Farmakiotis D, Kontoyiannis DP, Sanglard D, Taj-AldeenSJ, Alexander BD, Jimenez-Ortigosa C, Shor E, Perlin DS. 2016. Prevalent mutator genotype identified infungal pathogen candida glabrata promotes multi-drug resistance. Nature Communications 7:11128. doi: 10.1038/ncomms11128, PMID: 27020939
Hietpas RT, Bank C, Jensen JD, Bolon DN. 2013. Shifting fitness landscapes in response to altered environments.Evolution 67:3512–3522. doi: 10.1111/evo.12207, PMID: 24299404
Iguchi S, Mizutani T, Hiramatsu K, Kikuchi K. 2016. Rapid acquisition of Linezolid resistance in Methicillin-Resistant Staphylococcus aureus: role of hypermutation and homologous recombination. PLoS One 11:e0155512. doi: 10.1371/journal.pone.0155512, PMID: 27182700
Jolivet-Gougeon A, Kovacs B, Le Gall-David S, Le Bars H, Bousarghin L, Bonnaure-Mallet M, Lobel B, Guille F,Soussy CJ, Tenke P. 2011. Bacterial hypermutation: clinical implications. Journal of Medical Microbiology 60:563–573. doi: 10.1099/jmm.0.024083-0, PMID: 21349992
Kaplan S, Bren A, Zaslaver A, Dekel E, Alon U. 2008. Diverse two-dimensional input functions control bacterialsugar genes. Molecular Cell 29:786–792. doi: 10.1016/j.molcel.2008.01.021, PMID: 18374652
Krasovec R, Belavkin RV, Aston JA, Channon A, Aston E, Rash BM, Kadirvel M, Forbes S, Knight CG. 2014.Mutation rate plasticity in rifampicin resistance depends on Escherichia coli cell-cell interactions. NatureCommunications 5:3742. doi: 10.1038/ncomms4742, PMID: 24776982
LeClerc JE, Li B, Payne WL, Cebula TA. 1996. High mutation frequencies among Escherichia coli and Salmonellapathogens. Science 274:1208–1211. doi: 10.1126/science.274.5290.1208, PMID: 8895473
Lee AH, Fidock DA. 2016. Evidence of a mild mutator phenotype in cambodian Plasmodium falciparum malariaparasites. PLoS One 11:1–14. doi: 10.1371/journal.pone.0154166
Lee H, Popodi E, Tang H, Foster PL. 2012. Rate and molecular spectrum of spontaneous mutations in thebacterium Escherichia coli as determined by whole-genome sequencing. PNAS 109:E2774–E2783. doi: 10.1073/pnas.1210309109, PMID: 22991466
Lenski RE, Rose MR, Simpson SC, Tadler SC. 1991. Long-Term experimental evolution in Escherichia coli. I.adaptation and divergence during 2,000 generations. The American Naturalist 138:1315–1341. doi: 10.1086/285289
Lindsey HA, Gallie J, Taylor S, Kerr B. 2013. Evolutionary rescue from extinction is contingent on a lower rate ofenvironmental change. Nature 494:463–467. doi: 10.1038/nature11879, PMID: 23395960
Loh E, Salk JJ, Loeb LA. 2010. Optimization of DNA polymerase mutation rates during bacterial evolution. PNAS107:1154–1159. doi: 10.1073/pnas.0912451107, PMID: 20080608
Lynch M, Ackerman MS, Gout JF, Long H, Sung W, Thomas WK, Foster PL. 2016. Genetic drift, selection and theevolution of the mutation rate. Nature Reviews Genetics 17:704–714. doi: 10.1038/nrg.2016.104, PMID: 27739533
Lynch M. 2010. Evolution of the mutation rate. Trends in Genetics 26:345–352. doi: 10.1016/j.tig.2010.05.003,PMID: 20594608
Lynch M. 2011. The lower bound to the evolution of mutation rates. Genome Biology and Evolution 3:1107–1118. doi: 10.1093/gbe/evr066, PMID: 21821597
Mao EF, Lane L, Lee J, Miller JH. 1997. Proliferation of mutators in A cell population. Journal of Bacteriology179:417–422. doi: 10.1128/jb.179.2.417-422.1997, PMID: 8990293
Marinus MG. 2010. DNA methylation and mutator genes in Escherichia coli K-12. Mutation Research/Reviews inMutation Research 705:71–76. doi: 10.1016/j.mrrev.2010.05.001, PMID: 20471491
Swings et al. eLife 2017;6:e22939. DOI: 10.7554/eLife.22939 22 of 24
Research article Genomics and Evolutionary Biology Microbiology and Infectious Disease

Marvig RL, Johansen HK, Molin S, Jelsbak L. 2013. Genome analysis of a transmissible lineage of Pseudomonasaeruginosa reveals pathoadaptive mutations and distinct evolutionary paths of hypermutators. PLoS Genetics 9:e1003741. doi: 10.1371/journal.pgen.1003741, PMID: 24039595
Marvig RL, Sommer LM, Molin S, Johansen HK. 2015. Convergent evolution and adaptation of Pseudomonasaeruginosa within patients with cystic fibrosis. Nature Genetics 47:57–64. doi: 10.1038/ng.3148, PMID: 25401299
Matic I, Radman M, Taddei F, Picard B, Doit C, Bingen E, Denamur E, Elion J. 1997. Highly variable mutationrates in commensal and pathogenic Escherichia coli. Science 277:1833–1834. doi: 10.1126/science.277.5333.1833, PMID: 9324769
Negri MC, Morosini MI, Baquero MR, del Campo R, Blazquez J, Baquero F. 2002. Very low cefotaximeconcentrations select for hypermutable Streptococcus pneumoniae populations. Antimicrobial Agents andChemotherapy 46:528–530. doi: 10.1128/AAC.46.2.528-530.2002, PMID: 11796370
Nicolaou SA, Gaida SM, Papoutsakis ET. 2012. Exploring the combinatorial genomic space in Escherichia coli forethanol tolerance. Biotechnology Journal 7:1337–1345. doi: 10.1002/biot.201200227, PMID: 22847918
Nowosielska A, Marinus MG. 2008. DNA mismatch repair-induced double-strand breaks. DNA Repair 7:48–56.doi: 10.1016/j.dnarep.2007.07.015, PMID: 17827074
Oliver A. 2015. Clinical relevance of Pseudomonas aeruginosa hypermutation in cystic fibrosis chronic respiratoryinfection. Journal of Cystic Fibrosis 14:e1–e2. doi: 10.1016/j.jcf.2014.12.009, PMID: 25563521
Otto SP, Day T. 2007. A Biologist’s Guide to Mathematical Modeling in Ecology and Evolution. PrincetonUniversity Press.
Pal C, Macia MD, Oliver A, Schachar I, Buckling A. 2007. Coevolution with viruses drives the evolution ofbacterial mutation rates. Nature 450:1079–1081. doi: 10.1038/nature06350, PMID: 18059461
Perfeito L, Fernandes L, Mota C, Gordo I. 2007. Adaptive mutations in bacteria: high rate and small effects.Science 317:813–815. doi: 10.1126/science.1142284, PMID: 17690297
Pulido-Tamayo S, Sanchez-Rodrıguez A, Swings T, Van den Bergh B, Dubey A, Steenackers H, Michiels J, FostierJ, Marchal K. 2015. Frequency-based haplotype reconstruction from deep sequencing data of bacterialpopulations. Nucleic Acids Research 43:e105. doi: 10.1093/nar/gkv478, PMID: 25990729
Rajanna C, Ouellette G, Rashid M, Zemla A, Karavis M, Zhou C, Revazishvili T, Redmond B, McNew L, BakanidzeL, Imnadze P, Rivers B, Skowronski EW, O’Connell KP, Sulakvelidze A, Gibbons HS. 2013. A strain of Yersiniapestis with a mutator phenotype from the republic of Georgia. FEMS Microbiology Letters 343:113–120.doi: 10.1111/1574-6968.12137, PMID: 23521061
Ram Y, Hadany L. 2014. Stress-induced mutagenesis and complex adaptation. Proceedings of the Royal SocietyB: Biological Sciences 281:20141025. doi: 10.1098/rspb.2014.1025, PMID: 25143032
Rando OJ, Verstrepen KJ. 2007. Timescales of genetic and epigenetic inheritance. Cell 128:655–668. doi: 10.1016/j.cell.2007.01.023, PMID: 17320504
Raynes Y, Sniegowski PD. 2014. Experimental evolution and the dynamics of genomic mutation rate modifiers.Heredity 113:375–380. doi: 10.1038/hdy.2014.49, PMID: 24849169
Roberts SA, Gordenin DA. 2014. Hypermutation in human cancer genomes: footprints and mechanisms. NatureReviews Cancer 14:786–800. doi: 10.1038/nrc3816, PMID: 25568919
Ronen M, Rosenberg R, Shraiman BI, Alon U. 2002. Assigning numbers to the arrows: parameterizing a generegulation network by using accurate expression kinetics. PNAS 99:10555–10560. doi: 10.1073/pnas.152046799, PMID: 12145321
Sandberg TE, Pedersen M, LaCroix RA, Ebrahim A, Bonde M, Herrgard MJ, Palsson BO, Sommer M, Feist AM.2014. Evolution of Escherichia coli to 42 ˚C and subsequent genetic engineering reveals adaptive mechanismsand novel mutations. Molecular Biology and Evolution 31:2647–2662. doi: 10.1093/molbev/msu209,PMID: 25015645
Schaaper RM, Dunn RL. 1987. Spectra of spontaneous mutations in Escherichia coli strains defective in mismatchcorrection: the nature of in vivo DNA replication errors. PNAS 84:6220–6224. doi: 10.1073/pnas.84.17.6220,PMID: 3306672
Schaaper RM, Radman M. 1989. The extreme mutator effect of Escherichia coli mutD5 results from saturation ofmismatch repair by excessive DNA replication errors. The EMBO Journal 8:3511–3516. PMID: 2555167
Shaver AC, Dombrowski PG, Sweeney JY, Treis T, Zappala RM, Sniegowski PD. 2002. Fitness evolution and therise of mutator alleles in experimental Escherichia coli populations. Genetics 162:557–566. PMID: 12399371
Sniegowski P, Raynes Y. 2013. Mutation rates: how low can you go? Current Biology 23:R147–R149. doi: 10.1016/j.cub.2013.01.018, PMID: 23428322
Sniegowski PD, Gerrish PJ, Johnson T, Shaver A. 2000. The evolution of mutation rates: separating causes fromconsequences. BioEssays 22:1057–1066. doi: 10.1002/1521-1878(200012)22:12<1057::AID-BIES3>3.0.CO;2-W,PMID: 11084621
Sniegowski PD, Gerrish PJ, Lenski RE. 1997. Evolution of high mutation rates in experimental populations of E.coli. Nature 387:703–705. doi: 10.1038/42701, PMID: 9192894
Stepanyan K, Wenseleers T, Duenez-Guzman EA, Muratori F, Van den Bergh B, Verstraeten N, De Meester L,Verstrepen KJ, Fauvart M, Michiels J. 2015. Fitness trade-offs explain low levels of persister cells in theopportunistic pathogen Pseudomonas aeruginosa. Molecular Ecology 24:1572–1583. doi: 10.1111/mec.13127,PMID: 25721227
SungW, AckermanMS, Dillon MM, Platt TG, Fuqua C, Cooper VS, Lynch M. 2016. Evolution of the Insertion-Deletion mutation rate across the tree of Life.Genes|Genomes|Genetics 6:2583–2591. doi: 10.1534/g3.116.030890, PMID: 27317782
Swings et al. eLife 2017;6:e22939. DOI: 10.7554/eLife.22939 23 of 24
Research article Genomics and Evolutionary Biology Microbiology and Infectious Disease
Tanaka MM, Bergstrom CT, Levin BR. 2003. The evolution of mutator genes in bacterial populations: the roles ofenvironmental change and timing. Genetics 164:843–854. PMID: 12871898
Tenaillon O, Toupance B, Le Nagard H, Taddei F, Godelle B. 1999. Mutators, population size, adaptivelandscape and the adaptation of asexual populations of bacteria. Genetics 152:485–493. PMID: 10353893
Thierauf A, Perez G, Maloy AS. 2009. Generalized transduction. Methods in Molecular Biology 501:267–286.doi: 10.1007/978-1-60327-164-6_23, PMID: 19066827
Thompson DA, Desai MM, Murray AW. 2006. Ploidy controls the success of mutators and nature of mutationsduring budding yeast evolution. Current Biology 16:1581–1590. doi: 10.1016/j.cub.2006.06.070, PMID: 16920619
Torres-Barcelo C, Cabot G, Oliver A, Buckling A, Maclean RC. 2013. A trade-off between oxidative stressresistance and DNA repair plays a role in the evolution of elevated mutation rates in bacteria. Proceedings ofthe Royal Society B: Biological Sciences 280:20130007. doi: 10.1098/rspb.2013.0007, PMID: 23446530
Trobner W, Piechocki R. 1984. Selection against hypermutability in Escherichia coli during long term evolution.MGG Molecular & General Genetics 198:177–178. doi: 10.1007/BF00328720, PMID: 6394963
Van den Bergh B, Michiels JE, Wenseleers T, Windels EM, Boer PV, Kestemont D, De Meester L, Verstrepen KJ,Verstraeten N, Fauvart M, Michiels J. 2016. Frequency of antibiotic application drives rapid evolutionaryadaptation of Escherichia coli persistence. Nature Microbiology 1:16020. doi: 10.1038/nmicrobiol.2016.20,PMID: 27572640
Voordeckers K, Kominek J, Das A, Espinosa-Cantu A, De Maeyer D, Arslan A, Van Pee M, van der Zande E,Meert W, Yang Y, Zhu B, Marchal K, DeLuna A, Van Noort V, Jelier R, Verstrepen KJ. 2015. Adaptation to highethanol reveals complex evolutionary pathways. PLoS Genetics 11:e1005635. doi: 10.1371/journal.pgen.1005635, PMID: 26545090
Wang J, Cazzato E, Ladewig E, Frattini V, Rosenbloom DI, Zairis S, Abate F, Liu Z, Elliott O, Shin YJ, Lee JK, LeeIH, Park WY, Eoli M, Blumberg AJ, Lasorella A, Nam DH, Finocchiaro G, Iavarone A, Rabadan R. 2016. Clonalevolution of glioblastoma under therapy. Nature Genetics 48:768–776. doi: 10.1038/ng.3590, PMID: 27270107
Wielgoss S, Barrick JE, Tenaillon O, Wiser MJ, Dittmar WJ, Cruveiller S, Chane-Woon-Ming B, Medigue C, LenskiRE, Schneider D. 2013. Mutation rate dynamics in a bacterial population reflect tension between adaptationand genetic load. PNAS 110:222–227. doi: 10.1073/pnas.1219574110, PMID: 23248287
Wiser MJ, Ribeck N, Lenski RE. 2013. Long-term dynamics of adaptation in asexual populations. Science 342:1364–1367. doi: 10.1126/science.1243357, PMID: 24231808
Woods RJ, Barrick JE, Cooper TF, Shrestha U, Kauth MR, Lenski RE. 2011. Second-order selection for evolvabilityin a large Escherichia coli population. Science 331:1433–1436. doi: 10.1126/science.1198914, PMID: 21415350
Yu J, Xiao J, Ren X, Lao K, Xie XS. 2006. Probing gene expression in live cells, one protein molecule at a time.Science 311:1600–1603. doi: 10.1126/science.1119623, PMID: 16543458
Zaslaver A, Bren A, Ronen M, Itzkovitz S, Kikoin I, Shavit S, Liebermeister W, Surette MG, Alon U. 2006. Acomprehensive library of fluorescent transcriptional reporters for Escherichia coli. Nature Methods 3:623–628.doi: 10.1038/nmeth895, PMID: 16862137
Zaslaver A, Mayo AE, Rosenberg R, Bashkin P, Sberro H, Tsalyuk M, Surette MG, Alon U. 2004. Just-in-timetranscription program in metabolic pathways. Nature Genetics 36:486–491. doi: 10.1038/ng1348, PMID: 15107854
Zwietering MH, Jongenburger I, Rombouts FM, van ’t Riet K. 1990. Modeling of the bacterial growth curve.Applied and Environmental Microbiology 56:1875–1881. PMID: 16348228
Swings et al. eLife 2017;6:e22939. DOI: 10.7554/eLife.22939 24 of 24
Research article Genomics and Evolutionary Biology Microbiology and Infectious Disease