Embed Size (px)
Citation preview

Ending “Too Big To Fail”:Government Promises versus Investor Perceptions
Todd A. Gormley, Simon Johnson,and Changyong RheeNo. 314 | October 2012
ADB Economics Working Paper Series
About the PaperAnalysis of the 1997–1999 crisis in the Republic of Korea suggests that despite a “no bailout” policy, chaebols could still issue bonds at prices implying very low expected default risk. The evidence suggests that government promises did not eliminate the “too big to fail” beliefs. Subsequent government handling of potential and actual defaults by Daewoo and Hyundai confirmed the market view that creditors would be protected.
About the Asian Development BankADB’s vision is an Asia and Pacific region free of poverty. Its mission is to help its developing member countries reduce poverty and improve the quality of life of their people. Despite the region’s many successes, it remains home to two-thirds of the world’s poor: 1.8 billion people who live on less than $2 a day, with 903 million struggling on less than $1.25 a day. ADB is committed to reducing poverty through inclusive economic growth, environmentally sustainable growth, and regional integration. Based in Manila, ADB is owned by 67 members, including 48 from the region. Its main instruments for helping its developing member countries are policy dialogue, loans, equity investments, guarantees, grants, and technical assistance.
Asian Development Bank6 ADB Avenue, Mandaluyong City1550 Metro Manila, Philippineswww.adb.org/economics
Printed on recycled paper Printed in the Philippines

ADB Economics Working Paper Series
Ending “Too Big To Fail”: Government Promises versus Investor Perceptions Todd A. Gormley, Simon Johnson, and Changyong Rhee
No. 314 October 2012
Todd A. Gormley is Assistant Professor of Finance at the Wharton School, University of Pennsylvania. Simon Johnson is the Ronald A. Kurtz Professor of Entrepreneurship at the Sloan School of Management, MIT and a Senior Fellow at the Peterson Institute for International Economics, Washington, DC. Changyong Rhee is Chief Economist, Economics and Research Department, Asian Development Bank. We are grateful to Bruno Biais, Olivier Blanchard, Hülya Eraslan, Mike Faulkender, Radha Gopalan, Marco Pagano, Ernst-Ludwig von Thadden, Vikrant Vig, and participants at the CEPR European Summer Symposium in Financial Markets, the Olin Business School –Washington University in St. Louis Finance luncheon, MIT Development & Finance lunches, and the World Bank Finance Research Group Seminar for their many useful comments. All remaining errors and omissions are our own. This paper has been previously published as NBER Working Paper 17518.

Asian Development Bank 6 ADB Avenue, Mandaluyong City 1550 Metro Manila, Philippines www.adb.org © 2012 by Asian Development Bank October 2012 ISSN 1655-5252 Publication Stock No. WPS124994 The views expressed in this paper are those of the author and do not necessarily reflect the views and policies of the Asian Development Bank (ADB) or its Board of Governors or the governments they represent. ADB does not guarantee the accuracy of the data included in this publication and accepts no responsibility for any consequence of their use. By making any designation of or reference to a particular territory or geographic area, or by using the term “country” in this document, ADB does not intend to make any judgments as to the legal or other status of any territory or area. Note: In this publication, “$” refers to US dollars.
The ADB Economics Working Paper Series is a forum for stimulating discussion and eliciting
feedback on ongoing and recently completed research and policy studies undertaken by the
Asian Development Bank (ADB) staff, consultants, or resource persons. The series deals with
key economic and development problems, particularly those facing the Asia and Pacific region;
as well as conceptual, analytical, or methodological issues relating to project/program
economic analysis, and statistical data and measurement. The series aims to enhance the
knowledge on Asia’s development and policy challenges; strengthen analytical rigor and quality
of ADB’s country partnership strategies, and its subregional and country operations; and
improve the quality and availability of statistical data and development indicators for monitoring
development effectiveness.
The ADB Economics Working Paper Series is a quick-disseminating, informal publication
whose titles could subsequently be revised for publication as articles in professional journals or
chapters in books. The series is maintained by the Economics and Research Department.
Printed on recycled paper

CONTENTS
ABSTRACT v I. INTRODUCTION 1 II. REPUBLIC OF KOREA’S CHAEBOLS AND FINANCIAL SYSTEM 5
A. Republic of Korea’s Chaebols and Financial Markets, Pre-1998 5 B. Chaebols, the Post-Crisis Bond Market, and Bailouts 6
III. EMPIRICAL SPECIFICATION 8 IV. DATA DESCRIPTION 10
A. Chaebol Membership 12 B. Financial Flows and Firm Characteristics 13 C. Corporate Governance 15
V. RESULTS AND INTERPRETATION 16
A. Access to Bonds in 1998 16 B. Yield to Maturity and Default Risk 21
VI. LOANS AND PROFITABILITY 24
A. Pre-crisis Loans and Chaebol Affiliation 24 B. Corporate Governance & Post-Crisis Profitability 26
VII. CONCLUSION 27 REFERENCES 33


ABSTRACT
Can a government credibly promise not to bailout firms whose failure would have major negative systemic consequences? Our analysis of the Republic of Korea’s 1997–1999 crisis, suggests an answer: No. Despite a general “no bailout” policy during the crisis, the largest Korean corporate groups (chaebol)―facing severe financial and governance problems―could still borrow heavily from households through issuing bonds at prices implying very low expected default risk. The evidence suggests “too big to fail” beliefs were not eliminated by government promises, presumably because investors believed that this policy was not time consistent. Subsequent government handling of potential and actual defaults by Daewoo and Hyundai confirmed the market view that creditors would be protected.


I. INTRODUCTION
The global financial crisis of 2008–2009 and its aftermath have highlighted the problems that occur when corporate entities are “too big to fail”.1 The potential bankruptcy of some large United States (US) banks and nonbank financial institutions in September–October 2008 was seen by the government as likely to damage the broader economy―consequently, these firms were provided with various forms of support that kept management in place and prevented creditor losses (Sorkin 2009). More broadly, as the crisis spread around the world, many countries put in place extraordinary measures to protect their largest financial and nonfinancial firms, including banks, insurance companies, and auto manufacturers. Presumably, these efforts further undermine the incentives for careful risk management in the future―managers are less likely to be careful if they feel that downside risks (both personal and corporate) will be covered by the state, and outside investors will provide cheaper capital to such large implicitly state-guaranteed firms.2 Governments may now promise not to provide further bailouts, but in the view of Alessandri and Haldane (2009, p.7)―from the Bank of England―such promises are unlikely to be believed:
“Ex-ante, they [the authorities] may well say “never again.” But the ex-post costs of crisis mean that such a statement lacks credibility. Knowing this, the rational response by market participants is to double their bets. This adds to the costs of future crises. And the larger these costs, the lower the credibility of ‘never again’ announcements.”
In contrast, the current consensus in the US official circles is that the government can
commit not to bail out large firms. For example, Title II of the Dodd–Frank financial legislation (signed into law on 21 July 21 2010) creates a “resolution authority” that allows a regulatory agency (the Federal Deposit Insurance Corporation) to manage the effective bankruptcy of big nonbank financial institutions, i.e., run an orderly process in which creditors and shareholders incur losses (and management can be fired) but, in principle, the financial system is not jeopardized and there is no shock to the broader economy.3 If investors view this as credible, they should no longer provide cheap funding for “too big to fail” financial institutions.4
Can such a “no bailout” government policy constitute a credible commitment that solves
the problem of “too big to fail”? Ex ante promises to let companies fail―and run through some form of bankruptcy―may not be optimal when the moment for a decision actually arrives. In particular, given the “systemic” nature of financial crises―with widespread perceived contagion
1 “Too big to fail” is far from a new issue, as discussed in detail by Stern and Feldman (2004)―in the modern
American context, it dates from at least the conservatorship of Continental Illinois in the 1980s. Concerns about this issue have become more intense since fall 2008.
2 The status of “too big to fail” definitely protects creditors and should enable firms to borrow more cheaply. It may or may not also generate higher expected returns for shareholders―on the one hand, the firm is less likely to go bankrupt, but on the other hand, share values can still fall to almost zero before some recovery (as was the case with US banks in 2007-–2009).
3 The Federal Deposit Insurance Corporation (FDIC) had such authority before the Dodd–Frank bill, but only over banks with insured deposits―i.e., this did not cover nonbank financial companies and, as interpreted, also was not applied to Bank Holding Companies (typically, large banks with major non-deposit taking activities) in 2008–2009.
4 This was the claim made by President Barrack Obama when he signed the Dodd–Frank bill into law in July 2010, “Finally, because of this law, the American people will never again be asked to foot the bill for Wall Street's mistakes. There will be no more taxpayer-funded bailouts. Period. If a large financial institution should ever fail, this reform gives us the ability to wind it down without endangering the broader economy. And there will be new rules to make clear that no firm is somehow protected because it is "too big to fail," so that we don't have another AIG.” (http://www.marketwatch.com/story/text-of-obama-remarks-on-dodd-frank-2010-07-21)

2 І ADB Economics Working Paper Series No. 314 both within and across countries – will financial markets really believe any government when it promises not to save its biggest firms?
Relevant experience in the Republic of Korea suggests an answer: No. When financial
crisis broke out at the end of 1997, the banking system was threatened with collapse and the exchange rate depreciated rapidly. At this time of crisis, government policy was explicitly and emphatically not to bailout the largest Korean conglomerates (known as chaebol), which were heavily leveraged and exposed to the ensuing financial crisis. This approach was rooted in the incoming president’s long-standing dislike for and opposition to the political power of large chaebol, and the authorities attempted to make the firmest and most credible commitments in this regard, including through its agreements with the International Monetary Fund (IMF).5
Despite this, the largest conglomerates (“chaebol”) were able to borrow heavily from
households through issuing bonds at low interest rates in 1998―allowing many of them to avoid immediate failure and become even bigger relative to the economy. The largest conglomerates issued disproportionately more bonds than other firms and were able to do so at rates implying much lower default risk. There is no evidence that this advantageous access to finance was due to better historic performance, stronger prospects, preferential access to state-owned banks, implicit cross-debt guarantees among group members, less exposure to the financial crisis, or better governance within the biggest firms―if anything, all objective measures suggest that the largest conglomerates were actually in worse shape (apart from their presumed implicit government backing) relative to other Korean firms. Instead, the most plausible interpretation is that investors perceived these large firms as “too big to fail”.
Investors’ perceptions proved largely correct. Daewoo, the Republic of Korea’s third
largest conglomerate, declared bankruptcy in 1999, and Hyundai, the Republic of Korea’s largest conglomerate, also had an actual default in 2000 default in 2000. In both cases, the government, fearing another economic crisis, intervened so as to effectively and largely bail out the bond investors.6
To assess the extent to which “too big to fail” beliefs contributed to the flow of bond
finance towards chaebol-affiliated firms in 1998, we obtained comprehensive data on the amount and date of issuance for every publicly placed corporate bond in the Republic of Korea in 1998. The dataset, which covers 1,175 bond issues, also includes the yield to maturity for each bond issue at the time of issuance along with the issuing firm’s credit rating at the time. Using company names, we then matched the issuance-level data to firms’ financial and ownership data, as compiled by National Information Credit Evaluation (NICE). One of the largest Korean credit evaluating firms, NICE compiles and verifies firms’ annual financial statements submitted to the Korea Securities Supervisory Board. In total, the NICE data covers about 9,000 firms during the 1990s. We also use the NICE financial data to track financial flows via loans, bonds, and equity to firms before and after the financial crisis. Finally, we match this data to firms’ chaebol affiliation using data provided by the Korean Fair Trade Commission (KFTC).
5 The government’s fiscal position was healthy and there was little outstanding public debt, so bailouts were
feasible. But the government, backed by the IMF and the US Treasury, stated there would be no money to protect creditors, and this was enshrined in the country’s Letters of Intent with the IMF in December 1997 (Johnson and Kwak, 2010, chapter 2; also endnote 17 on p.237). Section I provides more details of this shift in government policy towards bailouts.
6 Oh and Rhee (2002) estimate that investors recovered 95% of their initial investment in Daewoo because of these emergency measures put in place by the Korean government. See Section I.

Ending “Too Big to Fail”: Government Promises versus Investor Perceptions І 3
Using these data, we confirm that the chaebol-affiliated firms did in fact enjoy disproportionate access to bond financing in 1998. Within our panel of firms, the Herfindahl index of total gross funds rose from 0.012 in the early and mid-1990s to 0.019 in 1998, and 0.016 in 1999. This increased concentration of financial flows was driven by the Republic of Korea’s biggest chaebols. Firms affiliated with the top five chaebols received 34% of net finance in 1996 and 46% in 1998. Firms affiliated with the largest five chaebols also raised much more bond financing than anyone else―firms in the largest five chaebols accounted for 53% of net bond flows in 1998, while firms in the next 25 largest chaebols only accounted for 11%.
However, it is harder to establish that “too big to fail” beliefs facilitated the largest
chaebols access to bonds in 1998. For example, were investors willing to lend to these large chaebols because they were better run or had better projects at the time, or was it just that investors saw them as “too big to fail”? This is a tough question because post-crisis performance was likely affected by whether or not a firm could obtain external funding. Moreover, pre-crisis performance measures are not necessarily informative as a crisis of this nature dramatically changes the relative profitability of activities.
To control for potential differences in investment opportunities among firms, we employ
two complementary approaches. First, we test for differences in post-crisis access to bond financing within industries. Using industry fixed effects to control for unobserved differences in investment opportunities across industries, we test whether a chaebol-affiliated firm enjoyed better access to capital relative to other firms in the same industry. Second, we exploit an established feature of emerging markets in general and in the Republic of Korea in particular―specifically the finding that corporate governance matters for firm-level outcomes. The literature has established that firms with weaker corporate governance had less good performance in the Republic of Korea before the crisis (Joh 2003), as well as more adverse stock price outcomes during the crisis (Baek, Kang, and Park 2004). A firm’s pre-crisis governance thus provides a plausible alternative proxy for a firm’s likely performance and default risk following the crisis. If the bond market was allocating capital on the basis of likely performance rather than “too big to fail” beliefs, we would expect that more capital should have flowed to firms with better governance (i.e., stronger safeguards against “tunneling” by insiders, which hurts both outside equity investors and creditors).7
Using this strategy, we find evidence consistent with investors believing the largest
Korean firms were “too big to fail” in 1998. Chaebol-affiliated firms were able to issue significantly more bonds and at better rates relative to other firms that issued bonds in the same industry. These findings are robust to controlling for numerous firm-level characteristics measured prior to the crisis. Moreover, there is no evidence to indicate that bond prices incorporated the default risk of firms; investors appeared indifferent to credit ratings or other standard measures of default risk in 1998, and bond prices at the time of issuance yield no evidence that investors anticipated the eventual default of some chaebols. For example, firms affiliated with Daewoo―the second largest chaebol (by some measures) that soon defaulted―actually sold bonds in 1998 with a lower interest rate than did other chaebol-affiliated firms. There is also no evidence that the bond market allocated credit to firms with better corporate governance. Instead, the chaebol-affiliated firms receiving the most bond financing in 1998 (and at the best rates) actually had the worst corporate governance (and the worst implied creditor protection against various forms of tunneling).
7 The available governance measures are for shareholder protection. But in an environment of potential pervasive
tunneling by insiders, protections provided to shareholders can also help creditors—both are helped when it is harder for managers effectively to steal value (Johnson et al. 2000).

4 І ADB Economics Working Paper Series No. 314
Alternative explanations cannot easily explain why chaebol-affiliated firms were able to significantly issue more bonds and at better rates after the crisis. The greater ability to borrow does not appear driven by implicit cross-debt guarantees among firms within a chaebol. Such guarantees were legally prohibited, and our findings hold when we aggregate chaebol-affiliated firms up to the group level and treat an entire chaebol as just one observation. Less exposure to the Korean crisis because of international business or better export opportunities also does not appear to explain our findings. Our findings are robust to controlling for firms’ level of exports and to using within-industry comparisons. There is also no evidence that in the absence of a government bailout, chaebol-affiliated firms were a lower default risk after the crisis. We find that the default rate of chaebol-affiliated firms was actually higher than that of non-chaebol firms.
Overall, this evidence is consistent with Korean investors believing the very largest
Korean chaebol were “too big to fail” in 1998―despite explicit attempts by the government to establish and implement a no bailout policy. When the entire set of firms in a chaebol group were very large relative to the economy or sufficiently important to key components of the economy, it made sense for investors to expect that the government would, one way or another, eventually and substantially ride to their rescue.8 It is very hard to commit not to save massive firms and their investors―because of the systemic implications, and investors know this.9 Of course, if investors believe there will be such a rescue, they will reward bigger firms with cheaper access to finance, further solidifying these firms’ status as “too big to fail”. The Korean evidence suggests that a government commitment―no matter how binding―to not bail out large firms is unlikely to eliminate “too big to fail” beliefs because it is not time consistent and, in a crisis, emergency measures can always be brought in to help investors.
Most of the established literature on the issue of “too big to fail” has focused on the
financial sector and has been relatively informal―although quite prescient, e.g., Stern and Feldman (2004), which anticipated many of the global issues seen in 2008–2009. Drawing on experience in the 1990s, Summers (2000) summarizes best practice for policy: “It is certain that a healthy financial system cannot be built on the expectation of bailouts.” Our paper expands the set of retrospective experiences when “too big to fail” was a relevant consideration to nonfinancial conglomerates, which can also pose a systematic risk when they account for a significant share of the domestic economy. The case of the Republic of Korea strongly suggests that the more general study of “too big to fail” should not be limited to the financial sector alone.
Our evidence fits well with the idea that vested interests play an important role in
financial development (Morck, Wolfenzon, and Yeung 2005) and suggests links between “too big to fail” and the broader evidence that firm-level governance and financing arrangements matter for country-level macroeconomic outcomes. The link seems to be particularly strong for crises in emerging markets where firms with weaker corporate governance are more likely to suffer stock price declines when a crisis hits (Johnson et al. 2000, Mitton 2002, Lemmon and Lins 2003).10
Our analysis of the Republic of Korea's bond market also relates to growing evidence
regarding the importance of legal institutions for financial development (Beck, Demirgüç-Kunt,
8 Additionally, part of this “too big to fail” belief may be driven by the largest chaebols being household brand names
in the Republic of Korea (e.g., Samsung, Daewoo, Hyundai, LG, and SK), which would only bolster the belief of investors and households that these firms would never be allowed to fail.
9 This idea is similar to that of Bhattacharya (2003), which derives a model where agents rationally participate in gigantic Ponzi schemes because they correctly believe that a partial bailout is possible when the scheme eventually collapses.
10 This literature builds directly on the measurement of investor protection in La Portaet al. (1997 and 1998).

Ending “Too Big to Fail”: Government Promises versus Investor Perceptions І 5 and Levine 2003) and how market-based or bank-based financial systems may independently matter for economic development and growth (Beck and Levine 2002). Our paper builds upon existing work concerning business groups in the Republic of Korea (Bae, Kang, and Kim 2002), the separation of ownership and control frequently found in these firms (Claessens, Djankov, and Lang 2000), and the readjustment of credit extended to these groups following the financial crisis (Borensztein and Lee 2002).
The remainder of the paper proceeds as follows. Section I explains the nature of the
Republic of Korea's financial system through the mid-1990s. Section II explains our empirical specification, and Section III describes the data. Section IV reports our regressions. Section V offers some additional analysis of loans and profitability, and Section VI concludes.
II. REPUBLIC OF KOREA’S CHAEBOLS AND FINANCIAL SYSTEM
In this section, we briefly describe the size of the Republic of Korea’s largest chaebols in relation to the economy prior to the financial crisis in 1997–1998, and also the development of the Republic of Korea’s financial market during the crises years. We place particular emphasis on the development of the country’s corporate bond market, which provided a primary channel through which firms, particularly the largest chaebols, raised capital following the crisis in 1998. A. Republic of Korea’s Chaebols and Financial Markets, Pre-1998
Chaebols―groups of firms in the Republic of Korea connected through complicated ownership structures―dominate the Korean economy. There were hundreds of such chaebols prior to the financial crisis in 1997, but the largest five and next largest 25 chaebols were generally considered to be in a class of their own in terms of size. The five largest chaebols prior to the crises, in terms of total assets, were Hyundai, Samsung, LG, Daewoo, and SK. These five chaebols alone had combined sales of 225 trillion won (W) in 1996. These sales are significant relative to the size of the Republic of Korea’s entire gross domestic product (GDP) at the time, W448.6 trillion. The next largest 25 chaebols also accounted for a significant share of sales in 1996. Total sales of these 25 chaebols were W86 trillion in 1996.11 The market share of these chaebols, particularly the largest five, facilitated what many considered to be a “too big to fail” belief by investors (Krueger and Yoo 2002).
The chaebols’ enormous size is partially attributed to their success as exporters,
combined with subsidized credit from the government, during the 1960s, 1970s, and 1980s. From the 1960s into the 1980s, the Republic of Korea’s financial system, which was dominated by state-owned banks, allocated credit at the behest of the government. These directed bank credits were provided to firms that fulfilled government priorities, particularly through developing exports. Korean chaebols were adept beneficiaries of this system, allowing them to capture a significant share of the economy.12
In the early 1990s, there were attempts by the government to switch towards a more
market-based financial system, but almost all external financing for firms continued to flow through banks. Official aggregate flows of funds data from the Bank of Korea demonstrate this. Before 1997, total annual net financial flows to the corporate sector were around 25% of GDP,
11 We calculate the sales of the largest chaebols using our NICE data, which is described in Section II. The gross
domestic product is provided by the Bank of Korea and given in Appendix Table II. 12 See Krueger and Yoo (2002) for more details on the history and growth of chaebols.

6 І ADB Economics Working Paper Series No. 314 of which financial intermediaries provided between 45% and 60%. 13 The largest chaebols accounted for a significant share of these bank loans. About 44% of net finance flows from financial intermediaries in 1996 went to the largest five chaebols in 1996. Other important sources of funds before the crisis were commercial paper (17.5% of all funding in 1996), stocks (10.9%), and overseas borrowing (10.4%).
Despite its large nominal size, the corporate bond market was quite inactive prior to the
crisis. Corporate bonds issued prior to 1998 were essentially disguised bank loans rather than capital market instruments as Korean banks routinely guaranteed corporate bonds and held them to the maturity. Bond investment by banks was an alternative method to extend loans to a specific company when banks could not extend loans to the company due to loan exposure regulation. By investing in bonds, banks could escape the regulation which limited loan exposure per firm as bond holdings were classified as portfolio investments, not loans. The government's regulation on interest rates also hampered the development of corporate bond markets. Instead of putting a ceiling on interest rates, the government took an indirect approach. It controlled the supply of corporate bonds (new issuance of corporate bonds had to be pre-approved) to manage market interest rates. B. Chaebols, the Post-Crisis Bond Market, and Bailouts
Following the financial crisis in 1997, the Republic of Korea’s financial markets, which had historically favored the largest chaebols, changed dramatically. In response to the crisis, the Republic of Korea’s banks dramatically curtailed their lending. Net financial flows from the country’s financial intermediaries were a negative W15.9 trillion in 1998, indicating net repayment of loans. Because of their high leverage, this drop in bank loans, a primary source of capital for the largest chaebols, likely posed a significant challenge for chaebol-affiliated firms. The median debt-to-equity ratio of firms affiliated with a top five chaebol was 3.9 in 1997, and the median debt-to-equity ratio of firms affiliated with the next largest 25 chaebols was 3.6. Firms affiliated with Hyundai had a median debt-to-equity ratio of 5.1 in 1997.
At the same time, government policy towards propping up failing banks and firms also
changed. The Republic of Korea government, backed by the IMF and the US Treasury, stated there would be no money to protect individual firms, and this was enshrined in the country’s Letter of Intent with the IMF at the very end of 1997.14 These shifts were intended to signal that no firm was “too big to fail” and that government aid would not be forthcoming for troubled firms. These shifts were substantiated by the government’s willingness to allow some smaller chaebols to go bankrupt. Hanil, the 27th largest chaebol in 1997, entered bankruptcy in the second half of 1998. New Core and Geopyung, ranked 27th and 28th in size in 1998, also subsequently went bankrupt.
Despite their high leverage and a supposed unwillingness of the government to bailout
failing firms, the chaebol-affiliated firms obtained new financing in 1998 rather easily. This was
13 For example, in 1996 total financing to the corporate sector was W118,769 billion. Of this, 14% came from bank
lending directly and 17.5% came from banks through their purchases of bonds. A further 13.9% came from non-bank financial intermediaries. See Appendix Table II for the complete aggregate finance data from 1990–2002.
14 From the December 3, 1997, letter (http://www.imf.org/external/np/loi/120397.HTM): paragraph 35, “To strengthen market discipline, bankruptcy provisions according to Korean law will be allowed to operate without government interference. No government subsidized support or tax privileges will be provided to bail out individual corporations”; paragraph 17, “All support to financial institutions, other than Bank of Korea liquidity credits, will be recorded transparently in the fiscal accounts”; and the tight fiscal policy laid out in paragraphs 13 and 14. These commitments were reinforced in a second Letter of Intent on 24 December 1997.

Ending “Too Big to Fail”: Government Promises versus Investor Perceptions І 7 accomplished by their ability to raise significant amounts of capital through bond issues as part of an overall surge in the Republic of Korea’s bond market at the time. The monthly average amount of corporate bonds issued was less than W3 trillion prior to the crisis. But, the monthly average increased to W7 trillion in the second half of 1998, and for all of 1998, the Bank of Korea reports net bond financing was W45.9 trillion.15 Moreover, the net finance flows from bonds in 1998 roughly equaled the net flows of financial intermediaries before the crisis. Net bond flows were 9.5% of GDP in 1998, whereas net flows of indirect finance (i.e., banks) were about 9% of GDP from 1990–1997. The dramatic switch from bank-based finance to issuing bonds is shown in Figure 1, which shows the main net financial flows to the Korean corporate sector during the 1990s as reported by the Bank of Korea.16
Figure 1: Aggregate Net Financial Flows by Year (won billion)
Note: This figure reports the aggregate corporate net financial flows for equity, bonds, and loans, by year.
Source: Bank of Korea.
While the government’s decision to no longer control the supply of corporate bonds was
a contributing factor in the bond market’s sudden development, the primary driver was a drawing down of bank deposits by households and the reinvestment of these savings in corporate bonds. Anecdotal evidence suggests that households moved their savings to corporate bonds for two main reasons.17 First, individuals perceived bonds issued by chaebol-affiliated firms to be safe investments irrespective of government commitments to not bail out these firms. Second, banks―many of which were recently taken over by the government because of the crisis―could not compete with the higher interest rates offered by corporate bonds. In January 1998, the three-year bank deposit rate was 17% whereas the three-year corporate bond yield (AA rating) was 24%. The introduction of asset-backed securities and the securitization of bad bank loans also helped diversify the products available to investors and deepen their demand for bonds in 1998.
15 Using an average exchange rate of W1,400 per dollar in 1998, this is about $32.8 billion. 16 The type of corporate bond issued also changed drastically with the crisis as guaranteed corporate bonds
immediately disappeared from the market. Due to new restrictions put in place by the government after the crisis, banks and other institutional investors’ ability to provide a financial guarantee to bond issuers was severely curtailed, and almost all corporate bonds issued after the crisis were non-guaranteed bonds.
17 This anecdotal evidence is based on discussions with leading Korean bond experts. Detailed data on household savings and the purchasers of corporate bonds in the Republic of Korea is not available.
−30,000−15,000
015,00030,00045,00060,00075,00090,000
105,000120,000
1990 1991 1992 1993 1994 1995 1996 1997 1998 1999 2000
Billi
on W
on
Bonds Equity Financial Intermediaries
8 І ADB Economics Working Paper Series No. 314
The dramatic growth of the bond market slowed after the government placed a limit on the amount of bonds that chaebol-affiliated firms could issue on 28 October 1998. This limit was implemented out of concerns that the largest chaebols were accumulating large amounts of debt that they would not be able to repay. These concerns were justified in July 1999 when the Daewoo group, the third largest chaebol in the Republic of Korea at the time and one of the largest issuers of bonds in 1998, declared bankruptcy.
Immediately after the Daewoo bankruptcy, the amount of corporate bonds issued was
almost negligible, as investors became very sensitive to corporate credit risk and the possibility that the largest chaebols might not be “too big to fail”. The average monthly issuance of bonds for the first half of 1999 was W2.9 trillion, and the total amount of bonds issued in July and August 1999 was W2.4 trillion and W2.5 trillion, respectively. In September 1999, however, corporate bonds issued fell to W162 billion, and only averaged W680 billion for the remainder of 1999. Total monthly bonds issued did not again exceed W2 trillion until February 2001.
Despite the government’s commitment to not bail out firms, lenders to the largest
chaebols were eventually protected against losses to a large degree in 1999 and 2000 by government action. After Daewoo’s bankruptcy, the Korea Asset Management Company, set up with public funds, purchased Daewoo’s non-performing loans and debts, which were estimated at more than $57 billion. Oh and Rhee (2002) estimate that investors made back 95% of their initial investment in Daewoo because of these emergency measures put in place by the government. Hyundai, another large issuer of debt in 1998 also had an actual default in 2000. Unable to rollover its debt, the company was only able to avoid bankruptcy through government measures initiated to avoid another collapse similar to Daewoo. Through these measures, the Korean Development Bank purchased bonds from Hyundai and other troubled companies, thus shielding bond investors from potential losses.18
Why were chaebol-affiliated firms able to issue so many bonds after the crisis and after
the government stated there would be no money to protect individual firms? Were these financial flows to the largest firms because these firms were better run or had better projects at the time, or was it just that investors still saw them as “too big to fail”? To address this question, we now turn to our empirical specification.
III. EMPIRICAL SPECIFICATION
To analyze whether “too big to fail” perceptions among bond investors may have contributed to chaebol-affiliated firms’ ability to access bonds in 1998, we need to test whether chaebol affiliation is associated with better access to bond financing after controlling for firms’ investment opportunities and underlying default risk. For example, one relationship of interest is:
, , , , , ,i j T i j T i i j TF P Chaebol
(1)
where , ,i j TF is a measure of the finance obtained by firm i in industry j and period T, i.e., after the
crisis, , ,i j TP is a measure of the expected return on the firm's projects in T (and beyond), and
Chaeboli is an indicator for being affiliated with a large chaebol. We are interested in whether
18 See Oh and Rhee (2002) for more details of these emergency measures.

Ending “Too Big to Fail”: Government Promises versus Investor Perceptions І 9
0 , which would suggest better access to capital for chaebol-affiliated firms after controlling for investment opportunities. Likewise, another relationship of interest is:
, , , , , ,i j T i j T i i j TYTM Risk Chaebol (2)
Where, , ,i j TYTM is a measure of the yield-to-maturity offered on bond issues of firm i in industry
j after the crisis, and , ,i j TRisk is a measure of the underlying default risk (absent a government
bailout) on the bonds issued by firm i. Now, we are interested in whether 0 , which would suggest investors perceived chaebol-affiliated firms as “too big to fail”. The problem is that we do not have a good measure of either expected return, P, or default risk, Risk.
Using post-crisis performance measures to proxy for P is not appealing as these are
likely affected in part by access to finance, causing a potential endogeneity bias. Firms with access to the bond market following the crisis may have performed better simply because they could obtain credit when other firms could not. For example, Daewoo, which issued a large share of the bonds in 1998, was probably able to delay bankruptcy because of its ability to issue bonds. Therefore, using post-crisis performance measures would bias us towards finding a positive correlation between performance and financial access. A similar concern arises in trying to determine whether these bond issues adequately priced a firm’s default risk, Risk.
Using other standard proxies for investment opportunities, such as Tobin’s Q, from
before the crisis to proxy for firms’ expected return on investments after the crisis is also not appealing. A dramatic change in relative prices following the crisis likely shifted the set of profitable investments to new areas of the economy, and a firm’s performance prior to the crisis need not be a strong predictor of its post-crisis expected returns. Using standard measures of default risk measured from before the onset of the crisis is also unappealing for the same reason.
To capture differences in investment opportunities and risk across firms, we instead rely
on industry fixed effects. Adding industry fixed effects to the above specifications will help control for unobserved investment opportunities and risk attributes at the industry level and ensure that we are only estimating differences in post-crisis access to bond financing within industries―i.e., are chaebol-affiliated firms able to borrow more and at better terms than other firms in the same industry?
An additional and attractive proxy for the potential risk and return of a firm’s investments
following the crisis is a firm’s corporate governance structure prior to the crisis. Recent corporate governance literature suggests that corporate governance arrangements matter for firm-level performance (Mitton 2002; Lemmon and Lins 2003; Morck, Wolfenzon, and Yeung 2005), and there is ample evidence that corporate governance mattered for performance specifically in the Republic of Korea before, during, and after the crisis (Joh 2003; Baek, Kang, and Park 2004; Black, Jang, and Kim 2006). Governance structures also tend to be persistent, and in the Republic of Korea, they do not appear affected by the financial crisis. Thus, as an additional control for investment opportunities, we will also test the robustness of our findings to including controls for firm-level governance.
Making use of these ideas, we estimate the following specification:
, , , , , , , ,'i j T j i j T s i i j T s i j TF G Chaebol Z (3)

10 І ADB Economics Working Paper Series No. 314 where , ,i j TF is the finance obtained by firm i in industry j and period T, which is after the crisis;
j are three-digit industry fixed effects, and , ,i j T sG is the corporate governance of firm i in period
T-s, which is before the crisis; and ,'i T sZ is a vector of firm-level controls, which are all
measured before the crisis to ensure they are not endogenously related to post-crisis financial flows. We estimate a similar regression for the yield-to-maturity of bonds issued in 1998.
Our main empirical specifications will rely on industry fixed effects to capture differences
in investment opportunities and risk. Empirical specifications that also include corporate governance as an additional proxy will rely on three assumptions. First, the crisis was a surprise to all concerned, so that corporate governance and other arrangements were not designed with the crisis in mind. Second, corporate governance is to some extent persistent, i.e., cannot be quickly changed, particularly during a crisis.19 Third, building on Joh’s (2003) result that firms with bad governance performed worse before the crisis, we assume it would be reasonable to suppose that in early 1998 these same firms would not make good use of external funds.
IV. DATA DESCRIPTION
In this section, we describe the construction of variables we will use in our subsequent analysis. A more detailed description of how we construct each variable can be found in Appendix Table 1. Descriptive statistics of our key variables and controls are provided in Tables 1 and 2, and pair-wise correlations of key variables are reported in Table 3. As noted in our empirical strategy, all firm-level controls, including those for chaebol membership, corporate governance, and size are measured prior to the financial crisis to ensure they are not endogenously related to post-crisis bond flows and yield to maturity, which form our main dependent variables. To that effect, we construct all of our firm-level controls from 1996 data to ensure they are not influenced by financial crisis in mid- to late-1997. All subsequent analysis is also robust to constructing our control variables from 1997 data instead.
19 The corporate governance measures used in our later specifications are in fact highly persistent. See Section II, A.

Ending “Too Big to Fail”: Government Promises versus Investor Perceptions І 11
Table 1: Gross Financial Flows by Year and Chaebol Affiliation
1996 1997 1998 1999 2000Number of Firms with Non-zero Gross Bond Flows 837 701 519 569 504 Firms in a Top 5 Chaebol in 1996 46 46 54 41 38 Firms in a Top 6–30 Chaebol in 1996 70 69 59 53 50 Average Gross Bond Flows/Assets 1.55 1.03 0.93 1.00 1.04 Firms in a Top 5 Chaebol in 1996 5.3 5.3 10.9 4.0 3.8 Firms in a Top 6–30 Chaebol in 1996 4.0 4.0 4.5 3.8 3.1 Number of Firms with Other Financial Flows Non-zero Gross Loan Flows 4,310 5,174 4,784 5,622 6,232 Non-zero Gross Equity Flows 926 1,188 1,069 2,133 2,499 Herfindahl Index Gross Bond Flows 0.021 0.024 0.034 0.025 0.036 Gross Loan Flows 0.013 0.026 0.025 0.019 0.016 Gross Equity Flows 0.012 0.017 0.037 0.035 0.054 Herfindahl Index for Gross Loan Flows 0.950 1.720 1.650 1.350 1.160
Note: Financial flows are calculated using cash flow data reported under financing activities in the National Information Credit Evaluation dataset. The top 30 chaebol affiliations are determined using the 1996 the Korean Fair Trade Commission listing.
Source: Authors’ estimates.
Table 2: Descriptive Statistics of Firms in 1996
All NICE Firms Firms That Issue Bonds in 1998
All Firms (N=6428)
Top 5 Chaebols
Only (N=83)
Top 6–30 Chaebols
Only (N=161)
Non-Chaebol
Firms (N=6186)
All Firms (N=507)
Top 5 Chaebols
Only (N=54)
Top 6–30 Chaebols
Only (N=59)
Non-Chaebol
Firms (N=394)
Log of Total Assets 16.7 19.7 18.9 16.6 18.9 20.9 20.2 18.5 (1.44) (2.10) (1.76) (1.33) (1.67) (1.48) (1.20) (1.46) Debt/Assets 0.78 0.75 0.83 0.78 0.74 0.78 0.77 0.73 (0.29) (0.20) (0.42) (0.29) (0.15) (0.13) (0.12) (0.16) Cash Flows/Assets 0.033 0.040 –0.007 0.034 0.044 0.044 0.026 0.046 (0.174) (0.117) (0.210) (0.174) (0.100) (0.084) (0.072) (0.106) Cash Volatility [1994–1996] 0.116 0.090 0.112 0.117 0.067 0.060 0.061 0.069 (0.122) (0.121) (0.175) (0.120) (0.053) (0.046) (0.041) (0.055) Modified Altman-Z Score 1.44 1.98 0.92 1.45 1.41 2.22 1.35 1.30 (1.58) (5.11) (1.86) (1.45) (2.25) (6.16) (1.97) (0.71) ROA 0.019 0.011 –0.015 0.020 0.019 0.010 0.007 0.022 (0.121) (0.108) (0.133) (0.121) (0.049) (0.039) (0.036) (0.052) Ownership Concentration (%) 46.3 6.8 12.0 48.1 26.1 6.5 9.3 31.6 (35.1) (18.1) (21.5) (34.7) (26.8) (18.4) (13.4) (27.0) Control-Ownership Rights Gap (%) 21.2 45.2 48.2 19.8 19.5 38.2 28.2 15.4 (33.5) (34.4) (38.0) (32.8) (28.7) (32.0) (30.1) (26.7)
N= number, NICE = National Information Credit Evaluation, ROA = return on assets.
Notes: 1. All reported summary statistics are with regards to firm observations in 1996. 2. Standard deviations are presented below the means in parentheses. 3. Debt/Assets is total liabilities over total assets. 4. Cash flows are operating cash flows plus depreciation and minus changes in accruals. 5. Cash volatility is the standard deviation of cash flows/assets from 1994-1996. 6. The modified altman-Z score is defined as 3.3*(EBIT/assets)+1.0*(sales/assets)+1.4*(retained earnings/assets)+1.2*(working capital/assets). ROA is ordinary income normalized by assets. 7. Ownership concentration is the sum of personal shareholder stakes found in the NICE ownership data. The control-ownership rights gap is the difference in the total sum of shareholdings for large shareholders and personal shareholding stakes.
Source: Authors’ estimates.

12 І ADB Economics Working Paper Series No. 314
Table 3: Correlations Between Key Variables
Log (Bond Flows
in 1998) ROA
in 1998 Top 5
Chaebol Top 6–30 Chaebol
Owner- ship
Conc.
Control-Owner-
ship Gap
Log (Total
Assets) Debt/
Assets Log(Bond Flows in 1998) 1.000 ROA in 1998 0.120 1.000 Top 5 Chaebol in 1996 0.446 –0.001 1.000 Top 6-30 Chaebol in 1996 0.229 –0.004 –0.0181 1.000 Ownership Concentration in 1996 –0.411 0.085 –0.144 –0.180 1.000 Control-Ownership Rights Gap in 1996 0.020 –0.013 0.092 0.150 –0.641 1.000 Log(Total Assets) in 1996 0.823 –0.001 0.238 0.244 –0.346 0.087 1.000 Debt/Assets in 1996 –0.075 –0.003 –0.011 0.026 0.117 –0.098 0.046 1.000
ROA = return of assets.
Notes: 1. The table reports pairwise correlations between key variables. 2. ROA refers to ordinary income / assets in 1998. 3. Top 5 and Top 6–30 chaebol indicator variables are determined using the 1996 Korean Fair Trade Commission listing of the top 30 chaebols. Firms entering a top 30 chaebol from 1997–2000 and firms that exit a chaebol from 1997–1998 are dropped. 4. Ownership concentration is Joh's sum of personal shareholdings using the largest eight shareholders identified by National Information Credit Evaluation (NICE). 5. The Control-Ownership Gap is Joh's difference between the sum of all large shareholdings and the sum of only personal shareholdings using the largest eight shareholders identified by NICE. 6. Both ownership concentration and the control-ownership rights gap are measured as of 1996. 7. 'Debt' refers to total liabilities.
Source: Authors’ estimates.
A. Chaebol Membership
A firm’s chaebol affiliation is determined using the KFTC annual publication of the 30 largest chaebols, according to total assets. This is the standard measure used both in the literature and by practitioners in the Republic of Korea. In our subsequent analysis, a firm is classified as chaebol-affiliated based on the 1996 listing of the top 30 chaebols. According to the KFTC, there are 343 firms affiliated with a top-30 chaebol in 1996. Because there is a large distinction between the largest five chaebols (Hyundai, Samsung, LG, Daewoo, and SK) and the next largest 25 chaebols, in terms of overall size, we also separately identify firms affiliated with a top five chaebols and those that are affiliated with the next 25 largest chaebols.
There was some merger activity during the period of interest, and it is not clear how
exactly to treat a firm that joins or leaves a chaebol. In our base regressions and descriptive statistics, we therefore drop all firms that become a member of a top-30 chaebol during 1997–2000 or leave a chaebol during 1997–1998. However, in our robustness checks, we add these firms to the sample and confirm that our results are robust to treating these firms as either non-chaebol or chaebol and clustering the standard errors on either pre- or post-crisis chaebol affiliation.
In our base regressions, we cluster the standard errors by chaebol to avoid overstating the findings, which might occur if financing decisions or idiosyncratic shocks occur at the group level rather than among individual firms. Our results are robust to not clustering.

Ending “Too Big to Fail”: Government Promises versus Investor Perceptions І 13 B. Financial Flows and Firm Characteristics
Our measures of firm-level financial flows, i.e., bonds, loans, and equity, are derived from operating activity cash flow data reported in a dataset compiled by the NICE. One of the largest credit evaluating firms in the Republic of Korea, NICE compiles and verifies firms’ annual financial statements submitted to the Korea Securities Supervisory Board. After excluding observations on financial firms, the NICE data set contains the financial statements for approximately 6,400 nonfinancial firms in 1996 and 8,800 firms by 2000.
The NICE financial dataset captures a large share of the Republic of Korea’s economy,
and the aggregate pattern of financial flows for firms in the dataset closely mirror those of the entire economy. This is shown in Figure 2, where we calculate the aggregate net equity, bond, and financial intermediary flows by year using NICE. The overall amount and changes in net financial flows reported by NICE are very similar to those reported by the Bank of Korea, as reported in Figure 1.20 Net financing from loans is almost zero in 1998, while financing from bond issues provides the primary source of capital in 1998. Equity-financing is relatively small, except in 1999.
Figure 2: Aggregate Net Financial Flows, as Reported by NICE (billion won)
NICE = National Information Credit Evaluation.
Note: This figure reports the aggregate corporate net financial flows for equity, bonds, and loans, by year as calculated from the NICE dataset.
Source: Authors’ estimates.
The chaebol-affiliated firms, particularly those in a top five chaebol, appear to issue a
disproportionate share of the bonds in the post-crisis years. This is seen in Table 1, where we report the number of firms that report positive cash inflows from bond issuances and the average gross bond flows normalized by assets for firms from 1996–2000. Between 500 and 600 firms issue bonds each year in the 3 years following the crisis, but about 20% of the issuers
20 Note that the Bank of Korea construction of net bond flows used in Figure 1 does not include bonds issued
overseas with foreign currency denomination, while our measurement of bond flows from the NICE data does include such bonds. Moreover, we cannot separate out commercial paper from our loans in the NICE data. Despite these differences in how the two datasets are constructed, the two series show the same general pattern.
−30,000−15,000
015,00030,00045,00060,00075,00090,000
105,000120,000
1990 1991 1992 1993 1994 1995 1996 1997 1998 1999 2000
Billi
on W
on
Bonds Equity Financial Intermediaries plus Commercial Paper

14 І ADB Economics Working Paper Series No. 314 are affiliated with a large chaebol even though these firms account for less than 4% of the firms in the NICE dataset. The chaebol-affiliated firms also issue far more bonds per unit of assets than non-chaebol firms. The average gross bond flows normalized by assets is around one from 1997–2000 for all firms, and for chaebol-affiliated firms, it is four times larger.
In 1998, the concentration of bond flows among the largest five chaebols is even starker.
Average gross bond flows normalized by assets is 10.9 for firms affiliated with the five largest chaebols, compared to just 0.93 for all firms. In fact, the 54 firms associated with the top five chaebols―and actively issuing bonds in 1998―accounted for 56% of the gross bond flows, though they only account for 10% of the firms that issue bonds in 1998. And the 59 firms associated with the next 25 largest chaebols and actively issuing bonds in 1998 accounted for 13% of gross bond flows in 1998.21
The number of firms with cash inflows from loans or equity in 1998 is larger, but the net
financial flows from loans and equity are much smaller than that of bond flows. As seen in Table 1, approximately 5,000 firms have positive net financial flows from loans in 1998. But, as shown in Figures 1 and 2, the net financial flows from the loan market were negative in 1998. Likewise, while around 1,000 firms issued equity in 1998, the aggregate volume of net equity financing did not become sizable until 1999. On aggregate, the bond market provided the primary source of capital in the year immediately following the financial crisis.
The NICE dataset also provides us a number of other key firm-level characteristics,
including firm size and leverage, which will be used as controls in our regressions. The log of total assets is used to control for overall firm size since larger firms naturally borrow more in levels. Findings are also robust to using second-, third-, and fourth-order polynomials of total assets to control for size or to controlling for size non-parametrically using fixed effects based on which decile a firm’s assets belong to . A firm’s leverage ratio, as measured by total debt divided by assets controls for a firm’s level of indebtedness and exposure to risk. We also control for the amount of cash flows generated by the firm. To do this, we calculate a firm’s cash flows normalized by assets, where cash flows are measured using operating cash flows plus depreciation and minus changes in accruals. To control for the volatility of a firm’s cash flow, we also calculate a firm’s cash volatility, which is the standard deviation of cash flows/assets from 1994–1996. Finally, to capture other potential risk exposures beyond leverage, we calculate the firms’ modified Altman Z-score.22
As expected, chaebol-affiliated firms are much larger and less profitable than non-
chaebol firms prior to the crisis. This is seen in Table 2, which provides descriptive statistics for both the entire sample of firms in NICE and those that issue bonds in 1998. Firms affiliated with a top-5 chaebol are 3.1 log points larger in total assets than non-chaebol firms, and nearly a log point larger than firms affiliated with the 25 largest chaebols. Overall, firms affiliated with a top 30 chaebol account for approximately 40% of total assets and 50% of total sales in 1996. Confirming that the top five are much larger than even the next 25 largest chaebols and more likely to be considered “too big to fail”, they alone account for 25% of assets and 36% of sales. At the same time, however, firms affiliated with a top 30 chaebol are less profitable than non-
21 Total gross bond flows in 1998 for firms in the NICE data were W71.9 trillion, of which firms in top five chaebols
accounted for W40.2 trillion, and firms in next 25 largest chaebols accounted for W9.1 trillion. 22 Following MacKie-Mason (1990), we calculate a modified-Altman Z-score as 3.3*(EBIT/assets) +
1.0*(sales/assets) + 1.4*(retained earnings/assets) + 1.2*(working capital/assets). Since we do not have stock price data, we are unable to calculate firms’ ratio of market equity to book debt, and instead control for book leverage separately.

Ending “Too Big to Fail”: Government Promises versus Investor Perceptions І 15 chaebol firms, as captured by a lower return on assets in 1996. This is also true among the subset of firms that successfully issue bonds in 1998. C. Corporate Governance
To construct our pre-crisis measures of corporate governance—which again will serve as one proxy for firms’ ability to invest funds successfully after the financial crisis (and the likelihood that such returns would benefit outside equity holders and creditors)—we use the NICE ownership data. This dataset lists the eight largest shareholders and their ownership stake for a subset of the firms found in the larger financial dataset provided by NICE. Ownership data is available for approximately 3,500 firms in 1996.23 We use two variables to measure corporate governance: control-ownership rights gap and ownership concentration. Both of these variables were used by Joh (2003) and are derived using ownership data provided by NICE.
To construct these two corporate governance measures, we first calculate the ownership
(cash flow) and control rights of the controlling family in each firm. Since the controlling family or founders of the firm are typically the largest shareholder, we calculate the ownership rights of the controlling family by summing up all personal holdings among the largest eight shareholders reported by NICE. Thus, all institutional shareholders (financial institutions and nonfinancial corporations), foreign owners, government, and employee stock ownership are excluded. It is necessary to sum overall personal shareholdings since some shares are often controlled by spouses or family members of the spouse, and it is not possible to distinguish such family connections in the Republic of Korea as wives do not adopt their husband's last name. The control rights of these shareholders are then approximated using the total sum of ownership stakes for all eight of the largest shareholders, including the non-personal holdings excluded from the measure of ownership rights. The implicit assumption is that these non-personal shareholdings among the largest shareholders are companies which are indirectly controlled by the founding family of the firm, which is typically the case in the Republic of Korea.24
Our first measure of corporate governance is the control-ownership rights gap, which is
calculated by taking the difference between the control and ownership rights. This measure captures the degree to which ownership and control rights are aligned within each firm. Firms with a greater spread between the control and ownership stakes of the top shareholders are more susceptible to poor management and misaligned incentives―definitely not in the interest of outside equity holders and creditors. Therefore, a larger control-ownership gap represents weaker corporate governance and should be negatively related to firm performance and positively related to default risk. In fact, this negative correlation with firm performance has been documented in a number of papers that analyze firms in the Republic of Korea (Joh 2003; Lemmon and Lins 2003; Baek, Kang, and Park 2004), and is also present in our dataset. As seen in Table 3, where we report correlations between our key variables, the control-ownership rights gap is negatively correlated to ROA in 1996.
Our second measure of corporate governance will be the ownership concentration of the
firm, which is measured using the ownership (cash flow) rights of the controlling family. The inability of some institutional or smaller shareholders to exercise voting rights under regulations of the Republic of Korea often allows a large shareholder to maintain control with a very small ownership stake. Controlling shareholders with a larger ownership stake likely face better
23 The pattern of total finance flows exhibited in the economy-wide data (Figure 1) and full sample of firms (Figure 2)
also persists in the more restricted sample of firms with ownership data. 24 See Joh (2003) for more details on constructing the both measures of corporate governance.

16 І ADB Economics Working Paper Series No. 314 incentives, and thus, greater ownership concentration represents a firm with better corporate governance and should be positively related to firm performance―and to the prospect that bond holders will be repaid. Again, a number of papers have shown this positive correlation between ownership concentration and firm performance to be true in the Republic of Korea (Joh 2003; Mitton 2002; Baek, Kang, and Park 2004), and we find it in our dataset as well. This is shown in Table 3.
The summary statistics also support the anecdotal evidence that chaebol-affiliated firms
exhibit very weak corporate governance structures. As seen in Table 2, chaebol-affiliated firms have a much larger control-ownership gap and lower ownership concentration than non-chaebol firms. The control-ownership rights gap is more than twice as large for chaebol-affiliated firms in both the full sample of firms and in the smaller sample of firms that issue bonds in 1998. And, ownership concentration of chaebol-affiliated firms averages only 7%–10% compared to 48% for non-chaebol firms in the full sample and 32% in the sample of non-chaebol firms that issue bonds in 1998.
As required for our empirical strategy, the corporate governance measures are also
highly persistent over time for firms. From 1993–1997, both measures exhibit serial correlation coefficients of about 0.93. Additionally, as is shown in later analysis, both measures are correlated with firm performance following the financial crisis. This supports our assumption that these measures provide valid proxies for firms’ ability to invest funds successfully after the financial crisis.
V. RESULTS AND INTERPRETATION A. Access to Bonds in 1998
Firms affiliated with the largest chaebols received a disproportionate amount of the bond financing in 1998. This is seen in Table 4, column (i), where we regress the log of gross bond flows in 1998 onto pre-crisis measures of firm’s chaebol affiliation, industry fixed effects, and other firm-level controls for size and leverage. The top five chaebol dummy is positive and highly significant. Being a member of a top five chaebol is associated with a 1.2 log point increase in gross bond flows for a firm in 1998 relative to other firms in the same industry that also issue bonds in that year. This effect is large. One log point in the gross bond flows regression is about half a standard deviation in our sample, and the average log of gross bond flows in 1998 for all firms in the Republic of Korea is 16.2. The dummy for being a chaebol in the top 30 (but not the top five) is also significant, though the magnitude of the effect is about one-third of that observed for the largest five chaebols.25 As expected, size is a strong positive predictor of gross bond flows and leverage is a negative predictor.
25 The smaller coefficient for the next largest 25 chaebols likely reflects that “too big to fail” beliefs were less for
these firms. As noted earlier, these next 25 largest chaebols were considerably smaller than the top five chaebols, and the government tried to establish a no bailout policy by allowing Hanil, the 27th largest chaebol in 1997, to enter bankruptcy in the second half of 1998.

Ending “Too Big to Fail”: Government Promises versus Investor Perceptions І 17
Table 4: Post-Crisis Bond Flows, Chaebol Affiliation and Governance
Dependent Variable =
Log(Bond Flows in 1998) (i) (ii) (iii) (iv)
Top 5 Chaebol 1.234*** 1.352*** 1.463*** 1.303*** (0.275) (0.355) (0.348) (0.254) Top 6–30 Chaebol 0.516** 0.536* 0.596** 0.579*** (0.213) (0.289) (0.295) (0.211) Log(Assets) 1.004*** 1.136*** 1.108*** 1.027*** (0.049) (0.076) (0.072) (0.053) Debt/Assets –1.165** –2.021*** –1.887*** –1.059* (0.570) (0.699) (0.629) (0.573) Ownership Concentration 0.251 (0.467) Control-Ownership Difference –0.586* (0.324) Cash Flows / Assets 1.662* (1.003) Cash Volatility 2.442 (1.959) Modified Altman Z-Score –0.002 (0.016) Industry Fixed Effects Yes Yse Yse Yes Observations 504 349 349 476 R-squared 0.75 0.76 0.76 0.76
* = 10% level, ** = 5% level, *** = 1% level. EBIT = earnings before interest and taxes, KTFC = Korean Fair Trade Commission, NICE = National Information Credit Evaluation, OLS = ordinary least squares, RHS = right hand side.
Notes: 1. The table reports coefficients from firm-level regressions of log 1998 gross bond flows (in thousand Won) onto three-digit industry fixed effects and pre-crisis firm characteristics using ordinary least squares with standard errors clustered around chaebol affiliation. 2. All RHS variables are measured with respect to 1996. 3. Top 5 and Top 6–30 chaebol indicator variables are determined using the 1996 KFTC listing of the top 30 chaebols. Firms entering a top 30 chaebol from 1997–2000 and firms that exit a chaebol from 1997–1998 are dropped. 4. 'Debt' refers to total liabilities. 5. Ownership concentration is Joh's sum of personal shareholdings using the largest eight shareholders identified by NICE. 6. The control-ownership gap is Joh's difference between the sum of all large shareholdings and the sum of only personal shareholdings using the largest eight shareholders identified by NICE. 7. 'Cash flows' are operating cash flows plus depreciation and minus changes in accruals. 8. 'Cash volatility' is the standard deviation of cash flows/assets from 1994–1996. The modified Altman Z-score is defined as 3.3*(EBIT/assets) + 1.0*(sales / assets) + 1.4*(retained earnings / assets) + 1.2*(working capital / assets).
Source: Authors’ estimates.
The large flow of bond financing to chaebol-affiliated firms does not appear driven by
these firms possessing better governance. Using corporate governance structures prior to the crisis as another proxy for firms’ post-crisis ability to implement projects successfully after the crisis, we still find a very strong relationship between chaebol-affiliation and gross bond flows. Adding our control for ownership concentration in column (ii) of Table 4, we do not find any correlation between ownership concentration and bond flows in 1998. But, we do find a negative relationship between control-ownership rights gap and bond flows [column (iii)], which weakly suggests that firms with worse governance issued fewer bonds. Both the top five chaebol and top 6–30 chaebol indicators, however, remain positive and highly significant predictors of bond flows after the crisis.
The disproportionate access to bonds for firms affiliated with the largest chaebols also
strongly suggests that these financial flows were not related to firms’ presumed ability to invest the funds successfully. As shown earlier, chaebol-affiliated firms typically had the weakest corporate governance structures and overall profitability prior to the crisis. As a robustness

18 І ADB Economics Working Paper Series No. 314 check, we also confirm that firms’ pre-crisis profitability is also not positively related to post-crisis bond flows.
Other firm-level differences in risk exposure or access to cash do not seem to explain
the preferential access to bond financing for chaebol-affiliated firms. In column (iv) of Table 4, we instead use pre-crisis controls for cash flows, volatility of cash flows, and bankruptcy risk, as measured by the modified Altman z-score. Again, both chaebol indicators remain a strong positive predictor of bond flows. In unreported regressions, the results are also robust to adding controls for exports/sales and foreign currency borrowings/total liabilities, which suggest that chaebols’ ability to issue bonds is not driven by better export opportunities or better access to international capital markets. We also found that the results are robust to adding controls for cash/assets, R&D expenses, market share, and training expenditures. And, as mentioned earlier, all findings are robust to alternative forms of clustering the standard errors.
One possibility is that chaebol-affiliation simply proxies for overall size. As seen in Table
2, chaebol-affiliated firms are much larger than the average firm. Since larger firms are likely to issue more bonds, one must worry that our control of size, log(total assets), is insufficient to capture the importance of size. However, the results for chaebol-affiliation in Table 4 are robust to adding nonlinear size controls to the estimation such as second-, third-, and fourth-order polynomial controls for total assets. The findings are also robust to restricting our sample to only the 500 largest firms, based on total assets in 1996, and re-estimating the equation.26 And, the results are robust to non-parametrically controlling for the size of assets by including fixed effects based on which decile a firm’s assets belong to in 1996.
Another possibility, however, may be that investors perceive chaebol-affiliated firms to
possess a larger asset base to collateralize the bonds issued by the firm. In particular, chaebol-affiliated firms may benefit from cross-debt guarantees from their affiliated firms, leading investors to view the bonds as potentially backed by the entire group’s asset base, rather than just the firm’s individual assets. If this were true, then controlling for an individual firm’s assets alone will not be sufficient. Additionally, it is possible that investors perceive chaebol-affiliated firms to be safer investments because an entire chaebols’ operations will be more diversified than that of any single firm, providing another implicit benefit of any cross-debt guarantees or cross-subsidization within the chaebol. If this is true, then controlling for an individual firm’s riskiness (such as cash flow volatility or the modified Altman Z-Score) will not adequately capture investors’ perception of risk for a chaebol-affiliated firm.
26 These estimates are reported in Appendix Table III. Our findings are also robust to using net bond finance flows
normalized by total assets as the dependent variable instead of Log(gross bond flows). These estimates are reported in Appendix Table 4.

Ending “Too Big to Fail”: Government Promises versus Investor Perceptions І 19
However, new cross-debt guarantees were not allowed in the crisis, i.e., existing arrangements stayed in place, but any new debt issue (e.g., in the form of bonds) was not allowed to be cross-guaranteed within a chaebol (or in any other way). This was a condition of the IMF loan that helped stabilize the macroeconomy, and it was viewed as an important element of the overall economic policy both by the government and by the US Treasury. There was rigorous enforcement for the letter of this rule, which pertained to explicit cross-debt guarantees.27 Implicit cross-guarantees, which might occur through tunneling of cash among group members, is also unlikely to explain our findings since the companies issuing bonds were often the largest in the chaebol making it unlikely that the other group members had sufficiently deep pockets to bail them out.28
To further exclude the possibility of implicit cross-debt guarantees driving our results, we
re-estimate our main regression after aggregating chaebol-affiliated firms up to the group level and treating an entire chaebol as just one observation. In particular, we calculate total assets, gross bond flows, and our other controls for cash flows and bankruptcy risk at the group level. For our corporate governance measures, we use the average ownership concentration and control-ownership rights gap of the group members as the proxy for the entire group. In unreported results, we also tried using the maximum and minimum levels of governance within the group, and the subsequent results were unchanged. Because it is not possible to classify a groups’ industry, we do not include industry–year fixed effects. The estimates from these aggregated regressions are reported in Table 5.
The disproportionate access of chaebol-affiliated firms does not appear driven by implicit
cross-debt guarantees. As seen in Table 5, column (i), the five largest chaebols still receive a much larger share of bond financing in 1998 at the group level. The estimates suggest that a top five chaebol group received about 1.6 log point larger flow of bonds in 1998, even after controlling for the entire group’s level of assets and overall leverage ratio. There is also still a large, positive relation between bond financing and affiliation with a top 6–30 chaebol, though it is no longer always statistically significant at conventional levels. Again, we find no relation between corporate governance and bond financing in 1998 [columns (ii)–(iii)]. Controlling for the overall cash flows, cash volatility, and modified Altman Z-score of the group [column (iv)] also does not affect the large, positive relation between bond financing and the chaebol indicators.29 In unreported regressions, the results are also robust to adding controls for exports/sales, foreign currency borrowings/total liabilities, cash/assets, research and development expenses, and market share.
27 See paragraph 37 in the Republic of Korea’s 3 December 1997 Letter of Intent to the IMF:
(http://www.imf.org/external/np/loi/120397.htm). In the official IMF summary of the program, the ban on new cross-guarantees (referred to as phasing out) is in the third bullet point (see http://www.imf.org/External/np/exr/facts/asia.pdf). We have checked that this formal language matched the reality on the ground through interviews with the Republic of Korea government officials and IMF officials, as well as with people active in the Korean bond market.
28 The subsequent failure and government bailout of Daewoo in 1999 confirms that other group members did not have the ability to tunnel sufficient resources to avoid another group member’s default.
29 The chaebols’ ownership of some key investment trust companies (ITCs) also does not explain their disproportionate access to bonds. ITCs were used by many individuals and institutional investors to purchase bonds in 1998 and chaebols’ ownership may have influenced the portfolio choices of these ITCs. However, fund managers in these ITCs faced institutional limits on buying bonds of their affiliates, and ITCs unaffiliated with chaebols also heavily invested in bonds issued by the chaebols.

20 І ADB Economics Working Paper Series No. 314
Table 5: Bond Flows at Group Level
Dependent Variable =
Log(Bond Flows in 1998) (i) (ii) (iii) (iv)
Top 5 Chaebol 1.620*** 1.499*** 1.642*** 1.715*** (0.272) (0.346) (0.360) (0.358) Top 6–30 Chaebol 0.405 0.492 0.604* 0.526* (0.301) (0.313) (0.318) (0.307) Log(Assets) 0.988*** 1.047*** 1.048*** 1.011*** (0.043) (0.067) (0.055) (0.049) Debt / Assets –1.772*** –2.787*** –2.728*** –2.048*** (0.518) (0.606) (0.504) (0.428) Ownership Concentration 0.011 (0.485) Control-Ownership Difference –0.491 (0.326) Cash Flows / Assets 1.305 (0.964) Cash Volatility 4.797*** (1.779) Modified Altman Z-Score –0.062 (0.129) Observations 415 289 289 393 R-squared 0.66 0.69 0.70 0.67
* = 10% level, ** = 5% level, *** = 1% level, EBIT = earnings before interest and taxes, KFTC = Korean Fair Trade Commission, NICE = National Information Credit Evaluation, RHS = right hand side, OLS = ordinary least squares.
Notes: 1. The table reports coefficients from group-level regressions of log 1998 gross bond flows (in thousand won) onto pre-crisis firm characteristics using OLS with standard errors clustered around chaebol affiliation. For firms affiliated with a chaebol, all variables are aggregated to the chaebol-level, and the chaebol is treated as one observation. 2. All RHS variables are measured with respect to 1996. 3. Top 5 and Top 6–30 chaebol indicator variables are determined using the 1996 KFTC listing of the top 30 chaebols. Firms entering a top 30 chaebol from 1997–2000 and firms that exit a chaebol from 1997–1998 are dropped. 4. Debt refers to total liabilities . 5. Ownership concentration is Joh's sum of personal shareholdings using the largest eight shareholders identified by NICE. 6. The control-ownership gap is Joh's difference between the sum of all large shareholdings and the sum of only personal shareholdings using the largest eight shareholders identified by NICE. 7. Cash flows are operating cash flows plus depreciation and minus changes in accruals. 8. Cash volatility is the standard deviation of cash flows/assets from 1994–1996. 9. The modified Altman Z-score is defined as 3.3*(EBIT/assets) + 1.0*(sales/assets) + 1.4*(retained earnings/assets) + 1.2*(working capital/assets).
Source: Authors’ estimates.
Overall, the firm-level regressions confirm the aggregate trends and suggest that bonds
were issued in 1998 predominately by chaebol-affiliated firms, particularly firms affiliated with the five biggest chaebols. The results are robust to industry fixed effects and numerous controls for the overall size of these firms and the possibility that investors may have perceived the existence of cross-debt guarantees among firms within a chaebol. Moreover, there is no evidence that bond were related to our alternative measure of firm performance, corporate governance from prior to the crisis. The primary beneficiaries of bonds, firms affiliated with the largest five chaebols, on average, had very poor corporate governance structures. This evidence appears to run counter to the notion that bond investors sought out firms best able to invest funds. Instead, it suggests that “too big to fail” beliefs may have affected investors’ willingness to buy massive amounts of bonds from firms affiliated with chaebols.

Ending “Too Big to Fail”: Government Promises versus Investor Perceptions І 21 B. Yield to Maturity and Default Risk
It is possible, however, that the poor corporate governance and default risk of firms issuing bonds was instead accounted for in the return (yield to maturity [YTM]) of the bonds being issued. To test this, we obtained data on the YTM for every publicly placed corporate bond in the Republic of Korea along with the amount and issue date of each bond issuance. In total, there were 1,175 public bond issues in 1998. Using company names, we match the issuance-level data to a firm’s financial and chaebol-affiliation data used in the previous regressions. After doing this and excluding financial firms, we were left with data on 737 bond issues in 1998.
Using a similar specification as before, we regress a bond’s YTM at time of issuance in
1998 on industry-fixed effects and firm-level characteristics measured using pre-crisis (1996) data. We are interested in seeing whether pre-crisis corporate governance or chaebol-affiliation was priced by investors purchasing bonds in 1998. This would indicate that the disproportionate amount of bonds issued by the chaebol-affiliated firms and other firms with the poor corporate governance were at least priced appropriately. To capture any aggregate monthly trend in interest rates throughout 1998, we also include monthly time dummies in the regression. These regressions are reported in Table 6.
Table 6: Bond YTMs, Chaebol Affiliation and Corporate Governance
Dependent Variable =
YTM of Bond Issue (i) (ii) (iii) (iv)
Top 5 Chaebol –1.696*** –2.137*** –2.280*** –2.086*** (0.541) (0.611) (0.670) (0.725) Top 6–30 Chaebol 1.320* 1.034 0.347 0.642 (0.772) (0.843) (0.675) (0.646) Log(Total Assets) 0.148 0.05 0.089 (0.139) (0.204) (0.208) Debt / Assets 2.810* 4.409** 4.458** (1.667) (1.928) (1.936) Ownership Concentration –4.414 (3.300) Control-Ownership Difference 0.913 (1.265) Industry Fixed Effects Yes Yes Yes Yes Time (Month) fixed effects Yes Yes Yes Yes Observations 737 737 482 482 R-squared 0.41 0.41 0.67 0.67
* = 10% level, ** = 5% level, *** = 1% level, KFTC = Korean Fair Trade Commission, NICE = National Information Credit Evaluation, OLS = ordinary least squares, RHS = right hand side, YTM = yield to maturity.
Notes: 1. The table reports coefficients from bond-issuance level regressions of 1998 bond YTMs onto three-digit industy fixed effects and pre-crisis firm characteristics and time (month) dummies using OLS with standard errors clustered around chaebol affiliation. 2. Dependent variable is the YTM of bonds (in %) at the time of issuance in 1998. 3. All RHS variables are measured with respect to 1996 levels. 4. Top 5 and Top 6–30 chaebol indicator variables are determined using the 1996 KFTC listing of the top 30 chaebols. Firms entering a top 30 chaebol from 1997–2000 and firms that exit a chaebol from 1997–1998 are dropped. 5. Debt refers to total. 6. Ownership concentration is Joh's sum of personal shareholdings using the largest eight shareholders identified by NICE. 7. The control-ownership gap is Joh's difference between the sum of all large shareholdings and the sum of only personal shareholdings using the largest eight shareholders identified by NICE.
Source: Authors’ estijmates.

22 І ADB Economics Working Paper Series No. 314
Overall, firms affiliated with a top five chaebol actually paid a lower YTM on their bonds in 1998. On average, top five chaebol-affiliated bonds were issued at a YTM about 1.7 percentage points less than other firms in the same industry [Table 6, column (i)]. The negative correlation between YTM and top five chaebol affiliation holds even after controlling for firm size and leverage [column (ii)]. In unreported regressions, we also find the negative correlation is robust to controlling for firm’s potential exposure to exchange rate fluctuations, as captured by exports/sales and foreign currency borrowings/total liabilities. This negative correlation indicates that investors did not perceive the bonds issued by firms affiliated with the top five chaebols to be risky investments. There is less evidence, however, that firms in a 25 next largest chaebols issued bonds at lower YTMs on average than non-chaebol firms.
The lower YTM on the bond issues of chaebol-affiliated firms is robust to including our
alternative proxy for default risk―a firm’s pre-crisis corporate governance. Neither measure of corporate governance is significantly related to YTM in 1998, suggesting that corporate governance was not priced by investors, and a top five chaebol affiliation is still strongly and negatively related to YTM [Table 6, columns (iii)–(iv)]. Moreover, the fact that top five chaebol-affiliated firms were able to issue bonds at a lower YTM than the average firm, despite chaebol-affiliated firms typically had the worst governance and profitability prior to the crisis, further suggests that investors willingness to hold these bonds was not related to firms’ ability to invest the funds successfully.
Chaebol-affiliated firms’ ability to issue bonds at a lower YTM also does not appear to be
related to the amount or maturity of the bonds being issued by these firms. There was very little variation in the maturity of the bonds in 1998; about two-thirds of the bonds were issued with a standard three-year maturity, and nearly all of the rest had a one- or two-year maturity. And adding controls for the size of issue also does not affect our findings [Table 7, column (i)].
One possibility, however, is that chaebol-affiliated firms were less likely to default for
other reasons not captured by size, leverage, or greater ability to invest funds successfully (as measured by industry fixed effects and pre-crisis corporate governance), issuance size, or maturity. To test for this possibility, we next added a control for a firms’ overall credit rating at the time of the bond issuance.

Ending “Too Big to Fail”: Government Promises versus Investor Perceptions І 23
Table 7: Bond YTMs and Default Risk
Dependent Variable =
YTM of Bond Issue
(i) (ii) (iii)Top 5 Chaebol –2.066*** –1.858* –2.059*** (0.575) (1.077) (0.575) Top 6–30 Chaebol 1.027 1.14 1.039 (0.838) (0.955) (0.831) Log(Total Assets) 0.224 0.879** 0.22 (0.270) (0.347) (0.266) Debt / Assets 2.784* 1.895 2.738* (1.640) (2.771) (1.608) Log(Amount Issued) –0.129 –0.337 –0.135 (0.347) (0.309) (0.357) Credit Rating –0.107 (0.126) Eventual Default 0.188 (0.580) Industry Fixed Effects Yes Yes Yes Time (Month) Dummies Yes Yes Yes Observations 737 506 737 R-squared 0.41 0.55 0.41
* = 10% level, ** = 5% level, *** = 1% level, OLS = ordinary least squares, YTM = yield to maturity.
Notes: 1. The table reports coefficients from bond-issuance level regressions of 1998 bond YTMs onto three-digit industry fixed effects, bond and risk characteristics, and time (month) dummies using OLS with standard errors clustered around chaebol affiliation. 2. Dependent variable is the YTM of bonds (in %) at the time of issuance in 1998. 3. Maturity is the number of years at time of issuance before the bond matures. 4. All other RHS variables are measured with respect to 1996 levels. 5. Standard errors clustered at the chaebol level are reported in parentheses. 6. Debt refers to total liabilities. 7. Amount Issued is the total amount of the bond issuance (thousand wons). 8. Credit rating captures the average credit rating of a firm's bonds where AAA+ = 27, AAA = 26, AAA– = 25, and so on to D = 0. 9. Bankruptcy equals 1, if a firm declared bankruptcy between 1999–2001.
Source: Authors’ estimates.
To control for credit ratings, we obtained the history of credit ratings reported by three of
the Republic of Korea’s largest credit rating agencies: NICE, Korea Investors Service, and Korea Ratings Corporation. Following the financial crises, each firm making a public issue of bonds was required to obtain a credit rating from two credit agencies. We then match these credit ratings to the bond issuance data using company names and transform each rating into a numerical value. For example, an AAA credit rating is assigned a score of 26, whereas a credit score of AAA– is assigned a score of 25, and so on. If the two agencies reporting a credit rating for the firm differ in their rating, we take the average of the two ratings. Of the 737 bond issues that we have YTM and firm-level data, we are able to match credit ratings for 506 of the bond issues.
Surprisingly, there is no evidence to indicate that a bond’s YTM was related to a firm’s
credit rating [Table 7, column (ii)]. While the coefficient is negative, the estimate is not statistically significant. Chaebol affiliation remains a strong, negative predictor of YTM. This indicates that chaebol-affiliated firms’ lower YTM is not driven by a better credit rating and that chaebol-affiliated firms were able to issue bonds at a lower YTM relative to firms of similar industry, size, leverage, and credit rating.
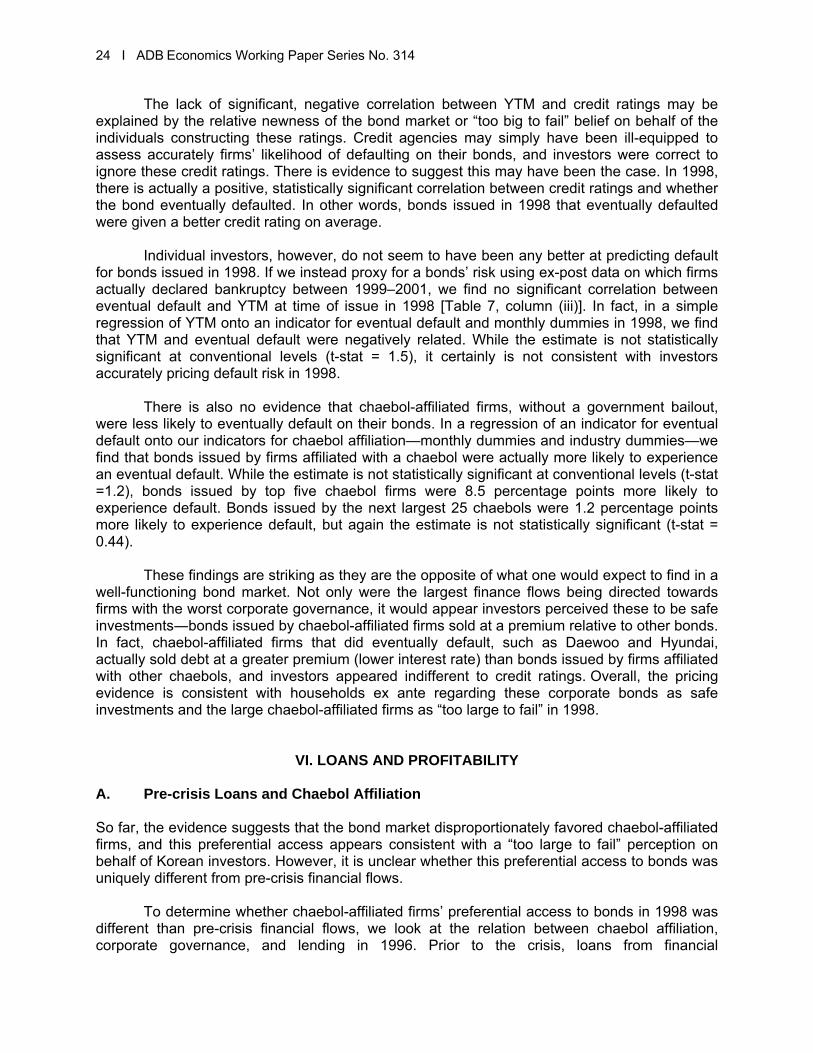
24 І ADB Economics Working Paper Series No. 314
The lack of significant, negative correlation between YTM and credit ratings may be explained by the relative newness of the bond market or “too big to fail” belief on behalf of the individuals constructing these ratings. Credit agencies may simply have been ill-equipped to assess accurately firms’ likelihood of defaulting on their bonds, and investors were correct to ignore these credit ratings. There is evidence to suggest this may have been the case. In 1998, there is actually a positive, statistically significant correlation between credit ratings and whether the bond eventually defaulted. In other words, bonds issued in 1998 that eventually defaulted were given a better credit rating on average.
Individual investors, however, do not seem to have been any better at predicting default
for bonds issued in 1998. If we instead proxy for a bonds’ risk using ex-post data on which firms actually declared bankruptcy between 1999–2001, we find no significant correlation between eventual default and YTM at time of issue in 1998 [Table 7, column (iii)]. In fact, in a simple regression of YTM onto an indicator for eventual default and monthly dummies in 1998, we find that YTM and eventual default were negatively related. While the estimate is not statistically significant at conventional levels (t-stat = 1.5), it certainly is not consistent with investors accurately pricing default risk in 1998.
There is also no evidence that chaebol-affiliated firms, without a government bailout,
were less likely to eventually default on their bonds. In a regression of an indicator for eventual default onto our indicators for chaebol affiliation—monthly dummies and industry dummies—we find that bonds issued by firms affiliated with a chaebol were actually more likely to experience an eventual default. While the estimate is not statistically significant at conventional levels (t-stat =1.2), bonds issued by top five chaebol firms were 8.5 percentage points more likely to experience default. Bonds issued by the next largest 25 chaebols were 1.2 percentage points more likely to experience default, but again the estimate is not statistically significant (t-stat = 0.44).
These findings are striking as they are the opposite of what one would expect to find in a
well-functioning bond market. Not only were the largest finance flows being directed towards firms with the worst corporate governance, it would appear investors perceived these to be safe investments―bonds issued by chaebol-affiliated firms sold at a premium relative to other bonds. In fact, chaebol-affiliated firms that did eventually default, such as Daewoo and Hyundai, actually sold debt at a greater premium (lower interest rate) than bonds issued by firms affiliated with other chaebols, and investors appeared indifferent to credit ratings. Overall, the pricing evidence is consistent with households ex ante regarding these corporate bonds as safe investments and the large chaebol-affiliated firms as “too large to fail” in 1998.
VI. LOANS AND PROFITABILITY
A. Pre-crisis Loans and Chaebol Affiliation
So far, the evidence suggests that the bond market disproportionately favored chaebol-affiliated firms, and this preferential access appears consistent with a “too large to fail” perception on behalf of Korean investors. However, it is unclear whether this preferential access to bonds was uniquely different from pre-crisis financial flows.
To determine whether chaebol-affiliated firms’ preferential access to bonds in 1998 was
different than pre-crisis financial flows, we look at the relation between chaebol affiliation, corporate governance, and lending in 1996. Prior to the crisis, loans from financial

Ending “Too Big to Fail”: Government Promises versus Investor Perceptions І 25 intermediaries were the primary means to raise capital in the Republic of Korea. Looking at loan flows in 1996, before the onset of the financial crisis, allows us to see whether chaebol-affiliated firms also enjoyed preferential access to capital prior to the crisis. In particular, we now use log of gross loan flows before the crisis in 1996 as the dependent variable, and our control variables are constructed using data from 1995. These estimates are reported in Table 8.
Firms affiliated with the largest chaebols did not appear to receive a disproportionate
share of the loan financing prior to the crisis relative to other firms in the same industry. The top five chaebol dummies are mostly negative in Table 8, and not statistically significant from zero. There is only weak evidence that firms affiliated with the next largest 25 chaebols received a larger amount of loans relative to other firms in the same industry. This suggests that the financial flows following the crisis were even more concentrated among the chaebol-affiliated firms then financial flows before the crisis.
Table 8: Pre-Crisis Loan Flows, Chaebol Affiliation, and Governance
Dependent Variable =
Log(Loan Flows in 1996) (i) (ii) (iii) (iv)
Top 5 Chaebol 0.083 –0.011 –0.027 –0.017 (0.290) (0.246) (0.246) (0.221) Top 6-30 Chaebol 0.450*** 0.266 0.251 0.373** (0.163) (0.192) (0.193) (0.166) Log(Assets) 1.077*** 1.127*** 1.126*** 1.106*** (0.024) (0.031) (0.029) (0.024) Debt/Assets 1.181*** 1.421*** 1.425*** 1.082*** (0.134) (0.191) (0.191) (0.153) Ownership Concentration 0.011 (0.093) Control-Ownership Difference 0.061 (0.100) Cash Flows/Assets –0.490** (0.190) Cash Volatility 0.835*** (0.280) Modified Altman Z-Score –0.045** (0.020) Industry Fixed Effects Yes Yes Yes Yes Observations 4,246 2,678 2,678 3,923 R-squared 0.50 0.54 0.54 0.53
* = 10% level, ** = 5% level, *** = 1% level, EBIT = earnings before interest and taxes, KFTC = Korean Fair Trade Commission, NICE = National Information Credit Evaluation, OLS = ordinary least squares, RHS = right hand side.
Notes: 1. The table reports coefficients from firm-level regressions of log 1996 gross loan flows (in thousand wons) onto three-digit industry fixed effects and firm characteristics using OLS with standard errors clustered around chaebol affiliation. 2. Top 5 and Top 6–30 chaebol indicator variables are determined using the 1996 KFTC listing of the top 30 chaebols. All remaining RHS variables are measured with respect to 1995 levels. 3. Debt refers to total liabilities . 4. Ownership concentration is Joh's sum of personal shareholdings using the largest eight shareholders identified by NICE in 1996. 5. The control-ownership gap is Joh's difference between the sum of all large shareholdings and the sum of only personal shareholdings using the largest eight shareholders identified by NICE in 1996. 6. Cash flows are operating cash flows plus depreciation, and minus changes in accruals. 7. Cash volatility is the standard deviation of cash flows/assets from 1994–1996. 8. The modified Altman Z-score is defined as 3.3*(EBIT / assets) + 1.0*(sales / assets) + 1.4*(retained earnings / assets) + 1.2*(working capital / assets).
Source: Authors’ estimates.

26 І ADB Economics Working Paper Series No. 314 B. Corporate Governance & Post-Crisis Profitability
In our specifications that include governance measures, we presume firms with better pre-crisis corporate governance are more likely to make effective use of financing in the post-crisis years. Earlier evidence pertaining to Korean firms and corporate governance before and during the crisis suggests this to be true (Joh 2003; Baek, Kang, and Park 2004). In Table 9, we test this directly by regressing ROA into our chaebol dummies and ownership concentration for each post-crisis year.
Table 9: Post-Crisis Profitability, Chaebol Affiliation and Governance
Dependent Variable = 1998 ROA 1999 ROA 2000 ROA(i) (ii) (iii) (iv) (v) (vi)
Top 5 Chaebol 0.031** 0.086*** –0.023 0.037 –0.292 –0.191 (0.013) (0.018) (0.046) (0.038) (0.342) (0.299) Top 6–30 Chaebol –0.01 0.025 –0.027 0.023 0.032 0.089** (0.017) (0.019) (0.022) (0.027) (0.021) (0.039) Ownership Concentration 0.070*** 0.041*** 0.036*** 0.016* 0.044*** 0.004 (0.013) (0.010) (0.009) (0.009) (0.014) (0.019) Industry Fixed Effects Yes Yes Yes Yes Yes Yes Additional Controls Yes Yes Yes Observations 2,277 2,168 2,277 2,168 2,277 2,168 R-squared 0.130 0.200 0.070 0.140 0.060 0.100
. * = 10% level, ** = 5% level, *** = 1% level, KFTC = Korean Fair Trade Commission, NICE = National Information Credit Evaluation, OLS = ordinary least squares, RHS = right hand side, ROA = return on assets.
Notes: 1. The table reports coefficients from firm-level regressions of post-crisis ratio net income over total assets onto three-digit industry fixed effects and pre-crisis firm characteristics using OLS, with standard errors clustered around chaebol affiliation. 2. To ensure a consistent sample across years, only firms in a 1996–2000 balanced panel were included, and all RHS variables are measured with respect to 1996 levels. 3. Top 5 and Top 6–30 chaebol indicator variables are determined using the 1996 KFTC listing of the top 30 chaebols. Firms entering a top 30 chaebol from 1997–2000 and firms that exit a chaebol from 1997–1998 are dropped. 4. Ownership concentration is Joh's sum of personal shareholdings using the largest eight shareholders identified by NICE. 5. Additional controls included in columns (ii), (iv), and (vi) include Log(Total Assets), Debt/Assets , Cash flows/Assets, Cash volatility, and the modified Altman Z-score
Source: Authors’ estimates.
In 1998, the coefficient estimate for ownership concentration is positive and significant indicating that firms with better corporate governance prior to the crisis were, in fact, more profitable on average immediately after the crisis. This is striking given our earlier estimates indicate that these firms with greater ownership concentration were no more likely to issue bonds in 1998. In unreported results, we also found a negative correlation between our second governance measure, the control-ownership rights gap, and ROA in 1998 as we might expect, though the estimate is not significant at conventional levels. In further support that firms with better pre-crisis corporate governance are more likely to make effective use of financing in the post-crisis years, ownership concentration remains a strong, positive predictor of ROA in 1999 and 2000 as well.
The top five chaebol dummy is also positively related to ROA in 1998, but it is important
to emphasize that this need not imply that the chaebol-affiliated firms were better able to invest funds after the crises than other firms. As noted earlier in the discussion of our empirical strategy, post-crisis performance measures after the crisis are likely affected by access to

Ending “Too Big to Fail”: Government Promises versus Investor Perceptions І 27 finance. Firms with access to the bond market following the crisis may have performed better simply because they could obtain credit when other firms could not. In fact, the strong performance of firms affiliated with the top five chaebols in 1998 likely reflects their preferential access to bonds in that, ex-post, we know that these firms were actually more likely to go bankrupt in later years. Additionally, we can see that affiliation with a top five chaebol is not positively related to ROA in 1999 or 2000. This again highlights the importance of our empirical strategy to use industry fixed effects and pre-crisis measures of corporate governance to proxy for firms’ post-crisis ability to invest funds successfully.
VII. CONCLUSION
Our evidence suggests that households in the Repulic of Korea were willing to forgo demand deposits and buy corporate bonds during the Korean banking crisis of 1997–1998 because they regarded the largest chaebols as “too big to fail”. There is no evidence that the bond market allocated credit to firms more likely to make better use of the funds, and there is also no evidence that default risk was appropriately priced. Chaebol-affiliated firms issued larger amounts of bonds relative to other firms in the same industry. Moreover, the large chaebol-affiliated firms receiving the most bond financing in 1998 actually had the worst corporate governance prior to crisis and the highest eventual default rates, indicating they would be least able to invest the funds successfully. These chaebol-affiliated firms were also able to issue bonds with a lower yield-to-maturity relative to that of other firms, and there is no evidence that corporate governance or other standard measures of default risk were priced by bond investors. In fact, firms affiliated with Daewoo, a huge chaebol that did eventually default, actually sold bonds in 1998 at a higher premium (i.e., lower interest rate) than firms affiliated with other chaebols.
These “too big to fail” beliefs persisted despite serious efforts of the Government of the
Republic of Korea to credibly commit to not bailing out these firms. In retrospect, the market beliefs were correct. When some of the largest chaebols were unable to meet their debt obligations in 1999 and 2000, the government undertook a large-scale intervention to protect creditors from losses―taking the view that this was necessary in order to prevent another financial crisis. As a result, the bond investors that had invested in these chaebols largely recouped their investments. The Korean experience suggests that governments may have great difficulty convincing investors that no firm is “too big to fail”, and that heavy regulation or the dismantling of these firms may be necessary. It also strongly suggests that “too big to fail” problems are not necessarily limited to the financial firms.
The Republic of Korea’s experience also highlights the ability of large, vested interests to
continue their expansion even in the face of a crisis. Funding after the Korean financial crisis was more concentrated than before the crisis, despite the fact that the crisis was due in part to large chaebol firms over-expanding based on cheap credit. Smaller firms, even those with better corporate governance structures, were unable to access the new capital markets when banks stopped lending. The net effect of the crisis, therefore, was to help large firms relative to small firms. Economic power became even more concentrated as a result, further perpetuating investors’ beliefs that the large firms were “too big to fail”. Rather than breaking the power of chaebols, the immediate effect of the crisis―at least in terms of financial flows―was to help further the strongest pre-crisis special interests.

28 І ADB Economics Working Paper Series No. 314
Appendix Table 1: Definition and Source of Variables
Financial Flow Variables Gross Bond Flows Constructed using the 'cash flows from financing activities'
section of the NICE financial data set. Gross bond flows = "Increase in debentures payable" (_43121). All missing values were assumed to be zeros so long as at least one other financial cash flow variable was non-missing for that given firm-year observation.
Gross Equity Flows Constructed using the 'cash flows from financing activities' section of the NICE financial data set. Gross equity flows = “Increase in capital stock” (_43140) + “Payment of margin for new stock offering" (_43150) + “Increase in Paid-in capital in excess of par values" (_43161). All missing values were assumed to be zeros so long as at least one other financial cash flow variable was non-missing for that given firm-year observation.
Gross Loan Flows Constructed using the 'cash flows from financing activities' section of the NICE financial data set. Gross loan flows = "Increase in short-term borrowings" (_43111) + "Increase in long-term borrowings (Foreign Currency)" (_43122). All missing values were assumed to be zeros so long as at least one other financial cash flow variable was non-missing for that given firm-year observation.
Net Bond Flows Constructed using the 'cash flows from financing activities' section of the NICE financial data set. Net bond flows = Gross bond flows - "Redemption of debentures payable by purchase" (_43521). All missing values were assumed to be zeros so long as at least one other financial cash flow variable was non-missing for that given firm-year observation.
Net Equity Flows Constructed using the 'cash flows from financing activities' section of the NICE financial data set. Net equity flows = Gross equity flows - "Decrease in capital stock" (_43550). All missing values were assumed to be zeros so long as at least one other financial cash flow variable was non-missing for that given firm-year observation.
Net Loan Flows Constructed using the 'cash flows from financing activities' section of the NICE financial data set. Net loan flows = Gross loan flows - "Redemption of short-term borrowings" (_43511) - "Redemption of long-term borrowings (foreign currency)" (_43522). All missing values were assumed to be zeros so long as at least one other financial cash flow variable was non-missing for that given firm-year observation.
Ownership Variables Control-Ownership Gap
This variable is obtained directly from Joh (2003), who creates the variable using the ownership data provided by NICE. For each firm, the NICE ownership data lists the largest eight shareholders and their direct ownership stake (in percent) of that firm. 'Control-Ownership Rights Gap' is calculated by summing over the ownership stakes for all of the largest eight shareholders and then subtracting 'ownership concentration' (see below for construction of this variable). In all regressions, this variable is given as a fraction rather than a percent.
Ownership Concentration This variable is obtained directly from Joh (2003), who creates the variable using the ownership data provided by NICE. For each firm, the NICE ownership data lists the largest eight shareholders and their direct ownership stake (in percent) of that firm. 'Ownership concentration' is calcuted by

Ending “Too Big to Fail”: Government Promises versus Investor Perceptions І 29
simply summing the ownership stakes for "personal" holdings among the top shareholders. All institutional shareholders (financial institutions and nonfinancial corporations), foreign owners, government, and employment stock ownership stakes are excluded from this calculation. In all regressions, this variable is given as a fraction rather than a percent.
Chaebol Indicators Top 5 Chaebol Indicator
The top 5 chaebols are determined using the Korean Fair Trade Commision's (KFTC) annual publication of the largest 30 chaebols based on total assets. The Top 5 Chaebols indicator in the regressions uses the 1996 KFTC listing. For firms associated with a top 5 chaebol in 1996, the indicator equals "1", while the indicator equals zero for all other firms. The top 5 chaebols are Hyundai, Samsung, Daewoo, SK, and LG.
Top 6-30 Chaebol Indicator The top 6-30 chaebols are determined using the KFTC annual publication of the largest 30 chaebols based on total assets. The Top 6–30 Chaebols indicator in the regressions uses the 1996 KFTC listing. For firms associated with a top 6–30 chaebol in 1996, the indicator equals "1", while the indicator equals zero for all other firms.
Firm Characteristics Cash Flows
Equals operating cash flows plus depreciation minus changes in non-cash accruals. This is calculated using the NICE financial dataset variables, "Operating Cash Flow" (_25000) - change in "Current Assets, excluding cash" (_11000 -_11110) + change in "Current Liabilities, excluding debt & taxes" (_15000 -_15020 -_15110 -_15070) + "depreciation" (_24880) + "amortization" (_24360). All missing values are assumed to be zeros.
Cash Volatility Standard deviation of (cash flows/assets) from 1994-1996. Debt / Assets Equals the NICE financial dataset variable "Total Liabilities"
(_16900) divided by "Total Assets (_14900). Missing values are left missing.
Modified Altman-Z Score Defined as 3.3*(EBIT/assets) + 1.0*(sales/assets) + 1.4*(retained earnings/assets) + 1.2*(working capital/assets), where the components are calculated using the NICE financial dataset variables,"Total Assets" (_14900), "EBIT" (_25000), "Total Sales" (_21000), "Retained Earnings" (_19000), and "Working Capital" (_11000-_15000).
Total Assets Equals the NICE financial dataset variable "Total Assets" (_14900). Missing values are left missing.
Profit Variables Return on Assets (ROA)
Calculated using the NICE financial dataset variable “Ordinary Income [or loss]” (_27000) normalized by total assets. Ordinary income is operating income (sales minus the cost of sales, selling expenses, and administrative expenses) minus interest payments plus dividends and gains on securities. Unlike net income, ordinary income excludes extraordinary gains or losses and taxes.
Price Index
The NICE financial dataset reports nominal values. These nominal values were indexed for inflation using the Consumer Price Index issed by the Korean Central Bank. The base year is 2000.
EBIT = earnings before interest and taxes, NICE = National Information Credit Evaluation.
Note: All variables except the price index and chaebol indicators are obtained from the NICE datasets. Numbers given in parentheses represent the actual NICE code for that particular variable.

30 І ADB Economics Working Paper Series No. 314
Appendix Table 2: Korean Corporate Sector Net Finance Flows, 1990–2002
1990 1991 1992 1993 1994 1995 1996 1997 1998 1999Total Financing 50.8 58.2 54.9 65.0 89.0 100.0 118.8 118.0 27.7 51.8 Direct Financing 21.5 22.1 21.3 31.9 32.5 48.1 56.1 44.1 49.5 24.8 Corporate Paper 1.9 –2.2 4.2 9.0 4.4 16.1 20.7 4.4 –11.7 –16.1 Bonds 10.9 14.1 6.6 9.5 12.6 15.4 21.2 27.5 45.9 –2.8 Stocks 6.0 6.7 7.2 9.5 13.2 14.4 13.0 9.0 13.5 41.1 Indirect Finance 19.5 24.3 19.9 20.4 39.7 31.9 33.2 43.4 –15.9 2.2 Banks 8.0 11.5 8.3 8.5 18.4 14.9 16.7 15.2 0.3 15.5 Non-Banks 11.5 12.8 11.6 11.9 21.2 17.0 16.6 28.2 –16.6 –13.3 Overseas Borrowings 3.2 2.4 3.9 1.0 5.9 8.4 12.4 6.6 –9.8 11.6 Other 6.5 9.4 9.7 11.7 11.0 11.7 17.1 24.0 3.8 13.2 Nominal GDP 186.7 226.0 257.5 290.7 340.2 398.8 448.6 491.1 484.1 529.5
2000 2001 2002
Total Financing 65.8 50.6 83.3 Direct Financing 17.2 37.7 20.0 Corporate Paper –4.8 4.4 –3.8 Bonds –2.1 11.4 –7.9 Stocks 20.8 16.2 28.7 Indirect Finance 11.7 –0.3 51.1 Banks 23.3 3.2 41.1 Non-Banks –11.6 –3.7 8.6 Overseas Borrowings 16.8 0.6 2.4 Other 20.0 12.6 10.8 Nominal GDP 578.7 622.1 684.3
GDP = gross domestic product.
Note: All values are given in units of one trillion won.
Source: Bank of Korea.

Ending “Too Big to Fail”: Government Promises versus Investor Perceptions І 31
Appendix Table 3: Bond Allocation for 500 Largest Firms
Dependent Variable = Log(Bond Flows in 1998) (i) (ii) (iii) (iv)
Top 5 Chaebol 1.298*** 1.573*** 1.685*** 1.285*** (0.281) (0.327) (0.317) (0.270) Top 6–30 Chaebol 0.477* 0.485 0.541* 0.522** (0.252) (0.316) (0.314) (0.251) Log(Assets) 1.064*** 1.120*** 1.070*** 1.083*** (0.092) (0.132) (0.128) (0.092) Debt/Assets –1.490* –1.834 –1.759* –1.007 (0.875) (1.141) (1.055) (0.800) Ownership Concentration 0.214 (0.493) Control-Ownership Difference –0.621 (0.396) Cash Flows/Assets 0.188 (1.034) Cash Volatility 1.163 (1.634) Modified Altman-Z Score 0.011 (0.015) Industry Fixed Effects Yes Yes Yes Yes Observations 297 206 206 285 R-squared 0.77 0.76 0.76 0.77
* = 10% level, ** = 5% level, *** = 1% level, EBIT = earnings before interest and taxes, KFTC = Korean Fair Trade Commission, NICE = National Information Credit Evaluation, OLS = ordinary least squares, RHS = right hand side.
Notes: 1. The table reports coefficients from firm-level regressions of log 1998 gross bond flows (in thousand wons) for the 500 largest firms (using total assets as of 1996) onto three-digit industry fixed effects and pre-crisis firm characteristics using OLS with standard errors clustered around chaebol affiliation. 2. All RHS variables are measured with respect to 1996. 3. Top 5 and Top 6–30 chaebol indicator variables are determined using the 1996 KFTC listing of the top 30 chaebols. Firms entering a top 30 chaebol from 1997–2000 and firms that exit a chaebol from 1997–1998 are dropped. 4. Debt refers to total liabilities . 5. Ownership concentration is Joh's sum of personal shareholdings using the largest eight shareholders identified by NICE. 6. The control-ownership gap is Joh's difference between the sum of all large shareholdings and the sum of only personal shareholdings using the largest eight shareholders identified by NICE. 7. Cash flows are operating cash flows plus depreciation and minus changes in accruals. 8. Cash volatility is the standard deviation of cash flows/assets from 1994–1996. 9. The modified Altman Z-score is defined as 3.3*(EBIT/assets) + 1.0*(sales / assets) + 1.4*(retained earnings/assets) + 1.2*(working capital/assets).
Source: Authors’ estimates.

32 І ADB Economics Working Paper Series No. 314
Appendix Table 4: Net Bond Flows in 1998, Chaebol, Affliation, and Governance
Dependent Variable =
(Net Bond Flows/Assets) in 1998 (i) (ii) (iii) (iv)
Top 5 Chaebol 6.989*** 7.008*** 7.413*** 7.197*** (1.691) (2.211) (2.176) (1.787) Top 6–30 Chaebol 2.589 3.54 4.007 2.747 (1.989) (2.472) (2.483) (1.985) Log(Assets) 0.299 0.536 0.706 0.531 (0.350) (0.538) (0.457) (0.341) Debt / Assets 0.248 –3.938 –4.438 –0.094 (4.789) (3.715) (3.669) (4.783) Ownership Concentration –2.33 (2.394) Control-Ownership Difference –0.618 (1.871) Cash Flows / Assets 0.414 (4.563) Cash Volatility 23.470** (11.384) Modified Altman-Z Score –0.271 (0.167) Industry Fixed Effects Yes Yes Yes Yes Observations 504 349 349 476 R-squared 0.24 0.32 0.32 0.28
* = 10% level, ** = 5% level, *** = 1% level, EBIT = earnings before interest and taxes, KFTC = Korean Fair Trade Commission, NICE = National Information Credit Evaluation, OLS = ordinary least squares, RHS = right hand side.
Notes: 1. The table reports coefficients from firm-level regressions of 1998 net bond flows normalized by assets onto three-digit industry fixed effects and pre-crisis firm characteristics using OLS with standard errors clustered around chaebol affiliation. 2. All RHS variables are measured with respect to 1996. 3. Top 5 and Top 6–30 chaebol indicator variables are determined using the 1996 KFTC listing of the top 30 chaebols. Firms entering a top 30 chaebol from 1997–2000 and firms that exit a chaebol from 1997–1998 are dropped. 4. Debt refers to total liabilities . 5. Ownership concentration is Joh's sum of personal shareholdings using the largest eight shareholders identified by NICE. 6. The control-ownership gap is Joh's difference between the sum of all large shareholdings and the sum of only personal shareholdings using the largest eight shareholders identified by NICE. 7. Cash flows are operating cash flows plus depreciation and minus changes in accruals. 8. Cash volatility is the standard deviation of cash flows/assets from 1994–1996. 9. The modified Altman Z-score is defined as 3.3*(EBIT/assets) + 1.0*(sales/assets) + 1.4*(retained earnings / assets) + 1.2*(working capital/assets).
Source: Authors’ estimates.

REFERENCES Alessandri, Piergiorgio, and Andrew Haldane. 2009. Banking on the State. BIS Review. 139.
Nov.11. Bank for International Settlements. (http://www.bis.org/review/r091111e.pdf) Bae, Kee-Hong, Jun-Koo Kang, and Jin-Mo Kim. 2002. Tunneling or Value Added? Evidence
from Mergers by Korean Business Groups. Journal of Finance. 57(6). pp. 2695–2740. Baek, Jae-Sung, Jun-Joo Kang, and Kyung Suh Park. 2004. Corporate Governance and Firm
Value: Evidence from the Korean Financial Crisis. Journal of Financial Economics, Vol. 71 (2). February, pp. 265–313.
Beck, Thorsten, Asli Demirgüç-Kunt, and Ross Levine. 2003. Law, Endowments, and Finance.
Journal of Financial Economics. 70(2). pp. 137–181. Beck, Thorsten, and Ross Levine. 2002. Industry Growth and Capital Allocation: Does Having a
Market- or Bank-based System Matter? Journal of Financial Economics. 64(2). 147–180.
Bhattacharya, Utpal. 2003. The Optimal Design of Ponzi Schemes in Finite Economies. Journal
of Financial Intermediation. 12(1) pp. 2–24. Black, Bernard S., Hasung Jang, and Woochan Kim. 2006. Does Corporate Governance Predict
Firms’ Market Values? Evidence from [the Republic of] Korea. Journal of Law, Economics and Organization. 22(2). October. pp. 366–413.
Borensztein, Eduardo, and Jong-Wha Lee. 2002. Financial Crisis and Credit Crunch in [the
Republic of] Korea: Evidence from Firm-Level Data. Journal of Monetary Economics. 49(4). pp. 853–875.
Claessens, Stijn, Simeon Djankov, and Larry H. P. Lang. 2000. The Separation of Ownership
and Control in East Asian Corporations. Journal of Financial Economics. 58(1). pp. 81–112.
Joh, Sung Wook. 2003. Corporate Governance and Firm Profitability: Evidence from [the
Republic of] Korea before the Economic Crisis. Journal of Financial Economics. Volume 68. No. 2. May. pp. 287–322.
Johnson, Simon, Peter Boone, Alasdair Breach, and Eric Friedman. 2000. Corporate
Governance in the Asian Financial Crisis. Journal of Financial Economics. Vol. 58 (1–2). October/November. pp. 141-186.
Johnson, Simon, and James Kwak. 2010. 13 Bankers: The Wall Street Takeover and the Next
Financial Meltdown. New York: Pantheon Books. Johnson, Simon, Rafael La Porta, Florencio Lopez-de-Silanes, and Andrei Shleifer. 2000.
Tunneling. American Economic Review (Papers and Proceedings). Vol.90, No.2. pp. 22–27, May.
Krueger, Anne O., and Jungho Yoo. 2002. Falling Profitability, Higher Borrowing Costs, and
Chaebol Finances during the Korean Crisis. Chapter 5. In David T. Coe and Se-Jik Kim,

34 І ADB Economics Working Paper Series No. 314
eds. Korean Crisis and Recovery. Washington DC: International Monetary Fund, and Seoul: Korea Institute for International Economic Policy.
La Porta, Rafael, Florencio Lopez-de-Silanes, Andrei Shleifer, and Robert W. Vishny. 1997.
Legal Determinants of External Finance. Journal of Finance. 52 (3). pp. 1113–1155. ———. Law and Finance. Journal of Political Economy. 106 (6). pp. 1113–1155. Lemmon, Michael L., and Karl V. Lins. 2003. Ownership Structure, Corporate Governance, and
Firm Value: Evidence from the East Asian Financial Crisis. Journal of Finance. Vol. 58 (4). pp. 1445–1468.
MacKie-Mason, Jeffrey K. 1990. Do Taxes Affect Corporate Financing Decisions? Journal of
Finance. 45(5). pp. 1471–1493. Mitton, Todd. 2002. A Cross-Firm Analysis of the Impact of Corporate Governance on the East
Asian Financial Crisis. Journal of Financial Economics. 64 (2). February. pp. 215–241. Morck, Randall, Daniel Wolfenzon, and Bernard Yeung. 2005. Corporate Governance,
Economic Entrenchment, and Growth. Journal of Economic Literature. 43(3). pp. 655–720.
Oh, Gyutaeg, and Changyong Rhee. 2002. The Role of Corporate Bond Markets in Korean
Financial Restructuring Process. Chapter 7. In David T. Coe and Se-Jik Kim, eds. Korean Crisis and Recovery. Washington, DC: International Monetary Fund, and Seoul: Korea Institute for International Economic Policy.
Sorkin, Andrew Ross. 2009. Too Big To Fail: The Inside Story of How Wall Street and
Washington Fought to Save the Financial System – and Themselves. New York: Viking Adult.
Stern, Gary H., and Ron J. Feldman. 2004. Too Big To Fail: The Hazards of Bank Bailouts.
Washington, DC: Brookings Institution Press. Summers, Larry. 2000. International Financial Crises: Causes, Prevention, and Cures.
American Economic Review (Papers and Proceedings). 90(2). May, 1–16. (Ely Lecture to the American Economic Association annual meeting in January 2000.)

Ending “Too Big To Fail”:Government Promises versus Investor
Todd A. Gormley, Simon Johnson,and Changyong RheeNo. 314 | October 2012
ADB Economics Working Paper Series
About the PaperAnalysis of the 1997–1999 crisis in the Republic of Korea suggests that despite a “no bailout” policy, chaebols could still issue bonds at prices implying very low expected default risk. The evidence suggests that government promises did not eliminate the “too big to fail” beliefs. Subsequent government handling of potential and actual defaults by Daewoo and Hyundai confirmed the market view that creditors would be protected.
About the Asian Development BankADB’s vision is an Asia and Pacific region free of poverty. Its mission is to help its developing member countries reduce poverty and improve the quality of life of their people. Despite the region’s many successes, it remains home to two-thirds of the world’s poor: 1.8 billion people who live on less than $2 a day, with 903 million struggling on less than $1.25 a day. ADB is committed to reducing poverty through inclusive economic growth, environmentally sustainable growth, and regional integration. Based in Manila, ADB is owned by 67 members, including 48 from the region. Its main instruments for helping its developing member countries are policy dialogue, loans, equity investments, guarantees, grants, and technical assistance.
Asian Development Bank6 ADB Avenue, Mandaluyong City1550 Metro Manila, Philippineswww.adb.org/economics
Printed on recycled paper Printed in the Philippines