Embed Size (px)
Citation preview
Addendum to
High Resolution Seismic Reflection Surveyat Mud Mountain Dam
near Enumclaw, Washington
Addendum to the final report submitted toU.S. Army Corps of Engineers
Seattle Engineers DistrictSeattle, Washington
Kansas Geological SurveyUniversity of Kansas
Lawrence, Kansas
Open-file Report No. 97-65
January 15, 1997
High Resolution Seismic Reflection Surveyat Mud Mountain Dam
near Enumclaw, Washington
by
Richard D. MillerJoe M. AndersonDavid R. LaflenBrett C. BennettChoon B. Park
of theKansas Geological Survey
University of KansasLawrence, Kansas
Addendum to the final report submitted toU.S. Army Corps of Engineers
Seattle Engineers DistrictSeattle, Washington
Kansas Geological SurveyUniversity of Kansas
Lawrence, Kansas
Open-file Report No. 97-65
January 15, 1997
1
Addendum to ReportHigh Resolution Seismic Reflection Survey
at Mud Mountain Damnear Enumclaw, Washington
NOTE: Site and project details normally found in the Introduction and GeologicSetting sections of a report like this are contained in the first report (Miller et al.,1995, KGS Open-file Report #95-8) and are not repeated in this addendum.
Summary
The shallow seismic reflection program at Mud Mountain Dam focuses on
defining and delineating stratigraphic and structural features within the Pleistocene
sequence that overlies igneous bedrock. The portion of the project contained in the
first report consisted of a series of acquisition/feasibility tests followed by two CDP
profiles along gravel logging roads. The goal of the first CDP profiles was to
extrapolate/extend sediments identified in sidehill outcrop into the embayment to
establish some understanding of horizontal continuity. The second part of the
seismic program (the portion reported here) included a series of source tests and a
300+ shotpoint CDP profile along the main access road to the Mud Mountain Dam
overlook. This second survey line was designed to allow extrapolation and
enhancement of interpretations from the first set of survey lines immediately north
of the main dam road. Improvements in acquisition and processing techniques and
equipment on the second trip allowed a much improved image of the subsurface
and confidence in interpretation of the entire sedimentary sequence beneath the
main access road.
Interpretations of the CDP profile collected during March of 1996 are con-
sistent with drill holes 38, 23, 24, and 34. The bedrock reflection possesses almost
40 msec or about 100 ft of variation across this profile. An apparent bedrock high is
interpreted beneath and slightly east of the logging road bridge. The configuration
and topography of the bedrock surface suggests borehole 23 must have a TD very
near the bedrock surface. The bedrock is deepest at the west end of the line beyond
borehole 34. The Mud Mountain Complex (MMC) is stratigraphically the next
higher unit. Several reflection events can be interpreted within this interval that
are consistent with logs from on-line boreholes which show discrete changes in
material. Reflections from the MMC and bedrock surface can be interpreted with a
high degree of confidence and are both very consistent with logs.
The division between the MMC and Vashon Lake Bed (VLB) sequences and
Hayden Creek Till (HCT) is acoustically distinct and can be confidently interpreted
2
everywhere except beneath the bridge where the fold drops and the lithology
appears to change dramatically. It is difficult to determine with confidence whether
the MMC possesses a relative elevation high near the center of the line due to
missing data, hence two possible interpretations are provided. The interpretation
suggesting a local thickening of the MMC near the center of the line is consistent
with off-line borehole data. Above the MMC there appears to be a very complex set
of erosional and depositional sequences that are made up of VLB, HCT, and Vashon
Outwash (VO). The most likely interpretation of this sequence puts a complete
relatively undisturbed section of bedrock, MMC, VLB, and VO at borehole 34 with
dramatic cut-and-fill features possessing little or no distinct horizons above the
deltaic layer. A very well-defined erosional channel cut-and-fill within the VLB is
interpreted at boreholes 38 and 23. The high amplitude nature of the reflection with
the VLB is likely related to saturation and possibly the pooling of water at that
interface.
Between boreholes 38 and 23 a mound of HCT can be interpreted which is
consistent with borehole 24, previous seismic lines, and hillside outcrop maps. The
distinct character, reflection orientation, and shadowing effects of this area on
deeper reflections is strong evidence to support a distinct horizontal change in
material within this area. The borehole data was used to help identify the possible
source of this acoustically unique area within the context of the entire seismic
profile line. Preliminary processed sections possess distinct high angle apparent
reflection arrivals with apparent dip to the west that are likely indicators of the
western boundary of the HCT mound. The geologic interpretation of this HCT
mound was only possible with the inclusion of borehole logs and interpretations.
Intermediate processed seismic sections enhanced the identification of
secondary channels and approximate amounts of fill material redeposited into these
apparent deep cuts into the VLB sequences. Without digital filtering and spectral
balancing the channel feature between stations 1070 and 1110 is quite pronounced,
possessing well-defined sides and top. The unique acoustic characteristics of this
feature as displayed on the intermediate processed section is not consistent with the
final processing flow that was designed to enhance reflections from deeper more
consistent and competent layers. A much less well-defined channel is discernable
between stations 1220 and 1280 on this same intermediate processed section. It is
reasonable to suggest the strong reflection altered by these channels is the top of the
VLB sequence. The high amplitude reflection truncated by the western edge of the
western channel is consistent with the missing lower outwash layer as interpreted
3
in borehole 34. It is not unreasonable to suggest the section as sampled by well 34
might be unaltered while the section encountered in boreholes 38 and 23 have the
upper portion of the VLB altered by erosional fill.
Introduction
A second continuous profile was acquired on March 1 and 2 , 1996, to
continue 3-D extrapolation of structures delineated on previous seismic reflection
surveys (Miller et al., 1995) and through sidehill outcrop studies (Hancock, personal
communication and working maps, 1994) at Mud Mountain Dam. The previous
hillside studies and seismic reflection surveys focused on the flanks of the Mud
Mountain Dam north embayment (Figure 1). Timber roads along which seismic
reflection data were acquired during the 1994 survey possessed a relative elevation
difference of 50 and 80 ft to the seismic profile collected during the second trip
during March of 1996. Time shifts of between 40 to 60 msec are necessary to offset
the 50 to 80 ft of relative elevation difference to time tie profiles collected during
these two trips. A 20 to 30% difference in near-surface average velocity between the
two data sets is likely the result of increased saturation of the near-surface present
during the second trip.
The second survey consisted of several source and geometry tests and a 300+
shotpoint CDP profile that extended from about 500 ft east of borehole 38 to about
200 ft west of borehole 34 (Figure 1). The survey was designed to image the same
section and assist with continued 3-D extrapolation of features delineated during the
first part of this study. The walkaway testing performed at the east end of the CDP
profiles allowed identification of reflection events between about 100 and 500 feet.
The survey was acquired along the paved road with receivers in the north road
ditch (which in places contained standing water), while the source occupied
locations on the paved road surface. The profile was centered on a 50+ ft high
single-span bridge with fill material making up some portion of the upper 10 to 50 ft
off both ends of the bridge.
Data Acquisition
The acquisition parameters and equipment were selected and configured
based on a series of complementary walkaway noise tests collected during both trips
to this site. The testing completed during the first trip (Miller et al., 1995) provided a
basis for the 8 ft station spacing, split-spread geometry, far-offset of at least 300 ft, and
the need for a non-invasive, medium energy source. Walkaway tests during the
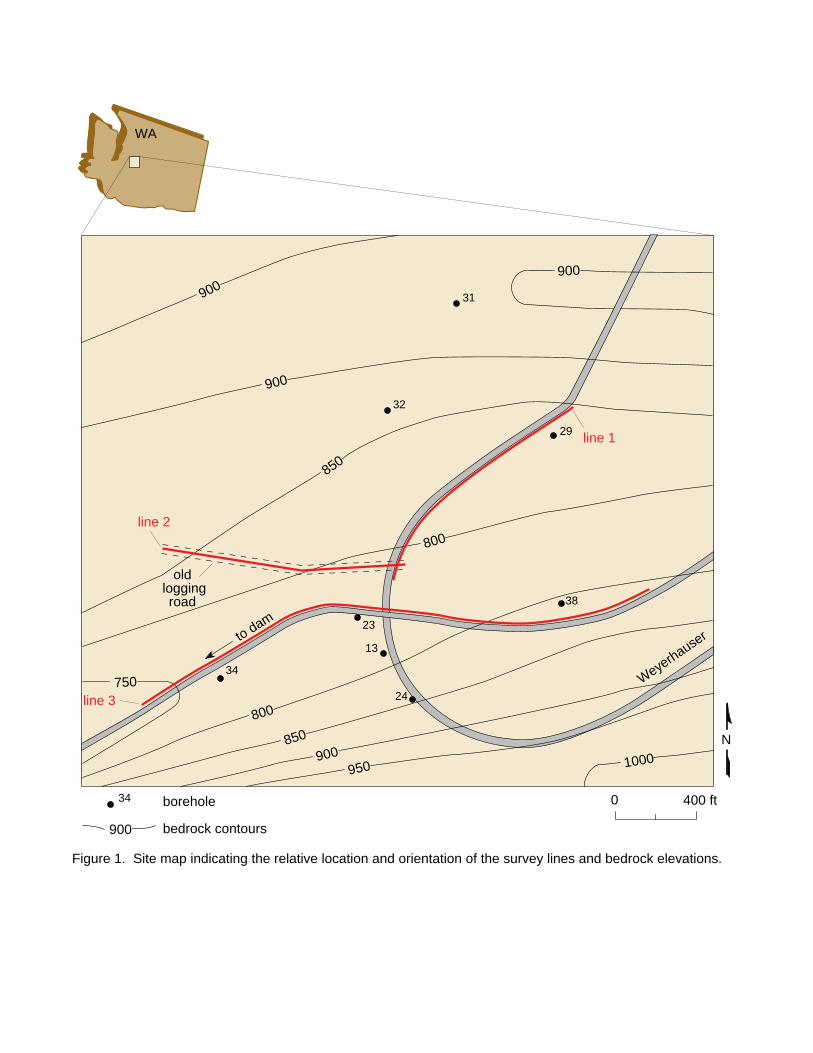
Figure 1. Site map indicating the relative location and orientation of the survey lines and bedrock elevations.
24
0 400 ft
N
WA
line 2
line 3
31
29
38
32
34
34
13
23
borehole
bedrock contours
old logging road
to dam
Weyerhause
r
900
900
850
900
800
850
900 950
800
900
1000
750
line 1
4
second trip were primarily intended to allow selection of the optimum source and
geometry. The sources tested during the second trip included the 8-gauge auger gun,
rubber band accelerated weight drop, and the IVI MiniVib. The MiniVib was tested
with an extensive series of sweeps correlated with a variety of pilots. The increased
number of recording channels available on the second trip (96 in comparison to 48)
allowed for a split-spread geometry which greatly improved both dip control and
close offset redundancy without compromising velocity control. The split-spread
geometry allowed a close offset of 25 ft and a maximum offset of just over 400 ft.
The 25 ft off-line offset allowed near channel recording of signal well within the
threshold of the geophones and pre-amplifiers and avoided disturbing geophone
coupling.
Data for this study were acquired on two 48-channel Geometrics StrataView
seismographs networked to allow simultaneous 96-channel recording. The seismo-
graphs record and A/D convert the analog input data from the geophones into a 24-
bit word. The 10 second pilot trace recorded on channel 1 of the master seismograph
was correlated with the remaining 95 channels of 12 second data to produce a 1
second shot record. This in-field correlation allowed real-time preliminary analysis
and QA/QC of the data. Data were recorded with a 1 msec sampling interval and
stored in SEG2 format on internal hard drives within each seismograph.
The source was an IVI MiniVib calibrated to deliver a flat up-sweep from 30
to 200 Hz at a peak force of 6500 lbs. The 10 second ground force pilot calculated at
the vibrator using the base plate and mass accelerometers was real-time telemetried
to the seismograph and correlated with the 12 seconds of seismic data collected
during that same time interval. The vibrator pad was placed on the asphalt road
surface opposite the road ditch where the geophones were planted. Three sweeps
were individually correlated and stored for each shotpoint, allowing future vertical
stacking of each sweep for signal-to-noise enhancement and to negate the effects of
random (wind) or pseudo random (cars, airplanes, etc.) noise sources.
Three Mark Products L28E 40 Hz geophones were wired in series and
deployed in a 3 ft array at each station. The 8 ft receiver and shot spacing was
selected based on walkaway tests performed during the first part of the seismic
surveys conducted at Mud Mountain Dam. Geophones were planted at the base of a
3 to 4 ft deep road ditch where in places 1 to 8 inches of water was standing. The 14
cm spikes were critical in penetrating into solid planting material beneath the
extremely saturated section of the ditch.
5
The production portion of the survey took one day to complete and included
approximately 316 shotpoints, all collected along a single traverse split in half by a
single-span bridge approximately 200 ft wide. The vibrator was ideally suited for the
line conditions and constraints of invasive investigations. The three-sweep
sequence allowed cancellation of most intermittent noise sources while boosting the
signal levels to allow effective digital filtering. The normal moveout (NMO)
velocity of the reflections imaged in the upper 300 msec on field files ranged from
3000 to 4000 ft/sec and the dominant frequency was about 60 to 70 Hz with an upper
corner frequency of about 125 to 140 Hz, providing an excellent bandwidth for
resolving the features of interest on this survey.
Processing
The processing of seismic data from the second visit followed a flow and used
parameters consistent with processing used to generate CDP stacked sections from
the first visit to this site (Miller et al., 1995) (Table 1). The main distinctions between
the two flows was the NMO velocity and use of spectral equalization. The different
NMO velocity was due to the increased saturation of the near-surface and the likely
increase in subsurface moisture levels. The spectral equalization was effective on
this data set where it was not on the last due to the broader band reflection wavelet
recorded with the vibrator and increased saturation, hence reduced attenuation of
the upper few feet. The spectral properties observed with the auger gun (providing
the best results with 2 ft subterrain burial) during the last visit suffered from dry
near-surface conditions and poor ground penetration (due to near-surface rocks and
boulders) and therefore reduced coupling. The same caution and step-by-step
QA/QC was followed on this processing flow as with the previous data set.
Results
Confident identification, mathematical verification, and geological con-
sistency of reflections on field files is necessary to properly and accurately process
shallow seismic reflection data, and as well it is of the utmost importance in
differentiating reflections from refractions and other coherent noise in the shallow
portions of CDP stacked sections. Raw and processed field files acquired during the
production portion of the survey have identifiable reflection events between 50 and
250 msec (Figure 2). The reflection hyperbola are well defined, allowing correlation
of most of the higher amplitude events on field files to stacked reflections on the
CDP profile. From inspection of field files it is evident that the data possess a
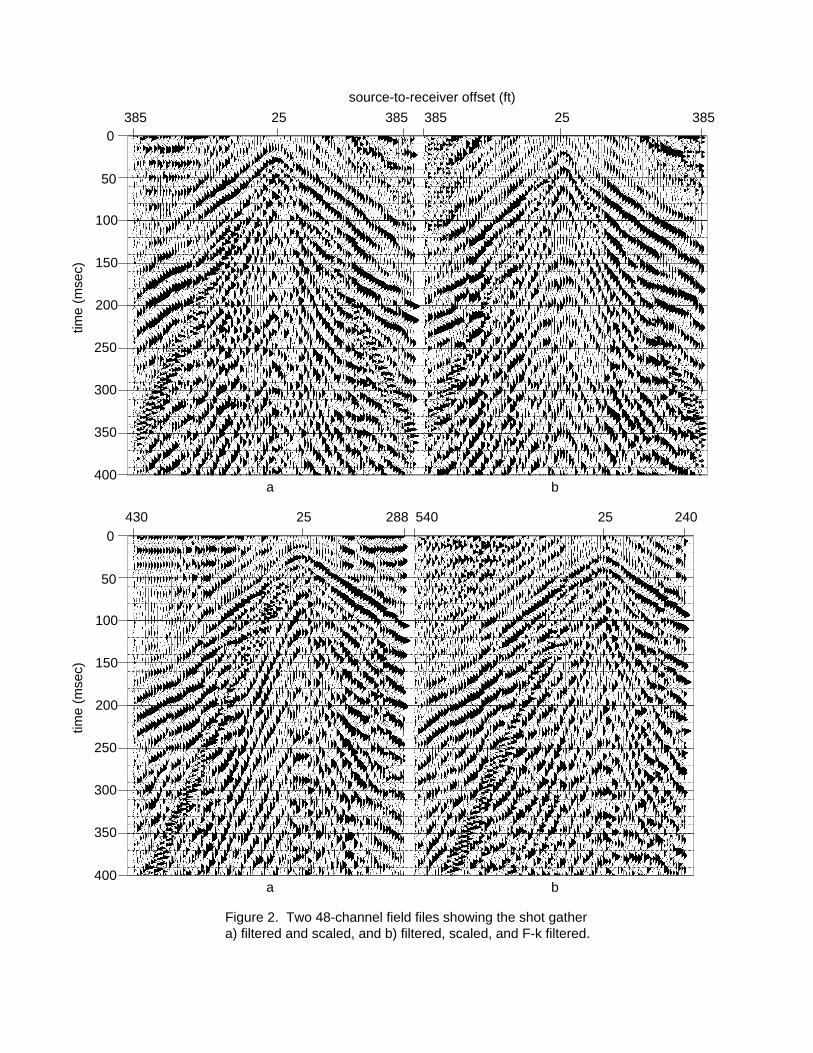
Figure 2. Two 48-channel field files showing the shot gather a) filtered and scaled, and b) filtered, scaled, and F-k filtered.
100
0
50
time
(mse
c)
source-to-receiver offset (ft)
a
385 25 385 385 25 385
150
200
250
300
350
400
100
0
50
time
(mse
c) 150
200
250
300
350
400
b
a b
430 25 288 540 25 240
6
relatively narrow bandwidth, or, at a minimum, severely unbalanced spectra.
Everything considered, the signal-to-noise ratio of these three-shot vertical stacks is
very good with reflection identifiable on at least 70% of the field files.
Processed field files show the enhancement of the reflections interpreted on
the raw field files (Figure 2). Digital filtering, first arrival muting, spectral balancing,
ground roll/air wave surgical mute, refracted/direct wave f-k filter, and time
varying amplitude scaling greatly improved the signal-to-noise ratio of the data set
as a whole. The removal and/or attenuation of as much noise as possible, in
conjunction with the redundancy of the stacked data, provided a very interpretable
stacked section.
The dominant frequency of reflections from this site is around 60 to 70 Hz.
The resolution potential is reasonably close to that of the previous trip. The in-
crease in average velocity and slight decrease in apparent dominant frequency
effectively reduced vertical and horizontal resolution slightly, but the increase in
signal-to-noise ratio and the more uniform amplitude spectra within the reflection
frequency band actually provides a better, more uniform image of the subsurface.
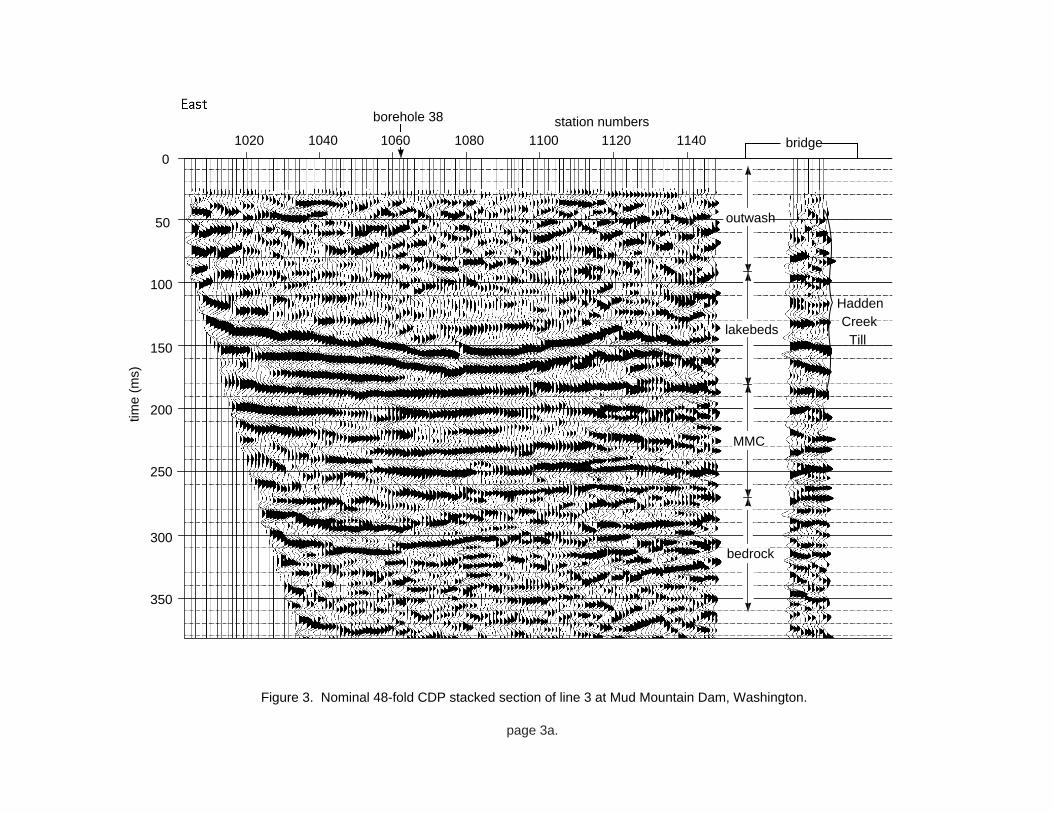
The CDP stacked section possesses several high amplitude reflections with as
many subtle, less acoustically significant reflection interfaces interpretable between
about 50 and 300 msec (Figure 3). The highest amplitude reflection both on the field
files and the CDP stacked section is from a time depth of about 130 to 140 msec.
Considering the average stacking velocity to that time depth, the reflector respon-
sible for that event is likely about 220 to 240 ft deep. Based on previous experience
interpreting reflection within unconsolidated sequences, reflectivity at an interface
this high has usually been related to a perched water table or at least increased
saturation of one of the two materials at a contact. Combining the calculated depth
with the inference of perching or saturation it is most likely this interface is at the
top of or within the VLB sequences. Considering this same criteria for identification
of the VLB sequence, the reflection at about 90 msec on the west end of the line is
also part of the VLB both in terms of time/depth conversion and the effects of
increased moisture.
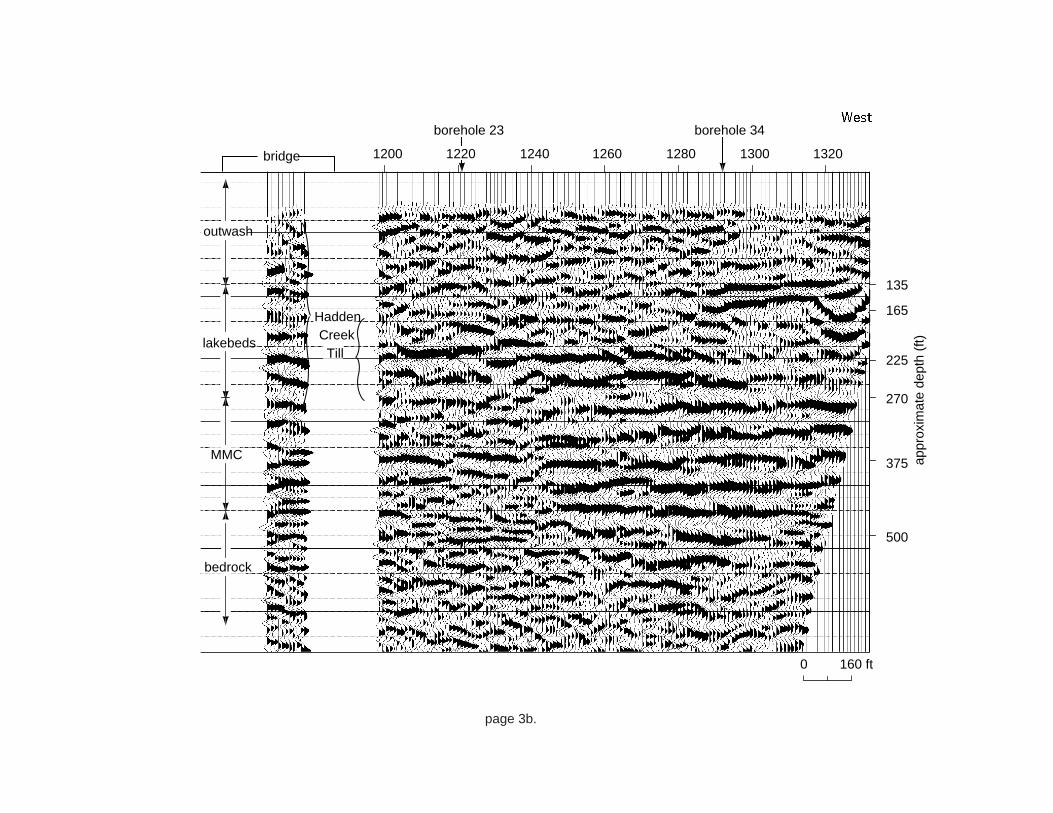
The borehole data from wells 38 and 23 suggest a gravel/cobble zone is
present at a depth of about 170 ft that seems to be present locally in every borehole
except 34 (Figure 4). This cobble zone is generally identified as the base of the
outwash gravel and the marker that divides the VO from VLB. The apparent
unique geologic setting at borehole 34 (unique due to the missing gravel marker) is
quite clearly represented on the stacked section between CDP 1285 and the west end
12122012001140112011001080106010401020
50
100
0
time
(ms)
150
200
300
350
250
bridge
station numbersborehole 38 borehole 23
MMC
bedrock
outwash
lakebeds
Figure 3. Nominal 48-fold CDP stacked section of line 3 at Mud Mountain Dam, Washington.
HaddenCreek
Till
page 3a.
12801260124012201200114011201100 1300 1320bridge
station numbers borehole 34borehole 23
225
375
500
270
165
135
MMC
bedrock
outwash
lakebeds
160 ft0
appr
oxim
ate
dept
h (f
t)
HaddenCreek
Till
page 3b.
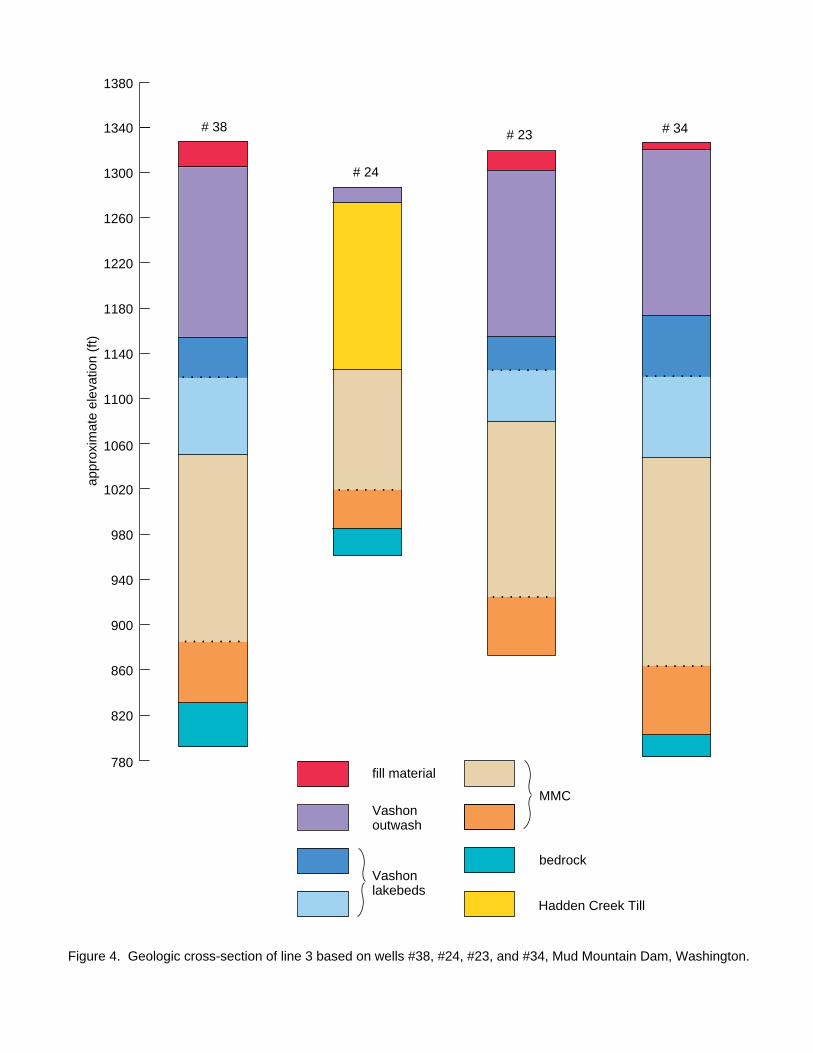
Figure 4. Geologic cross-section of line 3 based on wells #38, #24, #23, and #34, Mud Mountain Dam, Washington.
780
820
860
900
940
fill material
Vashonlakebeds
Hadden Creek Till
MMC
bedrock
1180
appr
oxim
ate
elev
atio
n (f
t)
1140
1060
1020
980
1100
1220
1260
1300
1340
1380
# 38# 23
# 24
# 34
. . . . . . .. . . . . . . . . . . . . .
. . . . . . .
. . . . . . .
. . . . . . .
. . . . . . .
Vashonoutwash
7
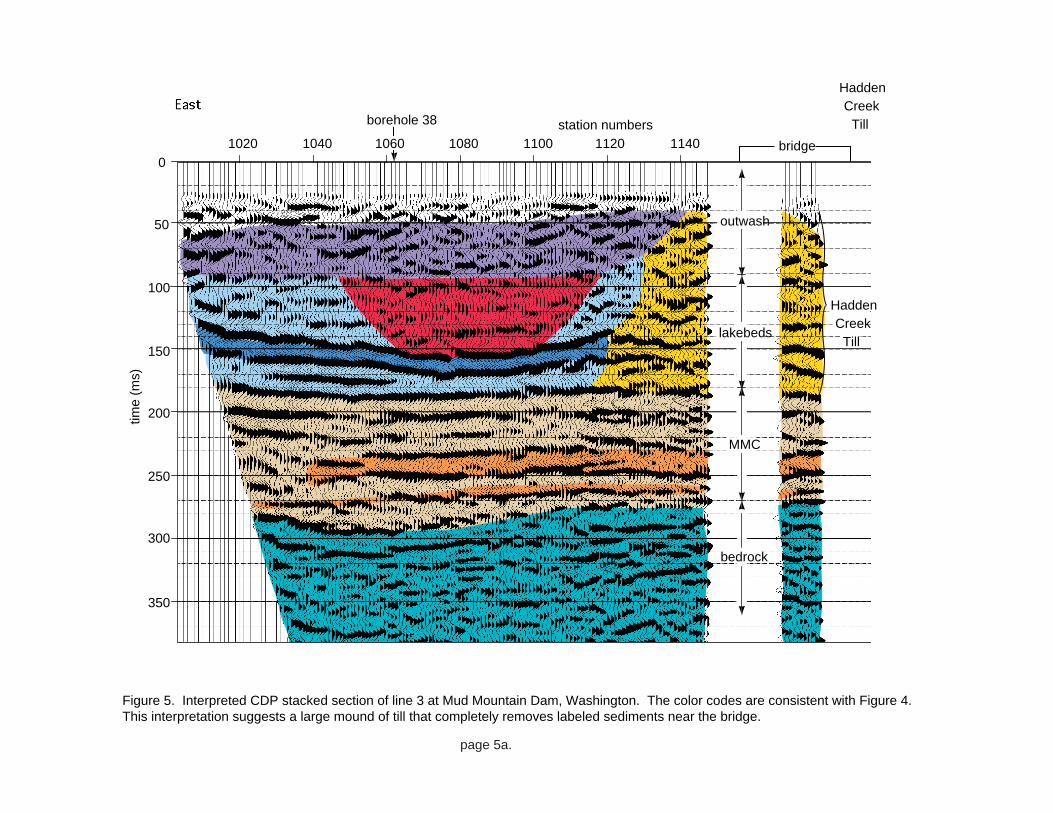
of the profile (Figure 5). Based on the geology of the interval, between about 150 ft
and 200 ft in boreholes along this line, it seems likely the upper part of the
interpreted VLB sequences between CDP 1285 and the end of the profile is likely a
block of more resistant material that was either spared from erosion by or withstood
the erosional action of the ancient White River. Another possibility is that this area
is the only local remnant that avoided alpine glacial erosion/gouging and subse-
quent retreating and deposition that possibly produced this locally consistent
boulder layer.
The synclinal shape of the high amplitude layer between CDPs 1040 and 1120
at a two-way travel time of around 140 msec is interpreted to be within the VLB
sequence and is very likely the result of either river actions or possibly glacial move-
ments. Thinning of the VLB as indicated by the apparent truncation of the reflec-
tion at 170 msec beneath station 1040 supports explanations for the topography of
the 140 msec layer as being the result of erosion and not depositional or tectonic
forces. The relative high amplitude of the 140 msec reflection on the east end of the
line is likely indicative of either a saturated, relatively compacted, well sorted layer
in contact with a diffuse, relative porous layer, and/or the higher amplitude could
be associated with a relatively nonpermeable layer that is acting to perch water. The
seismic section from the first trip provided an image of approximately the same
geologic interval with similar well defined high amplitude reflections. It is most
likely the less permeable materials that make up the VLB retain moisture, resulting
in higher reflection coefficients and therefore more pronounced reflection events
when in contact with other units.
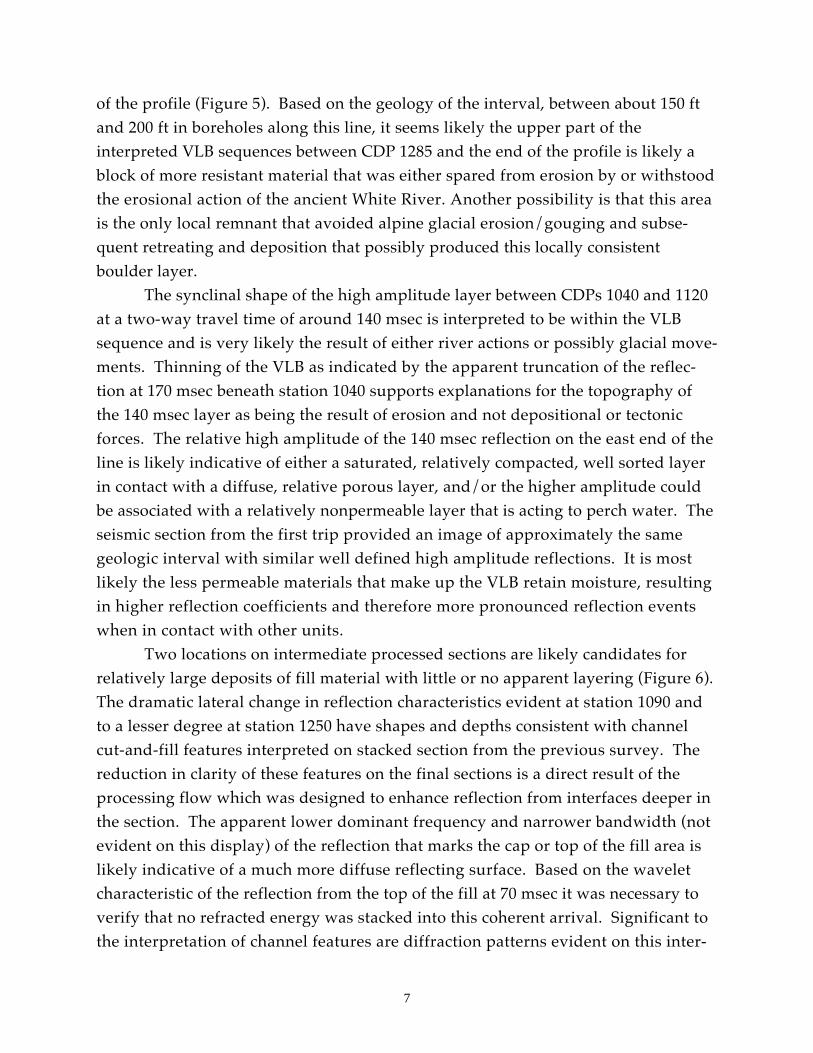
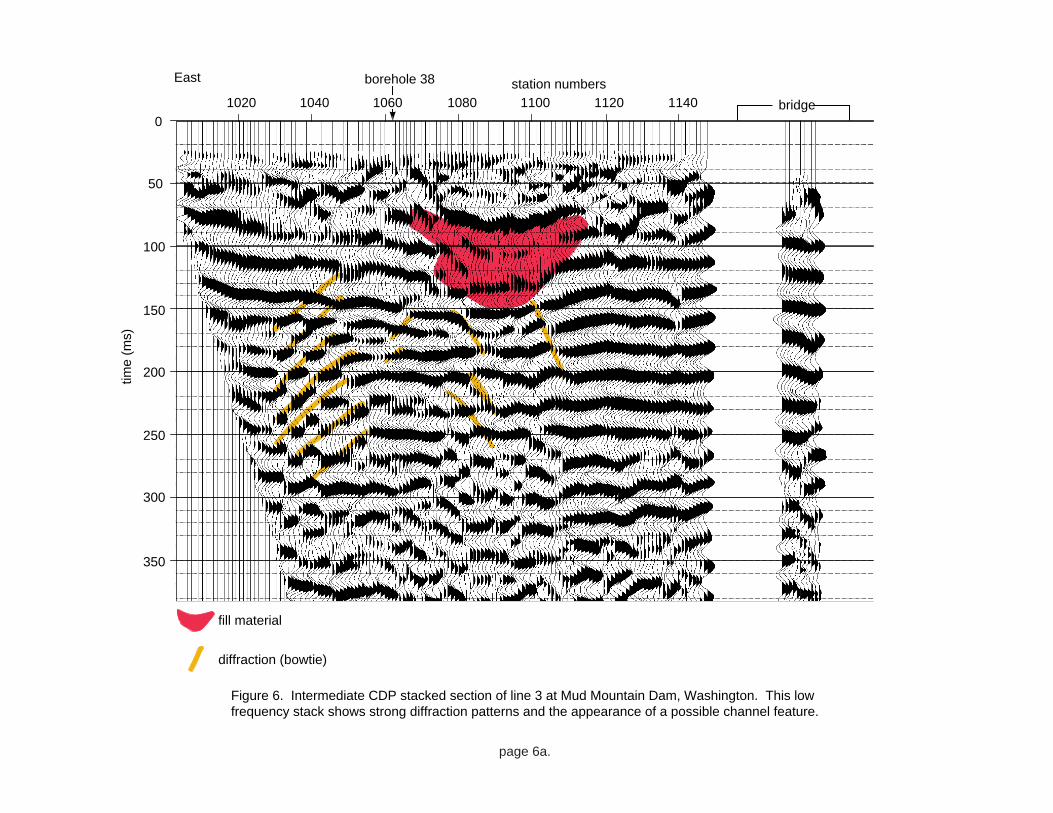
Two locations on intermediate processed sections are likely candidates for
relatively large deposits of fill material with little or no apparent layering (Figure 6).
The dramatic lateral change in reflection characteristics evident at station 1090 and
to a lesser degree at station 1250 have shapes and depths consistent with channel
cut-and-fill features interpreted on stacked section from the previous survey. The
reduction in clarity of these features on the final sections is a direct result of the
processing flow which was designed to enhance reflection from interfaces deeper in
the section. The apparent lower dominant frequency and narrower bandwidth (not
evident on this display) of the reflection that marks the cap or top of the fill area is
likely indicative of a much more diffuse reflecting surface. Based on the wavelet
characteristic of the reflection from the top of the fill at 70 msec it was necessary to
verify that no refracted energy was stacked into this coherent arrival. Significant to
the interpretation of channel features are diffraction patterns evident on this inter-
50
100
time
(ms)
150
200
300
350
250
225
375
500
270
165
135
160 ft0
appr
oxim
ate
dept
h (f
t)
12001140 128011201100 126010801060 124010401020 1220 1300 13200
bridge
station numbers borehole 34borehole 38 borehole 23
MMC
bedrock
outwash
lakebeds
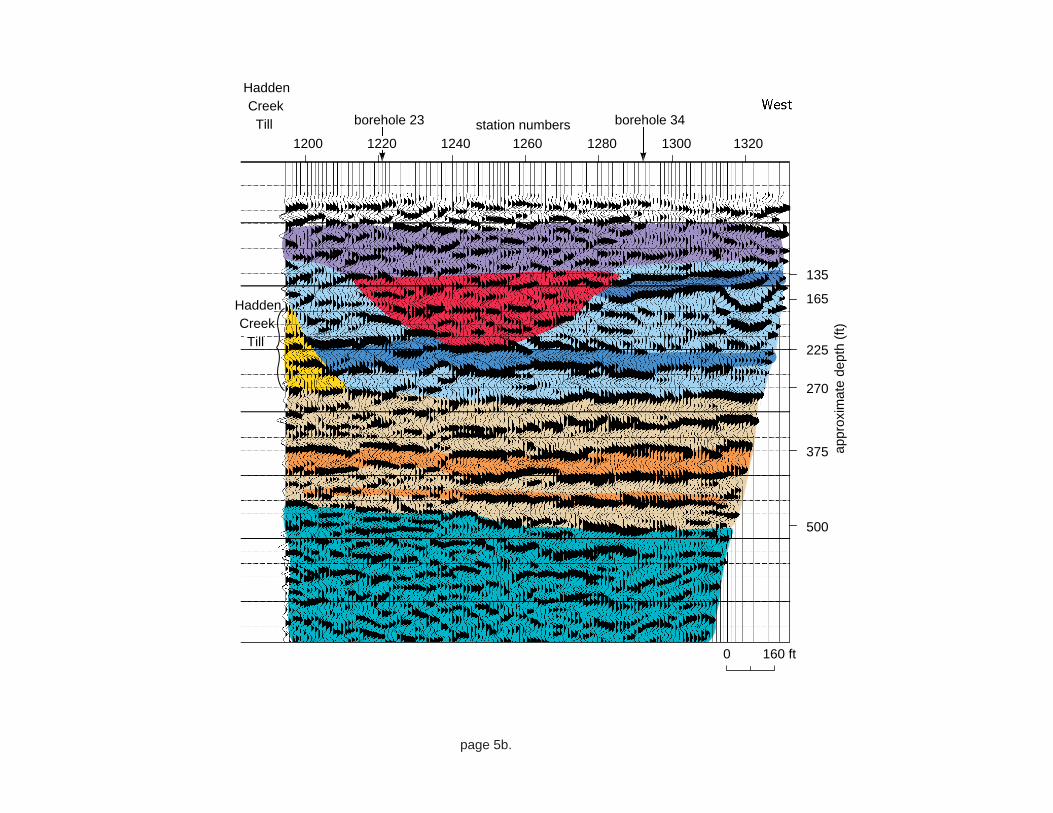
Figure 5. Interpreted CDP stacked section of line 3 at Mud Mountain Dam, Washington. The color codes are consistent with Figure 4. This interpretation suggests a large mound of till that completely removes labeled sediments near the bridge.
HaddenCreek
Till
HaddenCreek
Till
page 5a.
50
100
time
(ms)
150
200
300
350
250
225
375
500
270
165
135
160 ft0
appr
oxim
ate
dept
h (f
t)
12001140 128011201100 126010801060 124010401020 1220 1300 13200
bridge
station numbers borehole 34borehole 38 borehole 23
MMC
bedrock
outwash
lakebeds
HaddenCreek
Till
HaddenCreek
Till
page 5b.
12601240122012001140112011001080106010401020 1300 1320
50
100
0tim
e (m
s)
150
200
300
350
250
EastWest
bridge
station numbers borehole 34borehole 38 borehole 23
225
375
500
270
165
135
160 ft0
appr
oxim
ate
dept
h (f
t)
fill material
diffraction (bowtie)
1280
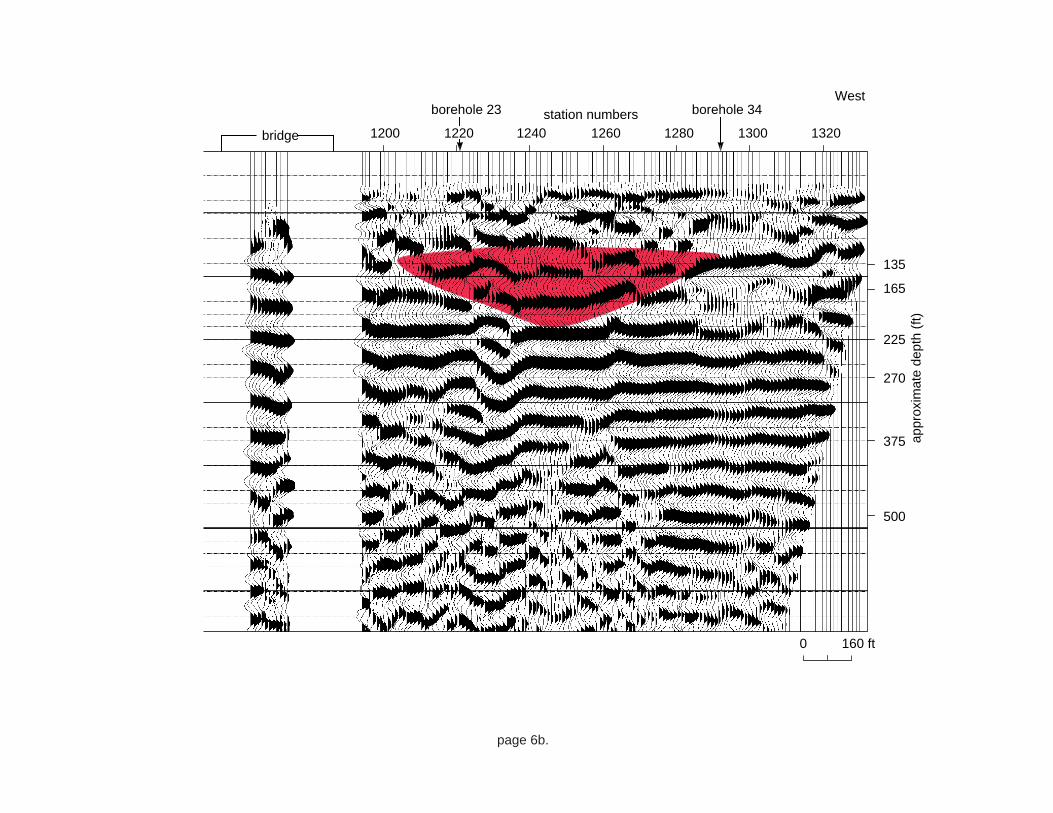
Figure 6. Intermediate CDP stacked section of line 3 at Mud Mountain Dam, Washington. This low frequency stack shows strong diffraction patterns and the appearance of a possible channel feature.
page 6a.
12601240122012001140112011001080106010401020 1300 1320
50
100
0
time
(ms)
150
200
300
350
250
EastWest
bridge
station numbers borehole 34borehole 38 borehole 23
225
375
500
270
165
135
160 ft0
appr
oxim
ate
dept
h (f
t)
fill material
diffraction (bowtie)
1280
page 6b.
8
mediate processed section. The diffractions or in this case “bow ties” interfering
beneath the channel features are indicators of a severely curved (small radius)
surface that is sufficiently severe to produce a geometrically distorted image on the
seismic section. Migration was used on the final section to correct the seismic
image.
The upper contact of the MMC is very well defined both geologically in
cuttings and acoustically by the strong reflection at about 180 msec. Based on stack-
ing velocities this reflection is around 280 ft below ground surface. Considering the
variability in velocity of the material above the MMC reflector, the 10 msec varia-
tion in arrival time across the line cannot be confidently interpreted as completely
related to topography on the MMC surface. Due to the missing data in the area
under and near the bridge it is difficult to determine if the MMC is slightly
mounded or thickens beneath the bridge. It is likely, based on the general structure
of underlying events, that either some uplift is present or a change in near-surface
material has resulted in increased average velocities, and therefore reflections at
depth are “pulled-up.”
A couple of well-defined reflection events that are within the portion of the
stacked seismic section interpreted to be MMC are likely from laterally consistent
reflectors that should have similar character in local borehole data. In examining
borehole logs, the shallower intermediate event is at a depth of around 400 ft and is
probably the contact between fine grain clay particles and gravels/cobbles which has
a very well-defined kick at around an elevation of 960 on electric logs. The deeper
coherent event thins near the center of the line and is probably a clayey sand/gravel
contact at about 465 ft in borehole 34. This same geologic layer is not present in
borehole 23 due to its shallow TD, and in borehole 38 it is not nearly as evident on
the electric logs. However, it is clearly a distinct acoustic contact. The MMC seems
to possesses several reflection events coherent and relatively flat across the profile
with little in the way of structurally complex features.
The bedrock surface is easily interpreted based on its relative time/depth and
the distinct character of the reflection wavelet. The bedrock structure is consistent
with interpretations from boreholes suggesting a bedrock high near the center of the
line. The bedrock elevation changes from 485 ft below ground surface at station
1030, 500 ft below ground surface at station 1070, 470 ft below ground surface at
station 1170, to 525 ft below ground surface at station 1310. Topographically, the
bedrock surface as defined by the seismic reflection section is very consistent with
well data. There appears to be a basin or channel feature directly beneath borehole
9
38 that is about 500 ft across and 20 ft deep. The saddle feature created by the
elevated bedrock surface at station 1170 should act to hydrologically divide the basin
on the east from the low on the west.
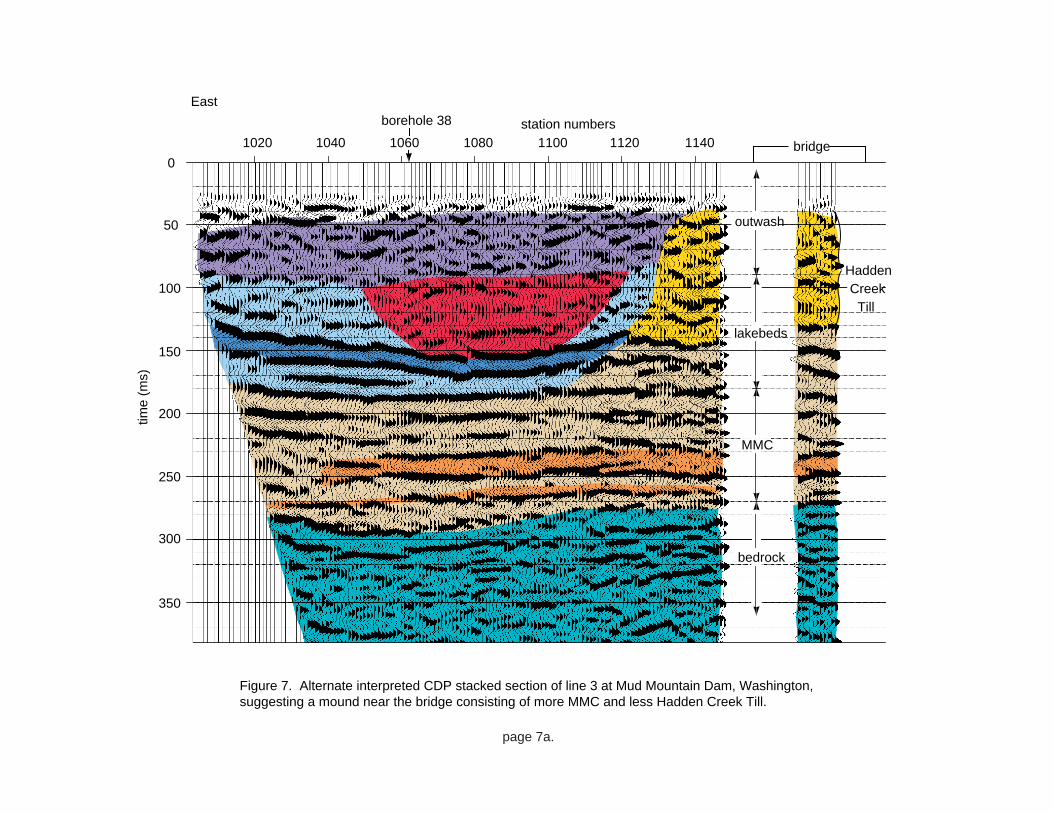
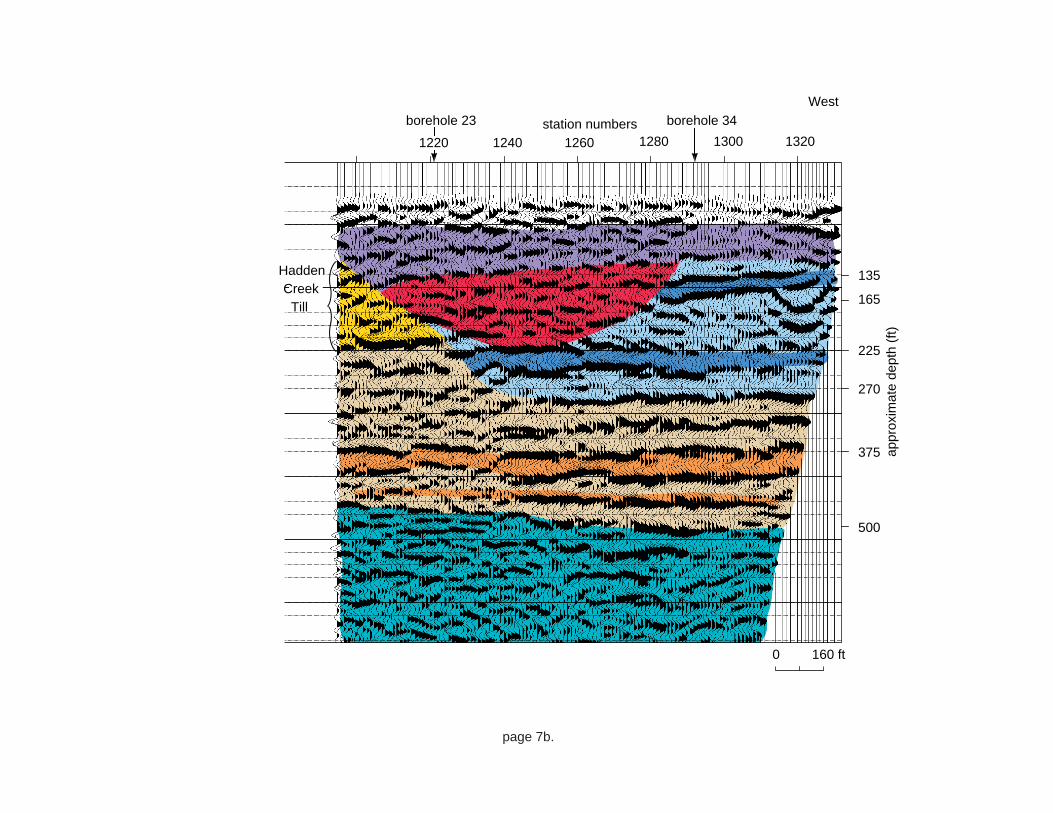
The most speculative feature interpreted on this section is the mound of
HCT. The apparent abrupt termination of the VLB sequence reflections and the
interpreted presence of HCT on the previous seismic section and borehole 24
provides a very strong basis for suggesting this acoustically unique area is the image
of a very steep-sided mound of HCT. If the interpretation of the HCT mound is
accurate, the contact between the HCT and MMC is very uniform with the HCT and
VLB both in contact with the relatively flat surface of the MMC. An alternate
interpretation places the contact between the MMC and the HCT about 70 to 80 ft
higher in the section (Figure 7). This interpretation is consistent with borehole 24
with the exception of the elevation of the bedrock surface beneath this remnant
mound. It is reasonable to suggest that the HCT is present beneath the bridge based
on the presence of HCT in borehole 24, the interpreted presence of the HCT on the
previous seismic profile, and the evidence suggesting HCT exposed in hillside
outcrop.
Conclusions
The seismic reflection program at Mud Mountain Dam was effective in
delineating the bedrock surface and apparent cut-and-fill channels within the
Vashon Lake Bed sequences. The excellent match between the seismic profiles and
the drill data allows confidence in extrapolating interpretations from well-to-well
for determination of orientation and localized variability in sedimentation. The
vibratory source allowed greater energy penetration with minimal to no environ-
mental impact. The 96-channel recording format allow better control of velocity
and provided improved coherency of deeper events by recording longer offsets than
possible on the first profile when only 48 channels were used. The outwash
material seems to have very little, if any, layered sedimentation or the
velocity/density contrast at layer boundaries is extremely small. The shallow high
resolution reflection technique clearly possesses the potential to resolve beds as thin
as 15 ft at this site.
The cut-and-fill features in the VLB sequences appear to extend from stations
1040 to 1110 and from stations 1210 to 1280 with the potential for very unsorted piles
of material (possibly similar to boulder outcrops on both flanks of the embayment)
deposited in channels between stations 1075 and 1105. The depths of these channels
East
120011001080106010401020 1300 1320
50
100
0
time
(ms)
150
200
300
350
250
West
bridge
borehole 34
225
375
500
270
165
135
MMC
bedrock
outwash
lakebeds
160 ft0
appr
oxim
ate
dept
h (f
t)
11401120 1220 128012601240
borehole 23station numbersborehole 38
Figure 7. Alternate interpreted CDP stacked section of line 3 at Mud Mountain Dam, Washington, suggesting a mound near the bridge consisting of more MMC and less Hadden Creek Till.
page 7a.
HaddenCreek
Till
East
120011001080106010401020 1300 1320
50
100
0
time
(ms)
150
200
300
350
250
West
bridge
borehole 34
225
375
500
270
165
135
MMC
bedrock
outwash
lakebeds
160 ft0
appr
oxim
ate
dept
h (f
t)
11401120 1220 128012601240
borehole 23 station numbersborehole 38
page 7b.
HaddenCreek
Till
10
are around 50 to 75 ft. Cuts into the VLB across the expanse of the embayment is
likely more common than the presence of the complete VLB and deltaic sequences
as present in borehole 34.
A basin or closed low in the bedrock surface is evident beneath well 38 with a
low extending westward off the end of the seismic profile. The closed low or basin
beneath well 38 could act as an isolated conduit for the movement of fluid.
Complete delineation of the cut-and-fill features as well as bedrock con-
figuration would require a seismic profile that included the entire Mud Mountain
access road. The data quality evident on this portion of the section would greatly
enhance well-to-well ties, providing several potential drill locations for accurate
monitoring of increased levels of saturation within the embayment.
Acknowledgments
We would like to thank William Hancock for his assistance with fieldlogistics and data acquisitions. Thanks also to Xujin Sun for his assistance with thefield work.
References
Miller, R.D., J.M. Anderson, D.R. Laflen, B.C. Bennett, and C.B. Park, 1995, Highresolution seismic reflection survey at Mud Mountain Dam near Enumclaw,Washington: Kansas Geological Survey Open-file Report #95-8.
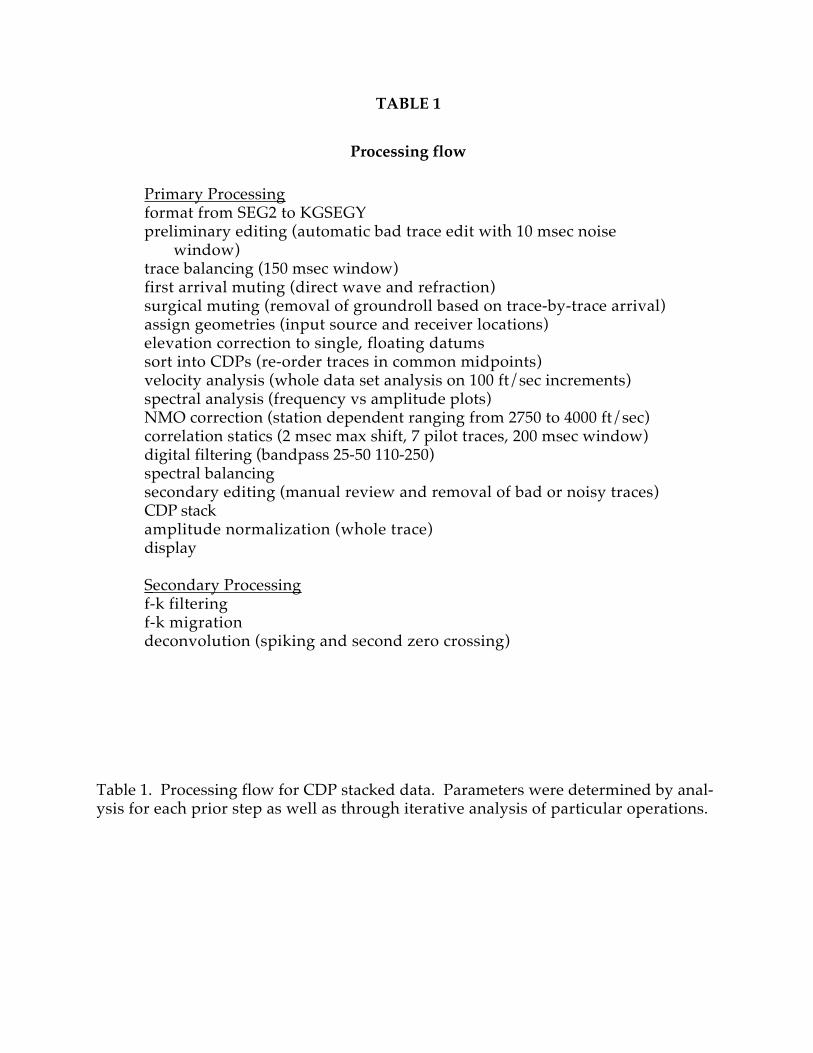
TABLE 1
Processing flow
Primary Processing format from SEG2 to KGSEGYpreliminary editing (automatic bad trace edit with 10 msec noise
window)trace balancing (150 msec window)first arrival muting (direct wave and refraction)surgical muting (removal of groundroll based on trace-by-trace arrival)assign geometries (input source and receiver locations)elevation correction to single, floating datumssort into CDPs (re-order traces in common midpoints)velocity analysis (whole data set analysis on 100 ft/sec increments)spectral analysis (frequency vs amplitude plots)NMO correction (station dependent ranging from 2750 to 4000 ft/sec)correlation statics (2 msec max shift, 7 pilot traces, 200 msec window)digital filtering (bandpass 25-50 110-250)spectral balancingsecondary editing (manual review and removal of bad or noisy traces)CDP stackamplitude normalization (whole trace)display
Secondary Processing f-k filteringf-k migrationdeconvolution (spiking and second zero crossing)
Table 1. Processing flow for CDP stacked data. Parameters were determined by anal-ysis for each prior step as well as through iterative analysis of particular operations.
Figure Captions
Figure 1. Site map indicating the relative location and orientation of the surveylines and bedrock elevations.
Figure 2. Two 48-channel field files showing the shot gather a) filtered and scaled,and b) filtered, scaled, and F-k filtered.
Figure 3. Nominal 48-fold CDP stacked section of line 3 at Mud Mountain Dam,Washington.
Figure 4. Geologic cross-section of line 3 based on wells #38, #24, #23, and #34, MudMountain Dam, Washington.
Figure 5. Interpreted CDP stacked section of line 3 at Mud Mountain Dam,Washington. The color codes are consistent with Figure 4. This interpretationsuggests a large mound of till that completely removes labeled sediments near thebridge.
Figure 6. Intermediate CDP stacked section of line 3 at Mud Mountain Dam,Washington. This low frequency stack shows strong diffraction patterns and theappearance of a possible channel feature.
Figure 7. Alternate interpreted CDP stacked section of line 3 at Mud Mountain Dam,Washington, suggesting a mound near the bridge consisting of more MMC and lessHadden Creek Till.