Embed Size (px)
Citation preview

WHO/HSE/WSH/10.04
ADDENDUM TO THE
WHO GUIDELINES FOR SAFE RECREATIONAL
WATER ENVIRONMENTS,
VOLUME 1, COASTAL AND FRESH WATERS
LIST OF AGREED UPDATES

ii
Addendum to Guidelines for Safe Recreational Water Environments, Vol 1
World Health Organization – Geneva, Switzerland
© World Health Organization 2009
All rights reserved. Publications of the World Health Organization can be obtained from Marketing and Dissemination,
World Health Organization, 20 Avenue Appia, 1211 Geneva 27, Switzerland (tel: +41 22 791 2476; fax: +41 22 791
4857; email: [email protected]). Requests for permission to reproduce or translate WHO publications – whether for
sale or for noncommercial distribution – should be addressed to Publications, at the above address (fax: +41 22 791
4806; email: [email protected]).
The designations employed and the presentation of the material in this publication do not imply the expression of any
opinion whatsoever on the part of the World Health Organization concerning the legal status of any country, territory,
city or area or of its authorities, or concerning the delimitation of its frontiers or boundaries.
The mention of specific companies or of certain manufacturers’ products does not imply that they are endorsed or
recommended by the World Health Organization in preference to others of a similar nature that are not mentioned.
Errors and omissions excepted, the names of proprietary products are distinguished by initial capital letters.
The World Health Organization does not warrant that the information contained in this publication is complete and
correct and shall not be liable for any damages incurred as a result of its use.

iii
CONTENTS
1. INTRODUCTION................................................................................................... 1
2. UPDATED ITEMS ................................................................................................. 2
Throughout .................................................................................................... 2
Introduction ...................................................................................................... 2
Table 4.1 Examples of pathogens and index organisms concentrated in raw
sewage ............................................................................................. 3
Box 4.1 Faecal streptococci/intestinal enterococci ........................................ 4
Table 4.2 Outbreaks Associated with Recreational Waters in the USA,
1985-2006 ....................................................................................... 7
4.3.2 Risk Assessment ............................................................................. 8
Box 4.2 Screening-level QMRA approach for bather risk............................ 11
4.3.3 Risk Management.......................................................................... 14
Table 4.6 Implementation of HACCP approach for recreational water
management .................................................................................. 15
Box 4.4 Percentage Calculation .................................................................. 17
Table 4.7 Guideline values for microbiological quality of recreational waters ...
.................................................................................................... 20
Box 4.5 Differential die-off of index bacteria and pathogens in seawater
and fresh water .............................................................................. 20
4.4.4 Guideline values for fresh water .................................................... 22
4.5.1 Animal Inputs (Item 4) .................................................................. 23
Box 4.6 Case Study..................................................................................... 24
4.7.1 Public health advisories and warnings ........................................... 25
4.7.2 Assessing and acting on single and/or high analytical results
(New Section) ............................................................................... 26
4.8 References .................................................................................... 27
12.2.2 Item 10.......................................................................................... 33

1
1. INTRODUCTION
This addendum provides updated information based on new scientific evidence to
explain matters relating to faecal pollution in the 2003 volume of the Guidelines for
Safe Recreational Water Environments, Volume 1, Coastal and Fresh Waters.
The addendum is the product of presentations and discussions that took place at an
expert meeting held in January 2009 at World Health Organization headquarters in
Geneva. Participants included researchers, regulators, and epidemiologist from seven
countries. The meeting was convened to review emerging evidence regarding faecal
pollution and human health in connection with recreational bathing waters. Through
the course of the meeting it was decided that there was insufficient new evidence nor
were there significant advancements in water quality monitoring to warrant a new
edition of the Guidelines. Rather, it was decided that updated information based on
best available evidence would be better presented in an addendum to the existing
Guidelines. Therefore, each participant, according to their expertise, contributed
material to this addendum.
The items in the addendum are listed in the numerical order (by page) in which they
appear in the Guidelines. Only those references that are not yet listed in the
Guidelines are listed in the addendum. For further information regarding the meeting
presentations and discussions reference is made to the report of the meeting on WHO
Guidelines for Safe Recreational Water Environments Meeting Report, World Health
Organization, 14-16 January 2009 - WHO/HSE/WSH/09.07, also available on the
Water, Sanitation and Health pages of the WHO web site
(www.who.int/water_sanitation_health).

2
2. UPDATED ITEMS
THROUGHOUT
Replace “Norwalk Virus” with “Norovirus”, except in Table 4.3.
Likewise on pg. 57, second paragraph, “Norwalk-like viruses” should be changed to
Noroviruses.
INTRODUCTION
page xxiiii
Replace paragraph 5 that begins with “Population groups” with:
Some population groups, such as the very young, the elderly, the
immunocompromised, and tourists, might be more susceptible to local endemic
pathogens and, thus, may be at higher risk to swimming-associated disease. Children
are clearly at higher risk because of their swimming behaviour and immature immune
systems, while visiting populations may be at higher risk because they have not been
previously exposed to local pathogens. Little is known about the risk of disease for
the elderly and immunocompromised exposed to recreational waters. Extensive
exposure to recreational waters by these higher risk groups should be considered in
the development of risk assessments and by managers of water resources.

3
CHAPTER 4. FAECAL POLLUTION AND WATER QUALITY
Page 54, TABLE 4.1 EXAMPLES OF PATHOGENS AND INDEX ORGANISMS
CONCENTRATED IN RAW SEWAGE
Replace second row, “Viruses”, with the following:
Viruses
Adenoviruses Ocular, respiratory and urinary infections,
gastroenteritis
47 600-11 600 000
Enteroviruses Central nervous system, ocular and respiratory
infections
0-3 723
Noroviruses Gastroenteritis 380-7 100 000
Rotaviruses Gastroenteritis 400-85 000
Update Footnote (a) with the following references: Bofill-Mas, et al., 2006; Costán-Longares et al.,2008; Iwai et al., 2009.
4
Page 55, BOX 4.1 FAECAL STREPTOCOCCI/INTESTINAL ENTEROCOCCI
Replace current Box 4.1 with new Box 4.1 below: Faecal streptococci and E. coli are used to index of faecal pollution in recreational
waters. However, they may not be useful in tropical waters due to potential growth in
soils/sediments. However, they may not be useful in tropical waters due to potential
growth in soils, in fact molecular methods has proved that E. coli can become
“naturalized” in the environment and do not necessarily indicate recent faecal pollution
(Ishii et al., 2007; Ishii and Sadowsky, 2008).
Faecal streptococci is a bacterial group that includes species of different sanitary
significance and survival characteristics (Gauci, 1991; Sinton & Donnison, 1994) and
species prevalence differs between animal and human faeces (Rutkowski & Sjogren,
1987; Poucher et al., 1991; see Table 9.8 in Bartram & Rees, 2000). The taxonomy of
this group has been subject to extensive revision (Ruoff, 1990; Devriese et al., 1993;
Janda, 1994; Leclerc et al., 1996) and contains species of two genera—Enterococcus
and Streptococcus (Holt et al., 1993). Although several species of both genera are
included under the term enterococci (Leclerc et al., 1996), the species most
predominant in the polluted aquatic environments are Enterococcus faecalis, E.
faecium and E. durans (Volterra et al., 1986; Sinton & Donnison, 1994; Audicana et
al., 1995; Figueras et al., 1998; Borrego et al., 2002). In fresh water E. faecium
prevails over E. faecalis while in seawater occurs the other way around (Figueras et
al., 1998).
Enterococci, a term commonly used in the USA, includes all the species described as
members of the genus Enterococcus that fulfil the following criteria: growth at 10 °C
and 45 °C, resistance to 60 °C for 30 min, growth at pH 9.6 and at 6.5% NaCl, and the
ability to reduce 0.1% methylene blue. Since the most common environmental species
fulfil these criteria, in practice the terms faecal streptococci, enterococci, intestinal
enterococci and Enterococcus group may refer to the same bacteria. In this chapter,
the term intestinal enterococci has been used, except where a study reported the
enumeration of faecal streptococci, in which case the original term has been retained.
The International Organization for Standardization (ISO) has developed two methods
one based on the Membrane Filtration Technique (MF) and the other based on the
Most Probable Number (MPN) using a miniaturized 96-well system to enhance
precision (Bartram & Rees, 2000—chapter 8). The MF method (ISO 7899-2)
employs the classical m-Ent culture media (with 1% sterile solution of TTC incubated
for 44 ± 4 h at 36 ±2°C), after which a transplantation of the filter to bile esculin azide
agar (incubating for 2 h at 44 ± 0.5 °C) allows for confirming all colonies that appear
as dark brown to black as intestinal enterococci. This confirmation step is essential to
avoid false positives (Figueras et al., 1996). The MPN (ISO7899-1) enumerates
intestinal enterococci on basis to their capacity to growth at 44 ± 0.5°C and of
hydrolysing 4-methylumbelliferyl-b-D-glucoside in the presence of thallium acetate,
nalidixic acid and 2,3,5-triphenyltetrazolium chloride, in specified liquid medium
being the reaction visualized by the emission of fluorescence in 36-72 h. Details are
given on the following page.
New approaches to the quantification of faecal indicator organisms in recreational
waters are emerging. Molecular methods such as quantitative Polymerase Chain
Reaction (qPCR) are being employed in epidemiological studies and showing promise
in predicting illness rates in swimmers (Wade et al., 2006; 2008; Ahmed et al.,
2008a). Such approaches also have potential utility as a rapid method of water quality

5
assessment to inform decisions on ‘advisory’ notices and timely management of
health risk at bathing waters. There is an indication of weak but significant correlation
(least squares regression R2 0.46) between intestinal enterococci, enumerated by
culture methods (e.g. colony counts from membrane filtration), and genome copy cell
equivalents enumerated by qPCR (Haugland et al., 2005). However, it is not
recommended that simplistic functional relationships between these parameters are
assumed and used to convert between parameter sets because their fate and transport
in the environment is very different. It is likely that future epidemiological studies
will deploy both culture and molecular methods in parallel and further information on
their statistical comparability will emerge in the medium term to underpin a more
rigorous comparative evaluation of their public health and management utility.
It may be important to identify human versus animal enterococci, as greater human
health risks (primarily enteric viruses) are likely to be associated with human faecal
material and therefore more emphasis on human sources of pollution is made in the
sanitary inspection categorisation of (see Table 4.12). Grant et al. (2001) presented a
good example of this approach. They demonstrated that enterococci from storm water,
impacted by bird faeces and wetland sediments and from marine vegetation,
confounded the assessment of possible bather impact in the surf zone at southern
Californian beaches. There will, however, be cases where animal faeces are an
important source of pollution in terms of human health risk.
E. coli are bacteria that replaced faecal coliforms as a more specific index of faecal
pollution because it is a more specific indicator of faeces from warm blooded animals.
It is considered an indicator of recent faecal pollution due to its higher decay rate than
intestinal enterococci, both in fresh water and sea water (Table 9.6 in Bartram &
Rees, 2000).
Of the two ISO methods, one is based on MF and the other on the MPN (Bartram &
Rees, 2000). The MF (ISO 9308-1) allows two alternative procedures the first is the
standard test and uses lactose TTC agar with Tergitol-7 and requires a probabilistic
confirmation of the colonies (at least 10). The second is the rapid test that use
tryptone soya agar ( 4-5 h at 36 ± 2°C°C) after which a transplantation of the filter to
tryptone bile agar (19-20 h at 44 ± 0.5°C) allows for confirming all the colonies that
turn red after the addition of drops of the indole reagent (on their top) as E. coli.
Transplantation can be avoided if both media are included in the same Petri dish and a
programmed incubation is used. This ISO method was designed for drinking water or
treated waters and may not be useful for contaminated marine waters or fresh waters
with many interfering microbes. The MPN method, ISO 9308-3 (96 wells),
enumerates E. coli on basis to their capacity to growth at 44 ± 0.5°C in tryptone,
salicine triton and of hydrolysing 4-methylumbelliferyl-b-D-glucuronide being the
reaction visualized by the emission of fluorescence in 36-72 h. It is worth mentioning
that both the MF and MPN ISO methods can provide results for E. coli that can be
equal or higher than the results obtained for faecal coliforms, because both methods
involve less selective conditions that may favour the recovery of stressed E. coli.
Both MPN ISO methods for intestinal enterococci (ISO7899-1) and E. coli had been
specifically designed for environmental waters with different degrees of pollution and
are not suitable for drinking water because the lower limit of detection is 15 counts
per 100 mL. This limit can be reduced to 3.5 counts per 100 mL using 3 microplates
per sample, 200 µl per well, 288 wells with a 1:2 dilution (Wiedenmann et al., 2006).
Many chromogenic and fluorogenic substrates exist for the specific detection of the
same enzymatic activities included in the ISO MPN methods, and various commercial

6
tests based on these substrates are available (Buckalew et al., 2006; Fricker et al.,
2008; Maheux et al., 2008).
While both MF and MPN ISO methods for intestinal enterococci provide quite similar
results, this is not the case for E. coli where the ISO MPN method can provide higher
results (>1 log) than the MF ISO in marine waters with very low levels of faecal
pollution, measured by the mean (and range) of intestinal enterococci of 11 (2-36)
cfu/100mL. This is due to enzymatic activity from other non-target bacteria (false
positives) at low levels of the targeted bacteria (Fiksdal & Tryland, 2008) or even by
plant extracts and algae including diatoms (Davies et al., 1994). The MPN methods
for intestinal enterococci and E. coli had been used for fresh recreational waters in a
recent epidemiological study without finding the false positive reactions for E. coli
mentioned above (Wiedenmann et al., 2006).

7
Page 56, TABLE 4.2 OUTBREAKS ASSOCIATED WITH RECREATIONAL WATERS IN
THE USA, 1985-2006A
Replace current table with table below:
TABLE 4.2 OUTBREAKS ASSOCIATED WITH RECREATIONAL WATERS IN THE USA,
1985-2006a
Etiological agent Number of cases Number of outbreaks
Shigella spp. 1905 25
Escherichia coli 0157:H7 313 15
Leptospira spp. 438 6
Giardia lamblia 76 6
Cryptosporidium parvum 471 8
Norovirus 300 11
Adenovirus 3 595 1
Acute gastrointestinal infections (no
agent identified)
Naegleria
2305
1
42
1 a
Craun et al., 1997; Dziudan et al., 2006; Kramer et al., 1996; Levy et al., 1998;
Yoder et al., 2004; 2008.

8
Page 60, 4.3.2 Risk Assessment Beginning with the second paragraph that starts “QMRA can be used to…”
replace remainder of the section with the following text:
TABLE 4.4 RISK ASSESSMENT PARADIGM FOR ANY HEALTH EFFECT remains as
presented.
QMRA can be used to indirectly estimate the risk to human health by predicting
infection or illness rates given densities of particular pathogens in recreational waters,
assumed rates of ingestion and appropriate dose-response models for the exposed
population (US EPA, 2007; Boehm et al., 2009). Application of QMRA to
recreational water use is constrained by the current lack of specific water quality data
for many pathogens and the fact that pathogen numbers, as opposed to faecal index
organisms, vary according to the prevalence of specific pathogens in the contributing
population and may exhibit seasonal trends.
These factors suggest a general screening-level risk assessment (SLRA) as the first
step to identify where further data collection and quantitative assessment may be most
useful. As such, QMRA should be undertaken in an iterative manner to explore where
health concerns may arise for the system being modelled. Further, QMRA should be
undertaken with stochastic values (using distributions rather than point estimates) to
better account for the inherent variability as well as the uncertainty in parameter
values. Where estimated risks are consider unacceptable, but uncertainties are high,
research to reduce uncertainties is suggested, followed by re-running of the QMRA.
Nonetheless, key areas for risk management can still be identified using uncertain
QMRA parameter values and initial point estimates (in a screening-level risk
assessment).
Caution is required in interpreting the results of a QMRA because the risk of infection
or illness from exposure to pathogenic microorganisms is subject to many
uncertainties. It should also be recognized that microbial risks are fundamentally
different from the risk associated with other contaminants, such as toxic chemicals.
Consequently, QMRA has greatest utility to aid in risk management (Section 4.3.3),
where relative changes in estimated risks to various scenarios can be explored to
provide insight into where management may be most beneficial. Also QMRA can
explore risks either below epidemiologically detectable levels or under circumstances
that are not suited to epidemiological examination.
Several of the key differences between exposure to pathogens and toxic chemicals
are:
• Exposure to pathogens can occur via an environment-to-person pathway, but
can also occur due to person-to-person contact (secondary spread);
• whether a person becomes infected or ill after exposure to a pathogen may
depend on the person’s immune status. This condition implies that exposure
events are not independent;
• infectious individuals may be symptomatic or asymptomatic;
• different strains of the same pathogen have a variable ability to cause disease
(differing virulence);
• this virulence can evolve and change as the pathogen passes through various
infected individuals; and
• pathogens are generally not evenly suspended in water.

9
Although the differences between exposure to chemical agents and pathogenic
microorganisms are widely acknowledged, the conceptual framework for chemical
risk assessment (Table 4.4) has been commonly employed for assessing the risk
associated with exposure to pathogenic microorganisms. Frameworks have been
developed specifically to assess the risks of human infection associated with exposure
to pathogenic microorganisms and to account for some of the perceived shortcomings
of the chemical risk framework with respect to properties unique to infectious
microorganisms. However, to date, these frameworks have not been widely adopted,
such as those that attempt to account for prior immunity and secondary spread of
infectious agents, so called dynamic models (Soller & Eisenberg, 2008) rather than
the more common static (or single pass) models.
In employing the chemical risk framework to carry out a SLRA, representative
pathogens for viral, bacterial and parasitic protozoan pathogens (reference pathogens)
are used to conservatively characterize each pathogen group. For example, the
occurrence of adenovirus, with its associated dose–response curve, may be used as a
predictor for all enteric viruses. As such, conservative estimates of exposure to each
reference pathogen are initially used to characterize “total” risks from each of the
groups of pathogens. The results of the SLRA, often only calculated the end point of
infection (not disease), should then indicate an order of magnitude estimate of risk,
whether or not further data are required and if risks are likely to be dominated by a
single class of pathogen or source (potentially defining options for risk management).
It should be emphasized that this SLRA approach presumes that little net error is
made by not accounting for either person-to-person transmission of disease or
immunity.
Despite the somewhat limited array of microorganisms and exposed sub-populations
for which dose–response relationships have been estimated, there is a sufficient array
of reference pathogens to at least undertake a SLRA. The range of microbes from
which to select relevant reference pathogens for a particular site include: for the
enteric viruses, rotavirus, adenovirus, and norovirus; for enteric bacteria, Salmonella
enterica (various serotypes), Campylobacter jejuni, and E. coli O157:H7; and for
parasitic protozoa, Cryptosporidium parvum, and Giardia lamblia (Haas et al., 1999;
US EPA, 2005; Teunis et al., 2008). A screening-level QMRA and risk management
approach is outlined for a recreational water example in Box 4.2 (adapted from Roser
et al., 2006; 2007).
A more comprehensive alternative to the SLRA approach is to employ a population
based disease transmission (dynamic) model to assess the risks of human disease
associated with exposure to pathogenic microorganisms. In this population-based
approach, the potential for person-to-person transmission and immunity are accounted
for (Eisenberg et al., 1996; Soller, 2002), however, the models require substantially
more epidemiological and clinical data than SLRA models. Application of the disease
transmission modelling approach may, therefore, be more limited than the SLRA
approach.
The primary advantages of QMRA studies are that the potential advantages and
limitations of risk management options may be explored via numerical simulation to
examine their potential efficacy, and that risk below epidemiologically detectable
levels may be estimated under certain circumstances. The limitations of QMRA
studies, as noted earlier, are that limited data are available to carry out these

10
assessments and, in many cases, the data that are available are highly uncertain and
variable. Nevertheless, it may be inferred from several of the available QMRA studies
(Sydney and Honolulu) (Mamala Bay Study Commission, 1996; Ashbolt et al., 1997)
that they provide supporting evidence for the results of various epidemiological
studies.
Thus, QMRA can be a useful tool for screening the risk to public health at
recreational water sites and for determining the potential efficacy of management
alternatives through the integration of a wide array of disparate data. Finally, QMRA
provides credible scientific analysis that can be used in conjunction with or, at times,
in lieu of epidemiological investigations to assess risk to human health at recreational
water sites.

11
Page 62, BOX 4.2 SCREENING-LEVEL QMRA APPROACH FOR BATHER RISK
Replace Box 4.2 with the following text:
A freshwater lake that had been closed to swimming due to high faecal indicator
levels was evaluated to see if under certain conditions it would be suitable for
recreational activity in Sydney, Australia (Roser et al., 2006; 2007). Historic
monitoring data and a recent sanitary inspection around the 10.5 hectares lake
identified background E. coli/enterococci contamination due to waterfowl and
periodic contamination due to sewer overflows via the major inflow creek. The
concentration of pathogens in waters may be estimated from the mean pathogen
densities in raw sewage and their dilution in recreational waters (based on the
numbers of index organisms to pathogens; see Table 4.1). As an initial conservative
approximation of pathogen numbers in recreational waters, E. coli or enterococci may
be used as an index for the dilution of sewage-associated bacterial pathogens (e.g.,
Salmonella) and spores of Clostridium perfringens or enterococci for the enteric
viruses and parasitic protozoa. Alternatively, direct presence/absence measurement of
pathogens in 1-10-L volumes of recreational waters may be attempted (Reynolds et
al., 1998; Calgua et al., 2008).
An additional important factor in highly transparent water bodies is that of solar
inactivation. Modeling solar inactivation is possible based on the work of Davies-
Colley et al. (2000) (equation below). This model explains how it is possible to have
widely different estimates for the first order reaction constant k, and that it can be
important to incorporate estimates of solar radiation exposure:
KH
S
sdsd kkSkkk 0+=+=
Where kd = dark inactivation coefficient, ks = sunlight inactivation coefficient and S is
the insolation averaged over the water column of depth H and light attenuation
coefficient K, and So is insolation incident at the water surface.
In optimised experimental reactors the solar irradiance required for 90% reduction
(S90s) are typically 2.5-5 MJ.m-2
for bacterial and F-RNA coliphage faecal indictors
(e.g. Davies–Colley et al., 2005), and for Enterococcus faecalis, Clostridium
perfringens and the DNA bacteriophage PRD1, 1-2 MJ.m-2
. For comparison the
radiation on sunny summer days in Sydney is about 20-35 MJ.m-2
.d-1
and seldom
drops below 10 MJ.m-2
.d-1
in summer. Hence the stormwater microbial inflows to the
lake could be reduced by over five logs and measured T90S (time for 90% reduction
due to sunlight) were 1 to 2 days.
After the general concentrations of pathogens from the three microbial groups have
been determined, selected reference pathogens are used for which dose–response data
are available (e.g., Campylobacter jejuni, Salmonella enterica, Cryptosporidium
parvum, Giardia lamblia, rotavirus and adenoviruses) (WHO, 2004). Note that these
specific pathogens may not necessarily be the major etiological agents, but are used as
characteristic of the likely pathogens. Risks from viral, bacterial and protozoan
pathogens can then be characterized per exposure by applying published dose–
response models for infection and illness (Haas et al., 1999).
Hence, using the approach described by Ashbolt et al. (1997) and assuming sewage as
the primary source of pathogens (faecal sterols indicated a primary dilution factor of
3x10⁻⁵
[e.g. ca 1:30,000]), accidental ingestion of 20-50 mL per swim (Dufour et al.,
2006), and bather shedding described by Gerba (2000), the estimated infection risks
were generated for five scenarios (Table 4.5).

12
During dry weather (Scenario 1, Table 4.5) the maximum infection risk for a given
pathogen per bathing event was 2.7 x 10⁻⁶
, supporting the conclusion that at such
times primary contact should be acceptable (threshold risk of illness being about 5%
for gastroenteritis, Table 4.7). With increasing rainfall input and shorter Lake
recovery times (Scenario 2) risks from run-off increased and in the case of
Campylobacter approached the proposed benchmark (5 x 10⁻³
infection
probability.person-1
.exposure-1
). Scenario 3 illustrated the importance of allowing
water quality to recover and the effect on infection risk of not making this allowance.
Scenario 4 generated two more risk estimates close to the proposed pathogen
benchmark. These high risks arise not only from the input load but also from the use
of a more conservative dilution factor. This increase indicates an additional day
recovery might be advisable following a very large event (>100 mm). Scenario 5,
shedding of pathogens by bathers, appears to be of greatest concern. The risk estimate
for rotavirus indicated an infection risk on average of 9.2x10⁻²
person-1
.exposure-1
despite high-simulated dilution. This high value arose due to the following: the high
numbers of viral particles released per bather shedding event (1 event per 1000
bathers (Gerba, 2000) with 1.4 x 10⁴ protozoa per bather per contact day and 1.4 x 10
7
enteric viruses per bather per contact day); the low dose-response relationship
reported in the literature and used in the simulation; and the inclusion of excretion by
children in the estimate of the quantity of average faecal matter excreted, which Gerba
(2000) estimates is about 100-times higher than for adults.
TABLE 4.5 - RISK ESTIMATES (INFECTION PROBABILITY.PERSON-1
.EXPOSURE-1
) FOR
LAKE SWIMMERS UNDER FIVE DIFFERENT SCENARIOS Scenario Reference
Pathogen Different amounts of rainfall
1. Dry
Weather 2. Management
Trigger
Threshold Risk (9.9 mm previous
night)
3. Substantial
(40 mm) Event
followed by
three days
recovery
4. Large
Event (180
mm),
Epilimnion
Displaced,
Five days
recovery
5. Bather
sheddingb
Cryptosporidium 2.5x10⁻⁶ 1.9x10⁻⁴ 8.1x10⁻⁵ 1.6x10⁻³
9.3x10⁻⁵
Giardia 3.8x10⁻⁷
2.9x10⁻⁵
1.2x10⁻⁵
2.4x10⁻⁴
2.8x10⁻⁶
Rotavirus 2.3x10⁻⁸
1.8x10⁻⁶
7.4x10⁻⁷
1.4x10⁻⁵
9.2x10⁻²
Enterovirus 6.9x10⁻¹¹ 5.2x10⁻⁹ 2.2x10⁻⁹ 4.3x10⁻⁸ 3.5x10⁻⁴
Salmonella 2.3x10⁻¹¹
1.8x10⁻⁸
7.4x10⁻¹⁰
4.6x10⁻⁹
-
Campylobacter 2.7x10⁻⁶
2.1x10⁻³
8.6x10⁻⁵
5.4x10⁻⁴
- a Infection probabilities close to, or exceeding, the proposed benchmark probability range
(0.5-2 x 10⁻³) are shown in bold. b Shedding risks were calculated separately to risks from run-off.
Risk Management Guidance from the QMRA Because of the variation in run-off event sizes it was seen as essential to estimate
Lake recovery rates and using these estimates develop a defensible scheme for
estimating when the Lake water quality was likely to have recovered. Within the
limits of the method it was estimated that recovery for run-off events involving > 10
mm of rainfall in the previous 24 h would require between 1.5 and 4 days or
cumulative global radiation exposure of between 40 and 93 MJ.m-2
assuming that
solar radiation was the primary inactivation agent.
Hence, the proposed water safety plan for the lake was based on:

13
• During ‘dry weather’ the small pathogen inputs from contaminated stormwater
are unlikely to pose a significant risk to bathers;
• 10 mm of rainfall appears to be a rational trigger for managing access;
• Following substantial rainfall events the probability of infection from
pathogens rises to levels of concern, and a no-swim period of a few days (two
to three days) should allow for solar radiation driven suitable for primary
contact recreation; and
• Bather shedding appears to be the greatest concern during Lake use and hence
the need to emphasize good hygiene and potentially limit lake recreator
numbers. However, this can be reduced with toilet facilities and education
campaigns.

14
Page 63, 4.3.3 Risk Management
Replace entire sub-section with text below:
To meet health targets ultimately based on a tolerable risk of illness (see section 4.4),
achievable objectives need to be established for water quality and associated
management. Hazard analysis and critical control point (HACCP) or what has
evolved for the water management, water safety plans (WSP) provide an approach. A
WSP promotes good operational/management practice and effective quality assurance
(QA), similar to that used in the food and beverage industry (Deere et al., 2001) since
its codification in 1993 by the Food and Agriculture Organization of the United
Nations and WHO Codex Alimentarius Commission. WSP for drinking water were
developed from the HACCP approach (Davison et al., 2006; Bartram e al. , 2009) and
are equally applicable to recreational and reuse water management.
An example WSP outline for recreational waters is described in Table 4.6. This risk
management procedure should be approached in an iterative manner, with increasing
detail proportional to the scale of the problem and resources available. By design, the
WSP addresses principally the needs for information for immediate management
action; when applied to recreational water use areas, however, its information outputs
are also suitable for use in longer-term classification.
Variation in water quality may occur in response to events (such as rainfall) with
predictable outcomes, or the deterioration may be constrained to certain areas or sub-
areas of a single recreational water environment. It may be possible to effectively
discourage use of areas that are of poor quality or discourage use at times of increased
risk. Since measures to predict times and areas of elevated risk and to discourage
water contact during these periods may be inexpensive (especially where large point
sources are concerned), greater cost effectiveness and improved possibilities for
effective local management intervention are possible (see section 4.7).

15
Page 64, TABLE 4.6 IMPLEMENTATION OF HACCP APPROACH FOR RECREATIONAL
WATER MANAGEMENT
Replace entire table with table below and rename table as follows
“TABLE 4.6 WATER SAFETY PLAN OUTLINE FOR RECREATIONAL
WATER MANAGEMENT”
Component Action
System Assessment
Assemble
WSP team • The team is formed to steer the overall process. Composition of the
team should represent all stakeholders and cover all fields of expertise
as much as possible. Representatives of health agencies, microbiologist
responsible of the analysis, user groups, tourism industry, water and
sewage industry, communities, competent authorities, potential
polluters, experts in hazard and risk analysis, etc., should all therefore
be considered.
Document and
describe the
system
• Summarize previous data from sanitary surveys, compliance testing,
maps specifying sewage inputs, overflow points and stormwater pipes
and overflows.
• Determine if there are major animal faecal sources within the
recreational water catchment.
• Reference development applications and appropriate legal requirements.
• If no (historic) microbiological/sanitary data are available, collect basic
data to fill data gap/deficiency.
Produce and
verify pollutant
flow charts
• Produce and verify source-to-water flow charts for faecal pollution from
source(s) to recreational exposure area(s) for each recreational water
catchment. This may require a new sanitary survey.
• The series of flow charts should illustrate what happens to water
between source(s) and exposure in sufficient detail for potential entry
points of different sources of faecal contaminants to be pinpointed and
any detected contamination to be traced (WHO, 2009).
• This information may best be summarised in conceptual diagrams for
normal and potential event conditions to aid in pollutant management
(WHO, 2009).
Hazard Identification & Risk Prioritisation
Identify
potential
hazards
• Identify human versus different types of animal faecal pollution sources
and potential points of entry into recreational waters as either a risk
priority or major risk.
Determine
existing control
measures
• Determine significance of possible exposure risks (based on judgement,
quantitative and qualitative risk assessment, as appropriate).
• Identify existing control measures to prevent/reduce exposure.
Risk
prioritisation • Identify preventive measures (control points) for all significant risks &
prioritise. (See Box 4.2)
Operational Monitoring to Support Risk Management
Operational
monitoring and
selection of
operational
control
parameters
• Establish a monitoring regime to give early warning of exceedances
beyond operational limits (see Box 4.2, section 4.7.7). Those
responsible for the monitoring should be closely involved in developing
monitoring and response procedures. Note that monitoring is not limited
to water sampling and analysis, but could also include, for example,
visual inspection of potential sources of contamination in catchment,
flow/overflow gauges, change in river heights, amount of rainfall, wind
speed, and direction.
Establish
corrective action
for deviations
• Identify those points or locations at which management actions can be
applied at defined control points to reduce the presence of, or exposure
to, hazards to acceptable levels. Examples include municipal sewage

16
that may occur discharge points, treatment works operation, combined sewer overflows,
illegal connections to combined sewers, etc.
• Determine measurable control parameters (e.g. salinity deviation from
normal values for seawater) and their operational limits. Ideally, assign
target and action limits to pick up trends towards operational limits
(e.g., >10–20mm rainfall in previous 24-h period that based on historic
data analysis would exceed the beach microbiological criteria or
notification of sewer overflow by local agency).
Incidents and
emergency
responses
• If the corrective action does not bring the system back under control, or
if some unforeseen event occurs, it’s possible that water quality and
safety could become compromised. Under such circumstances a major
response is required to prevent potentially significant health impacts.
Such broad responses are often terms ‘incidents’ or ‘emergencies’.
Under such circumstances signs prohibiting bathing and announcement
through load speakers may be the responses as well as fencing and
posting signs in the affected area.
Verification and Audit
Verification • Obtain objective evidence that the envisaged management actions will
ensure that the desired water quality will be obtained or that human
recreational exposures will be avoided; e.g. inspect the site for absence
of bathers. This would draw from the literature and in-house validation
exercises.
Auditing • Obtain objective data from auditing management actions that the
desired water quality or change in human exposure is in fact obtained
and that the good operational practices, monitoring and management
actions are being complied with at all times.
Supporting Programmes and Management Procedures
Management • Prepare and test actions to reduce or prevent exposure in the event of
critical limit actions being exceeded. Examples include building an
appropriate treatment and/or wastewater disposal system, training
personnel, developing an early warning system for bathers, issuing a
media release and (ultimately) closing the area for recreational use.
Record keeping • Ensure that monitoring records are retained in a format that permits
external audit and compilation of annual statistics. These should be
designed in close liaison with those using the documents and records.
17
Page 69, BOX 4.4, PERCENTAGE CALCULATION
Replace entire Box 4.4 with content below:
Inappropriate choice of methods for calculation of the 95th percentile or their use on
limited data sets is liable to lead to substantial error that can lead to misclassification
of recreational waters.
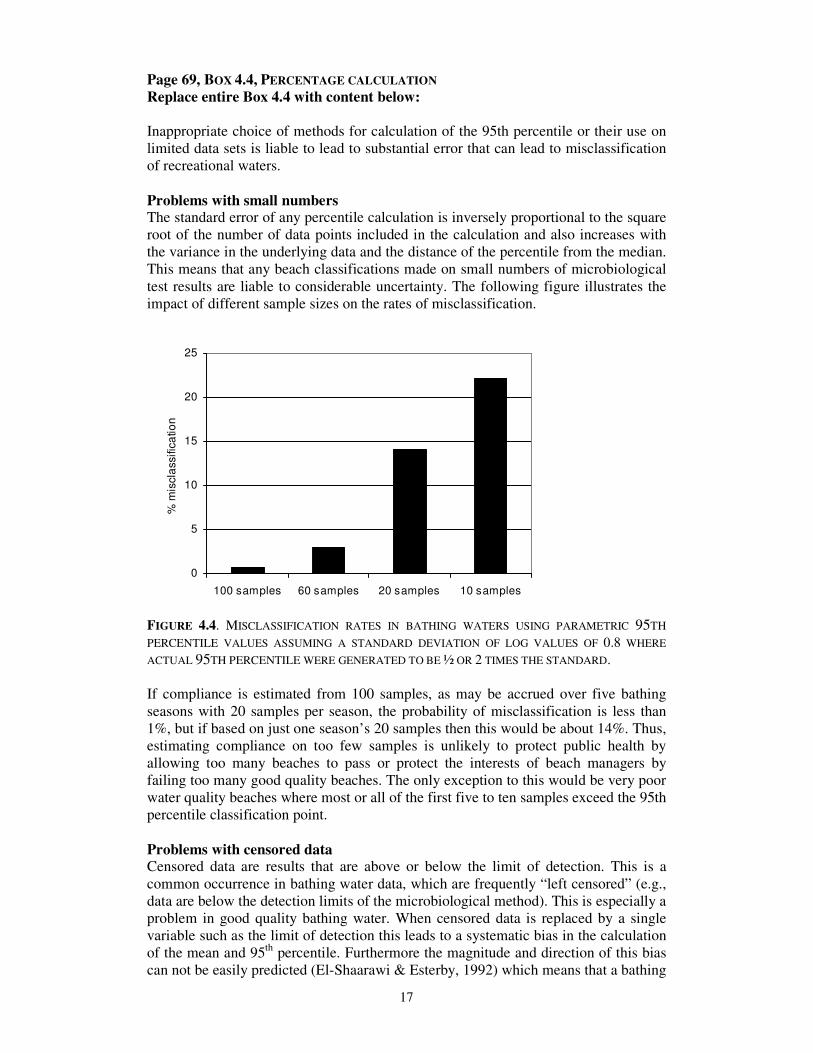
Problems with small numbers The standard error of any percentile calculation is inversely proportional to the square
root of the number of data points included in the calculation and also increases with
the variance in the underlying data and the distance of the percentile from the median.
This means that any beach classifications made on small numbers of microbiological
test results are liable to considerable uncertainty. The following figure illustrates the
impact of different sample sizes on the rates of misclassification.
0
5
10
15
20
25
100 samples 60 samples 20 samples 10 samples
% m
iscla
ssific
atio
n
FIGURE 4.4. MISCLASSIFICATION RATES IN BATHING WATERS USING PARAMETRIC 95TH
PERCENTILE VALUES ASSUMING A STANDARD DEVIATION OF LOG VALUES OF 0.8 WHERE
ACTUAL 95TH PERCENTILE WERE GENERATED TO BE ½ OR 2 TIMES THE STANDARD.
If compliance is estimated from 100 samples, as may be accrued over five bathing
seasons with 20 samples per season, the probability of misclassification is less than
1%, but if based on just one season’s 20 samples then this would be about 14%. Thus,
estimating compliance on too few samples is unlikely to protect public health by
allowing too many beaches to pass or protect the interests of beach managers by
failing too many good quality beaches. The only exception to this would be very poor
water quality beaches where most or all of the first five to ten samples exceed the 95th
percentile classification point.
Problems with censored data Censored data are results that are above or below the limit of detection. This is a
common occurrence in bathing water data, which are frequently “left censored” (e.g.,
data are below the detection limits of the microbiological method). This is especially a
problem in good quality bathing water. When censored data is replaced by a single
variable such as the limit of detection this leads to a systematic bias in the calculation
of the mean and 95th
percentile. Furthermore the magnitude and direction of this bias
can not be easily predicted (El-Shaarawi & Esterby, 1992) which means that a bathing

18
area with very low values <10ufc/100mL and that sporadically shows some values as
40 or 60 cfu/100mL may have a 95th percentile above the standard for excellent water
quality. A number of adjustments to the parametric calculation of the 95th
percentile
have been proposed but none of them work well under all circumstances (Hewett &
Ganser, 2007).
Problems with distributions other than log normality The parametric estimation of the 95th percentile is based on the assumption that the
data is normally distributed after being log transformed. When this assumption is not
correct then there will be errors in the calculated mean and so 95th
percentile
(Schmoyer et al., 1996). In a study of Irish bathing water quality datasets, the data
were not log-normally distributed in 85% of sites where there was disagreement
between the parametric and % compliance results (Chawla & Hunter, 2005). It would
appear that many bathing water datasets are not log normal, nor is it usually possible
to determine the underlying distribution, in part because of censoring within the data
or because in excellent bathing areas the low values will prevail.
Recommendations Bathing water classification cannot be made on small numbers of samples unless the
bathing water quality is very poor, otherwise there will be a significant number of
misclassifications. At least 60 samples are required and preferably 100 samples.
The parametric calculation of percentiles cannot be recommended for the numerical
basis of bathing water classification unless there are no results that are outside the
limits of detection of the microbiological method and the dataset is shown to be log
normally distributed. Both these conditions are likely to be uncommon. A non-
parametric method is more appropriate. The Hazen method has been shown to be the
least biased estimator (Hunter 2002, Bartram & Rees, 2000—Chapter 8).
Hazen is a ranking formula where the data are ranked in ascending order. The rth
count is then the value of the appropriate percentile where r is given by formula:
1002
1 Pnr +=
Here P is the percentile and n the number of values in the dataset (how you practically
derive the Pile from this formula an example is required). Because the above formula
rarely gives an exact rank, the percentile is calculated by interpolation between the
two data-points on either side of the calculated rank. So assume that we have 100
samples for the calculation of the 95th percentile (the 95th percentile = 5th
largest out
of 100)
100
1005
2
1 ×+=r
5.5=r
So the 95%ile is half way between the 5th
and 6th
largest value. If the 5th
largest value
is 115 and the 6th
is 111 then the 95th percentile would be 115 - (115-111) x 0.5 =
113.
Now assume only 46 samples;

19
100
465
2
1 ×+=r
8.2=r
Hence, the 95th percentile is somewhere between the 2nd
and 3rd
largest value, but
closer to the 3rd
largest. If the 2nd
largest number is 115 and the 3rd
is 111 then the
95th percentile would be 115 - (115-111) x 0.8 = 111.8.

20
Page 71, Table 4.7. GUIDELINE VALUES FOR MICROBIOLOGICAL QUALITY OF
RECREATIONAL WATERS, Continued
Replace current Footnote 7, with text below:
This table may not apply to children, the elderly, or immunocompromised persons
because it was developed from studies of young, healthy adults. Presently available
data on these special groups (children) does not lend itself to quantifying the degree of
protection needed by at higher risk groups and, therefore, no correction factors are
applied to the current guidelines.
Add Footnote 8, with text below: Epidemiological data on fresh waters, obtained using the same methodology as in the
seawater study which formed the basis to calculate the attributable risks listed in the
table, yielded considerably lower attributable risks at the same concentrations of
faecal indicators, while relative risks (2.6 in the fresh water versus 2.5 in the seawater
study, at values above 50 IE/100 mL) and the threshold of effect (38 IE/100 mL [95th
percentile value]) were very similar (Wiedenmann et al., 2004; 2006). This might be
partially explained by a higher ratio of pathogens to indicators in seawater. But it
might have primarily resulted from a lower susceptibility to infection or disease of the
participants in the fresh water study, which could also explain the much lower disease
rates in the non-bathers group. As a high susceptibility to infection or disease,
dependent on the epidemiological situation present at the time of the study, and this
might also occur in freshwater environments (Fewtrell et al., 1992, Prüss, 1998), it is
recommended that the information given in the table should also be used to set
indicator standard values in freshwaters. The same applies for exposures other than
swimming (e.g., high exposure activities such as surfing, dinghy boat sailing, or
whitewater canoeing). In addition, it is recommended that the length and frequency
of exposure encountered by special interest groups (such as body surfers boat riders,
wind surfers, sub-aqua divers, canoeists and dinghy sailors) be taken into account.
Page 71, BOX 4.5 DIFFERENTIAL DIE-OFF OF INDEX BACTERIA AND PATHOGENS IN
SEAWATER AND FRESH WATER
Change sentence before Table 4.8 to:
Cioglia & Loddo (1962) showed that poliovirus, echovirus, and coxsackie virus were
inactivated at approximately the same rate in marine and fresh waters, but it is
important to note that other factors, such as water temperature, are more important
than salinity for virus inactivation (Gantzer et al., 1998). Information on survival of
viruses in seawater and freshwater is shown in Table 4.8.
Refer to updated Table 4.8 on following page.

21
Page 71, BOX 4.5 DIFFERENTIAL DIE-OFF OF INDEX BACTERIA AND PATHOGENS IN
SEAWATER AND FRESH WATER
Replace Table 4.8 with the table below:
TABLE 4.8. SURVIVAL OF VIRUSES IN SEAWATER AND RIVER WATER
Die-off rates (in days)
Virus Strain Seawater River water
Adenovirus 40, 41a 1 LTR in 40 days 3.2 LTR in 60 days. 1 LTR
in 40 days
Enterovirus 1 LTR in 4 days b 1 LTR in 2 days in river
water “in situ” c
Hepatitis Ad 2 LTR in 28 days Estuarine water: 2 LTR in
28 days
Rotaviruse Bovine Rotavirus decay
0.5 LTR per day
Group A virus: 2 LTR >
64 days in tapwater or 10
days in river water ; Group
B virus: 3.2 LTR in 60
days
LTR: Log titre reduction
a. Enriquez et al., 1995.
b. Bitton, 1978.
c. O’Brien & Newman, 1977.
d. Sobsey et al., 1988.
e. Loisy et al., 2004; Terrett et al., 1987; Vondefecht et al., 1986.

22
Page 72, Add after 2nd
Paragraph (Section 4.4.4 Guideline values for fresh water) The faster die-off of index bacteria than certain pathogens, especially viruses
(Enriquez et al., 1995) in sea water compared with fresh water (Box 4.5), and the
significant differences in swimming-associated GI rates in seawater swimmers and
freshwater swimmers at a given level of faecal index organisms observed in certain
epidemiological studies as discussed by Dufour (1984; 2007) has prompted national
and international authorities to set different standards for seawater and freshwater
(e.g., US EPA since 1983, EU since 2006).
Page 72, 3rd
full Paragraph (Section 4.4.4 Guideline values for fresh water) Replace paragraph starting with “Studies using a randomised trial design have
been conducted in Germany at fresh water sites. These have…” with the following
text:
When Wiedenmann et al. (2006) repeated the key studies mentioned in 4.4.3 using a
similar randomised controlled trial design in German freshwater bathing sites, and
compared their results to those of the eligible studies reviewed by Prüss (1998), they
came to the conclusion that the highly variable attributable risks (‘excess risks’) of
gastroenteritis (0.4 to 27.7% in freshwater and 0.5 to 19.5% in seawater studies) were
most likely due to differences in the cohort susceptibility as demonstrated, e.g., by
Cabelli et al. (1982) for local residents and tourists at Egyptian beaches and in other
studies (Prüss 1998, Wiedenmann et al. 2004 and 2006, Dizer et al. 2005,
Wiedenmann 2007a). They suggested that in order to account for variable
susceptibilities of bathers in different epidemiological studies, a rationale different
from the one based solely on the “disease burden” concept might be necessary for
relating standards to potential health threats. This rationale might be based on
threshold concentrations (No Observable Adverse Effect Level; NOAEL’s), above
which disease rates start to increase (Wiedenmann, 2007b), or on relative rather than
attributable risks.

23
Page 76, FIGURE 4.4
Change to FIGURE 4.5.
A new figure was added in Box 4.4; therefore the subsequent figure on pg 76 should
be changed from Figure 4.4 to Figure 4.5.
Page 82, 4. Animal Inputs
Insert text below after first paragraph on animal inputs: The emerging technique of Microbial Source Tracking (MST) offers the potential for
determining the source of faecal indicator concentrations in a receiving water used for
recreational activities. The suite of approaches was recently reviewed in a collection
of papers published in Water Research (Vol. 41) and national agencies have produced
useful review papers (US EPA, 2005; Edge, 2006) and other valuable review papers
can be accessed in the international literature (Ahmed et al., 2008; Field et al., 2003;
Field & Samadpour, 2007; Gourmelon et al., 2007; Ishii & Sadowsky, 2008; Isobe et
al., 2004; McLaugin et al., 2007; Reischer et al., 2008; Santo Domingo et al., 2007;
Stoeckel and Harwood, 2007; Vogel et al., 2007). This suite of methods range from
chemical approaches, such as the detection of sterols and fluorescent whitening
agents, through microbial techniques based on antibiotic resistance profiling and
qPCR assessment of human and ruminant fractions of the bacteriodetes flora. It is
prudent to deploy a range of methods to any specific site investigation to gain an
understanding of the probable contributors to the faecal loading. Quantitative
apportionment of faecal indicators measured in a recreational water to individual
contributing species (e.g. human and ruminant) is, at this time, not provided by the
suite of MST techniques available.
Page 82, last sentence
Change the text that begins with the sentence “For example, it is not acceptable”
to: The sampling programme should be representative of the range of conditions (dry and
wet weather, etc) in the recreational water environment where it is being used. When
determining recreational water classification, all routinely collected samples on days
when the recreational water area was open to the public should be used. For example,
it is not appropriate to resample the bathing water following a high count measured
when the beach was open and no ‘advisory’ notice had been posted and then to use
the re-sample result but not the original result (this is not the case where an advisory
notice has been posted in which case the sample taken during the period of the posted
advisory would be omitted (e.g. discounted) from percentile calculations). On the
other hand, reactive samples may be taken following an adverse event or high result
from a routine sample. The additional samples may be used to investigate the full
impact of the event on the bathing water or to further characterise the area and the
impacts of adverse events.
24
Page 86, BOX 4.6 CASE STUDY, continued Top of page, part (e), Replace “Very high” with “Very high susceptibility to faecal
influence”
Part 3 Combined Sanitary and Microbial Water Quality Assessment and Overall
Classification
Move: This beach is rated as “poor”, to bottom
Change: Sanitary Inspection Category-“Very low”, should read “Very high
susceptibility to faecal influence”
In table add “95th
tile” before (intestinal enterococci/100 mL)
25
Page 93, 4.7.1 Public health advisories and warnings
Insert new box, 4.9, INFORMING THE BATHER WITH IMPROVED ASSESSMENTS OF
WATER QUALITY
Predictive models can be used at bathing water areas to derive microbial water quality
forecasts (e.g. daily) which can then be made available to the public by beach signage
and other methods of disseminating information. These provide bathers and beach
users with near-real-time information on likely water quality conditions that are more
up to date than the historical results provided by traditional analytical methods. They
allow water users to make informed choices on whether or not it is advisable to
undertake bathing activities using the predict and protect (precautionary) principle.
These predictive water quality models are usually site specific but can sometimes be
developed for adjacent bathing waters if they are affected by common pollution inputs
and are predictable by the same environmental factors, which drive water quality.
Commonly they work by using input data from the local factors which correlate
strongest with factors which cause or affect water quality such as the levels of
preceding rainfall (e.g. over previous 12, 24 or 48 hr) from drainage catchments, river
or storm water flows, wind direction, turbidity, UV and tidal state.
Working predictive water quality models have been developed and used in a number
of countries such in the U.S. for freshwater bathing waters on the Great Lakes (Never
& Whitman, 2005; Boehm et al., 2007) and in Scotland for coastal bathing waters
(McPhail & Stidson, 2004; 2009). Information of model outputs and water quality
predictions are usually posted on the Internet (see References for websites) or by
beach advisory notices.
In Scotland, the Scottish Environment Protection Agency (SEPA) issues daily water
quality forecasts to the public during the bathing season by a network of electronic
variable message signs located at a number of bathing beaches affected by rain events.
The predicted water quality conditions are also posted simultaneously on a website
and through a telephone text message service.
Electronic messages are switched on through a central national control as to either:
“Good Water Quality is Predicted Today”, or
“Bathing Not Advised Today – Risk of Poor Water Quality”.
Additional public messages can be provided by alternating text pages.
It is important that the predictive models are validated and checked against real
conditions, but once developed they have been shown to be good (correct or
precautionary) at predicting water quality. They work particularly well at waters that
may be subject to weather-related or other environmental factors that correlate with
causing short-term pollution or elevated microbiological events. As further
developments are made in information technologies there will be opportunities to
extend the methods of disseminating water quality predictions and information to the
public by methods that they find useful.
26
Page 96, Add following new section, after 4.7.1 (and renumber following sections
to 4.7.3 and 4.7.4):
4.7.2 ASSESSING AND ACTING ON SINGLE AND/OR HIGH ANALYTICAL RESULTS Those with responsibility in this area should ensure they are fully appraised of any
sanitary survey information for the particular site, any past records of water quality
and they have undertaken a recent visual site inspection. There are three principal
conditions that might lead beach management agencies to consider posting an
advisory notice of likely adverse water quality.
i. Where climatic conditions, such as high rainfall, produces elevation of faecal
indicator bacteria in the recreational waters (Marsalek & Rochfort, 2004).
The microbial source may be agricultural runoff and/or urban surface water.
Here, the appropriate management action is to give the public information
through signage, ideally, provided through real-time prediction of bathing
water quality communicated via electronic means to key communication
facilities such as signs at bathing water sites and/or via the internet to tourist
information centres and the news media. The water quality levels at which
such an advisory might be prudent should be decided in light of local
conditions. Examples of predicted faecal indicator bacterial concentrations
used to inform decisions on when to deploy advisory signs are presented for
Scotland in Box 4.9. In Scotland, limit values from current water quality
standards (e.g. 2000 E. coli/100mL and or 200 intestinal enterococci/100mL)
are used. These limit values might also be appropriate for locations with no
regulator compliance history or data describing water quality.
ii. Where some rare and/or extreme event causes gross pollution of the bathing
water. Often, the first evidence of such a condition are visual reports of gross
pollution indicated by high turbidity and associated sanitary wastes from
sewer overflows and/or overflow debris from rivers and drains discharging to
the bathing water. Action to protect the public is prudent on observing such
conditions, particularly where the visual evidence suggests discharges from
the sewerage system or there is telemetric evidence of sewer flooding.
Microbiological testing, to confirm such adverse water quality, could provide
both confirmation of the high microbial concentrations and a yardstick to
ensure a return to more ‘normal’ water quality for the site affected by the
extreme event. However, the protective advisory notice, informing the public
of potentially adverse water quality, should be posted on first observation of
the extreme event evidence.
iii. Where weather events do not present a feasible explanation for observed
sewer debris at the bathing water but such observations are reported. This
may indicate a gross malfunction or leakage of the sewerage system. Here, an
advisory notice to inform the public of the new risk should be posted and only
removed when the new source of gross pollution has been rectified.

27
Page 96, 4.8 References
Insert the additional references listed below:
Ahmed W, Stewart J, Gardner T, Powell D (2008a) A real-time polymerase chain
reaction assay for quantitative detection of the human-specific enterococci surface
protein marker in sewage and environmental waters. Environmental Microbiology,
10: 3255-3264.
Ahmed W, Hargreaves M, Goonetilleke A, Katouli M (2008b) Population similarity
analysis of indicator bacteria for source prediction of faecal pollution in coastal lake.
Marine Pollution Bulletin, 56: 1469-1475.
Bartram J, Corrales L, Davison A, Deere D, Drudy D, Gordon B, Howard G,
Rinehold A, Stevens M (2009) Water safety plan manual: step-by-step risk
management for drinking-water suppliers. Geneva, World Health Organization.
Boehm AB, Whitman RL, Nevers MB, Hou D, Weisberg SB (2007) Nowcasting
recreational water quality. In: Wymer, L.J. (Ed.), Statistical Framework for
Recreational Water Quality Criteria and Monitoring.
Boehm A, Nicolas JA, Colford JM, Dunbar LE, Fleming LE, Gold MA, Hansel JA,
Hunter PR, Ichida AM, McGee CH.D, Soller JA, Weisberg SB (2009) A sea change
ahead for recreational water quality criteria. Journal of Water and Health, Doi:
10.2166/wh.2009.122.
Bofill-Mas S, Albiñana-Gimenez N, Clemente-Casares P, Hundesa A, Rodriguez-
Manzano J, Allard A, Calvo M, Girones R (2006) Quantification and stability of
human adenoviruses and polyomavirus JCPyV in wastewater matrices. Applied and
Environmental Microbiology,72:7894-6.
Buckalew DW, Hartman LJ, Grimsley GA, Martin AE, Register KM (2006) A long-
term study comparing membrane filtration with Colilert® defined substrates in
detecting faecal coliforms and Escherichia coli in natural waters. Journal of
Environmental Management, 80:191-197.
Calgua B, Mengewein A, Grunert A, Bofill-Mas S, Clemente-Casares P, Hundesa A,
Wyn-Jones AP, Lopez-Pila JM, Girones R (2008) Development and application of a
one-step low cost procedure to concentrate viruses from seawater samples. Journal of
Virological Methods, 153: 79-83.
Chawla R, Hunter PR (2005) Classification of Bathing Water Quality based on the
Parametric Calculation of Percentiles is unsound. Water Research, 39: 4552-4558.
Costán-Longares A, Mocé-Llivina L, Avellón A, Jofre L, Lucena F (2008)
Occurrence and distribution of culturable enteroviruses in wastewater and surface
waters on north-eastern Spain. Journal of Applied Microbiology, 105:1945-1955.
Davies CM, Apte SC, Peterson SM, Stauber JL (1994) Plant and algal interference in
bacterial beta-D-galactosidase and beta-D-glucuronidase assays. Applied
Environmental Microbiology, 60:3959-3964.

28
Davies-Colley RJ, Craggs RJ, Park J, Sukias JP, Nagels JW, Stott R (2005) Virus
removal in a pilot-scale 'advanced' pond system as indicated by somatic and F-RNA
bacteriophages. Water Science and Technology, 51:107-110.
Davison A, Deere D, Stevens M, Howard G, Bartram J (2006) Water Safety Plan
Manual. Geneva, World Health Organization.
Dizer H, Wolf S, Fischer M, López-Pila JM, Röske I, Schmidt R, Szewzyk R,
Wiedenmann A (2005) The EU Bathing Water Directive. Risk assessment and
standards. Bundesgesundheitsblatt Gesundheitsforschung Gesundheitsschutz.
48(5): 607-14. German, English abstract.
Dufour A, Schaub S (2007) The evolution of water quality criteria in the United
States, 1922-2003. In Wymer LJ (ed.): Statistical Framework for Recreational Water
Quality Criteria and Monitoring. Statistics in Practice. John Wiley & Sons Ltd.,
Chichester, England: 1-12.
Dufour AP, Evans O, Behymer TD, Cantú R. (2006) Water ingestion during
swimming activities in a pool: a pilot study. Journal of Water Health, 4: 425-430.
Edge TA, Schaefer KA, ed. (2006) Microbial Source Tracking in Aquatic
Ecosystems: The State of the Science and an Assessment of Needs. National Water
Research Institute, Burlington, Ontario. NWRI Scientific Assessment Report Series
No. 7 and Linking Water Science to Policy Workshop Series. 23p.
El-Shaarawi, AH, Esterby SR (1992) Replacement of censored observations by a
constant: an evaluation. Water Res. 26 (6): 835–844.
Enriquez CE, Hurst CJ, Gerba CP (1995) Survival of the enteric adenoviruses 40 and
41 in tap, sea and wastewater. Water Research, 29: 2548–2553.
Field, KG, Chern EC, Dick LK, Fuhrman J, Griffith J, Holden PA, La Montagne
MG, Le J, Olson B, Simonich MT (2003) A comparative study of culture
independent, library-independent genotypic methods of fecal source tracking. Journal
of Water and Health, 1: 181-194.
Field, KG and Samadpour M (2007) Fecal source tracking, the indicator paradigm,
and managing water quality. Water Research, 41: 3517 – 3538.
Figueras MJ, Inza I, Polo FL, Feliu MT, Guarro J (1996) A fast method for the
confirmation of fecal streptococci from M-enterococcus medium. Applied
Environmental Microbiology, 62:2177-2178.
Figueras MJ, Inza I, Polo F, Guarro J (1998) Evaluation of the oxolinic acid--esculin--
azide medium for the isolation and enumeration of faecal streptococci in a routine
monitoring programme for bathing waters. Canadian Journal of Microbiology,
44:998-1002.
Fiksdal L, Tryland I (2008) Application of rapid enzyme assay techniques for
monitoring of microbial water quality. Current opinion in Biotechnology, 19: 289-
294.

29
Fricker CR, DeSarno M, Warden PS, Eldred BJ (2008) False –negative β-D-
glucuronidase reactions in membrane lactose glucuronide agar medium used for the
simultaneous detection of coliforms and Escherichia coli from water. Letters in
Applied Microbiology, 47: 539-42.
Gourmelon M, Caprais MP, Segura R, Le Mennec C, Lozach S, Piriou JY, Rince A
(2007) Evaluation of two library-independent microbial source tracking methods to
identify sources of fecal contamination in French estuaries. Applied Environmental
Microbiology, 73: 4857-4866.
Haugland RA, Siefring SC, Wymer LJ, Brenner KP, Dufour AP (2005) Comparison
of Enterococcus measurements in freshwater at two recreational beaches by
quantitative polymerase chain reaction and membrane filter culture analysis. Water
Research, 39(4): 559-568.
Hewett P, Ganser GH (2007) A Comparison of Several Methods for Analyzing
Censored Data. Annals Occupational Hygiene, 51 (7): 611–632.
Hunter PR (2002) Appropriate calculation of the 95th percentile of microbiological
results in determining compliance with bathing water quality standards. Letters in
Applied Microbiology, 34: 283-286.
Ishii S, Hansen DL, Hicks RE, Sadowsky MJ (2007) Beach sand sediments are
temporal sinks and sources of Escherichia coli in Lake Superior. Environmental
Science and Technology, 41: 2203-2209.
Ishii S, Sadowsky MJ (2008) Escherichia coli in the environment: implications for
water quality and human health. Microbes and Environment, 23: 101-108.
Isobe KO, Tarao M, Chiem NH, Mihn LY, Takada H (2004) Effect of environmental
factors on the relationship between concentrations of coprostanol and fecal indicator
bacteria in tropical (Mekong Delta) and temperate (Tokyo) freshwaters. Applied and
Environmental Microbiology, 70: 814-821.
Iwai M, Hasegawa S, Obara M, Nakamura K, Horimoto E, Takizawa T, Kurata T,
Sogen S, Shiraki K (2009) Continuous existence of nororviruses and sapoviruses in
raw sewage reveals infection among inhabitants in Toyama, Japan (2006-2008).
Applied Environmental Microbiology, Doi:10.1128/AEM.01166-08.
Loisy F, Atmar RL, Cohen J, Bosch A, Le Guyader FS (2004) Rotavirus VLP2/6: a
new tool for tracking rotavirus in the marine environment. Research in Microbiology,
155: 575–578. Marsalek J, Rochfort Q (2004) Urban wet-weather flows: sources of fecal
contamination impacting on recreational waters and threatening drinking-water
sources. Journal of Toxicology and Environmental Health, Part A, 67: 1765-1777.
Maheux AF, Huppé V, Boissinot M, Picard FJ, Bissonnette L, Bernier JT, Bergeron
MG (2008) Analytical limits of four β-glucuronidase and β-galactosidase-based
commercial culture methods used to detect Escherichia coli and total coliforms.
Journal of Microbiological Methods, 75: 506-514.

30
McLaughlin K, Ho Ahn J, Litton RM, Grant SB (2007) Use of salinity mixing models
to estimate the contribution of creek water fecal indicator bacteria on an estuarine
environment: Newport Bay, California. Water Research, 41: 3595-3604. McPhail CD, Stidson, R (2004) The Scottish Signage Project. Water and Environment
Magazine, 9(4): 18-19.
McPhail CD, Stidson R (2009) Bathing Water Signage and Predictive Water Quality
Models in Scotland. Aquatic Ecosystem Health and Management Journal, in press.
Nevers MB, RL Whitman. (2005) Nowcast modeling of Escherichia coli
concentrations at multiple urban beaches of southern Lake Michigan. Water Research,
39:5250-5260.
O’Brien RT and Newman, JS (1977) Inactivation of polioviruses and Coxsackie
viruses in surface water. Applied Environmental Microbiology, 33: 334-340.
Reischer GH, Haider JM, Sommer R, Stadler H, Keiblinger KM, Hornek R, Zerobin
W, Mach RL, Farnleitner AH (2008) Quantitative microbial faecal source tracking
with sampling guided by hydrological catchment dynamics. Environmental
Microbiology, 10: 2598-2608.
Roser DJ, Davies CM, Ashbolt NJ, Morison P (2006) Microbial exposure assessment
of an urban recreational lake: a case study of the application of new risk-based
guidelines. Water Science and Technology, 54: 245-252.
Roser DJ, Ashbolt NJ, Davies CM, Glamore WC, Hawker KM, Miller BM (2007)
Application of TMDL and risk assessment principles for pathogen management at an
urban recreational lake. In Watershed Management to Meet Water Quality Standards
and TMDLS, 4th Conference Proceedings, March 10-14, 2007 San Antonio, Texas.
Stephenville, Texas: The American Society of Agricultural and Biological Engineers
(ASABE), 420-426.
Santo Domingo JW, Bambic DG, Edge TA, Wuertz S (2007) Quo vadis source
tracking? Towards a strategic framework for environmental monitoring of fecal
pollution. Water Research, 41: 3539-3552.
Schmoyer RL, Beauchamp JJ, Brandt CC, Hoffman JR (1996) Difficulties with the
Iognormal model in mean estimation and testing. Environmental and Ecological
Statistics 3: 81-97.
Sobsey MD, Shields PA, Hauchman FS, Davis AL, Rullman VА, Bosch A (1988)
Survival and persistence of hepatitis A virus in environmental samples. In: Alan R
Liss (Ed.), Viral Hepatitis and Liver Disease, New York: 121–124.
Soller JA, and Eisenberg JNS (2008) An evaluation of parsimony for microbial risk
assessment models. Environmetics, 19: 61–78.
Stoeckel DM, Harwood V (2007) Performance, design, and analysis in microbial
source tracking studies. Applied and Environmental Microbiology, 73(8): 2405–2415.

31
Terrett LA, Sail LJ, Theil KW, Kohler EM (1987) Physicochemical characterisation
of porcine pararotavirus and detection of virus and viral antibodies using cell culture
immunofluorescence. Journal of Clinical Microbiology, 25: 268–272.
Teunis PF, Moe CL, Liu PE, Miller S, Lindesmith L, Baric RS, Le Pendu J, Calderon
RL (2008) Norwalk virus: How infectious is it? Journal of Medical Virology, 80:
1468-1476.
US EPA (2007) Report of the experts scientific workshop on critical research needs
for the development of new or revised recreational water quality criteria. June 2007.
Warrenton, Virginia. U.S. Environmental Protection Agency, Office of Water (EPA
823-R-07-006).
US EPA (2005) Economic Analysis for the Final Long Term 2 Enhanced Surface
Water Treatment Rule. Washington D.C.: U.S. Environmental Protection Agency,
(EPA 815-R-06-001).
Vogel JR, Stoeckel DM, Lamendella R, Zelt RB, Santo Domingo JW, Walker SR,
Oerther DB. (2007) Identifying fecal sources in a selected catchment reach using
multiple source-tracking tools. Journal of Environmental Quality, 36: 718-729.
Vondefecht SL, Huber AC, Eiden J, Mader LC, Yolken RH (1986) Infectious
diarrhoea of infant rats produced by a rotavirus-like agent. Journal of Medical
Virology, 19: 167–173.
Wade TJ, Calderon RL, Sams E, Beach M, Brenner KP, Williams AH, Dufour AP
(2006) Rapidly measured indicators of recreational water quality are predictive of
swimming-associated gastrointestional illness. Environmental Health Perspectives,
114(1): 24-28.
Wade T, Calderon RL, Brenner KP; Sams E, Beach M, Haugland R, Wymer L,
Dufour AP (2008) High sensitivity of children to swimming associated
gastrointestinal illness. Epidemiology; 19(3): 375-383.
WHO (2004) Guidelines for Drinking Water Quality, Third Edition, Vol 1. Geneva,
World Health Organization.
Wiedenmann A (2007a) A plausible model to explain concentration-response
relationships in randomized controlled trials assessing infectious disease risks from
exposure to recreational waters. In Wymer LJ (ed.): Statistical Framework for
Recreational Water Quality Criteria and Monitoring. Statistics in Practice.
Chichester, England: John Wiley & Sons Ltd., 153-177.
Wiedenmann A (2007b) Health-related interpretation of individual microbiological
sample results from monitoring programs of recreational waters based on recent
epidemiological findings. (German; Engl. abstract), Umweltmedizin in Forschung und
Praxis. UFP (6) 351-365.
Wiedenmann A, Krüger P, Dietz K, López-Pila JM, Szewzyk R, Botzenhart K (2006)
A randomized controlled trial assessing infectious disease risks from bathing in fresh
recreational waters in relation to the concentration of Escherichia coli, intestinal
enterococci, Clostridium perfringens, and somatic coliphages. Environmental Health

32
Perspectives, 114:228-236.
Wiedenmann A, Krüger P, Gommel S, Eissler A, Hirlinger M, Paul A, Jüngst K,
Sieben E, Dietz K (2004) Epidemiological Determination of Disease Risks from
Bathing. Final Report. UFOPLAN 298 61 503. Umweltbundesamt.
Yoder JS, Blackburn BG, Craun GF, Hill V, Levy DA, Chen N, Lee SH, Calderon
RL, Beach MJ (2004) Surveillance for Waterborne Disease Outbreaks Associated
with Recreational Water – United States, 2001 – 2002, MMWR, Surveillance
Summaries, Vol. 53, No. SS-8.
Yoder JS, Hlavsa MC, Craun GF, Hill V, Roberts V, Yu PA, Hicks LA, Alexander
NT, Calderon RL, Roy SL, Beach MJ (2008) Surveillance for Waterborne Disease
Outbreaks Associated with Recreational Use and other Aquatic Facility-associated
Health events – United States, 2005 – 2006, MMWR, Surveillance Summaries, Vol.
57, No. SS-9.
Internet resources for Box 4.9 1:http://www.glsc.usgs.gov/main.php?content=research_initiatives_beachhealth&title
=Project%20S.A.F.E.0&menu=research_initiatives_projectSAFE
2. http://www.ohionowcast.info/index.asp
3. http://www.sepa.org.uk/water/bathing_waters/bathing_signs.aspx

33
CHAPTER 10. FAECAL POLLUTION AND WATER QUALITY
Page 195
Change Item 15, Delete “prior” in “The influence of specific events such as rain on
the recreational water use areas, especially in relation to the duration of the peak
contamination period, should be established and prior agreed procedures
implemented.”