Embed Size (px)
Citation preview
HCP Adding New Telemetry Data Source 1
Adding a New Telemetry SourceDate of Publish: 2018-10-15
http://docs.hortonworks.com

Contents
Adding a New Telemetry Data Source...................................................................3Telemetry Data Source Parsers Bundled with HCP............................................................................................ 3
Snort.......................................................................................................................................................... 3Bro.............................................................................................................................................................3YAF (NetFlow).........................................................................................................................................3Indexing.....................................................................................................................................................4pcap........................................................................................................................................................... 4
Prerequisites to Adding a New Telemetry Data Source......................................................................................4Streaming Data into HCP Overview....................................................................................................................5Stream Data Using NiFi.......................................................................................................................................6Creating Parsers.................................................................................................................................................. 11
Create a Parser for Your New Data Source by Using the Management UI...........................................11Create a Parser for Your New Data Source by Using the CLI..............................................................14Create Multiple Parsers on One Topology............................................................................................ 19Chain Parsers.......................................................................................................................................... 20Transform Your New Data Source Parser Information by Using the Management UI......................... 25Tune Parser Storm Parameters by Using the Management UI.............................................................. 28
Configuring Indexing..........................................................................................................................................29Understanding Indexing..........................................................................................................................29Default Configuration............................................................................................................................. 30Creating a New Index Template or Schema..........................................................................................30Index HDFS Tuning............................................................................................................................... 30Turn Off HDFS Writer...........................................................................................................................31Upgrading to Elasticsearch 5.6.2............................................................................................................31Add X-Pack Extension to Elasticsearch.................................................................................................34Troubleshooting Indexing.......................................................................................................................38Understanding Global Configuration..................................................................................................... 38Create Global Configurations.................................................................................................................39Verify That Events Are Indexed............................................................................................................ 42

HCP Adding New Telemetry Data Source Adding a New Telemetry Data Source
Adding a New Telemetry Data Source
Part of customizing your Hortonworks Cybersecurity Platform (HCP) configuration is adding a new telemetry datasource. Before HCP can process the information from your new telemetry data source, you must use one of thetelemetry data collectors to ingest the information into the telemetry ingest buffer. Information moves from the dataingest buffer into the Apache Metron real-time processing security engine, where it is parsed, enriched, triaged, andindexed. Finally, certain telemetry events can initiate alerts that can be assessed in the Metron dashboard.
To add a new telemetry data source, you must first meet certain prerequisites, and then perform the following tasks:
1. Stream data into HCP2. Create a parser for your new data source3. Verify that events are indexed
Telemetry Data Source Parsers Bundled with HCPTelemetry data sources are sensors that provide raw events that are captured and pushed into Apache Kafka topics tobe ingested in Hortonworks Cybersecurity Platform (HCP) powered by Metron.
SnortSnort is one of the telemetry data source parsers that are bundled in Hortonworks Cybersecurity Platform (HCP).
Snort is a network intrusion prevention systems (NIPS). Snort monitors network traffic and generates alerts based onsignatures from community rules. Hortonworks Cybersecurity Platform (HCP) sends the output of the packet captureprobe to Snort. HCP uses the kafka-console-producer to send these alerts to a Kafka topic. After the Kafka topicreceives Snort alerts, they are retrieved by the parsing topology in Storm.
By default, the Snort parser uses ZoneId.systemDefault() as the source time zone for the incoming data and MM/dd/yy-HH:mm:ss.SSSSSS as the default date format. Valid time zones are determined according to the JavaZoneId.getAvailableZoneIds() values. DateFormats should match options at https://docs.oracle.com/javase/8/docs/api/java/time/format/DateTimeFormatter.html.
Following is a sample configuration with dateFormat and timeZone explicitly set in the parser configuration file:
"parserConfig": {"dateFormat" : "MM/dd/yy-HH:mm:ss.SSSSSS","timeZone" : "America/New_York"}
BroThe Bro ingest data source is a custom Bro plug-in that pushes DPI (deep packet inspection) metadata intoHortonworks Cybersecurity Platform (HCP).
Bro is primarily used as a DPI metadata generator. HCP does not currently use the IDS alert features of Bro. HCPintegrates with Bro by way of a Bro plug-in, and does not require recompiling of Bro code.
The Bro plug-in formats Bro output messages into JSON and puts them into a Kafka topic. The JSON message outputby the Bro plug-in is parsed by the HCP Bro parsing topology.
DPI metadata is not a replacement for packet capture (pcap), but rather a complement. Extracting DPI metadata (APILayer 7 visibility) is expensive, and therefore is performed on only selected protocols. You should enable DPI forHTTP and DNS protocols so that, while the pcap probe records every single packets it sees on the wire, the DPImetadata is extracted only for a subset of these packets.
YAF (NetFlow)The YAF (yet another flowmeter) data source ingests NetFlow data into HCP.
3

HCP Adding New Telemetry Data Source Adding a New Telemetry Data Source
Not everyone wants to ingest pcap data due to space constraints and the load exerted on all infrastructure components.NetFlow, while not a substitute for pcap, is a high-level summary of network flows that are contained in the pcapfiles. If you do not want to ingest pcap, then you should at least enable NetFlow. HCP uses YAF to generate IPFIX(NetFlow) data from the HCP pcap probe, so the output of the probe is IPFIX instead of raw packets. If NetFlow isgenerated instead of pcap, then the NetFlow data goes to the generic parsing topology instead of the pcap topology.
IndexingThe Indexing topology takes data ingested into Kafka from enriched topologies and sends the data to an indexing boltconfigured to write to HDFS and either Elasticsearch or Solr.
Indices are written in batch and the batch size is specified in the enrichment configuration file by the batchSizeparameter. This configuration is variable by sensor type.
Errors during indexing are sent to a Kafka topic named indexing_error.
The following figure illustrates the data flow between Kafka, the Indexing topology, and HDFS:
pcapPacket capture (pcap) is a performant C++ probe that captures network packets and streams them into Kafka. Apcap Storm topology then streams them into HCP. The purpose of including pcap source with HCP is to provide amiddle tier in which to negotiate retrieving packet capture data that flows into HCP. This packet data is of a form thatlibpcap-based tools can read.
The network packet capture probe is designed to capture raw network packets and bulk-load them into Kafka. Kafkafiles are then retrieved by the pcap Storm topology and bulk-loaded into Hadoop Distributed File System (HDFS).Each file is stored in HDFS as a sequence file.
HCP provides three methods to access the pcap data:
• Rest API• pycapa• DPDK
There can be multiple probes into the same Kafka topic. The recommended hardware for the probe is an Intel familyof network adapters that are supportable by Data Plane Development Kit (DPDK).
Prerequisites to Adding a New Telemetry Data SourceBefore you add a new telemetry data source, you must ensure that your system set up meets the HortonworksCybersecurity Platform (HCP) requirements.
4
HCP Adding New Telemetry Data Source Adding a New Telemetry Data Source
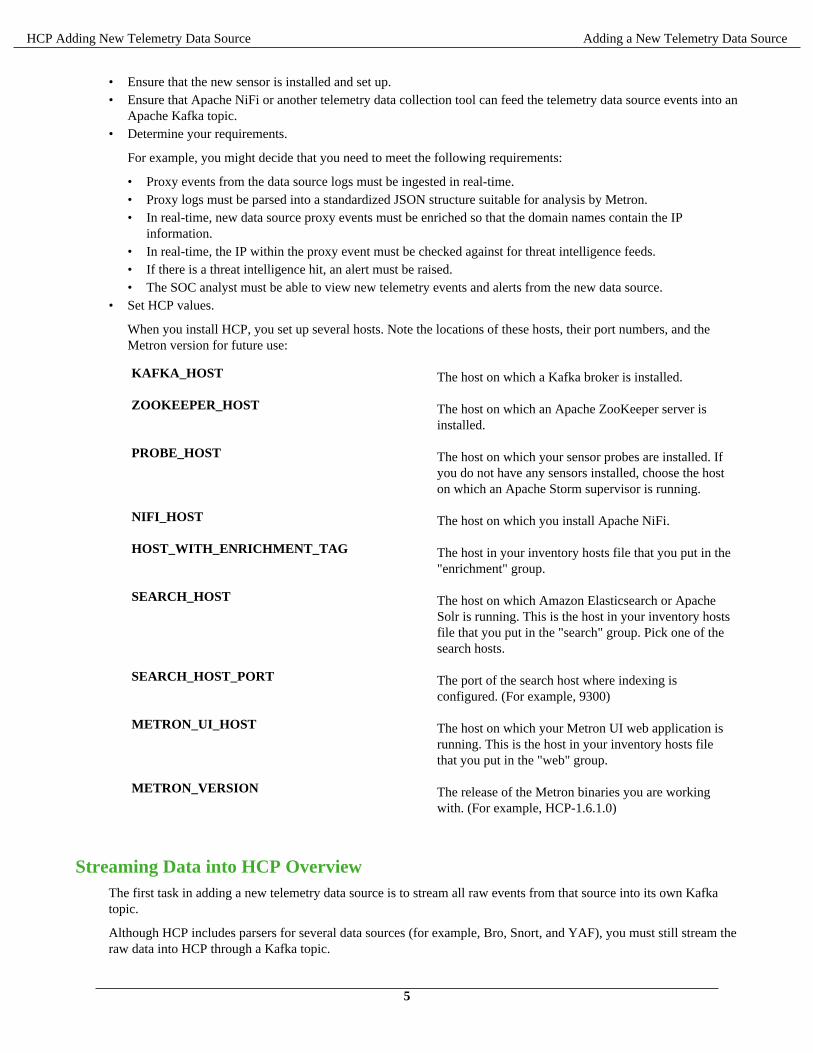
• Ensure that the new sensor is installed and set up.• Ensure that Apache NiFi or another telemetry data collection tool can feed the telemetry data source events into an
Apache Kafka topic.• Determine your requirements.
For example, you might decide that you need to meet the following requirements:
• Proxy events from the data source logs must be ingested in real-time.• Proxy logs must be parsed into a standardized JSON structure suitable for analysis by Metron.• In real-time, new data source proxy events must be enriched so that the domain names contain the IP
information.• In real-time, the IP within the proxy event must be checked against for threat intelligence feeds.• If there is a threat intelligence hit, an alert must be raised.• The SOC analyst must be able to view new telemetry events and alerts from the new data source.
• Set HCP values.
When you install HCP, you set up several hosts. Note the locations of these hosts, their port numbers, and theMetron version for future use:
KAFKA_HOST The host on which a Kafka broker is installed.
ZOOKEEPER_HOST The host on which an Apache ZooKeeper server isinstalled.
PROBE_HOST The host on which your sensor probes are installed. Ifyou do not have any sensors installed, choose the hoston which an Apache Storm supervisor is running.
NIFI_HOST The host on which you install Apache NiFi.
HOST_WITH_ENRICHMENT_TAG The host in your inventory hosts file that you put in the"enrichment" group.
SEARCH_HOST The host on which Amazon Elasticsearch or ApacheSolr is running. This is the host in your inventory hostsfile that you put in the "search" group. Pick one of thesearch hosts.
SEARCH_HOST_PORT The port of the search host where indexing isconfigured. (For example, 9300)
METRON_UI_HOST The host on which your Metron UI web application isrunning. This is the host in your inventory hosts filethat you put in the "web" group.
METRON_VERSION The release of the Metron binaries you are workingwith. (For example, HCP-1.6.1.0)
Streaming Data into HCP OverviewThe first task in adding a new telemetry data source is to stream all raw events from that source into its own Kafkatopic.
Although HCP includes parsers for several data sources (for example, Bro, Snort, and YAF), you must still stream theraw data into HCP through a Kafka topic.
5

HCP Adding New Telemetry Data Source Adding a New Telemetry Data Source
If you choose to use the Snort telemetry data source, you must meet the following configuration requirements:
• When you install and configure Snort, to ensure proper functioning of indexing and analytics, configure Snort toinclude the year in the timestamp by modifying thesnort.conf file as follows:
# Configure Snort to show year in timestampsconfig show_year
• By default, the Snort parser is configured to use ZoneId.systemDefault() for the source timeZone for the incomingdata and MM/dd/yy-HH:mm:ss.SSSSSS as the default dateFormat. Valid timezones are defined in Java'sZoneId.getAvailableZoneIds(). DateFormats should use the options defined in https://docs.oracle.com/javase/8/docs/api/java/time/format/DateTimeFormatter.html. The following sample configuration shows the dateFormatand timeZone values explicitly set in the parser configuration:
"parserConfig": {"dateFormat" : "MM/dd/yy-HH:mm:ss.SSSSSS", "timeZone" : "America/New_York"
Depending on the type of data you are streaming into HCP, you can use one of the following methods:
• NiFi
This streaming method works for most types of data sources. To use it with HCP, you must install it manually onport 8089. For information on installing NiFi, see the NiFi documentation.
Important:
NiFi cannot be installed on top of HDP, so you must install NiFi manually to use it with HCP.• Performant network ingestion probes
This streaming method is ideal for streaming high-volume packet data.• Real-time and batch threat intelligence feed loaders
This streaming method works for intelligence feeds that you want to view in real-time or collect batches ofinformation to view or query at a later date.
Stream Data Using NiFiNiFi provides a highly intuitive streaming user interface that is compatible with most types of data sources.
Procedure
1. Open the NiFi user interface canvas.
2. Drag
(processor icon) to your workspace.
NiFi displays the Add Processor dialog box.
3. Select the TailFile type of processor and click ADD.
NiFi displays a new TailFile processor:
6

HCP Adding New Telemetry Data Source Adding a New Telemetry Data Source
4. Right-click the processor icon and select Configure to display the Configure Processor dialog box.
a) In the Settings tab, change the name to Ingest $DATASOURCE Events:
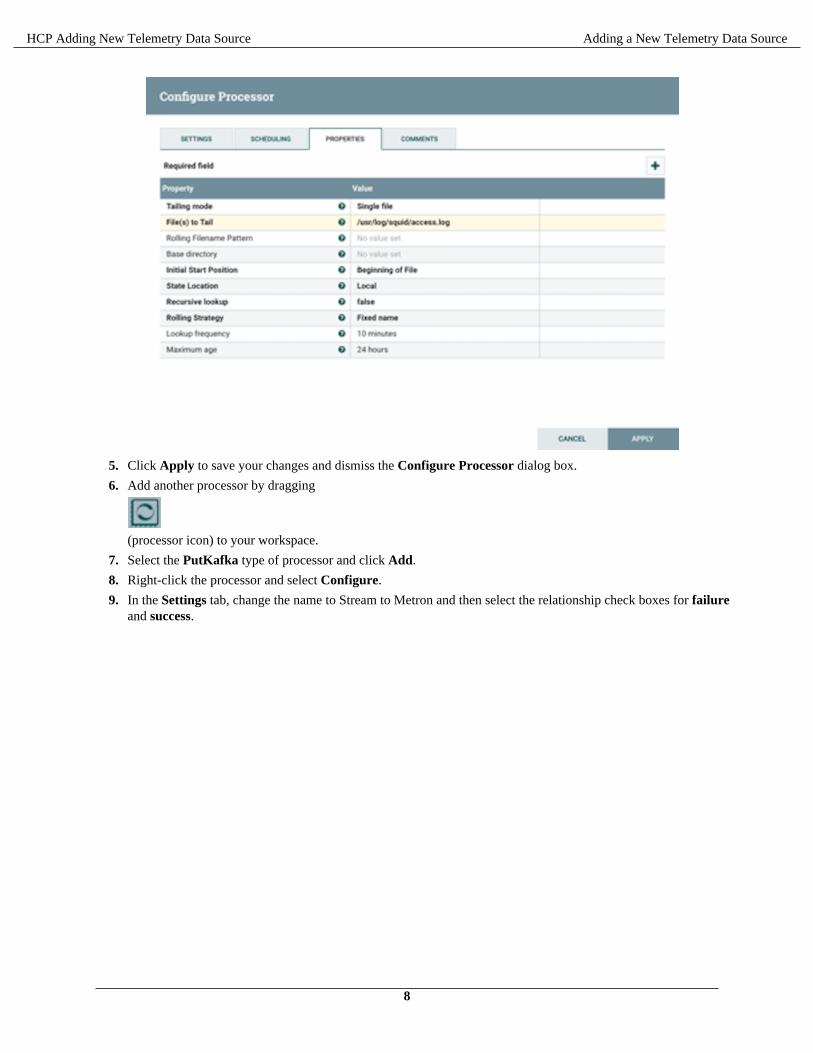
b) In the Properties tab, enter the path to the data source file in the Value column for the File(s) to Tailproperty:
7
HCP Adding New Telemetry Data Source Adding a New Telemetry Data Source
5. Click Apply to save your changes and dismiss the Configure Processor dialog box.
6. Add another processor by dragging
(processor icon) to your workspace.
7. Select the PutKafka type of processor and click Add.
8. Right-click the processor and select Configure.
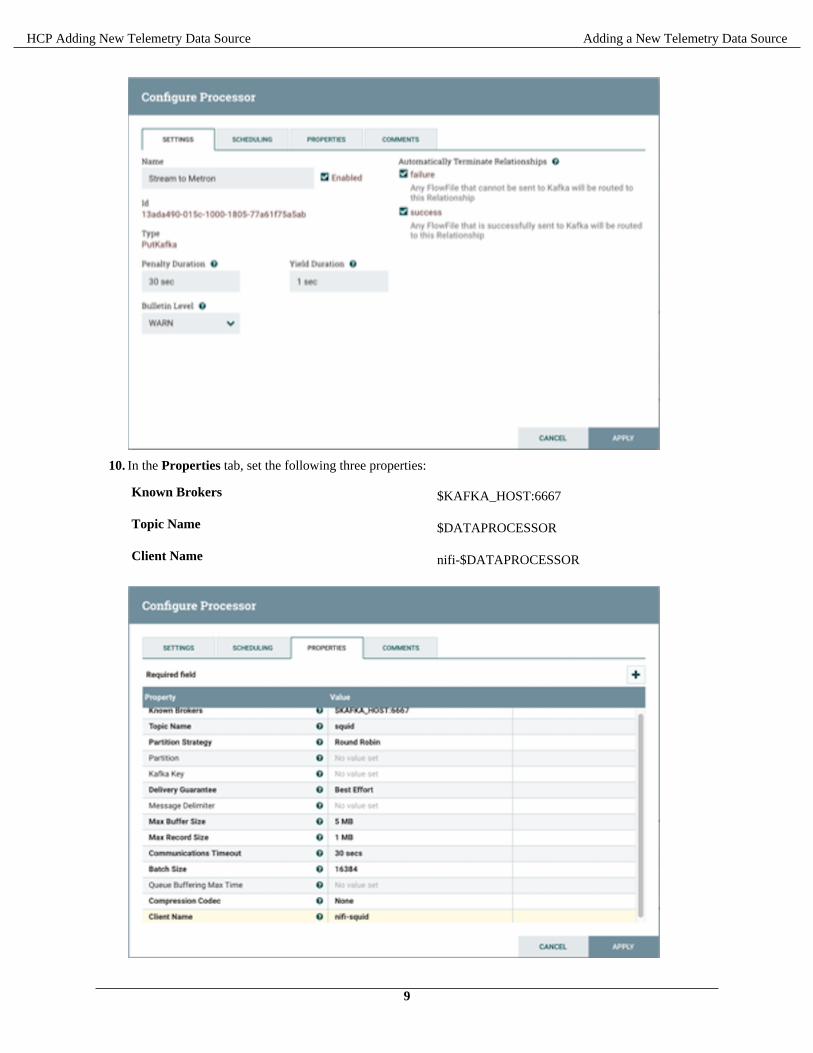
9. In the Settings tab, change the name to Stream to Metron and then select the relationship check boxes for failureand success.
8
HCP Adding New Telemetry Data Source Adding a New Telemetry Data Source
10. In the Properties tab, set the following three properties:
Known Brokers $KAFKA_HOST:6667
Topic Name $DATAPROCESSOR
Client Name nifi-$DATAPROCESSOR
9
HCP Adding New Telemetry Data Source Adding a New Telemetry Data Source
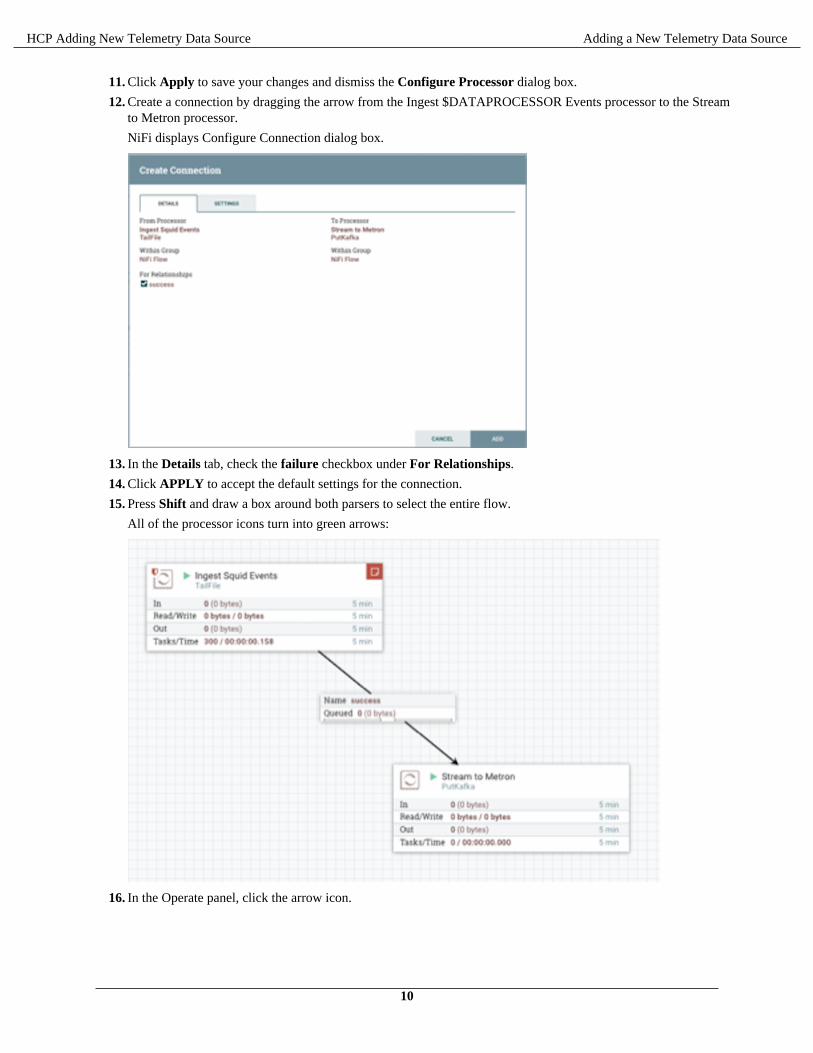
11. Click Apply to save your changes and dismiss the Configure Processor dialog box.
12. Create a connection by dragging the arrow from the Ingest $DATAPROCESSOR Events processor to the Streamto Metron processor.
NiFi displays Configure Connection dialog box.
13. In the Details tab, check the failure checkbox under For Relationships.
14. Click APPLY to accept the default settings for the connection.
15. Press Shift and draw a box around both parsers to select the entire flow.
All of the processor icons turn into green arrows:
16. In the Operate panel, click the arrow icon.
10

HCP Adding New Telemetry Data Source Adding a New Telemetry Data Source
17. Generate some data using the new data processor client.
18. Look at the Storm UI for the parser topology and confirm that tuples are coming in.
19. After about five minutes, you should see a new index called $DATAPROCESSOR_index* in either the SolrAdmin UI or the Elastic Admin UI.
Creating ParsersParsers transform raw data into JSON messages suitable for downstream enrichment and indexing by HCP. There isone parser for each data source and HCP pipes the information to the Enrichment/Threat Intelligence topology.
You can transform the field output in the JSON messages into information and formats that make the output moreuseful. For example, you can change the timestamp field output from GMT to your timezone.
You must make two decisions before you parse a new data source:
• Type of parser to use
HCP supports two types of parsers:
General Purpose HCP supports two general purpose parsers: Grok andCSV. These parsers are ideal for structured or semi-structured logs that are well understood and telemetrieswith lower volumes of traffic.
Java A Java parser is appropriate for a telemetry type that iscomplex to parse, with high volumes of traffic.
• How to parse
HCP enables you to parse a new data source and transform data fields using the HCP Management module or thecommand line interface
Create a Parser for Your New Data Source by Using the Management UITo add a new data source, you must create a parser that transforms the data source data into JSON messages suitablefor downstream enrichment and indexing by HCP. Although HCP supports both Java and general-purpose parsers,you can learn the general process of creating parsers by viewing an example using the general-purpose parser Grok.
Procedure
1. Determine the format of the new data source’s log entries, so you can parse them:
a) Use ssh to access the host for the new data source.
11
HCP Adding New Telemetry Data Source Adding a New Telemetry Data Source
b) View the different log files and determine which to parse:
sudo su - cd /var/log/$NEW_DATASOURCE ls
The file you want is typically the access.log, but your data source might use a different name.c) Generate entries for the log that needs to be parsed so that you can see the format of the entries:
timestamp | time elapsed | remotehost | code/status | bytes | method | URL rfc931 peerstatus/peerhost | type
2. Create a Grok statement file that defines the Grok expression for the log type you identified in Step 1.
Important: You must include timestamp in the Grok expression to ensure that the system uses the eventtime rather than the system time.
Refer to the Grok documentation for additional details.
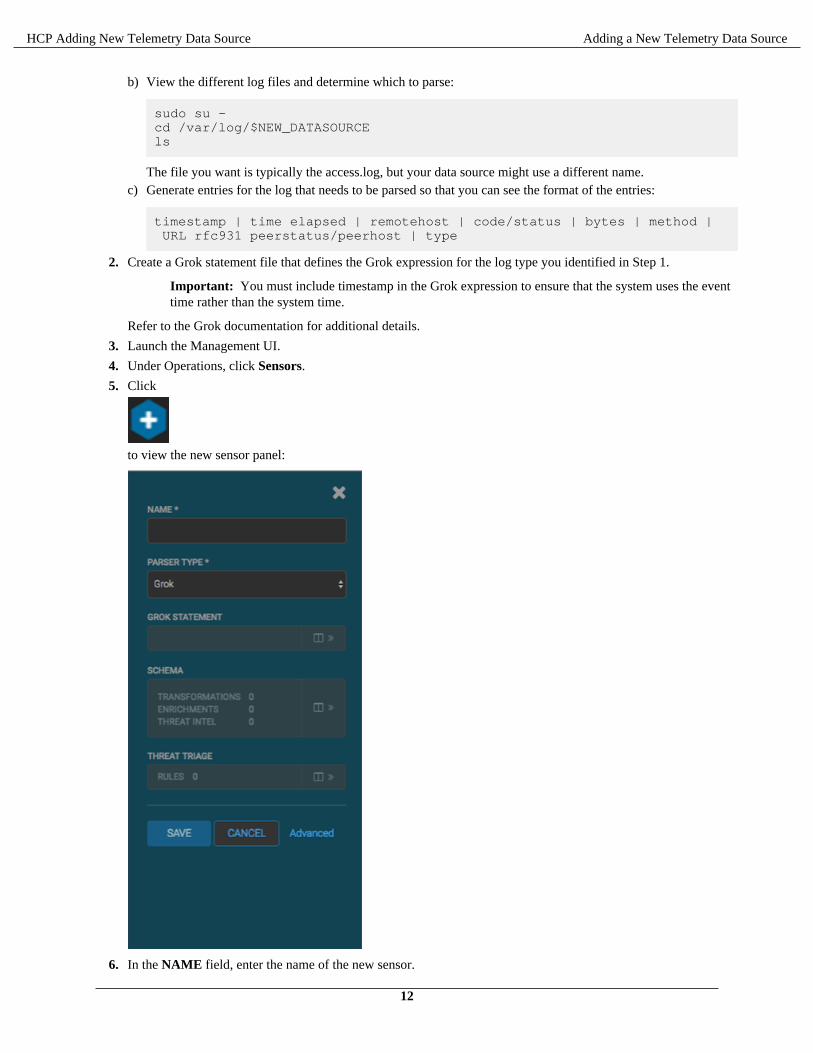
3. Launch the Management UI.
4. Under Operations, click Sensors.
5. Click
to view the new sensor panel:
6. In the NAME field, enter the name of the new sensor.
12

HCP Adding New Telemetry Data Source Adding a New Telemetry Data Source
7. In the Kafka Type field, enter the name of the new sensor.
8. In the Parser Type field, choose the type of parser for the new sensor (in this example task, Grok).
Don't worry if you see "No Matching Kafka Topic." The Kafka topic will be created automatically when you save.
9. Enter a Grok statement for the new parser:
a) In the Grok Statement box, click
(expand window) to display the Grok validator panel:
b) For SAMPLE, enter a sample log entry for the data source.c) For STATEMENT, enter the Grok statement you created for the data source.
The Management UI automatically completes partial words in your Grok statement as you enter them.
Note: You must include timestamp to ensure that the system uses the event time rather than thesystem time.
d) Click TEST.
If the validator finds an error, it displays the error information; otherwise, the valid mapping displays in thePREVIEW field.
Consider repeating substeps a through c to ensure that your Grok statement is valid for all sensor logs.e) Click SAVE to save the sensor information and add it to the list of sensors.
10. Click the pencil icon to edit the sensor you just added.
11. Scroll down to the Parser Config section.
12. In the first open field, indicated by enter field, enter timestampField.
13

HCP Adding New Telemetry Data Source Adding a New Telemetry Data Source
13. In next open field, enter timestamp.
14. Click Save.
15. Continue to build and test the Grok statement until you have entries for each element in the log entry.
ResultsThis new data source processor topology ingests from the $Kafka topic and then parses the event with the HCPGrok framework using the Grok pattern. The result is a standard JSON Metron structure that then is added to the"enrichment" Kafka topic for further processing.
Create a Parser for Your New Data Source by Using the CLIAs an alternative to using the HCP Management module to parse your new data source, you can use the CLI.
Procedure
1. Determine the format of the new data source’s log entries, so you can parse them:
a) Use ssh to access the host for the new data source.b) Look at the different log files and determine which to parse:
sudo su - cd /var/log/$NEW_DATASOURCE ls
The file you want is typically the access.log, but your data source might use a different name.
14

HCP Adding New Telemetry Data Source Adding a New Telemetry Data Source
c) Generate entries for the log that needs to be parsed so that you can see the format of the entries:
timestamp | time elapsed | remotehost | code/status | bytes | method | URL rfc931 peerstatus/peerhost | type
2. Create a Kafka topic for the new data source:
a) Log in to $KAFKA_HOST as root.b) Create a Kafka topic with the same name as the new data source:
/usr/hdp/current/kafka-broker/bin/kafka-topics.sh --zookeeper $ZOOKEEPER_HOST:2181 --create --topic $NEW_DATASOURCE --partitions 1 --replication-factor 1
c) Verify your new topic by listing the Kafka topics:
/usr/hdp/current/kafka-broker/bin/kafka-topics.sh --zookeeper $ZOOKEEPER_HOST:2181 --list
3. Create a Grok statement file that defines the Grok expression for the log type you identified in Step 1.
Note: You must include timestamp to ensure that the system uses the event time rather than the systemtime. For information about setting the grok parser to use the current year, see step 5c.
Refer to the Grok documentation for additional details.
4. Save the Grok pattern and load it into Hadoop Distributed File System (HDFS) in a named location:
a) Create a local file for the new data source:
touch /tmp/$DATASOURCE
b) Open $DATASOURCE and add the Grok pattern defined in Step 3:
vi /tmp/$DATASOURCE
c) Put the $DATASOURCE file into the HDFS directory where Metron stores its Grok parsers.
Existing Grok parsers that ship with HCP are staged under /apps/metron/patterns:
su - hdfs hadoop fs -rmr /apps/metron/patterns/$DATASOURCE hdfs dfs -put /tmp/$DATASOURCE /apps/metron/patterns/
5. Define a parser configuration for the Metron Parsing Topology.
a) As root, log into the host with HCP installed:
ssh $HCP_HOST
b) Create a $DATASOURCE parser configuration file at $METRON_HOME/config/zookeeper/parsers/$DATASOURCE.json:
{ "parserClassName": "org.apache.metron.parsers.GrokParser","filterClassName:": null,"sensorTopic": "$DATASOURCE","outputTopic": null,"errorTopic": null,"readMetadata" : true,"mergeMetadata" : true,"numWorkers": null,"numAckers": null,"spoutParallelism": 1,"spoutNumTasks": 1,"parserParallelism": 1,
15

HCP Adding New Telemetry Data Source Adding a New Telemetry Data Source
"parserNumTasks": 1,"errorWriterParallism": 1,"errorWriterNumTasks": 1,"spoutConfig:" :{},"securityProtocol:" null,"stormConfig": {},"parserConfig": { "grokPath": "/apps/metron/patterns/$DATASOURCE", "patternLabel": "$DATASOURCE_DELIMITED", "timestampField": "timestamp" }, "fieldTransformations" : [ { "transformation" : "STELLAR" ,"output" : [ "full_hostname", "domain_without_subdomains" ] ,"config" : { "full_hostname" : "URL_TO_HOST(url)" ,"domain_without_subdomains" : "DOMAIN_REMOVE_SUBDOMAINS(full_hostname)" } } ] }
parserClassName The name of the parser's class in the .jar file.
filterClassName The filter to use.
This can be the fully qualifiedname of a class that implements theorg.apache.metron.parsers.interfaces.MessageFilter<JSONObject>interface. Message filters enable you to ignorea set of messages by using custom logic. Theexisting implementation is STELLAR. The Stellarimplementation enables you to apply a Stellarstatement that returns a Boolean, which passes everymessage for which the statement returns true . Thestellar statement is specified by the filter.queryproperty in the parserConfig. For example, thefollowing Stellar filter includes messages that containa field1 field:
{ "filterClassName" : "STELLAR" ,"parserConfig" : { "filter.query" : "exists(field1)" } }
sensorTopic The Kafka topic on which the telemetry is beingstreamed. If the topic is prefixed and suffixed by/ then it is assumed to be a regex and will matchany topic matching the pattern (for example, /bro.*/matches bro_cust0, bro_cust1 and bro_cust2).
readMetadata A Boolean indicating whether to read metadata andmake it available to field transformations (false bydefault).
16
HCP Adding New Telemetry Data Source Adding a New Telemetry Data Source
There are two types of metadata supported in HCP:
• Environmental metadata about the whole system
For example, if you have multiple Kafka topicsbeing processed by one parser, you might want totag the messages with the Kafka topic.
• Custom metadata from an individual telemetrysource that you might want to use within Metron
mergeMetadata A Boolean indicating whether to merge metadatawith the message (false by default).
If this property is set to true, then everymetadata field becomes part of the messagesand, consequently, is also available for fieldtransformations.
numWorkers The number of workers to use in the topology(default is the storm default of 1).
numAckers The number of acker executors to use in the topology(default is the Storm default of 1).
spoutParallelism The Kafka spout parallelism (default to 1). Youcan override the default on the command line and ifthere are multiple sensors they should be in a commaseparated list in the same order as the sensors.
spoutNumTasks The number of tasks for the spout (default to 1). Youcan override the default on the command line, and ifthere are multiple sensors they should be in a commaseparated list in the same order as the sensors.
parserParallelism The parser bolt parallelism (default to 1). This canbe overridden on the command line , and if there aremultiple sensors should be in a comma separated listin the same order as the sensors.
parserNumTasks The number of tasks for the parser bolt (defaultto 1). If there are multiple sensors, the last one'sconfiguration will be used. This can be overridden onthe command line.
errorWriterParallelism The error writer bolt parallelism (default to 1). Thiscan be overridden on the command line.
errorWriterNumTasks The number of tasks for the error writer bolt (defaultto 1). This can be overridden on the command line.
spoutConfig A map representing a custom spout configuration(this is a map). If there are multiple sensors, theconfigs will be merged with the last specified takingprecedence. This can be overridden on the commandline.
17
HCP Adding New Telemetry Data Source Adding a New Telemetry Data Source
securityProtocol The security protocol to use for reading fromKafka (this is a string). This can be overridden onthe command line and also specified in the spoutconfiguration via the security.protocol key. If bothare specified, then they are merged and the CLI willtake precedence. If multiple sensors are used, any non"PLAINTEXT" value will be used.
stormConfig The storm configuration to use (this is a map). Thiscan be overridden on the command line. If both arespecified, they are merged with CLI properties takingprecedence.
cacheConfig Cache config for stellar field transformations. Thisconfigures a least frequently used cache. This isa map with the following keys. If not explicitlyconfigured (the default), then no cache will be used.
• • stellar.cache.maxSize - The maximum numberof elements in the cache. Default is to not usea cache.
• stellar.cache.maxTimeRetain - The maximumamount of time an element is kept in the cache(in minutes). Default is to not use a cache.
grokPath The path for the Grok statement.
patternLabel The top-level pattern of the Grok file.
parserConfig A JSON map defining the parser implementationconfiguration.
This configuration file also includes batch sizingand timeout settings for writer configuration. If youdo not define these properties, the system uses theirdefault values.
• batchSize - Number of records to batch togetherbefore sending to the writer. Default is 15.
• batchTimeout - Optional. The timeout after whicha batch is flushed even if the batchSize is not met.
"parserConfig" { "batchSize": 15, "batchTimeout" : 0 },
In addition, you can override settings for the kafkawriter within the parserConfig file.
fieldTransformations An array of complex objects representing thetransformations to be performed on the messagegenerated from the parser before writing to the Kafkatopic.
18

HCP Adding New Telemetry Data Source Adding a New Telemetry Data Source
In this example, the Grok parser is designed toextract the URL, but the only information that youneed is the domain (or even the domain withoutsubdomains). To obtain this, you can use the StellarField Transformation (under the fieldTransformationselement). The Stellar Field Transformation enablesyou to use the Stellar DSL (Domain SpecificLanguage) to define extra transformations to beperformed on the messages flowing through thetopology.
c) If you want to set the grok parser to use the current year in its timestamp, add the following information to thetransformations function in the datasource json file:
"fieldTransformations" : [ { "transformation" : "STELLAR" ,"output" : [ "timestamp"] ,"config" : { "timestamp”: “TO_EPOCH_TIMESTAMP(FORMAT(‘%s %d’, timestamp_str , YEAR()), ‘MMM dd HH:mm:ss:yyyy’)”
For example, the datasource json file would change to:
"fieldTransformations" : [ { "transformation" : "STELLAR" ,"output" : [ "full_hostname", "domain_without_subdomains" , "timestamp"] ,"config" : { "full_hostname" : "URL_TO_HOST(url)" ,"domain_without_subdomains" : ,”timestamp”: “TO_EPOCH_TIMESTAMP(FORMAT(‘%s %d’, timestamp_str , YEAR()), ‘MMM dd HH:mm:ss:yyyy’)” "DOMAIN_REMOVE_SUBDOMAINS(full_hostname)"
d) Use the following script to upload configurations to Apache ZooKeeper:
$METRON_HOME/bin/zk_load_configs.sh --mode PUSH -i $METRON_HOME/config/zookeeper -z $ZOOKEEPER_HOST:2181
6. Deploy the new parser topology to the cluster:
If you want to deploy multiple parsers on one topology, refer to Creating Multiple Parsers on One Topology.
a) Log in to the host that has Metron installed as root user.b) Deploy the new parser topology:
$METRON_HOME/bin/start_parser_topology.sh -k $KAFKA_HOST:6667 -z $ZOOKEEPER_HOST:2181 -s $DATASOURCE
c) Use the Apache Storm UI to verify that the new topology is listed and that it has no errors.
This new data source processor topology ingests from the $DATASOURCE Kafka topic that you created earlierand then parses the event with the HCP Grok framework using the Grok pattern defined earlier.
Create Multiple Parsers on One TopologyYou can specify multiple parsers to run on one aggregated Storm topology to conserve resources. However, forperformance reasons, you should group multiple parsers that have similar velocity or data flow and perform functionswith similar complexity.
19

HCP Adding New Telemetry Data Source Adding a New Telemetry Data Source
Procedure
1. Use the CLI to create multiple parsers that you want to specify on a single Storm topology.
Refer to Create a Parser for Your New Data Source by Using the CLI.
2. Deploy the new parser topologies to the cluster:
a) Log in to the host that has Metron installed as root user.b) Deploy the new parsers you want to specify onto one topology:
$METRON_HOME/bin/start_parser_topology.sh -k $KAFKA_HOST:6667 -z $ZOOKEEPER_HOST:2181 -s $DATASOURCE_ONE,$DATASOURCE_TWO
Note: If your parser name contains a hyphen, you must enclose the parser name in single quotes (').If you do not enclose a hyphenated parser name in single quotes, Ambari will assume each word orcharacter in the hyphenated parser name is a separate parser. For example, Ambari interprets sapower-windows-x-json,bro as seven parsers instead of one. Even the hyphen is considered a parser.
For clarity and consistency, we recommend enclosing all parser names in single quotes when youdeploy the new parsers onto a topology.
For example:
$METRON_HOME/bin/start_parser_topology.sh -z $ZOOKEEPER_HOST:2181 -s 'bro-source1','yaf'
c) If you want to override parser parameters, you can add the parameter and its value to the deploymentcommand.
For a list of parser parameters, see Create a Parser for Your New Data Source by Using the CLI.
For example:
$METRON_HOME/bin/start_parser_topology.sh -z $ZOOKEEPER_HOST:2181 -s 'bro-source1','yaf' -spoutNumTasks 2,3 -parserParallelism 2 -parserNumTasks 5
This command will create a topology with the following parameters:
• Bro - spout number of tasks = 2• YAF - spout number of tasks = 3• YAF - parser parallelism = 2• YAF - parser number of tasks = 5
d) Use the Apache Storm UI to verify that the new topology is listed and that it has no errors.
This new data source processor topology ingests from each $DATASOURCE Kafka topic that you created earlierand then parses the event with the HCP Grok framework using the Grok pattern defined earlier.
Chain ParsersMany sensors contain metadata that should be ingested along with the data or contain different sensor types that needto be parsed separately. You can chain multiple parsers for a sensor to individually address the different types ofinformation in the sensor. For example, you can parse multiple components in a Syslog log file such as timestamp,message type, and message payload, to differentiate the information contained in the log file. To chain parsers, youneed an enveloping parser and sub-parsers for one or more sensor types.For ease of explanation, the following steps use the Grok parser format example provided in Step 1c.
Procedure
1. Before editing configurations, pull the configurations from ZooKeeper locally:
$METRON_HOME/bin/zk_load_configs.sh --mode PULL -z $ZOOKEEPER -o $METRON_HOME/config/zookeeper/ -f
20
HCP Adding New Telemetry Data Source Adding a New Telemetry Data Source
For ease of explanation, steps in this topic use the Grok parser format example provided in Step 2c.
2. Determine the format of the new data source’s log entries, so you can parse them.
3. Create a statement that defines the pattern of the parser expression for the log type for your enveloping parser.
For ease of explanation, we assume that we are using a Grok topology. Refer to the Grok documentation foradditional details.
4. Save the Grok statement and load it into Hadoop Distributed File System (HDFS) in a named location:
a) Create a local file for the new data source:
touch /tmp/$ENVELOPE_DATASOURCE
b) Open $ENVELOPE_DATASOURCE and add the Grok statement defined in Step 3:
vi /tmp/$ENVELOPE_DATASOURCE
c) Put the $ENVELOPE_DATASOURCE file into the HDFS directory where Metron stores its Grok parsers.
Existing Grok parsers that ship with HCP are staged under /apps/metron/patterns:
su - hdfs hadoop fs -rmr /apps/metron/patterns/$ENVELOPE_DATASOURCE hdfs dfs -put /tmp/$ENVELOPE_DATASOURCE /apps/metron/patterns/
5. Define the enveloping parser configuration.
a) As root, log into the host with HCP installed:
ssh $HCP_HOST
b) Create a $DATASOURCE envelope parser configuration file at $METRON_HOME/config/zookeeper/parsers/$ENVELOPE_DATASOURCE.json:
/usr/hdp/current/kafka-broker/bin/kafka-topics.sh --zookeeper $ZOOKEEPER --create --topic $ENVELOPE_DATASOURCE --partitions 1 --replication-factor 1
c) Verify your new topic by listing the Kafka topics:
/usr/hdp/current/kafka-broker/bin/kafka-topics.sh --zookeeper $ZOOKEEPER --list
d) Populate the $ENVELOPE_PARSER Kafka topic with the following:
{ "parserClassName": "org.apache.metron.parsers.GrokParser", "sensorTopic": "$ENVELOPE_DATASOURCE", "parserConfig": { "grokPath": "/apps/metron/patterns/$ENVELOPE_DATASOURCE", "batchSize" : 1, "patternLabel": "$DATASOURCE_DELIMITED", "timestampField": "timestamp" "timeFields" : [ "timestamp" ], "dateFormat" : "MMM dd yyyy HH:mm:ss", "kafka.topicField" : "logical_source_type"}
The important parameters to set for this parser are the following:
parserClassName The name of the parser's class in the .jar file.
sensorTopic The Kafka topic on which the telemetry is beingstreamed. If the topic is prefixed and suffixed by
21

HCP Adding New Telemetry Data Source Adding a New Telemetry Data Source
/ then it is assumed to be a regex and will matchany topic matching the pattern (for example, /bro.*/matches bro_cust0, bro_cust1 and bro_cust2).
parserConfig A JSON map defining the parser implementationconfiguration.
For an envelope parser, this parameter specifies thatthe parser will send messages to the topic specifiedin the logical_source_type field. If the field does notexist, then the message is not sent.
EXAMPLE for Envelope Parser
The following is an example of an envelope parser called pix_syslog_router configured to:
• Parse the timestamp field• Parse the payload into a field called data (messageField" : "data)• Parse the tag into a field called pix_type (input": "pix_type)• Route the enveloped message to the appropriate Kafka topic based on the tag. In this case, it's called
logical_source_type.
The envelope parser will send output to two sub-parsers:
• cisco-6-302 - Connection creation and teardown messages, for example, Built UDP connection for faddr198.207.223.240/53337 gaddr 10.0.0.187/53 laddr 192.168.0.2/53
• cisco-5-304 - URL access events, for example 192.168.0.2 Accessed URL 66.102.9.99:/
In order for this parser configuration to work, you must create a file called cisco_patterns and populate it with thefollowing grok expressions:
CISCO_ACTION Built|Teardown|Deny|Denied|denied|requested|permitted|denied by ACL|discarded|est-allowed|Dropping|created|deletedCISCO_REASON Duplicate TCP SYN|Failed to locate egress interface|Invalid transport field|No matching connection|DNS Response|DNS Query|(?:%{WORD}\s*)*CISCO_DIRECTION Inbound|inbound|Outbound|outboundCISCOFW302020_302021 %{CISCO_ACTION:action}(?:%{CISCO_DIRECTION:direction})? %{WORD:protocol} connection %{GREEDYDATA:ignore} faddr %{IP:ip_dst_addr}/%{INT:icmp_seq_num}(?:\(%{DATA:fwuser}\))? gaddr %{IP:ip_src_xlated}/%{INT:icmp_code_xlated} laddr %{IP:ip_src_addr}/%{INT:icmp_code}( \(%{DATA:user}\))?ACCESSED %{URIHOST:ip_src_addr} Accessed URL %{IP:ip_dst_addr}:%{URIPATHPARAM:uri_path}CISCO_PIX %{GREEDYDATA:timestamp}: %PIX-%{NOTSPACE:pix_type}: %{GREEDYDATA:data}
Place the file at /tmp/cisco_patterns in HDFS by using:
hadoop fs -put ~/cisco_patterns /tmp
Parser Configuration
{ "parserClassName" : "org.apache.metron.parsers.GrokParser" ,"sensorTopic" : "pix_syslog_router" , "parserConfig": { "grokPath": "/tmp/cisco_patterns", "batchSize" : 1, "patternLabel": "CISCO_PIX", "timestampField": "timestamp", "timeFields" : [ "timestamp" ],
22

HCP Adding New Telemetry Data Source Adding a New Telemetry Data Source
"dateFormat" : "MMM dd yyyy HH:mm:ss", "kafka.topicField" : "logical_source_type" } ,"fieldTransformations" : [ { "transformation" : "REGEX_SELECT" ,"input" : "pix_type" ,"output" : "logical_source_type" ,"config" : { "cisco-6-302" : "^6-302.*", "cisco-5-304" : "^5-304.*" } } ]}
fieldTransformations An array of complex objects representing thetransformations to be performed on the messagegenerated from the parser before writing to the Kafkatopic.
For this example, this parameter includes the followingoptions:
• transformation - The REGEX_SELECT fieldtransformation sets the logical_source_type fieldbased on the value of the input value.
• input - Determines the subparser type.• output - The output of the field transform.• config - The name of the sub-parsers and the
REGEX that matches them.
6. Define one or more sub-parser configurations.
a) As root, log into the host with HCP installed:
ssh $HCP_HOST
b) Create a $DATASOURCE sub-parser configuration file at $METRON_HOME/config/zookeeper/parsers/$SUBPARSER_DATASOURCE.json:
/usr/hdp/current/kafka-broker/bin/kafka-topics.sh --zookeeper $ZOOKEEPER --create --topic $SUBPARSER_DATASOURCE --partitions 1 --replication-factor 1
c) Populate the $SUBPARSER_DATASOURCE.json file with the following:
{ "parserClassName": "org.apache.metron.parsers.GrokParser", "sensorTopic": "$SUBPARSER_DATASOURCE", "rawMessageStrategy" : "ENVELOPE" ,"rawMessageStrategyConfig" : { "messageField" : "data", "metadataPrefix" : "" "parserConfig": { "grokPath": "/apps/metron/patterns/$SUBPARSER_DATASOURCE", "batchSize" : 1, "patternLabel": "$DATASOURCE_DELIMITED", "timestampField": "timestamp" "timeFields" : [ "timestamp" ], "dateFormat" : "MMM dd yyyy HH:mm:ss", "kafka.topicField" : "logical_source_type"
23

HCP Adding New Telemetry Data Source Adding a New Telemetry Data Source
}}
The important parameters to set for this parser are the following:
parserClassName The name of the parser's class in the .jar file.
sensorTopic The Kafka topic on which the telemetry is beingstreamed. If the topic is prefixed and suffixed by/ then it is assumed to be a regex and will matchany topic matching the pattern (for example, /bro.*/matches bro_cust0, bro_cust1 and bro_cust2).
rawMessageStrategyConfig This is a strategy that indicates how to read data andmetadata. The strategies supported are:
• DEFAULT - Data is read directly from the Kafkarecord value and metadata, if any, is read fromthe Lafka record key. This strategy defaults to notreading metadata and not merging metadata.
• ENVELOPE - Data from Kafka record value ispresumed to be a JSON blob. One of these fieldsmust contain the raw data to pass to the parser.All other fields should be considered metadata.The field containing the raw data is specifiedin rawMessageStrategyConfig. Data held inthe Kafka key as well as the non-data fields inthe JSON blob passed into the Kafka value areconsidered metadata. Note that the exception tothis is that any original_string field is inheritedfrom the envelope data so that the original stringcontains the envelope data. If you do not preferthis behavior, remove this field from the envelopedata.
rawMessageStrategyConfig The configuration (a map) for therawMessageStrategy. Available configurations arestrategy dependent:
• DEFAULT - metadataPrefix defines the keyprefix for metadata (default is metron.metadata).
• ENVELOPE - metadataPrefix defines the keyprefix for metadata (default is metron.metadata)
messageField defines the field from the envelopeto use as the data. All other fields are consideredmetadata.
parserConfig A JSON map defining the parser implementationconfiguration.
For a chained parser, this parameter specifies that theparser will send messages to the topic specified in thelogical_source_type field. If the field does not exist,then the message is not sent.
This parameter also includes batch sizing and timeoutsettings for writer configuration. If you do not definethese properties, the system uses their default values.
24

HCP Adding New Telemetry Data Source Adding a New Telemetry Data Source
• grokPath - The path for the Grok statement.• batchSize - Number of records to batch together
before sending to the writer. Default is 15.• patternLabel - The name of the Grok statement
that defines the pattern of the Grok expression.• kafka.topicField - Specifies the topic as the value
of a particular field.
This field enables the routing capabilitiesnecessary for handling enveloped date. sIf thisvalue is unpopulated, the message is dropped.
EXAMPLE for Sub-Parser
The following is an example of a parser called cisco-6-302 configured to append to the existing fields from thepix_syslog_router the sensor specific fields based on the tag type.
{ "parserClassName" : "org.apache.metron.parsers.GrokParser" ,"sensorTopic" : "cisco-6-302" ,"rawMessageStrategy" : "ENVELOPE" ,"rawMessageStrategyConfig" : { "messageField" : "data", "metadataPrefix" : "" } , "parserConfig": { "grokPath": "/tmp/cisco_patterns", "batchSize" : 1, "patternLabel": "CISCOFW302020_302021" }}
7. Use the following script to upload configurations to Apache ZooKeeper:
$METRON_HOME/bin/zk_load_configs.sh --mode PUSH -i $METRON_HOME/config/zookeeper -z $ZOOKEEPER
8. Deploy the new parser topology to the cluster:
a) Log in to the host that has Metron installed as root user.b) Deploy the new parser topology:
$METRON_HOME/bin/start_parser_topology.sh -k $KAFKA -z $ZOOKEEPER -s $DATASOURCE
c) Use the Apache Storm UI to verify that the new topology is listed and that it has no errors.
This new data source processor topology ingests from the $DATASOURCE Kafka topic that you created earlierand then parses the event with the HCP Grok framework using the Grok pattern defined earlier.
Transform Your New Data Source Parser Information by Using the Management UIAfter you create a parser, you can use the HCP Management UI to transform the data source data to provide morerelevant and helpful information. For example, you can choose to transform a url to provide the domain name of theoutbound connection or the IP address.
Procedure
1. From the list of sensors in the main window, select your new sensor.
2. Click the pencil icon in the toolbar.
The Management UI displays the sensor panel for the new sensor.
25

HCP Adding New Telemetry Data Source Adding a New Telemetry Data Source
Note: Your sensor must be running and producing data before you can add transformation information.
3. In the Schema box, click
(expand window).
The Management UI populates the panel with message, field, and value information.
The Sample field displays a parsed version of a sample message from the sensor. The Management UI tests yourtransformations against these parsed messages.
You can use the right and left arrows to view the parsed version of each sample.
Although you can apply transformations to an existing field, users typically create and transform a new field.
4. To add a new transformation, either click
(edit) next to a field or click
(add) at the bottom of the Schema panel.
The following dialog box displays:
26

HCP Adding New Telemetry Data Source Adding a New Telemetry Data Source
5. From INPUT FIELD, select the field to transform, enter the name of the new field in the NAME field, and thenchoose a function with the appropriate parameters in the TRANSFORMATIONS box.
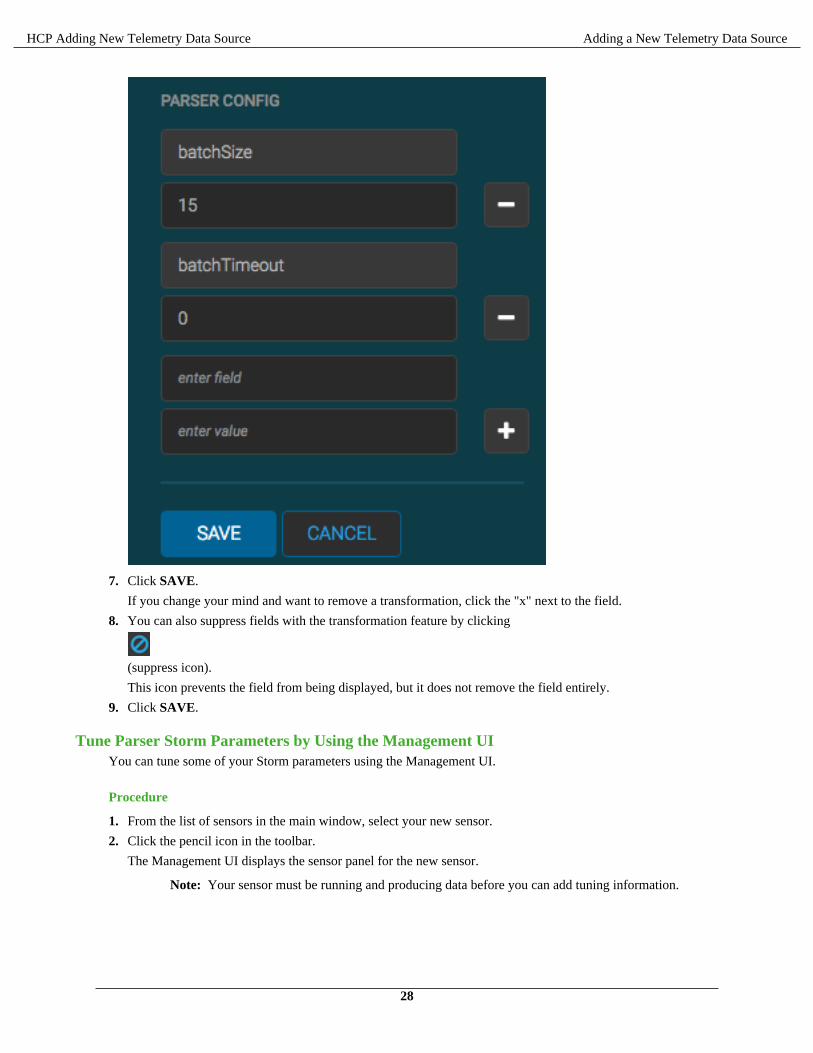
6. If you decide not to use the default values for the batchSize and batchTimeout properties, you can set their values.
In the Advanced portion of the input panel, enter the property name (for example batchSize) and the value in thePARSER CONFIG fields.
27
HCP Adding New Telemetry Data Source Adding a New Telemetry Data Source
7. Click SAVE.
If you change your mind and want to remove a transformation, click the "x" next to the field.
8. You can also suppress fields with the transformation feature by clicking
(suppress icon).
This icon prevents the field from being displayed, but it does not remove the field entirely.
9. Click SAVE.
Tune Parser Storm Parameters by Using the Management UIYou can tune some of your Storm parameters using the Management UI.
Procedure
1. From the list of sensors in the main window, select your new sensor.
2. Click the pencil icon in the toolbar.
The Management UI displays the sensor panel for the new sensor.
Note: Your sensor must be running and producing data before you can add tuning information.
28
HCP Adding New Telemetry Data Source Adding a New Telemetry Data Source
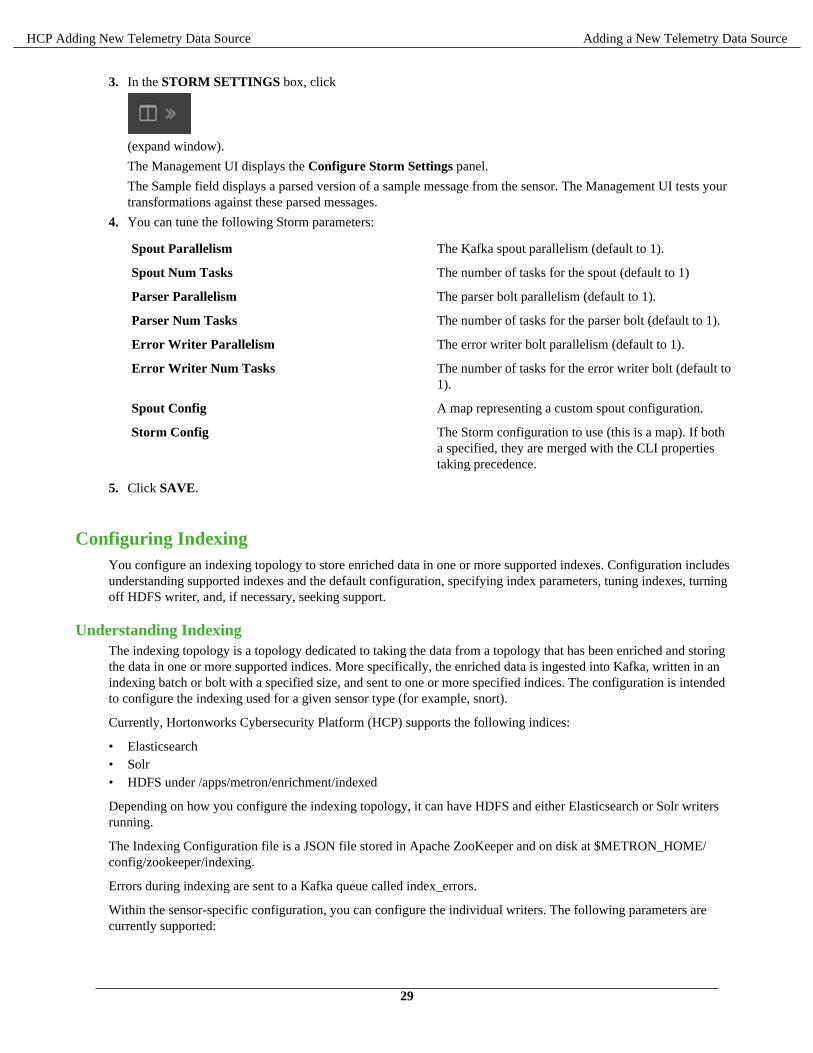
3. In the STORM SETTINGS box, click
(expand window).
The Management UI displays the Configure Storm Settings panel.
The Sample field displays a parsed version of a sample message from the sensor. The Management UI tests yourtransformations against these parsed messages.
4. You can tune the following Storm parameters:
Spout Parallelism The Kafka spout parallelism (default to 1).
Spout Num Tasks The number of tasks for the spout (default to 1)
Parser Parallelism The parser bolt parallelism (default to 1).
Parser Num Tasks The number of tasks for the parser bolt (default to 1).
Error Writer Parallelism The error writer bolt parallelism (default to 1).
Error Writer Num Tasks The number of tasks for the error writer bolt (default to1).
Spout Config A map representing a custom spout configuration.
Storm Config The Storm configuration to use (this is a map). If botha specified, they are merged with the CLI propertiestaking precedence.
5. Click SAVE.
Configuring IndexingYou configure an indexing topology to store enriched data in one or more supported indexes. Configuration includesunderstanding supported indexes and the default configuration, specifying index parameters, tuning indexes, turningoff HDFS writer, and, if necessary, seeking support.
Understanding IndexingThe indexing topology is a topology dedicated to taking the data from a topology that has been enriched and storingthe data in one or more supported indices. More specifically, the enriched data is ingested into Kafka, written in anindexing batch or bolt with a specified size, and sent to one or more specified indices. The configuration is intendedto configure the indexing used for a given sensor type (for example, snort).
Currently, Hortonworks Cybersecurity Platform (HCP) supports the following indices:
• Elasticsearch• Solr• HDFS under /apps/metron/enrichment/indexed
Depending on how you configure the indexing topology, it can have HDFS and either Elasticsearch or Solr writersrunning.
The Indexing Configuration file is a JSON file stored in Apache ZooKeeper and on disk at $METRON_HOME/config/zookeeper/indexing.
Errors during indexing are sent to a Kafka queue called index_errors.
Within the sensor-specific configuration, you can configure the individual writers. The following parameters arecurrently supported:
29

HCP Adding New Telemetry Data Source Adding a New Telemetry Data Source
index The name of the index to write to (defaulted is the nameof the sensor).
batchSize The size of the batch allowed to be written to the indicesat once (defaulted is 1).
enabled Whether the index or writer is enabled (default is true).
Default ConfigurationIf you do not configure the individual writers, the sensor-specific configuration uses default values.
You can use this default configuration either by not creating an indexing configuration file or by entering thefollowing in the file:
{}
Not specifying a writer configuration causes a warning in the Storm console, such as WARNING: Default and(likely) unoptimized writer config used for hdfs writer and sensor squid. You can safely ignore this warning.
The default configuration has the following features:
• solr writer
• index name the same as the sensor• batch size of 1• enabled
• elasticsearch writer
• index name the same as the sensor• batch size of 1• enabled
• hdfs writer
• index name the same as the sensor• batch size of 1• enabled
Creating a New Index Template or SchemaWhen you set up a new sensor, you must create either a new index template if you are using Elasticsearch or a newindex schema if you are using Solr.
Procedure
Add the following to the properties section of the template or the schema:
"properties": { "metron_field": { "type": "keyword" }}
Refer to Elastic Index Templates or Solr Index Schemas for more information.
Index HDFS TuningFor information on tuning indexing, see General Tuning Suggestions.
30
HCP Adding New Telemetry Data Source Adding a New Telemetry Data Source
Turn Off HDFS WriterYou can turn off the HDFS index or writer by modifying the index.json file.
Procedure
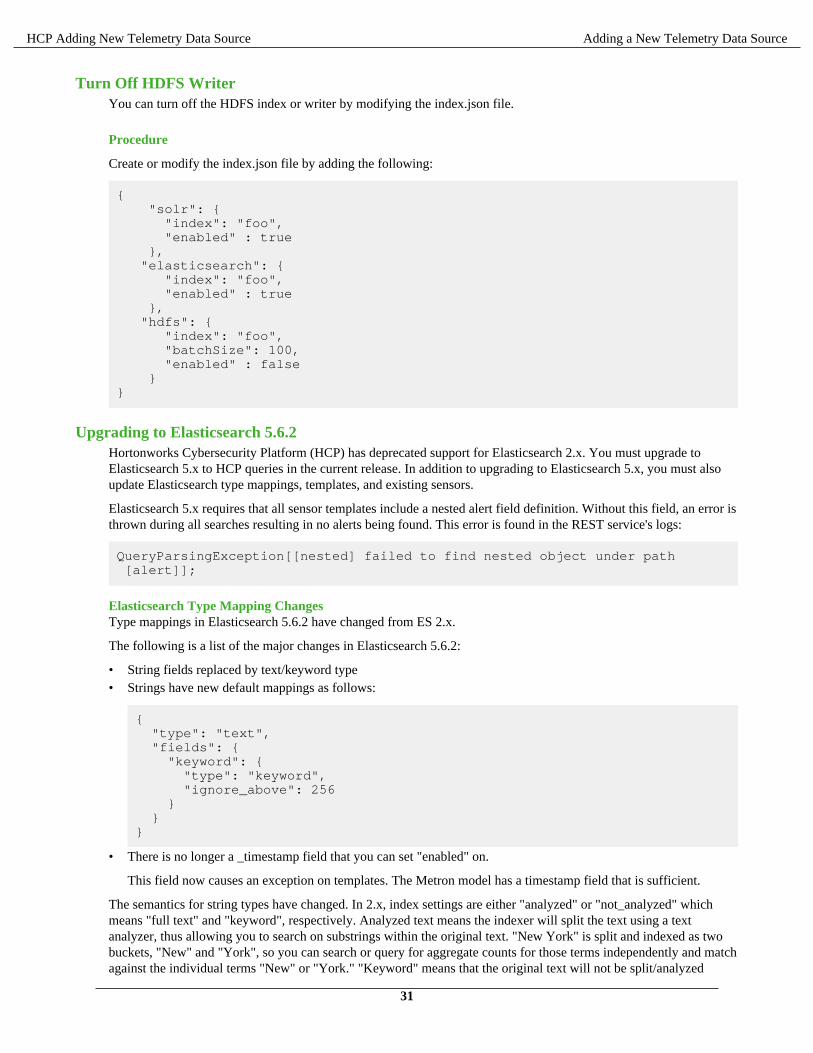
Create or modify the index.json file by adding the following:
{ "solr": { "index": "foo", "enabled" : true }, "elasticsearch": { "index": "foo", "enabled" : true }, "hdfs": { "index": "foo", "batchSize": 100, "enabled" : false }}
Upgrading to Elasticsearch 5.6.2Hortonworks Cybersecurity Platform (HCP) has deprecated support for Elasticsearch 2.x. You must upgrade toElasticsearch 5.x to HCP queries in the current release. In addition to upgrading to Elasticsearch 5.x, you must alsoupdate Elasticsearch type mappings, templates, and existing sensors.
Elasticsearch 5.x requires that all sensor templates include a nested alert field definition. Without this field, an error isthrown during all searches resulting in no alerts being found. This error is found in the REST service's logs:
QueryParsingException[[nested] failed to find nested object under path [alert]];
Elasticsearch Type Mapping ChangesType mappings in Elasticsearch 5.6.2 have changed from ES 2.x.
The following is a list of the major changes in Elasticsearch 5.6.2:
• String fields replaced by text/keyword type• Strings have new default mappings as follows:
{ "type": "text", "fields": { "keyword": { "type": "keyword", "ignore_above": 256 } }}
• There is no longer a _timestamp field that you can set "enabled" on.
This field now causes an exception on templates. The Metron model has a timestamp field that is sufficient.
The semantics for string types have changed. In 2.x, index settings are either "analyzed" or "not_analyzed" whichmeans "full text" and "keyword", respectively. Analyzed text means the indexer will split the text using a textanalyzer, thus allowing you to search on substrings within the original text. "New York" is split and indexed as twobuckets, "New" and "York", so you can search or query for aggregate counts for those terms independently and matchagainst the individual terms "New" or "York." "Keyword" means that the original text will not be split/analyzed
31

HCP Adding New Telemetry Data Source Adding a New Telemetry Data Source
during indexing and instead treated as a whole unit. For example, "New" or "York" will not match in searches againstthe document containing "New York", but searching on "New York" as the full city name will match. In Elasticsearch5.6 language, instead of using the "index" setting, you now set the "type" to either "text" for full text, or "keyword"for keywords.
Below is a table listing the changes to how String types are now handled.
sort, aggregate, or access values Elasticsearch 2.x Elasticsearch 5.x Example
no"my_property" : { "type": "string", "index": "analyzed"}
"my_property" : { "type": "text"}
Additional defaults: "index":"true", "fielddata": "false"
"New York" handled via in-memsearch as "New" and "York"buckets. No aggregation or sort.
yes"my_property": { "type": "string", "index": "analyzed"}
"my_property": { "type": "text", "fielddata": "true"}
"New York" handled via in-memsearch as "New" and "York"buckets. Can aggregate and sort.
yes"my_property": { "type": "string", "index": "not_analyzed"}
"my_property" : { "type": "keyword"}
"New York" searchable as singlevalue. Can aggregate and sort. Asearch for "New" or "York" willnot match against the whole value.
yes"my_property": { "type": "string", "index": "analyzed"}
"my_property": { "type": "text", "fields": { "keyword": { "type": "keyword", "ignore_above": 256 } }}
"New York" searchable as singlevalue or as text document. Canaggregate and sort on the sub term"keyword."
If you want to set default string behavior for all strings for a given index and type, you can do so with a mappingsimilar to the following (replace ${your_type_here} accordingly):
# curl -XPUT 'http://${ES_HOST}:${ES_PORT}/_template/default_string_template' -d '{ "template": "*", "mappings" : { "${your_type_here}": { "dynamic_templates": [ { "strings": {
32
HCP Adding New Telemetry Data Source Adding a New Telemetry Data Source
"match_mapping_type": "string", "mapping": { "type": "text" "fielddata": "true" } } } ] } }}
By specifying the template property with value *, the template will apply to all indexes that have documents indexedof the specified type (${your_type_here}).
The following are other settings for types in Elasticsearch:
• doc_values
• • On-disk data structure• Provides access for sorting, aggregation, and field values• Stores same values as _source, but in column-oriented fashion better for sorting and aggregating• Not supported on text fields• Enabled by default
• fielddata
• In-memory data structure• Provides access for sorting, aggregation, and field values• Primarily for text fields• Disabled by default because the heap space required can be large
Update Elasticsearch Templates to Work with Elasticsearch 5.xHCP requires that all sensor templates have a nested metron_alert field defined to work with Elasticsearch 5.x.
Procedure
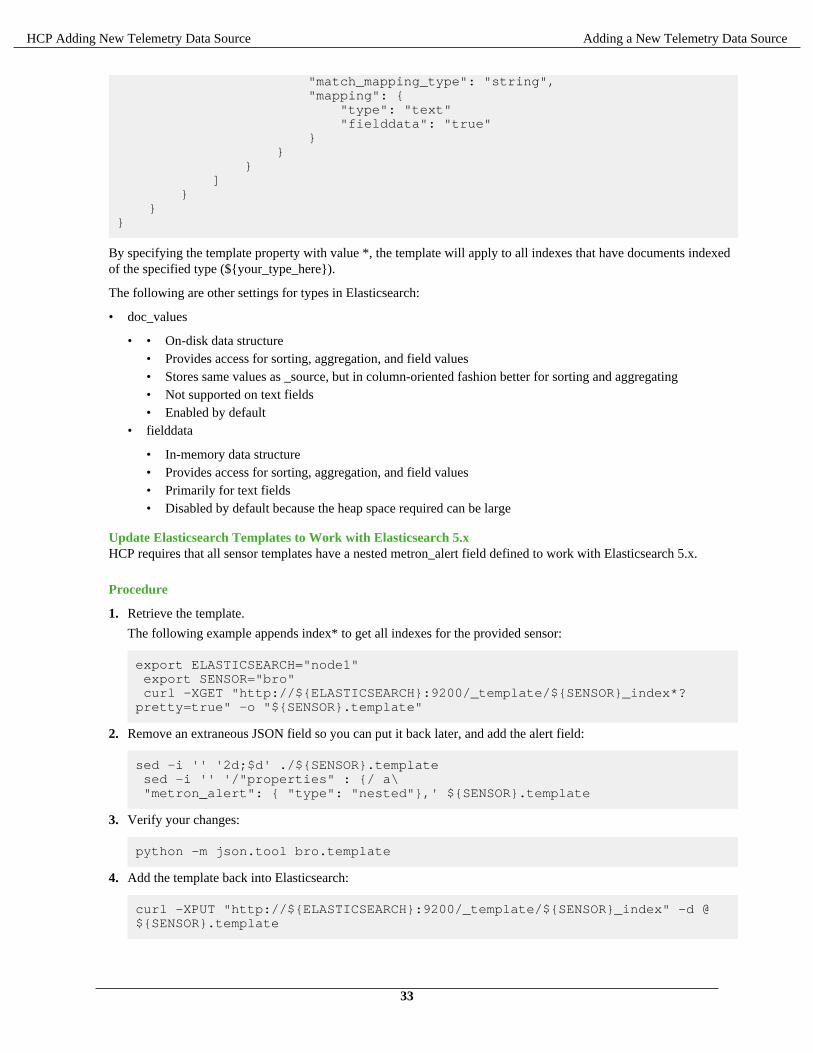
1. Retrieve the template.
The following example appends index* to get all indexes for the provided sensor:
export ELASTICSEARCH="node1" export SENSOR="bro" curl -XGET "http://${ELASTICSEARCH}:9200/_template/${SENSOR}_index*?pretty=true" -o "${SENSOR}.template"
2. Remove an extraneous JSON field so you can put it back later, and add the alert field:
sed -i '' '2d;$d' ./${SENSOR}.template sed -i '' '/"properties" : {/ a\ "metron_alert": { "type": "nested"},' ${SENSOR}.template
3. Verify your changes:
python -m json.tool bro.template
4. Add the template back into Elasticsearch:
curl -XPUT "http://${ELASTICSEARCH}:9200/_template/${SENSOR}_index" -d @${SENSOR}.template
33
HCP Adding New Telemetry Data Source Adding a New Telemetry Data Source
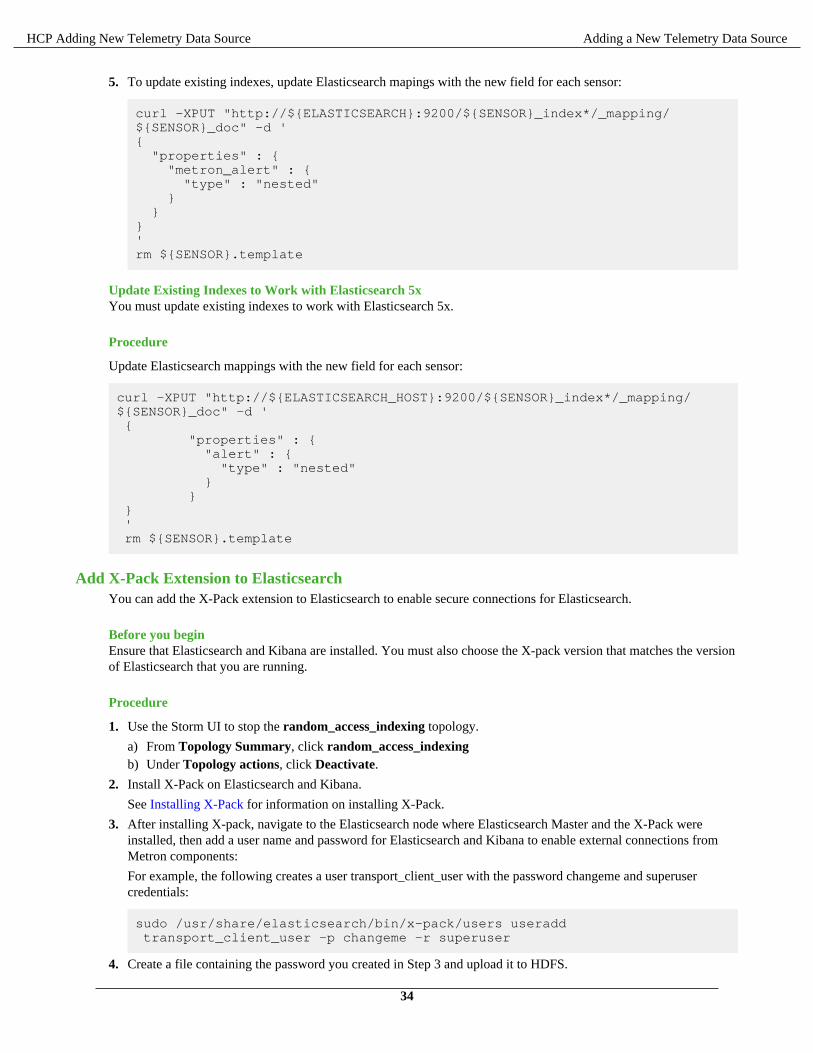
5. To update existing indexes, update Elasticsearch mapings with the new field for each sensor:
curl -XPUT "http://${ELASTICSEARCH}:9200/${SENSOR}_index*/_mapping/${SENSOR}_doc" -d '{ "properties" : { "metron_alert" : { "type" : "nested" } }}'rm ${SENSOR}.template
Update Existing Indexes to Work with Elasticsearch 5xYou must update existing indexes to work with Elasticsearch 5x.
Procedure
Update Elasticsearch mappings with the new field for each sensor:
curl -XPUT "http://${ELASTICSEARCH_HOST}:9200/${SENSOR}_index*/_mapping/${SENSOR}_doc" -d ' { "properties" : { "alert" : { "type" : "nested" } } } ' rm ${SENSOR}.template
Add X-Pack Extension to ElasticsearchYou can add the X-Pack extension to Elasticsearch to enable secure connections for Elasticsearch.
Before you beginEnsure that Elasticsearch and Kibana are installed. You must also choose the X-pack version that matches the versionof Elasticsearch that you are running.
Procedure
1. Use the Storm UI to stop the random_access_indexing topology.
a) From Topology Summary, click random_access_indexingb) Under Topology actions, click Deactivate.
2. Install X-Pack on Elasticsearch and Kibana.
See Installing X-Pack for information on installing X-Pack.
3. After installing X-pack, navigate to the Elasticsearch node where Elasticsearch Master and the X-Pack wereinstalled, then add a user name and password for Elasticsearch and Kibana to enable external connections fromMetron components:
For example, the following creates a user transport_client_user with the password changeme and superusercredentials:
sudo /usr/share/elasticsearch/bin/x-pack/users useradd transport_client_user -p changeme -r superuser
4. Create a file containing the password you created in Step 3 and upload it to HDFS.
34

HCP Adding New Telemetry Data Source Adding a New Telemetry Data Source
For example:
echo changeme > /tmp/xpack-passwordsudo -u hdfs hdfs dfs -mkdir /apps/metron/elasticsearch/sudo -u hdfs hdfs dfs -put /tmp/xpack-password /apps/metron/elasticsearch/sudo -u hdfs hdfs dfs -chown metron:metron /apps/metron/elasticsearch/xpack-password
5. Pull the most recent HCP configuration to the local file system by running the following on the node on whichHCP is installed:
$METRON_HOME/bin/zk_load_configs.sh -m PULL -o ${METRON_HOME}/config/zookeeper -z $ZOOKEEPER -f
6. Set the X-Pack es.client.class by adding it to $METRON_HOME/config/zookeeper/global.json.
For example, add the following to the global.json file:
{... "es.client.settings" : { "es.client.class" : "org.elasticsearch.xpack.client.PreBuiltXPackTransportClient", "es.xpack.username" : "transport_client_user", "es.xpack.password.file" : "/apps/metron/elasticsearch/xpack-password" } ...}
7. OPTIONAL: To set SSL support for Elasticsearch X-pack, add the following properties to es.client.settings in the$METRON_HOME/config/zookeeper/global.json file:
{... "es.client.settings" : { "xpack.ssl.key": "/path/to/client.key", "xpack.ssl.certificate": "/path/to/client.crt", "xpack.ssl.certificate_authorities": "/path/to/ca.crt", "xpack.security.transport.ssl.enabled": "true" } ...}
Note: Make sure you do not overwrite the existing es.client.settings properties.
The client.key, client.crt, and ca.crt must reside on all Storm supervisor nodes as well as the REST applicationnode.
For more information about configuring Elasticsearch SSL for X-pack, see Java Client and Security.
8. Add the X-Pack changes to ZooKeeper:
$METRON_HOME/bin/zk_load_configs.sh -m PUSH -i METRON_HOME/config/zookeeper/ -z $ZOOKEEPER
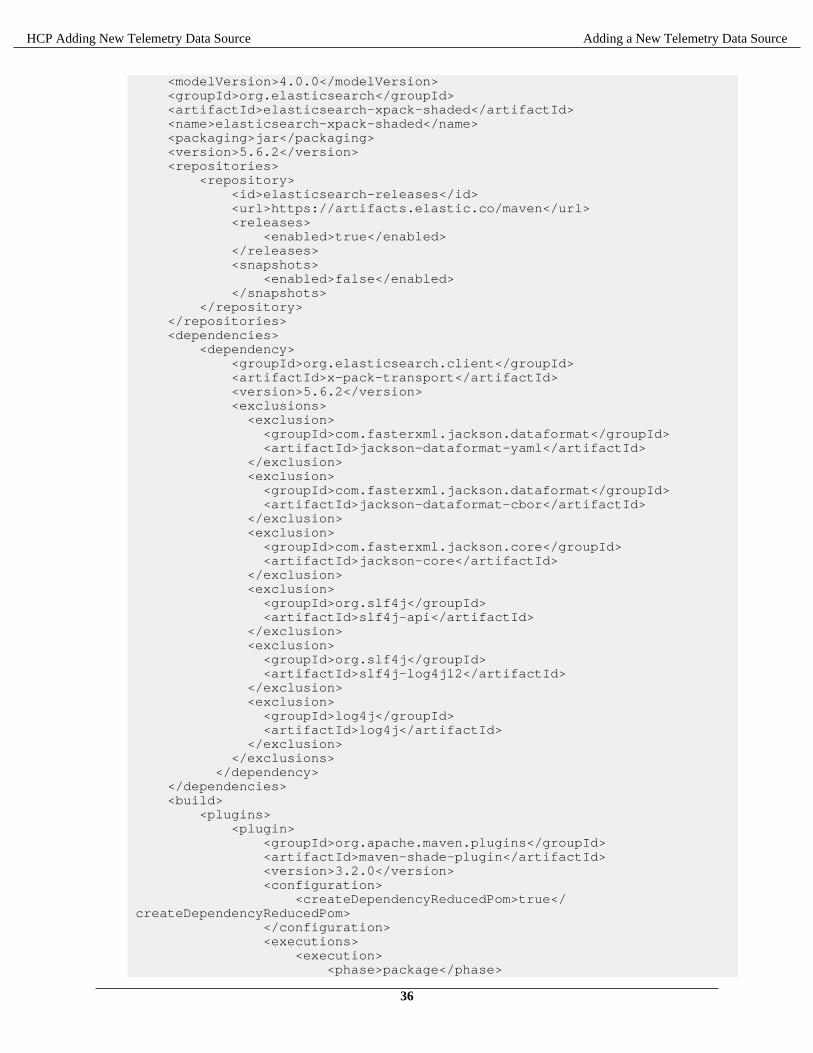
9. Create a custom X-Pack shaded and relocated jar file.
Your jar file is specific to your licensing restrictions. However, you can use the following example for reference:
<project xmlns="http://maven.apache.org/POM/4.0.0" xmlns:xsi="http://www.w3.org/2001/XMLSchema-instance" xsi:schemaLocation="http://maven.apache.org/POM/4.0.0 http://maven.apache.org/xsd/maven-4.0.0.xsd">
35
HCP Adding New Telemetry Data Source Adding a New Telemetry Data Source
<modelVersion>4.0.0</modelVersion> <groupId>org.elasticsearch</groupId> <artifactId>elasticsearch-xpack-shaded</artifactId> <name>elasticsearch-xpack-shaded</name> <packaging>jar</packaging> <version>5.6.2</version> <repositories> <repository> <id>elasticsearch-releases</id> <url>https://artifacts.elastic.co/maven</url> <releases> <enabled>true</enabled> </releases> <snapshots> <enabled>false</enabled> </snapshots> </repository> </repositories> <dependencies> <dependency> <groupId>org.elasticsearch.client</groupId> <artifactId>x-pack-transport</artifactId> <version>5.6.2</version> <exclusions> <exclusion> <groupId>com.fasterxml.jackson.dataformat</groupId> <artifactId>jackson-dataformat-yaml</artifactId> </exclusion> <exclusion> <groupId>com.fasterxml.jackson.dataformat</groupId> <artifactId>jackson-dataformat-cbor</artifactId> </exclusion> <exclusion> <groupId>com.fasterxml.jackson.core</groupId> <artifactId>jackson-core</artifactId> </exclusion> <exclusion> <groupId>org.slf4j</groupId> <artifactId>slf4j-api</artifactId> </exclusion> <exclusion> <groupId>org.slf4j</groupId> <artifactId>slf4j-log4j12</artifactId> </exclusion> <exclusion> <groupId>log4j</groupId> <artifactId>log4j</artifactId> </exclusion> </exclusions> </dependency> </dependencies> <build> <plugins> <plugin> <groupId>org.apache.maven.plugins</groupId> <artifactId>maven-shade-plugin</artifactId> <version>3.2.0</version> <configuration> <createDependencyReducedPom>true</createDependencyReducedPom> </configuration> <executions> <execution> <phase>package</phase>
36

HCP Adding New Telemetry Data Source Adding a New Telemetry Data Source
<goals> <goal>shade</goal> </goals> <configuration> <filters> <filter> <artifact>*:*</artifact> <excludes> <exclude>META-INF/*.SF</exclude> <exclude>META-INF/*.DSA</exclude> <exclude>META-INF/*.RSA</exclude> </excludes> </filter> </filters> <relocations> <relocation> <pattern>org.apache.logging.log4j</pattern> <shadedPattern>org.apache.metron.logging.log4j</shadedPattern> </relocation> </relocations> <artifactSet> <excludes> <exclude>org.slf4j.impl*</exclude> <exclude>org.slf4j:slf4j-log4j*</exclude> </excludes> </artifactSet> <transformers> <transformer implementation="org.apache.maven.plugins.shade.resource.DontIncludeResourceTransformer"> <resources> <resource>.yaml</resource> <resource>LICENSE.txt</resource> <resource>ASL2.0</resource> <resource>NOTICE.txt</resource> </resources> </transformer> <transformer implementation="org.apache.maven.plugins.shade.resource.ServicesResourceTransformer"/> <transformer implementation="org.apache.maven.plugins.shade.resource.ManifestResourceTransformer"> <mainClass></mainClass> </transformer> </transformers> </configuration> </execution> </executions> </plugin> </plugins> </build></project>
10. After you build the elasticsearch-xpack-shaded-$ES_VERSION.jar file, you must make the file available to Stormwhen you submit the topology.
37
HCP Adding New Telemetry Data Source Adding a New Telemetry Data Source
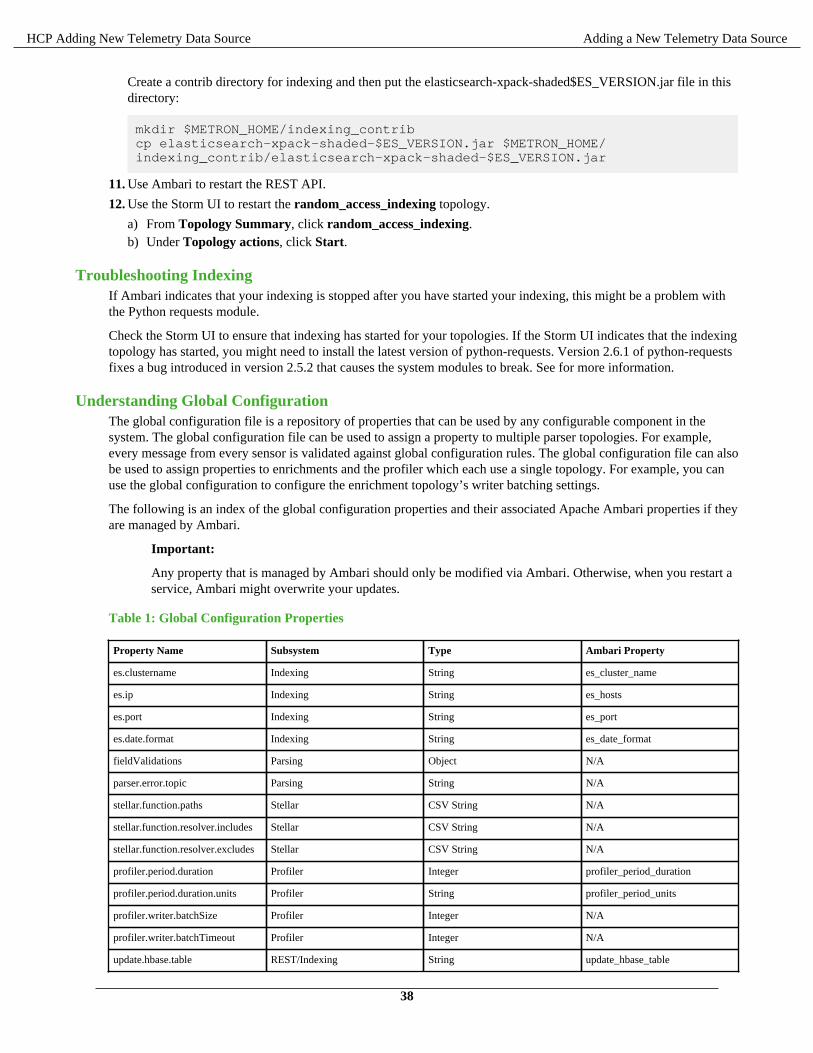
Create a contrib directory for indexing and then put the elasticsearch-xpack-shaded$ES_VERSION.jar file in thisdirectory:
mkdir $METRON_HOME/indexing_contribcp elasticsearch-xpack-shaded-$ES_VERSION.jar $METRON_HOME/indexing_contrib/elasticsearch-xpack-shaded-$ES_VERSION.jar
11. Use Ambari to restart the REST API.
12. Use the Storm UI to restart the random_access_indexing topology.
a) From Topology Summary, click random_access_indexing.b) Under Topology actions, click Start.
Troubleshooting IndexingIf Ambari indicates that your indexing is stopped after you have started your indexing, this might be a problem withthe Python requests module.
Check the Storm UI to ensure that indexing has started for your topologies. If the Storm UI indicates that the indexingtopology has started, you might need to install the latest version of python-requests. Version 2.6.1 of python-requestsfixes a bug introduced in version 2.5.2 that causes the system modules to break. See for more information.
Understanding Global ConfigurationThe global configuration file is a repository of properties that can be used by any configurable component in thesystem. The global configuration file can be used to assign a property to multiple parser topologies. For example,every message from every sensor is validated against global configuration rules. The global configuration file can alsobe used to assign properties to enrichments and the profiler which each use a single topology. For example, you canuse the global configuration to configure the enrichment topology’s writer batching settings.
The following is an index of the global configuration properties and their associated Apache Ambari properties if theyare managed by Ambari.
Important:
Any property that is managed by Ambari should only be modified via Ambari. Otherwise, when you restart aservice, Ambari might overwrite your updates.
Table 1: Global Configuration Properties
Property Name Subsystem Type Ambari Property
es.clustername Indexing String es_cluster_name
es.ip Indexing String es_hosts
es.port Indexing String es_port
es.date.format Indexing String es_date_format
fieldValidations Parsing Object N/A
parser.error.topic Parsing String N/A
stellar.function.paths Stellar CSV String N/A
stellar.function.resolver.includes Stellar CSV String N/A
stellar.function.resolver.excludes Stellar CSV String N/A
profiler.period.duration Profiler Integer profiler_period_duration
profiler.period.duration.units Profiler String profiler_period_units
profiler.writer.batchSize Profiler Integer N/A
profiler.writer.batchTimeout Profiler Integer N/A
update.hbase.table REST/Indexing String update_hbase_table
38

HCP Adding New Telemetry Data Source Adding a New Telemetry Data Source
Property Name Subsystem Type Ambari Property
update.hbase.cf REST-Indexing String update_hbase_cf
geo.hdfs.file Enrichment String geo_hdfs_file
enrichment.writer.batchSize Enrichment Integer N/A
enrichment.writer.batchTimeout Enrichment Integer N/A
source.type.field UI String source_type_field
threat.triage.score.field UI String threat_triage_score-_field
You can also create a validation using Stellar. The following validation uses Stellar to validate an ip_src_addr similarto the "validation":"IP"" example above:
"fieldValidations" : [ { "validation" : "STELLAR", "config" : { "condition" : "IS_IP(ip_src_addr, 'IPV4')" } } ]
Create Global ConfigurationsThe global configuration file is accessible to all configurable components in the system. The global configurationfile can be used to assign a property to multiple parser topologies. For example, every message from every sensoris validated against global configuration rules. The global configuration file can also be used to assign properties toenrichments and the profiler which each use a single topology. For example, you can use the global configuration toconfigure the enrichment topology’s writer batching settings.
Procedure
1. To configure a global configuration file, create a file called global.json at $METRON_HOME/config/zookeeper.
2. Using the following format, populate the file with enrichment values that you want to apply to all sensors:
{ "es.clustername": "metron", "es.ip": "node1", "es.port": "9300", "es.date.format": "yyyy.MM.dd.HH", "fieldValidations" : [ { "input" : [ "ip_src_addr", "ip_dst_addr" ], "validation" : "IP", "config" : { "type" : "IPV4" } } ]}
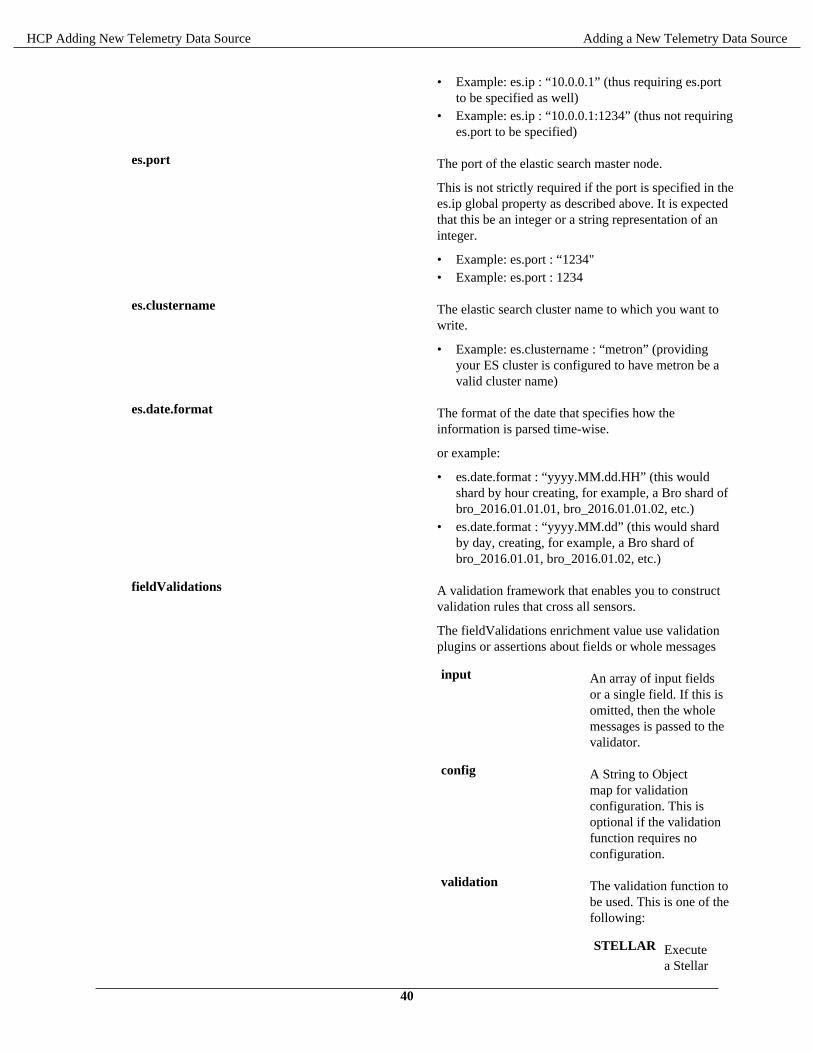
es.ip A single or collection of elastic search master nodes.
They might be specified using the hostname:portsyntax. If a port is not specified, then a separate globalproperty es.port is required:
• Example: es.ip : [ “10.0.0.1:1234”,“10.0.0.2:1234”]
39
HCP Adding New Telemetry Data Source Adding a New Telemetry Data Source
• Example: es.ip : “10.0.0.1” (thus requiring es.portto be specified as well)
• Example: es.ip : “10.0.0.1:1234” (thus not requiringes.port to be specified)
es.port The port of the elastic search master node.
This is not strictly required if the port is specified in thees.ip global property as described above. It is expectedthat this be an integer or a string representation of aninteger.
• Example: es.port : “1234"• Example: es.port : 1234
es.clustername The elastic search cluster name to which you want towrite.
• Example: es.clustername : “metron” (providingyour ES cluster is configured to have metron be avalid cluster name)
es.date.format The format of the date that specifies how theinformation is parsed time-wise.
or example:
• es.date.format : “yyyy.MM.dd.HH” (this wouldshard by hour creating, for example, a Bro shard ofbro_2016.01.01.01, bro_2016.01.01.02, etc.)
• es.date.format : “yyyy.MM.dd” (this would shardby day, creating, for example, a Bro shard ofbro_2016.01.01, bro_2016.01.02, etc.)
fieldValidations A validation framework that enables you to constructvalidation rules that cross all sensors.
The fieldValidations enrichment value use validationplugins or assertions about fields or whole messages
input An array of input fieldsor a single field. If this isomitted, then the wholemessages is passed to thevalidator.
config A String to Objectmap for validationconfiguration. This isoptional if the validationfunction requires noconfiguration.
validation The validation function tobe used. This is one of thefollowing:
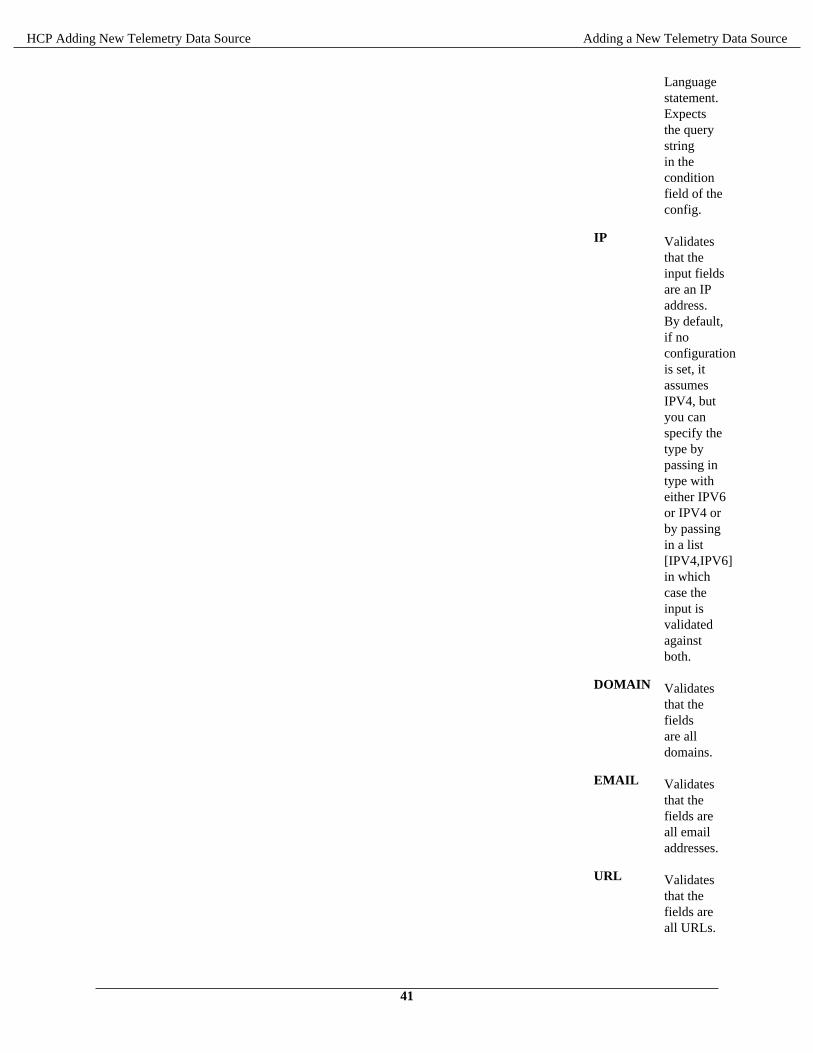
STELLAR Executea Stellar
40
HCP Adding New Telemetry Data Source Adding a New Telemetry Data Source
Languagestatement.Expectsthe querystringin theconditionfield of theconfig.
IP Validatesthat theinput fieldsare an IPaddress.By default,if noconfigurationis set, itassumesIPV4, butyou canspecify thetype bypassing intype witheither IPV6or IPV4 orby passingin a list[IPV4,IPV6]in whichcase theinput isvalidatedagainstboth.
DOMAIN Validatesthat thefieldsare alldomains.
EMAIL Validatesthat thefields areall emailaddresses.
URL Validatesthat thefields areall URLs.
41

HCP Adding New Telemetry Data Source Adding a New Telemetry Data Source
DATE Validatesthat thefields area date.Expectsformatin theconfiguration.
INTEGER Validatesthat thefields arean integer.Stringrepresentationof aninteger isallowed.
REGEX_MATCHValidatesthat thefieldsmatch aregex.Expectspatternin theconfiguration.
NOT_EMPTYValidatesthat thefields existand arenot empty(aftertrimming.)
Verify That Events Are IndexedAfter you add your new data source, you should verify that events are indexed and output matches any Stellartransformation functions you used.
Procedure
From the Alerts UI, search the source:type filter for the $DATASOURCE messages.
By convention, the index of new messages is called $DATASOURCE_index_[timestamp] and the document type is$DATASOURCE_doc.
42