Embed Size (px)
Citation preview

Health Information Systems, Inc.
3
Adding Clinical Data to Statewide Administrative Data: Pilot Project
Analysis and Results Final Report
AHRQ Contract #07-10042 AHCA Subcontract #EXD016
December 29th, 2009
3M Health Information Systems Norbert I Goldfield, M.D., Medical Director
Jack S. Hughes, M.D. Deborah S. Anderson, MBA, PMP
Elizabeth C. McCullough, M.S. Richard F. Averill, M.S.
Pam D. Banning, MT(ASCP), PMP Jean H. Xiang, M.S. Mona Z. Bao, M.S

AHRQ Adding Clinical Data to Statewide
Administrative Data: Pilot Project
3M Health Information Systems Summary Results Report
INTRODUCTION
Hospitals’ mortality rates will be affected by the types of patients they treat. Any comparison of
hospital mortality rates must therefore be risk-adjusted for the case mix of each hospital. All
hospitals routinely collect and submit to payers and government agencies standard data (referred
to as administrative data) that includes demographic, diagnostic and procedure data on each
patient.
The administrative data allows the determination of a patient’s reason for admission, the severity
of the condition that caused the admission, and the types and severity of comorbid conditions,
which can then be used to describe a hospital’s case mix. An accurate description of a hospital’s
case mix can then be used as the basis for risk-adjusting hospital mortality rate comparisons. By
examining case-mix adjusted mortality rates – based on patients with comparable conditions who
are at comparable risk – deviations from expected mortality rates can be determined and used to
identify potential problems with the quality of care.
The diagnostic information contained in administrative data is coded using the International
Classification of Diseases, 9th Revision, Clinical Modification (ICD-9-CM). Although ICD-9-
CM diagnosis codes identify the existence of a disease or illness, they frequently do not provide
a complete description its extent or severity. Because of this limitation of ICD-9-CM, any
description of a hospital’s case mix may not fully capture the true risk of mortality associated
with the patients being treated. For some diagnoses, clinical laboratory data can be used to
augment the administrative data to provide a more complete description of the extent and
severity of a patient’s illness, thereby improving the accuracy of the risk adjustment method for
comparing hospital mortality rates.
3M Health Information Systems Page 1
In order to test the degree to which clinical laboratory data can improve the accuracy of the risk
adjustment methods for comparing hospital mortality rates, a risk adjustment method that uses
only administrative data must be selected and then modified by adding clinical laboratory data.
The performance of the risk adjustment method can then be assessed with and without the
clinical laboratory data.
For the purposes of this project, the All Patient Refined Diagnosis Related Groups (APR DRGs)
were selected as the administrative data based risk adjustment method because of their
widespread use. APR DRGs are currently used by the Agency for Healthcare Research and
Quality (AHRQ), Agency for Health Care Administration (AHCA), Joint Commission on
Accreditation of Healthcare Organizations (JCAHO) and many other agencies as the risk
adjustment model in either public or confidential reporting of inpatient outcomes including
mortality. This project modified the administrative data based version of APR DRGs to include
clinical laboratory data, and then compared the versions of APR DRGs with and without
laboratory data in terms of their ability to predict inpatient mortality. The project involved five
steps:
1. Using research literature and clinical input, identify the subset of candidate clinical
laboratory tests to be evaluated
2. Create a database that includes both administrative and clinical laboratory data
3. Create standardized test result ranges (TRR) for each clinical laboratory test
4. Using research literature and clinical input to identify meaningful results outside normal
ranges of laboratory tests, statistical tests were then used to identify the subset of clinical
laboratory test results specified that improve the performance of APR DRGs for
predicting inpatient mortality
5. Assess the overall incremental improvement due to the addition of the clinical laboratory
test results on the performance of APR DRGs for predicting inpatient mortality
After a brief overview of APR DRGs, the methods and results for each step will be described,
followed by a discussion of project limitations and conclusions.
3M Health Information Systems Page 2

Background on APR DRGs
The All Patient Refined Diagnosis Related Groups (APR DRGs) expand the basic DRG
structure by adding two sets of subclasses to each base APR DRG. Each subclass set
consists of four subclasses and addresses patient differences relating to severity of illness
(SOI) and risk of mortality (ROM). Severity of illness is defined as the extent of
physiologic decompensation or organ system loss of function. Risk of mortality is
defined as the likelihood of dying. Since severity of illness and risk of mortality are
distinct patient attributes, separate subclasses are assigned to a patient for severity of
illness and risk of mortality. Thus, in the APR DRG system a patient is assigned three
distinct descriptors:
• The base APR DRG (e.g., APR DRG 194 Heart Failure or APR DRG 440 Kidney
Transplant)
• The severity of illness (SOI) subclass
• The risk of mortality (ROM) subclass
The four severity of illness subclasses and the four risk of mortality subclasses are
numbered sequentially from 1 to 4 indicating respectively, minor, moderate, major, and
extreme severity of illness or risk of mortality. For applications such as evaluating
resource use or establishing patient care guidelines, the APR DRG in conjunction with
severity of illness subclass is used. For evaluating patient mortality the APR DRG in
conjunction with the risk of mortality subclass is used.
The underlying clinical principles of APR DRGs are that the severity of illness and risk
of mortality of a patient are highly dependent on the patient’s underlying clinical
problems, and that patients with high severity of illness or risk of mortality are usually
characterized by multiple serious diseases or illnesses. In the APR DRGs, the assessment
of the severity of illness or risk of mortality of a patient is specific to the base APR DRG
to which a patient is assigned. In other words, the determination of the severity of illness
and risk of mortality is disease-specific. Thus, the significance attributed to complicating
or comorbid conditions is dependent on the underlying problem. For example, certain
types of infections are considered a more significant problem in a patient who is
3M Health Information Systems Page 3

immunosuppressed than in a patient with a fractured arm. In APR DRGs, high severity of
illness or risk of mortality are primarily determined by the interaction of multiple
diseases. Patients with multiple comorbid conditions involving multiple organ systems
represent difficult-to-treat patients who tend to have poor outcomes.
APR DRGs are a joint development of 3M Health Information Systems (3M HIS) and the
National Association of Children’s Hospitals and Related Institutions (NACHRI). Thus,
the APR DRGs provide a comprehensive and clinically specific classification of both
Medicare and non-Medicare patients.
The development of APR DRGs involved an iterative process of formulating clinical
hypotheses and then testing the hypotheses with historical data. Separate clinical models
are developed for each of 314 reasons for admission (base APR DRGs), in which the risk
factors that impact the severity of illness and risk of mortality are identified. Thus, the
APR DRGs are a clinical model that has been extensively reviewed with historical data.
APR DRG Risk of Mortality Subclass
In APR DRGs, the process of determining the risk of mortality (ROM) subclass of a
patient consists of three phases. In Phase I, the risk of mortality level of each secondary
diagnosis is determined. Once the risk of mortality level of each individual secondary
diagnosis is established, then Phase II determines a base risk of mortality subclass for the
patient based on all of the patient’s secondary diagnoses. In Phase III, the final risk of
mortality subclass for the patient is determined by incorporating the impact of principal
diagnosis, age, operating room procedure, non-operating room procedures, multiple
operating room procedures, and combinations of categories of secondary diagnoses. An
in depth description of the construction of the base APR DRGs and the 18 steps used to
assign the risk of mortality subclass can be made available from the authors upon request.
Admission APR DRG
Hospitals report discharge diagnoses on the Medicare claim form that include diagnoses
that were present on admission as well as diagnoses that develop post admission. As a
result, the base APR DRG, severity of illness subclass and risk of mortality subclass
represent the patient’s condition at the time of discharge and include the impact of
3M Health Information Systems Page 4

conditions that developed during the hospital stay. The Deficit Reduction Omnibus
Reconciliation Act of 2005 requires that hospital report a “present on admission” (POA)
indicator for each diagnosis that specifics whether the diagnosis was present at the time
of admission on all Medicare claims beginning in FY 2008. With the availability of the
POA indicator an Admission APR DRG (including the base ARR DRG, and the severity
of illness and risk of mortality subclasses) can be assigned in addition to the Discharge
APR DRG. The assignment of the Admission APR DRG is accomplished through a
seven step process that essentially eliminates certain diagnoses and procedures from
consideration in the assignment of the APR DRG. The underlying clinical logic for
assigning both the Admission APR DRG and Discharge APR DRG is identical. The one
difference is that a reduced set of diagnoses and procedures – only those present at the
time of admission – are used to assign the Admission APR DRG. The seven steps in
Admission APR DRG assignment essentially represent a preprocessing that limits the
diagnoses and procedures passed to the standard APR DRG assignment logic.
DATA SOURCE
We obtained hospital discharge data and clinical laboratory data from a nine months interval
from 2007 and 2008 for twenty-two Florida hospitals from three health systems and two
children’s hospitals. (One hospital provided 12 months of data). Hospitals that did not have
unique hospital identification numbers we combined based on the hospital identification number
provided in the dataset. Table 1 lists the combined seventeen participating hospitals and the
number of discharges from each hospital within the specified discharge time periods. The
administrative dataset provided to 3M HIS from AHCA contained a total of 223,468 discharges.
The standard patient discharge data elements provided in the administrative dataset included
diagnosis codes for principal and secondary diagnoses, procedure codes and the number of days
after admission they were performed, age, gender, patient discharge status, and the present on
admission indicator for each secondary diagnosis. The administrative data also included a
unique identification (ID) number for each patient discharge that was used to link to the
hospital’s clinical laboratory data.
3M Health Information Systems Page 5

Table 1: Florida Hospitals Participating in the Project
Health System - Hospital NameNumber of Discharges Discharge Time Period
All Children's Hospital 5,947 April 2007 - December 2007BayCare - Mease Countryside Hospital 12,929 April 2007 - December 2007BayCare - Mease Dunedin Hospital 4,793 April 2007 - December 2007BayCare - Morton Plant Hospital 23,662 April 2007 - December 2007BayCare - Morton Plant North Bay Hospital 4,838 January 2007 - December 2007BayCare - South Florida Baptist Hospital 4,524 April 2007 - December 2007BayCare - St. Anthony's Hospital 8,158 April 2007 - December 2007BayCare - St. Joseph's Hospital 37,214 April 2007 - December 2007Broward - Broward General Medical Center 21,896 April 2007 - December 2007Broward - Coral Springs Medical Center 9,876 April 2007 - December 2007Broward - Imperial Point Medical Center 5,318 April 2007 - December 2007Broward - North Broward Medical Center 10,120 April 2007 - December 2007Memorial - Memorial Hospital Miramar 8,142 April 2007 - December 2007Memorial - Memorial Hospital Pembroke 5,185 April 2007 - December 2007Memorial - Memorial Hospital West 20,405 April 2007 - December 2007Memorial - Memorial Regional Hospital 28,401 April 2007 - December 2007Miami Children's Hospital 12,060 January 2008 - December 2008
METHODS
Step 1: Identify the subset of candidate clinical laboratory tests to be evaluated
Before obtaining the hospital data, the research team, based on clinical grounds and a review of
the literature, selected candidate laboratory tests that were:
• Thought likely to contribute to predictions of in-hospital mortality and therefore useful to
incorporate into the APR DRG model
• Based on information routinely ordered by health care professionals
• Derived, whenever possible, from standardized items already tested in the literature.
The list of selected candidate clinical laboratory data elements collected for the project is shown
in Table 2.
Step 2: Create a database with that includes both administrative and clinical laboratory
data
3M Health Information Systems Page 6

The selected laboratory tests were identified according to Logical Observation Identifiers Names
and Codes (LOINC) standards, which allowed them to be indentified by standardized codes in
electronic reports.1 LOINC codes are highly specific and assign separate codes not only for the
type of laboratory test but also the source of the specimen and the specific analytic technique. A
single laboratory test can therefore have multiple associated LOINC codes.
The data elements contained in the clinical laboratory dataset included the LOINC codes, test
result, units of measure, date and time of the specimen, type of test performed, and reference
range of the test. Each record in the clinical laboratory dataset included the unique patient
discharge identification number that was included in the administrative dataset in order to link a
patient’s clinical laboratory data with the associated administrative discharge data.
Each of the laboratory test record in the clinical laboratory dataset was standardized to a LOINC
code using the mapping file developed by 3M HIS specific to the children’s hospitals and the
hospitals within each health system. Each LOINC code was associated with one of the selected
clinical laboratory data elements, and some of the laboratory tests were associated with multiple
LOINC codes.
Appendix A contains the fifty-five LOINC codes associated with the laboratory data elements
selected for the project as well as the number of laboratory test records in the clinical laboratory
dataset provided by the hospitals for the project. The LOINC codes shown in Appendix A are
organized by clinical laboratory data element so that an overall picture of the frequency of the
clinical laboratory data element could be assessed. Over 11.7 million clinical laboratory test
records were contained in the clinical laboratory dataset.
1 LOINC is one of the accepted standards of the Consolidated Health Informatics Initiative; recommended for use by the Office of National Coordinator (ONC) and its supporting workgroups within the American Health Information Community (AHIC).
3M Health Information Systems Page 7

Table 2: Candidate Clinical Laboratory Data Elements Collected
Clinical Laboratory Data ElementSGOTCPK MBPotassiumSodiumTroponin T pH PO2.sat pCO2 Prothrombin TimeAlbuminBase ExcessTotal bilrubin fractionsCalcium (total and ionized)CreatinineGlucoseAlkaline phosphataseBlood urea nitrogen (BUN)Hematocrit Mean cell hemoglobinMean cell volumePlatelets White blood cell (WBC) countChlorideBicarbonateGamma glutamyl transferaseSGPTPhosphorousTotal hemoglobinPartial thromboplastin timeBlood/Lymph culture-positive
Administrative Data Exclusions
After compiling the linked administrative and clinical laboratory data sets, we applied additional
criteria to the administrative dataset and excluded discharges from the analysis if:
• The discharge was classified to an ungroupable or error APR DRG (APR DRG
955 or 956)
• Charges for the discharge were less than $200
• Charges for the discharge were greater then two million dollars
• The length of stay for the discharge was over one year
3M Health Information Systems Page 8
• The discharge had a duplicate unique discharge ID number
• The discharge was from a hospital during a three month period (quarter) in which
less than 65% of the administrative discharges had at least one linked clinical
laboratory data record
• The hospital did not meet the POA data quality screening criteria (none of the 17
hospitals failed to meet this criterion)
Applying the patient level data quality screening criteria to the administrative dataset, 34,913
discharges were excluded from the administrative dataset. Table 3 shows the number and
percent of administrative discharge data records that failed one or more of the data quality
screening criteria.
The majority of the discharges excluded from the administrative dataset based on the data quality
screening criteria were due to a hospital having a low percentage of linked lab data for a three
month quarter of data. In particular, data from Miami Children’s Hospital was excluded entirely
because it had less than 15% of administrative data records linked to at least one laboratory data
record across all four quarters (twelve months) of data. Five other hospitals had one of their
three quarters of administrative data in which failed this criterion. The number and percent of
discharges with one or more laboratory test record linked to the administrative data for each
hospital for each quarter of data is included in Appendix B.
For this project, we applied five specific criteria for evaluating the quality of the present on
admission coding. This POA screening criteria was developed using administrative data from
California, and applied to the Florida administrative data to ensure POA coding accuracy. All 17
hospitals passed the POA data quality screen criteria. Eight hospitals had slightly over 10% of
the secondary diagnosis codes with a blank (empty) POA indicator. For these hospitals a blank
POA indicator was set to “Y”(yes) if the code was on our pre-existing list, “E” (exempt) if the
code was on the National Center for Health Statistics POA list of exempt diagnosis codes, and
otherwise was assumed to be not POA and labeled “N”. The detailed description of the POA
data quality screen criteria can be found in Appendix C.
3M Health Information Systems Page 9
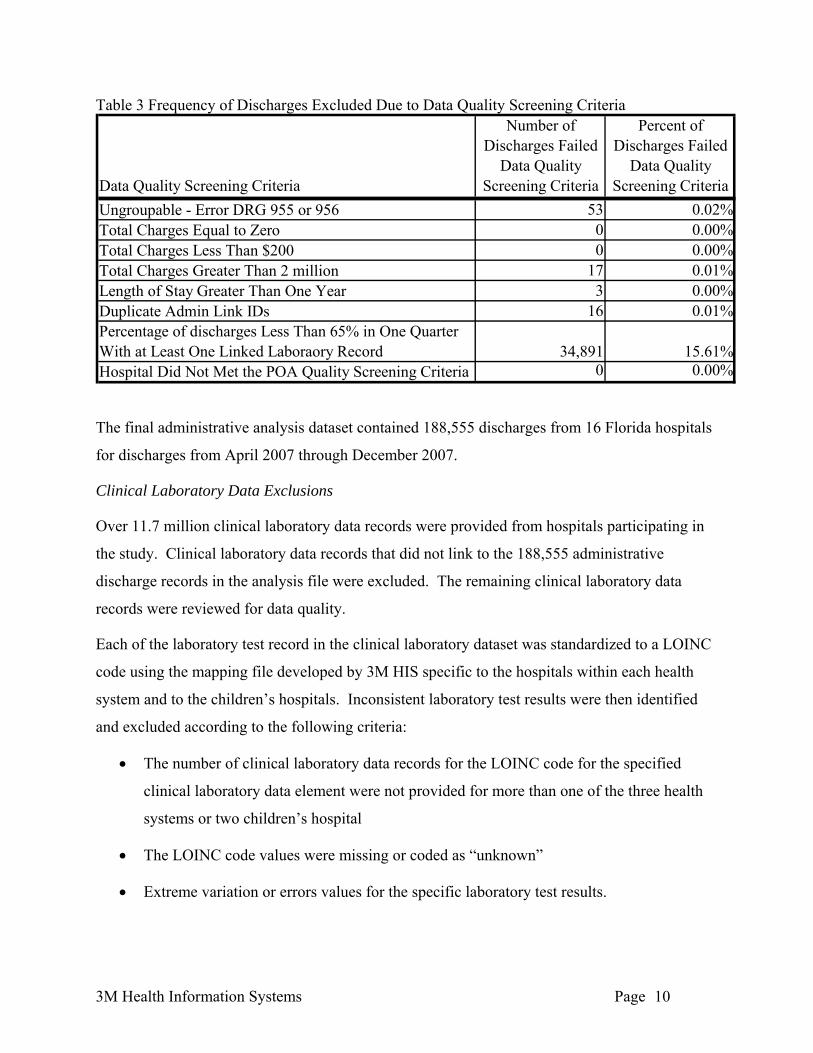
Table 3 Frequency of Discharges Excluded Due to Data Quality Screening Criteria
Data Quality Screening Criteria
Number of Discharges Failed
Data Quality Screening Criteria
Percent of Discharges Failed
Data Quality Screening Criteria
Ungroupable - Error DRG 955 or 956 53 0.02%Total Charges Equal to Zero 0 0Total Charges Less Than $200 0 0Total Charges Greater Than 2 million 17 0.01%Length of Stay Greater Than One Year 3 0Duplicate Admin Link IDs 16 0.01%Percentage of discharges Less Than 65% in One Quarter With at Least One Linked Laboraory Record 34,891 15.61%Hospital Did Not Met the POA Quality Screening Criteria 0 0
.00%
.00%
.00%
.00% The final administrative analysis dataset contained 188,555 discharges from 16 Florida hospitals
for discharges from April 2007 through December 2007.
Clinical Laboratory Data Exclusions
Over 11.7 million clinical laboratory data records were provided from hospitals participating in
the study. Clinical laboratory data records that did not link to the 188,555 administrative
discharge records in the analysis file were excluded. The remaining clinical laboratory data
records were reviewed for data quality.
Each of the laboratory test record in the clinical laboratory dataset was standardized to a LOINC
code using the mapping file developed by 3M HIS specific to the hospitals within each health
system and to the children’s hospitals. Inconsistent laboratory test results were then identified
and excluded according to the following criteria:
• The number of clinical laboratory data records for the LOINC code for the specified
clinical laboratory data element were not provided for more than one of the three health
systems or two children’s hospital
• The LOINC code values were missing or coded as “unknown”
• Extreme variation or errors values for the specific laboratory test results.
3M Health Information Systems Page 10
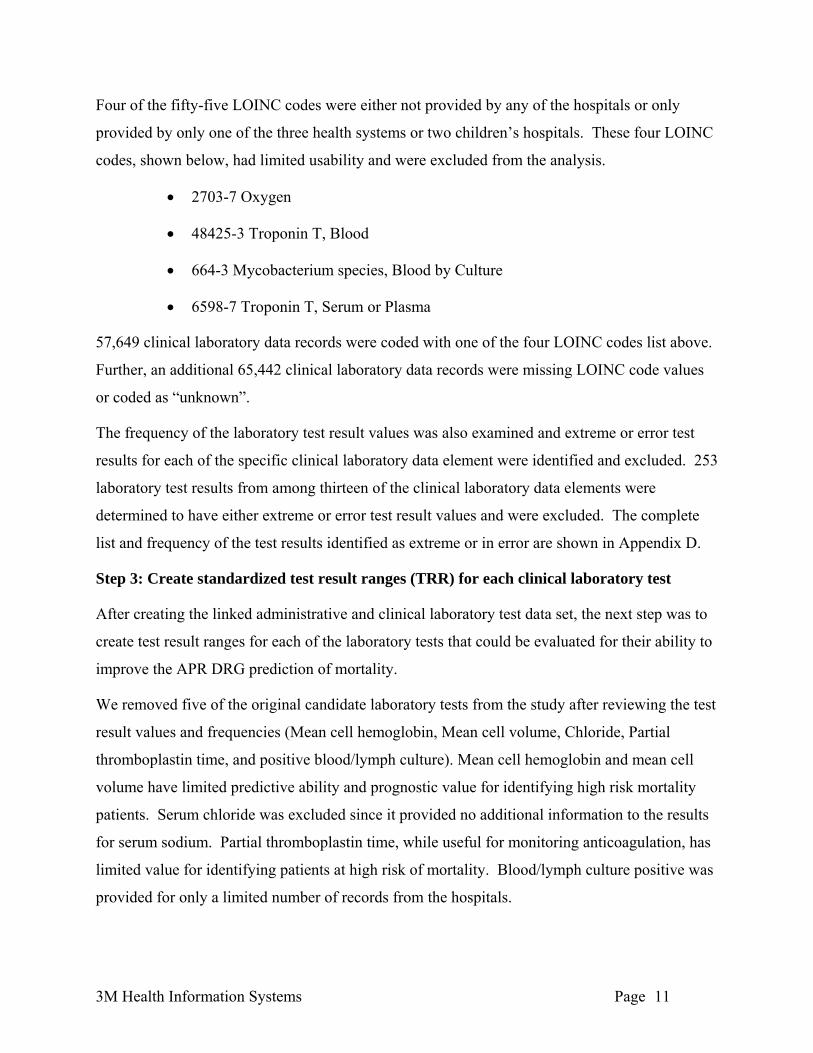
Four of the fifty-five LOINC codes were either not provided by any of the hospitals or only
provided by only one of the three health systems or two children’s hospitals. These four LOINC
codes, shown below, had limited usability and were excluded from the analysis.
• 2703-7 Oxygen
• 48425-3 Troponin T, Blood
• 664-3 Mycobacterium species, Blood by Culture
• 6598-7 Troponin T, Serum or Plasma
57,649 clinical laboratory data records were coded with one of the four LOINC codes list above.
Further, an additional 65,442 clinical laboratory data records were missing LOINC code values
or coded as “unknown”.
The frequency of the laboratory test result values was also examined and extreme or error test
results for each of the specific clinical laboratory data element were identified and excluded. 253
laboratory test results from among thirteen of the clinical laboratory data elements were
determined to have either extreme or error test result values and were excluded. The complete
list and frequency of the test results identified as extreme or in error are shown in Appendix D.
Step 3: Create standardized test result ranges (TRR) for each clinical laboratory test
After creating the linked administrative and clinical laboratory test data set, the next step was to
create test result ranges for each of the laboratory tests that could be evaluated for their ability to
improve the APR DRG prediction of mortality.
We removed five of the original candidate laboratory tests from the study after reviewing the test
result values and frequencies (Mean cell hemoglobin, Mean cell volume, Chloride, Partial
thromboplastin time, and positive blood/lymph culture). Mean cell hemoglobin and mean cell
volume have limited predictive ability and prognostic value for identifying high risk mortality
patients. Serum chloride was excluded since it provided no additional information to the results
for serum sodium. Partial thromboplastin time, while useful for monitoring anticoagulation, has
limited value for identifying patients at high risk of mortality. Blood/lymph culture positive was
provided for only a limited number of records from the hospitals.
3M Health Information Systems Page 11

The research team reviewed the distribution of test results for each individual LOINC code
across hospitals and determined that the variation in both the reference (normal) ranges and the
overall distribution of results was not significant. Therefore, the normal ranges did not require
modification in order to be comparable across hospitals, and the actual numeric laboratory test
result values were used directly in the analysis.
For each of the clinical laboratory data elements retained in the study, we categorized the test
results into clinically determined ranges test result range (TRR) categories, based on clinical
judgment and literature review2,3,4. The highest number of abnormal test result ranges defined
for a clinical laboratory data element was six. The normal test result ranges were labeled
“NTRR”, and the six abnormal test result ranges were labeled “ABNTRR1” through
“ABNTRR6”. For example, the normal test result range for sodium is defined as 135-145. We
defined five additional abnormal test result range categories for sodium: less than 130, 130-135,
145-150, 150-155, and greater than 155. The standardized normal and abnormal test result ranges
for each of the clinical laboratory data elements is detailed in Appendix E.
We hypothesized that the test ranges that deviated most from normal would tend to correlate
with higher mortality rates. We tested this hypothesis by examining the ability of TRRs for each
laboratory test to predict mortality when combined with APR DRGs.
We agreed with the overall philosophical approach of prior research that used laboratory values
for improved risk of mortality prediction based on diagnoses/procedures present on admission,
the challenge was in operationalizing this approach. There are several possible methods for
selecting an admission laboratory value, including 1) the first test result value available; 2) the
first test result available as long as it occurs in the first 48 hrs; or 3) the nearest normal or the
most abnormal result in the first 48 hrs if more than one laboratory result is available.
Since the admission date was not provided as a data element in the administrative dataset, we did
not know if a test was performed within 48 hours of admission. Therefore, for patient discharges
2 Abt Associates, Inc. Adding Clinical Data Elements to Administrative Data for Hospital-level Reporting: Final Report AHRQ Contract # 233-02-0088, Task Order 13. July 3, 2006 3 Pine M, Jordan HS, Elixhauser A, et. al. Enhancement of Claims Data to Improve Risk Adjustment of Hospital Mortality. JAMA 297 (1): 71-76; January 3, 2007. 4 Pine M, Jordan HS, Elixhauser A, et al. Modifying ICD-9 Coding of secondary diagnoses to improve the risk adjustment of inpatient mortality rates. Medical Decision Making 2009 Jan-Feb; 29 (1): 69-81
3M Health Information Systems Page 12
with multiple test results for the same clinical laboratory data element, we selected the first test
result available to be included in the clinical laboratory data analysis file.
This strategy of selecting only a single result from each hospitalization for each of the laboratory
tests yielded at total of 6,506,941 (from the total file of over 11 million) records from 16 Florida
hospitals in the final clinical laboratory data analysis file. If a patient did not have a specific
laboratory test performed during the hospitalization, the patient was assigned to the “No Data”
test result range category for purposes of the analysis for that specific laboratory data element.
By creating this “No Data” test result range category, all the administrative data could be used in
the analysis and the results would be more consistent across the various clinical laboratory data
elements.
Step 4: Identify the subset of clinical laboratory test results that improve the performance
of APR DRGs for predicting inpatient mortality
The next step was to determine which of the laboratory tests and their test result ranges added
predictive value to the existing APR DRGs, and to incorporate them into the APR DRG logic.
Risk adjusted models were created and analyzed using the following hospital administrative and
clinical laboratory dataset models:
• Model A – the Discharge APR DRG and risk of mortality subclass assignment based on
administrative data elements including principal and all secondary diagnosis, procedures,
age, gender, and patient discharge status; no clinical laboratory data
• Model B - the Admission APR DRG and risk of mortality subclass assignment based on
the same administrative data elements for Model A plus the present on admission (POA)
indicator for each secondary diagnosis and the number of days after admission each
procedure is performed; no clinical laboratory data
• Model C – the Admission APR DRG and risk of mortality subclass used in Model B data
plus test results for each of the selected laboratory clinical data elements
We used the APR DRG version 26.1 software to assign each discharge in the administrative
dataset both a Discharge APR DRG and risk of mortality subclass, as well as an Admission APR
DRG and risk of mortality subclass. Because we were primarily interested in the impact of
adding clinical laboratory data elements to the risk of mortality at the time of admission, we used
3M Health Information Systems Page 13

Admission APR DRG and risk of mortality (“Model B”) as the basic risk adjustment model for
the development of model “C”. We then examined the effect of individual laboratory tests and
test result ranges within various patient groups, including individual APR DRGs, entire Major
Diagnostic Categories (MDC), all surgical APR DRGs or all medical APR DRGs, or the entire
patient population, in order to identify those laboratory tests associated with of higher risk of
mortality. Indirect rate standardization was used to generate a set of reports that were used to
evaluate the impact of clinical laboratory data on the four risk of morality subclasses. (Technical
specifications for the indirect rate standardization are found in Appendix F.) The clinical
hypothesis tested was that for certain categories of patients the risk of mortality subclass could
be increased based on the value of specific clinical laboratory results.
We developed separate clinical models for each of the laboratory data elements by calculating
the mortality rate for each TRR within each ROM subclass for each category of cases. In
addition we calculated an “impact factor” index for each TRR on each of the 4 ROM subclasses.
The impact factor index was a generated by interpolating the mortality rate created by TRR in
each ROM subclass between the mortality rate of the ROM subclass that would be expected
without using laboratory data (e.g. the mortality rate resulting from Model “B”) and the expected
mortality rate of the next highest ROM subclass. For example, if the mortality rate calculation
for the TRR for pH < 7.10 in ROM subclass 1 was 15%, and the expected mortality rate derived
from Model “B” for ROM 1 was 10%, and the expected mortality rate for ROM 2 was 20%, the
impact factor would be 1.5, since the mortality rate increase due to the TRR for the low pH was
50% of the way between ROM 1 and ROM 2. The clinical panel then reviewed the resulting
reports to determine which specific laboratory TRRs should be used to alter the risk of mortality
subclass for specific type of cases.
The clinical panel focused on those TRR and ROM subclass combinations with at least 20 cases
and with an impact factor that was at least 50% higher than the expected value derived from
Model “B” (e.g., >1.5 for ROM 1, >2.5 for ROM 2, etc).
The following format was used to evaluate each clinical laboratory abnormal test result ranges:
Test Result RangeOcurrence
ROM 1
Mortality Rate ROM
1
Impact Measure ROM 1
Ocurrence ROM 2
Mortality Rate ROM
2
Impact Measure ROM 2
Ocurrence ROM 3
Mortality Rate ROM
3
Impact Measure ROM 3
Ocurrence ROM 4
Mortality Rate ROM
4
Impact Measure ROM 4
3M Health Information Systems Page 14
where “Occurrence” is the number of patients in each risk of mortality subclass, “Mortality
Rate” is the percent of patients who died in each APR DRG risk of mortality subclass and
“Impact Measure” is a relative measure of the impact on the likelihood of dying of patients
assigned to each of the four APR DRG risk of mortality subclasses. The Impact Measure is in
the format of X.Y where X is the estimated risk of mortality subclass value from the data and Y
is an interpolation of the estimated risk of mortality subclass value and the next higher risk of
mortality subclass value (e.g., a 3.2 means that the subset patients with the laboratory test result
in the specified range have a risk of mortality that is 20 percent of the way between the risk of
mortality for patients in APR DRG subclass 3 and APR DRG subclass 4). The rows in the
analysis are the different ranges of the laboratory test result being examined.
Reports for each clinical laboratory data element were generated in the form at described above
with the test result range categories in the rows of the reports. The rows on the reports were
summarized by four specific case type aggregation levels: 1) overall, 2) cases defined as medical
or surgical based on the APR DRG assignment, 3) MDC, and 4) base Admission APR DRG. By
aggregating the reports by the various types of cases, the clinical review of the results can
determine if the laboratory test result range related adjustments to the APR DRG risk of
mortality algorithm should be made for specific risk of mortality levels, for specific test result
range categories, or diseases specific at either the MDC or base Admission APR DRG level.
Step 5: Assess the overall incremental improvement due to the addition of the clinical
laboratory test results on the performance of APR DRGs for predicting inpatient mortality
The literature which assesses the ability of various models to predict mortality relies on two
basic statistics, reduction of variance (R2) and the area under the receiver operating
characteristics (ROC) curve. In order to be consistent with this literature, the same two statistics
were used for evaluating the ability of the APR DRG system to predict inpatient mortality with
Florida data.
Case-level comparison of the baseline model A (using only administrative data) to model “B”
(including the secondary diagnosis present on admission indicator) and model “C” (combining
model B with laboratory test results) were performed using the c-statistic and R2. The c-statistic
summarizes the ability of the Admission APR DRG and risk of mortality models to discriminate
between patients that were discharged alive or dead. The R2 also summarizes the degree of error
3M Health Information Systems Page 15
inherent in the Admission APR DRG and risk of mortality models’ ability to predict individual
deaths. The statistical formulas for the R2 and c-statistic calculations are shown in Appendix G.
In order to understand the interpretation of the c-statistic, assume that patients are separated into
two groups comprising those who died and those who survived. If a patient is drawn from each
group at random, then each of these patients will have an associated APR DRG and each APR
DRG will have an associated mortality rate (i.e., fraction of patients who die). The c-statistic is
the probability that the mortality rate in the APR DRG assigned to the patient who died is higher
than the mortality rate in the APR DRG assigned to the patient who lived
The research team next incorporated the results of the analysis into an APR DRG research
prototype grouper. Each model was run against the Florida analysis dataset. Case level c-
statistics and R2 were computed for each model separately. These reports and statistics were
reviewed by the clinical panel to determine which clinical laboratory attributes should be
recommend for incorporation into the APR DRG risk of mortality model. Once the individual
clinical laboratory data element models for inclusion into the APR DRG model were identified,
the APR DRG research prototype was developed to include all the additional recommended
clinical laboratory modifications for a final evaluation of Model “C”, and case level statistics
were recomputed.
RESULTS
APR DRG Classification of the Florida Administrative Discharge Analysis Dataset
The 188, 555 administrative records in the analysis file were grouped and assigned an Admission
and Discharge APR DRG and risk of mortality subclass. The administrative data is a full
abstract of nine months of hospital inpatient acute care discharge data and represents the
complete diversity of conditions, diseases and procedures encountered at these facilities. Table 4
contains ten examples of high volume base APR DRGs from the administrative discharge
analysis dataset that have relatively high mortality rates. The mortality rates for each risk of
morality level 1 through 4 are also shown in Table 4 along with the percent of discharges for that
base APR DRG that had one or more linked laboratory test record. The morality rates increase
monotonically as the risk of mortality level increases from 1 (minor) to 4 (extreme), as would be
expected based on results obtained previously from national databases.
3M Health Information Systems Page 16

Table 4: Number of Deaths for High Volume APR DRGs
Base APR DRG APR DRG description
Number of Discharges
Number of Discharges
DiedMortailty
Rate
Mortality Rate for ROM=1 Minor
Mortality Rate for ROM=2 Moderate
Mortality Rate for ROM=3 Major
Mortality Rate for ROM =4 Extreme
Percent of Discharges with
At Least One Lab Record
720 Septicemia & disseminated infections 2211 361 16.3% 0.4% 4.0% 9.5% 33.0% 87.3%133 Pulmonary edema & respiratory failure 1534 218 14.2% 1.0% 5.8% 11.8% 39.8% 85.8%137 Major respiratory infections & inflammations 1072 90 8.4% 0.0% 4.5% 9.2% 25.5% 90.9%190 Acute myocardial infarction 1975 100 5.1% 0.5% 0.8% 4.1% 25.6% 88.7%045 CVA & precerebral occlusion w infarct 1903 69 3.6% 1.2% 2.6% 6.3% 32.4% 91.2%221 Major small & large bowel procedures 1751 57 3.3% 0.6% 2.2% 8.7% 21.9% 90.3%460 Renal failure 2455 79 3.2% 0.0% 1.4% 5.6% 21.5% 91.8%248 Major gastrointestinal & peritoneal infections 1187 34 2.9% 0.4% 1.7% 6.2% 23.5% 79.0%174 Percutaneous cardiovascular procedures w AMI 1261 30 2.4% 0.0% 0.5% 4.1% 27.3% 86.6%194 Heart failure 4426 99 2.2% 0.0% 1.0% 4.0% 12.8% 92.3%
Step 4: Identify the subset of clinical laboratory test results that improve the performance
of APR DRGs for predicting inpatient mortality
The administrative and clinical laboratory data was used to test and validate the clinical
hypothesis that for certain types of patients, the risk of mortality subclass could be increased
based on the value of specific clinical laboratory results. Using the indirect rate standardization
reports described above, each clinical laboratory test result range was evaluated to determine if a
laboratory test result in the specified range impacted the likelihood of dying and if the specified
laboratory test result range should be used to alter the risk of mortality level for specific types of
cases.
For example, Table 5 shows the section of this report for pH, aggregated by Medical (M) and
Surgical (S) case types. The clinical laboratory data element pH has six abnormal test result
range categories plus a normal test result range. Patients who did not have a pH test were
assigned to the “NoLab” test result range category. For pH < 7.10 medical cases in Table 5
below, there are 77 cases assigned to a risk of mortality subclass 1 (minor) with a mortality rate
of 1.3%. The mortality impact measure for these cases in risk of mortality subclass 1 is 2.61
indicating that these cases expected mortality rate is 61 percent of the difference between risk of
mortality subclass 2 (moderate) and 3 (major). The actual risk of mortality for these cases is
more like the expected mortality for subclass 2 or 3. As a result of this data medical patient
assigned to risk of mortality subclass 1 who had a PH<7.10 were promoted to a risk of mortality
subclass of 2. This pattern is consistent with the surgical cases as well even though the volume
of cases was lower for surgical cases.
3M Health Information Systems Page 17
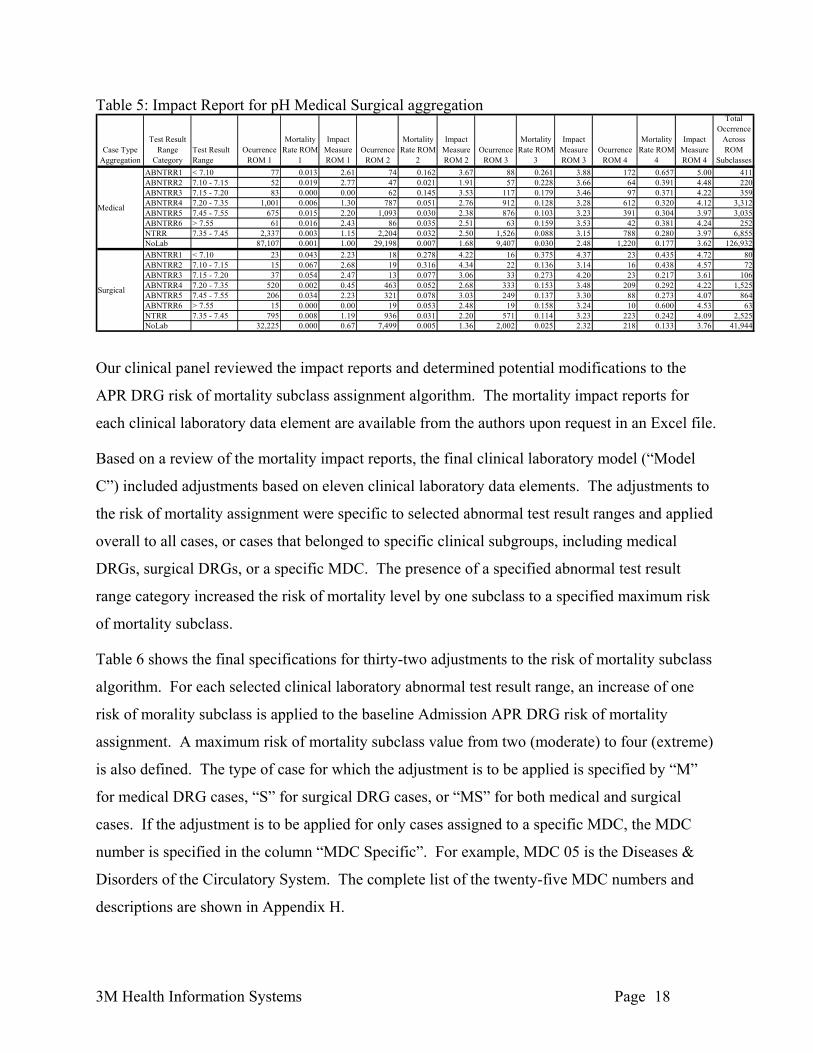
Table 5: Impact Report for pH Medical Surgical aggregation
Case Type Aggregation
Test Result Range
CategoryTest Result Range
Ocurrence ROM 1
Mortality Rate ROM
1
Impact Measure ROM 1
Ocurrence ROM 2
Mortality Rate ROM
2
Impact Measure ROM 2
Ocurrence ROM 3
Mortality Rate ROM
3
Impact Measure ROM 3
Ocurrence ROM 4
Mortality Rate ROM
4
Impact Measure ROM 4
Total Occrrence
Across ROM
SubclassesABNTRR1 < 7.10 77 0.013 2.61 74 0.162 3.67 88 0.261 3.88 172 0.657 5.00 411ABNTRR2 7.10 - 7.15 52 0.019 2.77 47 0.021 1.91 57 0.228 3.66 64 0.391 4.48 220ABNTRR3 7.15 - 7.20 83 0.000 0.00 62 0.145 3.53 117 0.179 3.46 97 0.371 4.22 359ABNTRR4 7.20 - 7.35 1,001 0.006 1.30 787 0.051 2.76 912 0.128 3.28 612 0.320 4.12 3,312ABNTRR5 7.45 - 7.55 675 0.015 2.20 1,093 0.030 2.38 876 0.103 3.23 391 0.304 3.97 3,035ABNTRR6 > 7.55 61 0.016 2.43 86 0.035 2.51 63 0.159 3.53 42 0.381 4.24 252NTRR 7.35 - 7.45 2,337 0.003 1.15 2,204 0.032 2.50 1,526 0.088 3.15 788 0.280 3.97 6,855NoLab 87,107 0.001 1.00 29,198 0.007 1.68 9,407 0.030 2.48 1,220 0.177 3.62 126,932ABNTRR1 < 7.10 23 0.043 2.23 18 0.278 4.22 16 0.375 4.37 23 0.435 4.72 80ABNTRR2 7.10 - 7.15 15 0.067 2.68 19 0.316 4.34 22 0.136 3.14 16 0.438 4.57 72ABNTRR3 7.15 - 7.20 37 0.054 2.47 13 0.077 3.06 33 0.273 4.20 23 0.217 3.61 106ABNTRR4 7.20 - 7.35 520 0.002 0.45 463 0.052 2.68 333 0.153 3.48 209 0.292 4.22 1,525ABNTRR5 7.45 - 7.55 206 0.034 2.23 321 0.078 3.03 249 0.137 3.30 88 0.273 4.07 864ABNTRR6 > 7.55 15 0.000 0.00 19 0.053 2.48 19 0.158 3.24 10 0.600 4.53 63NTRR 7.35 - 7.45 795 0.008 1.19 936 0.031 2.20 571 0.114 3.23 223 0.242 4.09 2,525NoLab 32,225 0.000 0.67 7,499 0.005 1.36 2,002 0.025 2.32 218 0.133 3.76 41,944
Medical
Surgical
Our clinical panel reviewed the impact reports and determined potential modifications to the
APR DRG risk of mortality subclass assignment algorithm. The mortality impact reports for
each clinical laboratory data element are available from the authors upon request in an Excel file.
Based on a review of the mortality impact reports, the final clinical laboratory model (“Model
C”) included adjustments based on eleven clinical laboratory data elements. The adjustments to
the risk of mortality assignment were specific to selected abnormal test result ranges and applied
overall to all cases, or cases that belonged to specific clinical subgroups, including medical
DRGs, surgical DRGs, or a specific MDC. The presence of a specified abnormal test result
range category increased the risk of mortality level by one subclass to a specified maximum risk
of mortality subclass.
Table 6 shows the final specifications for thirty-two adjustments to the risk of mortality subclass
algorithm. For each selected clinical laboratory abnormal test result range, an increase of one
risk of morality subclass is applied to the baseline Admission APR DRG risk of mortality
assignment. A maximum risk of mortality subclass value from two (moderate) to four (extreme)
is also defined. The type of case for which the adjustment is to be applied is specified by “M”
for medical DRG cases, “S” for surgical DRG cases, or “MS” for both medical and surgical
cases. If the adjustment is to be applied for only cases assigned to a specific MDC, the MDC
number is specified in the column “MDC Specific”. For example, MDC 05 is the Diseases &
Disorders of the Circulatory System. The complete list of the twenty-five MDC numbers and
descriptions are shown in Appendix H.
3M Health Information Systems Page 18

Table 6: Clinical Laboratory Model Adjustment Specifications
Clinical Laboratory Model Adjustment
TRR Description
Max ROM
Medical / Sugical Type
MDC Specific
Number of ROM Impacted
Cases
Percent of Cases
with ROM
ImpactedSGOT 300 - 2000 3 MS 1,057 0.56%SGOT > 2000 3 MS 68 0.04%Sodium 150 - 155 2 MS 160 0.08%Sodium > 155 2 MS 37 0.02%Sodium < 130 3 M 05 416 0.22%pH < 7.10 4 MS 454 0.24%pH 7.10 - 7.15 3 S 65 0.03%pCO2 < 27 3 S 246 0.13%pCO2 < 27 3 M 01 25 0.01%pCO2 < 27 3 M 04 106 0.06%pCO2 < 27 3 M 05 53 0.03%pCO2 < 27 4 M 06 71 0.04%pCO2 < 27 4 M 07 60 0.03%pCO2 < 27 4 M 18 61 0.03%pCO2 60 - 65 3 MS 612 0.32%pCO2 > 65 3 MS 755 0.40%Albumin < 2.4 3 MS 6,655 3.53%Total bilrubin fractions 10 - 20 3 MS 1,078 0.57%Total bilrubin fractions > 20 3 MS 99 0.05%Blood urea nitrogen 40 - 50 3 MS 4,912 2.61%Blood urea nitrogen > 50 3 MS 3,745 1.99%Platelets < 20 3 MS 579 0.31%Platelets 20 - 60 3 S 240 0.13%White blood cell count < 1 3 MS 468 0.25%White blood cell count 40 - 100 4 MS 545 0.29%White blood cell count > 100 4 MS 56 0.03%Bicarbonate < 10 4 MS 393 0.21%Bicarbonate 10 - 15 4 MS 766 0.41%Bicarbonate 35 - 45 3 MS 556 0.29%Bicarbonate > 45 3 MS 72 0.04%SGPT 300 - 2000 3 MS 1,246 0.66%SGPT > 2000 3 MS 98 0.05%
3M Health Information Systems Page 19

From Table 6, patients with a sodium test result less than 130 would have their admission risk of
mortality subclass increased one level up to a maximum risk of mortality subclass of 3, applied
only to those cases assigned to a medical APR DRG in MDC 5. This specific adjustment for
sodium less than 130 increased the risk of mortality by one subclass for 416 (0.22%) patients.
Overall, 18,057 (9.58%) patients were impacted by the addition of clinical laboratory data
elements in the Admission APR DRG risk of mortality assignment. Blood urea nitrogen,
Albumin and pCO2 made up the vast majority of changes to the Admission APR DRG risk of
mortality assignment representing 8,657, 6,655, and 1,989 patients, respectively.
Step 5: Assess the overall incremental improvement due to the addition of the clinical
laboratory test results on the performance of APR DRGs for predicting inpatient mortality
The c-statistic and R2 for mortality was computed based on the APR DRG and risk of mortality
classification as defined by the three clinical models A, B and C as described in the methods
section. The third clinical model “C” incorporates the selected clinical laboratory data
adjustments specified above in Table 6. Table 7 shows the c-statistic and R2 for mortality for the
three clinical models. The removal of post-admission complications from the APR DRG and
ROM assignment in clinical model “A” to clinical model “B” results in a percent decrease of
1.23% and 12.66% in the c-statistic and R2, respectively. The addition of the clinical laboratory
data to the assignment of the Admission APR DRG and ROM subclass in model “C” relative to
model “B” resulted in a percent increase of 0.574% and 4.53% in the c-statistic and R2
respectively.
Table 7: Clinical Model C-Statistic and R2 Results
Clinical Model C Statistic R2
A. Discharge APR DRG ROM 0.9652 0.2290
B. Admission APR DRG ROM 0.9532 0.2000
C. Lab Adjusted Admission APR DRG ROM 0.9587 0.2091
For each of the clinical laboratory adjustment contained in Table 6, the c-statistic and R2 was
independently calculated and the results for each clinical laboratory adjustment for the final
3M Health Information Systems Page 20

clinical laboratory model (“Model C”) are shown in Table 8. The percent change in c-statistic
and R2 from the Admission APR DRG ROM clinical model (“Model B”) were reviewed. Four
clinical laboratory data element abnormal TRR category adjustment specifications had the
largest impact on the overall increase in the results. pH < 7.1, Bicarbonate 10-15 and < 10, and
Blood urea nitrogen had a percent increase in R2 of 4.41, 3.16, 2.86 and 1.07 respectively.
Table 8 Final Simulation Results C-Statistic and R2
Clinical Laboratory Model Adjustment
TRR Description
Max ROM
Medical / Sugical Type
MDC Specific C Stat R2
Percent Change
from Admission APR DRG
C Stat
Percent Change
from Admission APR DRG
R2SGOT 300 - 2000 3 MS 0.9542 0.2015 0.105 0.731SGOT > 2000 3 MS 0.9535 0.2004 0.023 0.204Sodium 150 - 155 2 MS 0.9533 0.2001 0.002 0.029Sodium > 155 2 MS 0.9533 0.2000 0.011 0.022Sodium < 130 3 M 05 0.9534 0.2000 0.012 0.006pH < 7.10 4 MS 0.9556 0.2088 0.247 4.406pH 7.10 - 7.15 3 S 0.9538 0.2010 0.062 0.523pCO2 < 27 3 S 0.9546 0.2016 0.138 0.782pCO2 < 27 3 M 01 0.9533 0.2001 0.003 0.049pCO2 < 27 3 M 04 0.9534 0.2001 0.012 0.033pCO2 < 27 3 M 05 0.9533 0.2000 0.005 0.017pCO2 < 27 4 M 06 0.9535 0.2006 0.025 0.313pCO2 < 27 4 M 07 0.9534 0.2009 0.011 0.434pCO2 < 27 4 M 18 0.9534 0.2008 0.011 0.390pCO2 60 - 65 3 MS 0.9539 0.2007 0.070 0.361pCO2 > 65 3 MS 0.9550 0.2017 0.182 0.847Albumin < 2.4 3 MS 0.9562 0.2017 0.309 0.869Total bilrubin fractions 10 - 20 3 MS 0.9539 0.2005 0.067 0.268Total bilrubin fractions > 20 3 MS 0.9536 0.2002 0.036 0.118Blood urea nitrogen 40 - 50 3 MS 0.9550 0.2015 0.185 0.734Blood urea nitrogen > 50 3 MS 0.9556 0.2021 0.242 1.067Platelets < 20 3 MS 0.9539 0.2009 0.072 0.446Platelets 20 - 60 3 S 0.9537 0.2009 0.044 0.468White blood cell count < 1 3 MS 0.9537 0.2001 0.047 0.035White blood cell count 40 - 100 4 MS 0.9543 0.2015 0.106 0.754White blood cell count > 100 4 MS 0.9532 0.2000 0.000 0.025Bicarbonate < 10 4 MS 0.9547 0.2057 0.154 2.858Bicarbonate 10 - 15 4 MS 0.9558 0.2063 0.267 3.158Bicarbonate 35 - 45 3 MS 0.9538 0.2004 0.059 0.186Bicarbonate > 45 3 MS 0.9534 0.2001 0.014 0.031SGPT 300 - 2000 3 MS 0.9545 0.2017 0.131 0.866SGPT > 2000 3 MS 0.9539 0.2007 0.065 0.338
3M Health Information Systems Page 21

DISCUSSION
Because of the increasing importance and scrutiny of public reporting of inpatient outcomes and
pay-for-performance initiatives, the risk adjustment method used in the comparison hospital
outcome rates such as mortality must accurately describe a hospital’s case mix. Applications of
risk adjusted mortality rates currently use the discharge APR DRG and risk of mortality subclass
that includes all secondary diagnosis including those that develop during the hospital stay.
However, the assessment of inpatient risk of mortality should ideally be based on a patient’s
condition at the time of admission. The challenge is to give hospitals credit for diseases and
conditions that represent a natural progression of the patient's underlying problem, but not to
give credit for preventable complications. In this study, to partially address this issue, the
Admission APR DRG and risk of mortality subclass was computed using the present on
admission indicator in order to remove any bias introduced by the inclusion of preventable
complications in the risk assessment (partially in the sense that there may be some secondary
diagnoses that occur after admission that should be included in the ROM assessment). While the
statistical performance of the Admission APR DRG is lower than the Discharge APR DRG, the
decrease in predictive power is relatively small and the APR DRG risk of mortality adjustment
remained high even when the confounding effect of post admission complications was removed.
In large measure this is due to the fact that the APR DRGs are a detailed clinical model and, for
example, take into account the interaction between secondary diagnoses. The slight reduction in
predictive power for the Admission APR DRG risk of mortality demonstrates that the models
based on APR DRG risk of mortality derive their predictive power primarily from the diagnostic
information present at admission and clinical stratification, and not from post admission
complications. An important evaluation criteria for any risk of mortality system, is the extent to
which the statistical performance of the system is dependent on the inclusion of post admission
complications.
Since laboratory test results are not currently collected in administrative data, there will be
considerable effort and cost associated with any mandate to report laboratory test results. To
justify such costs the operational value of the laboratory test results must be demonstrated. This
study demonstrated the value of selected laboratory results for enhancing the prediction of
patient mortality. This preliminary study identified laboratory tests that are relevant for APR
DRG Risk of Morality prediction and therefore should constitute the minimum scope of
3M Health Information Systems Page 22

laboratory test results that are included in any mandated collection of selected laboratory test
results.
In order to facilitate the collection of selected laboratory test results, this type of additional
information could be collected in a manner more consistent with the existing ICD-9-CM
diagnosis coding and reporting practices. A discrete set of “codes” could be defined for a select
set of laboratory test results to provide a means for collecting additional patient characteristics in
a way that does not require existing claims forms or claims processing systems to be modified.
Limitations
Although the study database included 188,555 patients with both administrative and clinical
laboratory test results, some laboratory tests are relatively infrequently performed. To fully
evaluate such laboratory test results, a larger data sample would be required. The evaluation of
the use of laboratory data for mortality prediction was done in the context of APR DRGs and the
conclusions may not apply to other methods of mortality risk adjustment. However, given the
comprehensive logic of APR DRGs the laboratory results found to provide additional
explanatory power are likely to apply to any risk of mortality model based on administrative
data. However, the converse is not necessarily true. Laboratory results found not to provide
additional explanatory power in the context of APR DRGs may add additional explanatory
power to less comprehensive models of risk of mortality based on administrative data. As with
any analysis based on administrative data, the study results are affected by the accuracy and
completeness of the diagnosis, procedure, and POA coding. In order to use laboratory data to
identify risk of mortality at admission, the computerized record will need to contain information
about when during the hospitalization the lab test was performed. A lab value obtained in the
first 1 or 2 days of hospitalization should adequately reflect the patient’s condition at the time of
admission. If the test was first obtained later in the stay, however, it may mean that it was
ordered in response to a post-admission complication or deterioration, and would not reflect the
patient’s risk of mortality at admission.
Although our goal was to enhance the performance of the Admission APR DRG and risk of
mortality and to therefore use laboratory tests obtained near the time of admission, this could not
always be the case. Although some types of laboratory tests are done routinely on admission
(sodium, creatinine, hematocrit), others, such as pH or pO2 may be done only in patients who are
3M Health Information Systems Page 23
either seriously ill at the time of admission or who became ill during the hospitalization. In the
former case, the fact that a particular lab test was ordered at all may be an indicator that the
patient was thought to be seriously ill, and the fact that the test was obtained in the first place
could have as much significance as if it were abnormal. In the latter case (lab test ordered after
admission), the abnormal lab test may be a marker for hospital acquired complications rather
than a reflection of the clinical state at the time of admission. This situation can be rectified if
the number of days (hours) between when the patient is admitted and when each lab test was
obtained are made available.
CONCLUSIONS
The results of this study demonstrate that selected clinical laboratory data elements added to
administrative data can improve the accuracy of the risk adjustment models for comparing
hospital mortality rates. The laboratory test results that were found to contribute to increased
predictive power were consistent with clinical expectations and constitute a relatively small
number of laboratory test results that are indicative of acute disease. The addition of eleven
clinical laboratory test results to the assignment of the admission APR DRG risk of mortality
increased the c-statistic and R2 by 0.574 percent and 4.53 percent, respectively. Risk of mortality
models are in the midst of significant evolution. The emergence of the POA indicator in the past
year along with the incorporation of selected clinical data elements such as laboratory test results
can lead to more valid and stable assessments of risk of mortality at admission.
3M Health Information Systems Page 24

Appendix A Frequency of Laboratory Test Records Provided by Health System/Children’s
Hospital
LOINC Code LOINC Description Clinical Laboratory Data Element Total
All Childrens Bay Care
Broward Health Memorial
Miami Childrens
1742-6 Alanine Aminotransferase SGOT 184,819 0 117,262 58,449 9,099 713969-1 Creatine Kinase MB CPK MB 95,094 57 59,988 35,027 22 02823-3 Potassium Potassium 460,268 21,708 261,075 151,247 23,898 1,3732951-2 Sodium Sodium 448,449 21,756 256,223 146,276 23,423 45248425-3 Troponin T, Blood Troponin T6598-7 Troponin T, Serum or Plasma Troponin T 14,012 0 0 0 14,012 010839-9 Troponin I Troponin I 100,017 406 62,138 37,420 53 02744-1 pH, Arterial Blood pH 71,652 1,426 43,659 22,599 3,968 02745-8 pH, Capillary Blood pH 2,350 2,350 0 0 0 02746-6 pH, Venous Blood pH 141 141 0 0 0 02708-6 Oxygen Saturation, Arterial Blood PO2.sat 33,639 1,390 14,336 17,913 0 02709-4 Oxygen Saturation, Capillary Blood PO2.sat 1,795 1,795 0 0 0 02711-0 Oxygen Saturation, Venous Blood PO2.sat 67 67 0 0 0 02713-6 Oxygen Saturation, Calculated PO2.sat 0 0 0 0 02019-8 Carbon Dioxide, Arterial Blood pCO2 72,616 1,398 43,640 23,612 3,966 02020-6 Carbon Dioxide, Capillary Blood pCO2 2,341 2,341 0 0 0 02021-4 Carbon Dioxide, Venous Blood pCO2 85 85 0 0 0 05902-2 Prothrombin Time Prothrombin Time 58,144 2,305 0 43,694 11,002 6461751-7 Albumin Albumin 198,307 10,072 118,027 60,020 9,124 64711555-0 Base Excess, Blood Base Excess 0 0 0 0 01925-7 Base Excess, Arterial Blood Base Excess 29,022 1,459 0 23,598 3,965 01926-5 Base Excess, Capillary Blood Base Excess 2,354 2,354 0 0 0 01927-3 Base Excess, Venous Blood Base Excess 141 141 0 0 0 01975-2 Bilirubin Total bilrubin fractions 198,395 10,889 118,964 57,897 9,104 93617861-6 Calcium Calcium (total) 445,370 21,166 254,625 145,965 23,455 9017863-2 Ionized Calcium, Serum grams Calcium (ionized) 6,560 0 5,191 1,369 0 01994-3 Ionized Calcium, Blood moles Calcium (ionized) 14,406 14,347 0 0 0 401995-0 Ionized Calcium, Serum moles Calcium (ionized) 0 0 0 0 034581-9 Ionized Calcium, Arterial Blood moles Calcium (ionized) 430 0 0 0 430 02160-0 Creatinine Creatinine 446,598 21,276 255,025 145,859 23,418 5802345-7 Glucose Glucose 446,099 21,087 253,255 146,722 23,652 7826768-6 Alkaline Phosphatase Alkaline phosphatase 202,134 8,475 117,174 58,299 18,160 153094-0 Urea Nitrogen Blood urea nitrogen 444,397 21,196 253,677 145,680 23,421 2534544-3 Hematocrit Hematocrit 504,595 19,531 293,606 158,486 32,566 220785-6 Mean Cell Hemoglobin Mean cell Hemoglobin 466,044 17,904 264,996 154,009 29,130 3787-2 Mean Cell Volume Mean Cell volume 466,045 17,904 264,995 154,012 29,130 2777-3 Platelets, automated count Platelets 471,195 18,537 266,496 154,675 29,363 1,148778-1 Platelets, manual count Platelets 103 0 0 0 3 606690-2 Leukocytes, automated count White blood cell count 469,471 17,905 265,106 154,877 29,125 1,295804-5 Leukocytes, manual count White blood cell count2075-0 Chloride Chloride 447,104 21,224 255,787 146,019 23,380 38514627-4 Bicarbonate, Venous Blood Bicarbonate 140 140 0 0 0 01959-6 Bicarbonate, Blood Bicarbonate 0 0 0 0 01960-4 Bicarbonate, Arterial Blood Bicarbonate 74,661 1,458 45,639 23,599 3,965 01961-2 Bicarbonate, Capillary Blood Bicarbonate 2,085 2,085 0 0 0 02324-2 Gamma Glutamyl Transferase Gamma Glutamyl Transferase 2,470 121 717 1,572 60 01920-8 Aspartate Aminotransferase SGPT 184,886 0 117,269 58,514 9,096 42777-1 Phosphorous Phosphorous 55,088 7,173 27,729 18,706 1,129 193718-7 Hemoglobin Total Hemoglobin 485,406 0 293,373 158,698 32,482 47214979-9 Partial Thromboplastin Time Partial thromboplastin time 98,731 2,813 55,356 30,496 8,979 560533-0 Mycobacterium species, Blood by Culture Blood/Lymph Culture-Positive 0 0 0 0 0600-7 Bacteria, Blood by Culture Blood/Lymph Culture-Positive 2,758 591 0 0 2,167601-5 Fungus, Blood by Culture Blood/Lymph Culture-Positive 0 1 0 0 02703-7 Oxygen 43,637 0 43,637 0 0 0664-3 Gram StainUnknown Unknown 65,267 0 65,267 0 0 0Blank Blank 175 0 0 0 0 175
Number of Laboratory Test Records
3M Health Information Systems Page 25

Appendix B Frequency of Discharges with One or More Laboratory Data Records by
Health System/Children’s Hospital
All Children’s Hospital
Year Quarter
Number of Administrative
Discharges
Number of Discharges with One or More
Laboratory Data Record
Percent of Discharges with One or More Laboratory
Data Record
2007 2 1,961 1,603 81.72007 3 1,885 1,572 83.42007 4 2,101 1,686 80.2
All Children's Hospital
Memorial Health System
Year Quarter
Number of Administrative
Discharges
Number of Discharges with One or More
Laboratory Data Record
Percent of Discharges with One or More
Laboratory Data Record Memorial - Memorial Hospital Miramar 2007 2 2,256 1,723 76.4 2007 3 2,850 2,114 74.2 2007 4 3,036 775 25.5 Memorial - Memorial Hospital Pembroke 2007 2 1,678 1,565 93.3 2007 3 1,757 1,646 93.7 2007 4 1,750 630 36.0 Memorial - Memorial Hospital West 2007 2 6,666 5,230 78.5 2007 3 6,944 5,444 78.4 2007 4 6,795 2,051 30.2 Memorial - Memorial Regional Hospital 2007 2 8,750 6,090 69.6 2007 3 9,663 6,892 71.3 2007 4 9,988 2,814 28.2
3M Health Information Systems Page 26

Bay Care Health System
Year Quarter
Number of Administrative
Discharges
Number of Discharges with One or More
Laboratory Data Record
Percent of Discharges with One or More Laboratory
Data Record
2007 2 4,274 3,854 90.22007 3 4,168 3,734 89.62007 4 4,487 4,055 90.4
2007 2 1,598 1,544 96.62007 3 1,571 1,515 96.42007 4 1,624 1,543 95.0
2007 2 7,895 6,938 87.92007 3 7,803 6,921 88.72007 4 7,964 7,092 89.1
2007 1 1,262 0 0.02007 2 1,209 1,130 93.52007 3 1,181 1,171 99.22007 4 1,186 1,178 99.3
2007 2 1,451 1,362 93.92007 3 1,425 1,342 94.22007 4 1,648 1,550 94.1
2007 2 2,512 2,398 95.52007 3 2,840 2,697 95.02007 4 2,806 2,671 95.2
2007 2 11,653 10,081 86.52007 3 12,533 10,919 87.12007 4 13,028 11,300 86.7
BayCare - Mease Countryside Hospital
BayCare - South Florida Baptist Hospital
BayCare - St. Anthony's Hospital
BayCare - St. Joseph's Hospital
BayCare - Morton Plant Hospital
BayCare - Mease Dunedin Hospital
BayCare - Morton Plant North Bay Hospital
3M Health Information Systems Page 27

Broward Health System
Year Quarter
Number of Administrative
Discharges
Number of Discharges with One or More
Laboratory Data Record
Percent of Discharges with One or More
Laboratory Data Record Broward - Broward General Medical Center 2007 2 6,861 6,324 92.2 2007 3 7,243 6,606 91.2 2007 4 7,792 7,103 91.2 Broward - Coral Springs Medical Center 2007 2 3,089 2,705 87.6 2007 3 3,378 2,928 86.7 2007 4 3,409 2,929 85.9 Broward - Imperial Point Medical Center 2007 2 1,694 1,595 94.2 2007 3 1,781 1,677 94.2 2007 4 1,843 1,774 96.3 Broward - North Broward Medical Center 2007 2 3,250 3,188 98.1 2007 3 3,429 3,362 98.0 2007 4 3,441 3,388 98.5
Miami Children’s Hospital
Year Quarter
Number of Administrative
Discharges
Number of Discharges with One or More
Laboratory Data Record
Percent of Discharges with One or More
Laboratory Data Record Miami Children's Hospital 2008 1 3,042 0 0.0 2008 2 3,107 394 12.7 2008 3 2,776 408 14.7 2008 4 3,135 443 14.1
3M Health Information Systems Page 28
Appendix C Present on Admission Data Quality Screening Criteria
The diagnosis present on admission indicator is a key data element for assigning an
admission APR DRG for risk adjustment at the time of admission. To evaluate the
appropriateness of the use of the POA coding, the Florida administrative dataset needs to
be reviewed and hospitals with questionable POA data removed. To assist in developing
a methodology for data cleansing a data set, statistical analysis was performed on the
2005/2006 California data. From this analysis of the California data, a set of POA
screening criteria was developed and applied to the Florida administrative data to ensure
POA coding accuracy.
The POA screening criteria required the use of four different list of diagnosis codes. The
first set of codes contains a list of all secondary diagnosis codes identified as pre-existing
and should always or nearly always be coded as present on admission. Hospitals with a
low present on admission rate for these secondary diagnosis codes would be in question.
The second set of codes contains a list of all secondary diagnosis codes identified as
exempt defined in the national POA coding guidelines. These codes are usually either
present on admission or their present on admission status is not an important distinction
such as the V codes for need for vaccination, observe newborn, circumcision,
sterilization, et.al. Some of the exempt V codes provide information about the
circumstances of treatment such as no proc/contraindicated, lap surgery converted to
open surgery and POA would not have the same meaning as for diagnoses. The third list
of secondary diagnosis codes are perinatal codes 7600x-7799x. The fourth list of
secondary diagnosis codes contains codes that should have a relatively lower percentage
rate for being present on admission when they occur for elective surgical cases and
surgical cases that may be urgent but usually aren’t emergency situations. Hospitals with
a high present on admission percentage rate for these secondary diagnosis codes for these
surgical DRG cases would be in question. The codes contained in these four list are
available from the authors upon request.
Discharges from the administrative dataset for hospitals with poor quality coding of the
present on admission indicator were excluded from the administrative analysis dataset if:
3M Health Information Systems Page 29
• Hospitals with excessive numbers of pre-existing secondary diagnoses labeled
Not POA greater than or equal to 7.5%. This criterion identifies hospitals
with a high not POA rate for pre-existing secondary diagnosis codes. For
example, chronic conditions that could not have arisen after hospital
admission such as diabetes, chronic lung disease and malignancy.
• Hospitals with excessive numbers of secondary diagnoses with a POA
designation of “uncertain” greater than or equal to 10%. This criterion
identifies hospitals with a high uncertain present on admission rate for
secondary diagnosis codes (excluding exempt and pre-existing codes).
• Hospitals with a high percent of secondary diagnosis coded POA greater than
or equal to 96%. This criterion identifies hospitals with an extremely high
percent present on admission rate for secondary diagnosis codes (excluding
exempt, pre-existing, and OB 7600x-7799x codes).
• Hospitals with a low percent of secondary diagnosis coded POA less than or
equal to 70%. This criterion identifies hospitals with a low percent present on
admission rate for secondary diagnosis codes (excluding exempt, pre-existing,
and OB 7600x-7799x codes).
• Hospitals with excessive numbers of potential “false negatives” greater than
or equal to 40%. This criterion identifies hospitals with a high present on
admission percentage rate among secondary diagnosis codes from a list of
codes that were likely to be complications of surgery during the current
admission. A hospital was considered to have failed this criterion if the
percentage of secondary diagnoses from the following list of diagnosis codes
labeled POA was greater than or equal to 40%.
3M Health Information Systems Page 30

Appendix D List of Extreme Laboratory Test Results
Clinical Laboratory Data Element
Laboratory Test Result
Value
Number of Laboratory
Test Records
SGOT 0.00 20.00 90.00 21.00 11.20 10.00 2
201.00 1240.00 1
0.00 230.30 10.00 20.00 21
875.00 1988.00 1993.00 1
pCO2 0.00 290.00 11.00 11.20 20.00 20.50 10.80 20.90 4
30.00 1Base Excess 100.00 1Total bilrubin fractions 0.00 47
0.00 2147.10 1
0.00 286.00 196.90 1
CPK MB
Potassium
Sodium
pH
PO2.sat
Prothrombin Time
Albumin
Calcium (total)
Creatinine
3M Health Information Systems Page 31
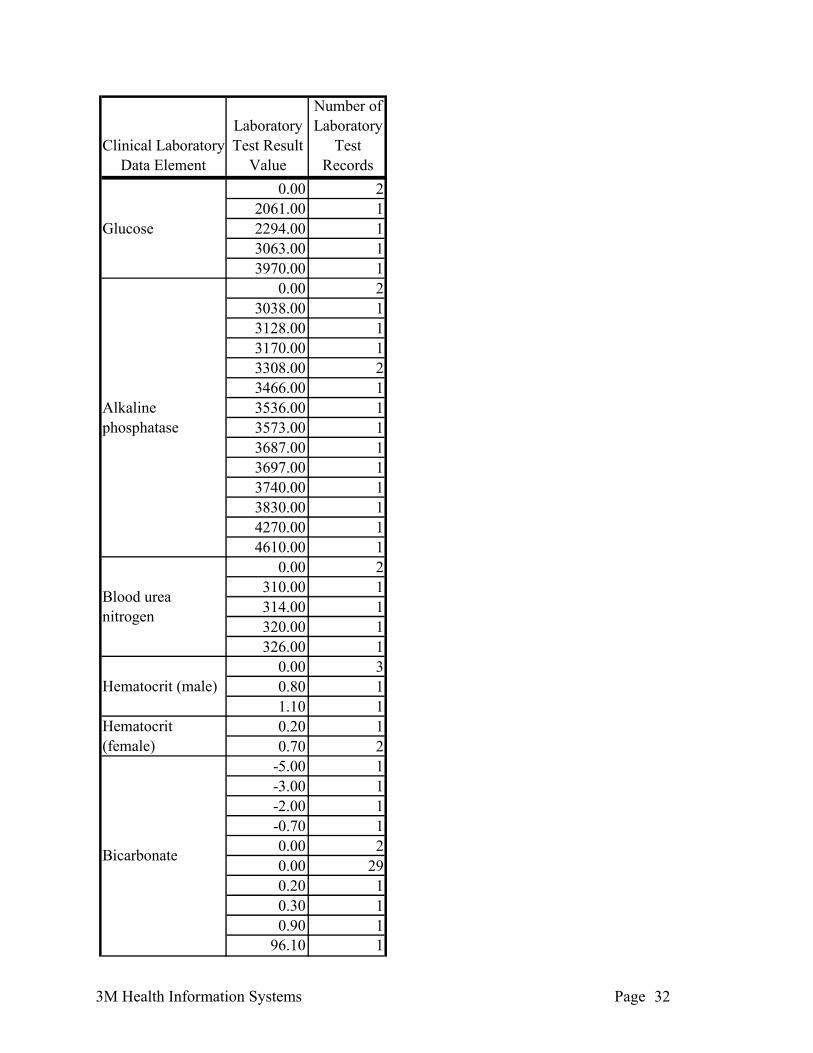
Clinical Laboratory Data Element
Laboratory Test Result
Value
Number of Laboratory
Test Records
0.00 22061.00 12294.00 13063.00 13970.00 1
0.00 23038.00 13128.00 13170.00 13308.00 23466.00 13536.00 13573.00 13687.00 13697.00 13740.00 13830.00 14270.00 14610.00 1
0.00 2310.00 1314.00 1320.00 1326.00 1
0.00 30.80 11.10 10.20 10.70 2
-5.00 1-3.00 1-2.00 1-0.70 10.00 20.00 290.20 10.30 10.90 1
96.10 1
Hematocrit (female)
Bicarbonate
Glucose
Alkaline phosphatase
Blood urea nitrogen
Hematocrit (male)
3M Health Information Systems Page 32

Clinical Laboratory Data Element
Laboratory Test Result
Value
Number of Laboratory
Test Records
SGPT 0.00 20.00 1
46.00 172.00 1
Total Hemoglobin (male) 0.00 2
Phosphorous
3M Health Information Systems Page 33
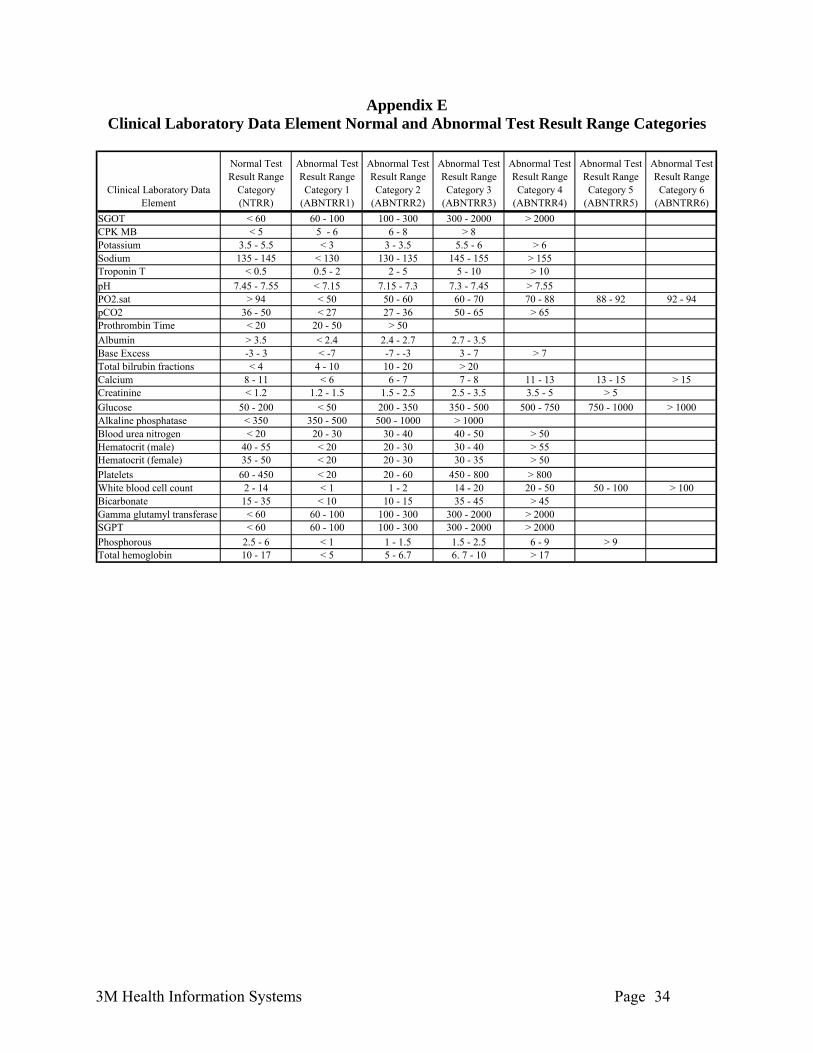
Appendix E Clinical Laboratory Data Element Normal and Abnormal Test Result Range Categories
Clinical Laboratory Data Element
Normal Test Result Range
Category(NTRR)
Abnormal Test Result Range Category 1
(ABNTRR1)
Abnormal Test Result Range Category 2
(ABNTRR2)
Abnormal Test Result Range Category 3
(ABNTRR3)
Abnormal Test Result Range Category 4
(ABNTRR4)
Abnormal Test Result Range Category 5
(ABNTRR5)
Abnormal Test Result Range Category 6
(ABNTRR6)SGOT < 60 60 - 100 100 - 300 300 - 2000 > 2000CPK MB < 5 5 - 6 6 - 8 > 8Potassium 3.5 - 5.5 < 3 3 - 3.5 5.5 - 6 > 6Sodium 135 - 145 < 130 130 - 135 145 - 155 > 155Troponin T < 0.5 0.5 - 2 2 - 5 5 - 10 > 10pH 7.45 - 7.55 < 7.15 7.15 - 7.3 7.3 - 7.45 > 7.55PO2.sat > 94 < 50 50 - 60 60 - 70 70 - 88 88 - 92 92 - 94pCO2 36 - 50 < 27 27 - 36 50 - 65 > 65Prothrombin Time < 20 20 - 50 > 50Albumin > 3.5 < 2.4 2.4 - 2.7 2.7 - 3.5Base Excess -3 - 3 < -7 -7 - -3 3 - 7 > 7Total bilrubin fractions < 4 4 - 10 10 - 20 > 20Calcium 8 - 11 < 6 6 - 7 7 - 8 11 - 13 13 - 15 > 15Creatinine < 1.2 1.2 - 1.5 1.5 - 2.5 2.5 - 3.5 3.5 - 5 > 5Glucose 50 - 200 < 50 200 - 350 350 - 500 500 - 750 750 - 1000 > 1000Alkaline phosphatase < 350 350 - 500 500 - 1000 > 1000Blood urea nitrogen < 20 20 - 30 30 - 40 40 - 50 > 50Hematocrit (male) 40 - 55 < 20 20 - 30 30 - 40 > 55Hematocrit (female) 35 - 50 < 20 20 - 30 30 - 35 > 50Platelets 60 - 450 < 20 20 - 60 450 - 800 > 800White blood cell count 2 - 14 < 1 1 - 2 14 - 20 20 - 50 50 - 100 > 100Bicarbonate 15 - 35 < 10 10 - 15 35 - 45 > 45Gamma glutamyl transferase < 60 60 - 100 100 - 300 300 - 2000 > 2000SGPT < 60 60 - 100 100 - 300 300 - 2000 > 2000Phosphorous 2.5 - 6 < 1 1 - 1.5 1.5 - 2.5 6 - 9 > 9Total hemoglobin 10 - 17 < 5 5 - 6.7 6. 7 - 10 > 17
3M Health Information Systems Page 34
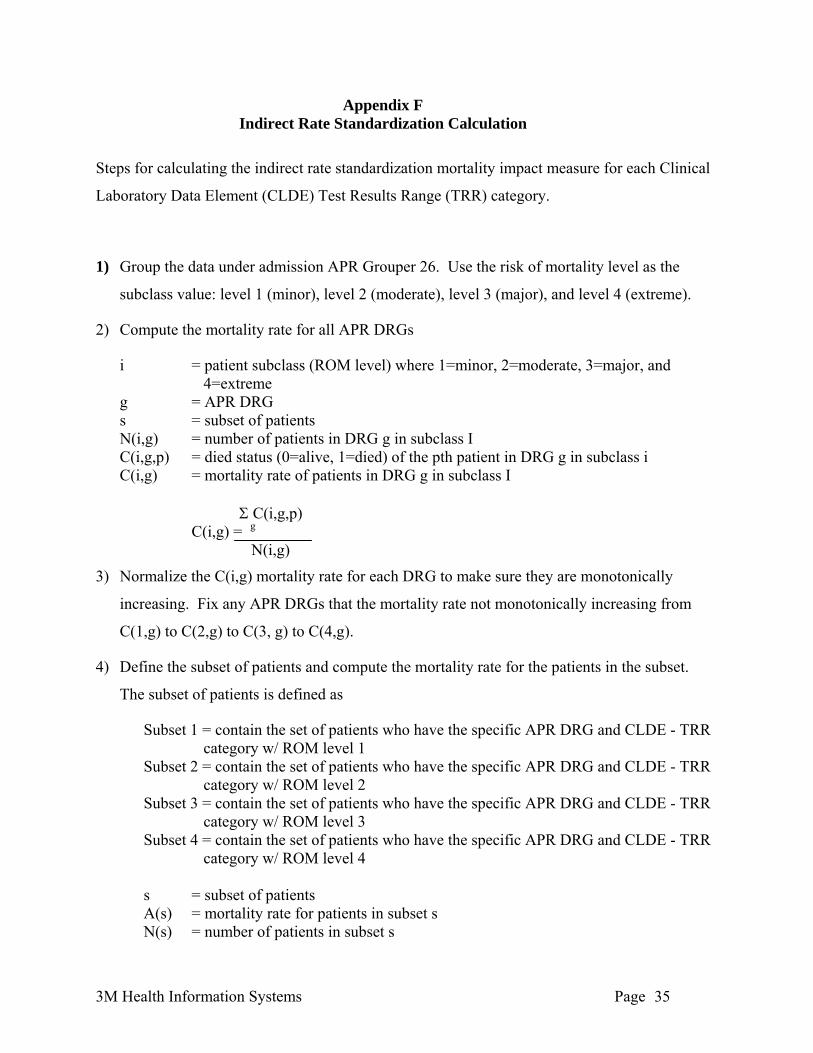
Appendix F Indirect Rate Standardization Calculation
Steps for calculating the indirect rate standardization mortality impact measure for each Clinical
Laboratory Data Element (CLDE) Test Results Range (TRR) category.
1) Group the data under admission APR Grouper 26. Use the risk of mortality level as the
subclass value: level 1 (minor), level 2 (moderate), level 3 (major), and level 4 (extreme).
2) Compute the mortality rate for all APR DRGs
i = patient subclass (ROM level) where 1=minor, 2=moderate, 3=major, and 4=extreme
g = APR DRG s = subset of patients N(i,g) = number of patients in DRG g in subclass I C(i,g,p) = died status (0=alive, 1=died) of the pth patient in DRG g in subclass i C(i,g) = mortality rate of patients in DRG g in subclass I Σ C(i,g,p) C(i,g) = g N(i,g)
3) Normalize the C(i,g) mortality rate for each DRG to make sure they are monotonically
increasing. Fix any APR DRGs that the mortality rate not monotonically increasing from
C(1,g) to C(2,g) to C(3, g) to C(4,g).
4) Define the subset of patients and compute the mortality rate for the patients in the subset.
The subset of patients is defined as
Subset 1 = contain the set of patients who have the specific APR DRG and CLDE - TRR category w/ ROM level 1
Subset 2 = contain the set of patients who have the specific APR DRG and CLDE - TRR category w/ ROM level 2
Subset 3 = contain the set of patients who have the specific APR DRG and CLDE - TRR category w/ ROM level 3
Subset 4 = contain the set of patients who have the specific APR DRG and CLDE - TRR category w/ ROM level 4
s = subset of patients
A(s) = mortality rate for patients in subset s N(s) = number of patients in subset s
3M Health Information Systems Page 35

Σ C(i,g,p) A(s) = i,g,p∈s N(s)
5) Calculate the estimated mortality rate for patients in subset s. For each CLDE - TRR in each
APR DRG g E(1,s), E(2,s), E(3,s) and E(4,s) will be computed separately.
N(g,s) = number of patients in APR DRG g in subset s E(i,s) = expected mortality rate for patients in subset s if the patients are assigned to
subclass i Σ N(g,s)C(i,g) E(i,s) = g N(s)
6) By comparing A(s) to E(1,s), E(2,s), E(3,s) and E(4,s) for each subset the estimated subclass
for the CLDE - TRR category in the APR DRG g can be computed in the following form
X.Y
X is the estimated subclass value from the data. If A(s) is within the range in the table then
the estimated subclass (i.e., X) for the CLDE - TRR category in the APR DRG g will have
the value shown in the following table
X Low High0 0 <E(1,s) 1 E(1,s) <E(2,s) 2 E(2,s) <E(3,s) 3 E(3,s) <E(4,s) 4 E(4,s) <2E(4,s) 5 >= 2E(4,s) -
Y is an interpolation of the value of A(s) between the estimated subclass value and the next higher subclass value.
3M Health Information Systems Page 36
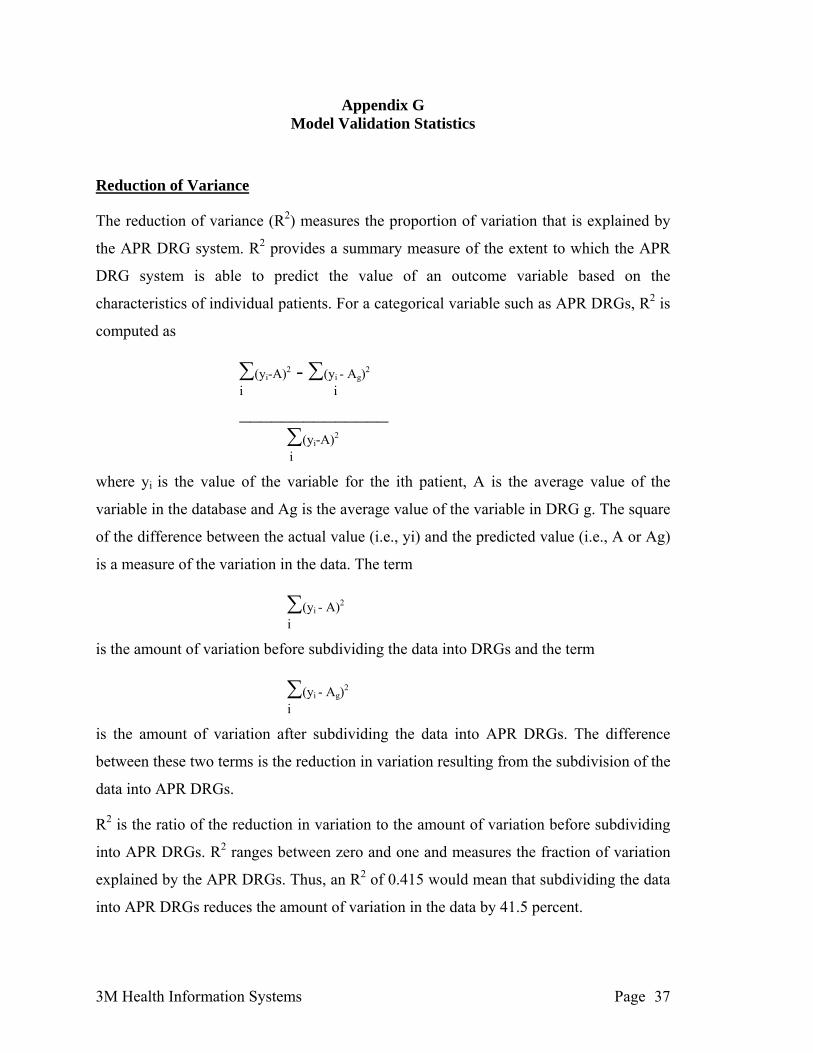
Appendix G Model Validation Statistics
Reduction of Variance
The reduction of variance (R2) measures the proportion of variation that is explained by
the APR DRG system. R2 provides a summary measure of the extent to which the APR
DRG system is able to predict the value of an outcome variable based on the
characteristics of individual patients. For a categorical variable such as APR DRGs, R2 is
computed as
∑ 2 - ∑ i Ag)2 (yi-A) (y -i i ______________
∑(yi-A)2
i
where yi is the value of the variable for the ith patient, A is the average value of the
variable in the database and Ag is the average value of the variable in DRG g. The square
of the difference between the actual value (i.e., yi) and the predicted value (i.e., A or Ag)
is a measure of the variation in the data. The term
∑ 2 (yi - A)i
is the amount of variation before subdividing the data into DRGs and the term
∑(yi - Ag)2 i
is the amount of variation after subdividing the data into APR DRGs. The difference
between these two terms is the reduction in variation resulting from the subdivision of the
data into APR DRGs.
R2 is the ratio of the reduction in variation to the amount of variation before subdividing
into APR DRGs. R2 ranges between zero and one and measures the fraction of variation
explained by the APR DRGs. Thus, an R2 of 0.415 would mean that subdividing the data
into APR DRGs reduces the amount of variation in the data by 41.5 percent.
3M Health Information Systems Page 37

The R2 for mortality is computed by assigning each patient a value of zero or one
indicating whether they were discharged alive or dead, respectively. The predicted
mortality for the patient is equal to the average value of the zero/one variable in the DRG
to which the patient is assigned. The average value of the zero/one value is equivalent to
the fraction of patients who died in the APR DRG. Based on the zero/one variable, the R2
for mortality is computed in the same manner as the R2 for cost or length of stay
described above.
C-Statistics
The area under the receiver operating characteristics (ROC) curve, is commonly used to
evaluate alternative methods for predicting a zero/one outcome. The area under the ROC
curve is typically used for evaluating the efficacy of a method which predicts that a given
patient will or will not experience the event of interest. The basis of the ROC curve is
sensitivity and specificity. In this context, sensitivity is the probability that someone who
died was classified as likely to have died, while specificity is the probability that
someone who did not die was classified as not likely to die. Sensitivity and specificity
are computed as follows:
Sensitivity = ∑nipi I(pi≥P) / ∑nipi
Specificity = ∑ni(1-pi) I(pi<P) / ∑ni(1-pi)
where ni is the number of patients in APR DRG i, pi is the fraction of patients who died in
APR DRG i and I(pi) is an indicator that takes the value 1.0 if, in a particular APR DRG,
the proportion of dead is at least P for sensitivity and less than P for specificity. The
computation of the sensitivity and specificity assumes that all patients in an APR DRG
died if pi≥P and conversely that all patients in an APR DRG lived if pi < P.
The ROC curve plots sensitivity against one minus specificity as the value of P varies.
The area under the ROC curve is referred to as the c-statistic. The c-statistic measures
how well the APR DRG system discriminates between patients who lived and those who
died. A c-statistic value of 0.5 indicates no ability to discriminate while a value of 1.0
indicates perfect discrimination.
3M Health Information Systems Page 38
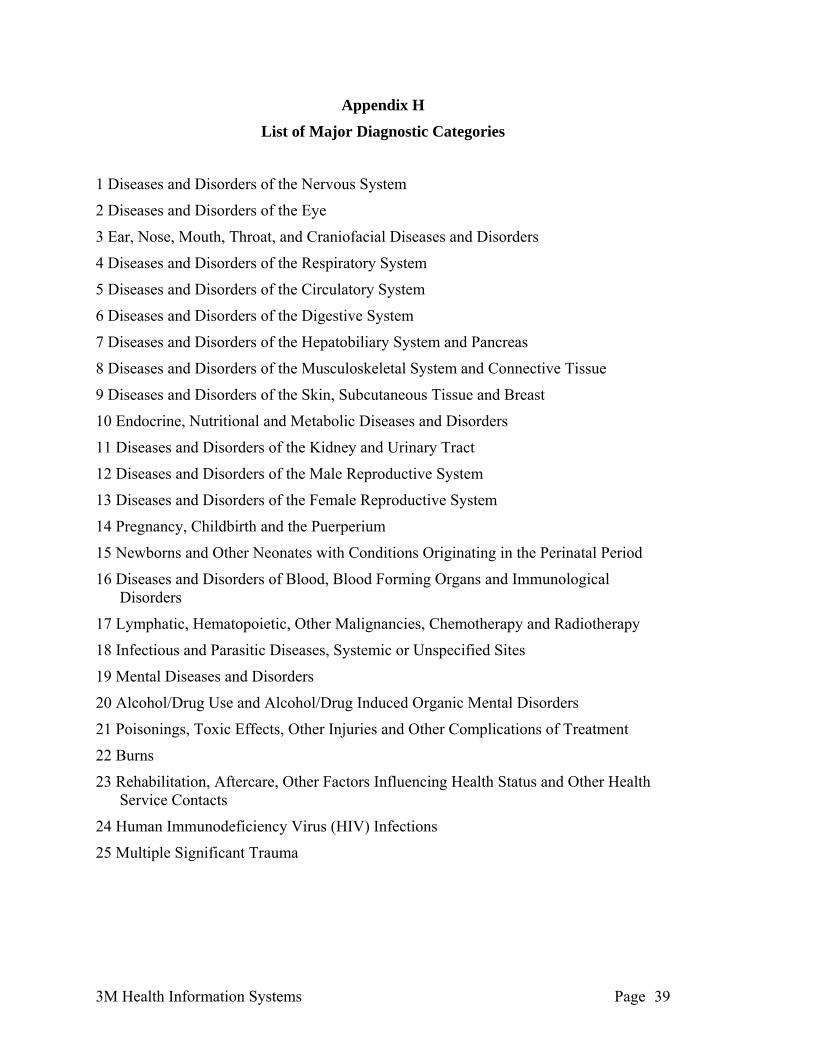
3M Health Information Systems Page 39
Appendix H
List of Major Diagnostic Categories
1 Diseases and Disorders of the Nervous System
2 Diseases and Disorders of the Eye
3 Ear, Nose, Mouth, Throat, and Craniofacial Diseases and Disorders
4 Diseases and Disorders of the Respiratory System
5 Diseases and Disorders of the Circulatory System
6 Diseases and Disorders of the Digestive System
7 Diseases and Disorders of the Hepatobiliary System and Pancreas
8 Diseases and Disorders of the Musculoskeletal System and Connective Tissue
9 Diseases and Disorders of the Skin, Subcutaneous Tissue and Breast
10 Endocrine, Nutritional and Metabolic Diseases and Disorders
11 Diseases and Disorders of the Kidney and Urinary Tract
12 Diseases and Disorders of the Male Reproductive System
13 Diseases and Disorders of the Female Reproductive System
14 Pregnancy, Childbirth and the Puerperium
15 Newborns and Other Neonates with Conditions Originating in the Perinatal Period
16 Diseases and Disorders of Blood, Blood Forming Organs and Immunological Disorders
17 Lymphatic, Hematopoietic, Other Malignancies, Chemotherapy and Radiotherapy
18 Infectious and Parasitic Diseases, Systemic or Unspecified Sites
19 Mental Diseases and Disorders
20 Alcohol/Drug Use and Alcohol/Drug Induced Organic Mental Disorders
21 Poisonings, Toxic Effects, Other Injuries and Other Complications of Treatment
22 Burns
23 Rehabilitation, Aftercare, Other Factors Influencing Health Status and Other Health Service Contacts
24 Human Immunodeficiency Virus (HIV) Infections
25 Multiple Significant Trauma

![MASTER SUBCONTRACT Agreement - Swinerton … Subcontract... · Web viewMASTER SUBCONTRACT Agreement THIS MASTER SUBCONTRACT AGREEMENT (“MSA” or “Agreement”) is made this [date]](https://img.pdfslide.net/doc/110x75/5adb1e4d7f8b9ae1768e1acc/master-subcontract-agreement-swinerton-subcontractweb-viewmaster-subcontract.jpg)