Embed Size (px)
Citation preview

Adding Value to the Atlas of Major Appalachian Gas Plays
Natural Gas Conference Paper
Douglas G. PatchenRonald McDowell
Katharine Lee Avary
April 1997

This report was prepared as an account of work sponsored by an agency of the United StatesGovernment. Neither the United States Government nor any agency thereof, nor any of theiremployees, makes any warranty, express or implied, or assumes any legal liability or responsibilityfor the accuracy, completeness, or usefulness of any information, apparatus, product, or processdisclosed, or represents that its use would not infringe privately owned rights. Reference herein toany specific commercial product, process, or service by trade name, trademark, manufacturer, orotherwise does not necessarily constitute or imply its endorsement, recommendation, or favoring bythe United States Government or any agency thereof. The views and opinions of authors expressedherein do not necessarily state or reflect those of the United States Government or any agencythereof.

Abstract
Adding Value to the Atlas of Major Appalachian Gas PlaysPatchen, Douglas G., Ron McDowell and Lee Avary, West Virginia Geological Surveyand Appalachian Oil and Natural Gas Research Consortium, Morgantown, WV
Natural gas is produced from more than 100 stratigraphic levels in more than 1000 named fields ina broad trend that extends from New York to Tennessee and includes large portions of Pennsylvania,Ohio, West Virginia, and eastern Kentucky. In the new Atlas of Major Appalachian Gas Plays thesegas-bearing reservoirs have been organized into 30 major plays that have both historic significanceand future potential. A “play” as used in the atlas is a group of geologically similar drilling prospectshaving similar source, reservoir and trap controls of gas migration, accumulation, and storage. Thus,they share some common elements of risk with regard to the possible occurrence of gas within them.The 30 Appalachian gas plays have been designated by their reservoir lithology and by reference totrap type or the geologic conditions that control production within the play. Eighteen of the 30 playsare designated by the depositional environment that produced the reservoir lithology; the other 12are designated by the geologic factors that control production in the play.
Products of this five-year, DOE-funded and GRI-supported research effort include the atlas, anelectronic data base containing information on more than 5100 gas reservoirs, a second electronicdata base with more than 10,000 searchable references to the geologic and engineering literature, anda third data base with reservoir data compiled for more than 300 oil reservoirs.
The atlas consists of 200 pages (22 by 17 inches), that include 30 play descriptions, four introductorysections, more than 600 illustrations, references to nearly 1000 published works, and data tables foreach play that collectively include up to 46 geologic and engineering parameters for 426 gas pools.The companion data base includes up to 70 parameters for 5100 reservoirs in seven states, rangingin age from Pennsylvanian to Cambrian. One of the parameters in the data base is a field centroid,which allows mapping of numerous field averages to establish regional trends within a play.
Production from the 30 plays has been estimated by play authors to exceed 43 trillion cubic feet ofgas (tcf), with an estimated 95 to 158 tcf remaining as proved reserves, probable resources andundiscovered possible resources. The largest plays, in terms of estimated cumulative production, arethe Upper Devonian Bradford and Venango sandstone plays, the Lower Silurian Cataract/Medinasandstone play, and the Lower Mississippian Big Injun sandstone play. More than 60% of allproduction has been from Devonian plays, most of which are sandstone plays. In all 30 plays, morethan 80% of the cumulative production is from plays with sandstone reservoirs. Within the 18 playsdefined by environment of deposition, nearly 40% of the production has come from shallow shelfsandstones, with another 45% from fluvial deltaic and near shore sandstone plays. The 12 playscontrolled by geologic factors other than environment of deposition of reservoir rock havecontributed less than 20% of cumulative production, mostly from fractured Devonian shale reservoirs.
Most of the remaining gas, both discovered and undiscovered, is within black Upper Devonian shaleswhich produce from fractured reservoirs. Estimates of this resource range from 26 to 89.5 tcf,compared to the range for all 30 plays in the basin of 95 to 158.5 tcf. Six additional plays are

estimated to contain more than 5 tcf in reserves and resources, of which five produce from sandstonereservoirs. The sixth play produces from Devonian fractured siltstone and shales adjacent to thefractured black shale play.
The consensus of the play authors is that the nation’s oldest producing basin still has more gas toproduce than has been produced, although many of the more productive plays have reached the halfway point in their estimated ultimate recovery. Prolific plays in which the resource/production ratiois less than one include the Upper Devonian Venango, Bradford, and Elk sandstone plays, and theMississippian Greenbrier/Newman limestone play. Fortunately, however, 19 of the 30 plays haveresource/production ratios greater than one. Among established plays, the Devonian fractured shaleand siltstone plays, Pennsylvanian and Mississippian sandstone plays, and the various OriskanySandstone plays have the most future potential. Of the currently smaller plays, the Knox unconformityplay, Tuscarora Sandstone fractured anticlinal play, and pre-Knox Group play are estimated tocontain from 0.5 to 2.4 tcf of remaining producible gas.
Including a centroid for each of the 5100 reservoirs in the data base allows one to make interestingand potentially useful trend maps of each play, or of similar plays, such as all fluvial deltaic sandstoneplays. The centroid location becomes a control point for all averaged reservoir data, similar to a wellcontrol for mapping within a field. Using the control points and data base, regional trend maps of paythickness, average initial potential, reservoir depth, reservoir pressure, pressure gradient, andrecovery factor, among others can be made. Such maps can be used to determine what area of a playone should go into, as well as which plays to get involved in. Finally, the centroid location and thefact that most of the atlas was computer drafted, will allow for a more rapid conversion of the atlasfigures to be imported into a Geographic Information System (GIS).
____________________________Research sponsored by the U.S. Department of Energy’s Federal Energy Technology Center,under contract DE-FC21-91MC28176 with the Appalachian Oil and Natural Gas ResearchConsortium, P.O. Box 6064, Morgantown, WV 26506-6064; telefax 304-293-7822.
Adding Value to the Atlas of Major Appalachian Gas Plays
Douglas G. Patchen ([email protected]; 304-293-2867)Ronald McDowell ([email protected]; 304-594-2331)Katharine Lee Avary ([email protected]; 304-594-2331)
West Virginia Geological SurveyP. O. Box 879
Morgantown, WV 26507-0879
Introduction
The text and figures that follow are organized into two parts. Part one will describe the atlas andcompanion database, and part two will describe how the atlas and database can be used to developa basin-wide summary of past production and future resources. It should be noted that part twocontains summaries of undiscovered resources as estimated by the authors for the 30 gas playsdescribed in the Atlas of Major Appalachian Gas Plays. In many cases, the authors offered more thanone estimate. In making the graphs, charts and tables that are included in this paper, we selected oneof the options offered, and used it for each of the plays. The one exception is the wide range ofresources suggested for the Devonian black shale play. Anyone using the atlas may choose a differentresource number for any number of plays. Therefore, resource numbers used in this report shouldnot be quoted and incorporated into future papers without reading the individual play descriptionsfirst, and evaluating the numbers chosen by us.
It also must be noted that much of what was presented in DOE’s Natural Gas Conference wasdesigned to make users of the atlas think about what they could do with the atlas, to go beyond whatwas written to more fully evaluate the potential of the basin and various plays in the basin. Much ofwhat is presented may have little or no significance to individual readers. The purpose of theworkshop, and of this description of what was presented, is to encourage atlas users to think and toadd their own value to the atlas.
Producing the Atlas and Database
In a 1996 report titled “Technology and Related Needs of US Oil and Natural Gas Producers” thePetroleum Technology Transfer Council concluded that independent oil and gas operators hadinadequate access to geologic and production data, and inadequate well and reservoir level geologicand production data, case studies and analogs. The report cited the Appalachian basin as the primeexample of this deficiency. In the Appalachian basin, where oil and gas have been produced for more

than 125 years, there has been no attempt by either the public or private sector to compile regionaldata on all of the major gas plays, or on each of the gas reservoirs in the plays. Only recently has theU.S. Geological Survey made an attempt to separate gas reservoirs into plays, and to collect geologicand engineering data on reservoirs in the Medina (“Clinton”) sandstone play and the OriskanySandstone play. These were the first attempts to use the play concept in an analysis of theAppalachian basin, and to estimate proven reserves and undiscovered resources within plays.
The Appalachian Oil and Natural Gas Research Consortium, a partnership among the state geologicalsurveys in West Virginia, Pennsylvania, Kentucky and Ohio and the departments of Geology andGeography and Petroleum and Natural Gas Engineering at West Virginia University, submitted anunsolicited proposal to the Department of Energy’s Morgantown Energy Technology Center, orMETC (now the Federal Energy Technology Center, or FETC) to apply the play concept to the gas-producing areas of the Appalachian basin, and produce an atlas of the major gas plays and acompanion database of geologic and reservoir data for all reservoirs assigned to each play. Five yearslater the consortium had produced an atlas of 30 major gas plays, an electronic database containinginformation on more than 5100 gas reservoirs, a digital database containing more than 10,000references to the geologic and engineering literature, and enhanced well-specific databases in fourAppalachian basin states.
Description of the Atlas of Major Appalachian Gas Plays. The atlas consists of 200 pages, each17 x 22 inches, containing nearly 600 maps, cross sections and other figures that illustrate 30 playdescriptions, stratigraphic and structural overviews of the basin, and a description of the reservoir-level database. A bibliography with nearly 1000 cited references is included in the back of the atlas.Each play description contains a data table for key fields in the play. The tables contain 46 rows forspecific geologic and engineering parameters, and a column of each of the main reservoirs in a keygas field. The 30 play descriptions combined contain 426 columns of reservoir data.
The companion database contains data on 70 parameters for more than 5100 reservoirs. Theseparameters are separated into basic field information (field name, play, discovery date, formation,number of wells, etc), reservoir parameters (pay thickness, porosity, temperature, pressure, etc), fluidproperties (gas gravity, gas and water saturations, etc), and volumetric data (original gas in place,estimated cumulative production, known or reported production, remaining reserves, etc). A key dataelement is a centroid location for each of the reservoirs in the database. This allows database usersto map any parameter on a regional scale to determine basin-wide trends.
Play Description Format. As a guide to authors, and to establish uniformity among playdescriptions, we decided to create a rigid format for all play descriptions. Each consists of the sameeight main headings, in this order: Location, Production History, Stratigraphy, Structure, Reservoir,Description of Key Fields, Resources and Reserves, and Future Trends. Also, eight key illustrationswere required for each play: the size and extent of each play; a key field location map; a stratigraphiccolumn; a correlation chart; a regional map, either stratigraphic or structural; a regional cross section,either stratigraphic or structural; a type log; and a pay or porosity map. Authors could include asmany additional illustrations as desired.
Defining Gas Plays. At the beginning of the project a research team from six states met to organizeall producing intervals into plays, using the definition of White (1980, 1988) that a play is a group ofgeologically similar drilling prospects having basically the same source, reservoir and trap controlsof gas accumulation, migration and storage. Thus, they share some common elements of risk withrespect to the possible occurrence of natural gas. Plays are commonly designated by their reservoirlithology (e.g., Oriskany Sandstone Play), although play names can be modified by reference to traptype (the Oriskany Structural Play) or some other geologic similarity (the Knox Unconformity Play).Our approach was to define stratigraphically and geographically restricted geologic plays basedlargely on age, lithology and deposition of reservoir rocks under similar environments of depositionthat have undergone similar structural and diagenetic histories. The end result should be a set ofreservoirs with common geologic and engineering characteristics. This approach was applied to themore than 100 stratigraphic intervals from which gas is produced in more than 1000 named fields ineight Appalachian basin states.
In the Appalachian basin, production in 18 of the 30 gas plays is thought to be controlled by theenvironment of deposition of the reservoir rock in one of seven types of depositional systems: fluvialdeltaic sandstone (six plays), nearshore sandstone (one play), shallow shelf sandstone (three plays),turbidites or slope sandstones (one play), transgressive sandstones (two plays), shallow shelfcarbonates (two plays), and reefs and carbonate mounds or bars (three plays). Production in theremaining 12 plays is associated with or controlled by unconformities (three plays), anticlines andcombination traps (three plays) and fractured reservoirs (six plays) (Table 1).
The Appalachian basin is a broad, elliptical basin that is broader on the north than on the south. Theyoungest Paleozoic sediments, ranging from Mississippian to Permian, are in the center of the basin,flanked by older Devonian and Silurian rocks, and eventually Cambrian and Ordovician rocks on thebasin margin. Structural complexity increases from west to east from the relatively flat plateau rocksthrough the high amplitude folds immediately west of the Allegheny Front, to the highly deformed“Eastern Overthrust Belt” east of the front. Fractured anticlinal and structural plays are confined toareas of Pennsylvania and West Virginia east of the front, whereas the fractured Huntersville andOriskany play is in the foreland area west of the front, and the fractured black shale play is fartherwest. Stratigraphically-controlled plays in younger rocks are confined to the center of the basin,whereas plays in older rocks are restricted to the western side of the basin in Ohio and Kentuckywhere these rocks are at relatively shallow depths as compared to the basin center.
Fluvial-deltaic Sandstone Plays. Six fluvial-deltaic sandstone plays have been defined and describedin the atlas. These include the Pennsylvanian Allegheny and Pottsville sandstones and associated coalplays, the Mississippian Mauch Chunk, Big Injun and Weir sandstone plays, and the Mississippian-Devonian Berea Sandstone play (Figure 1a-c). With the exception of the Berea Sandstone play,these plays are confined to the center of the basin.
The uppermost play, the Middle Pennsylvanian Allegheny Sandstone play, is confined to the tri-statesarea of Ohio, Pennsylvania and West Virginia, and produces from thin sandstones called BurningSprings, Gas and Horseneck by drillers. Coal beds associated with these sandstones include theUpper and Lower Freeport, Upper and Lower Kittanning, and the Clarion/Brookville at the base.The underlying Lower Pennsylvanian Pottsville, New River and Lee Sandstone play is more
extensive, with significant production to the southwest in Kentucky. Production is from sandstonesoften saturated with salt water in commercial quantities, giving rise to the name Salt sands.Associated coals include the Sewell, Beckley and Pocahontas nos. 3 and 4.
The Upper Mississippian Mauch Chunk Sandstone play produces in a geographic area similar in sizeto the Pottsville-Lee Sandstone play. Production is from numerous lenticular fluvial-deltaicsandstones, of which the Maxon and Ravencliff are the most important. The more important LowerMississippian Big Injun Sandstone play has been a prolific play in West Virginia, where more than8,000 wells are estimated to have produced nearly four trillion cubic feet of gas from subtle structuraland stratigraphic traps within the area of preserved sandstone. The underlying Weir Sandstone playincludes extensive fluvial-deltaic sandstones in West Virginia, and more offshore, deeper-watersandstones in Kentucky. The Berea Sandstone play at the base of the Mississippian-top of Devonianis the most extensive of the six fluvial-deltaic plays, reflecting more extensive preservation of rockin the basin with depth and age. Important production has been established in Ohio, Pennsylvania,Kentucky and West Virginia.
Nearshore and Shelf Sandstone Plays. Nearshore and shelf sandstone plays include the UpperDevonian Venango and Bradford Sandstone plays, the Upper Silurian Newburg sandstone play, andthe Lower Silurian Medina-Cataract (“Clinton”) sandstone play.
Gas is produced in the large Venango play from stacked, marginal marine sandstones with excellentreservoir quality in Pennsylvania and West Virginia. Reservoir sandstones are both shoreline paralleland shoreline perpendicular, and number more than a dozen from the Gantz sandstone at the top tothe First Warren at or near the base of the play section. Other important reservoirs are developed inthe Gordon, Venango, Fourth, Fifth and Bayard sandstones. Current development has moved to thenorthwest to an area with coastal plain and shelf sandstones with lower permeability.
The Bradford Sandstone play is the uppermost of the three shelf sandstone plays. Production is frommultiple shelf to nearshore sandstones that were deposited parallel to the paleoshoreline. Keyproducing sandstones include the Warren, Speechley, Balltown and Bradford. Current explorationis in areas of previously bypassed shelf and basinal siltstones in northern West Virginia. The Bradfordplay is the middle of three Upper Devonian sandstone plays in a progradational wedge that migratedfarther west with time. Sandstones in this play correspond in time to the Huron-Dunkirk black shalefacies farther to the west.
The Upper Silurian Newburg sandstone play is a small, but prolific play from which nearly 300 bcfof gas were produced from approximately 300 wells during the late 1960s and early 1970s.Production was from the western, updip edge of the sandstone body in combination stratigraphic-structural traps. The older Medina-Cataract play, better known as the Clinton sandstone play in Ohio,is the largest play in the basin. The play developed in three stages, with each moving progressivelyeastward and deeper with advances in technology, notably rotary drilling, hydraulic fracturing andbetter logging tools. More than 76,000 gas wells have been completed, and 6 tcf of gas have beenproduced from the Grimsby (red facies) and Whirlpool (white facies) in stratigraphic traps createdby variations in porosity and permeability.
Turbidites and Transgressive Sandstone Plays. Gas production from sandstones interpreted tobe turbidites or slope sandstones are confined to the Upper Devonian Elk Sandstone play, the lowestof the three progradational sandstone packages in Pennsylvania and West Virginia. Productionoccurs in ten to 12 fine-grained sandstones or siltstones, of which the Benson sandstone is the mostimportant. Recent development has been in the deeper Elk sandstones 500 to 1500 feet below theBenson.
The Middle Ordovician St. Peter Sandstone and various pre-Knox Group sandstones from which gashas been produced in small areas of Kentucky have been interpreted to be transgressive sandstonebodies. Traps in the St. Peter are structural in nature, and are associated with the Kentucky Riverand Irvine-Paint Creek fault zones. There is potential for this play to extend into West Virginia abovethe Rome Trough. Gas production from pre-Knox sandstones and carbonates is confined to fewerthan 100 wells in eastern Kentucky and one well in West Virginia (Figure 1f).
Shallow Shelf Carbonate Plays. The nearly 10,000 wells in the Mississippian Greenbrier-NewmanLimestone play have produced 2.9 tcf of gas from dolomitized sandstones, sandy dolostones andoolitic limestones of the drillers’ Greenbrier Big Injun, Keener and Big Lime reservoirs Figure 1b).The dolomitic sandstones are interpreted as submarine dunes deposited in a nearshore sandstoneenvironment. The upper oolitic zones formed as tidal bars perpendicular to a structural hinge line,and repeat geographically in a predictable spacing pattern. Lower oolitic zones are associated witha regional unconformity below the Greenbrier.
Gas is produced from the Ordovician Trenton Limestone in both stratigraphic and structural traps inKentucky and New York (Figure 1f) where drilling depths to the Trenton are relatively shallow.Production is from bioclastic carbonate bars and secondary porosity in linear zones of secondarydolomitization.
Reef and Carbonate Bar Plays. Gas wells have been completed in the Lower Mississippian Ft.Payne Formation in seven counties in Tennessee and four counties in adjacent Kentucky (Figure 1b).Production is associated with oil in most areas, with reservoirs developed in bryozoan-rich,Waulsortian-type carbonate mounds. In contrast, gas production in the Middle Devonian OnondagaLimestone reef play is from Edgecliff Member pinnacle reefs up to 200 feet high that cover up to 100acres. Six fields have been discovered in New York, and one in Pennsylvania (Figure 1e). Thesereefs are hard to map and find where the Onondaga is more than 100 feet thick.
Gas is produced from the Upper Silurian Lockport Dolomite and underlying Keefer Sandstone innumerous small fields in eastern Kentucky (the Big Six sandstone), and from the Lockport in northernOhio (Figure 1e). Production is from porous patch reef bioherms or skeletal sand shoals in 60 fields.Combination stratigraphic-structural traps formed draped over closure or along pinchouts onstructural flanks.
Plays Due to Unconformities and Structure. The Lower Devonian Oriskany Sandstone updippermeability pinchout play is confined to the western and northern margins of the basin (Figure 1e)where permeability is lost as the Oriskany thins updip toward its zero edge. The play is flankeddowndip by the Oriskany combination traps play. The Lower Devonian-Upper Silurian unconformity
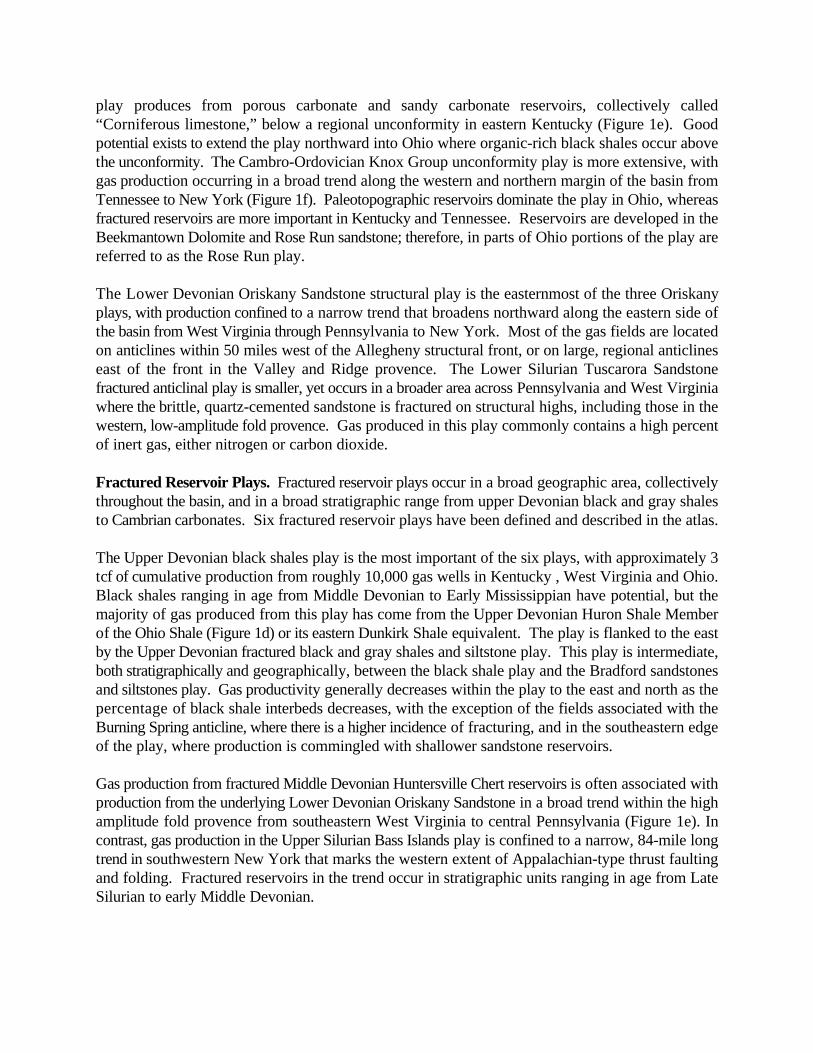
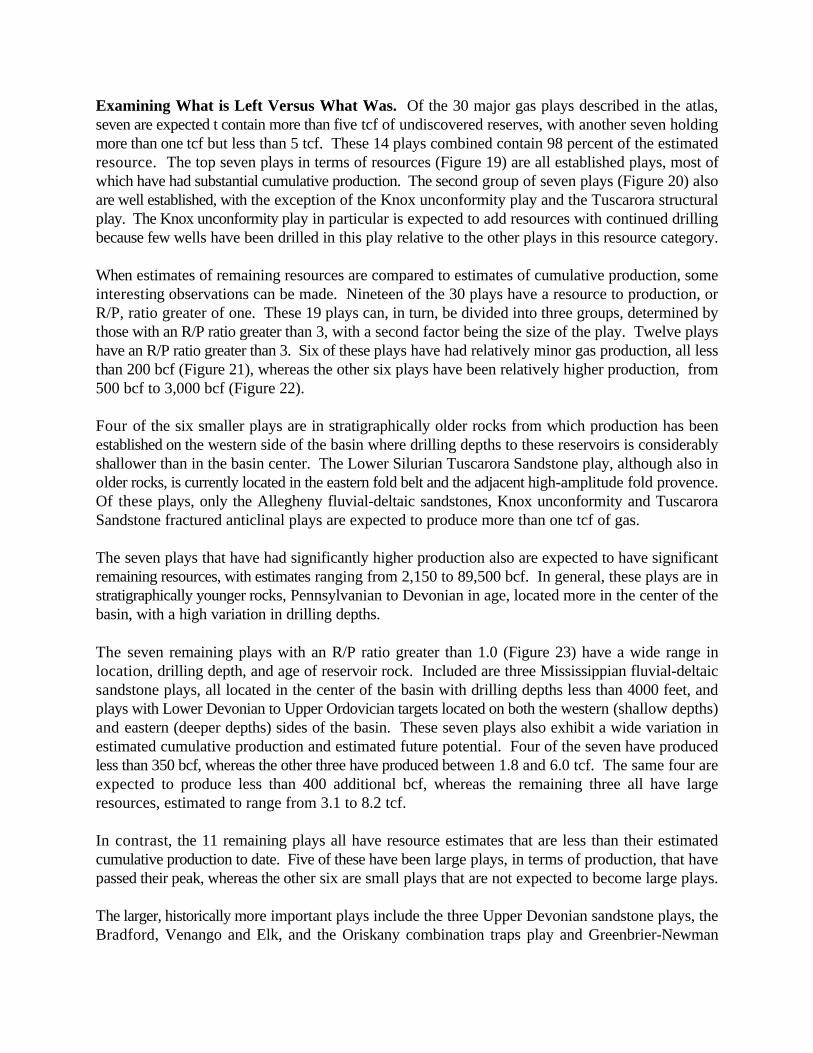
play produces from porous carbonate and sandy carbonate reservoirs, collectively called“Corniferous limestone,” below a regional unconformity in eastern Kentucky (Figure 1e). Goodpotential exists to extend the play northward into Ohio where organic-rich black shales occur abovethe unconformity. The Cambro-Ordovician Knox Group unconformity play is more extensive, withgas production occurring in a broad trend along the western and northern margin of the basin fromTennessee to New York (Figure 1f). Paleotopographic reservoirs dominate the play in Ohio, whereasfractured reservoirs are more important in Kentucky and Tennessee. Reservoirs are developed in theBeekmantown Dolomite and Rose Run sandstone; therefore, in parts of Ohio portions of the play arereferred to as the Rose Run play.
The Lower Devonian Oriskany Sandstone structural play is the easternmost of the three Oriskanyplays, with production confined to a narrow trend that broadens northward along the eastern side ofthe basin from West Virginia through Pennsylvania to New York. Most of the gas fields are locatedon anticlines within 50 miles west of the Allegheny structural front, or on large, regional anticlineseast of the front in the Valley and Ridge provence. The Lower Silurian Tuscarora Sandstonefractured anticlinal play is smaller, yet occurs in a broader area across Pennsylvania and West Virginiawhere the brittle, quartz-cemented sandstone is fractured on structural highs, including those in thewestern, low-amplitude fold provence. Gas produced in this play commonly contains a high percentof inert gas, either nitrogen or carbon dioxide.
Fractured Reservoir Plays. Fractured reservoir plays occur in a broad geographic area, collectivelythroughout the basin, and in a broad stratigraphic range from upper Devonian black and gray shalesto Cambrian carbonates. Six fractured reservoir plays have been defined and described in the atlas.
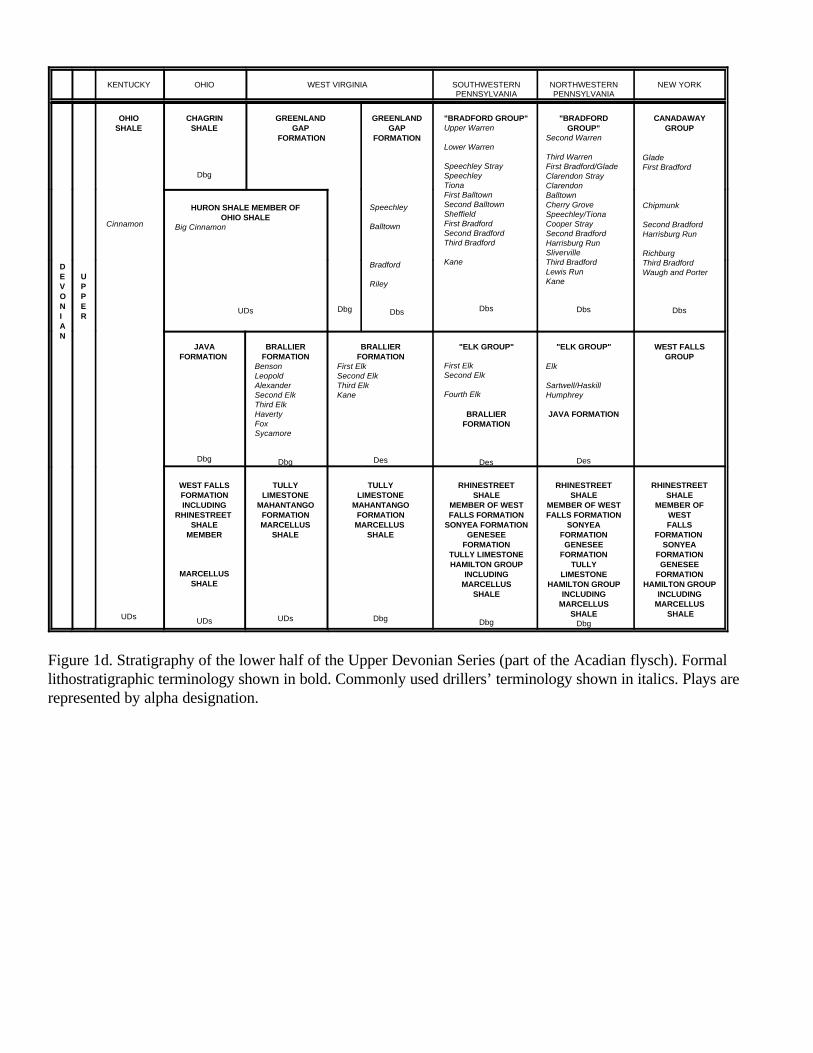
The Upper Devonian black shales play is the most important of the six plays, with approximately 3tcf of cumulative production from roughly 10,000 gas wells in Kentucky , West Virginia and Ohio.Black shales ranging in age from Middle Devonian to Early Mississippian have potential, but themajority of gas produced from this play has come from the Upper Devonian Huron Shale Memberof the Ohio Shale (Figure 1d) or its eastern Dunkirk Shale equivalent. The play is flanked to the eastby the Upper Devonian fractured black and gray shales and siltstone play. This play is intermediate,both stratigraphically and geographically, between the black shale play and the Bradford sandstonesand siltstones play. Gas productivity generally decreases within the play to the east and north as thepercentage of black shale interbeds decreases, with the exception of the fields associated with theBurning Spring anticline, where there is a higher incidence of fracturing, and in the southeastern edgeof the play, where production is commingled with shallower sandstone reservoirs.
Gas production from fractured Middle Devonian Huntersville Chert reservoirs is often associated withproduction from the underlying Lower Devonian Oriskany Sandstone in a broad trend within the highamplitude fold provence from southeastern West Virginia to central Pennsylvania (Figure 1e). Incontrast, gas production in the Upper Silurian Bass Islands play is confined to a narrow, 84-mile longtrend in southwestern New York that marks the western extent of Appalachian-type thrust faultingand folding. Fractured reservoirs in the trend occur in stratigraphic units ranging in age from LateSilurian to early Middle Devonian.
The Upper Ordovician Bald Eagle Formation fractured anticlinal play is the smallest play describedin the atlas, but one that may have big potential for the future. Currently, production is confined tothe Grugan field in Pennsylvania (Figure 1f). The Middle Ordovician fractured carbonates play isgeographically quite extensive, with production along the western edge of the basin in Tennessee,Kentucky, Ohio and Ontario, Canada. An easternward projection of the play in eastern Kentucky isassociated with fractured carbonate reservoirs above the Rome trough. Reservoirs within this playare developed in the Trenton, Black River and Wells Creek carbonate formations (Figure 1f).
Manipulating Gas Production and Resource Values in the Atlas
This portion of the text emphasizes the types of summaries that one can make from the 30 playdescriptions by looking at the atlas as a whole, as a sum of its parts, resulting in compilations notfound in the atlas.
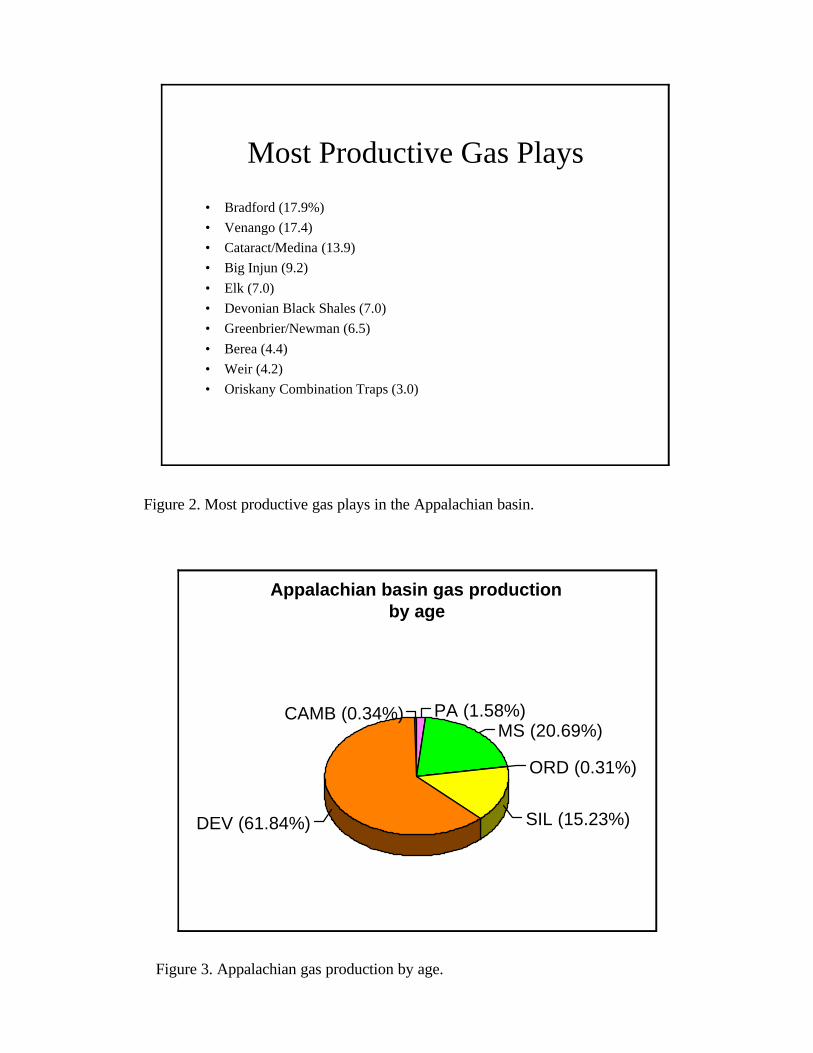
Play Production Summary. Cumulative gas production from all 30 gas plays has been estimatedby the play authors to exceed 43 tcf. The ten most productive plays (Figure 2) have produced 90percent of the estimated production, led by the Upper Devonian Bradford (17.9%) and Venango(17.4%) nearshore and shelf sandstone plays, and the Lower Silurian Cataract/Medina Sandstone play(13.9%). More than 60 percent of the estimated cumulative production has come from Devonianplays (Figure 3) followed by production from Mississippian plays (20.7%) and Silurian plays (15.2%).
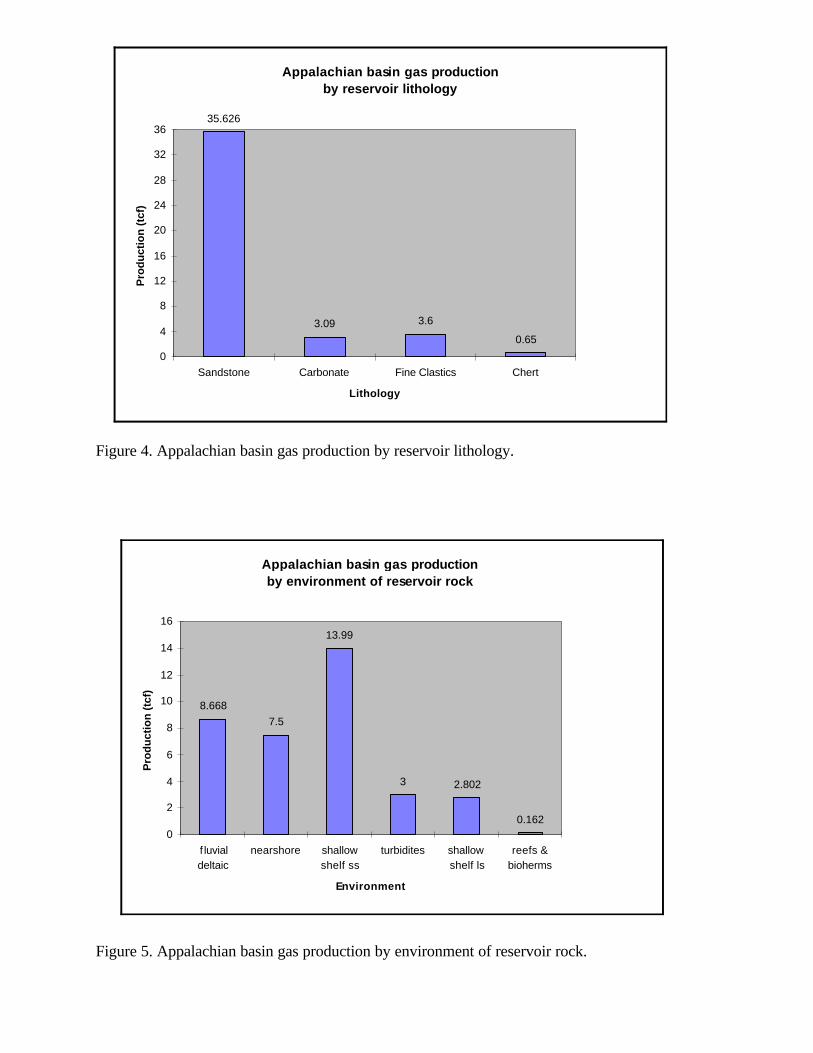
Sandstones reservoirs have produced more than 80 percent of the gas production (Figure 4)attributed to the 30 major plays. Production from finer clastics - shales and siltstones - essentiallyequals production from all plays with carbonate reservoirs, (7 and 8%, respectively). This dominationby sandstone reservoirs also is reflected in a comparison of production versus environment ofdeposition of reservoir rock (Figure 5). Shallow shelf sandstone plays have produced 32.5 percentof the estimated cumulative production, followed by fluvial-deltaic sandstone plays (20%), andnearshore sandstone plays (17.4%). Plays in which environments of deposition are the mostimportant factor in controlling production have produced 84 percent of the estimated cumulative gas.
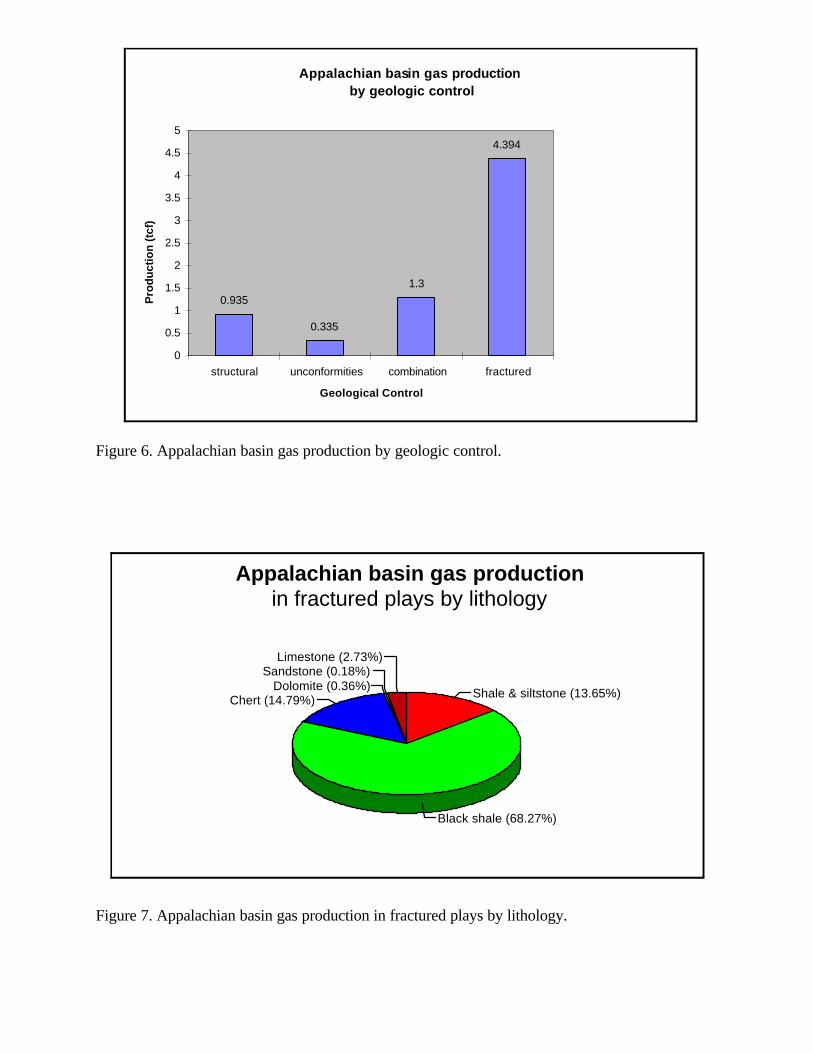
Plays in which other geologic controls are the dominating factor in controlling production accountfor 16% of the estimated basin production. Of these, fractured reservoirs are the most important,having yielded an estimated 10 percent of all production (Figure 6). Fractured shales have yieldedmost of the gas in fractured reservoir plays (Figure 7) (7% of all production; 68% of all productionfrom fractured plays).
Appalachian basin cumulative gas production also can be subdivided by age and environment ofdeposition of reservoir rock (Figure 8). Mississippian-aged fluvial-deltaic sandstone plays, Devoniannearshore and shallow shelf sandstone plays, and Silurian shallow shelf sandstone plays dominate thisclassification. A similar display comparing production by age versus other geologic controls (Figure9) illustrates the dominating influence of fractured Devonian plays. Lumping all plays controlled byenvironments and all plays with geologic controls into two groups subdivided by age (Figure 10)illustrates the importance of environmental control, particularly in Devonian age rocks.

Reserve and Resource Summary. Play authors provided their best estimate of remaining gasreserves and undiscovered probable and possible resources. In many cases, authors provided morethan one estimate. Thus, different readers of the atlas could tabulate several different estimates ofremaining reserves and resources. For this reason, the numbers that follow in this section should beused for comparative purposes only, and not be repeated as the only estimate of remaining reservesand resources for different plays, ages, and rocks produced in various environments of deposition.
A conservative estimate of remaining gas resources, using estimates by play authors, ranges from 95to 158.5 tcf, where the total variation in the range is attributed to the range in resources for fracturedDevonian black shales of 26 to 89.5 tcf. The low end of the range, 95 tcf, is more than twice theestimated cumulative production (43 tcf); the upper end, 158.5 tcf, is nearly four times the estimatedcumulative production. Acceptance of either figure acknowledges that the mature Appalachian basinstill should have more gas remaining to be produced than has been produced throughout the longproductive history of the basin.
Approximately one half to three quarters of the remaining gas in the basin will be found in Devonian-aged rocks (Figure 11). Using the lower end for the range in estimated remaining resources, 95 tcf,74 percent will be in Devonian rocks, with another 10.5 percent in Pennsylvanian rocks and 7.2% inMississippian rocks. As expected, nearly 70 percent of remaining gas is expected to be found inshales (Figure 12), with less than 30 percent in sandstones, the reservoir lithology that has producedmore than 60 percent of the gas to date.
Sandstone plays, particularly fluvial-deltaic and shallow shelf sandstones, are significant whenresources are grouped by environment of deposition of reservoir rock (Figure 13) as was done withestimated gas production. Estimated resources in fluvial-deltaic sandstones represent approximately20 percent of the total; resources in shallow shelf sandstones another 10 percent. Approximately halfof the gas to be found in fluvial-deltaic plays will be in Pennsylvanian rocks (Figure 14), anotherreflection of the rather surprising estimate that 10 percent of all undiscovered resources will be inPennsylvanian-aged rocks.
Fractured reservoirs will contain from 35 to 60 percent of remaining gas, depending on which endof the estimated resource range one chooses. More than half of the remaining resources will be infractured black shale plays, with only five percent in all other fractured lithologies. When comparingremaining resources by various types of geologic controls of plays, fractured reservoirs dominateplays in this category (Figure 15).
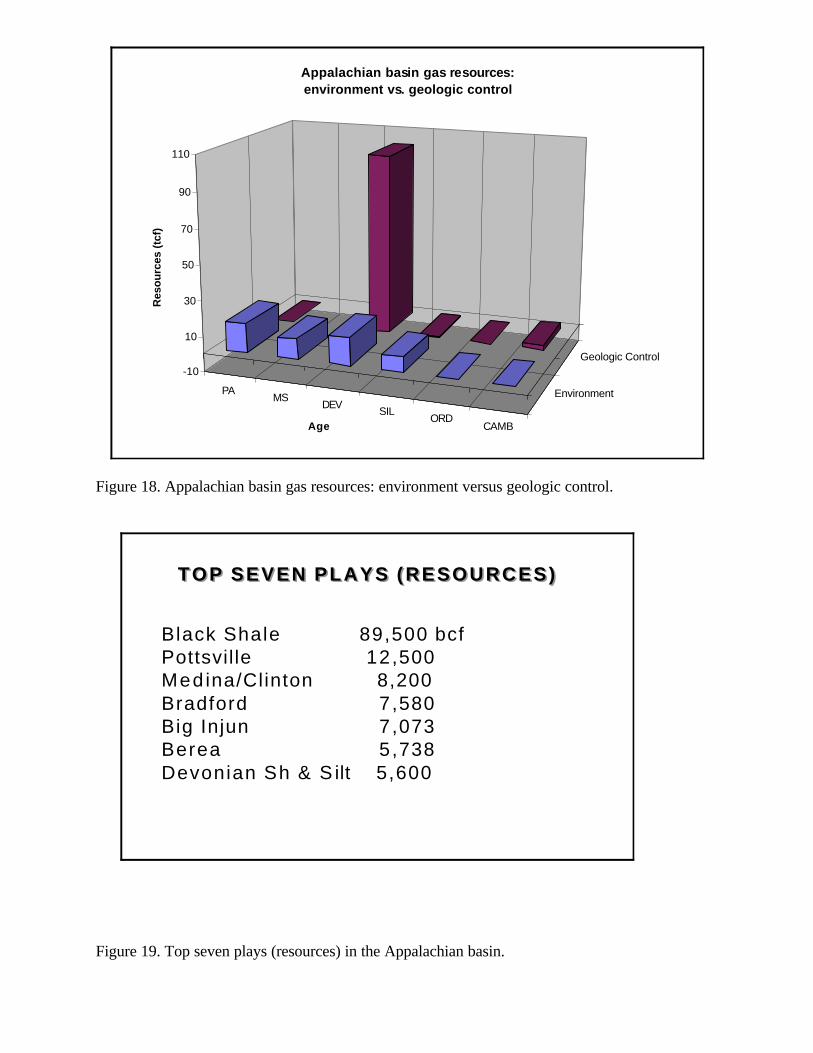
Pennsylvanian and Mississippian fluvial-deltaic sandstone plays, Silurian and Devonian shallow shelfsandstone plays, and Devonian fluvial-deltaic sandstone plays are projected to be the only importantplays controlled by environment of deposition, with a significant amount also to be found in Devoniannearshore sandstones (Figure 16). However, when comparing plays controlled by geology other thanenvironment of deposition (Figure 17), or when comparing plays controlled by environment ofdeposition of reservoir rock versus those with other geologic controls (Figure 18), the totaldominance of Devonian fractured plays is overwhelming.
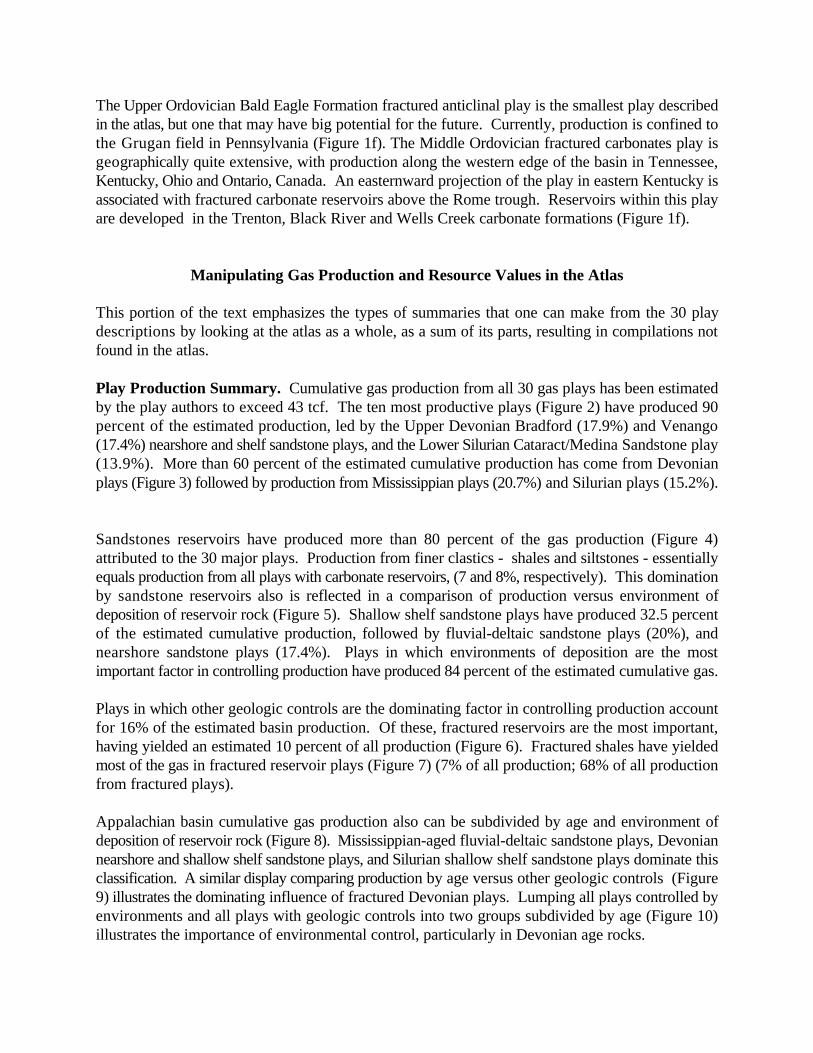
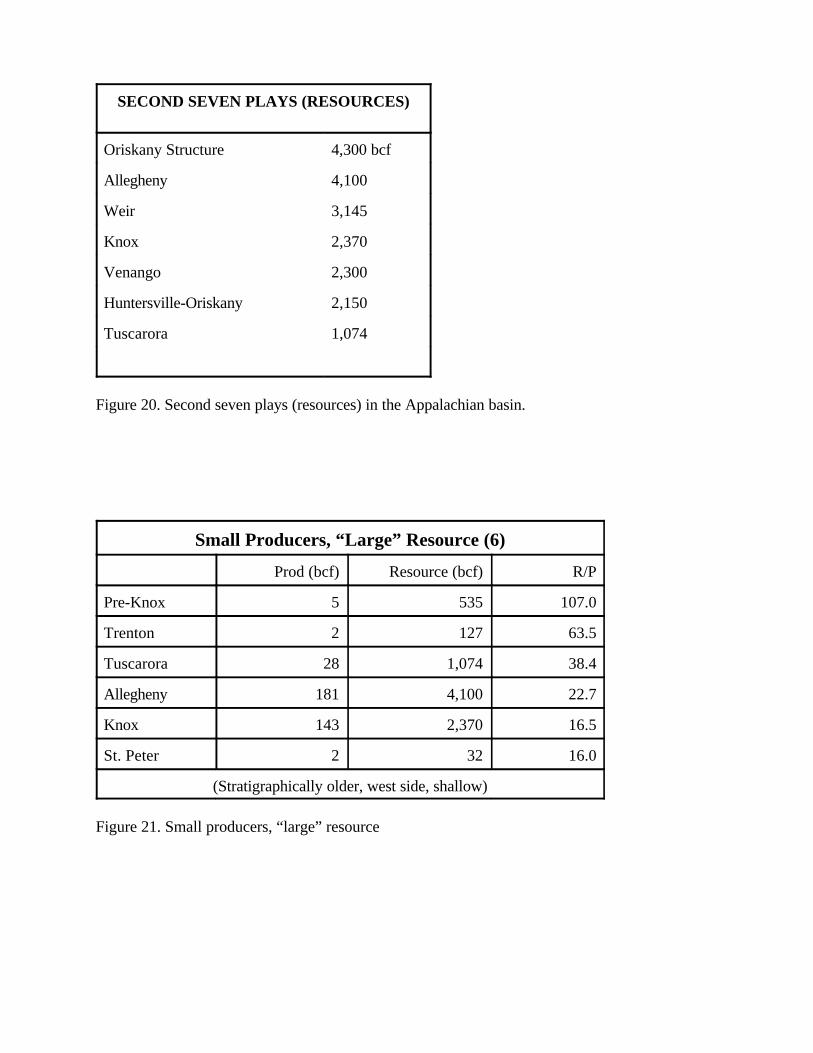
Examining What is Left Versus What Was. Of the 30 major gas plays described in the atlas,seven are expected t contain more than five tcf of undiscovered reserves, with another seven holdingmore than one tcf but less than 5 tcf. These 14 plays combined contain 98 percent of the estimatedresource. The top seven plays in terms of resources (Figure 19) are all established plays, most ofwhich have had substantial cumulative production. The second group of seven plays (Figure 20) alsoare well established, with the exception of the Knox unconformity play and the Tuscarora structuralplay. The Knox unconformity play in particular is expected to add resources with continued drillingbecause few wells have been drilled in this play relative to the other plays in this resource category.
When estimates of remaining resources are compared to estimates of cumulative production, someinteresting observations can be made. Nineteen of the 30 plays have a resource to production, orR/P, ratio greater of one. These 19 plays can, in turn, be divided into three groups, determined bythose with an R/P ratio greater than 3, with a second factor being the size of the play. Twelve playshave an R/P ratio greater than 3. Six of these plays have had relatively minor gas production, all lessthan 200 bcf (Figure 21), whereas the other six plays have been relatively higher production, from500 bcf to 3,000 bcf (Figure 22).
Four of the six smaller plays are in stratigraphically older rocks from which production has beenestablished on the western side of the basin where drilling depths to these reservoirs is considerablyshallower than in the basin center. The Lower Silurian Tuscarora Sandstone play, although also inolder rocks, is currently located in the eastern fold belt and the adjacent high-amplitude fold provence.Of these plays, only the Allegheny fluvial-deltaic sandstones, Knox unconformity and TuscaroraSandstone fractured anticlinal plays are expected to produce more than one tcf of gas.
The seven plays that have had significantly higher production also are expected to have significantremaining resources, with estimates ranging from 2,150 to 89,500 bcf. In general, these plays are instratigraphically younger rocks, Pennsylvanian to Devonian in age, located more in the center of thebasin, with a high variation in drilling depths.
The seven remaining plays with an R/P ratio greater than 1.0 (Figure 23) have a wide range inlocation, drilling depth, and age of reservoir rock. Included are three Mississippian fluvial-deltaicsandstone plays, all located in the center of the basin with drilling depths less than 4000 feet, andplays with Lower Devonian to Upper Ordovician targets located on both the western (shallow depths)and eastern (deeper depths) sides of the basin. These seven plays also exhibit a wide variation inestimated cumulative production and estimated future potential. Four of the seven have producedless than 350 bcf, whereas the other three have produced between 1.8 and 6.0 tcf. The same four areexpected to produce less than 400 additional bcf, whereas the remaining three all have largeresources, estimated to range from 3.1 to 8.2 tcf.
In contrast, the 11 remaining plays all have resource estimates that are less than their estimatedcumulative production to date. Five of these have been large plays, in terms of production, that havepassed their peak, whereas the other six are small plays that are not expected to become large plays.
The larger, historically more important plays include the three Upper Devonian sandstone plays, theBradford, Venango and Elk, and the Oriskany combination traps play and Greenbrier-Newman

shallow shelf carbonate play (Figure 24). Although each has produced more than one tcf, only theVenango and Bradford are expected to produce more than one additional tcf. However, drilling tothe other three is not expected to terminate in the near future. For example, it has takenapproximately 10,000 wells to produce the 2.8 tcf from the Greenbrier Limestone play, so it will takemany years at current drilling rates in this play to drill enough wells to find and produce the estimated800 bcf in remaining resources.
Of the remaining six historically smaller plays, none is expected to have significant future production,according to the play authors (Figure 25). These estimates beg the question, If these are reallyresource estimates, why would anyone look for new gas in these plays? The answer may be thatseveral of the play authors were too conservative to estimate undiscovered resources for small playsthat have unknown geographic boundaries. This is especially true for the Onondaga reef, Ft. Paynecarbonate mound and Bass Island plays. Estimates given by play authors are probably provedreserves, not undiscovered resources.
Where Will Explorationists Look? Each play description included figure 1, a map of the basin onwhich all known producing wells in the play were plotted, and on which a boundary of the expectedlimits of the play was drawn. These maps can be used to visually estimate which plays have beenimportant in the various Appalachian basin states, and which plays should be important in each of thestates in the future. As an exercise prior to making this workshop presentation, visual estimates weremade of the percent of wells in each play in each state, and the amount of future play area in eachstate. These percentages were then applied to estimates of cumulative production and estimatedundiscovered resources to rank the future potential of different states in the basin.
As an initial check, estimates of production within each state were compared to estimates publishedby the Independent Petroleum Association of America (IPAA) in their annual yearbook. Estimatesmade from drilling density from the figure 1's in the atlas were within 10 percent of estimatespublished by IPAA. With this in mind, we proceeded with the exercise. The estimates rank WestVirginia, Pennsylvania, Ohio, Kentucky and New York, in that order, in terms of production.
The seven most productive plays include the three Upper Devonian sandstone plays developed in theprogradational sandstone packages, and the Mississippian and Devonian fluvial-deltaic sandstoneplays, as well as the Greenbrier Limestone play, Cataract/Medina play, and Oriskany combinationtraps play. Six of the seven are important in West Virginia, although several extend into Pennsylvaniaand Kentucky. Ohio has had the benefit of most of the Clinton play.In general, the distribution of these largest plays reflects the overall distribution of production amongthe various states.
Estimates of resources in each state also were made from a visual comparison of potential areas inthe figure 1's. These estimates were compared to proven reserve figures published by IPAA todetermine if we were in the ballpark before proceeding. There appeared to be little problem withNew York, West Virginia and Ohio, but our estimates appear low in Pennsylvania, and high inKentucky. The optimism of authors in Kentucky, and the pessimism in Pennsylvania, may both berelated to the future of the fractured black shale play. Kentucky has it, Pennsylvania does not. And,

because this single play dominates the resource picture and skews all of the data, Kentucky looksgood in the future, relative to what it has produced, whereas Pennsylvania does not look as good.
Playing With the Gas Atlas Database. Because each of the 5100 gas reservoirs in the gas atlasdatabase contains a centroid location, mapping of most of the data elements in the database on aregional scale is possible. These maps could be quite simple, merely maps of centroid locations ofall fields in a play, or all fields in all plays, or contoured maps could be produced of pay thickness,average field initial open flows, or estimates of cumulative production for all fields in a play to showvariation across the productive trend. It should be noted however, that many of the 70 data elementsfor each reservoir in the database are missing for many reservoirs in many plays. Therefore, somedesired regional map cannot be produced with the data at hand.
Examples of maps produced for the Houston workshop included a series of maps with average paydepths sorted into 1000 foot increments, a time-depth analysis of drilling in two plays, maps ofreservoirs of various lithologies, and maps of reservoirs sorted by environment of deposition ofreservoir rock. Other maps that could be produced include all fractured reservoirs, separated bylithology if desired; maps of reservoirs with different traps specified; or maps of commingledproduction from stacked reservoirs and pays. In this last category, maps could be produced showingfields with multiple reservoir potential in a given play, or fields that produce from multiple plays.Depth and lithology screens can be applied as well.
Digitizing the Atlas. The suggestion has been made that eventually we should completely digitizethe atlas and make it available on a compact disc (CD rom) or on the Internet. Although we do notplan to do so in the near future, this could be accomplished with less effort then the recent projectto hand digitize one of the atlases produced by GRI and the Texas Bureau of Economic Geology.All of our text is in WordPerfect, and most of our 600 illustrations were computer drafted usingAutoCAD and smoothed using AutoScript. Software exists to transfer these digital files into aGeographic Information System (GIS) environment. Furthermore, many of our maps have latitude-longitude designations, or county or state lines, and most maps have a digital UTM designations builtinto the AutoCAD drafting files. Therefore, our drawings are in digital format, and have a digitalgeographic component that can be migrated into a GIS with more speed and efficiency than handdigitizing would require.
Summary
This five year project had two original goals: to produce and publish an atlas of gas plays in theAppalachian basin that included all known production, and to produce a digital database of allknown reservoirs in each play. Additional products that were developed include a database with10,000 geologic and engineering references, and enhanced well-specific databases in each of thefour state geologic surveys that contributed to the atlas.
The atlas can be used as a valuable reference tool, reading one play at a time to become morefamiliar with a play and characteristics of reservoirs within the play, or it can be used as a wholeto develop basin wide summaries of historical production and future potential sorted by plays,

reservoir lithology, environment of deposition of reservoir rock, or by geologic controls on playproduction. Play authors have estimated that more than 43 tcf of gas have been produced fromthee 30 plays, and 95 to 168.5 tcf remain as undiscovered resources.
The purpose of the workshop in Houston and of this report was to summarize the atlas and theeffort required to produce the atlas and data base, and to stimulate thought by users of the atlas inhow to add value to the atlas and database during their own quest for basin wide data that willhelp them make future decisions in the nation’s oldest gas producing basin.
Acknowledgments
The authors would like to acknowledge the patience and support of Harold Shoemaker, ourContracting Officer’s Representative from FETC, during the five year period required to producethis product. We also acknowledge the efforts of the individual play authors, and the fourgeological surveys who served as subcontractors for this project. Finally, we would like to thankDan Barker and Kathy Newcome for producing slides used in the workshop presentation of theAtlas of Major Appalachian Gas Plays.
References
Petroleum Technology Transfer Council, 1996, Technology and related needs of U.S. oil andnatural gas producers. 88 p.
White, D.A. 1980. Assessing oil and gas plays in facies-cycle wedges. American Association ofPetroleum Geologists Bulletin, v. 64, p. 1158-1178.
White, D. A. 1988. Oil and gas play maps in exploration and assessment. American Associationof Petroleum Geologists Bulletin, v. 72, p. 944-949.
Table 1. Play Classifications and Codes
Fluvial-Deltaic Sandstone PlaysPlay Paf: Middle Pennsylvanian Allegheny Formation/Group Sandstone PlayPlay Pps: Lower and Middle Pennsylvanian Pottsville, New River and Lee Sandstone
PlayPlay Mmc: Upper Mississippian Mauch Chunk Group and Equivalent StrataPlay Mbi: Lower Mississippian Big Injun SandstonesPlay Mws: Lower Mississippian Weir SandstonesPlay MDe: Lower Mississippian-Upper Devonian Berea and Equivalent Sandstones
Nearshore Sandstone PlaysPlay Dvs: Upper Devonian Venango Sandstones and Siltstones
Shallow Shelf Sandstone Plays
Play Dbs: Upper Devonian Bradford Sandstones and SiltstonesPlay Sns: Upper Silurian Newburg Sandstone PlayPlay Scm: Lower Silurian Cataract/Medina Group (“Clinton”) Sandstone Play
Turbidite Sandstones PlayPlay Des: Upper Devonian Elk Sandstones
Transgressive Sandstones PlaysPlay Osp: Middle Ordovician St. Peter SandstonePlay Cpk: Cambrian Pre-Knox Group Play
Shallow Marine Shelf Carbonate PlaysPlay Mgn: Upper Mississippian Greenbrier/Newman LimestonesPlay Obc: Middle and Upper Ordovician Bioclastic Carbonate (“Trenton”) Play
Reef and Carbonate Bar PlaysPlay Mpf: Lower Mississippian Fort Payne Carbonate Mound PlayPlay Dol: Middle Devonian Onondaga Limestone Reef PlayPlay Sld: Upper Silurian Lockport Dolomite-Keefer (Big Six) Sandstone
Plays Due to UnconformitiesPlay Dop: Lower Devonian Oriskany Sandstone Updip Permeability PinchoutPlay DSu: Lower Devonian-Upper Silurian Unconformity PlayPlay COk: Cambrian-Ordovician Knox Group Unconformity Play
Fractured Anticlines and Combination Traps PlaysPlay Dos: Lower Devonian Oriskany Sandstone Structural PlayPlay Doc: Lower Devonian Oriskany Sandstone Combination Traps PlayPlay Sts: Lower Silurian Tuscarora Sandstone Fractured Anticlinal Play

Fractured Reservoir PlaysPlay UDs: Upper Devonian Black ShalesPlay Dbg: Upper Devonian Fractured Black and Gray Shales and SiltstonesPlay Dho: Fractured Middle Devonian Huntersville Chert and Lower Devonian Oriskany
SandstonePlay Sbi: Upper Silurian Bass Islands TrendPlay Obe: Upper Ordovician Bald Eagle Formation Fractured Anticlinal PlayPlay MOf: Middle Ordovician Fractured Carbonates

Figures
KENTUCKY OHIO WEST VIRGINIA SOUTHWESTERN NORTHWESTERN NEW YORKPENNSYLVANIA PENNSYLVANIA
PENNSYLVANIAN
UPPER CONEMAUGH CONEMAUGH CONEMAUGH
MONONGAHELA MONONGAHELA MONONGAHELAGROUP GROUP GROUP
Goose Run MinshallMurphyMoundsville
GROUP GROUP GROUPFirst Cow Run Cow RunMacksburg 300-Foot Little Dunkard Little Dunkard
Big Dunkard Big Dunkard
M BREATHITT ALLEGHENY ALLEGHENY ALLEGHENY ALLEGHENYI FORMATION OF GROUP GROUP GROUP GROUPD ALLEGHENYD GROUP LE
Second Cow Run Burning Springs GasMacksburg 500-Foot Gas
Paf
Lower Gas Upper GasHorseneck Lower Gas
Paf Paf
L OF POTTSVILLE SANDSTONE SANDSTONE SANDSTONE GROUPO GROUPWER
LEE FORMATION POTTSVILLE POTTSVILLE POTTSVILLE POTTSVILLE
Salt SandFirst SaltSecond SaltHortonThird SaltWilliamsburg
Macksburg 700-Foot First Salt First Salt
Salt Second Salt Second SaltSharon (Maxton)
Pps
Third Salt Third Salt
Pps Pps
Figure 1a. Stratigraphy of the Pennsylvanian System (Alleghenian flysch). Formallithostratigraphic terminology shown in bold. Commonly used drillers’ terminology shown initalics. Plays are represented by alpha designation.

KENTUCKY OHIO WEST VIRGINIA SOUTHWESTERN NORTHWESTERN NEW YORKPENNSYLVANIA PENNSYLVANIA
MISSISSIPPIAN
UPPER
PENNINGTON MAUCH CHUNK MAUCH CHUNK FORMATION GROUP FORMATION
Ravencliff
CARTER CAVESSANDSTONE
MaxonBradleyLittle Lime
Mmc
PrincetonRavencliff
MaxonLower MaxonBlue Monday
Mmc
Maxton
Mmc
NEWMAN MAXVILLE GREENBRIER GREENBRIERLIMESTONE LIMESTONE LIMESTONE FORMATION AND
Big LimeKeener
Mgn
Jingle Rock
Mgn
Big Lime
Keener
Greenbrier BigInjun
Mgn
LOYALHANNA FORMATION
Keener
Mgn
LOWER
FORT PAYNEFORMATION
Mfp
BORDEN LOGAN MACCRADY BURGOONFORMATION FORMATION FORMATION SANDSTONE
Big Injun Keener Red InjunKeener
Mbi
CUYAHOGA PRICEFORMATION FORMATION
Injun Big InjunSquaw Squaw
Mbi Mbi
Big Injun
Mbi
BORDEN CUYAHOGA PRICE SHENANGO SHENANGOFORMATION FORMATION FORMATION FORMATION AND FORMATION AND
First Weir Weir Upper WeirSecond Weir Lower Weir
Mws MwsMws
CUYAHOGA CUYAHOGAFORMATION FORMATION
SquawUpper 30-Foot
Mws
Figure 1b. Stratigraphy of the Mississippian System (Lower Carboniferous flysch, molasse, andstable shelf sequence and Mississippian portion of Acadian flysch sequence). Formallithostratigraphic terminology shown in bold. Commonly used drillers’ terminology shown initalics. Plays are represented by alpha designation.

KENTUCKY OHIO WEST VIRGINIA SOUTHWESTERN NORTHWESTERN NEW YORKPENNSYLVANIA PENNSYLVANIA
DE UV PO PN EI R GantzAN
SUNBURY SHALE SUNBURY SHALE SUNBURY SHALE BEREA SANDSTONE BEREA SANDSTONECoffee Shale Coffee Shale
BEREA BEREA Berea-CorrySANDSTONE SANDSTONE Berea BEDFORD SHALE
Berea First Berea SANDSTONE
MDe
BEDFORD SHALESecond Berea
MDe MDe
RIDDLESBURG MEMBER OF AND CORRYPRICE FORMATION AND SANDSTONE
BEREA SANDSTONE
CLOYD MEMBER OF PRICE CUSSEWAGO FORMATION SANDSTONE
Berea -MurrysvilleBEDFORD SHALE
CUSSEWAGO
Cussewago
MDe
Cussewago
MDe
CLEVELAND CLEVELAND OSWAYO OSWAYO "VENANGO GROUP" RICEVILLE CONEWANGOSHALE MEMBER SHALE MEMBER MEMBER OF MEMBER OF FORMATION GROUPOF OHIO SHALE OF OHIO SHALE PRICE PRICE AND OSWAYO
UDs
Gantz
UDs
FORMATION FORMATION FORMATION
Dbg First VenangoGantz
CHAGRIN SHALE CHAGRIN SHALE VENANGO VENANGO "VENANGO GROUP"MEMBER OF OHIO MEMBER OF FORMATION FORMATION
SHALE OHIO SHALE AND AND
Gordon
Fifth
Dbg Dvs
GREENLAND GREENLANDGAP GAP
FORMATION FORMATIONFifty-Foot Fifty-FootThirty-Foot Thirty-FootGordon Stray Gordon StrayGordon GordonFourth FourthFifth FifthBayard BayardElizabeth ElizabethWarren Warren
Dbg Dvs
Hundred-FootFifty-FootThirty-FootNineveh-SneeGordon Stray-GordonFourthFifth/McDonaldBayardElizabethSweet Richard
CHADAKOINFORMATION
First Warren
Red ValleySecond Venango
Third Venango StrayThird Venango
CHADAKOINFORMATION
First Warren
DvsDbg
CONNEAUTGROUP
Figure 1c. Stratigraphy of the upper half of the Upper Devonian Series (part of the Acadian flysch). Formallithostratigraphic terminology shown in bold. Commonly used drillers’ terminology shown in italics. Plays arerepresented by alpha designation.
KENTUCKY OHIO WEST VIRGINIA SOUTHWESTERN NORTHWESTERN NEW YORKPENNSYLVANIA PENNSYLVANIA
DE UV PO PN EI RAN
OHIO CHAGRIN GREENLAND GREENLAND "BRADFORD GROUP" "BRADFORD CANADAWAYSHALE SHALE GAP GAP GROUP" GROUP
Cinnamon Cooper Stray
Dbg
FORMATION FORMATIONUpper Warren
Lower Warren
Speechley StraySpeechleyTionaFirst BalltownSecond BalltownSheffieldFirst BradfordSecond BradfordThird Bradford
Kane
Dbs
Second Warren
Third WarrenFirst Bradford/GladeClarendon StrayClarendonBalltownCherry GroveSpeechley/Tiona
Second BradfordHarrisburg RunSlivervilleThird BradfordLewis RunKane
Dbs
GladeFirst Bradford
Chipmunk
Second BradfordHarrisburg Run
RichburgThird BradfordWaugh and Porter
Dbs
HURON SHALE MEMBER OFOHIO SHALE
Big Cinnamon
UDs Dbg
Speechley
Balltown
Bradford
Riley
Dbs
JAVA BRALLIER BRALLIER "ELK GROUP" "ELK GROUP" WEST FALLSFORMATION FORMATION FORMATION GROUP
Dbg
Benson First Elk ElkLeopold Second ElkAlexander Third Elk Sartwell/HaskillSecond Elk Kane HumphreyThird ElkHaverty BRALLIER JAVA FORMATIONFoxSycamore
Dbg Des
First ElkSecond Elk
Fourth Elk
FORMATION
Des Des
UDs
WEST FALLS TULLY TULLY RHINESTREET RHINESTREET RHINESTREETFORMATION LIMESTONE LIMESTONE SHALE SHALE SHALEINCLUDING MAHANTANGO MAHANTANGO MEMBER OF WEST MEMBER OF WEST MEMBER OF
RHINESTREET FORMATION FORMATION FALLS FORMATION FALLS FORMATION WESTSHALE MARCELLUS MARCELLUS SONYEA FORMATION SONYEA FALLS
MEMBER SHALE SHALE GENESEE FORMATION FORMATION
MARCELLUSSHALE
UDs UDs Dbg
FORMATION GENESEE SONYEATULLY LIMESTONE FORMATION FORMATIONHAMILTON GROUP TULLY GENESEE
INCLUDING LIMESTONE FORMATIONMARCELLUS HAMILTON GROUP HAMILTON GROUP
SHALE INCLUDING INCLUDING
Dbg
MARCELLUS MARCELLUSSHALE SHALE
Dbg
Figure 1d. Stratigraphy of the lower half of the Upper Devonian Series (part of the Acadian flysch). Formallithostratigraphic terminology shown in bold. Commonly used drillers’ terminology shown in italics. Plays arerepresented by alpha designation.
KENTUCKY OHIO WEST VIRGINIA SOUTHWESTERN NORTHWESTERN NEW YORKPENNSYLVANIA PENNSYLVANIA
DEVONIAN
MIDDLE DSu
ONONDAGA ONONDAGA ONONDAGA ONONDAGA ONONDAGA ONONDAGALIMESTONE LIMESTONE LIMESTONE FORMATION FORMATION LIMESTONE
Corniferous Big Lime
Dol Dol
L FORMATION CHERT CHERT FORMATIONOWER
Dsu
BOIS BLANC HUNTERSVILLE HUNTERSVILLE BOIS BLANC
Dho Dho"OriskanySandstone"
ORISKANY ORISKANY ORISKANY RIDGELEY ORISKANYSANDSTONE SANDSTONE SANDSTONE SANDSTONE SANDSTONE
DSu Dop, Doc Dos Doc, Dos
SHRIVERFORMATION
Dos, Doc Dop, Dos
S PI EL RU RIAN
U LIMESTONEP
HELDERBERG HELDERBERG HELDERBERG MANDATA SHALEFORMATION FORMATION FORMATION CORRIGANVILLE
DSu
LIMESTONENEW CREEK
BASS ISLANDS BASS ISLANDS KEYSER BASS ISLANDS BASS ISLANDSFORMATION DOLOMITE FORMATION FORMATION FORMATION
DSu
Bass Islands zone Bass Islands zone
Sbi Sbi
SALINA SALINA SALINA SALINA GROUP SALINA SALINAFORMATION FORMATION FORMATION FORMATION FORMATION
DSu
Newburg
Sns
LOCKPORT LOCKPORT LOCKPORT LOCKPORT LOCKPORT LOCKPORTDOLOMITE FORMATION DOLOMITE DOLOMITE DOLOMITE DOLOMITE
Sld Sld Sld Sld
L FORMATIONOWE "Clinton sandstone"R
BIG SIX CLINTON GROUP KEEFER CLINTON GROUP CLINTON GROUP CLINTON GROUPSANDSTONE FORMATION
Big SixROSE HILL SHALE
Sld
Packer ShellROSE HILL
Sld
Scm
CATARACT TUSCARORA TUSCARORA MEDINA GROUP MEDINA GROUPFORMATION SANDSTONE SANDSTONE INCLUDING INCLUDING
Stray ClintonRed ClintonWhite ClintonMedina
Scm Sts Sts
GRIMSBY GRIMSBYSANDSTONE SANDSTONECABOT HEAD WHIRLPOOL
SHALE SANDSTONEWHIRLPOOLSANDSTONE
Scm Scm
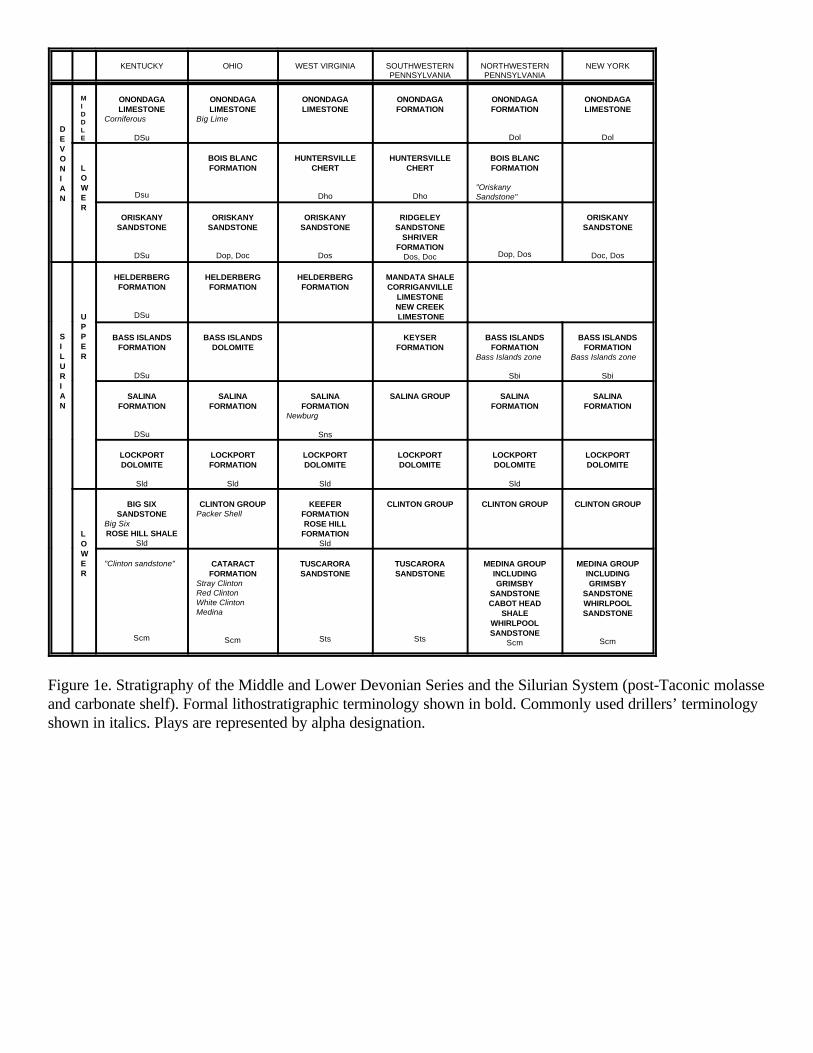
Figure 1e. Stratigraphy of the Middle and Lower Devonian Series and the Silurian System (post-Taconic molasseand carbonate shelf). Formal lithostratigraphic terminology shown in bold. Commonly used drillers’ terminologyshown in italics. Plays are represented by alpha designation.

KENTUCKY OHIO WEST VIRGINIA SOUTHWESTERN NORTHWESTERN NEW YORKPENNSYLVANIA PENNSYLVANIA
ORDOVICIAN
UPPER
DRAKES QUEENSTON JUNIATA QUEENSTON QUEENSTON QUEENSTONFORMATION SHALE FORMATION SHALE/JUNIATA SHALE/JUNIATA SHALE
RICHMOND GROUP FORMATION FORMATIONQueenston
Red Medina
MAYSVILLE GROUP OSWEGO BALD EAGLE REEDSVILLE OSWEGOEDEN GROUP SANDSTONE SANDSTONE SHALE SANDSTONE
MARTINSBURG REEDSVILLE UTICA SHALE LORRAINEFORMATION SHALE THROUGH GROUP
UTICA SHALE HATTERTHROUGH FORMATIONHATTER
FORMATION
Obe
TRENTON GROUP TRENTON TRENTON LOYSBURG LOYSBURG TRENTON
ObcLIMESTONE FORMATION FORMATION LIMESTONE
MOf
M STONES RIVER- BLACK RIVER BLACK RIVER BEEKMANTOWN BEEKMANTOWN BLACK RIVERI HIGH BRIDGE LIMESTONE LIMESTONE GROUP GROUP GROUPD GROUP GULL RIVER WELLS CREEKD LIMESTONE FORMATIONL WELLS CREEKE FORMATION
St. Peter Sandstone
Osp MOf
L KNOX GROUP KNOX GROUP BEEKMANTOWN TRIBES HILLO BEEKMANTOWN GROUP FORMATIONW GROUPE ROSE RUNR SANDSTONE
COPPER RIDGEDOLOMITE
COk
COk
C FORMATIONAMBRIAN
U ROSE RUN ROSE RUN GATESBURG GATESBURG LITTLE FALLSP TREMPEALEAU COPPER RIDGE FORMATION FORMATION FORMATIONP COPPER RIDGE DOLOMITE WARRIOR WARRIOR THERESAE DOLOMITE FORMATION FORMATION FORMATIONR POTSDAMKrysik sandstone
COkCOk
M CONASAUGA CONASAUGA CONASAUGA POTSDAM POTSDAMI FORMATION FORMATION FORMATION SANDSTONE SANDSTONEDDLE
ROME FORMATION ROME FORMATION ROMETOMSTOWN FORMATIONDOLOMITE TOMSTOWN
Cpk
DOLOMITE
LOWER
ANTIETAM MT. SIMON MT. SIMONSANDSTONE SANDSTONE SANDSTONE
Basal Sandstone Basal Sandstone
Cpk
Figure 1f. Stratigraphy of the Ordovician and Cambrian Systems (Taconic flysch and Iapetan rift and passivemargin sequences). Formal lithostratigraphic terminology shown in bold. Commonly used drillers’ terminologyshown in italics. Plays are represented by alpha designation.
Most Productive Gas Plays
• Bradford (17.9%)
• Venango (17.4)
• Cataract/Medina (13.9)
• Big Injun (9.2)
• Elk (7.0)
• Devonian Black Shales (7.0)
• Greenbrier/Newman (6.5)
• Berea (4.4)
• Weir (4.2)
• Oriskany Combination Traps (3.0)
ORD (0.31%)
MS (20.69%)PA (1.58%)CAMB (0.34%)
SIL (15.23%)DEV (61.84%)
Appalachian basin gas productionby age
Figure 2. Most productive gas plays in the Appalachian basin.
Figure 3. Appalachian gas production by age.
Appalachian basin gas production by reservoir lithology
35.626
3.09 3.6
0.65
0
4
8
12
16
20
24
28
32
36
Sandstone Carbonate Fine Clastics Chert
Lithology
Pro
du
ctio
n (
tcf)
Appalachian basin gas production by environment of reservoir rock
8.668
7.5
13.99
3 2.802
0.1620
2
4
6
8
10
12
14
16
f luvialdeltaic
nearshore shallowshelf ss
turbidites shallowshelf ls
reefs &bioherms
Environment
Pro
du
ctio
n (
tcf)
Figure 4. Appalachian basin gas production by reservoir lithology.
Figure 5. Appalachian basin gas production by environment of reservoir rock.
Appalachian basin gas production by geologic control
0.935
0.335
1.3
4.394
0
0.5
1
1.5
2
2.5
3
3.5
4
4.5
5
structural unconformities combination fractured
Geological Control
Pro
du
ctio
n (
tcf)
Shale & siltstone (13.65%)Chert (14.79%)Dolomite (0.36%)
Sandstone (0.18%)Limestone (2.73%)
Black shale (68.27%)
Appalachian basin gas productionin fractured plays by lithology
Figure 6. Appalachian basin gas production by geologic control.
Figure 7. Appalachian basin gas production in fractured plays by lithology.

PA
MS
DE
V
SIL
OR
D
CA
MB
reefs & bioherms
f luvial deltaic
nearshore
shallow shelf ss
shallow shelf lsturbidites
0
1
2
3
4
5
6
7
8P
rod
uct
ion
(tc
f)
Age
Environments:
Appalachian basin gas production by age and environment
MS
DE
V
SIL
OR
D
CA
MB
structural
unconformitiescombination
fractured
0
1
2
3
4
5
Pro
du
ctio
n (
tcf)
Age
Geo
log
ic
Co
ntr
ol
Appalachian basin gas production by age and geologic control
Figure 8. Appalachian basin gas production by age and environment.
Figure 9. Appalachian basin gas production by age and geologic control.

PA
MS
DE
V
SIL
OR
D
CA
MB
Geologic ControlsEnvironment0
5
10
15
20
25P
rod
uct
ion
(t
cf)
Age
Appalachian basin gas production: environment vs. geologic control
MS (7.19%)
PA (10.52%)SIL (6.04%)ORD (0.13%)CAMB (1.83%)
DEV (74.28%)
Appalachian basin gas resourcesby age
Figure 10. Appalachian basin gas production: environment versus geologic control.
Figure 11. Appalachian basin gas resources by age.

Sandstone (28.36%)
Chert (1.57%)
Carbonate (0.74%)
Fine clastics (69.33%)
Appalachian basin gas resourcesby reservoir lithology
Appalachian basin gas resources by environment of reservoir rock
33.012
2.3
15.854
0.132 0.927 0.1980
5
10
15
20
25
30
35
fluvialdeltaic
nearshore shallowshelf ss
turbidites shallowshelf ls
reefs &bioherms
Environment
Res
ou
rces
(tc
f)
Figure 12. Appalachian basin gas resources by reservoir lithology.
Figure 13. Appalachian basin gas resources by environment of reservoir rock.

Appalachian gas resources in fluvia l-deltaic sandstones by age
PA50%
MS32%
DEV18%
combination (0.33 )unconformities (2.53 )
structural (5.941 )
fractured (97.313 )
Appalachian basin gas resourcesby geologic control
Figure 14. Appalachian basin gas resources in fluvial-deltaic sandstones by age.
Figure 15. Appalachian basin gas resources by geologic control.

PA MS DEV SIL ORD
reefs and bioherms
fluvial deltaic
nearshore
shallow shelf ss
shallow shelf lsturbidites
0
2
4
6
8
10
12
14
16
18
Res
ou
rces
(tc
f)
Age
Environments:
Appalachian basin gas resources by age and environment
DEV SIL ORDCAMB
structural
unconformities
combination
fractured
0
10
20
30
40
50
60
70
80
90
100
Res
ou
rces
(tc
f)
Age
Geologic Control
Appalachian basin gas resources by geologic control
Figure 16. Appalachian basin gas resources by age and environment.
Figure 17. Appalachian basin gas resources by geologic control.
PAMS
DEVSIL
ORDCAMB
Environment
Geologic Control-10
10
30
50
70
90
110R
eso
urc
es (
tcf)
Age
Appalachian basin gas resources: environment vs. geologic control
TOP SEVEN PLAYS (RESOURCES)TOP SEVEN PLAYS (RESOURCES)
Black Shale 89,500 bcfPottsville 12,500Medina/Clinton 8,200Bradford 7 ,580Big Injun 7 ,073Berea 5 ,738Devonian Sh & S ilt 5,600
Figure 18. Appalachian basin gas resources: environment versus geologic control.
Figure 19. Top seven plays (resources) in the Appalachian basin.
SECOND SEVEN PLAYS (RESOURCES)
Oriskany Structure 4,300 bcf
Allegheny 4,100
Weir 3,145
Knox 2,370
Venango 2,300
Huntersville-Oriskany 2,150
Tuscarora 1,074
Figure 20. Second seven plays (resources) in the Appalachian basin.
Small Producers, “Large” Resource (6)
Prod (bcf) Resource (bcf) R/P
Pre-Knox 5 535 107.0
Trenton 2 127 63.5
Tuscarora 28 1,074 38.4
Allegheny 181 4,100 22.7
Knox 143 2,370 16.5
St. Peter 2 32 16.0
(Stratigraphically older, west side, shallow)
Figure 21. Small producers, “large” resource

Larger Producers, large Resource (6)
Prod (bcf) Resource (bcf) R/P
Black Shale 3,000 89,500 29.8
Pottsville 500 12,580 25.2
Shale & Siltst 600 5,600 9.3
Oriskany Structure 900 4,300 4.8
Huntersville-Oriskany 650 2,150 3.3
Berea 1,886 5,738 3.0
(Stratigraphically younger, center, depth varies)
Figure 22. Larger producers, large resource
Remaining Plays, R/P > 1.0
Prod (bcf) Resource (bcf) R/P
Mauch Chunk 336 376 1.1
Big Injun 3,965 7,073 1.8
Weir 1,800 3,145 1.7
Oriskany Pinchout 82 133 1.6
Lockport 120 188 1.6
Clinton 6,000 8,200 1.4
Bald Eagle 8 9 1.4
(Wide range in size and age)
Figure 23. Remaining Plays, R/P > 1.0

Large Plays, R/P < 1.0
Prod (bcf) Resource (bcf) R/P
Elk 3,000 132 .04
Oriskany Comb 1,300 330 .25
Greenbrier 2,800 800 .29
Venango 7,500 2,300 .31
Bradford 7,700 7,580 .98
Figure 24. Large plays, R/P < 1.0
Smaller Plays, R/P < 1.0
Prod (bcf) Resource (bcf) R/P
Onondaga Reefs 32 4 .13
Dev-Sil Unconf 110 27 .25
Newburg 290 74 .26
Ordovician Carb 120 42 .35
Ft. Payne 14 6 .43
Bass Islands 16 12 .75
(Proved reserves, probable resources)
Figure 25. Smaller plays, R/P < 1.0