Embed Size (px)
Citation preview

WIND FARM SITE SUITABILITY ANALYSIS IN LAKE ERIE USING WEB-BASED PARTICIPATORY GIS (PGIS)
Addisu Mekonnen
A Thesis
Submitted to the Graduate College of Bowling Green State University in partial fulfillment of
the requirements for the degree of
MASTER OF SCIENCE
May 2014
Committee:
Peter Gorsevski, Advisor
Kurt Panter
Margaret Yacobucci

© 2014
Addisu Mekonnen
All Rights Reserved
iii
ABSTRACT
Peter Gorsevski, Advisor
This study presents the design and implementation of a web-based
Participatory Geographic Information System (PGIS) framework intended for offshore
wind suitability analysis. The PGIS prototype presented here integrates GIS and decision-
making tools that are intended to involve different stakeholders and the public for solving
complex planning problems and building consensus. Public involvement from the early
planning stage of projects with a spatial nature is very important for future legitimacy and
acceptance of these projects. Therefore, developing and executing a system that facilitates
effective public involvement for resolving contentious issues can help fostering long-
lasting agreements. The prototype here is a distributed and asynchronous PGIS that
combines a discussion forum, mapping tool and decision tool. The PGIS is implemented
following a thin-client server environment with three-tier architecture and the potential
strengths and benefits of this PGIS are demonstrated in a hypothetical case study in Lake
Erie, northern Ohio. In the hypothetical case study, participants evaluate the importance
of three decision alternatives using different evaluation criteria for expressing their
individual preferences. The individual preferences are aggregated by the Borda Count
(BC) method for generating the group solution, which is used for synthesizing the
different evaluation aspects such as the importance of criteria, ranking of the decision
alternatives and planning issues related to environmental and socio-economic concerns
from the participants.

iv
This is dedicated to my family and friends. Thank you for your unreserved love, support,
and encouragement

v
ACKNOWLEDGMENTS
This investigation is part of the Coastal Ohio Wind Project that was supported by
the US Department of Energy Award Number DE-FG36-06GO86096; the support of this
institution is gratefully acknowledged.
I would like to pass my special thanks to my advisor Dr. Peter Gorsevski for your
unreserved guidance, support, and mentorship throughout my course of study as your
student. Your thoughtful and kind encouragement helped me to learn new technologies
and develop my knowledge to the next level. Also, thanks to my committee members Dr.
Kurt Panter and Dr. Peg Yacobucci as both of you being part of this research and
provided your advice and support. Thank you to the Ohio Department of Natural
Resources (ODNR) for providing me all the spatial data used in this research.
I would like to thank Dr. Jeff Snyder who was always willing to help me. I also
want to thank all members of Geology Department in BGSU especially Bill and Pat.
Finally, I would like to thank my family and Yodi, my love; I would not be where
I am without your help. I also would like to thank my friends Yonas and Mesay who were
always supporting and encouraging me for the last 2 years.

vi
TABLE OF CONTENTS
Page
INTRODUCTION ................................................................................................................. 1
CHAPTER I. METHODOLOGY ......................................................................................... 7
1.1. The Conceptual Framework ................................................................................ 7
1.2. System Architecture ............................................................................................ 9
CHAPTER II. STUDY AREA AND DATA ........................................................................ 14
2.1. Study Area .......................................................................................................... 14
2.2. Decision Making Alternatives ............................................................................ 15
2.2.1. Bird Habitat .......................................................................................... 16
2.2.2. Fish Habitat .......................................................................................... 17
2.2.3. Sport Fishery Effort ............................................................................. 17
2.2.4. Commercial Fishery Effort .................................................................. 18
2.2.5. Utilities (Transmission) ....................................................................... 18
2.2.6. Population Density ............................................................................... 19
2.2.7. Navigable Waterways .......................................................................... 19
2.2.8. Distance from Shore ............................................................................ 20
CHAPTER III. PROTOTYPE IMPLEMENTATION ......................................................... 21
3.1. User Interface and System Description............................................................... 21
CHAPTER IV. DISCUSSION.............................................................................................. 26
CHAPTER V. CONCLUSIONS .......................................................................................... 29
REFERENCES ...................................................................................................................... 31
APPENDIX A. FIGURES .................................................................................................... 37

vii
APPENDIX B. TABLES ...................................................................................................... 49
APPENDIX C. CODE .......................................................................................................... 51

1
INTRODUCTION
Global warming resulting from human-induced emissions poses important policy
challenges that can have significant implications for macroeconomic stability and economic
well-being. Today's economy, which is mainly based on depleted fossil fuels, minerals and oil,
could not be sustained if technologies remain constant while energy demands increase
substantially (Grassi et. al., 2012; IPCC, 2011; Sadur et al., 2011). The need to control human-
induced atmospheric emissions of greenhouse gases requires development of other clean and
renewable sources of energy. Renewable energy sources (RES) include replenishable natural
resources such as geothermal, solar, bioenergy, ocean, and wind (Leung and Yang, 2012; IPCC,
2011; Mirhosseini et al., 2011; Molina-Ruiz et al., 2011). Among these RES, currently wind
energy is given the most attention due to its widespread distribution, economic viability,
significant market value, potential in power generation, and presence of advanced technology
(Adelaja, 2012; Coskun and Türker, 2012; Limpo, 2011; Snyder and Kaiser, 2009).
Offshore wind energy in the U.S. represents one of the largest RES. Thus, developing
offshore wind generating capacity is one of the most important steps for reducing global
warming. For instance, some of the future plans of the U.S. Department of Energy (USDOE)
examine the technical feasibility of generating 20% of the country’s electricity demand from
wind energy by 2030 (NREL, 2010; AWEA, 2008). Short term implementation of those plans
suggest that net generation from wind power increased by 28.1 % from 2009 to 2010, bringing
its share of total generation to 2.3 percent (USEIA, 2011). Offshore wind energy development in
the U.S. is in its early stage; however, there are some projects which are in the planning phase.
These include the Cape Wind project (Massachusetts), the Bluewater Wind project (Delaware),

2
the LIPA offshore wind park (New York), and the Galveston offshore wind project (Texas)
(USDOE, 2013; Leung and Yang, 2012; Snyder and Kaiser, 2009).
Over the last decade, the world’s wind power generation capacity has been growing
rapidly. This increase is due to implementation of federal policy initiatives promoting the
development of offshore wind farms and other advancements achieved by wind turbine
technologies such as efficiency and scalability (Grassi et al., 2012; Leung and Yang, 2012;
Omitaomu et al., 2012). At present, there is an increasing interest in development of offshore
wind farms due to several advantages: stronger and constant offshore winds that exist in the
offshore environment; closeness to coastal urban load centers, where most electrical energy
demand exists and opportunities for wind development on land are limited; and efficiency of the
offshore wind turbines, which can produce more electricity and can maintain higher levels of
electricity generation for longer periods of time (Adelaja et al., 2012; Landry et al., 2012, Leung
and Yang, 2012; O’Keeffe and Haggett, 2012; Vagiona and Karanikolas, 2012; Esteban et al.,
2011; Dvorak et al., 2010).
One of the major problems in offshore development is identifying the appropriate site for
wind energy farms. Determining wind farm site suitability is a difficult, complex, and protracted
process that requires evaluation of many different criteria (Grassi et. al., 2012; Tegou et al.,
2010) since it combines environmental, economic, and social considerations. Environmental
considerations are important and are routinely carried out for wind farm establishment (Leung
and Yang, 2012, Snyder and Kaiser, 2009). For example, some environmental impacts of wind
farms include turbine noise, visual effect and aesthetic and other impacts on humans, and effects
on ecosystems, including the killing of wildlife, especially birds and bats (Leung and Yang,
2012; O’Keeffe and Haggett, 2012; Saidur et al., 2011). Economic considerations in the siting of
wind farms include the costs associated with the acquisition, development, and operation of the

3
site (Grassi et al., 2012; Dvorak et al., 2010). Social and political considerations are related to
acceptance of a proposed offshore wind project by both residents along the shore, other
stakeholders from tourism and fishing industries, and policy makers. Their concerns include fear
about harm to the local environment leading to negative impacts on the fish stocks, and loss of
property value and income from tourism (Haggett, 2011; Blyth-Skyrme, 2010; Firestone et al.,
2009). The differences in viewpoints among stakeholders and the spatial nature of the
information regarding offshore wind siting problems require a tool that can handle these issues
effectively.
In recent years, Geographic Information System (GIS) has become a major tool used to
select the most suitable sites for offshore wind installation. For instance, Beacham et al. (2009)
used Boolean overlay analysis in ArcGIS to identify suitable offshore wind sites in South
Carolina. In this study, the raster format criteria were reclassified as suitable (1) and non-
suitable (0); then they used Boolean multiplication of the reclassified layers to identify suitable
sites. Another study accomplished by Schillings et al. (2011) illustrated the use of a web-based
spatial decision support system (SDSS) to locate and assess offshore wind potential at the North
Sea. This SDSS tool uses overlay analysis of raster layers weighted by user’s inputs to generate
the final offshore wind farm suitability map. Similarly, Vagiona and Karanikolas (2012) used
GIS and multi-criteria decision making (MCDM) to identify offshore wind sites in Greece. In
this research, Vagiona and Karanikolas applied constraints to all coastal areas to identify places
that do not fulfill a certain set of criteria and excluded them from further analysis. Then, they
used Analytical Hierarchy Process (AHP) and pairwise comparison of the evaluation criteria to
determine weights that show the importance of each criterion. They also performed pairwise
comparisons of the candidate sites with respect to each criterion generating weights and then
aggregated the weights for each candidate site from each criterion to locate the most appropriate
4
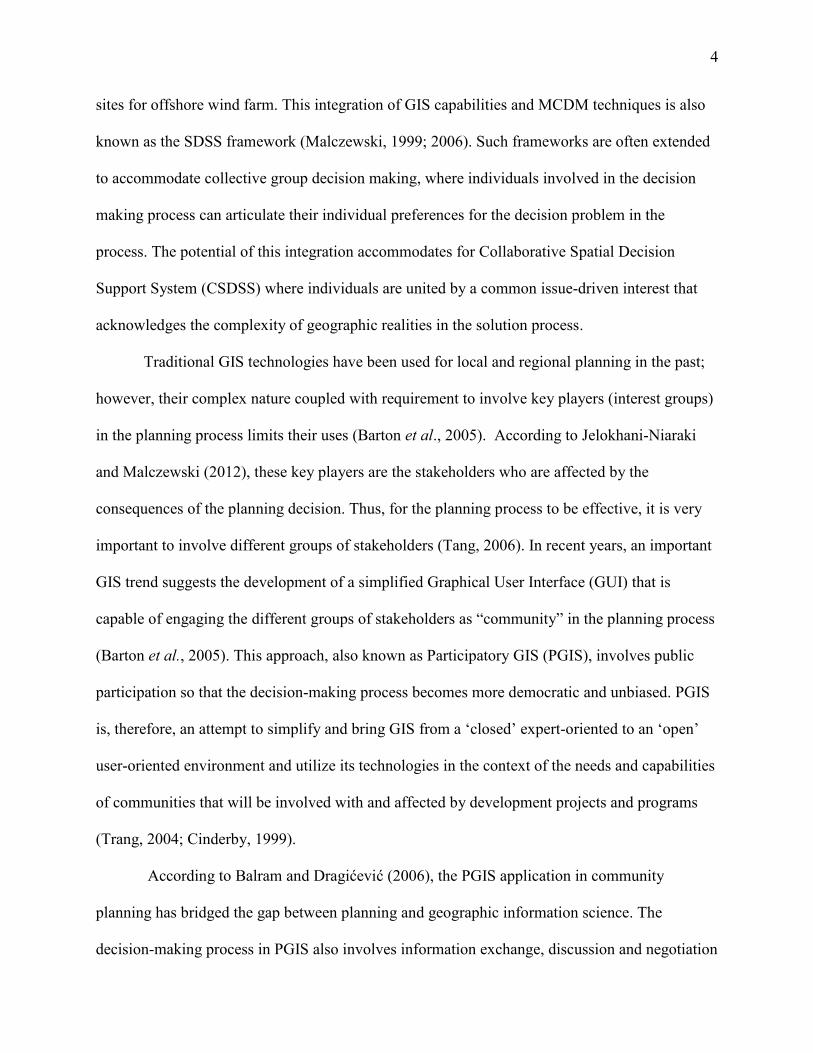
sites for offshore wind farm. This integration of GIS capabilities and MCDM techniques is also
known as the SDSS framework (Malczewski, 1999; 2006). Such frameworks are often extended
to accommodate collective group decision making, where individuals involved in the decision
making process can articulate their individual preferences for the decision problem in the
process. The potential of this integration accommodates for Collaborative Spatial Decision
Support System (CSDSS) where individuals are united by a common issue-driven interest that
acknowledges the complexity of geographic realities in the solution process.
Traditional GIS technologies have been used for local and regional planning in the past;
however, their complex nature coupled with requirement to involve key players (interest groups)
in the planning process limits their uses (Barton et al., 2005). According to Jelokhani-Niaraki
and Malczewski (2012), these key players are the stakeholders who are affected by the
consequences of the planning decision. Thus, for the planning process to be effective, it is very
important to involve different groups of stakeholders (Tang, 2006). In recent years, an important
GIS trend suggests the development of a simplified Graphical User Interface (GUI) that is
capable of engaging the different groups of stakeholders as “community” in the planning process
(Barton et al., 2005). This approach, also known as Participatory GIS (PGIS), involves public
participation so that the decision-making process becomes more democratic and unbiased. PGIS
is, therefore, an attempt to simplify and bring GIS from a ‘closed’ expert-oriented to an ‘open’
user-oriented environment and utilize its technologies in the context of the needs and capabilities
of communities that will be involved with and affected by development projects and programs
(Trang, 2004; Cinderby, 1999).
According to Balram and Dragićević (2006), the PGIS application in community
planning has bridged the gap between planning and geographic information science. The
decision-making process in PGIS also involves information exchange, discussion and negotiation

5
among stakeholders in order to clarify, refine, and resolve the spatial problem in hand. PGIS
integrates people, geographic information data, exploratory tools and structured discussion in
order to utilize the knowledge, expertise, and experience of multiple stakeholders (Jankowski et
al., 2008; Tang, 2006; Wang and Cheng, 2006; Jankowski and Nyerges, 2003).
Meng and Malczewski (2010) and Trang (2004) explained how PGIS practitioners use a
public participation ladder as the conceptual framework to guide public participation. In this
ladder, non-participation is put at the base of the ladder while higher levels of public
participation are at the top. The public participation increases as the ladder level increases,
leading to empowerment of the public with more control of the decision-making process. The
advancement of internet technologies in recent years is leading PGIS implementation in a web-
based environment (Web-PGIS), which provides an easy way for sharing public opinion with
decision makers without any place and/or time limitation by enhancing the level of public
involvement (Boroushaki and Malczewski, 2010; Rambaldi et al., 2006).
The Web-PGIS framework has addressed one of the problems observed in traditional GIS
by allowing participants to express their views anonymously, without any fear of confrontation
from anyone (Meng and Malczewski, 2010). Research show that implementation of web-based
PGIS can be achieved in various application domains such as onshore wind farm planning (Berry
et al., 2011; Simão et al., 2009), regional social networking (Kubota et al., 2012) and flood risk
analysis (Musungu and Motala, 2012). Berry et al. (2011) developed an application which
integrates wind farm sites visualization mapping tool and a web-based survey tool which
facilitates public participation in wind farm planning. On the other hand, Simão et al. (2009)
developed a conceptual system framework for web-based PGIS that combines an information
area, a multi-criteria spatial decision support system (MC-SDSS), and an argumentation map.
Other research by Jelokhani-Niaraki and Malczewski (2012) and Boroushaki and Malczewski
6
(2010) presented web-based prototypes that allow users to set weights of evaluation criteria for
decision alternatives under consideration and generate both individual and aggregated group
solutions. Decision alternatives represent the basic structure of a decision problem that is used in
the selection of a decision maker’s course of action (Malczewski, 1999). To date, little research
has been done in the implementation of web-based PGIS for wind farm site selection
applications. Therefore, this limitation has stimulated this research. The current work differs
from other studies by Berry et al. (2011) and Simão et al. (2009) in such a way that it supports
the evaluation of integrated web-based decision alternatives using public participation through
web-based PGIS intended for offshore wind farm site selection.
In this research project, a custom-built, web-based PGIS tool was developed and its
capabilities are demonstrated using a hypothetical dataset that could be generated in real settings
by potential stakeholders. The potential of the tool is illustrated by evaluating three predefined
decision alternatives using various evaluation criteria in the southwestern part of Lake Erie,
Ohio. The three main components that are emphasized in the illustrated tool include: a discussion
forum, mapping tool, and decision tool. The discussion forum is used to facilitate communication
and debate among users regarding different criteria before they use the decision tool. The map
tool is used in conjunction with the discussion forum for exploration and visualization of the
decision alternatives associated with different criteria while the decision tool allows participants
to make their decisions by ranking the decision alternatives using different sets of criteria and
casting their votes. The methodology, the proposed conceptual framework, and the system
architecture are discussed in the sections below.
7
CHAPTER I. METHODOLOGY
Implementation of the prototype PGIS tool involves configuration of the client-server
environment, development of the database which serves as storage for both spatial and non-
spatial data, development of the different components including forums, spatial maps and a
decision module, and their integration in the web-based framework. In the next section, the
conceptual framework of the proposed web-based PGIS and the system architecture are
discussed.
1.1. The Conceptual Framework
The advantage of implementing PGIS in a web-based environment is that it allows a
group of people to interact about common interests, tasks and ideas through easy access and
integration of different tools (Jankowski et al., 2008, Alesheikh et al., 2002). Some of the
features that are present in an effective PGIS are designed to support communication and
collaboration for a community of non-technical users using spatial data visualization and
decision analysis modules (Jankowski and Stasik, 1997).
In this research, the proposed conceptual framework is a web-based PGIS for ranking
decision alternatives associated with offshore wind farm site selection which contains suggested
modules by Jankowski and Stasik (1997) including visualization through mapping, collaboration
through a discussion forum and a voting module for decision making purposes through an
asynchronous and distributed environment. An asynchronous and distributed environment refers
to a system that is designed specifically to facilitate user participation during different-time and
different-place environments, which improves turnout and involvement in web-based
collaborative decision making (Jankowski et al., 2008). The integration of the mapping and the
decision tools in the proposed framework follows a loose coupling (ad hoc linkage) approach in
8
terms of data exchange between different modules. This approach also has the capability to
combine functionalities of different tools by sharing data in a web-based environment
(Jelokhani-Niaraki and Malczewski, 2012; Malczewski, 2006). In the system, the decision tool
and mapping tool share the same data, which are stored in a database, while the communication
tool runs independently. The literature suggests different communication tools such as the
Argumentation Map (“Argumap”) that integrates geographically referenced discussions and a
web-based GIS capable of structuring debates with spatial elements in asynchronous online
discussions (Sidlar and Rinner, 2007; Rinner et al., 2008). However, the prototype in this study
uses a communication tool customized by a .NET forum for the purpose of easy customization
and integration with the proposed ASP.NET (Active Server Page) development environment
used here.
The most common way of achieving a distributed and asynchronous environment for
web-based PGIS is through implementation of client-server architecture. In this architecture, the
client requests different services such as mapping, communication, decision analysis, data
processing, and data storage while the server provides the services (Jelokhani-Niaraki and
Malczewski, 2012, Karnatak et al., 2007, Barton et al., 2005). There are many implementations
of client-server architecture in different studies including urban planning (Mansourian, 2011;
Meng and Malczewski, 2010), tourism development (Brown and Weber, 2013), transportation
improvement program (Zhong, 2008), and watershed management (Sun, 2013; Zhang, 2011)
where the chief objective of the PGIS is to involve different grassroots and community-based
groups for broadening public involvement in policymaking. The following section illustrates the
system architecture of the proposed prototype, which uses ideas from existing PGIS frameworks.
9
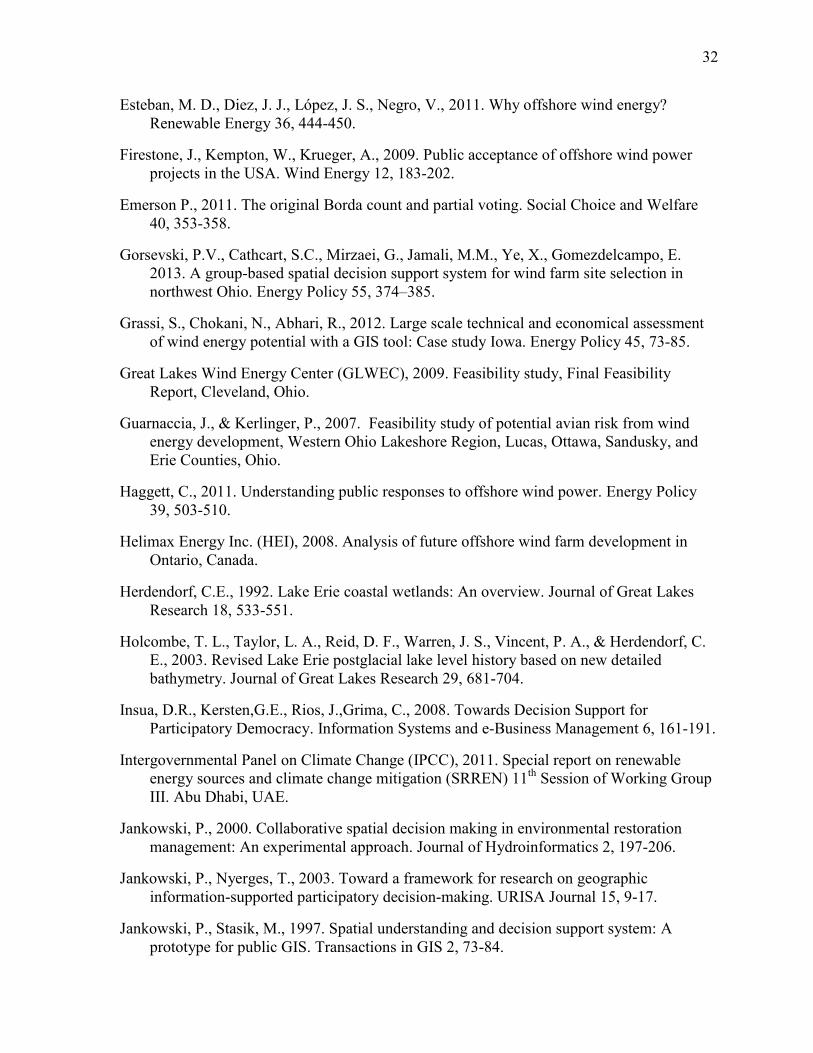
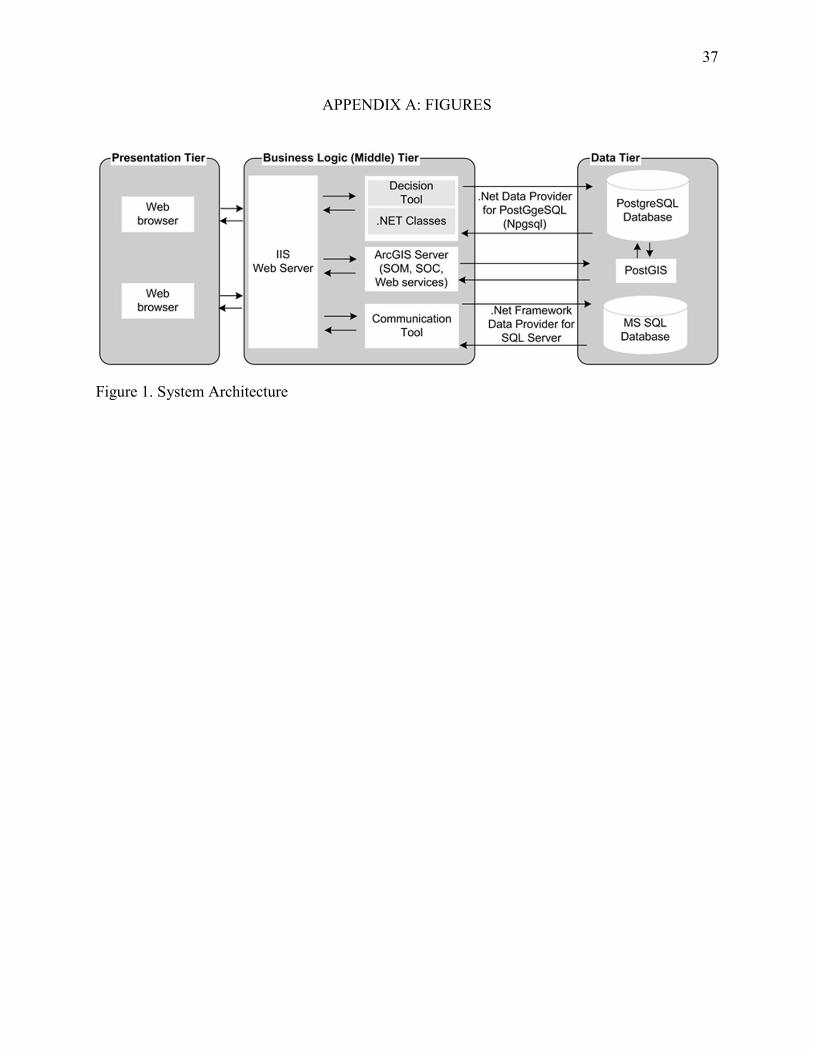
1.2. System Architecture
Figure 1 illustrates the conceptual PGIS framework of the thin client-server architecture.
This approach uses fully “server-side” processing that facilitates robust management and
deployment of the system with easy data update, integration, and implementation (Alesheikh et
al., 2002). The client-server adopted here is a three-tier system configuration, which is the
fundamental framework for the model design that segments the application into three tiers of
services. The advantages of the three-tier system architecture over other systems includes high
security, performance, scalability, and reusability of modules and system services (Mari et al.,
2011; Zhang et al., 2011; Jankowski et al., 2008). In the current implementation the three-tier
architecture is composed of the Presentation, Business Logic or Middle, and Data tiers. The
Presentation tier is the top-most level of the system and used by participants to interact with the
system using a simple web browsing interface. The main function of the interface is to translate
and interpret tasks and results that are comprehensive for the users. The web server, Internet
Information Services (IIS), and ASP or Servlet connectors, which facilitate the communication
between the Presentation client tier and the Data tier, are under the Business Logic tier. In the
prototype, the Business Logic tier integrates different modules such as the decision tool, .NET
classes, the ArcGIS server and the communication tool. This tier coordinates the application
processes such as decision making, evaluations and calculations that are used for data processing
between the two adjacent tiers. The third tier is the Data or Database tier, which is used to store
and retrieve both spatial and non-spatial information that is passed back to the Business Logic
tier and then back to the user. In this implementation, the Data tier includes two main
components: PostgreSQL and MS SQL server. The PostgreSQL uses a geodatabase and tables to
organize the spatial data related to users’ information and their preferences. A one-to-many
relationship is maintained between a user and related tables. The PostGIS plug-in stores and
10
manages the spatial data in the PostgreSQL database which is subsequently accessed by ArcGIS
Server, which is the mapping server. Lastly, the MS SQL relational database stores the non-
spatial information from all debates posted by the participants associated with the
communication tool. Here the data flow between the tool’s interface and the database is handled
by the .NET Framework Data Provider for SQL Server connection string.
The ArcGIS Server mapping server is used for creating and managing GIS Web services,
applications, and for accessing spatial data stored in the PostgreSQL database, where ArcGIS
Viewer for Silverlight is used to deploy robust web applications. The two main components of
ArcGIS Server that are involved in the process are server object manager (SOM) and server
object container (SOC). The SOC machine hosts the server objects (services) while the SOM
manages the set of server objects that are distributed across one or more SOC machines. When
the SOC receives a request from the SOM for the mapping service; it processes the request and
returns back the result to the SOM. Then, the SOM presents the map to clients through the
Representational State Transfer (REST) in the ArcGIS Viewer for Silverlight. REST is a set of
system architecture principles that facilitates data transfer between client and server over a
network using standard protocols such as Hypertext Transfer Protocol (HTTP).
In the prototype, the decision tool is developed using ASP utilizing different .NET
classes. It also uses .NET Data Provider for PostgreSQL (Npgsql) connection string to
communicate with the database. The decision tool implements Multi Criteria Decision Analysis
(MCDA) also referred to as Multi Attribute Decision Analysis (MADA) which deals with
decision problems from a number of alternatives. The tool accepts users’ preferences such as
criteria and rank of decision alternatives based on the selected criteria and stores the data in the
PostgreSQL database. Moreover, it is also responsible for retrieval of data from the database and
presentation of the analysis results to the users.

11
MCDA is a decision-support process that provides procedures and techniques to structure
and evaluate complex problems by assessing a set of alternatives using different criteria. In
MCDA, the criteria are evaluated based on their relative importance to assess the problem in
hand (Boroushaki and Malczewski, 2010; Taranu, 2009; Malczewski, 1999). According to
Jelokhani-Niaraki and Malczewski (2012), Boroushaki and Malczewski (2010), and Malczewski
(2006), the capabilities of MCDA and GIS can be integrated to facilitate participatory spatial
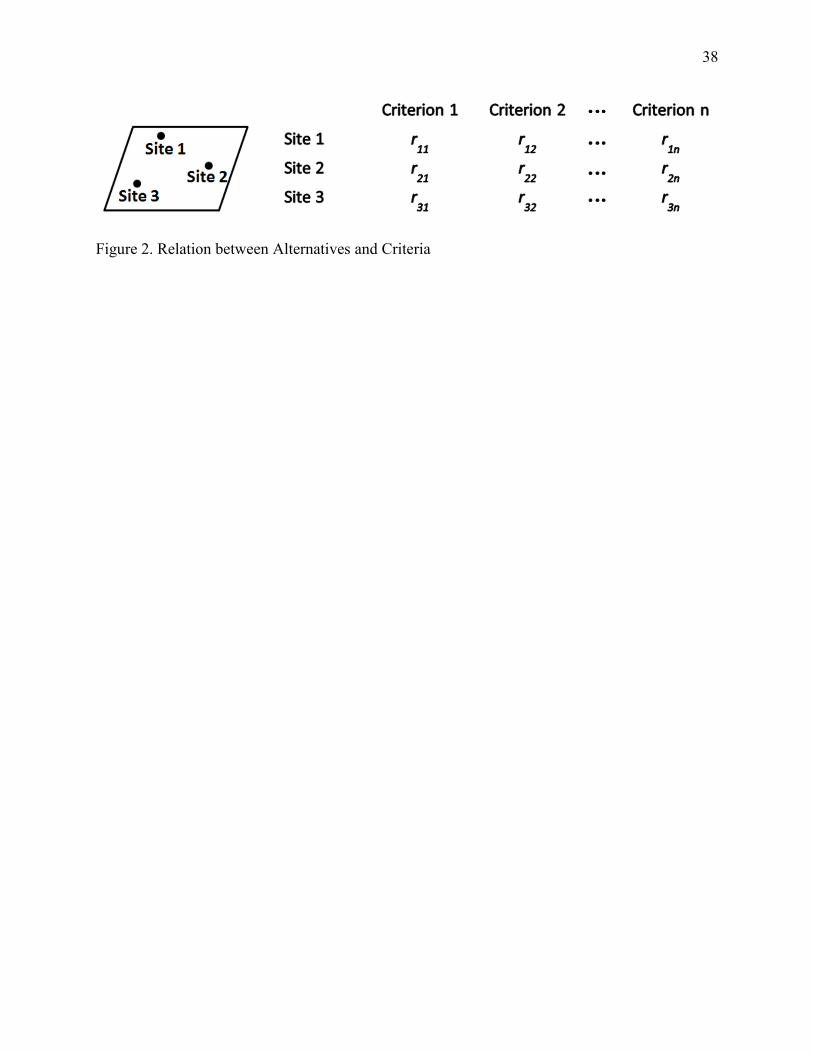
decision making. As the result of this integration participants can explore and visualize the
locations of alternatives and rank or weight these alternatives based on the preferred criteria.
Figure 2 shows the relation between three spatial alternatives associated with different
site locations and some number of different criteria. In this figure, the matrix of criteria and
alternatives illustrates the fundamental flow of the spatial MCDA process, which requires the
assignment of a rank/weight to each of the alternatives based on the selected criterion. The
ranking/weighting values in this figure are represented as rij; where i is the ith alternative and j is
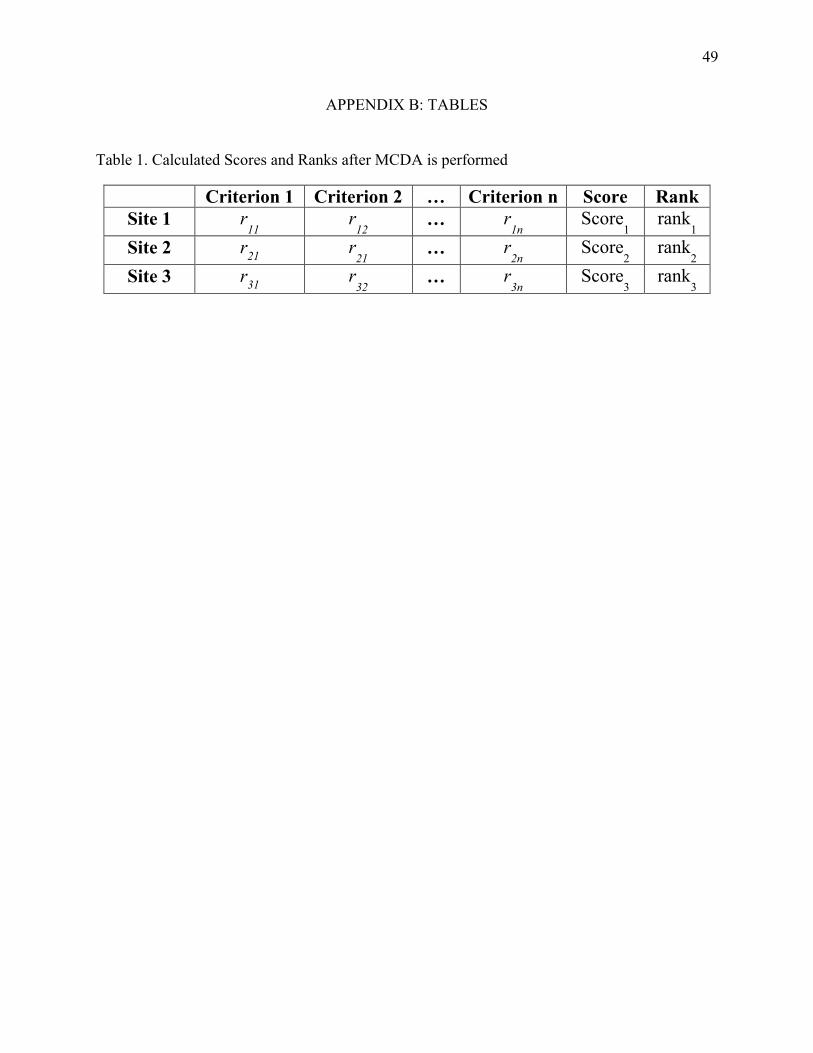
the jth criterion. Table 1 shows the calculated scores for the alternatives where the end result of
this process represents an ordered ranking of alternatives. In this study, the data values associated
with each of the alternatives are used to calculate the scores by implementing the Borda
aggregation method (Gorsevski et al., 2013; Emerson, 2011; Zarghami, 2011; Munda, 2008;
Ratliff, 2002).
Borda's method or the Borda Count (BC) was first introduced by a French scientist
named Jean Charles de Borda at the end of the 18th century (Gorsevski et al., 2013; Emerson,
2011; Zarghami, 2011; Munda, 2008; Ratliff, 2002). BC represents a social choice method that is
generated by a large group of people for decision making purposes and features the properties
called anonymity, neutrality, and consistency in the social choice literature (Munda, 2008). This
"positional" method assigns a score corresponding to the positions in which an alternative

12
appears within the ranked list of preferences. For instance, if there are N number of alternatives
under consideration, then the alternative that is ranked first gets N-1 points and the alternative
ranked next to the first ranked alternative gets N-2 points. This process of assigning scores
continues up to the last ranked alternative that gets zero points. Subsequently, the points assigned
to each alternative are summed up in order to calculate the total score and identify the ranking
order. Thus, the alternative with the highest total score is considered to be the most preferred.
In this study, the decision alternatives are ranked from first to third position in terms of
preferred importance. To get a clear understanding, the method is further explained using a
numerical example. Using the three alternatives (a-c) and 21 participants as shown in Table 2,
alternative ‘a’ is ranked in first position by eight (8), second position by zero (0), and third
position by thirteen (13) participants, respectively. The points assigned for each rank range for 0
to 2 where score of 2 is assigned for all first ranked outcomes, a score of 1 for all second ranked
outcomes, and 0 for all third ranked outcomes. Hence, the total score for each alternative is
summarized below by applying the Borda rule. As shown below, the Borda score for alternative
‘c’ is higher than all the other alternatives. A careful observation of Table 2 shows that
alternative ‘a’, which has the most first ranked outcomes, is also the one with the strongest
opposition since 13 outcomes reside into the last position. Therefore, alternative ‘c’ is the most
highly favored by the participants.
Alternative ‘a’ = (2x8) + (1x0) + (0x13) = 16
Alternative ‘b’ = (2x7) + (1x9) + (0x5) = 23
Alternative ‘c’ = (2x6) + (1x12) + (0x3) = 24
However, the merit of Borda's method is in the aggregation of participant’s scores where
individuals collectively make a choice from a set of presented alternatives. Such an approach

13
achieves a consensus solution by preventing contentious participants who rank some alternatives
very high and some very low from having dominance and thereby promotes a consensual
solution.
14
CHAPTER II. STUDY AREA AND DATA
2.1. Study Area
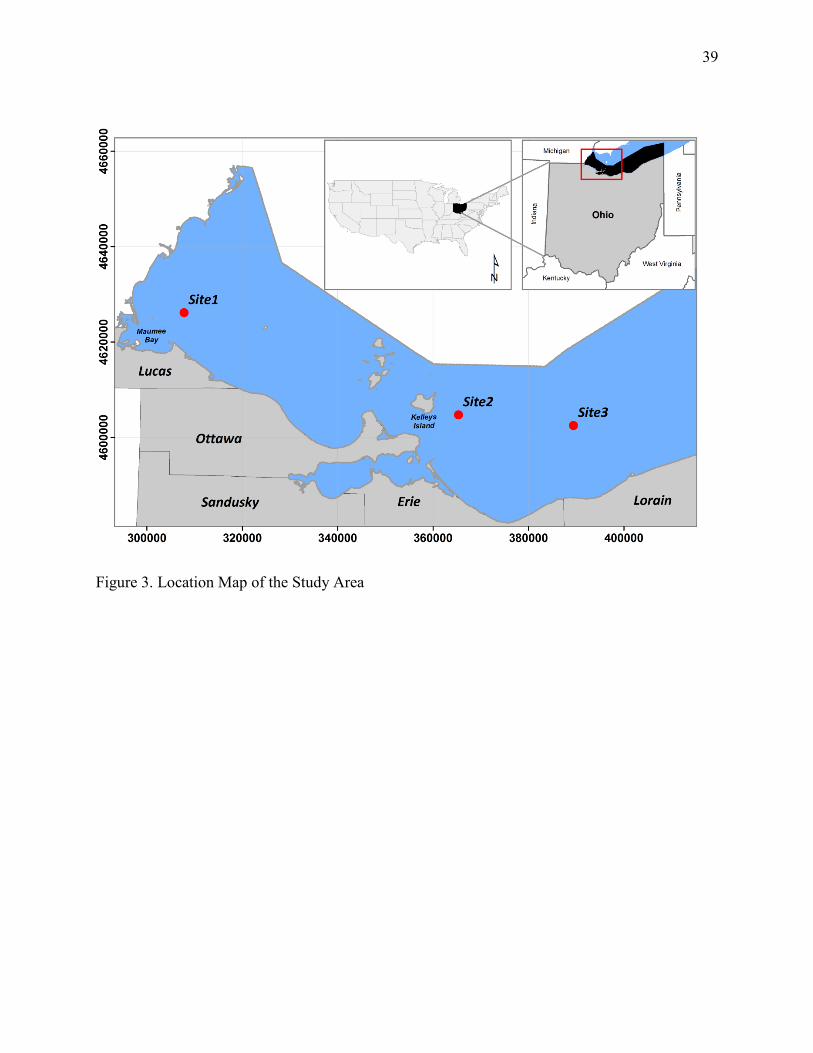
The hypothetical study area is located in northern Ohio along the western Lake Erie shore
(Figure 3). Five counties in Ohio are included in the study area, including Lucas, Ottawa,
Sandusky, Erie, and Lorain. According to the US Census Bureau’s report (2010), the total
population in these five counties is more than 0.9 million, which is equal to 8% of the State’s
total population. Major cities and towns located in the study area are Sandusky, Toledo, Port
Clinton, and Huron.
Lake Erie is fresh water and it is the shallowest of the Great Lakes (averaging only 19
meters) and overall the smallest by volume. Lake Erie can be naturally divided into three basins:
western, central, and eastern. The study area covers the western and central parts of the lake. The
average depth of the western part of the lake is 10 m and the central part is 18.5 m (Holcombe et
al., 2003; Herdendorf, 1992). The study area is characterized by strong wind with an annual
average speed of 7 to 7.5 m/sec, highest in November and lowest in July, which is favorable for
offshore wind energy generation. The area is characterized by high ice concentration in mid-
December to mid-February, with the ice concentration decreasing from mid-February to mid-
April (GLWEC, 2009; Kunkel et al., 2002). The wetlands of Lake Erie support a variety of plant
and bird species. For instance, according to Herdendorf (1992), there are over 300 plant species
in the aquatic and wetland habitats of western Lake Erie. The Ohio National Wildlife Refuge
(ONWR), which is known for its rich biodiversity, is part of the study area. Moreover, birds such
as waterfowl, wading birds, shore birds, gulls and terns, raptors and perching birds use Lake Erie
wetlands for migration, nesting and feeding.
The U.S. Department of Energy (USDOE, 2011) reported that the average annual electric
consumption of Ohio is around 154,145 million kWh and it shows a 1.4 % increase annually
15
(NREL, 2010). In the Great Lakes Region, there is a potential of 700GW of offshore wind
energy production. Of this amount from Lake Erie, it is possible to generate up to 45GW in Ohio
(NREL, 2010). This energy is equivalent to 98,550 million kWh with a 25% production
capacity. It is therefore possible to cover around 63.9% of the state’s energy consumption with
offshore wind energy. According to the Lake Erie Energy Development Corporation (LEEDCo,
2011), Lake Erie is a favorable and cost effective location for offshore wind farm installation.
In the study area there are three decision alternatives to be assessed by the participants.
As shown in Figure 3, “Site 1” is located near Maumee Bay, “Site 2” is located east of Kelleys
Island, and “Site 3” is located off the far northwestern corner of Lorain County. These decision
alternatives were identified since they fulfill the wind resource required for offshore wind farm
development, which is at least 7 m/s at a turbine height of 90 meters (or 262 ft) above the local
surface (NREL, 2010). To demonstrate the functionalities of this prototype tool and to illustrate
the potential application for evaluation of alternatives for wind farm selection, the simple
hypothetical scenario uses a total of three sites for ranking of alternatives.
2.2. Decision Making Alternatives
SDSS for suitable offshore wind site selection involves ranking of the decision
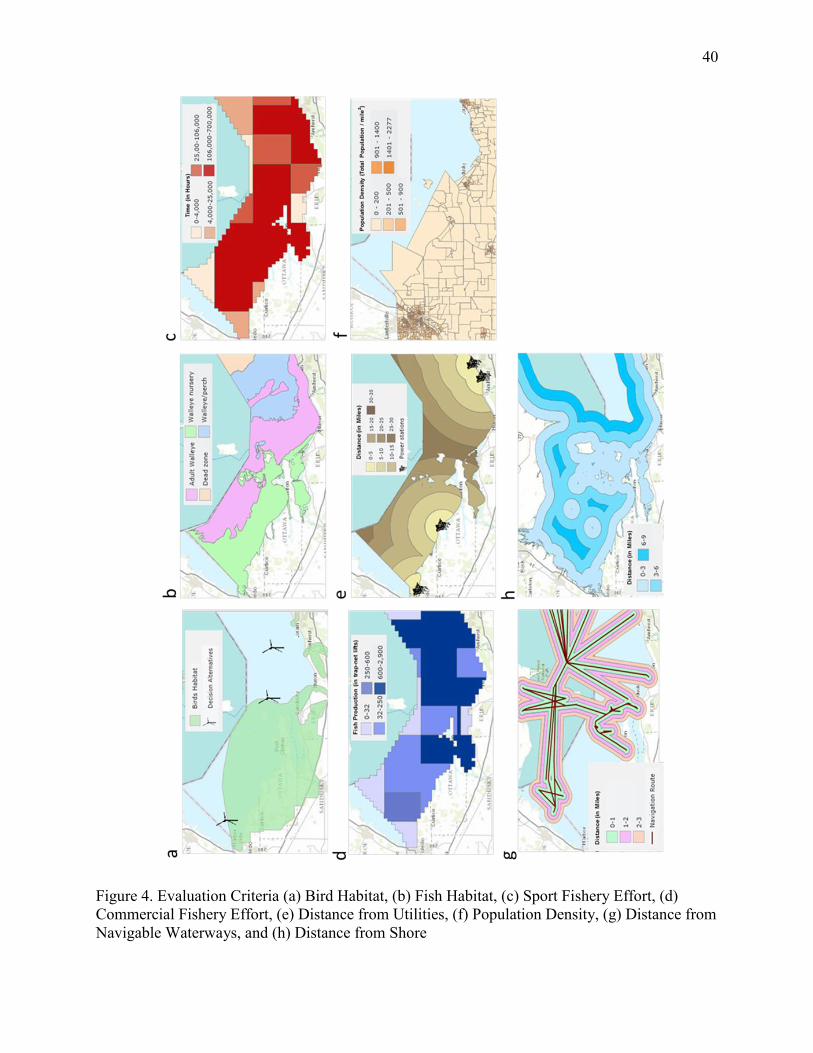
alternatives based on different evaluation criteria. In this study a total of eight evaluation criteria
were used, including: Population Density (PD), Bird Habitat (BH), Commercial Fishery Effort
(CF), Distance from Shore (DS), Fish Habitat (FH), Distance from Navigable Waterways (NW),
Sport Fishery Effort (SF), and Distance from Utilities (UT) (Figure 4). The criteria used in this
demonstration were identified based on detailed literature review, US offshore wind energy
siting legislations, and data availability (Adelaja et al., 2012; AWS Truewind, 2010; NREL,
2010; AWEA, 2008; HEI, 2008). In addition, in this study the evaluation criteria are intended to

16
address different wind farm development planning issues related to environmental and socio-
economic concerns which can impede the decision making process. The consideration of
environmental issues is to minimize any potential ecological impacts, while socio-economic
considerations are to minimize construction, operation and maintenance costs and impacts on the
local economy and quality of life affected directly or indirectly due to wind farm installation.
BH and FH fall under the environmental consideration while the socio-economic
considerations include SP, CF, UT, PD, NW, and DS. In this project, rather than fully accounting
for all possible evaluation criteria and concerns, the main objective was to demonstrate the
flexibility of this PGIS prototype, which could be altered by using different evaluation criteria
and concerns for different site specific problems and requirements. The classification of
evaluation criteria has been done based on recommendations of the Ohio Department of Natural
Resources (ODNR, 2012) Office of Costal Management.
2.2.1. Bird Habitat
Planning of new offshore wind energy site selection should consider the impact on the
natural habitat of birds. The study area is known to possess two national wildlife refuges
(NWRs) including Cedar Point and Ottawa NWRs, and three Important Birds Areas (IBA) sites
which are included in the American Birds Conservancy list of the 500 most important IBAs in
the United States (Guarnaccia and Kerlinger, 2007). According to Audubon Ohio (2012), IBA is
a conservable site identified on the basis of its international significance for the conservation of
birds at the global, regional or sub-regional level for: threatened, congregatory, assemblages of
restricted-range and biome-restricted bird species. As stated by NREL (2010) and Baisner et al.
(2010), the major risks from offshore wind turbines to sea and resting birds are collisions and
mortality, physical habitat loss from displacement, and visual stimulus/avoidance response and
17
barrier effects, including fragmentation of the ecological habitat network (e.g., migration
pathways, breeding or feeding areas). Therefore, offshore wind farms should be located out of
bird habitat (GLWEC, 2009). In this study, the electronic spatial data of IBAs in vector format
were collected from ODNR (2012) and used to show the location and proximity of bird habitats
relative to the proposed wind farm sites. Therefore, sites that are far from bird habitat are most
suitable for offshore wind farms.
2.2.2. Fish Habitat
The effect of offshore wind installation on fish habitat is one of the main environmental
concerns that should be addressed during wind farm site planning. Fish habitat is disturbed and
altered during and after installation of wind farms (Blyth-Skyrme, 2010; NREL, 2010; GLWEC,
2009). Therefore, it is important to know the fish habitat in the water body ahead of making any
further decision on the suitable site. As stated by the US Fish and Wildlife Service legislation,
offshore wind sites should be away from fish nursery and spawning areas. These areas are habitat
for larval and young-of-year fishes (NREL, 2010). In this study, the fish habitat map in a vector
data format was acquired from ODNR (2012). Then, the data were incorporated into GIS and
classified into four classes: as walleye nursery, adult walleye, walleye/perch, and dead zone. The
walleye nursery class is considered the least suitable area. Adult walleye and walleye/perch are
moderately suitable fish habitats, while the class representing the dead zone is the most suitable
area for wind farms.
2.2.3. Sport Fishery Effort
Sport fishery is a common activity in Lake Erie. According to GLWEC (2009), in 2006
alone a total of 1.25 million fishing licenses were sold in Ohio, generating around $1 billion. Of
these licenses, one third were sold in the counties along the Lake Erie shore. From the different

18
fish species that exist in the lake, walleye and yellow perch are most popular for sport fishery.
Sport fishery effort is compiled by the average hours targeting walleye and yellow perch using
an area of 10-minute quadrangle from 2000 to 2006. The spatial data layer for this criterion was
acquired from ODNR (2012). The sport fishery map was grouped into four classes as 0-4,000,
4,000-25,000, 25,000-106,000, and 106,000-700,000 hours. The classes are based on the total
hours spent by people in the areas. Classes with higher average hours are least suitable and
classes with lower average hours are most suitable for wind farm installation.
2.2.4. Commercial Fishery Effort
This criterion is related to the amount of fish that are produced for commercial purposes
from the study area. Since Lake Erie is known for its large fresh water commercial fisheries, this
criterion needs careful attention (GLWEC, 2009). Wind turbine installation is opposed by
fishermen fearing loss of their traditional fishing grounds, which are their income source.
Therefore, offshore wind turbine siting should involve this criterion in the planning phase. The
fish productivity of an area is measured based on the amount of fish harvest, which is measured
in trap net lift (GLWEC, 2009). ODNR (2012) provided the vector map showing the total
number of commercial fishery effort trap-net lifts by 10-minute quadrangle, from 2000 to 2006.
The map was classified into four classes as 0-32, 32-250, 250-600, and 600-2900 trap net lifts.
Therefore, suitability decreases from the first class, 0-32 traps, to the fourth class, 600-2900
traps.
2.2.5. Utilities (Transmission)
The third socio-economic factor considered was proximity to utilities or transmission lines.
According to GLWEC (2009), cable installation has a significant impact on the cost of an
offshore wind project. Cable cost is dependent on the project proximity to existing transmission
19
stations. The closer the project site to existing transmission stations, the less the cable installation
cost. Therefore, offshore wind energy developers prefer to develop the closest site so that it can
access existing transmission stations easily and deliver energy to customers with less cost. In this
study, data on existing transmission stations along the shore was collected from ODNR (2012).
Thereafter, in GIS using the buffer tool, distance was calculated from these places in different
intervals. The distance was grouped into seven classes as 0-5, 5-10, 10-15, 15-20, 20-25, 25-30,
and 30-35 miles. Classes with shorter distances such as 0-5 and 5-10 are most suitable, classes
with medium distances such as 10-15 and 15-20 are moderately suitable, while the other three
classes are least suitable for wind farm installation.
2.2.6. Population Density
Population density is assessed based on the number of residents per square kilometer. As
stated in HEI (2008), when considering population density from an economic point of view,
areas suitable for offshore wind energy installation are those which are close to higher population
densities. As reported by AWS Truewind (2010), these areas are the main consumers of the
produced energy. In this study, census tract vector data of the counties, located along the shore,
were collected from the US census office to calculate the population density (US Census Bureau,
2010). Then, the population density was calculated by dividing the total population by the total
area of each census tract in GIS. The population density layer was classified into five classes as
0-200, 201-500, 501-900, 901-1400, and 1400-2277. Therefore, sites that are close to high
population density are given higher priority than those which are far away.
2.2.7. Navigable Waterways
Offshore wind sites that are located far away from navigable waterways are more suitable
sites. These sites will not affect any transportation route in the water body (AWS Truewind,

20
2010; HEI, 2008). The spatial data for navigable waterways was collected from ODNR (2012).
Then, the data was added in GIS to generate buffer zones at 0-1, 1-2, and 2-3 miles interval.
Limitation of the distance into these three zones is to reduce the cost of offshore wind turbine
installation and to accommodate concerns related to turbine components’ transportation to far
distances. Therefore, sites that are in the third zone that is 2-3 miles are most suitable, followed
by the second zone that is 1-2 miles, and sites in the 0-1 mile zone are least suitable.
2.2.8. Distance from Shore
Noise pollution, shadow flickering, and aesthetic effects on people living along a shore are
important concerns for the acceptance of offshore wind farm projects by community along a
coast. Some people living along the shore claim that wind turbines close to the shore diminish
their quality of life, decrease their property value, and affect the local economy supported by
income generated from coastal recreation and tourism (Saidur et al., 2011; NREL, 2010; HEI,
2008). As a result, the distance from the shore at which wind turbines are going to be installed
should be given more attention. In this study, the shoreline data from ODNR (2012) were used to
generate buffer distances with three classes: 0-3 miles, 3-6 miles, and 6-9 miles.
21
CHAPTER III. PROTOTYPE IMPLEMENTATION
The PGIS prototype used in this study was developed within ESRI’s ArcGIS Server
environment using ASP.NET, Visual Basic(VB), Silverlight Viewer, and Cascading Style Sheet
(CSS) applications. The intention of the prototype was to provide a simple interface for non-
experienced GIS users. The main components that comprise the prototype were organized under
different themes, including the discussion forum, mapping tool and decision tool. The easy-to-
use interface was based on the principles of web usability, such as guided user interface elements
that are easy to follow, and elements of the navigation tool arranged logically and similar to a
traditional web site navigation bar. The description of the user interface and the ranking of the
alternatives is discussed below.
3.1. User Interface and System Description
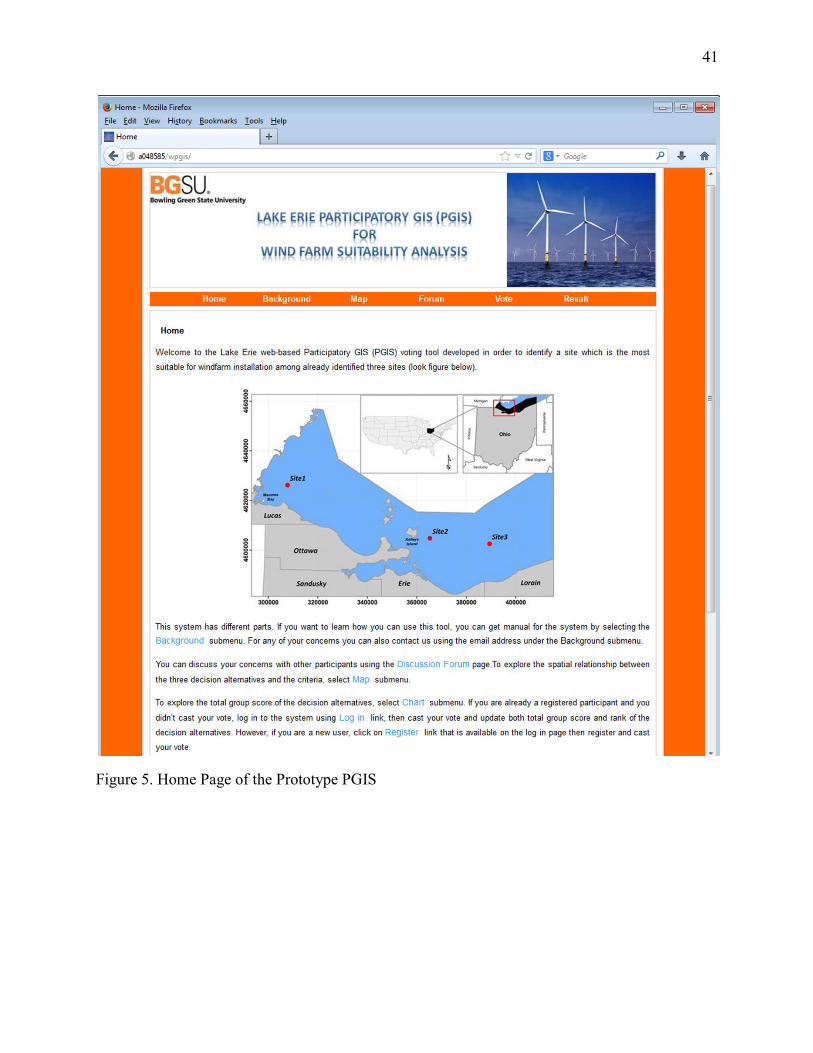
Figure 5 illustrates the PGIS web interface that is associated with the main page of the
project, and which can be accessed by web browsers such as Internet Explorer, Chrome or
Mozilla Firefox. The default web page is used for navigation between different levels that are
used for the development of a thorough understanding of the criteria associated with different
decision alternatives. The main goal of the default web page is to acquaint the participants with
the project and the process of selection alternatives for suitable offshore wind farms. As shown
in Figure 5, the default web page contains a location map of the case study area and a brief
description of the main components used in this PGIS.
The “Background” theme presents all the details associated with the project, including the
basics of wind energy, the benefits and the concerns associated with wind farms, development of
wind projects, the PGIS concept, information regarding the criteria used in the project, and
22
instructions for using the tool. In addition, participants can access a manual which contains a
brief explanation of how to utilize the different components in this prototype.
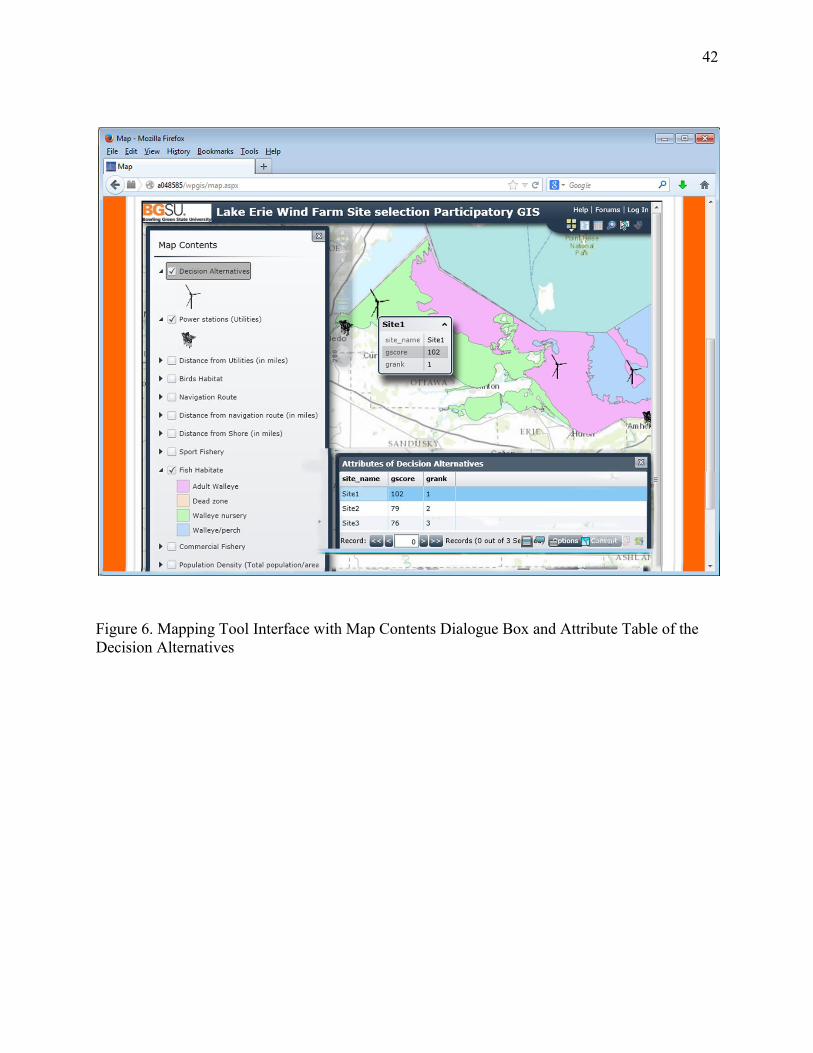
Figure 6 shows the mapping interface where participants can explore individual criteria
associated with decision alternatives. The main purpose of this component is for data
visualization that communicate the spatial extent of the criteria and the location of the decision
alternatives that will drive the decision making process. Here the visualization helps with the
overall understanding of the spatial criteria, providing valuable insights and reasoning behind the
ranking of the decision alternative. The background map information is powered by the Google
Maps interactive map interface (API) that helps participants to create a better understanding of
location while the familiarity and simplicity of Google Maps helps the general public to
participate in this complex decision making planning process. In addition, the system allows for
displaying different background Google Maps including roadmaps (normal, default 2D map),
satellite (photographic map), terrain (map with mountains, rivers, etc.) and hybrid (photographic
map with roads and city names).
As shown in Figure 6, the easy-to-use mapping interface contains basic mapping
functionalities such as zoom and pan, shown in the top right corner. Participants can use these
tools to manipulate and explore the spatial data associated with different criteria in the case study
area. The map content includes a legend display that provides useful narrative and graphic
descriptions for understanding what is being viewed in the map. For instance, the figure shows
that the “Decision Alternatives” and the “Fish Habitat” layers have been selected in the Map
Contents Panel. The “Decision Alternatives” layer shows the location for the proposed wind
farm locations that correspond to the displayed attribute table. The data from this attribute table
are primarily stored in the PostgreSQL database and the table contains information about
different geographic features that are used to find, query, and symbolize information. The “Fish

23
Habitat” layer shows the legend and the distribution of the four main species, including walleye
nursery, adult walleye, walleye/perch, and dead zone, separated by different colors. In addition,
participants can also display or hide map layers for better visualization of the spatial data.
Figure 7 shows the forum component that is used to facilitate discussion among
participants for exchanging views and ideas on spatially-related issues. The forum is customized
by Jibit, which is developed by ASP.NET technologies and MS SQL Server as a backend
(database). Specifically, the main objective of this module is to accommodate participants or
community members to discuss issues such as impacts on the local community influenced by
selection of different criteria and alternatives or to generate new ideas based on different
feedback. The module allows for an ongoing, asynchronous discussion and can help each
participant to better formulate his or her opinion, which may evolve throughout the discussion
process. Such a module is capable of catering to a large group of participants and supports
various tools such as text, maps, sketches, images and annotations to express and convey their
opinions. In addition, for better integration of the public to participate in the ongoing discussion,
a facilitator can guide the discussion process. Some of the tasks for the facilitator may include
coordination of the planning process, advising on the proper use of the tools, providing working
materials and information, and ensuring a participant’s full involvement in the discussion.
The discussion and interaction among participants precede the voting module that is used
for the ranking of the alternatives by individual participants. Participants are required to register
before using the forum and voting module. The registration details from the participants are only
used to help with the identification of participants and to collect the voting preferences for
inclusion of criteria and ranking of alternatives.
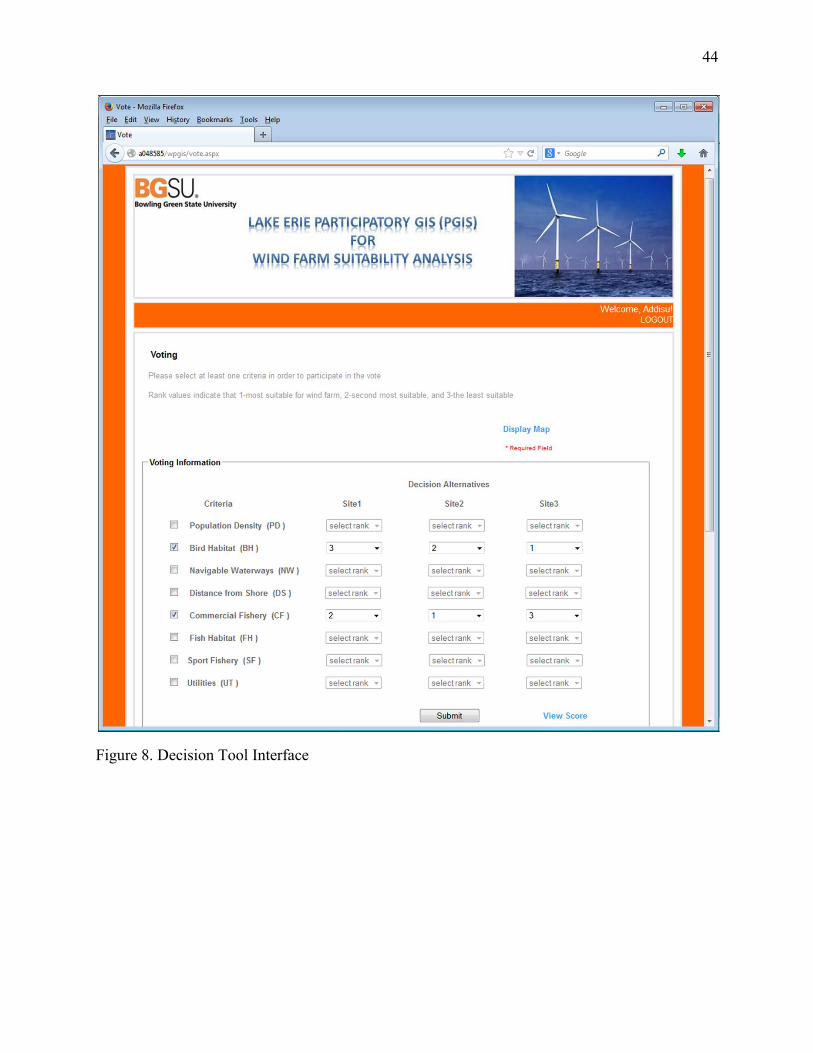
Figure 8 shows the decision tool or the voting module for ranking the decision alternatives
associated with the selection of wind farm location. The decision tool is the core part of the

24
system that is used to collect voting preferences from the participants. Here, the participants can
vote on the importance of each criterion and the rank of the alternatives. In this study, the
ranking method was used due to its simplicity and unambiguousness in collaborative and
participatory decision-making (Jelokhani-Niaraki and Malczewski, 2012; Malczewski, 2006).
For instance, Figure 8 shows that the two selected important criteria include bird habitat (BH)
and commercial fishery (CF). The selection of the criteria activates the ranking information
where participants can select the rank for each decision alternatives that relates to a specific
criterion. Rank 1 indicates the most suitable site, rank 2 the second most suitable, and rank 3 the
least suitable location for wind farm installation. For instance, Site 3 is the most suitable location
for a new wind farm in relation to the bird habitat criterion whereas Site 1 is the least suitable
location. Participants can also easily display the mapping module from the decision tool by using
the link ‘Display Map’. This helps participants to see the spatial relationship between criteria and
the decision alternatives while using the decision tool.
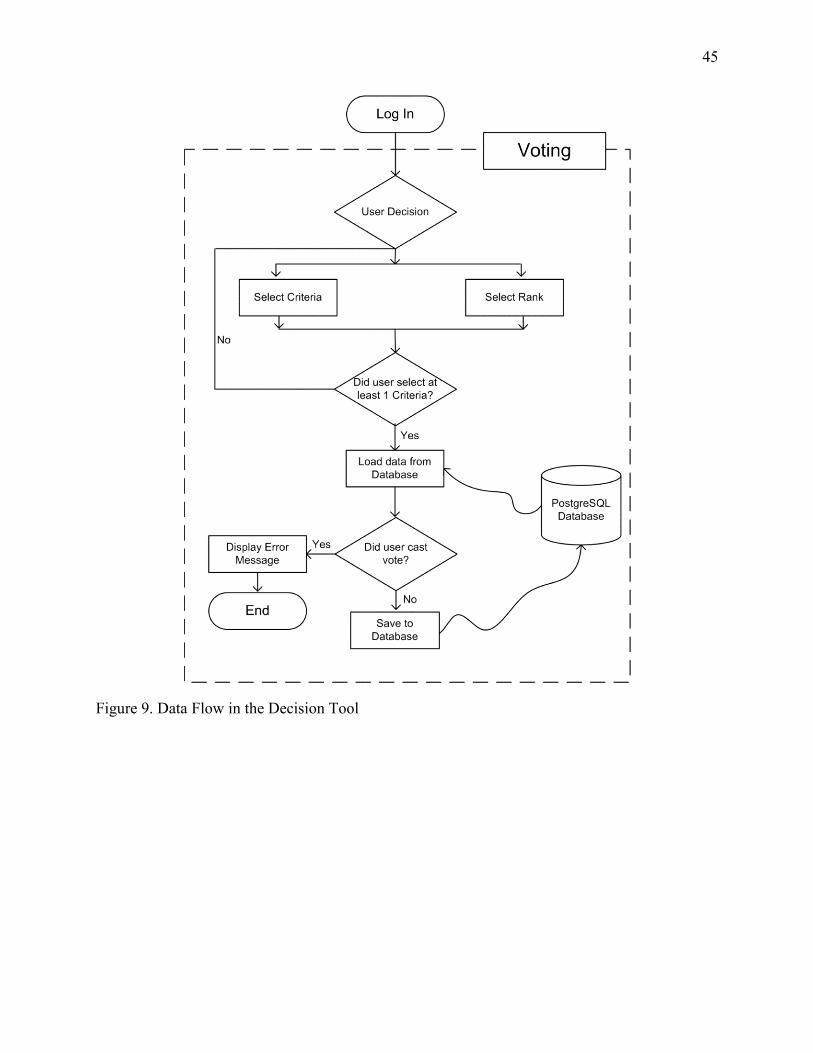
The flow chart in Figure 9 highlights the data flow process behind the voting tool. After
the participant is logged in, the decision module requires the participant to select the important
criteria, which are used for the ranking of the decision alternatives. Before the information is
submitted to the database, the system checks for errors such as selection of at least one criterion
and whether the participant has cast his or her vote earlier. After the participant submits his or
her vote, the score and voting position of the decision alternatives is calculated by adding the
ranks for each alternative from every voter using the Borda Count approach. The calculated
group scores can be accessed from the voting module using the “View Score” link. The voting
results in Figure 10 are calculated by a ranked voting technique that assigns ranks to decision
alternatives based on the most and the least suitable location for a wind farm.

25
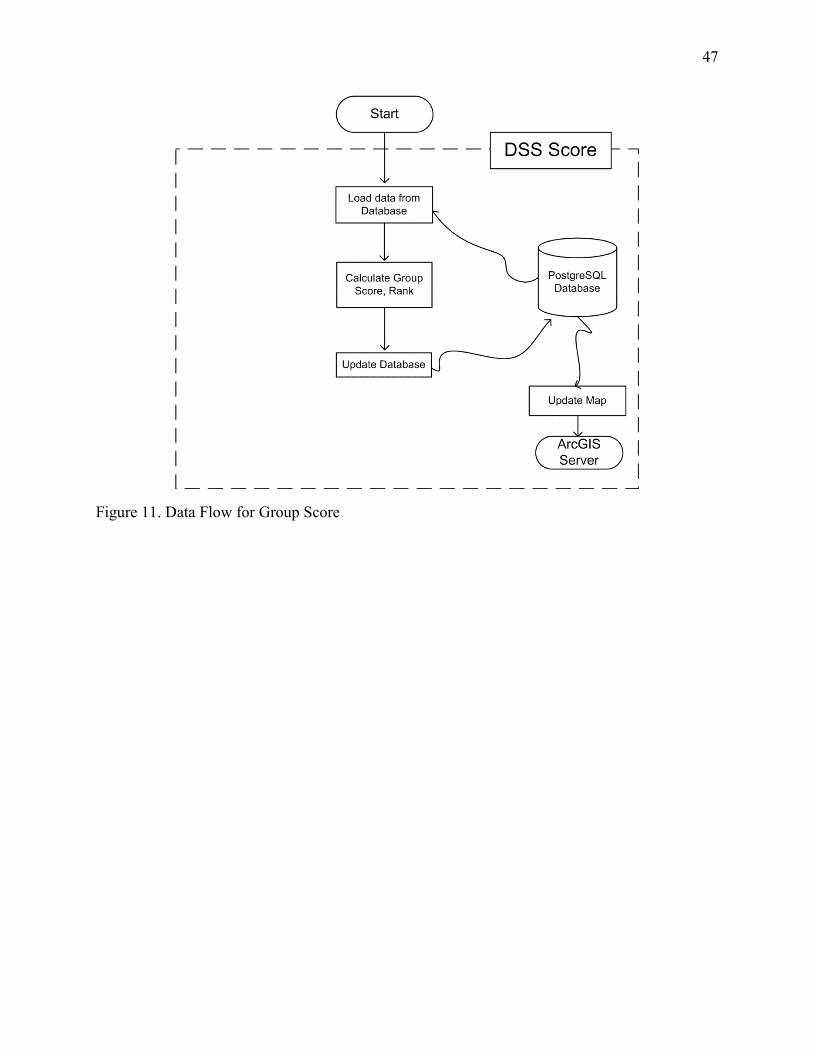
In Figure 11, the flow chart presents the data flow implemented in calculation of the group
score and rank of decision alternatives. When participants request the group score, the data are
fetched from the database. Then, the score is calculated using the Borda Count method.
Subsequently, the rank for the decision alternatives based on the group score will be calculated.
Moreover, based on the new result, the system updates the old group score and rank in both the
database and the map.
Participants can also visualize the voting results using a chart display before and after
casting their vote. Figure 12 shows the scores for the decision alternatives and the importance of
the criteria. For instance, Figure 12 shows that Site 1 is the most suitable decision alternative
while Site 3 is the least suitable decision alternative for a wind farm location. Also, the most
preferred criterion for the participants is the fish habitat, while distance from shore and utilities
are the most controversial criteria used for the selection of the wind farm location.

26
CHAPTER IV. DISCUSSION
In development of PGIS, the set of evaluation criteria depend on the problem under
consideration and the suggestions of stakeholders who participate in the planning phase. These
stakeholders have to be representatives of diverse areas of competence, political agendas, and
social values. This can be achieved by following inclusive participation (Zhong et al., 2008;
Jankowski and Nyerges, 2003). The inclusive participation approach follows the principle of
involving public representatives as participants. Otherwise, if participants are only activists,
interested groups, planners and professionals, then the public voice will be biased or dominated
by certain opinions that may not be representative of the community. Therefore, the public’s
involvement should be from the early stage of the planning process to build mutual
understanding and consensus among participants (Tang, 2006). This also will later lead to
legitimization and public acceptance of the decision process.
Participants can be informed and empowered about the initial idea through different
mechanisms such as stakeholder workshops, consensus conferences, deliberative opinion polls,
negotiated rulemaking, task forces, and town meetings (Insua et al., 2008). However, recently
public participation practices are using information technology (IT) for public involvement
rather than these traditional methods of participation. The mentioned mechanisms allow
participants to express their concerns and suggest criteria to be considered in the decision
process. Based on Malczewski (1999), the procedure for identifying the criteria should be a
multistep iterative process. That is, the process should be done repeatedly to accommodate all
concerns of the stakeholders. In this research, the implemented web-based PGIS is flexible and
can incorporate different criteria other than the eight criteria which we had already included in
the current version of the tool. This could be accomplished by public involvement in discussion
forums for selection of goals and criteria that should be considered in the offshore wind farms
27
planning process (Meng and Malczewski, 2010; Taranu, 2009; Karnataka et al., 2007). For
instance, this module can be used for idea generation, collection and sorting of ideas, and
improvement of the planning process based on feedback.
The identification of stakeholders is an important step while developing a PGIS. This will
help to address issues and concerns of stakeholders. Furthermore, it will give confidence to the
stakeholders in how to use the developed system. In this study, the main objective was to
demonstrate the potential of web-based PGIS as a SDSS tool using a hypothetical scenario
without the involvement of stakeholders’ opinion in the planning phase. However, as a starting
point this research consulted various studies to identify some of the criteria that are important in
offshore wind farm planning (Leung and Yang, 2012; Hagget, 2011; Limpo, 2011; Firestone et
al., 2009; GLWEC, 2009; HEI, 2008). A real scenario of PGIS development for wind farm site
selection should involve description of concerns to participants, discussion among participants,
setting criteria, and voting on the decision alternatives. During the description of concerns,
participants will be informed about the problem and background information. Then they will
express their concerns regarding the wind farm project during the discussion phase. This stage
helps to address the NIMBY (Not In My Back Yard) syndrome often associated with suitable
wind farm site selection. The criteria set by participants will serve as a means to evaluate the
decision alternatives. Once a common understanding and consensus is achieved between
participants regarding the criteria, the next step will be voting for achieving group decision
making (Zhong et al., 2008).
Different approaches can be followed to use the web-based PGIS in order to achieve
group decision making. For instance, facilitators can moderate the forum discussions and guide
the process where voting goals may include gathering of additional data to measure stakeholder
attitudes. Other models, such as an “open assess poll” that uses continuous voting (i.e.,

28
submitting a voting option on a website) or “online poll” that may use a survey in which
participants communicate responses via the internet, are also possible.
29
CHAPTER V. CONCLUSION
This study demonstrated the design and implementation of a conceptual framework for
distributed and asynchronous web-based PGIS. The PGIS framework integrated three
components, including a discussion forum, mapping tool and decision tool. The potential
implementation was illustrated by using a hypothetical case study to show the strengths and the
benefits from PGIS in facilitating suitable offshore wind farm site selection in Lake Erie. The
hypothetical case study implemented a standard decision-making scenario by ranking three
predefined sites or decision alternatives using eight different spatial criteria in a collaborative
and transparent way.
The implementation of the proposed framework used a thin client-server environment with
three-tier architecture. The integration of software tools included technologies such as ESRI
ArcGIS server in conjunction with API Silverlight Viewer, ASP.NET, PostgreSQL database, and
Jibit free discussion forum with MS SQL Server database. The final PGIS product of this
integration used a standard GIS-based multi-criteria evaluation approach that accommodates
multi-user environments and supports group decision making. The mapping tool is used for
visualization, exploration and comparison of decision alternatives and their corresponding
properties such as total score and rank. The decision tool is designed to perform ranking of the
decision alternatives based on the evaluation criteria, using the Borda Count (BC) method as a
means to calculate the group scores of each decision alternative. Lastly, the discussion forum is
used to facilitate communication and debate among participants.
In summary, the intention of this study was to show the potential of a web-based PGIS for
offshore wind suitability analysis that integrates alternatives, evaluation criteria, and participants
using new technological ideas. The strength of this methodology is the flexibility for
modification and customization when implemented in different study areas or other applications

30
and problems that require spatial decision support. Although the system was not fully tested with
real stakeholders, its potential implementation to resolve complex issues of important public
planning problems was demonstrated through a hypothetical scenario. As Jankowski (2000)
highlighted, the development of PGIS can be tested and its public acceptance can be increased by
following an approach which involves identification of criteria by stakeholders, selection of
decision alternatives by a group of experts, and evaluation of decision alternatives by randomly
selected group of the general public.
Future recommendations for improvement include the consideration of open source
software and technology. Such technologies will help to avoid dependency on expensive and
proprietary software such as ArcGIS server, ASP.NET, and MS SQL server. In terms of
functionality, the prototype could include additional modules for dynamic inclusion and
exclusion of decision alternatives, different voting approaches, aggregation of individual scores
to obtain a group solution, and simplification of the importance of the criteria using sets of
linguistic terms such as “low”, “medium”, and “high”. The use of linguistic terms or quantifiers
can help with the conversion of human language to inputs that can be formulated
mathematically, which can further simplify the system and encourage wider participation in the
spatial decision-making process.

31
REFERENCES
Adelaja, A., McKeown, C., Calnin, B., Hailu, Y., 2012. Assessing offshore wind potential.
Energy Policy 42, 191-200.
Alesheikh, A., Helali, H., Behroz, H., 2002. Web GIS: Technologies and its applications. Symposium on Geospatial Theory, Processing and Applications, Ottawa.
American Wind Energy Association (AWEA), 2008. 20% Wind energy by 2030. Accessed November 12, 2012, http://www.nrel.gov/docs/fy08osti/41869.pdf
AWS Truewind, 2010. Great lakes offshore wind power project, Site Screening Study for Potentially Viable Offshore Wind Energy Sites, Albany, NY.
Baisner, A. J., Andersen, J. L., Findsen, A., Granath, S. W., Madsen, K. Ø., 2010. Minimizing Collision Risk between Migrating Raptors and Marine Wind Farms: Development of a Spatial Planning Tool. Environmental Management 46, 801–808.
Balram, S., & Dragićević, S., 2006. Collaborative geographic information systems. Idea Group Publishing. Hershey, PA.
Barton, J., Plume, J., Parolin, B., 2005. Public participation in a spatial decision support system for public housing. Computers, Environment and Urban Systems 29, 630-652.
Beacham, J. L., Jensen, J. R.,Wang, Z., 2009. A feasibility analysis of South Carolina wind resources for electric power generation. Institute for Public Service and Policy Research, University of South Carolina.
Berry, R., Higgs, G., Fry, R., Langford, M., 2011. Web-based GIS approaches to enhance public participation in wind farm planning. Transactions in GIS 15, 147-172.
Blyth-Skyrme, R.E., 2010. Options and opportunities for marine fisheries mitigation associated with windfarms: Summary report for COWRIE contract FISHMITIG09. COWRIE Ltd, c/o Nature Bureau, Newbury, UK.
Boroushaki, S., Malczewski, J., 2010. ParticipatoryGIS: A Web-based collaborative GIS and multicriteria decision analysis. URISA Journal 22, 23-32.
Brown, G., Weber, D., 2013. Using public participation GIS (PPGIS) on the Geoweb to monitor tourism development preferences, Journal of Sustainable Tourism 21,192-211.
Cinderby, S., 1999. Geographic information systems (GIS) for participation: the future of environmental GIS? International Journal of Environment and Pollution 11, 304-315.
Coskun, A. A., & Türker, Y. Ö., 2012. Wind energy and Turkey. Environmental Monitoring and Assessment 184, 1265-1273.
Dvorak, M. J., Archer, C. L., Jacobson, M. Z., 2010. California offshore wind energy potential. Renewable Energy 35, 1244-1254.
32
Esteban, M. D., Diez, J. J., López, J. S., Negro, V., 2011. Why offshore wind energy? Renewable Energy 36, 444-450.
Firestone, J., Kempton, W., Krueger, A., 2009. Public acceptance of offshore wind power projects in the USA. Wind Energy 12, 183-202.
Emerson P., 2011. The original Borda count and partial voting. Social Choice and Welfare 40, 353-358.
Gorsevski, P.V., Cathcart, S.C., Mirzaei, G., Jamali, M.M., Ye, X., Gomezdelcampo, E. 2013. A group-based spatial decision support system for wind farm site selection in northwest Ohio. Energy Policy 55, 374–385.
Grassi, S., Chokani, N., Abhari, R., 2012. Large scale technical and economical assessment of wind energy potential with a GIS tool: Case study Iowa. Energy Policy 45, 73-85.
Great Lakes Wind Energy Center (GLWEC), 2009. Feasibility study, Final Feasibility Report, Cleveland, Ohio.
Guarnaccia, J., & Kerlinger, P., 2007. Feasibility study of potential avian risk from wind energy development, Western Ohio Lakeshore Region, Lucas, Ottawa, Sandusky, and Erie Counties, Ohio.
Haggett, C., 2011. Understanding public responses to offshore wind power. Energy Policy 39, 503-510.
Helimax Energy Inc. (HEI), 2008. Analysis of future offshore wind farm development in Ontario, Canada.
Herdendorf, C.E., 1992. Lake Erie coastal wetlands: An overview. Journal of Great Lakes Research 18, 533-551.
Holcombe, T. L., Taylor, L. A., Reid, D. F., Warren, J. S., Vincent, P. A., & Herdendorf, C. E., 2003. Revised Lake Erie postglacial lake level history based on new detailed bathymetry. Journal of Great Lakes Research 29, 681-704.
Insua, D.R., Kersten,G.E., Rios, J.,Grima, C., 2008. Towards Decision Support for Participatory Democracy. Information Systems and e-Business Management 6, 161-191.
Intergovernmental Panel on Climate Change (IPCC), 2011. Special report on renewable energy sources and climate change mitigation (SRREN) 11th Session of Working Group III. Abu Dhabi, UAE.
Jankowski, P., 2000. Collaborative spatial decision making in environmental restoration management: An experimental approach. Journal of Hydroinformatics 2, 197-206.
Jankowski, P., Nyerges, T., 2003. Toward a framework for research on geographic information-supported participatory decision-making. URISA Journal 15, 9-17.
Jankowski, P., Stasik, M., 1997. Spatial understanding and decision support system: A prototype for public GIS. Transactions in GIS 2, 73-84.
33
Jankowski, P., Zielinska, A., Swobodzinski, M., 2008. Choice modeler: A web-based spatial multiple criteria evaluation tool. Transactions in GIS 12, 541-561.
Jelokhani-Niaraki, M., Malczewski, J., 2012. A user-centered multicriteria spatial decision analysis model for participatory decision making: An ontology-based approach. Proceedings of global geospatial conference. Québec City, Canada.
Karnatak, H. C., Saran, S., Bhatia, K., Roy, P.S., 2007. Multicriteria spatial decision analysis in web GIS environment. Geoinformatica 11, 407–429.
Kubota, S., Soga, K., Sasaki, Y., Abe, A., 2012. Web GIS-based regional social networking service as participatory GIS. 2 LNEE 157, 313-321.
Kunkel, K. E., Westcott, N. E., Kristovich, D. A. R., 2002. Assessment of potential effects of climate change on heavy lake-effect snowstorms near Lake Erie. Journal of Great Lakes Research, 28, 521-536.
Lake Erie Energy Development Corporation (LEEDCo), 2011. Accessed October 25, 2012, http://www.leedco.org/.
Landry, C. E., Allen, T., Cherry, T., Whitehead, J. C., 2012. Wind turbines and coastal recreation demand. Resource and Energy Economics 34, 93-111.
Leung, D., Yang, Y., 2012. Wind energy development and its environmental impact: A review. Renewable & Sustainable Energy 16, 1031-1039.
Limpo J.R., 2011. Assessment of offshore wind energy in Portuguese shallow waters site selection, technical aspects and financial evaluation. A Master’s Thesis Instituto Superior Técnico, Universidade Técnica de Lisboa. Lisbon, Portugal.
Malczewski, J., 2006. GIS-based multicriteria decision analysis: a survey of the literature, International Journal of Geographical Information Science 20, 703-726
Malczewski, J., 1999. GIS and multicriteria decision analysis, John Wiley and Sons Inc., New York, NY.
Mansourian, A., Taleai, M., Fasihi, A., 2011. A web-based spatial decision support system to enhance public participation in urban planning processes. Journal of Spatial Science 56, 269-282.
Mari, R. , Bottai, L., Busillo, C., Calastrini, F., Gozzini, B., Gualtieri, G., 2011. AGIS-based interactive web decision support system for planning wind farms in Tuscany (Italy). Renewable Energy 36, 754-763.
Meng, Y., Malczewski, J., 2010. Web-PPGIS usability and public engagement: A case study in canmore, alberta, canada. URISA Journal 22(1), 55-64.
Mirhosseini, M., Sharifi, F., Sedaghat, A., 2011. Assessing the wind energy potential locations in province of semnan in Iran. Renewable and Sustainable Energy Reviews 15, 449-459.
34
Molina-Ruiz, J., Martínez-Sánchez, M. J., Pérez-Sirvent, C., Tudela-Serrano, M. L., García Lorenzo, M. L., 2011. Developing and applying a GIS-assisted approach to evaluate visual impact in wind farms. Renewable Energy 36, 1125-1132.
Munda, G., 2008. Social Multi-criteria Evaluation for a Sustainable Economy, Springer, Berlin, Germany.
Musungu, K. , Motala, S., 2012. Participatory multi-criteria evaluation and GIS: An application in flood risk analysis. FIG Young Surveyors Conference - Workshop 1.2, 6204.
National Renewable Energy Laboratory (NREL), 2010. Large-scale offshore wind power in the United States: Assessment of opportunities and barriers. Accessed August 15, 2012, http://www.nrel.gov/nwtc/.
O'Keeffe, A., Haggett, C., 2012. An investigation into the potential barriers facing the development of offshore wind energy in Scotland: Case study - firth of forth offshore wind farm. Renewable & Sustainable Energy Reviews 16, 3711-3721.
Ohio Audubon Society, 2012. Important Bird Areas (IBA). Accessed August 08, 2012, http://web4.audubon.org/bird/iba/.
Ohio Department of Natural Resources (ODNR), 2012. Offshore wind energy. Accessed December 10, 2012, http://www.ohiodnr.com/LakeErie/WindEnergyRules/tabid/21234/Default.aspx
Omitaomu, O. A., Rose, A. N., Blevins, B. R., Jochem, W. C., Mays, G. T., Belles, R., 2012. Adapting a GIS-based multicriteria decision analysis approach for evaluating new power generating sites. Applied Energy 96, 292-301.
Rambaldi, G., Kyem, P., McCall, M., Weiner D., 2006. Participatory spatial information management and communication in developing countries. EJISDC 25, 1-9.
Ratliff, T. C., 2002. A comparison of Dodgson's method and the Borda count. Economic Theory 20(2), 357-372.
Rinner, C., Keßler, C., Andrulis, S., 2008. The use of web 2.0 concepts to support deliberation in spatial decision-making. Computers, Environment and Urban Systems 32 (5), 386-395.
Saidur, R., Rahim, N. A., Islam, M. R., Solangi, K. H., 2011. Environmental impact of wind energy. Renewable and Sustainable Energy Reviews 15, 2423-2430.
Schillings, C., Wanderer,T., Cameron, L., Wal, J.T., Jacquemin, J., Veum, K., 2012. A decision support system for assessing offshore wind energy potential in the North Sea. Energy Policy 49, 541-551.
Sidlar, C.L., Rinner, C., 2007. Analyzing the usability of an argumentation map as a participatory spatial decision support tool. URISA Journal 19, 47-55.

35
Snyder, B., Kaiser, M. J., 2009. A comparison of offshore wind power development in Europe and the U.S.: Patterns and drivers of development. Applied Energy 86, 1845-1856.
Sun, A., 2013. Enabling collaborative decision-making in watershed management using cloud-computing services. Environmental Modelling & Software 41, 93-97.
Tang, M. Y., 2006. Design and implementation of a GIS-enabled online discussion forum for participatory planning. The 4th Annual PPGIS Conference, Cleveland State University, Cleveland, Ohio.
Tegou, L., Polatidis, H., Haralambopoulos, D. A., 2010. Environmental management framework for wind farm siting: Methodology and case study. Journal of Environmental Management 91, 2134-2147.
Taranu J., 2009. Building consensus using a collaborative spatial multi-criteria analysis system. M.Sc. Thesis. University of Waterloo.
Trang, N.T., 2004. PGIS’s relevance, applicability and conditions in local rural development: a case study with Village Development Planning in Bach Ma National Park buffer zone, Vietnam. International Institute for Geo-Information Science and Earth Observation. Enschede, The Netherlands.
U.S. Census Bureau, 2010. Accessed October 20, 2012, http://quickfacts.census.gov/qfd/states/39000.html
U. S. Department of Energy (USDOE), 2013. Offshore wind market and economic analysis. Accessed November 25, 2013, http://www1.eere.energy.gov/wind/pdfs/offshore_wind_market_and_economic_analysis_10_2013.pdf
U. S. Department of Energy (USDOE), 2011. National offshore wind strategy: creating an offshore wind energy industry in the United States. Accessed August 25, 2012, http://www1.eere.energy.gov/wind/
U.S. Energy Information Administration (USEIA), 2011. Electric power annual 2010. Accessed September 20, 2012, http://www.eia.gov/cneaf/electricity/epa/epa_sum.html.
Vagiona , D.G., Karanikolas, N.M., 2012. A multicriteria approach to evaluate offshore wind farms sitting in Greece. Global NEST Journal 14, 235-243.
Wang, L., Cheng, Q., 2006. Web-based collaborative decision support services: concept, challenges and application. ISPRS Technical Commission II Symposium, Vienna.
Zarghami, M., 2011. Soft computing of the Borda Count by fuzzy linguistic quantifiers. Applied Soft Computing 11, 1067-1073.
Zhang, Y., Sugumaran, R., McBroom, M., DeGroote, J., Kauten, R. L., Barten, P. K, 2011. Web-based spatial decision support system and watershed management with a case study. International Journal of Geosciences 2, 195-203.

36
Zhong, T., Young, R. K., Lowry, M., Rutherford, G. S., 2008. A model for public involvement in transportation improvement programming using participatory geographic information systems. Computers, Environment & Urban Systems, 32, 123-133.
37
APPENDIX A: FIGURES
Figure 1. System Architecture
38
Figure 2. Relation between Alternatives and Criteria
39
Figure 3. Location Map of the Study Area
40
Figure 4. Evaluation Criteria (a) Bird Habitat, (b) Fish Habitat, (c) Sport Fishery Effort, (d) Commercial Fishery Effort, (e) Distance from Utilities, (f) Population Density, (g) Distance from Navigable Waterways, and (h) Distance from Shore
41
Figure 5. Home Page of the Prototype PGIS
42
Figure 6. Mapping Tool Interface with Map Contents Dialogue Box and Attribute Table of the Decision Alternatives

43
Figure 7. Interface for the forum
44
Figure 8. Decision Tool Interface
45
Figure 9. Data Flow in the Decision Tool

46
Figure 10. Interface of Score Page
47
Figure 11. Data Flow for Group Score
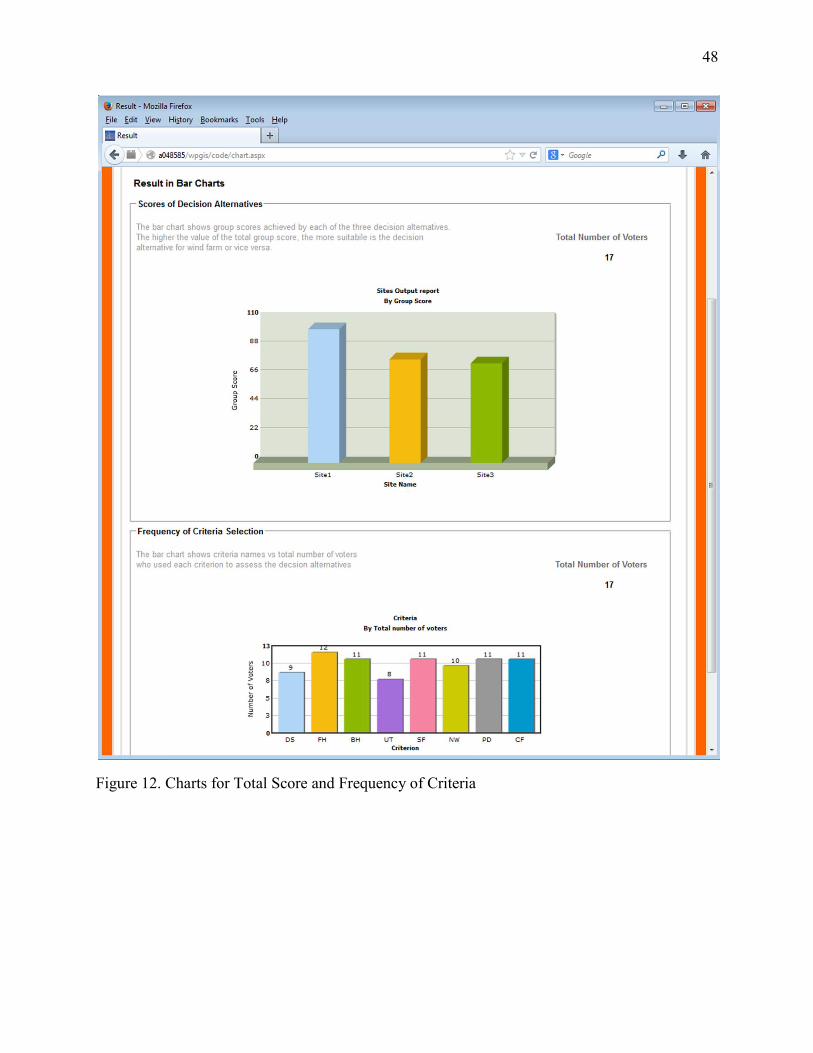
48
Figure 12. Charts for Total Score and Frequency of Criteria
49
APPENDIX B: TABLES
Table 1. Calculated Scores and Ranks after MCDA is performed
Criterion 1 Criterion 2 … Criterion n Score Rank Site 1 r
11 r
12 … r
1n Score
1 rank
1
Site 2 r21 r21
… r2n
Score2 rank
2
Site 3 r31 r32
… r3n
Score3 rank
3

50
Table 2. Numerical Example of 3 Alternatives and 21 Participants
Ranking Alternatives Points a b c 1
st 8 7 6 2
2nd
0 9 12 1 3
rd 13 5 3 0
Number of Participants 21 21 21
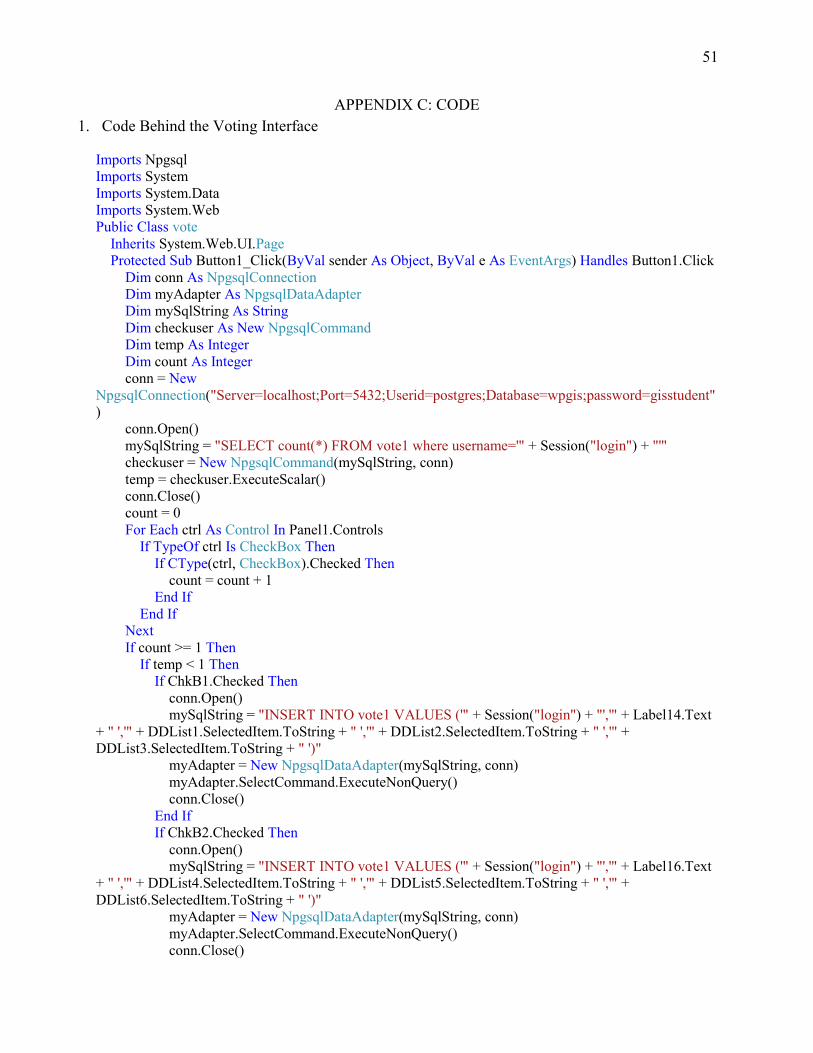
51
APPENDIX C: CODE 1. Code Behind the Voting Interface
Imports Npgsql Imports System Imports System.Data Imports System.Web Public Class vote Inherits System.Web.UI.Page Protected Sub Button1_Click(ByVal sender As Object, ByVal e As EventArgs) Handles Button1.Click Dim conn As NpgsqlConnection Dim myAdapter As NpgsqlDataAdapter Dim mySqlString As String Dim checkuser As New NpgsqlCommand Dim temp As Integer Dim count As Integer conn = New NpgsqlConnection("Server=localhost;Port=5432;Userid=postgres;Database=wpgis;password=gisstudent") conn.Open() mySqlString = "SELECT count(*) FROM vote1 where username='" + Session("login") + "'" checkuser = New NpgsqlCommand(mySqlString, conn) temp = checkuser.ExecuteScalar() conn.Close() count = 0 For Each ctrl As Control In Panel1.Controls If TypeOf ctrl Is CheckBox Then If CType(ctrl, CheckBox).Checked Then count = count + 1 End If End If Next If count >= 1 Then If temp < 1 Then If ChkB1.Checked Then conn.Open() mySqlString = "INSERT INTO vote1 VALUES ('" + Session("login") + "','" + Label14.Text + " ','" + DDList1.SelectedItem.ToString + " ','" + DDList2.SelectedItem.ToString + " ','" + DDList3.SelectedItem.ToString + " ')" myAdapter = New NpgsqlDataAdapter(mySqlString, conn) myAdapter.SelectCommand.ExecuteNonQuery() conn.Close() End If If ChkB2.Checked Then conn.Open() mySqlString = "INSERT INTO vote1 VALUES ('" + Session("login") + "','" + Label16.Text + " ','" + DDList4.SelectedItem.ToString + " ','" + DDList5.SelectedItem.ToString + " ','" + DDList6.SelectedItem.ToString + " ')" myAdapter = New NpgsqlDataAdapter(mySqlString, conn) myAdapter.SelectCommand.ExecuteNonQuery() conn.Close()
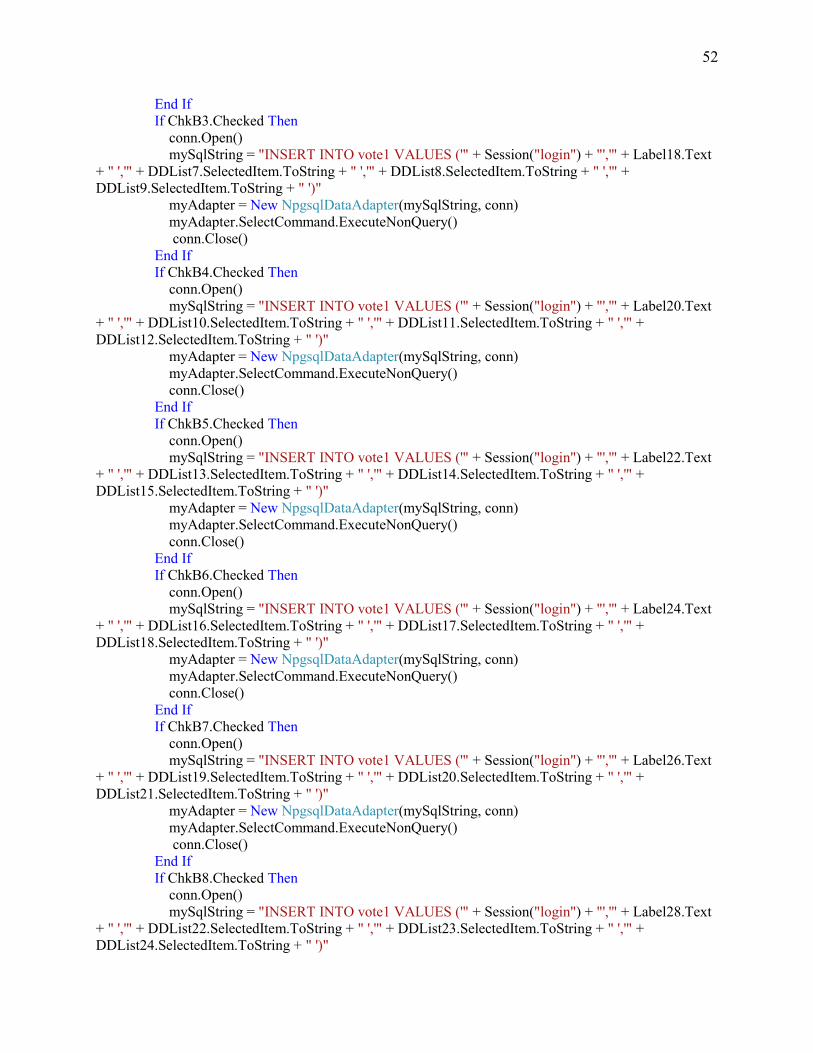
52
End If If ChkB3.Checked Then conn.Open() mySqlString = "INSERT INTO vote1 VALUES ('" + Session("login") + "','" + Label18.Text + " ','" + DDList7.SelectedItem.ToString + " ','" + DDList8.SelectedItem.ToString + " ','" + DDList9.SelectedItem.ToString + " ')" myAdapter = New NpgsqlDataAdapter(mySqlString, conn) myAdapter.SelectCommand.ExecuteNonQuery() conn.Close() End If If ChkB4.Checked Then conn.Open() mySqlString = "INSERT INTO vote1 VALUES ('" + Session("login") + "','" + Label20.Text + " ','" + DDList10.SelectedItem.ToString + " ','" + DDList11.SelectedItem.ToString + " ','" + DDList12.SelectedItem.ToString + " ')" myAdapter = New NpgsqlDataAdapter(mySqlString, conn) myAdapter.SelectCommand.ExecuteNonQuery() conn.Close() End If If ChkB5.Checked Then conn.Open() mySqlString = "INSERT INTO vote1 VALUES ('" + Session("login") + "','" + Label22.Text + " ','" + DDList13.SelectedItem.ToString + " ','" + DDList14.SelectedItem.ToString + " ','" + DDList15.SelectedItem.ToString + " ')" myAdapter = New NpgsqlDataAdapter(mySqlString, conn) myAdapter.SelectCommand.ExecuteNonQuery() conn.Close() End If If ChkB6.Checked Then conn.Open() mySqlString = "INSERT INTO vote1 VALUES ('" + Session("login") + "','" + Label24.Text + " ','" + DDList16.SelectedItem.ToString + " ','" + DDList17.SelectedItem.ToString + " ','" + DDList18.SelectedItem.ToString + " ')" myAdapter = New NpgsqlDataAdapter(mySqlString, conn) myAdapter.SelectCommand.ExecuteNonQuery() conn.Close() End If If ChkB7.Checked Then conn.Open() mySqlString = "INSERT INTO vote1 VALUES ('" + Session("login") + "','" + Label26.Text + " ','" + DDList19.SelectedItem.ToString + " ','" + DDList20.SelectedItem.ToString + " ','" + DDList21.SelectedItem.ToString + " ')" myAdapter = New NpgsqlDataAdapter(mySqlString, conn) myAdapter.SelectCommand.ExecuteNonQuery() conn.Close() End If If ChkB8.Checked Then conn.Open() mySqlString = "INSERT INTO vote1 VALUES ('" + Session("login") + "','" + Label28.Text + " ','" + DDList22.SelectedItem.ToString + " ','" + DDList23.SelectedItem.ToString + " ','" + DDList24.SelectedItem.ToString + " ')"
53
myAdapter = New NpgsqlDataAdapter(mySqlString, conn) myAdapter.SelectCommand.ExecuteNonQuery() conn.Close() conn = Nothing End If Label30.Visible = True Label30.Text = "You have successfully casted your vote!!!" Else MesBox1("This user named " + Session("login") + " had already casted his/her vote. So you cannot vote again!") End If Else MesBox1("Please select at least 1 criteria!!!") End If For Each ctrl As Control In Panel1.Controls If TypeOf ctrl Is CheckBox Then CType(ctrl, CheckBox).Checked = False End If If TypeOf ctrl Is DropDownList Then CType(ctrl, DropDownList).SelectedIndex = 0 End If If TypeOf ctrl Is DropDownList Then CType(ctrl, DropDownList).Enabled = False End If If TypeOf ctrl Is RequiredFieldValidator Then CType(ctrl, RequiredFieldValidator).Enabled = False End If Next End Sub Private Sub LinkButton2_Click(ByVal sender As Object, ByVal e As System.EventArgs) Handles LinkButton2.Click Label30.Visible = False End Sub Private Sub MesBox1(ByVal msg As String) Dim lbl As New Label lbl.Text = "<script language='javascript'>" & Environment.NewLine & _ "window.alert('" + msg + "')</script>" Page.Controls.Add(lbl) End Sub End Class
2. Code Behind the Result Interface
Imports System Imports System.Data Imports System.Web Imports Npgsql Imports InfoSoftGlobal Imports Utilities Public Class result Inherits System.Web.UI.Page
54
Protected Sub Page_Load(ByVal sender As Object, ByVal e As System.EventArgs) Handles Me.Load Dim conn As New NpgsqlConnection Dim mysqlstring As String Dim totalvoters As New NpgsqlCommand conn = New NpgsqlConnection("Server=localhost;Port=5432;Userid=postgres;Database=wpgis;password=gisstudent") conn.Open() mysqlstring = "SELECT Count(DISTINCT username) FROM vote1" totalvoters = New NpgsqlCommand(mysqlstring, conn) Label2.Text = totalvoters.ExecuteScalar conn.Close() End Sub Protected Sub Button2_Click(ByVal sender As Object, ByVal e As EventArgs) Handles Button2.Click Dim conn As New NpgsqlConnection Dim mysqlstring As String Dim myAdapter As New NpgsqlCommand conn = New NpgsqlConnection("Server=localhost;Port=5432;Userid=postgres;Database=wpgis;password=gisstudent") mysqlstring = "SELECT t7.score1,t6.score2,t6.score3 FROM (SELECT t5.id,t5.score2,t4.score3 FROM (SELECT sum(t3.score) as score3, sum(t3.score)* 0 as id FROM (SELECT t2.total*2 as score,t2.id FROM (SELECT site3 as id, count(site3) as total FROM vote1 GROUP BY site3) t2 WHERE(t2.id = 1)UNION SELECT t2.total*1 as score,t2.id FROM (SELECT site3 as id, count(site3) as total FROM vote1 GROUP BY site3) t2 WHERE t2.id=2 UNION SELECT t2.total*0 as score,t2.id FROM (SELECT site3 as id, count(site3) as total FROM vote1 GROUP BY site3) t2 WHERE t2.id=3) t3)t4 INNER JOIN (SELECT sum(t3.score) as score2, sum(t3.score)* 0 as id FROM ( SELECT t2.total*2 as score,t2.id FROM (SELECT site2 as id, count(site2) as total FROM vote1 GROUP BY site2) t2 WHERE(t2.id = 1) UNION SELECT t2.total*1 as score,t2.id FROM (SELECT site2 as id, count(site2) as total FROM vote1 GROUP BY site2) t2 WHERE t2.id=2 UNION SELECT t2.total*0 as score,t2.id FROM (SELECT site2 as id, count(site2) as total FROM vote1 GROUP BY site2) t2 WHERE t2.id=3) t3)t5 ON t4.id=t5.id)t6 INNER JOIN (SELECT sum(t3.score) as score1, sum(t3.score)* 0 as id FROM (SELECT t2.total*2 as score,t2.id FROM (SELECT site1 as id, count(site1) as total FROM vote1 GROUP BY site1) t2 WHERE(t2.id = 1) UNION SELECT t2.total*1 as score,t2.id FROM (SELECT site1 as id, count(site1) as total FROM vote1 GROUP BY site1) t2 WHERE(t2.id = 2) UNION SELECT t2.total*0 as score,t2.id FROM (SELECT site1 as id, count(site1) as total FROM vote1 GROUP BY site1) t2 WHERE t2.id=3) t3)t7 ON t7.id=t6.id" myAdapter = New NpgsqlCommand(mysqlstring, conn) Dim dr As NpgsqlDataReader conn.Open() dr = myAdapter.ExecuteReader Dim dt As New DataTable dr.Read() txtsite11.Text = dr(0).ToString txtsite22.Text = dr(1).ToString txtsite33.Text = dr(2).ToString
55
Button3.Enabled = True Label3.Visible = True HyperLinkMap.Enabled = True conn.Close() End Sub Protected Sub Button3_Click(ByVal sender As Object, ByVal e As EventArgs) Handles Button3.Click Dim conn As New NpgsqlConnection Dim mysqlstring As String Dim myAdapter As New NpgsqlCommand conn = New NpgsqlConnection("Server=localhost;Port=5432;Userid=postgres;Database=wpgis;password=gisstudent") conn.Open() mysqlstring = "UPDATE decision_alternatives SET gscore = CASE site_name WHEN 'Site1' THEN " & txtsite11.Text & " when 'Site2' then " & txtsite22.Text & " when 'Site3' then " & txtsite33.Text & " END WHERE site_name in ('Site1','Site2','Site3');" mysqlstring += "UPDATE decision_alternatives SET grank=t1.rank1 FROM (SELECT gscore, RANK() OVER (ORDER BY gscore DESC) AS rank1 FROM decision_alternatives) t1 WHERE t1.gscore = decision_alternatives.gscore;" myAdapter = New NpgsqlCommand(mysqlstring, conn) myAdapter.ExecuteNonQuery() MesBox1("You have successfully updated both the group score and rank of the decision alternatives on the map!!!") End Sub Private Sub MesBox1(ByVal msg As String) Dim lbl As New Label lbl.Text = "<script language='javascript'>" & Environment.NewLine & _ "window.alert('" + msg + "')</script>" Page.Controls.Add(lbl) End Sub End Class
3. Code Behind the Chart Interface
Imports Npgsql Imports InfoSoftGlobal Imports Utilities Public Class chart Inherits System.Web.UI.Page Protected Sub Page_Load(ByVal sender As Object, ByVal e As System.EventArgs) Handles Me.Load Dim mysqlstring As String Dim totalvoters As New NpgsqlCommand 'Database Objects - Initialization Dim conn As New NpgsqlConnection conn = New NpgsqlConnection("Server=localhost;Port=5432;Userid=postgres;Database=wpgis;password=gisstudent") conn.Open()
56
mysqlstring = "SELECT Count(DISTINCT username) FROM vote1" totalvoters = New NpgsqlCommand(mysqlstring, conn) Label5.Text = totalvoters.ExecuteScalar Label7.Text = totalvoters.ExecuteScalar conn.Close() FCLiteral.Text = CreateChart() FCLiteral1.Text = CreateChart1() End Sub Public Function CreateChart() As String 'Database Objects - Initialization Dim conn As NpgsqlConnection conn = New NpgsqlConnection("Server=localhost;Port=5432;Userid=postgres;Database=wpgis;password=gisstudent") 'Dim oRs As DbConn, strQuery As String 'strXML will be used to store the entire XML document generated Dim strXML As String Dim util As New Util() 'Dim strQuery As String Dim cmd As New NpgsqlCommand() 'Generate the graph element strXML = "<graph caption='Sites Output report' subCaption='By Group Score' xAxisName='Site Name' yAxisName='Group Score' decimalPrecision='0' showNames='1' showvalues='0' numberSuffix='' formatNumberScale='0'>" ' SQL Query cmd.CommandText = "select * from decision_alternatives" cmd.Connection = conn conn.Open() ' Open Data Reader Dim oRs As NpgsqlDataReader = cmd.ExecuteReader 'Iterate through each factory While oRs.Read() 'Generate <set name='..' value='..' /> strXML = strXML & "<set name='" & oRs.Item("site_name").ToString() & "' value='" & oRs.Item("gscore").ToString() & "' color='" & util.getFCColor() & "' />" End While ' Close Data Reader oRs.Close() 'Finally, close <graph> element strXML = strXML & "</graph>" 'Create the chart - Column 3D Chart with data from strXML Return FusionCharts.RenderChartHTML("../FusionCharts/FCF_Column3D.swf", "", strXML, "TotalScore", "550", "350", False)
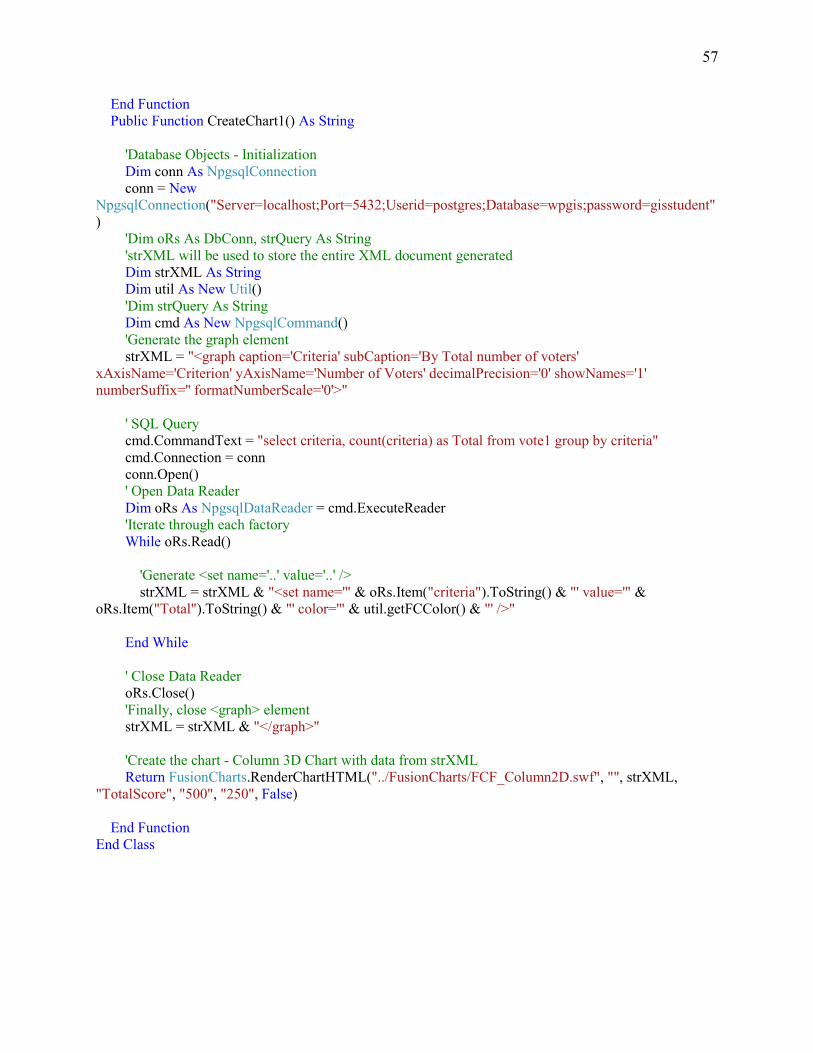
57
End Function Public Function CreateChart1() As String 'Database Objects - Initialization Dim conn As NpgsqlConnection conn = New NpgsqlConnection("Server=localhost;Port=5432;Userid=postgres;Database=wpgis;password=gisstudent") 'Dim oRs As DbConn, strQuery As String 'strXML will be used to store the entire XML document generated Dim strXML As String Dim util As New Util() 'Dim strQuery As String Dim cmd As New NpgsqlCommand() 'Generate the graph element strXML = "<graph caption='Criteria' subCaption='By Total number of voters' xAxisName='Criterion' yAxisName='Number of Voters' decimalPrecision='0' showNames='1' numberSuffix='' formatNumberScale='0'>" ' SQL Query cmd.CommandText = "select criteria, count(criteria) as Total from vote1 group by criteria" cmd.Connection = conn conn.Open() ' Open Data Reader Dim oRs As NpgsqlDataReader = cmd.ExecuteReader 'Iterate through each factory While oRs.Read() 'Generate <set name='..' value='..' /> strXML = strXML & "<set name='" & oRs.Item("criteria").ToString() & "' value='" & oRs.Item("Total").ToString() & "' color='" & util.getFCColor() & "' />" End While ' Close Data Reader oRs.Close() 'Finally, close <graph> element strXML = strXML & "</graph>" 'Create the chart - Column 3D Chart with data from strXML Return FusionCharts.RenderChartHTML("../FusionCharts/FCF_Column2D.swf", "", strXML, "TotalScore", "500", "250", False) End Function End Class