Embed Size (px)
Citation preview
HEI Research Report 184 McDonald Additional Materials I.B Available only on the Web
ADDITIONAL MATERIALS AVAILABLE ON THE HEI WEB SITE
Research Report 184
Advanced Collaborative Emissions Study (ACES): Lifetime Cancer and Non-Cancer Assessment in Rats Exposed to New-Technology Diesel Exhaust
Part 1. Assessment of Carcinogenicity and Biologic Responses in Rats after Lifetime
Inhalation of New-Technology Diesel Exhaust in the ACES Bioassay
Appendix I. Characterization of Exposure Atmospheres in the ACES Bioassay
McDonald et al.
Additional Materials I.B. Exposure Atmosphere Composition Averages at High Exposure Level During Detailed Characterizations, and Characterizations for April
2010, September 2010, April 2011, and April 2012
Additional Materials may appear in a different order from that in the original Investigators’ Report, and some
remnants of their original names may be apparent.
Additional Materials I.B was originally Appendices D–H.
The HEI Exposure Characterization Panel reviewed the draft of this appendix but not the final version. This appendix did not undergo the HEI scientific editing and production process but was proofread for spelling and
grammar only.
Correspondence may be addressed to Dr. Jacob D. McDonald, Lovelace Respiratory Research Institute, 2425 Ridgecrest Dr., SE, Albuquerque, NM 87108; e-mail: [email protected].
Although this document was produced with partial funding by the United States Department of Energy (DOE),
under the terms of Contract/Award Number DE-AC26-05NT42429, and certain motor vehicle and engine manufacturers, the opinion expressed herein are those of the authors and do not necessarily reflect the views of the
DOE or motor vehicle and engine manufacturers.
© 2015 Health Effects Institute, 101 Federal Street, Suite 500, Boston, MA 02110-1817
HEI Research Report 184 McDonald Additional Materials I.B Available only on the Web
Appendix D.
Average ± Standard Deviation for Concentration at High Exposure Level During Detailed
Characterizations
HEI Research Report 184 McDonald Additional Materials I.B Available only on the Web 106
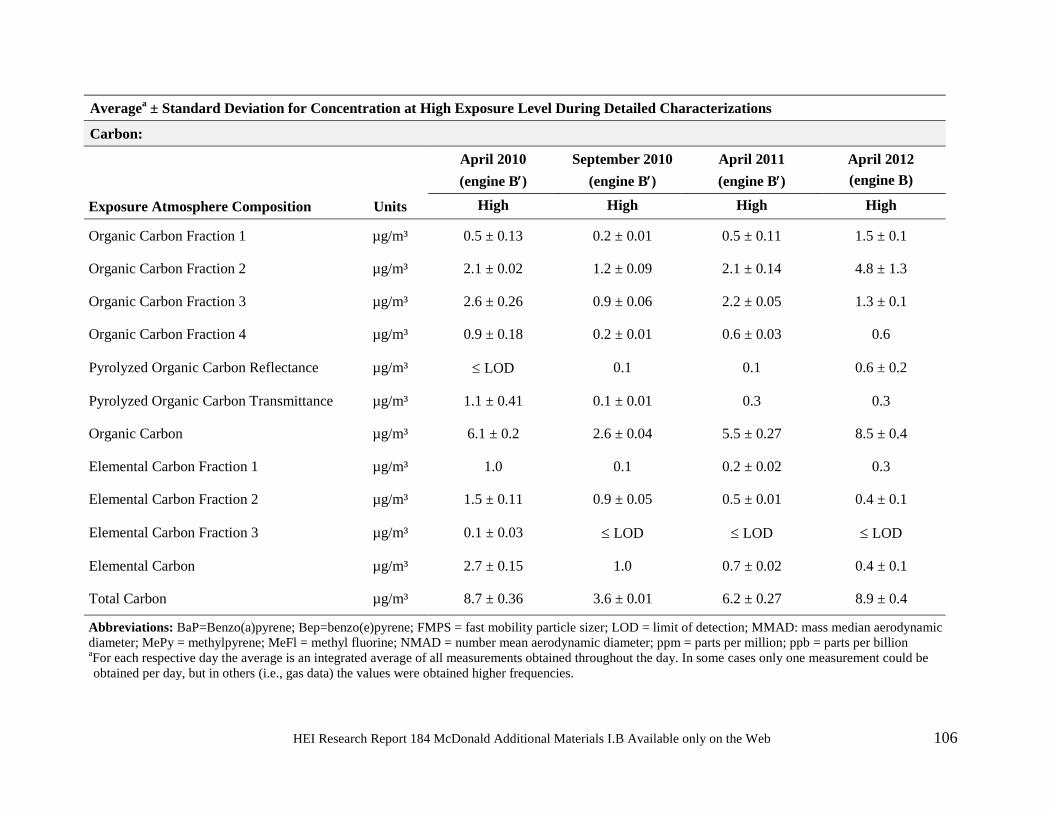
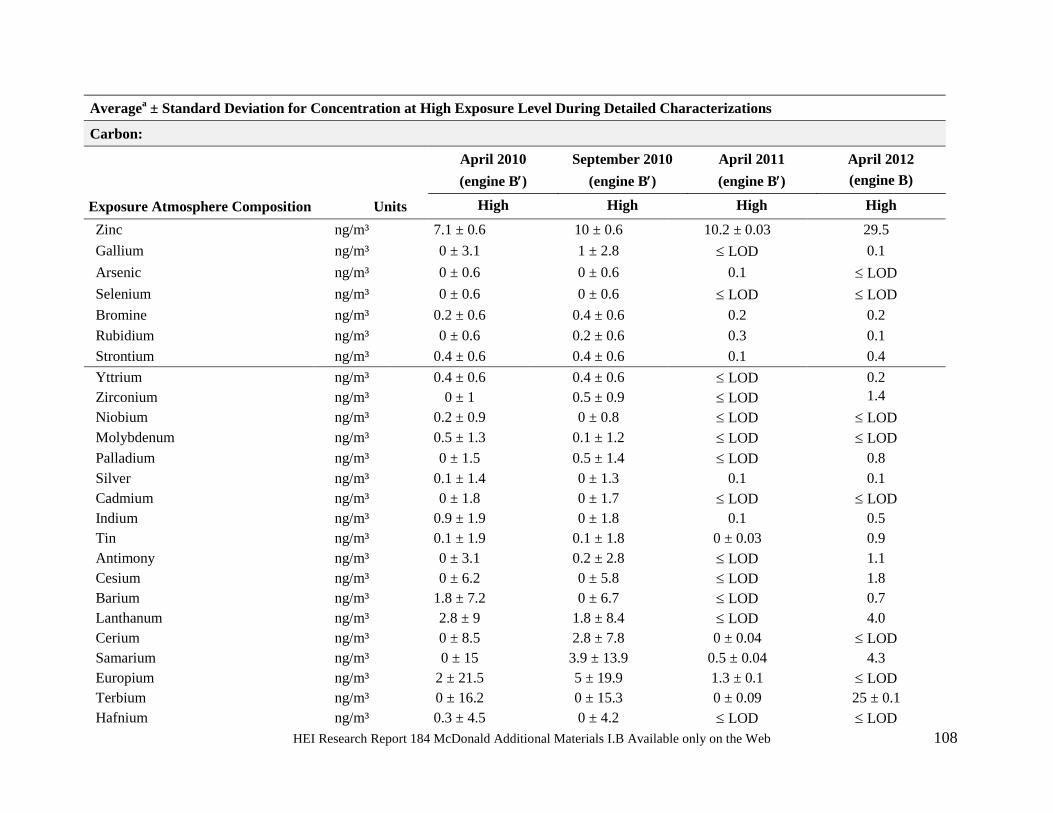
Averagea ± Standard Deviation for Concentration at High Exposure Level During Detailed Characterizations
Carbon:
April 2010 (engine B′)
September 2010 (engine B′)
April 2011 (engine B′)
April 2012 (engine B)
Exposure Atmosphere Composition Units High High High High
Organic Carbon Fraction 1 µg/m³ 0.5 ± 0.13 0.2 ± 0.01 0.5 ± 0.11 1.5 ± 0.1
Organic Carbon Fraction 2 µg/m³ 2.1 ± 0.02 1.2 ± 0.09 2.1 ± 0.14 4.8 ± 1.3
Organic Carbon Fraction 3 µg/m³ 2.6 ± 0.26 0.9 ± 0.06 2.2 ± 0.05 1.3 ± 0.1
Organic Carbon Fraction 4 µg/m³ 0.9 ± 0.18 0.2 ± 0.01 0.6 ± 0.03 0.6
Pyrolyzed Organic Carbon Reflectance µg/m³ ≤ LOD 0.1 0.1 0.6 ± 0.2
Pyrolyzed Organic Carbon Transmittance µg/m³ 1.1 ± 0.41 0.1 ± 0.01 0.3 0.3
Organic Carbon µg/m³ 6.1 ± 0.2 2.6 ± 0.04 5.5 ± 0.27 8.5 ± 0.4
Elemental Carbon Fraction 1 µg/m³ 1.0 0.1 0.2 ± 0.02 0.3
Elemental Carbon Fraction 2 µg/m³ 1.5 ± 0.11 0.9 ± 0.05 0.5 ± 0.01 0.4 ± 0.1
Elemental Carbon Fraction 3 µg/m³ 0.1 ± 0.03 ≤ LOD ≤ LOD ≤ LOD
Elemental Carbon µg/m³ 2.7 ± 0.15 1.0 0.7 ± 0.02 0.4 ± 0.1
Total Carbon µg/m³ 8.7 ± 0.36 3.6 ± 0.01 6.2 ± 0.27 8.9 ± 0.4
Abbreviations: BaP=Benzo(a)pyrene; Bep=benzo(e)pyrene; FMPS = fast mobility particle sizer; LOD = limit of detection; MMAD: mass median aerodynamic diameter; MePy = methylpyrene; MeFl = methyl fluorine; NMAD = number mean aerodynamic diameter; ppm = parts per million; ppb = parts per billion aFor each respective day the average is an integrated average of all measurements obtained throughout the day. In some cases only one measurement could be obtained per day, but in others (i.e., gas data) the values were obtained higher frequencies.
HEI Research Report 184 McDonald Additional Materials I.B Available only on the Web 107
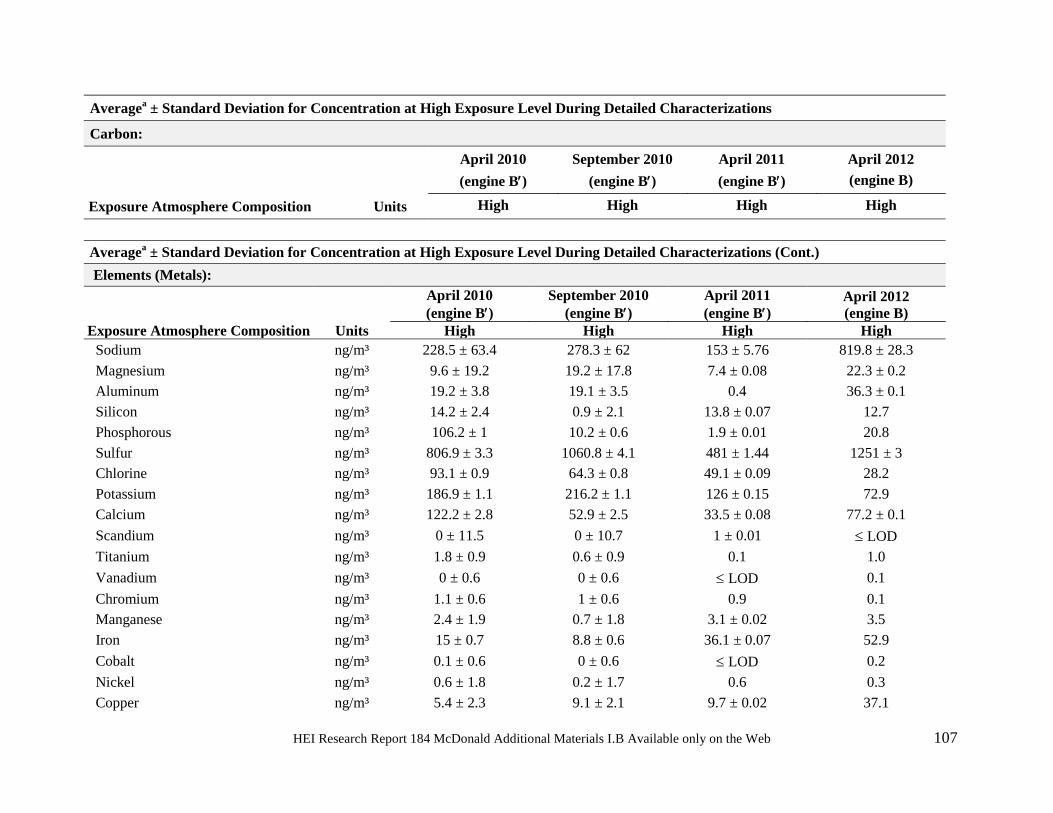
Averagea ± Standard Deviation for Concentration at High Exposure Level During Detailed Characterizations
Carbon:
April 2010 (engine B′)
September 2010 (engine B′)
April 2011 (engine B′)
April 2012 (engine B)
Exposure Atmosphere Composition Units High High High High
Averagea ± Standard Deviation for Concentration at High Exposure Level During Detailed Characterizations (Cont.) Elements (Metals):
April 2010 (engine B′)
September 2010 (engine B′)
April 2011 (engine B′)
April 2012 (engine B)
Exposure Atmosphere Composition Units High High High High Sodium ng/m³ 228.5 ± 63.4 278.3 ± 62 153 ± 5.76 819.8 ± 28.3 Magnesium ng/m³ 9.6 ± 19.2 19.2 ± 17.8 7.4 ± 0.08 22.3 ± 0.2 Aluminum ng/m³ 19.2 ± 3.8 19.1 ± 3.5 0.4 36.3 ± 0.1 Silicon ng/m³ 14.2 ± 2.4 0.9 ± 2.1 13.8 ± 0.07 12.7 Phosphorous ng/m³ 106.2 ± 1 10.2 ± 0.6 1.9 ± 0.01 20.8 Sulfur ng/m³ 806.9 ± 3.3 1060.8 ± 4.1 481 ± 1.44 1251 ± 3 Chlorine ng/m³ 93.1 ± 0.9 64.3 ± 0.8 49.1 ± 0.09 28.2 Potassium ng/m³ 186.9 ± 1.1 216.2 ± 1.1 126 ± 0.15 72.9 Calcium ng/m³ 122.2 ± 2.8 52.9 ± 2.5 33.5 ± 0.08 77.2 ± 0.1 Scandium ng/m³ 0 ± 11.5 0 ± 10.7 1 ± 0.01 ≤ LOD Titanium ng/m³ 1.8 ± 0.9 0.6 ± 0.9 0.1 1.0 Vanadium ng/m³ 0 ± 0.6 0 ± 0.6 ≤ LOD 0.1 Chromium ng/m³ 1.1 ± 0.6 1 ± 0.6 0.9 0.1 Manganese ng/m³ 2.4 ± 1.9 0.7 ± 1.8 3.1 ± 0.02 3.5 Iron ng/m³ 15 ± 0.7 8.8 ± 0.6 36.1 ± 0.07 52.9 Cobalt ng/m³ 0.1 ± 0.6 0 ± 0.6 ≤ LOD 0.2 Nickel ng/m³ 0.6 ± 1.8 0.2 ± 1.7 0.6 0.3 Copper ng/m³ 5.4 ± 2.3 9.1 ± 2.1 9.7 ± 0.02 37.1
HEI Research Report 184 McDonald Additional Materials I.B Available only on the Web 108
Averagea ± Standard Deviation for Concentration at High Exposure Level During Detailed Characterizations
Carbon:
April 2010 (engine B′)
September 2010 (engine B′)
April 2011 (engine B′)
April 2012 (engine B)
Exposure Atmosphere Composition Units High High High High
Zinc ng/m³ 7.1 ± 0.6 10 ± 0.6 10.2 ± 0.03 29.5 Gallium ng/m³ 0 ± 3.1 1 ± 2.8 ≤ LOD 0.1 Arsenic ng/m³ 0 ± 0.6 0 ± 0.6 0.1 ≤ LOD Selenium ng/m³ 0 ± 0.6 0 ± 0.6 ≤ LOD ≤ LOD Bromine ng/m³ 0.2 ± 0.6 0.4 ± 0.6 0.2 0.2 Rubidium ng/m³ 0 ± 0.6 0.2 ± 0.6 0.3 0.1 Strontium ng/m³ 0.4 ± 0.6 0.4 ± 0.6 0.1 0.4 Yttrium ng/m³ 0.4 ± 0.6 0.4 ± 0.6 ≤ LOD 0.2 Zirconium ng/m³ 0 ± 1 0.5 ± 0.9 ≤ LOD 1.4 Niobium ng/m³ 0.2 ± 0.9 0 ± 0.8 ≤ LOD ≤ LOD Molybdenum ng/m³ 0.5 ± 1.3 0.1 ± 1.2 ≤ LOD ≤ LOD Palladium ng/m³ 0 ± 1.5 0.5 ± 1.4 ≤ LOD 0.8 Silver ng/m³ 0.1 ± 1.4 0 ± 1.3 0.1 0.1 Cadmium ng/m³ 0 ± 1.8 0 ± 1.7 ≤ LOD ≤ LOD Indium ng/m³ 0.9 ± 1.9 0 ± 1.8 0.1 0.5 Tin ng/m³ 0.1 ± 1.9 0.1 ± 1.8 0 ± 0.03 0.9 Antimony ng/m³ 0 ± 3.1 0.2 ± 2.8 ≤ LOD 1.1 Cesium ng/m³ 0 ± 6.2 0 ± 5.8 ≤ LOD 1.8 Barium ng/m³ 1.8 ± 7.2 0 ± 6.7 ≤ LOD 0.7 Lanthanum ng/m³ 2.8 ± 9 1.8 ± 8.4 ≤ LOD 4.0 Cerium ng/m³ 0 ± 8.5 2.8 ± 7.8 0 ± 0.04 ≤ LOD Samarium ng/m³ 0 ± 15 3.9 ± 13.9 0.5 ± 0.04 4.3 Europium ng/m³ 2 ± 21.5 5 ± 19.9 1.3 ± 0.1 ≤ LOD Terbium ng/m³ 0 ± 16.2 0 ± 15.3 0 ± 0.09 25 ± 0.1 Hafnium ng/m³ 0.3 ± 4.5 0 ± 4.2 ≤ LOD ≤ LOD
HEI Research Report 184 McDonald Additional Materials I.B Available only on the Web 109
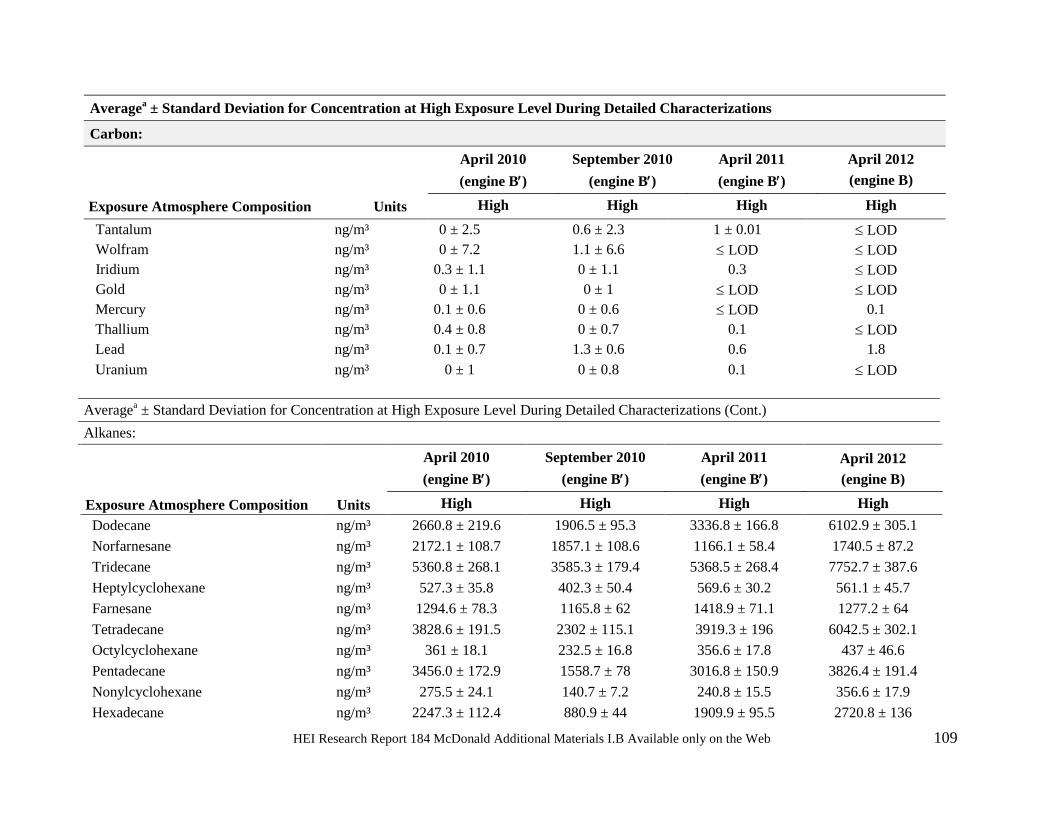
Averagea ± Standard Deviation for Concentration at High Exposure Level During Detailed Characterizations
Carbon:
April 2010 (engine B′)
September 2010 (engine B′)
April 2011 (engine B′)
April 2012 (engine B)
Exposure Atmosphere Composition Units High High High High Tantalum ng/m³ 0 ± 2.5 0.6 ± 2.3 1 ± 0.01 ≤ LOD Wolfram ng/m³ 0 ± 7.2 1.1 ± 6.6 ≤ LOD ≤ LOD Iridium ng/m³ 0.3 ± 1.1 0 ± 1.1 0.3 ≤ LOD Gold ng/m³ 0 ± 1.1 0 ± 1 ≤ LOD ≤ LOD Mercury ng/m³ 0.1 ± 0.6 0 ± 0.6 ≤ LOD 0.1 Thallium ng/m³ 0.4 ± 0.8 0 ± 0.7 0.1 ≤ LOD Lead ng/m³ 0.1 ± 0.7 1.3 ± 0.6 0.6 1.8 Uranium ng/m³ 0 ± 1 0 ± 0.8 0.1 ≤ LOD
Averagea ± Standard Deviation for Concentration at High Exposure Level During Detailed Characterizations (Cont.) Alkanes:
Exposure Atmosphere Composition Units
April 2010 (engine B′)
September 2010 (engine B′)
April 2011 (engine B′)
April 2012 (engine B)
High High High High Dodecane ng/m³ 2660.8 ± 219.6 1906.5 ± 95.3 3336.8 ± 166.8 6102.9 ± 305.1 Norfarnesane ng/m³ 2172.1 ± 108.7 1857.1 ± 108.6 1166.1 ± 58.4 1740.5 ± 87.2 Tridecane ng/m³ 5360.8 ± 268.1 3585.3 ± 179.4 5368.5 ± 268.4 7752.7 ± 387.6 Heptylcyclohexane ng/m³ 527.3 ± 35.8 402.3 ± 50.4 569.6 ± 30.2 561.1 ± 45.7 Farnesane ng/m³ 1294.6 ± 78.3 1165.8 ± 62 1418.9 ± 71.1 1277.2 ± 64 Tetradecane ng/m³ 3828.6 ± 191.5 2302 ± 115.1 3919.3 ± 196 6042.5 ± 302.1 Octylcyclohexane ng/m³ 361 ± 18.1 232.5 ± 16.8 356.6 ± 17.8 437 ± 46.6 Pentadecane ng/m³ 3456.0 ± 172.9 1558.7 ± 78 3016.8 ± 150.9 3826.4 ± 191.4 Nonylcyclohexane ng/m³ 275.5 ± 24.1 140.7 ± 7.2 240.8 ± 15.5 356.6 ± 17.9 Hexadecane ng/m³ 2247.3 ± 112.4 880.9 ± 44 1909.9 ± 95.5 2720.8 ± 136
HEI Research Report 184 McDonald Additional Materials I.B Available only on the Web 110
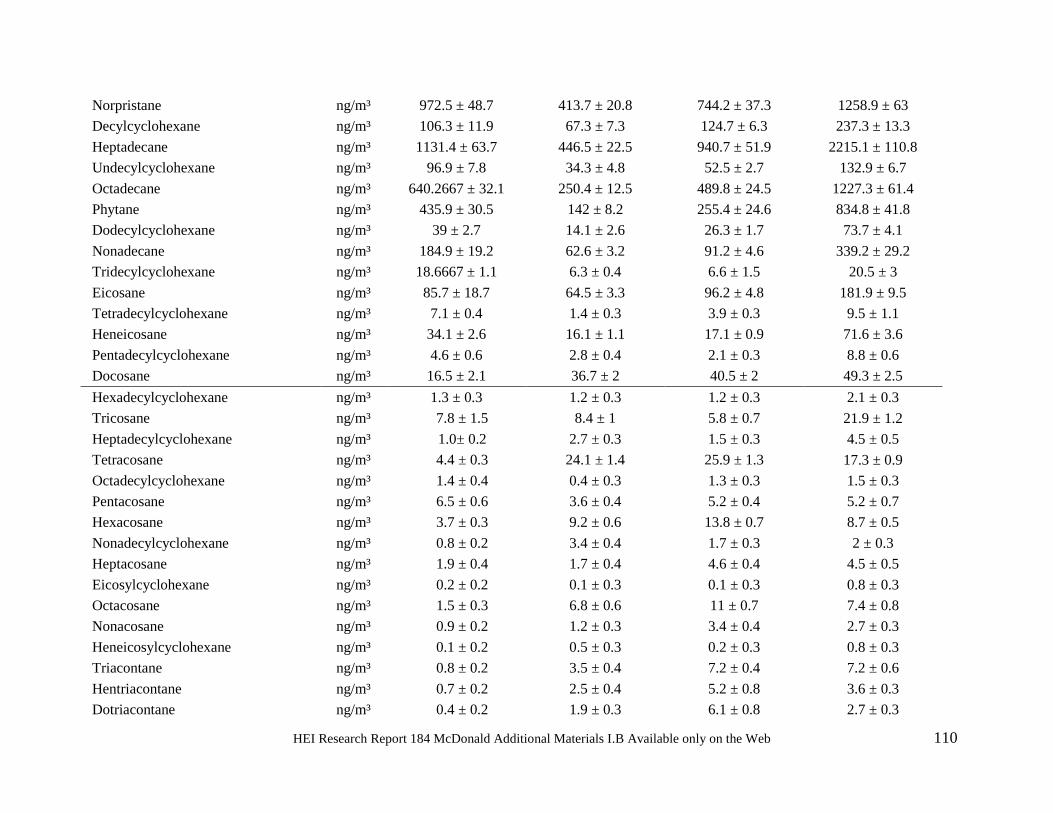
Norpristane ng/m³ 972.5 ± 48.7 413.7 ± 20.8 744.2 ± 37.3 1258.9 ± 63 Decylcyclohexane ng/m³ 106.3 ± 11.9 67.3 ± 7.3 124.7 ± 6.3 237.3 ± 13.3 Heptadecane ng/m³ 1131.4 ± 63.7 446.5 ± 22.5 940.7 ± 51.9 2215.1 ± 110.8 Undecylcyclohexane ng/m³ 96.9 ± 7.8 34.3 ± 4.8 52.5 ± 2.7 132.9 ± 6.7 Octadecane ng/m³ 640.2667 ± 32.1 250.4 ± 12.5 489.8 ± 24.5 1227.3 ± 61.4 Phytane ng/m³ 435.9 ± 30.5 142 ± 8.2 255.4 ± 24.6 834.8 ± 41.8 Dodecylcyclohexane ng/m³ 39 ± 2.7 14.1 ± 2.6 26.3 ± 1.7 73.7 ± 4.1 Nonadecane ng/m³ 184.9 ± 19.2 62.6 ± 3.2 91.2 ± 4.6 339.2 ± 29.2 Tridecylcyclohexane ng/m³ 18.6667 ± 1.1 6.3 ± 0.4 6.6 ± 1.5 20.5 ± 3 Eicosane ng/m³ 85.7 ± 18.7 64.5 ± 3.3 96.2 ± 4.8 181.9 ± 9.5 Tetradecylcyclohexane ng/m³ 7.1 ± 0.4 1.4 ± 0.3 3.9 ± 0.3 9.5 ± 1.1 Heneicosane ng/m³ 34.1 ± 2.6 16.1 ± 1.1 17.1 ± 0.9 71.6 ± 3.6 Pentadecylcyclohexane ng/m³ 4.6 ± 0.6 2.8 ± 0.4 2.1 ± 0.3 8.8 ± 0.6 Docosane ng/m³ 16.5 ± 2.1 36.7 ± 2 40.5 ± 2 49.3 ± 2.5 Hexadecylcyclohexane ng/m³ 1.3 ± 0.3 1.2 ± 0.3 1.2 ± 0.3 2.1 ± 0.3 Tricosane ng/m³ 7.8 ± 1.5 8.4 ± 1 5.8 ± 0.7 21.9 ± 1.2 Heptadecylcyclohexane ng/m³ 1.0± 0.2 2.7 ± 0.3 1.5 ± 0.3 4.5 ± 0.5 Tetracosane ng/m³ 4.4 ± 0.3 24.1 ± 1.4 25.9 ± 1.3 17.3 ± 0.9 Octadecylcyclohexane ng/m³ 1.4 ± 0.4 0.4 ± 0.3 1.3 ± 0.3 1.5 ± 0.3 Pentacosane ng/m³ 6.5 ± 0.6 3.6 ± 0.4 5.2 ± 0.4 5.2 ± 0.7 Hexacosane ng/m³ 3.7 ± 0.3 9.2 ± 0.6 13.8 ± 0.7 8.7 ± 0.5 Nonadecylcyclohexane ng/m³ 0.8 ± 0.2 3.4 ± 0.4 1.7 ± 0.3 2 ± 0.3 Heptacosane ng/m³ 1.9 ± 0.4 1.7 ± 0.4 4.6 ± 0.4 4.5 ± 0.5 Eicosylcyclohexane ng/m³ 0.2 ± 0.2 0.1 ± 0.3 0.1 ± 0.3 0.8 ± 0.3 Octacosane ng/m³ 1.5 ± 0.3 6.8 ± 0.6 11 ± 0.7 7.4 ± 0.8 Nonacosane ng/m³ 0.9 ± 0.2 1.2 ± 0.3 3.4 ± 0.4 2.7 ± 0.3 Heneicosylcyclohexane ng/m³ 0.1 ± 0.2 0.5 ± 0.3 0.2 ± 0.3 0.8 ± 0.3 Triacontane ng/m³ 0.8 ± 0.2 3.5 ± 0.4 7.2 ± 0.4 7.2 ± 0.6 Hentriacontane ng/m³ 0.7 ± 0.2 2.5 ± 0.4 5.2 ± 0.8 3.6 ± 0.3 Dotriacontane ng/m³ 0.4 ± 0.2 1.9 ± 0.3 6.1 ± 0.8 2.7 ± 0.3
HEI Research Report 184 McDonald Additional Materials I.B Available only on the Web 111
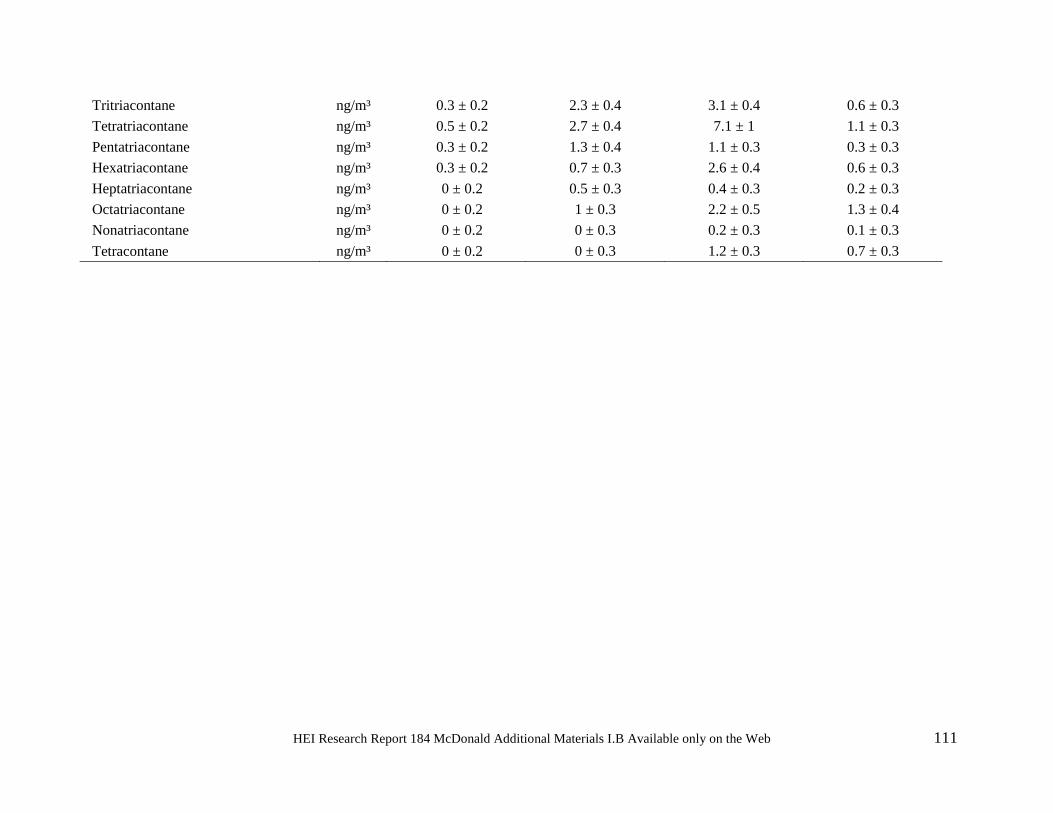
Tritriacontane ng/m³ 0.3 ± 0.2 2.3 ± 0.4 3.1 ± 0.4 0.6 ± 0.3 Tetratriacontane ng/m³ 0.5 ± 0.2 2.7 ± 0.4 7.1 ± 1 1.1 ± 0.3 Pentatriacontane ng/m³ 0.3 ± 0.2 1.3 ± 0.4 1.1 ± 0.3 0.3 ± 0.3 Hexatriacontane ng/m³ 0.3 ± 0.2 0.7 ± 0.3 2.6 ± 0.4 0.6 ± 0.3 Heptatriacontane ng/m³ 0 ± 0.2 0.5 ± 0.3 0.4 ± 0.3 0.2 ± 0.3 Octatriacontane ng/m³ 0 ± 0.2 1 ± 0.3 2.2 ± 0.5 1.3 ± 0.4 Nonatriacontane ng/m³ 0 ± 0.2 0 ± 0.3 0.2 ± 0.3 0.1 ± 0.3 Tetracontane ng/m³ 0 ± 0.2 0 ± 0.3 1.2 ± 0.3 0.7 ± 0.3
HEI Research Report 184 McDonald Additional Materials I.B Available only on the Web 112
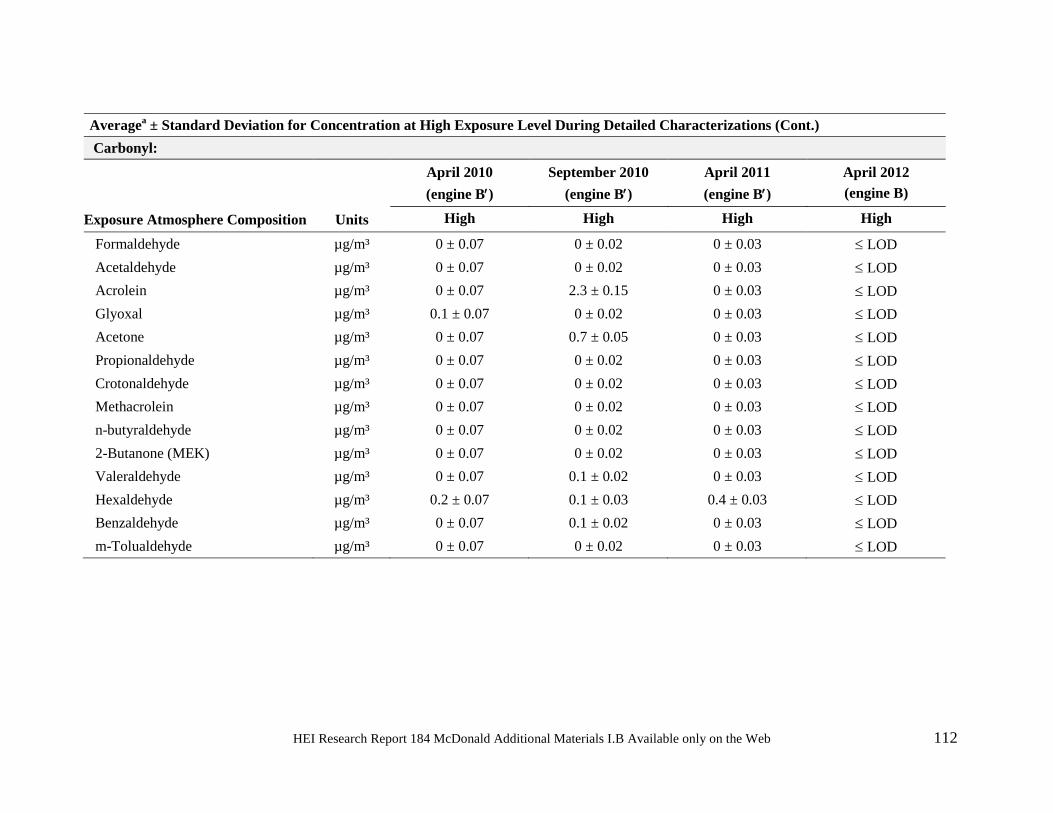
Averagea ± Standard Deviation for Concentration at High Exposure Level During Detailed Characterizations (Cont.) Carbonyl:
April 2010
(engine B′) September 2010
(engine B′) April 2011 (engine B′)
April 2012 (engine B)
Exposure Atmosphere Composition Units High High High High Formaldehyde µg/m³ 0 ± 0.07 0 ± 0.02 0 ± 0.03 ≤ LOD Acetaldehyde µg/m³ 0 ± 0.07 0 ± 0.02 0 ± 0.03 ≤ LOD Acrolein µg/m³ 0 ± 0.07 2.3 ± 0.15 0 ± 0.03 ≤ LOD Glyoxal µg/m³ 0.1 ± 0.07 0 ± 0.02 0 ± 0.03 ≤ LOD Acetone µg/m³ 0 ± 0.07 0.7 ± 0.05 0 ± 0.03 ≤ LOD Propionaldehyde µg/m³ 0 ± 0.07 0 ± 0.02 0 ± 0.03 ≤ LOD Crotonaldehyde µg/m³ 0 ± 0.07 0 ± 0.02 0 ± 0.03 ≤ LOD Methacrolein µg/m³ 0 ± 0.07 0 ± 0.02 0 ± 0.03 ≤ LOD n-butyraldehyde µg/m³ 0 ± 0.07 0 ± 0.02 0 ± 0.03 ≤ LOD 2-Butanone (MEK) µg/m³ 0 ± 0.07 0 ± 0.02 0 ± 0.03 ≤ LOD Valeraldehyde µg/m³ 0 ± 0.07 0.1 ± 0.02 0 ± 0.03 ≤ LOD Hexaldehyde µg/m³ 0.2 ± 0.07 0.1 ± 0.03 0.4 ± 0.03 ≤ LOD Benzaldehyde µg/m³ 0 ± 0.07 0.1 ± 0.02 0 ± 0.03 ≤ LOD m-Tolualdehyde µg/m³ 0 ± 0.07 0 ± 0.02 0 ± 0.03 ≤ LOD
HEI Research Report 184 McDonald Additional Materials I.B Available only on the Web 113
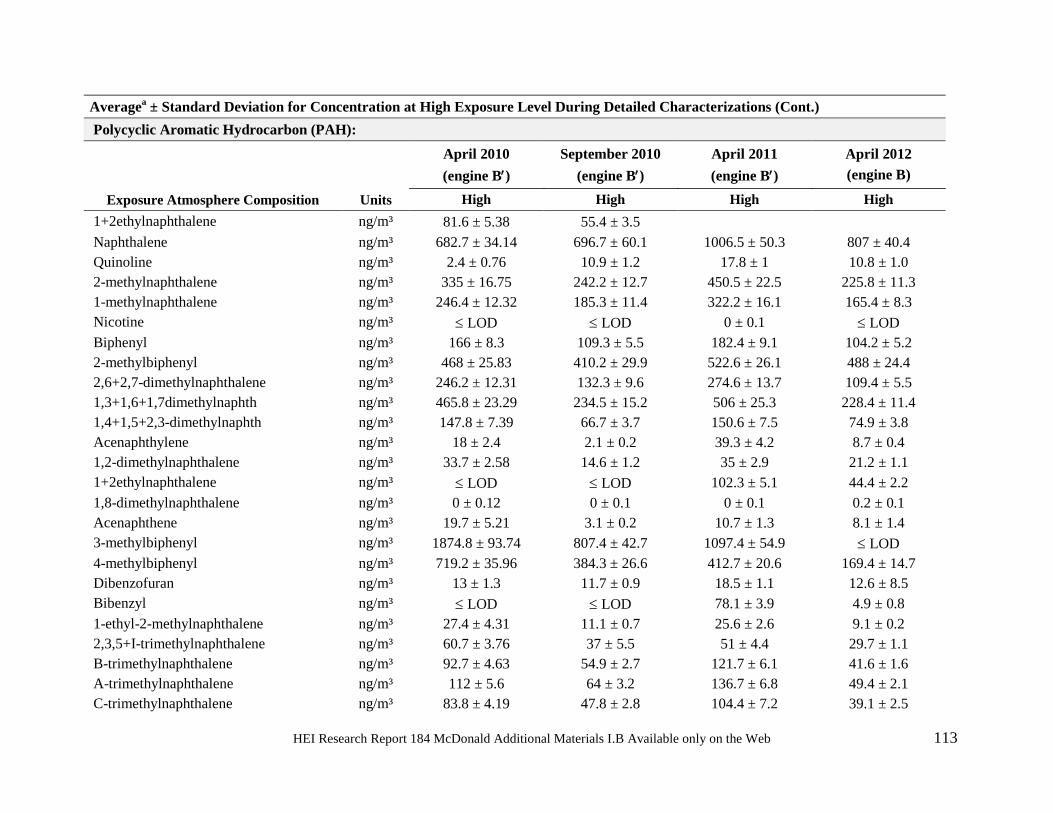
Averagea ± Standard Deviation for Concentration at High Exposure Level During Detailed Characterizations (Cont.) Polycyclic Aromatic Hydrocarbon (PAH):
Exposure Atmosphere Composition Units
April 2010 (engine B′)
September 2010 (engine B′)
April 2011 (engine B′)
April 2012 (engine B)
High High High High 1+2ethylnaphthalene ng/m³ 81.6 ± 5.38 55.4 ± 3.5 Naphthalene ng/m³ 682.7 ± 34.14 696.7 ± 60.1 1006.5 ± 50.3 807 ± 40.4 Quinoline ng/m³ 2.4 ± 0.76 10.9 ± 1.2 17.8 ± 1 10.8 ± 1.0 2-methylnaphthalene ng/m³ 335 ± 16.75 242.2 ± 12.7 450.5 ± 22.5 225.8 ± 11.3 1-methylnaphthalene ng/m³ 246.4 ± 12.32 185.3 ± 11.4 322.2 ± 16.1 165.4 ± 8.3 Nicotine ng/m³ ≤ LOD ≤ LOD 0 ± 0.1 ≤ LOD Biphenyl ng/m³ 166 ± 8.3 109.3 ± 5.5 182.4 ± 9.1 104.2 ± 5.2 2-methylbiphenyl ng/m³ 468 ± 25.83 410.2 ± 29.9 522.6 ± 26.1 488 ± 24.4 2,6+2,7-dimethylnaphthalene ng/m³ 246.2 ± 12.31 132.3 ± 9.6 274.6 ± 13.7 109.4 ± 5.5 1,3+1,6+1,7dimethylnaphth ng/m³ 465.8 ± 23.29 234.5 ± 15.2 506 ± 25.3 228.4 ± 11.4 1,4+1,5+2,3-dimethylnaphth ng/m³ 147.8 ± 7.39 66.7 ± 3.7 150.6 ± 7.5 74.9 ± 3.8 Acenaphthylene ng/m³ 18 ± 2.4 2.1 ± 0.2 39.3 ± 4.2 8.7 ± 0.4 1,2-dimethylnaphthalene ng/m³ 33.7 ± 2.58 14.6 ± 1.2 35 ± 2.9 21.2 ± 1.1 1+2ethylnaphthalene ng/m³ ≤ LOD ≤ LOD 102.3 ± 5.1 44.4 ± 2.2 1,8-dimethylnaphthalene ng/m³ 0 ± 0.12 0 ± 0.1 0 ± 0.1 0.2 ± 0.1 Acenaphthene ng/m³ 19.7 ± 5.21 3.1 ± 0.2 10.7 ± 1.3 8.1 ± 1.4 3-methylbiphenyl ng/m³ 1874.8 ± 93.74 807.4 ± 42.7 1097.4 ± 54.9 ≤ LOD 4-methylbiphenyl ng/m³ 719.2 ± 35.96 384.3 ± 26.6 412.7 ± 20.6 169.4 ± 14.7 Dibenzofuran ng/m³ 13 ± 1.3 11.7 ± 0.9 18.5 ± 1.1 12.6 ± 8.5 Bibenzyl ng/m³ ≤ LOD ≤ LOD 78.1 ± 3.9 4.9 ± 0.8 1-ethyl-2-methylnaphthalene ng/m³ 27.4 ± 4.31 11.1 ± 0.7 25.6 ± 2.6 9.1 ± 0.2 2,3,5+I-trimethylnaphthalene ng/m³ 60.7 ± 3.76 37 ± 5.5 51 ± 4.4 29.7 ± 1.1 B-trimethylnaphthalene ng/m³ 92.7 ± 4.63 54.9 ± 2.7 121.7 ± 6.1 41.6 ± 1.6 A-trimethylnaphthalene ng/m³ 112 ± 5.6 64 ± 3.2 136.7 ± 6.8 49.4 ± 2.1 C-trimethylnaphthalene ng/m³ 83.8 ± 4.19 47.8 ± 2.8 104.4 ± 7.2 39.1 ± 2.5
HEI Research Report 184 McDonald Additional Materials I.B Available only on the Web 114
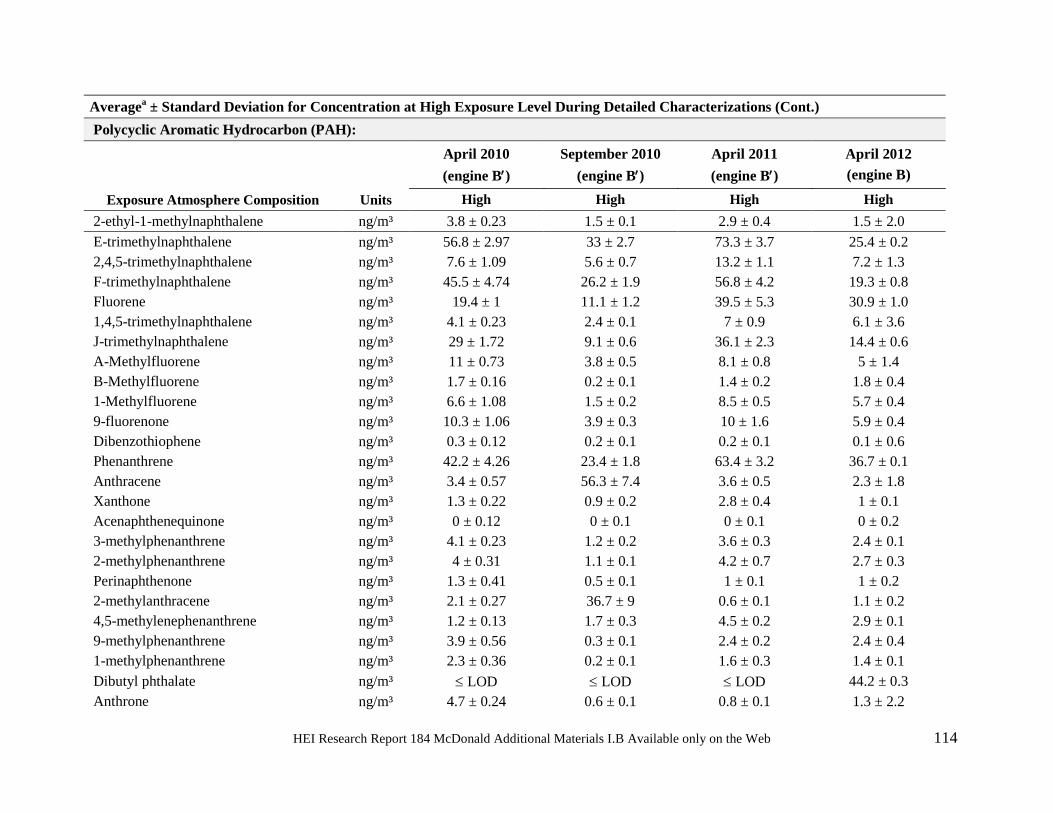
Averagea ± Standard Deviation for Concentration at High Exposure Level During Detailed Characterizations (Cont.) Polycyclic Aromatic Hydrocarbon (PAH):
Exposure Atmosphere Composition Units
April 2010 (engine B′)
September 2010 (engine B′)
April 2011 (engine B′)
April 2012 (engine B)
High High High High 2-ethyl-1-methylnaphthalene ng/m³ 3.8 ± 0.23 1.5 ± 0.1 2.9 ± 0.4 1.5 ± 2.0 E-trimethylnaphthalene ng/m³ 56.8 ± 2.97 33 ± 2.7 73.3 ± 3.7 25.4 ± 0.2 2,4,5-trimethylnaphthalene ng/m³ 7.6 ± 1.09 5.6 ± 0.7 13.2 ± 1.1 7.2 ± 1.3 F-trimethylnaphthalene ng/m³ 45.5 ± 4.74 26.2 ± 1.9 56.8 ± 4.2 19.3 ± 0.8 Fluorene ng/m³ 19.4 ± 1 11.1 ± 1.2 39.5 ± 5.3 30.9 ± 1.0 1,4,5-trimethylnaphthalene ng/m³ 4.1 ± 0.23 2.4 ± 0.1 7 ± 0.9 6.1 ± 3.6 J-trimethylnaphthalene ng/m³ 29 ± 1.72 9.1 ± 0.6 36.1 ± 2.3 14.4 ± 0.6 A-Methylfluorene ng/m³ 11 ± 0.73 3.8 ± 0.5 8.1 ± 0.8 5 ± 1.4 B-Methylfluorene ng/m³ 1.7 ± 0.16 0.2 ± 0.1 1.4 ± 0.2 1.8 ± 0.4 1-Methylfluorene ng/m³ 6.6 ± 1.08 1.5 ± 0.2 8.5 ± 0.5 5.7 ± 0.4 9-fluorenone ng/m³ 10.3 ± 1.06 3.9 ± 0.3 10 ± 1.6 5.9 ± 0.4 Dibenzothiophene ng/m³ 0.3 ± 0.12 0.2 ± 0.1 0.2 ± 0.1 0.1 ± 0.6 Phenanthrene ng/m³ 42.2 ± 4.26 23.4 ± 1.8 63.4 ± 3.2 36.7 ± 0.1 Anthracene ng/m³ 3.4 ± 0.57 56.3 ± 7.4 3.6 ± 0.5 2.3 ± 1.8 Xanthone ng/m³ 1.3 ± 0.22 0.9 ± 0.2 2.8 ± 0.4 1 ± 0.1 Acenaphthenequinone ng/m³ 0 ± 0.12 0 ± 0.1 0 ± 0.1 0 ± 0.2 3-methylphenanthrene ng/m³ 4.1 ± 0.23 1.2 ± 0.2 3.6 ± 0.3 2.4 ± 0.1 2-methylphenanthrene ng/m³ 4 ± 0.31 1.1 ± 0.1 4.2 ± 0.7 2.7 ± 0.3 Perinaphthenone ng/m³ 1.3 ± 0.41 0.5 ± 0.1 1 ± 0.1 1 ± 0.2 2-methylanthracene ng/m³ 2.1 ± 0.27 36.7 ± 9 0.6 ± 0.1 1.1 ± 0.2 4,5-methylenephenanthrene ng/m³ 1.2 ± 0.13 1.7 ± 0.3 4.5 ± 0.2 2.9 ± 0.1 9-methylphenanthrene ng/m³ 3.9 ± 0.56 0.3 ± 0.1 2.4 ± 0.2 2.4 ± 0.4 1-methylphenanthrene ng/m³ 2.3 ± 0.36 0.2 ± 0.1 1.6 ± 0.3 1.4 ± 0.1 Dibutyl phthalate ng/m³ ≤ LOD ≤ LOD ≤ LOD 44.2 ± 0.3 Anthrone ng/m³ 4.7 ± 0.24 0.6 ± 0.1 0.8 ± 0.1 1.3 ± 2.2
HEI Research Report 184 McDonald Additional Materials I.B Available only on the Web 115
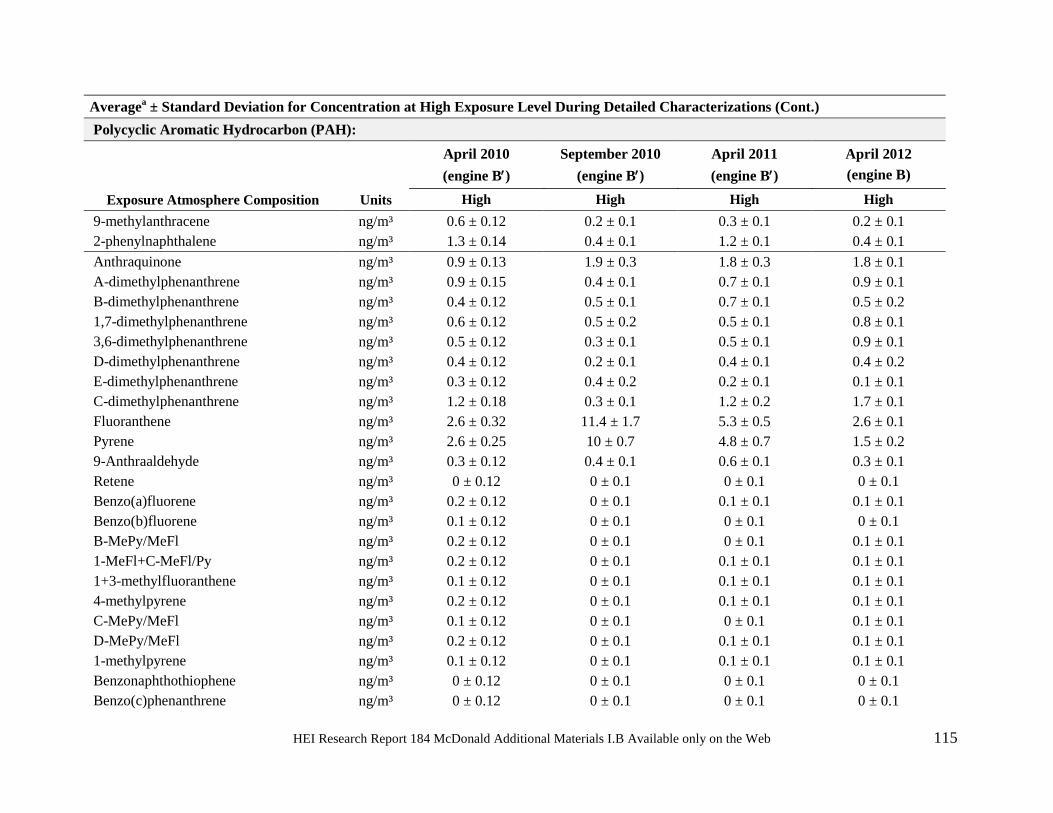
Averagea ± Standard Deviation for Concentration at High Exposure Level During Detailed Characterizations (Cont.) Polycyclic Aromatic Hydrocarbon (PAH):
Exposure Atmosphere Composition Units
April 2010 (engine B′)
September 2010 (engine B′)
April 2011 (engine B′)
April 2012 (engine B)
High High High High 9-methylanthracene ng/m³ 0.6 ± 0.12 0.2 ± 0.1 0.3 ± 0.1 0.2 ± 0.1 2-phenylnaphthalene ng/m³ 1.3 ± 0.14 0.4 ± 0.1 1.2 ± 0.1 0.4 ± 0.1 Anthraquinone ng/m³ 0.9 ± 0.13 1.9 ± 0.3 1.8 ± 0.3 1.8 ± 0.1 A-dimethylphenanthrene ng/m³ 0.9 ± 0.15 0.4 ± 0.1 0.7 ± 0.1 0.9 ± 0.1 B-dimethylphenanthrene ng/m³ 0.4 ± 0.12 0.5 ± 0.1 0.7 ± 0.1 0.5 ± 0.2 1,7-dimethylphenanthrene ng/m³ 0.6 ± 0.12 0.5 ± 0.2 0.5 ± 0.1 0.8 ± 0.1 3,6-dimethylphenanthrene ng/m³ 0.5 ± 0.12 0.3 ± 0.1 0.5 ± 0.1 0.9 ± 0.1 D-dimethylphenanthrene ng/m³ 0.4 ± 0.12 0.2 ± 0.1 0.4 ± 0.1 0.4 ± 0.2 E-dimethylphenanthrene ng/m³ 0.3 ± 0.12 0.4 ± 0.2 0.2 ± 0.1 0.1 ± 0.1 C-dimethylphenanthrene ng/m³ 1.2 ± 0.18 0.3 ± 0.1 1.2 ± 0.2 1.7 ± 0.1 Fluoranthene ng/m³ 2.6 ± 0.32 11.4 ± 1.7 5.3 ± 0.5 2.6 ± 0.1 Pyrene ng/m³ 2.6 ± 0.25 10 ± 0.7 4.8 ± 0.7 1.5 ± 0.2 9-Anthraaldehyde ng/m³ 0.3 ± 0.12 0.4 ± 0.1 0.6 ± 0.1 0.3 ± 0.1 Retene ng/m³ 0 ± 0.12 0 ± 0.1 0 ± 0.1 0 ± 0.1 Benzo(a)fluorene ng/m³ 0.2 ± 0.12 0 ± 0.1 0.1 ± 0.1 0.1 ± 0.1 Benzo(b)fluorene ng/m³ 0.1 ± 0.12 0 ± 0.1 0 ± 0.1 0 ± 0.1 B-MePy/MeFl ng/m³ 0.2 ± 0.12 0 ± 0.1 0 ± 0.1 0.1 ± 0.1 1-MeFl+C-MeFl/Py ng/m³ 0.2 ± 0.12 0 ± 0.1 0.1 ± 0.1 0.1 ± 0.1 1+3-methylfluoranthene ng/m³ 0.1 ± 0.12 0 ± 0.1 0.1 ± 0.1 0.1 ± 0.1 4-methylpyrene ng/m³ 0.2 ± 0.12 0 ± 0.1 0.1 ± 0.1 0.1 ± 0.1 C-MePy/MeFl ng/m³ 0.1 ± 0.12 0 ± 0.1 0 ± 0.1 0.1 ± 0.1 D-MePy/MeFl ng/m³ 0.2 ± 0.12 0 ± 0.1 0.1 ± 0.1 0.1 ± 0.1 1-methylpyrene ng/m³ 0.1 ± 0.12 0 ± 0.1 0.1 ± 0.1 0.1 ± 0.1 Benzonaphthothiophene ng/m³ 0 ± 0.12 0 ± 0.1 0 ± 0.1 0 ± 0.1 Benzo(c)phenanthrene ng/m³ 0 ± 0.12 0 ± 0.1 0 ± 0.1 0 ± 0.1
HEI Research Report 184 McDonald Additional Materials I.B Available only on the Web 116
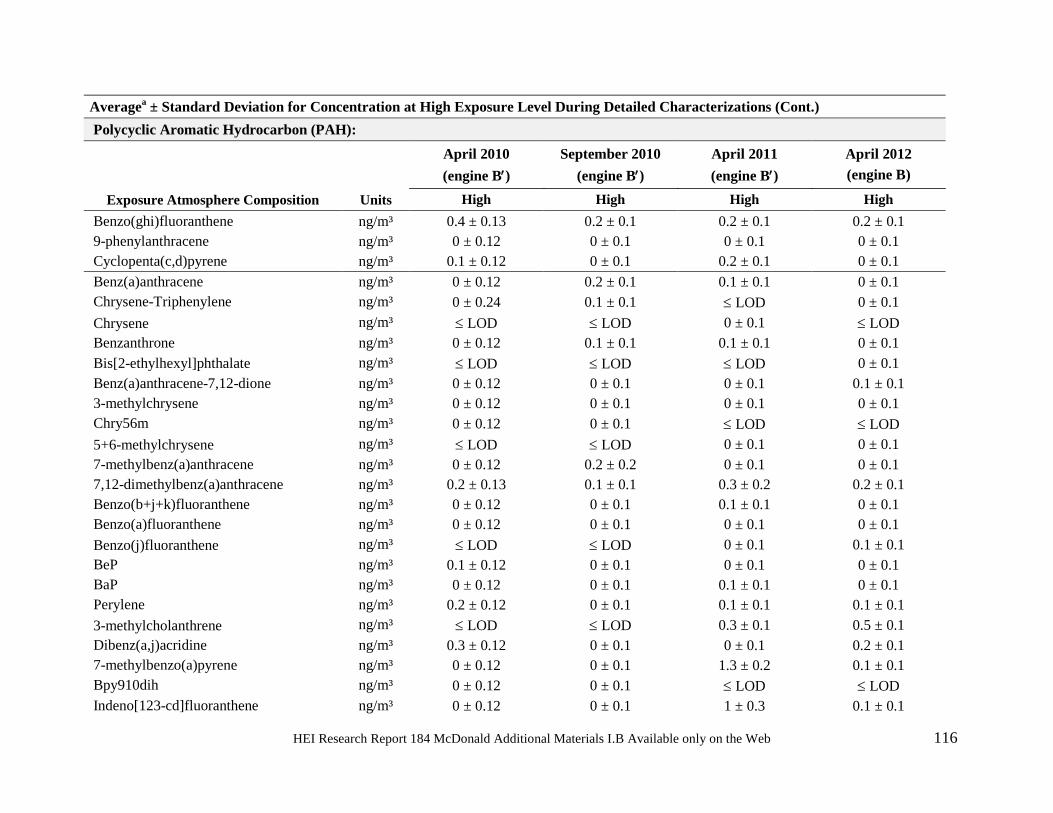
Averagea ± Standard Deviation for Concentration at High Exposure Level During Detailed Characterizations (Cont.) Polycyclic Aromatic Hydrocarbon (PAH):
Exposure Atmosphere Composition Units
April 2010 (engine B′)
September 2010 (engine B′)
April 2011 (engine B′)
April 2012 (engine B)
High High High High Benzo(ghi)fluoranthene ng/m³ 0.4 ± 0.13 0.2 ± 0.1 0.2 ± 0.1 0.2 ± 0.1 9-phenylanthracene ng/m³ 0 ± 0.12 0 ± 0.1 0 ± 0.1 0 ± 0.1 Cyclopenta(c,d)pyrene ng/m³ 0.1 ± 0.12 0 ± 0.1 0.2 ± 0.1 0 ± 0.1 Benz(a)anthracene ng/m³ 0 ± 0.12 0.2 ± 0.1 0.1 ± 0.1 0 ± 0.1 Chrysene-Triphenylene ng/m³ 0 ± 0.24 0.1 ± 0.1 ≤ LOD 0 ± 0.1 Chrysene ng/m³ ≤ LOD ≤ LOD 0 ± 0.1 ≤ LOD Benzanthrone ng/m³ 0 ± 0.12 0.1 ± 0.1 0.1 ± 0.1 0 ± 0.1 Bis[2-ethylhexyl]phthalate ng/m³ ≤ LOD ≤ LOD ≤ LOD 0 ± 0.1 Benz(a)anthracene-7,12-dione ng/m³ 0 ± 0.12 0 ± 0.1 0 ± 0.1 0.1 ± 0.1 3-methylchrysene ng/m³ 0 ± 0.12 0 ± 0.1 0 ± 0.1 0 ± 0.1 Chry56m ng/m³ 0 ± 0.12 0 ± 0.1 ≤ LOD ≤ LOD 5+6-methylchrysene ng/m³ ≤ LOD ≤ LOD 0 ± 0.1 0 ± 0.1 7-methylbenz(a)anthracene ng/m³ 0 ± 0.12 0.2 ± 0.2 0 ± 0.1 0 ± 0.1 7,12-dimethylbenz(a)anthracene ng/m³ 0.2 ± 0.13 0.1 ± 0.1 0.3 ± 0.2 0.2 ± 0.1 Benzo(b+j+k)fluoranthene ng/m³ 0 ± 0.12 0 ± 0.1 0.1 ± 0.1 0 ± 0.1 Benzo(a)fluoranthene ng/m³ 0 ± 0.12 0 ± 0.1 0 ± 0.1 0 ± 0.1 Benzo(j)fluoranthene ng/m³ ≤ LOD ≤ LOD 0 ± 0.1 0.1 ± 0.1 BeP ng/m³ 0.1 ± 0.12 0 ± 0.1 0 ± 0.1 0 ± 0.1 BaP ng/m³ 0 ± 0.12 0 ± 0.1 0.1 ± 0.1 0 ± 0.1 Perylene ng/m³ 0.2 ± 0.12 0 ± 0.1 0.1 ± 0.1 0.1 ± 0.1 3-methylcholanthrene ng/m³ ≤ LOD ≤ LOD 0.3 ± 0.1 0.5 ± 0.1 Dibenz(a,j)acridine ng/m³ 0.3 ± 0.12 0 ± 0.1 0 ± 0.1 0.2 ± 0.1 7-methylbenzo(a)pyrene ng/m³ 0 ± 0.12 0 ± 0.1 1.3 ± 0.2 0.1 ± 0.1 Bpy910dih ng/m³ 0 ± 0.12 0 ± 0.1 ≤ LOD ≤ LOD Indeno[123-cd]fluoranthene ng/m³ 0 ± 0.12 0 ± 0.1 1 ± 0.3 0.1 ± 0.1
HEI Research Report 184 McDonald Additional Materials I.B Available only on the Web 117
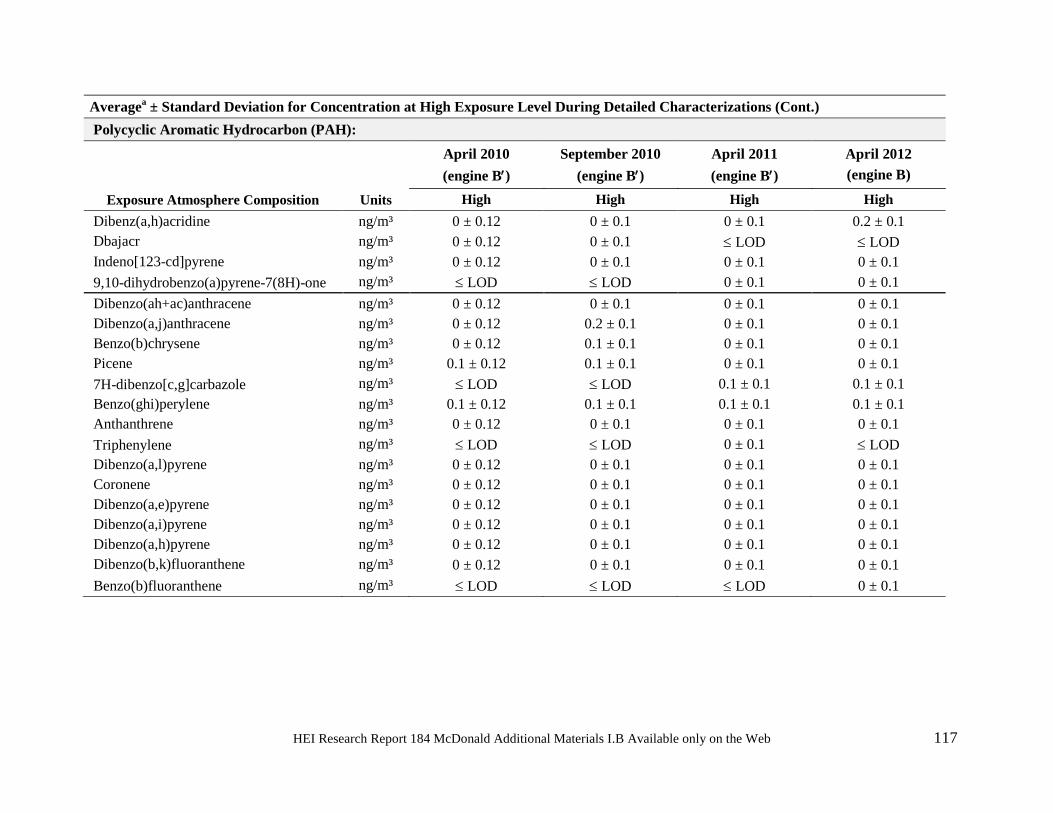
Averagea ± Standard Deviation for Concentration at High Exposure Level During Detailed Characterizations (Cont.) Polycyclic Aromatic Hydrocarbon (PAH):
Exposure Atmosphere Composition Units
April 2010 (engine B′)
September 2010 (engine B′)
April 2011 (engine B′)
April 2012 (engine B)
High High High High Dibenz(a,h)acridine ng/m³ 0 ± 0.12 0 ± 0.1 0 ± 0.1 0.2 ± 0.1 Dbajacr ng/m³ 0 ± 0.12 0 ± 0.1 ≤ LOD ≤ LOD Indeno[123-cd]pyrene ng/m³ 0 ± 0.12 0 ± 0.1 0 ± 0.1 0 ± 0.1 9,10-dihydrobenzo(a)pyrene-7(8H)-one ng/m³ ≤ LOD ≤ LOD 0 ± 0.1 0 ± 0.1 Dibenzo(ah+ac)anthracene ng/m³ 0 ± 0.12 0 ± 0.1 0 ± 0.1 0 ± 0.1 Dibenzo(a,j)anthracene ng/m³ 0 ± 0.12 0.2 ± 0.1 0 ± 0.1 0 ± 0.1 Benzo(b)chrysene ng/m³ 0 ± 0.12 0.1 ± 0.1 0 ± 0.1 0 ± 0.1 Picene ng/m³ 0.1 ± 0.12 0.1 ± 0.1 0 ± 0.1 0 ± 0.1 7H-dibenzo[c,g]carbazole ng/m³ ≤ LOD ≤ LOD 0.1 ± 0.1 0.1 ± 0.1 Benzo(ghi)perylene ng/m³ 0.1 ± 0.12 0.1 ± 0.1 0.1 ± 0.1 0.1 ± 0.1 Anthanthrene ng/m³ 0 ± 0.12 0 ± 0.1 0 ± 0.1 0 ± 0.1 Triphenylene ng/m³ ≤ LOD ≤ LOD 0 ± 0.1 ≤ LOD Dibenzo(a,l)pyrene ng/m³ 0 ± 0.12 0 ± 0.1 0 ± 0.1 0 ± 0.1 Coronene ng/m³ 0 ± 0.12 0 ± 0.1 0 ± 0.1 0 ± 0.1 Dibenzo(a,e)pyrene ng/m³ 0 ± 0.12 0 ± 0.1 0 ± 0.1 0 ± 0.1 Dibenzo(a,i)pyrene ng/m³ 0 ± 0.12 0 ± 0.1 0 ± 0.1 0 ± 0.1 Dibenzo(a,h)pyrene ng/m³ 0 ± 0.12 0 ± 0.1 0 ± 0.1 0 ± 0.1 Dibenzo(b,k)fluoranthene ng/m³ 0 ± 0.12 0 ± 0.1 0 ± 0.1 0 ± 0.1 Benzo(b)fluoranthene ng/m³ ≤ LOD ≤ LOD ≤ LOD 0 ± 0.1
HEI Research Report 184 McDonald Additional Materials I.B Available only on the Web 118
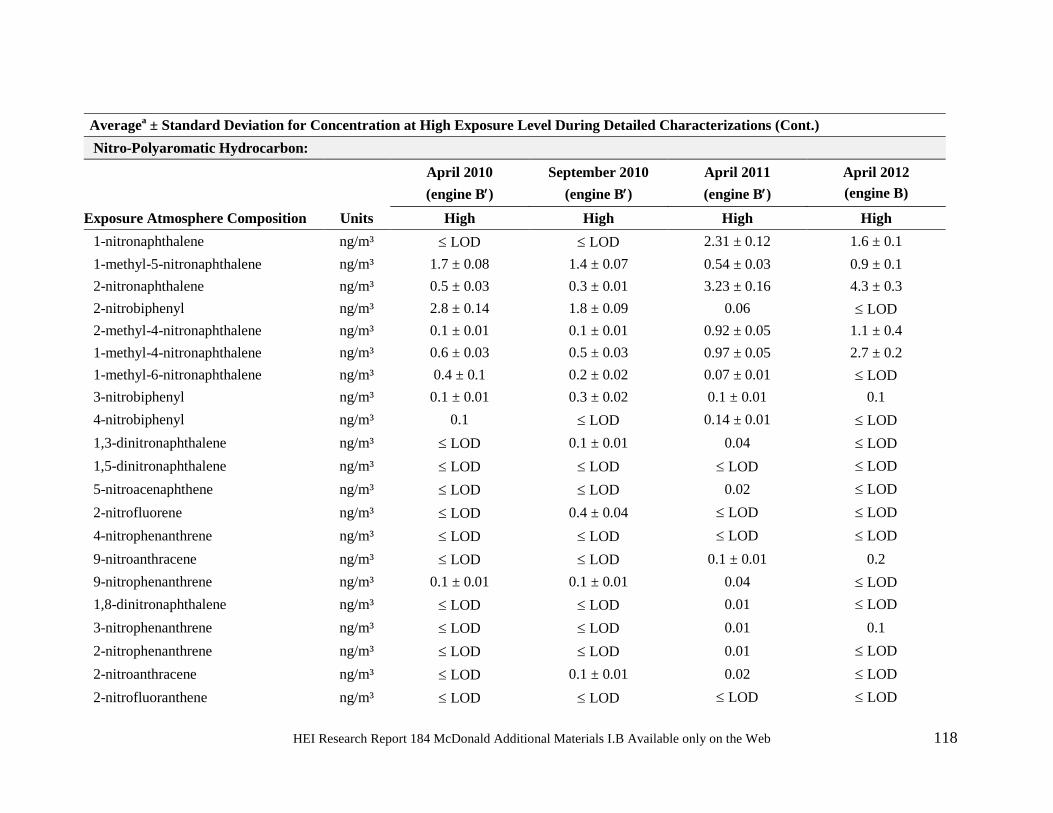
Averagea ± Standard Deviation for Concentration at High Exposure Level During Detailed Characterizations (Cont.) Nitro-Polyaromatic Hydrocarbon:
April 2010 (engine B′)
September 2010 (engine B′)
April 2011 (engine B′)
April 2012 (engine B)
Exposure Atmosphere Composition Units High High High High 1-nitronaphthalene ng/m³ ≤ LOD ≤ LOD 2.31 ± 0.12 1.6 ± 0.1 1-methyl-5-nitronaphthalene ng/m³ 1.7 ± 0.08 1.4 ± 0.07 0.54 ± 0.03 0.9 ± 0.1 2-nitronaphthalene ng/m³ 0.5 ± 0.03 0.3 ± 0.01 3.23 ± 0.16 4.3 ± 0.3 2-nitrobiphenyl ng/m³ 2.8 ± 0.14 1.8 ± 0.09 0.06 ≤ LOD 2-methyl-4-nitronaphthalene ng/m³ 0.1 ± 0.01 0.1 ± 0.01 0.92 ± 0.05 1.1 ± 0.4 1-methyl-4-nitronaphthalene ng/m³ 0.6 ± 0.03 0.5 ± 0.03 0.97 ± 0.05 2.7 ± 0.2 1-methyl-6-nitronaphthalene ng/m³ 0.4 ± 0.1 0.2 ± 0.02 0.07 ± 0.01 ≤ LOD 3-nitrobiphenyl ng/m³ 0.1 ± 0.01 0.3 ± 0.02 0.1 ± 0.01 0.1 4-nitrobiphenyl ng/m³ 0.1 ≤ LOD 0.14 ± 0.01 ≤ LOD 1,3-dinitronaphthalene ng/m³ ≤ LOD 0.1 ± 0.01 0.04 ≤ LOD 1,5-dinitronaphthalene ng/m³ ≤ LOD ≤ LOD ≤ LOD ≤ LOD 5-nitroacenaphthene ng/m³ ≤ LOD ≤ LOD 0.02 ≤ LOD 2-nitrofluorene ng/m³ ≤ LOD 0.4 ± 0.04 ≤ LOD ≤ LOD 4-nitrophenanthrene ng/m³ ≤ LOD ≤ LOD ≤ LOD ≤ LOD 9-nitroanthracene ng/m³ ≤ LOD ≤ LOD 0.1 ± 0.01 0.2 9-nitrophenanthrene ng/m³ 0.1 ± 0.01 0.1 ± 0.01 0.04 ≤ LOD 1,8-dinitronaphthalene ng/m³ ≤ LOD ≤ LOD 0.01 ≤ LOD 3-nitrophenanthrene ng/m³ ≤ LOD ≤ LOD 0.01 0.1 2-nitrophenanthrene ng/m³ ≤ LOD ≤ LOD 0.01 ≤ LOD 2-nitroanthracene ng/m³ ≤ LOD 0.1 ± 0.01 0.02 ≤ LOD 2-nitrofluoranthene ng/m³ ≤ LOD ≤ LOD ≤ LOD ≤ LOD
HEI Research Report 184 McDonald Additional Materials I.B Available only on the Web 119
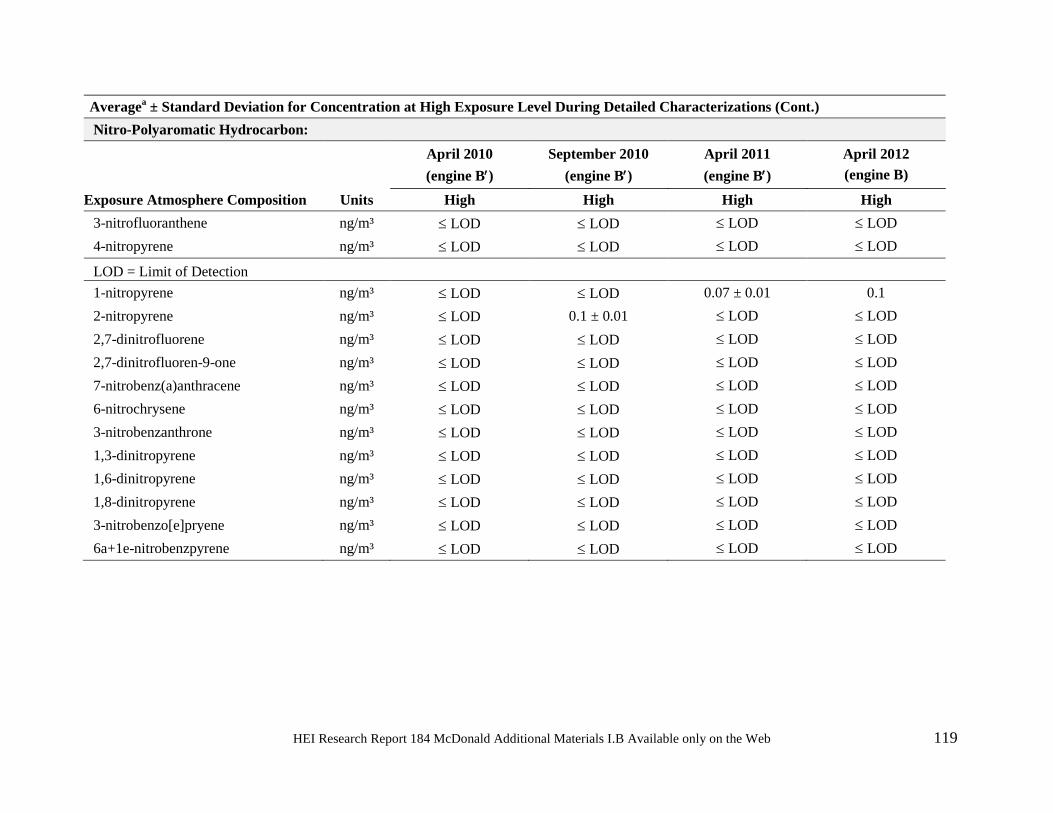
Averagea ± Standard Deviation for Concentration at High Exposure Level During Detailed Characterizations (Cont.) Nitro-Polyaromatic Hydrocarbon:
April 2010 (engine B′)
September 2010 (engine B′)
April 2011 (engine B′)
April 2012 (engine B)
Exposure Atmosphere Composition Units High High High High 3-nitrofluoranthene ng/m³ ≤ LOD ≤ LOD ≤ LOD ≤ LOD 4-nitropyrene ng/m³ ≤ LOD ≤ LOD ≤ LOD ≤ LOD LOD = Limit of Detection 1-nitropyrene ng/m³ ≤ LOD ≤ LOD 0.07 ± 0.01 0.1 2-nitropyrene ng/m³ ≤ LOD 0.1 ± 0.01 ≤ LOD ≤ LOD 2,7-dinitrofluorene ng/m³ ≤ LOD ≤ LOD ≤ LOD ≤ LOD 2,7-dinitrofluoren-9-one ng/m³ ≤ LOD ≤ LOD ≤ LOD ≤ LOD 7-nitrobenz(a)anthracene ng/m³ ≤ LOD ≤ LOD ≤ LOD ≤ LOD 6-nitrochrysene ng/m³ ≤ LOD ≤ LOD ≤ LOD ≤ LOD 3-nitrobenzanthrone ng/m³ ≤ LOD ≤ LOD ≤ LOD ≤ LOD 1,3-dinitropyrene ng/m³ ≤ LOD ≤ LOD ≤ LOD ≤ LOD 1,6-dinitropyrene ng/m³ ≤ LOD ≤ LOD ≤ LOD ≤ LOD 1,8-dinitropyrene ng/m³ ≤ LOD ≤ LOD ≤ LOD ≤ LOD 3-nitrobenzo[e]pryene ng/m³ ≤ LOD ≤ LOD ≤ LOD ≤ LOD 6a+1e-nitrobenzpyrene ng/m³ ≤ LOD ≤ LOD ≤ LOD ≤ LOD
HEI Research Report 184 McDonald Additional Materials I.B Available only on the Web 120
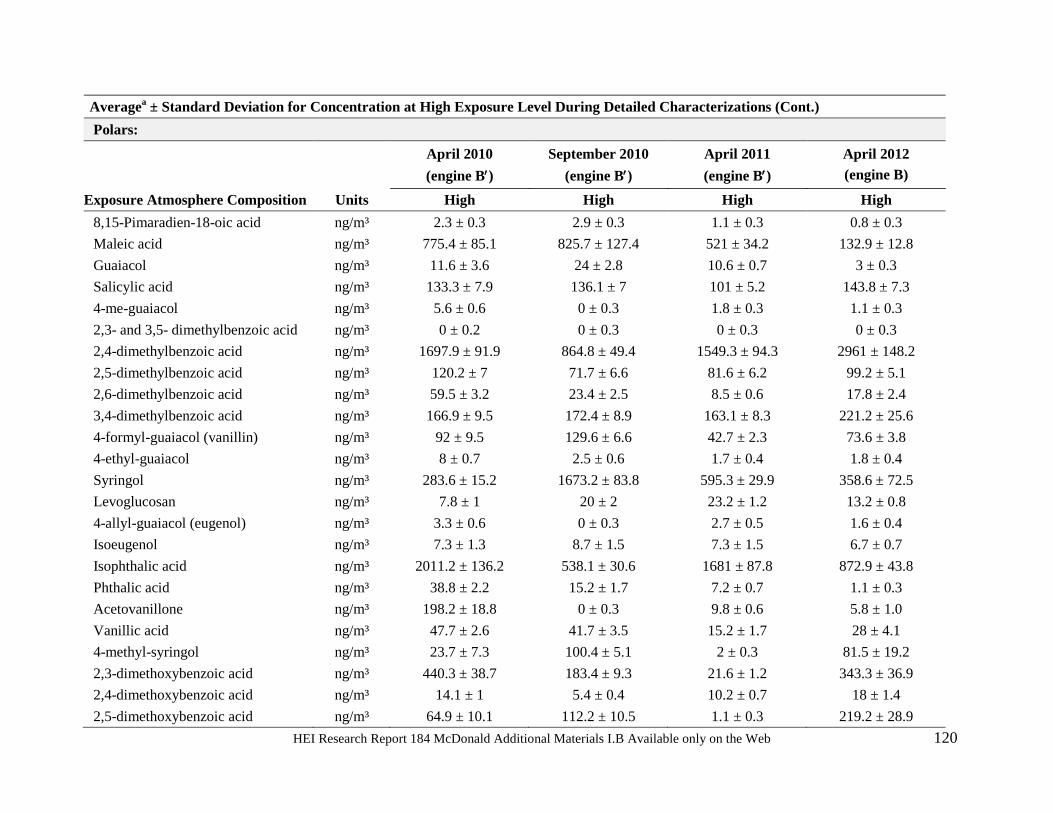
Averagea ± Standard Deviation for Concentration at High Exposure Level During Detailed Characterizations (Cont.) Polars:
April 2010 (engine B′)
September 2010 (engine B′)
April 2011 (engine B′)
April 2012 (engine B)
Exposure Atmosphere Composition Units High High High High 8,15-Pimaradien-18-oic acid ng/m³ 2.3 ± 0.3 2.9 ± 0.3 1.1 ± 0.3 0.8 ± 0.3 Maleic acid ng/m³ 775.4 ± 85.1 825.7 ± 127.4 521 ± 34.2 132.9 ± 12.8 Guaiacol ng/m³ 11.6 ± 3.6 24 ± 2.8 10.6 ± 0.7 3 ± 0.3 Salicylic acid ng/m³ 133.3 ± 7.9 136.1 ± 7 101 ± 5.2 143.8 ± 7.3 4-me-guaiacol ng/m³ 5.6 ± 0.6 0 ± 0.3 1.8 ± 0.3 1.1 ± 0.3 2,3- and 3,5- dimethylbenzoic acid ng/m³ 0 ± 0.2 0 ± 0.3 0 ± 0.3 0 ± 0.3 2,4-dimethylbenzoic acid ng/m³ 1697.9 ± 91.9 864.8 ± 49.4 1549.3 ± 94.3 2961 ± 148.2 2,5-dimethylbenzoic acid ng/m³ 120.2 ± 7 71.7 ± 6.6 81.6 ± 6.2 99.2 ± 5.1 2,6-dimethylbenzoic acid ng/m³ 59.5 ± 3.2 23.4 ± 2.5 8.5 ± 0.6 17.8 ± 2.4 3,4-dimethylbenzoic acid ng/m³ 166.9 ± 9.5 172.4 ± 8.9 163.1 ± 8.3 221.2 ± 25.6 4-formyl-guaiacol (vanillin) ng/m³ 92 ± 9.5 129.6 ± 6.6 42.7 ± 2.3 73.6 ± 3.8 4-ethyl-guaiacol ng/m³ 8 ± 0.7 2.5 ± 0.6 1.7 ± 0.4 1.8 ± 0.4 Syringol ng/m³ 283.6 ± 15.2 1673.2 ± 83.8 595.3 ± 29.9 358.6 ± 72.5 Levoglucosan ng/m³ 7.8 ± 1 20 ± 2 23.2 ± 1.2 13.2 ± 0.8 4-allyl-guaiacol (eugenol) ng/m³ 3.3 ± 0.6 0 ± 0.3 2.7 ± 0.5 1.6 ± 0.4 Isoeugenol ng/m³ 7.3 ± 1.3 8.7 ± 1.5 7.3 ± 1.5 6.7 ± 0.7 Isophthalic acid ng/m³ 2011.2 ± 136.2 538.1 ± 30.6 1681 ± 87.8 872.9 ± 43.8 Phthalic acid ng/m³ 38.8 ± 2.2 15.2 ± 1.7 7.2 ± 0.7 1.1 ± 0.3 Acetovanillone ng/m³ 198.2 ± 18.8 0 ± 0.3 9.8 ± 0.6 5.8 ± 1.0 Vanillic acid ng/m³ 47.7 ± 2.6 41.7 ± 3.5 15.2 ± 1.7 28 ± 4.1 4-methyl-syringol ng/m³ 23.7 ± 7.3 100.4 ± 5.1 2 ± 0.3 81.5 ± 19.2 2,3-dimethoxybenzoic acid ng/m³ 440.3 ± 38.7 183.4 ± 9.3 21.6 ± 1.2 343.3 ± 36.9 2,4-dimethoxybenzoic acid ng/m³ 14.1 ± 1 5.4 ± 0.4 10.2 ± 0.7 18 ± 1.4 2,5-dimethoxybenzoic acid ng/m³ 64.9 ± 10.1 112.2 ± 10.5 1.1 ± 0.3 219.2 ± 28.9
HEI Research Report 184 McDonald Additional Materials I.B Available only on the Web 121
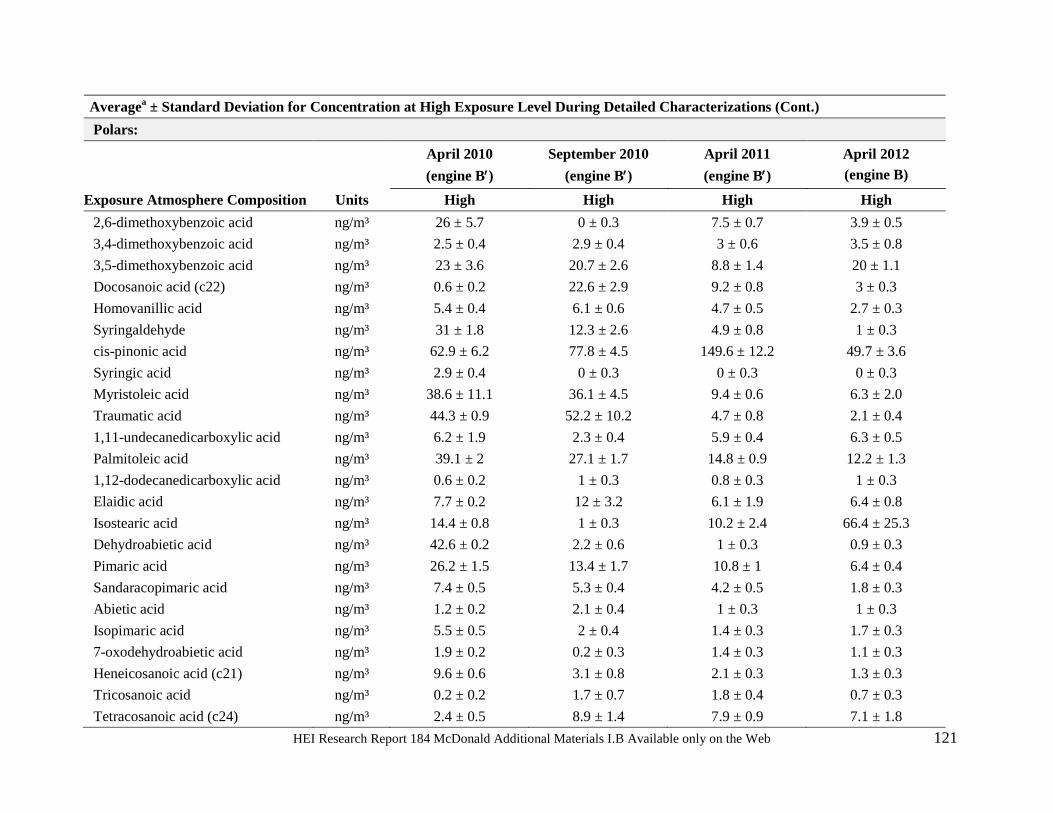
Averagea ± Standard Deviation for Concentration at High Exposure Level During Detailed Characterizations (Cont.) Polars:
April 2010 (engine B′)
September 2010 (engine B′)
April 2011 (engine B′)
April 2012 (engine B)
Exposure Atmosphere Composition Units High High High High 2,6-dimethoxybenzoic acid ng/m³ 26 ± 5.7 0 ± 0.3 7.5 ± 0.7 3.9 ± 0.5 3,4-dimethoxybenzoic acid ng/m³ 2.5 ± 0.4 2.9 ± 0.4 3 ± 0.6 3.5 ± 0.8 3,5-dimethoxybenzoic acid ng/m³ 23 ± 3.6 20.7 ± 2.6 8.8 ± 1.4 20 ± 1.1 Docosanoic acid (c22) ng/m³ 0.6 ± 0.2 22.6 ± 2.9 9.2 ± 0.8 3 ± 0.3 Homovanillic acid ng/m³ 5.4 ± 0.4 6.1 ± 0.6 4.7 ± 0.5 2.7 ± 0.3 Syringaldehyde ng/m³ 31 ± 1.8 12.3 ± 2.6 4.9 ± 0.8 1 ± 0.3 cis-pinonic acid ng/m³ 62.9 ± 6.2 77.8 ± 4.5 149.6 ± 12.2 49.7 ± 3.6 Syringic acid ng/m³ 2.9 ± 0.4 0 ± 0.3 0 ± 0.3 0 ± 0.3 Myristoleic acid ng/m³ 38.6 ± 11.1 36.1 ± 4.5 9.4 ± 0.6 6.3 ± 2.0 Traumatic acid ng/m³ 44.3 ± 0.9 52.2 ± 10.2 4.7 ± 0.8 2.1 ± 0.4 1,11-undecanedicarboxylic acid ng/m³ 6.2 ± 1.9 2.3 ± 0.4 5.9 ± 0.4 6.3 ± 0.5 Palmitoleic acid ng/m³ 39.1 ± 2 27.1 ± 1.7 14.8 ± 0.9 12.2 ± 1.3 1,12-dodecanedicarboxylic acid ng/m³ 0.6 ± 0.2 1 ± 0.3 0.8 ± 0.3 1 ± 0.3 Elaidic acid ng/m³ 7.7 ± 0.2 12 ± 3.2 6.1 ± 1.9 6.4 ± 0.8 Isostearic acid ng/m³ 14.4 ± 0.8 1 ± 0.3 10.2 ± 2.4 66.4 ± 25.3 Dehydroabietic acid ng/m³ 42.6 ± 0.2 2.2 ± 0.6 1 ± 0.3 0.9 ± 0.3 Pimaric acid ng/m³ 26.2 ± 1.5 13.4 ± 1.7 10.8 ± 1 6.4 ± 0.4 Sandaracopimaric acid ng/m³ 7.4 ± 0.5 5.3 ± 0.4 4.2 ± 0.5 1.8 ± 0.3 Abietic acid ng/m³ 1.2 ± 0.2 2.1 ± 0.4 1 ± 0.3 1 ± 0.3 Isopimaric acid ng/m³ 5.5 ± 0.5 2 ± 0.4 1.4 ± 0.3 1.7 ± 0.3 7-oxodehydroabietic acid ng/m³ 1.9 ± 0.2 0.2 ± 0.3 1.4 ± 0.3 1.1 ± 0.3 Heneicosanoic acid (c21) ng/m³ 9.6 ± 0.6 3.1 ± 0.8 2.1 ± 0.3 1.3 ± 0.3 Tricosanoic acid ng/m³ 0.2 ± 0.2 1.7 ± 0.7 1.8 ± 0.4 0.7 ± 0.3 Tetracosanoic acid (c24) ng/m³ 2.4 ± 0.5 8.9 ± 1.4 7.9 ± 0.9 7.1 ± 1.8
HEI Research Report 184 McDonald Additional Materials I.B Available only on the Web 122
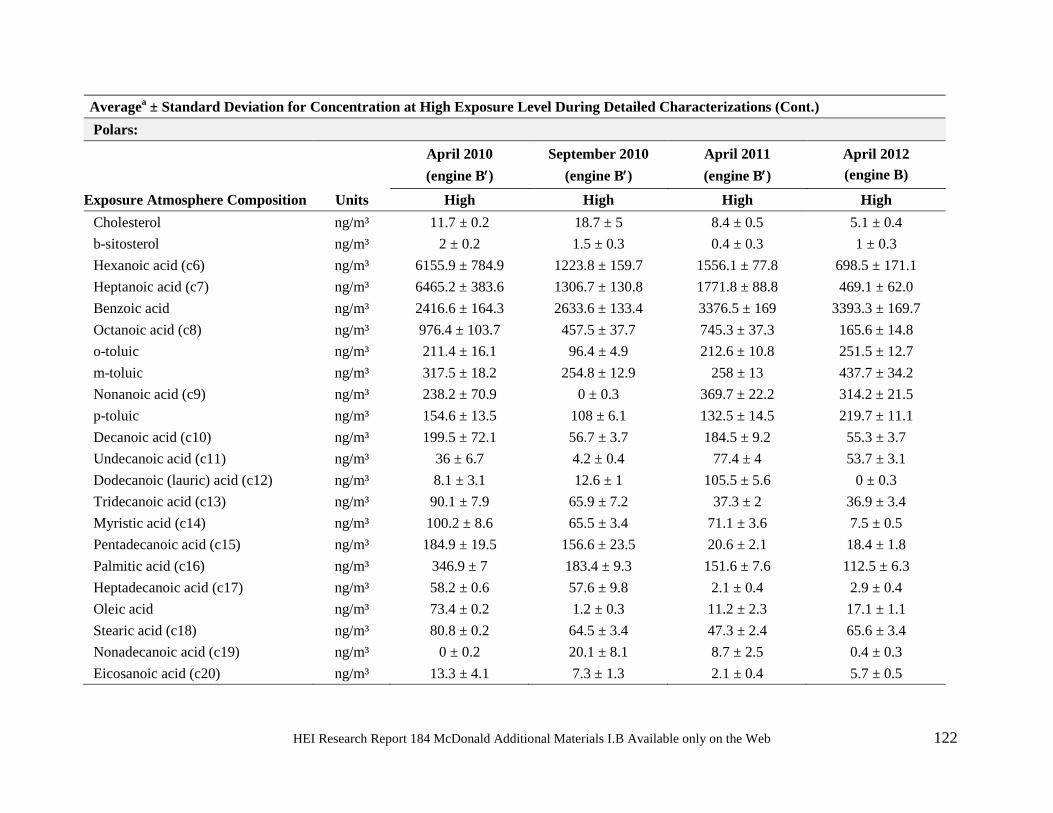
Averagea ± Standard Deviation for Concentration at High Exposure Level During Detailed Characterizations (Cont.) Polars:
April 2010 (engine B′)
September 2010 (engine B′)
April 2011 (engine B′)
April 2012 (engine B)
Exposure Atmosphere Composition Units High High High High Cholesterol ng/m³ 11.7 ± 0.2 18.7 ± 5 8.4 ± 0.5 5.1 ± 0.4 b-sitosterol ng/m³ 2 ± 0.2 1.5 ± 0.3 0.4 ± 0.3 1 ± 0.3 Hexanoic acid (c6) ng/m³ 6155.9 ± 784.9 1223.8 ± 159.7 1556.1 ± 77.8 698.5 ± 171.1 Heptanoic acid (c7) ng/m³ 6465.2 ± 383.6 1306.7 ± 130.8 1771.8 ± 88.8 469.1 ± 62.0 Benzoic acid ng/m³ 2416.6 ± 164.3 2633.6 ± 133.4 3376.5 ± 169 3393.3 ± 169.7 Octanoic acid (c8) ng/m³ 976.4 ± 103.7 457.5 ± 37.7 745.3 ± 37.3 165.6 ± 14.8 o-toluic ng/m³ 211.4 ± 16.1 96.4 ± 4.9 212.6 ± 10.8 251.5 ± 12.7 m-toluic ng/m³ 317.5 ± 18.2 254.8 ± 12.9 258 ± 13 437.7 ± 34.2 Nonanoic acid (c9) ng/m³ 238.2 ± 70.9 0 ± 0.3 369.7 ± 22.2 314.2 ± 21.5 p-toluic ng/m³ 154.6 ± 13.5 108 ± 6.1 132.5 ± 14.5 219.7 ± 11.1 Decanoic acid (c10) ng/m³ 199.5 ± 72.1 56.7 ± 3.7 184.5 ± 9.2 55.3 ± 3.7 Undecanoic acid (c11) ng/m³ 36 ± 6.7 4.2 ± 0.4 77.4 ± 4 53.7 ± 3.1 Dodecanoic (lauric) acid (c12) ng/m³ 8.1 ± 3.1 12.6 ± 1 105.5 ± 5.6 0 ± 0.3 Tridecanoic acid (c13) ng/m³ 90.1 ± 7.9 65.9 ± 7.2 37.3 ± 2 36.9 ± 3.4 Myristic acid (c14) ng/m³ 100.2 ± 8.6 65.5 ± 3.4 71.1 ± 3.6 7.5 ± 0.5 Pentadecanoic acid (c15) ng/m³ 184.9 ± 19.5 156.6 ± 23.5 20.6 ± 2.1 18.4 ± 1.8 Palmitic acid (c16) ng/m³ 346.9 ± 7 183.4 ± 9.3 151.6 ± 7.6 112.5 ± 6.3 Heptadecanoic acid (c17) ng/m³ 58.2 ± 0.6 57.6 ± 9.8 2.1 ± 0.4 2.9 ± 0.4 Oleic acid ng/m³ 73.4 ± 0.2 1.2 ± 0.3 11.2 ± 2.3 17.1 ± 1.1 Stearic acid (c18) ng/m³ 80.8 ± 0.2 64.5 ± 3.4 47.3 ± 2.4 65.6 ± 3.4 Nonadecanoic acid (c19) ng/m³ 0 ± 0.2 20.1 ± 8.1 8.7 ± 2.5 0.4 ± 0.3 Eicosanoic acid (c20) ng/m³ 13.3 ± 4.1 7.3 ± 1.3 2.1 ± 0.4 5.7 ± 0.5
HEI Research Report 184 McDonald Additional Materials I.B Available only on the Web 123
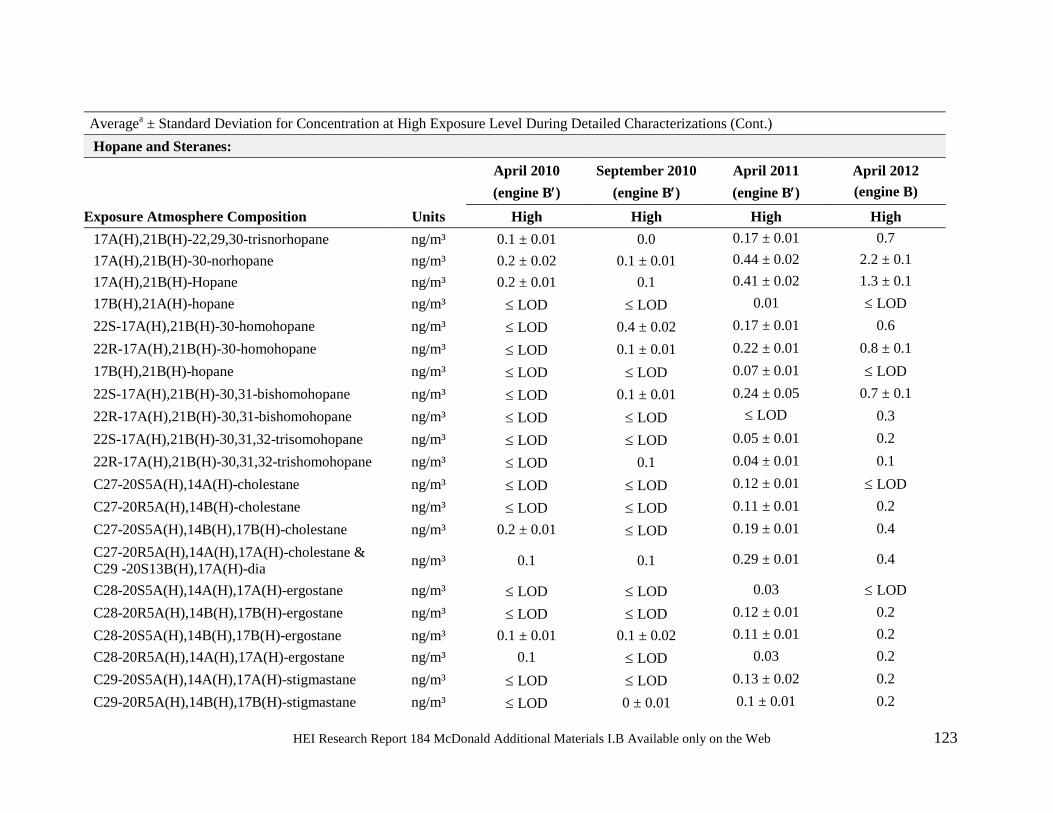
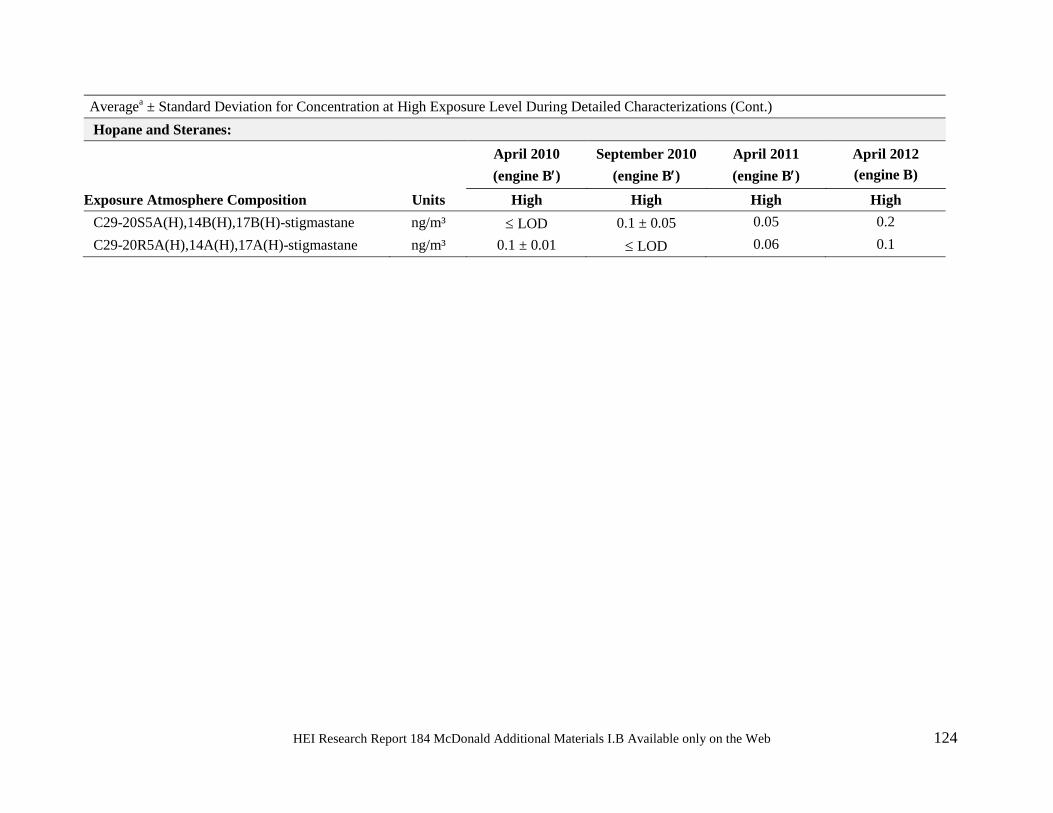
Averagea ± Standard Deviation for Concentration at High Exposure Level During Detailed Characterizations (Cont.) Hopane and Steranes:
April 2010 (engine B′)
September 2010 (engine B′)
April 2011 (engine B′)
April 2012 (engine B)
Exposure Atmosphere Composition Units High High High High 17A(H),21B(H)-22,29,30-trisnorhopane ng/m³ 0.1 ± 0.01 0.0 0.17 ± 0.01 0.7 17A(H),21B(H)-30-norhopane ng/m³ 0.2 ± 0.02 0.1 ± 0.01 0.44 ± 0.02 2.2 ± 0.1 17A(H),21B(H)-Hopane ng/m³ 0.2 ± 0.01 0.1 0.41 ± 0.02 1.3 ± 0.1 17B(H),21A(H)-hopane ng/m³ ≤ LOD ≤ LOD 0.01 ≤ LOD 22S-17A(H),21B(H)-30-homohopane ng/m³ ≤ LOD 0.4 ± 0.02 0.17 ± 0.01 0.6 22R-17A(H),21B(H)-30-homohopane ng/m³ ≤ LOD 0.1 ± 0.01 0.22 ± 0.01 0.8 ± 0.1 17B(H),21B(H)-hopane ng/m³ ≤ LOD ≤ LOD 0.07 ± 0.01 ≤ LOD 22S-17A(H),21B(H)-30,31-bishomohopane ng/m³ ≤ LOD 0.1 ± 0.01 0.24 ± 0.05 0.7 ± 0.1 22R-17A(H),21B(H)-30,31-bishomohopane ng/m³ ≤ LOD ≤ LOD ≤ LOD 0.3 22S-17A(H),21B(H)-30,31,32-trisomohopane ng/m³ ≤ LOD ≤ LOD 0.05 ± 0.01 0.2 22R-17A(H),21B(H)-30,31,32-trishomohopane ng/m³ ≤ LOD 0.1 0.04 ± 0.01 0.1 C27-20S5A(H),14A(H)-cholestane ng/m³ ≤ LOD ≤ LOD 0.12 ± 0.01 ≤ LOD C27-20R5A(H),14B(H)-cholestane ng/m³ ≤ LOD ≤ LOD 0.11 ± 0.01 0.2 C27-20S5A(H),14B(H),17B(H)-cholestane ng/m³ 0.2 ± 0.01 ≤ LOD 0.19 ± 0.01 0.4 C27-20R5A(H),14A(H),17A(H)-cholestane & C29 -20S13B(H),17A(H)-dia ng/m³ 0.1 0.1 0.29 ± 0.01 0.4
C28-20S5A(H),14A(H),17A(H)-ergostane ng/m³ ≤ LOD ≤ LOD 0.03 ≤ LOD C28-20R5A(H),14B(H),17B(H)-ergostane ng/m³ ≤ LOD ≤ LOD 0.12 ± 0.01 0.2 C28-20S5A(H),14B(H),17B(H)-ergostane ng/m³ 0.1 ± 0.01 0.1 ± 0.02 0.11 ± 0.01 0.2 C28-20R5A(H),14A(H),17A(H)-ergostane ng/m³ 0.1 ≤ LOD 0.03 0.2 C29-20S5A(H),14A(H),17A(H)-stigmastane ng/m³ ≤ LOD ≤ LOD 0.13 ± 0.02 0.2 C29-20R5A(H),14B(H),17B(H)-stigmastane ng/m³ ≤ LOD 0 ± 0.01 0.1 ± 0.01 0.2
HEI Research Report 184 McDonald Additional Materials I.B Available only on the Web 124
Averagea ± Standard Deviation for Concentration at High Exposure Level During Detailed Characterizations (Cont.) Hopane and Steranes:
April 2010 (engine B′)
September 2010 (engine B′)
April 2011 (engine B′)
April 2012 (engine B)
Exposure Atmosphere Composition Units High High High High C29-20S5A(H),14B(H),17B(H)-stigmastane ng/m³ ≤ LOD 0.1 ± 0.05 0.05 0.2 C29-20R5A(H),14A(H),17A(H)-stigmastane ng/m³ 0.1 ± 0.01 ≤ LOD 0.06 0.1
HEI Research Report 184 McDonald Additional Materials I.B Available only on the Web 125
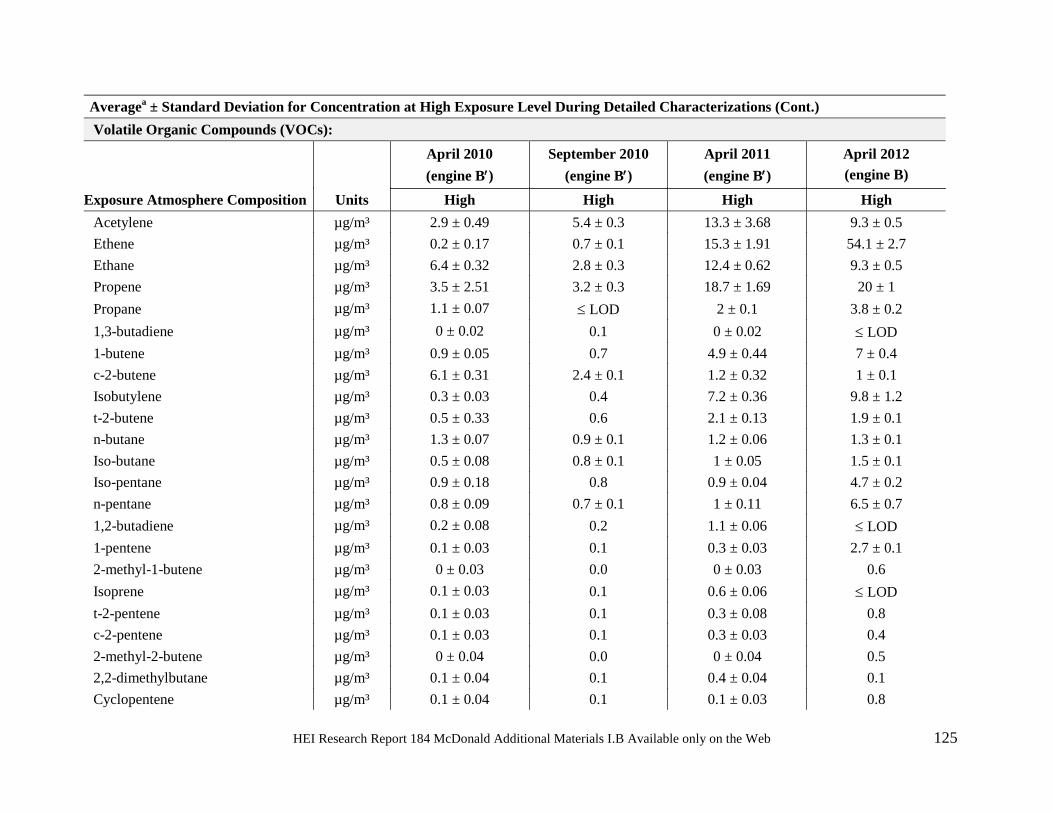
Averagea ± Standard Deviation for Concentration at High Exposure Level During Detailed Characterizations (Cont.) Volatile Organic Compounds (VOCs):
April 2010 (engine B′)
September 2010 (engine B′)
April 2011 (engine B′)
April 2012 (engine B)
Exposure Atmosphere Composition Units High High High High Acetylene µg/m³ 2.9 ± 0.49 5.4 ± 0.3 13.3 ± 3.68 9.3 ± 0.5 Ethene µg/m³ 0.2 ± 0.17 0.7 ± 0.1 15.3 ± 1.91 54.1 ± 2.7 Ethane µg/m³ 6.4 ± 0.32 2.8 ± 0.3 12.4 ± 0.62 9.3 ± 0.5 Propene µg/m³ 3.5 ± 2.51 3.2 ± 0.3 18.7 ± 1.69 20 ± 1 Propane µg/m³ 1.1 ± 0.07 ≤ LOD 2 ± 0.1 3.8 ± 0.2 1,3-butadiene µg/m³ 0 ± 0.02 0.1 0 ± 0.02 ≤ LOD 1-butene µg/m³ 0.9 ± 0.05 0.7 4.9 ± 0.44 7 ± 0.4 c-2-butene µg/m³ 6.1 ± 0.31 2.4 ± 0.1 1.2 ± 0.32 1 ± 0.1 Isobutylene µg/m³ 0.3 ± 0.03 0.4 7.2 ± 0.36 9.8 ± 1.2 t-2-butene µg/m³ 0.5 ± 0.33 0.6 2.1 ± 0.13 1.9 ± 0.1 n-butane µg/m³ 1.3 ± 0.07 0.9 ± 0.1 1.2 ± 0.06 1.3 ± 0.1 Iso-butane µg/m³ 0.5 ± 0.08 0.8 ± 0.1 1 ± 0.05 1.5 ± 0.1 Iso-pentane µg/m³ 0.9 ± 0.18 0.8 0.9 ± 0.04 4.7 ± 0.2 n-pentane µg/m³ 0.8 ± 0.09 0.7 ± 0.1 1 ± 0.11 6.5 ± 0.7 1,2-butadiene µg/m³ 0.2 ± 0.08 0.2 1.1 ± 0.06 ≤ LOD 1-pentene µg/m³ 0.1 ± 0.03 0.1 0.3 ± 0.03 2.7 ± 0.1 2-methyl-1-butene µg/m³ 0 ± 0.03 0.0 0 ± 0.03 0.6 Isoprene µg/m³ 0.1 ± 0.03 0.1 0.6 ± 0.06 ≤ LOD t-2-pentene µg/m³ 0.1 ± 0.03 0.1 0.3 ± 0.08 0.8 c-2-pentene µg/m³ 0.1 ± 0.03 0.1 0.3 ± 0.03 0.4 2-methyl-2-butene µg/m³ 0 ± 0.04 0.0 0 ± 0.04 0.5 2,2-dimethylbutane µg/m³ 0.1 ± 0.04 0.1 0.4 ± 0.04 0.1 Cyclopentene µg/m³ 0.1 ± 0.04 0.1 0.1 ± 0.03 0.8
HEI Research Report 184 McDonald Additional Materials I.B Available only on the Web 126
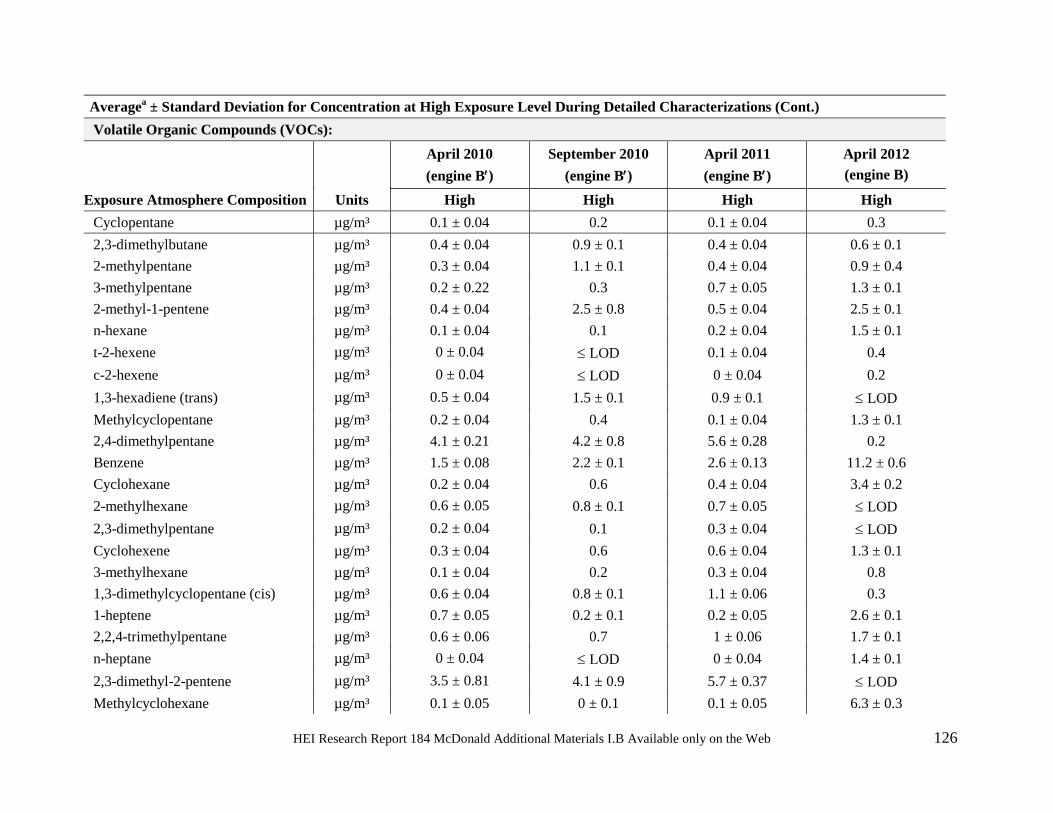
Averagea ± Standard Deviation for Concentration at High Exposure Level During Detailed Characterizations (Cont.) Volatile Organic Compounds (VOCs):
April 2010 (engine B′)
September 2010 (engine B′)
April 2011 (engine B′)
April 2012 (engine B)
Exposure Atmosphere Composition Units High High High High Cyclopentane µg/m³ 0.1 ± 0.04 0.2 0.1 ± 0.04 0.3 2,3-dimethylbutane µg/m³ 0.4 ± 0.04 0.9 ± 0.1 0.4 ± 0.04 0.6 ± 0.1 2-methylpentane µg/m³ 0.3 ± 0.04 1.1 ± 0.1 0.4 ± 0.04 0.9 ± 0.4 3-methylpentane µg/m³ 0.2 ± 0.22 0.3 0.7 ± 0.05 1.3 ± 0.1 2-methyl-1-pentene µg/m³ 0.4 ± 0.04 2.5 ± 0.8 0.5 ± 0.04 2.5 ± 0.1 n-hexane µg/m³ 0.1 ± 0.04 0.1 0.2 ± 0.04 1.5 ± 0.1 t-2-hexene µg/m³ 0 ± 0.04 ≤ LOD 0.1 ± 0.04 0.4 c-2-hexene µg/m³ 0 ± 0.04 ≤ LOD 0 ± 0.04 0.2 1,3-hexadiene (trans) µg/m³ 0.5 ± 0.04 1.5 ± 0.1 0.9 ± 0.1 ≤ LOD Methylcyclopentane µg/m³ 0.2 ± 0.04 0.4 0.1 ± 0.04 1.3 ± 0.1 2,4-dimethylpentane µg/m³ 4.1 ± 0.21 4.2 ± 0.8 5.6 ± 0.28 0.2 Benzene µg/m³ 1.5 ± 0.08 2.2 ± 0.1 2.6 ± 0.13 11.2 ± 0.6 Cyclohexane µg/m³ 0.2 ± 0.04 0.6 0.4 ± 0.04 3.4 ± 0.2 2-methylhexane µg/m³ 0.6 ± 0.05 0.8 ± 0.1 0.7 ± 0.05 ≤ LOD 2,3-dimethylpentane µg/m³ 0.2 ± 0.04 0.1 0.3 ± 0.04 ≤ LOD Cyclohexene µg/m³ 0.3 ± 0.04 0.6 0.6 ± 0.04 1.3 ± 0.1 3-methylhexane µg/m³ 0.1 ± 0.04 0.2 0.3 ± 0.04 0.8 1,3-dimethylcyclopentane (cis) µg/m³ 0.6 ± 0.04 0.8 ± 0.1 1.1 ± 0.06 0.3 1-heptene µg/m³ 0.7 ± 0.05 0.2 ± 0.1 0.2 ± 0.05 2.6 ± 0.1 2,2,4-trimethylpentane µg/m³ 0.6 ± 0.06 0.7 1 ± 0.06 1.7 ± 0.1 n-heptane µg/m³ 0 ± 0.04 ≤ LOD 0 ± 0.04 1.4 ± 0.1 2,3-dimethyl-2-pentene µg/m³ 3.5 ± 0.81 4.1 ± 0.9 5.7 ± 0.37 ≤ LOD Methylcyclohexane µg/m³ 0.1 ± 0.05 0 ± 0.1 0.1 ± 0.05 6.3 ± 0.3
HEI Research Report 184 McDonald Additional Materials I.B Available only on the Web 127
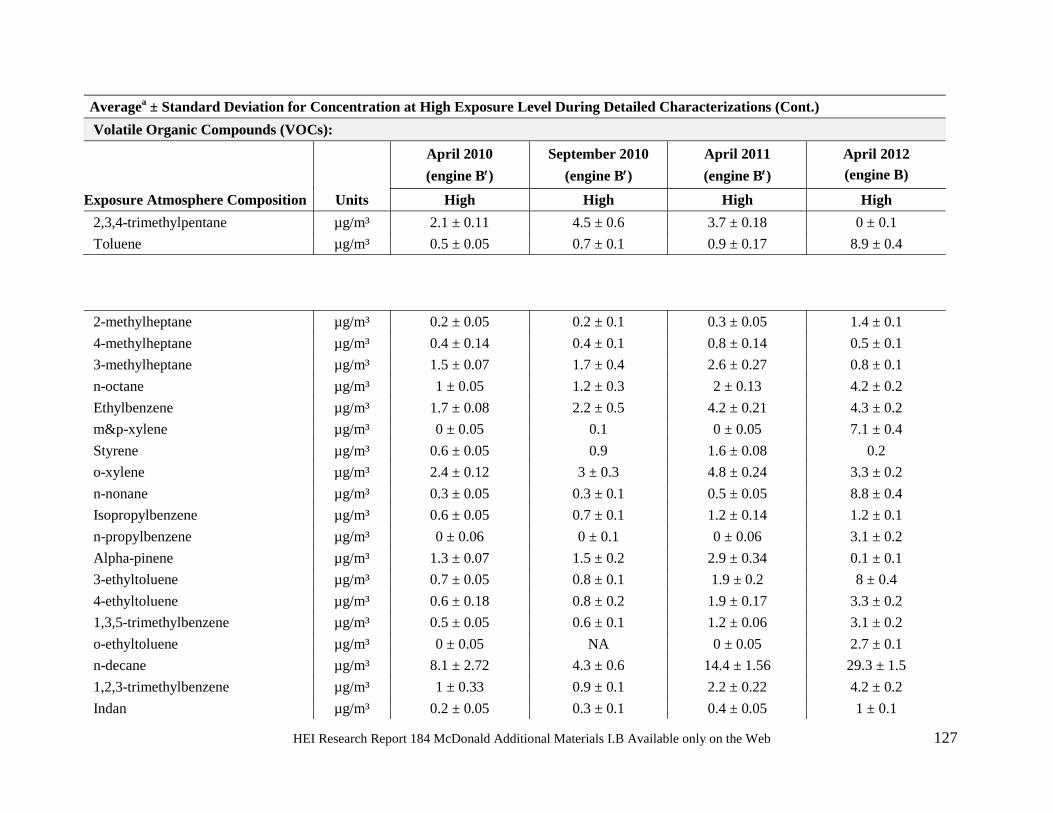
Averagea ± Standard Deviation for Concentration at High Exposure Level During Detailed Characterizations (Cont.) Volatile Organic Compounds (VOCs):
April 2010 (engine B′)
September 2010 (engine B′)
April 2011 (engine B′)
April 2012 (engine B)
Exposure Atmosphere Composition Units High High High High 2,3,4-trimethylpentane µg/m³ 2.1 ± 0.11 4.5 ± 0.6 3.7 ± 0.18 0 ± 0.1 Toluene µg/m³ 0.5 ± 0.05 0.7 ± 0.1 0.9 ± 0.17 8.9 ± 0.4
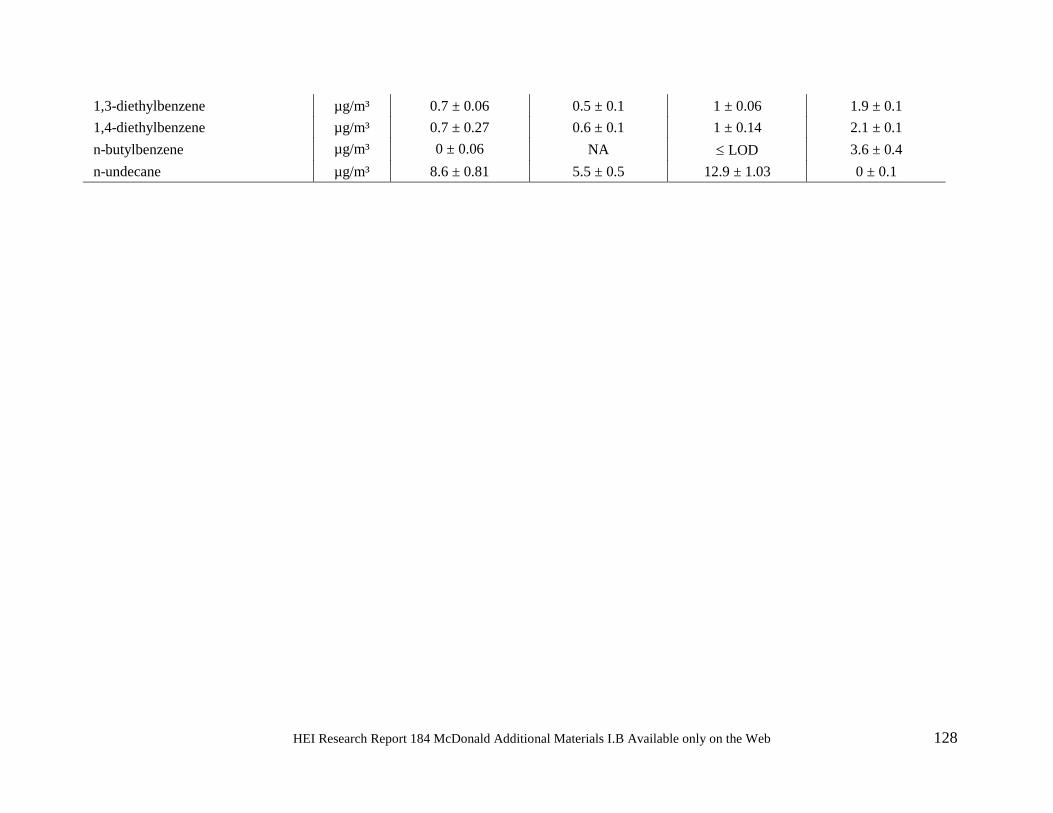
2-methylheptane µg/m³ 0.2 ± 0.05 0.2 ± 0.1 0.3 ± 0.05 1.4 ± 0.1 4-methylheptane µg/m³ 0.4 ± 0.14 0.4 ± 0.1 0.8 ± 0.14 0.5 ± 0.1 3-methylheptane µg/m³ 1.5 ± 0.07 1.7 ± 0.4 2.6 ± 0.27 0.8 ± 0.1 n-octane µg/m³ 1 ± 0.05 1.2 ± 0.3 2 ± 0.13 4.2 ± 0.2 Ethylbenzene µg/m³ 1.7 ± 0.08 2.2 ± 0.5 4.2 ± 0.21 4.3 ± 0.2 m&p-xylene µg/m³ 0 ± 0.05 0.1 0 ± 0.05 7.1 ± 0.4 Styrene µg/m³ 0.6 ± 0.05 0.9 1.6 ± 0.08 0.2 o-xylene µg/m³ 2.4 ± 0.12 3 ± 0.3 4.8 ± 0.24 3.3 ± 0.2 n-nonane µg/m³ 0.3 ± 0.05 0.3 ± 0.1 0.5 ± 0.05 8.8 ± 0.4 Isopropylbenzene µg/m³ 0.6 ± 0.05 0.7 ± 0.1 1.2 ± 0.14 1.2 ± 0.1 n-propylbenzene µg/m³ 0 ± 0.06 0 ± 0.1 0 ± 0.06 3.1 ± 0.2 Alpha-pinene µg/m³ 1.3 ± 0.07 1.5 ± 0.2 2.9 ± 0.34 0.1 ± 0.1 3-ethyltoluene µg/m³ 0.7 ± 0.05 0.8 ± 0.1 1.9 ± 0.2 8 ± 0.4 4-ethyltoluene µg/m³ 0.6 ± 0.18 0.8 ± 0.2 1.9 ± 0.17 3.3 ± 0.2 1,3,5-trimethylbenzene µg/m³ 0.5 ± 0.05 0.6 ± 0.1 1.2 ± 0.06 3.1 ± 0.2 o-ethyltoluene µg/m³ 0 ± 0.05 NA 0 ± 0.05 2.7 ± 0.1 n-decane µg/m³ 8.1 ± 2.72 4.3 ± 0.6 14.4 ± 1.56 29.3 ± 1.5 1,2,3-trimethylbenzene µg/m³ 1 ± 0.33 0.9 ± 0.1 2.2 ± 0.22 4.2 ± 0.2 Indan µg/m³ 0.2 ± 0.05 0.3 ± 0.1 0.4 ± 0.05 1 ± 0.1
HEI Research Report 184 McDonald Additional Materials I.B Available only on the Web 128
1,3-diethylbenzene µg/m³ 0.7 ± 0.06 0.5 ± 0.1 1 ± 0.06 1.9 ± 0.1 1,4-diethylbenzene µg/m³ 0.7 ± 0.27 0.6 ± 0.1 1 ± 0.14 2.1 ± 0.1 n-butylbenzene µg/m³ 0 ± 0.06 NA ≤ LOD 3.6 ± 0.4 n-undecane µg/m³ 8.6 ± 0.81 5.5 ± 0.5 12.9 ± 1.03 0 ± 0.1

ACES: Phase 3B: Characterization of Exposure Atmospheres
129
Appendix E.
April 2010 – Average ± Standard Deviation for Detailed Atmosphere Characterization
HEI Research Report 184 McDonald Additional Materials I.B Available only on the Web 130
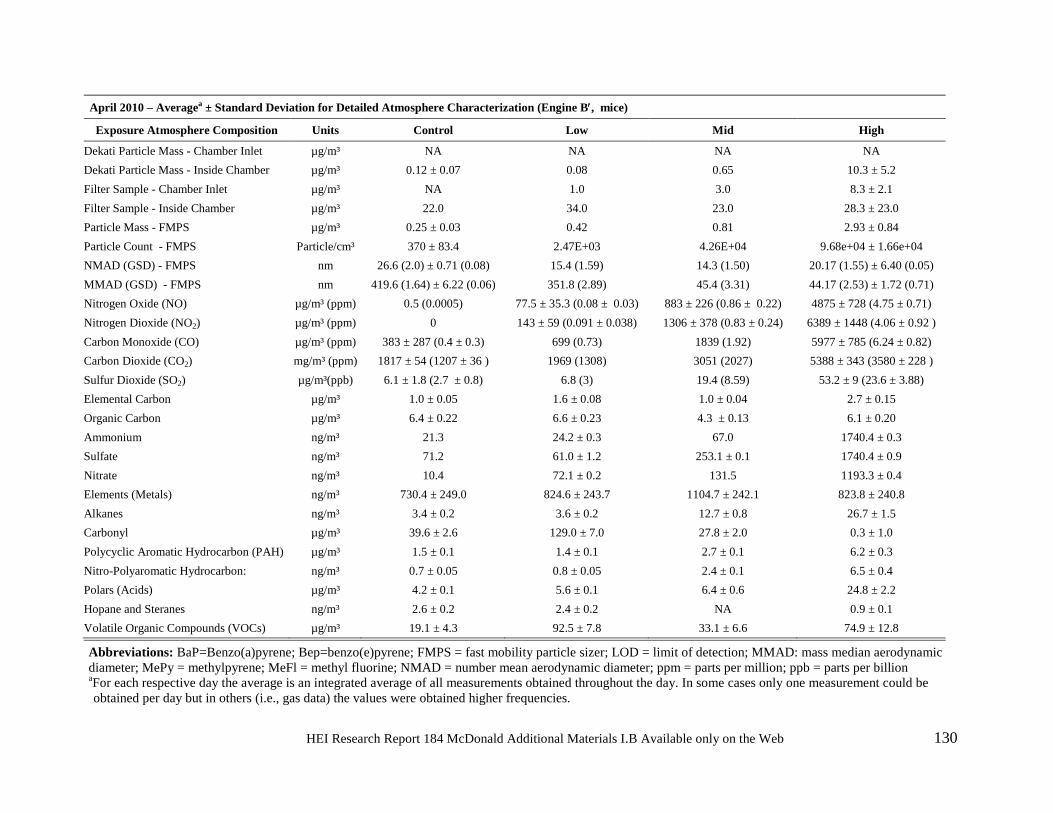
April 2010 – Averagea ± Standard Deviation for Detailed Atmosphere Characterization (Engine B′, mice)
Exposure Atmosphere Composition Units Control Low Mid High
Dekati Particle Mass - Chamber Inlet µg/m³ NA NA NA NA Dekati Particle Mass - Inside Chamber µg/m³ 0.12 ± 0.07 0.08 0.65 10.3 ± 5.2 Filter Sample - Chamber Inlet µg/m³ NA 1.0 3.0 8.3 ± 2.1 Filter Sample - Inside Chamber µg/m³ 22.0 34.0 23.0 28.3 ± 23.0 Particle Mass - FMPS µg/m³ 0.25 ± 0.03 0.42 0.81 2.93 ± 0.84 Particle Count - FMPS Particle/cm³ 370 ± 83.4 2.47E+03 4.26E+04 9.68e+04 ± 1.66e+04 NMAD (GSD) - FMPS nm 26.6 (2.0) ± 0.71 (0.08) 15.4 (1.59) 14.3 (1.50) 20.17 (1.55) ± 6.40 (0.05) MMAD (GSD) - FMPS nm 419.6 (1.64) ± 6.22 (0.06) 351.8 (2.89) 45.4 (3.31) 44.17 (2.53) ± 1.72 (0.71) Nitrogen Oxide (NO) µg/m³ (ppm) 0.5 (0.0005) 77.5 ± 35.3 (0.08 ± 0.03) 883 ± 226 (0.86 ± 0.22) 4875 ± 728 (4.75 ± 0.71) Nitrogen Dioxide (NO2) µg/m³ (ppm) 0 143 ± 59 (0.091 ± 0.038) 1306 ± 378 (0.83 ± 0.24) 6389 ± 1448 (4.06 ± 0.92 ) Carbon Monoxide (CO) µg/m³ (ppm) 383 ± 287 (0.4 ± 0.3) 699 (0.73) 1839 (1.92) 5977 ± 785 (6.24 ± 0.82) Carbon Dioxide (CO2) mg/m³ (ppm) 1817 ± 54 (1207 ± 36 ) 1969 (1308) 3051 (2027) 5388 ± 343 (3580 ± 228 ) Sulfur Dioxide (SO2) µg/m³(ppb) 6.1 ± 1.8 (2.7 ± 0.8) 6.8 (3) 19.4 (8.59) 53.2 ± 9 (23.6 ± 3.88) Elemental Carbon µg/m³ 1.0 ± 0.05 1.6 ± 0.08 1.0 ± 0.04 2.7 ± 0.15 Organic Carbon µg/m³ 6.4 ± 0.22 6.6 ± 0.23 4.3 ± 0.13 6.1 ± 0.20 Ammonium ng/m³ 21.3 24.2 ± 0.3 67.0 1740.4 ± 0.3 Sulfate ng/m³ 71.2 61.0 ± 1.2 253.1 ± 0.1 1740.4 ± 0.9 Nitrate ng/m³ 10.4 72.1 ± 0.2 131.5 1193.3 ± 0.4 Elements (Metals) ng/m³ 730.4 ± 249.0 824.6 ± 243.7 1104.7 ± 242.1 823.8 ± 240.8 Alkanes ng/m³ 3.4 ± 0.2 3.6 ± 0.2 12.7 ± 0.8 26.7 ± 1.5 Carbonyl µg/m³ 39.6 ± 2.6 129.0 ± 7.0 27.8 ± 2.0 0.3 ± 1.0 Polycyclic Aromatic Hydrocarbon (PAH) µg/m³ 1.5 ± 0.1 1.4 ± 0.1 2.7 ± 0.1 6.2 ± 0.3 Nitro-Polyaromatic Hydrocarbon: ng/m³ 0.7 ± 0.05 0.8 ± 0.05 2.4 ± 0.1 6.5 ± 0.4 Polars (Acids) µg/m³ 4.2 ± 0.1 5.6 ± 0.1 6.4 ± 0.6 24.8 ± 2.2 Hopane and Steranes ng/m³ 2.6 ± 0.2 2.4 ± 0.2 NA 0.9 ± 0.1 Volatile Organic Compounds (VOCs) µg/m³ 19.1 ± 4.3 92.5 ± 7.8 33.1 ± 6.6 74.9 ± 12.8
Abbreviations: BaP=Benzo(a)pyrene; Bep=benzo(e)pyrene; FMPS = fast mobility particle sizer; LOD = limit of detection; MMAD: mass median aerodynamic diameter; MePy = methylpyrene; MeFl = methyl fluorine; NMAD = number mean aerodynamic diameter; ppm = parts per million; ppb = parts per billion aFor each respective day the average is an integrated average of all measurements obtained throughout the day. In some cases only one measurement could be obtained per day but in others (i.e., gas data) the values were obtained higher frequencies.
HEI Research Report 184 McDonald Additional Materials I.B Available only on the Web 131
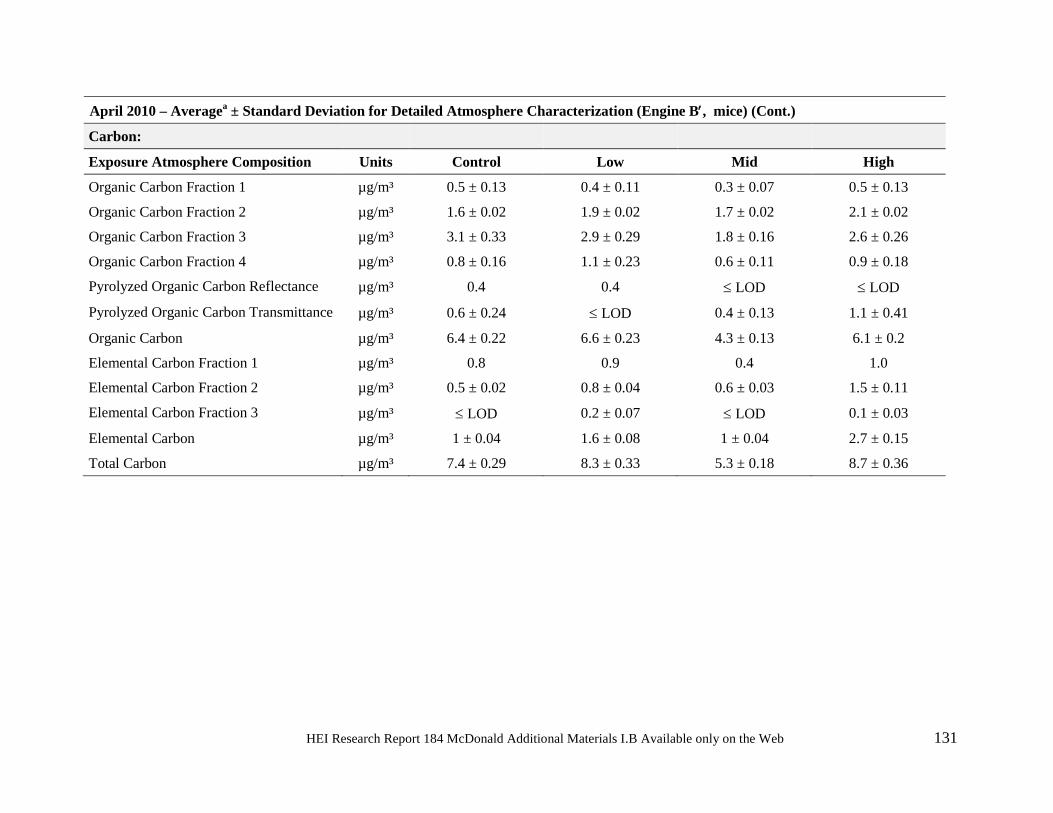
April 2010 – Averagea ± Standard Deviation for Detailed Atmosphere Characterization (Engine B′, mice) (Cont.)
Carbon: Exposure Atmosphere Composition Units Control Low Mid High
Organic Carbon Fraction 1 µg/m³ 0.5 ± 0.13 0.4 ± 0.11 0.3 ± 0.07 0.5 ± 0.13 Organic Carbon Fraction 2 µg/m³ 1.6 ± 0.02 1.9 ± 0.02 1.7 ± 0.02 2.1 ± 0.02 Organic Carbon Fraction 3 µg/m³ 3.1 ± 0.33 2.9 ± 0.29 1.8 ± 0.16 2.6 ± 0.26 Organic Carbon Fraction 4 µg/m³ 0.8 ± 0.16 1.1 ± 0.23 0.6 ± 0.11 0.9 ± 0.18 Pyrolyzed Organic Carbon Reflectance µg/m³ 0.4 0.4 ≤ LOD ≤ LOD Pyrolyzed Organic Carbon Transmittance µg/m³ 0.6 ± 0.24 ≤ LOD 0.4 ± 0.13 1.1 ± 0.41 Organic Carbon µg/m³ 6.4 ± 0.22 6.6 ± 0.23 4.3 ± 0.13 6.1 ± 0.2 Elemental Carbon Fraction 1 µg/m³ 0.8 0.9 0.4 1.0 Elemental Carbon Fraction 2 µg/m³ 0.5 ± 0.02 0.8 ± 0.04 0.6 ± 0.03 1.5 ± 0.11 Elemental Carbon Fraction 3 µg/m³ ≤ LOD 0.2 ± 0.07 ≤ LOD 0.1 ± 0.03 Elemental Carbon µg/m³ 1 ± 0.04 1.6 ± 0.08 1 ± 0.04 2.7 ± 0.15 Total Carbon µg/m³ 7.4 ± 0.29 8.3 ± 0.33 5.3 ± 0.18 8.7 ± 0.36
HEI Research Report 184 McDonald Additional Materials I.B Available only on the Web 132
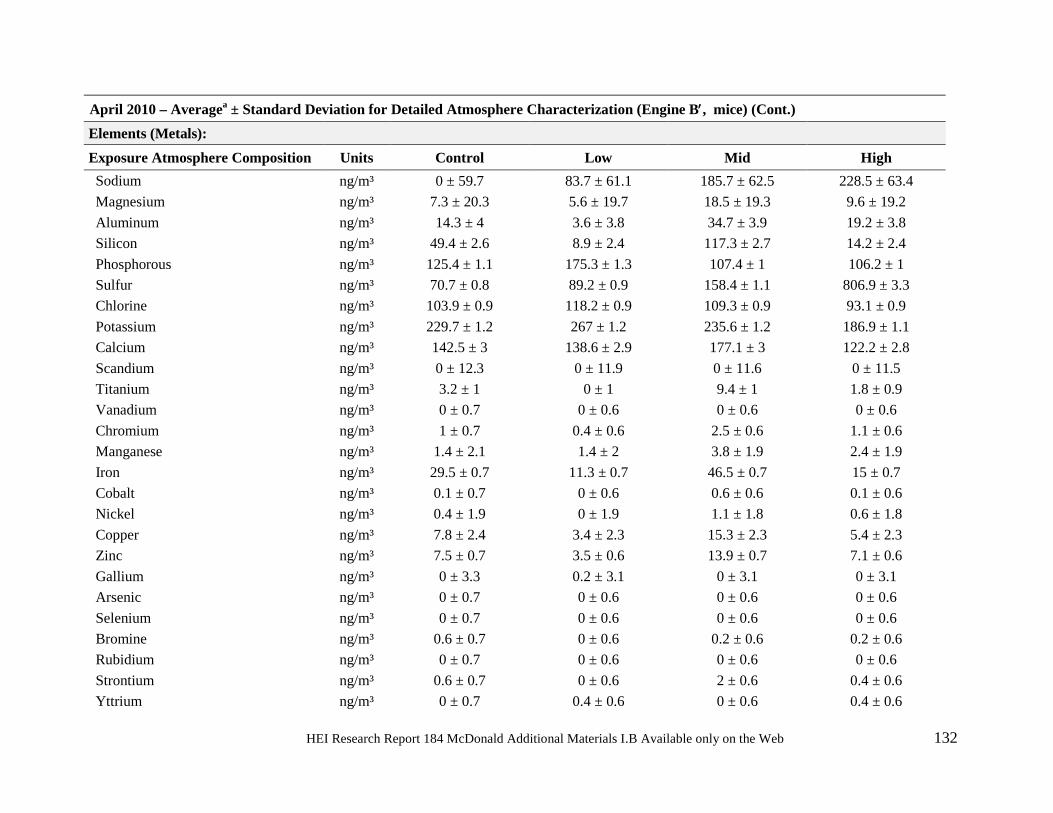
April 2010 – Averagea ± Standard Deviation for Detailed Atmosphere Characterization (Engine B′, mice) (Cont.) Elements (Metals): Exposure Atmosphere Composition Units Control Low Mid High Sodium ng/m³ 0 ± 59.7 83.7 ± 61.1 185.7 ± 62.5 228.5 ± 63.4 Magnesium ng/m³ 7.3 ± 20.3 5.6 ± 19.7 18.5 ± 19.3 9.6 ± 19.2 Aluminum ng/m³ 14.3 ± 4 3.6 ± 3.8 34.7 ± 3.9 19.2 ± 3.8 Silicon ng/m³ 49.4 ± 2.6 8.9 ± 2.4 117.3 ± 2.7 14.2 ± 2.4 Phosphorous ng/m³ 125.4 ± 1.1 175.3 ± 1.3 107.4 ± 1 106.2 ± 1 Sulfur ng/m³ 70.7 ± 0.8 89.2 ± 0.9 158.4 ± 1.1 806.9 ± 3.3 Chlorine ng/m³ 103.9 ± 0.9 118.2 ± 0.9 109.3 ± 0.9 93.1 ± 0.9 Potassium ng/m³ 229.7 ± 1.2 267 ± 1.2 235.6 ± 1.2 186.9 ± 1.1 Calcium ng/m³ 142.5 ± 3 138.6 ± 2.9 177.1 ± 3 122.2 ± 2.8 Scandium ng/m³ 0 ± 12.3 0 ± 11.9 0 ± 11.6 0 ± 11.5 Titanium ng/m³ 3.2 ± 1 0 ± 1 9.4 ± 1 1.8 ± 0.9 Vanadium ng/m³ 0 ± 0.7 0 ± 0.6 0 ± 0.6 0 ± 0.6 Chromium ng/m³ 1 ± 0.7 0.4 ± 0.6 2.5 ± 0.6 1.1 ± 0.6 Manganese ng/m³ 1.4 ± 2.1 1.4 ± 2 3.8 ± 1.9 2.4 ± 1.9 Iron ng/m³ 29.5 ± 0.7 11.3 ± 0.7 46.5 ± 0.7 15 ± 0.7 Cobalt ng/m³ 0.1 ± 0.7 0 ± 0.6 0.6 ± 0.6 0.1 ± 0.6 Nickel ng/m³ 0.4 ± 1.9 0 ± 1.9 1.1 ± 1.8 0.6 ± 1.8 Copper ng/m³ 7.8 ± 2.4 3.4 ± 2.3 15.3 ± 2.3 5.4 ± 2.3 Zinc ng/m³ 7.5 ± 0.7 3.5 ± 0.6 13.9 ± 0.7 7.1 ± 0.6 Gallium ng/m³ 0 ± 3.3 0.2 ± 3.1 0 ± 3.1 0 ± 3.1 Arsenic ng/m³ 0 ± 0.7 0 ± 0.6 0 ± 0.6 0 ± 0.6 Selenium ng/m³ 0 ± 0.7 0 ± 0.6 0 ± 0.6 0 ± 0.6 Bromine ng/m³ 0.6 ± 0.7 0 ± 0.6 0.2 ± 0.6 0.2 ± 0.6 Rubidium ng/m³ 0 ± 0.7 0 ± 0.6 0 ± 0.6 0 ± 0.6 Strontium ng/m³ 0.6 ± 0.7 0 ± 0.6 2 ± 0.6 0.4 ± 0.6 Yttrium ng/m³ 0 ± 0.7 0.4 ± 0.6 0 ± 0.6 0.4 ± 0.6
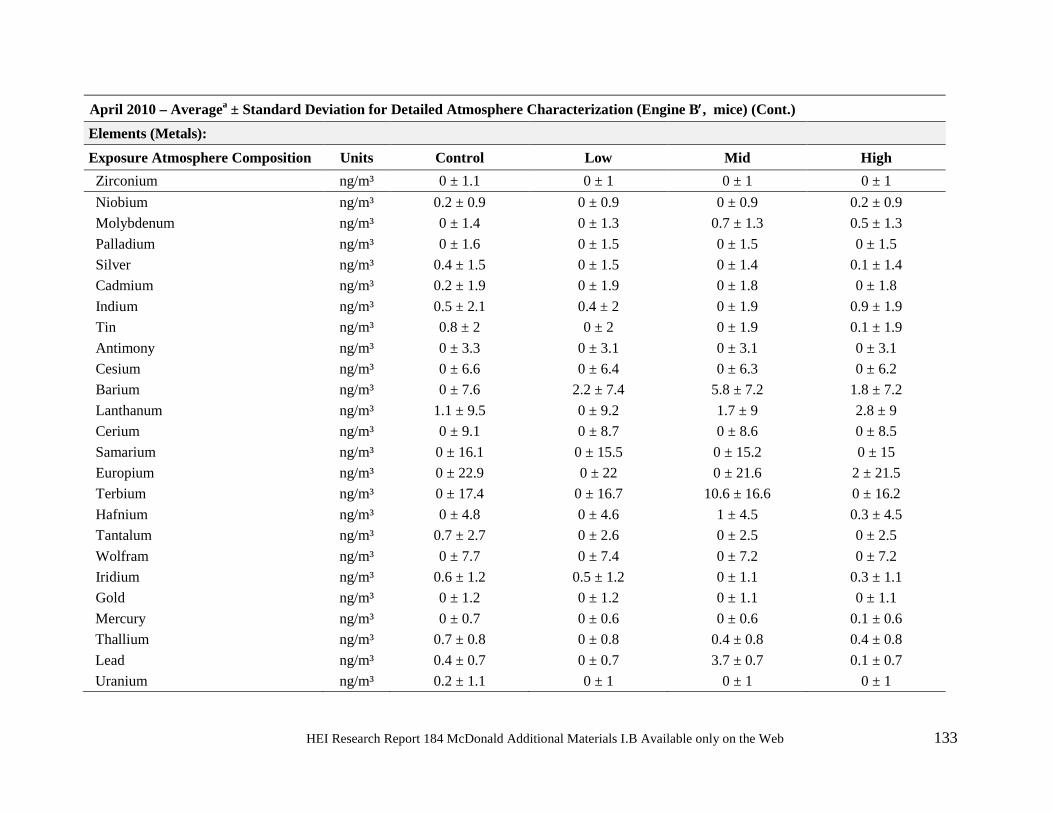
HEI Research Report 184 McDonald Additional Materials I.B Available only on the Web 133
April 2010 – Averagea ± Standard Deviation for Detailed Atmosphere Characterization (Engine B′, mice) (Cont.) Elements (Metals): Exposure Atmosphere Composition Units Control Low Mid High Zirconium ng/m³ 0 ± 1.1 0 ± 1 0 ± 1 0 ± 1 Niobium ng/m³ 0.2 ± 0.9 0 ± 0.9 0 ± 0.9 0.2 ± 0.9 Molybdenum ng/m³ 0 ± 1.4 0 ± 1.3 0.7 ± 1.3 0.5 ± 1.3 Palladium ng/m³ 0 ± 1.6 0 ± 1.5 0 ± 1.5 0 ± 1.5 Silver ng/m³ 0.4 ± 1.5 0 ± 1.5 0 ± 1.4 0.1 ± 1.4 Cadmium ng/m³ 0.2 ± 1.9 0 ± 1.9 0 ± 1.8 0 ± 1.8 Indium ng/m³ 0.5 ± 2.1 0.4 ± 2 0 ± 1.9 0.9 ± 1.9 Tin ng/m³ 0.8 ± 2 0 ± 2 0 ± 1.9 0.1 ± 1.9 Antimony ng/m³ 0 ± 3.3 0 ± 3.1 0 ± 3.1 0 ± 3.1 Cesium ng/m³ 0 ± 6.6 0 ± 6.4 0 ± 6.3 0 ± 6.2 Barium ng/m³ 0 ± 7.6 2.2 ± 7.4 5.8 ± 7.2 1.8 ± 7.2 Lanthanum ng/m³ 1.1 ± 9.5 0 ± 9.2 1.7 ± 9 2.8 ± 9 Cerium ng/m³ 0 ± 9.1 0 ± 8.7 0 ± 8.6 0 ± 8.5 Samarium ng/m³ 0 ± 16.1 0 ± 15.5 0 ± 15.2 0 ± 15 Europium ng/m³ 0 ± 22.9 0 ± 22 0 ± 21.6 2 ± 21.5 Terbium ng/m³ 0 ± 17.4 0 ± 16.7 10.6 ± 16.6 0 ± 16.2 Hafnium ng/m³ 0 ± 4.8 0 ± 4.6 1 ± 4.5 0.3 ± 4.5 Tantalum ng/m³ 0.7 ± 2.7 0 ± 2.6 0 ± 2.5 0 ± 2.5 Wolfram ng/m³ 0 ± 7.7 0 ± 7.4 0 ± 7.2 0 ± 7.2 Iridium ng/m³ 0.6 ± 1.2 0.5 ± 1.2 0 ± 1.1 0.3 ± 1.1 Gold ng/m³ 0 ± 1.2 0 ± 1.2 0 ± 1.1 0 ± 1.1 Mercury ng/m³ 0 ± 0.7 0 ± 0.6 0 ± 0.6 0.1 ± 0.6 Thallium ng/m³ 0.7 ± 0.8 0 ± 0.8 0.4 ± 0.8 0.4 ± 0.8 Lead ng/m³ 0.4 ± 0.7 0 ± 0.7 3.7 ± 0.7 0.1 ± 0.7 Uranium ng/m³ 0.2 ± 1.1 0 ± 1 0 ± 1 0 ± 1
HEI Research Report 184 McDonald Additional Materials I.B Available only on the Web 134
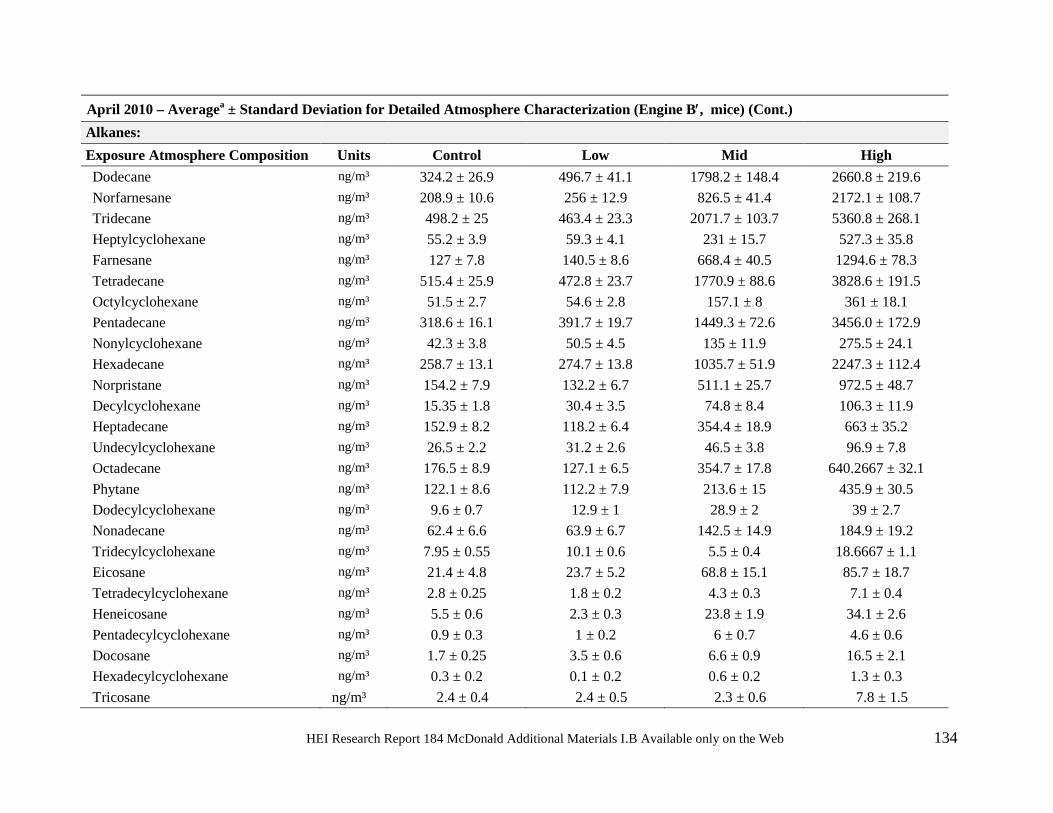
April 2010 – Averagea ± Standard Deviation for Detailed Atmosphere Characterization (Engine B′, mice) (Cont.) Alkanes: Exposure Atmosphere Composition Units Control Low Mid High Dodecane ng/m³ 324.2 ± 26.9 496.7 ± 41.1 1798.2 ± 148.4 2660.8 ± 219.6 Norfarnesane ng/m³ 208.9 ± 10.6 256 ± 12.9 826.5 ± 41.4 2172.1 ± 108.7 Tridecane ng/m³ 498.2 ± 25 463.4 ± 23.3 2071.7 ± 103.7 5360.8 ± 268.1 Heptylcyclohexane ng/m³ 55.2 ± 3.9 59.3 ± 4.1 231 ± 15.7 527.3 ± 35.8 Farnesane ng/m³ 127 ± 7.8 140.5 ± 8.6 668.4 ± 40.5 1294.6 ± 78.3 Tetradecane ng/m³ 515.4 ± 25.9 472.8 ± 23.7 1770.9 ± 88.6 3828.6 ± 191.5 Octylcyclohexane ng/m³ 51.5 ± 2.7 54.6 ± 2.8 157.1 ± 8 361 ± 18.1 Pentadecane ng/m³ 318.6 ± 16.1 391.7 ± 19.7 1449.3 ± 72.6 3456.0 ± 172.9 Nonylcyclohexane ng/m³ 42.3 ± 3.8 50.5 ± 4.5 135 ± 11.9 275.5 ± 24.1 Hexadecane ng/m³ 258.7 ± 13.1 274.7 ± 13.8 1035.7 ± 51.9 2247.3 ± 112.4 Norpristane ng/m³ 154.2 ± 7.9 132.2 ± 6.7 511.1 ± 25.7 972.5 ± 48.7 Decylcyclohexane ng/m³ 15.35 ± 1.8 30.4 ± 3.5 74.8 ± 8.4 106.3 ± 11.9 Heptadecane ng/m³ 152.9 ± 8.2 118.2 ± 6.4 354.4 ± 18.9 663 ± 35.2 Undecylcyclohexane ng/m³ 26.5 ± 2.2 31.2 ± 2.6 46.5 ± 3.8 96.9 ± 7.8 Octadecane ng/m³ 176.5 ± 8.9 127.1 ± 6.5 354.7 ± 17.8 640.2667 ± 32.1 Phytane ng/m³ 122.1 ± 8.6 112.2 ± 7.9 213.6 ± 15 435.9 ± 30.5 Dodecylcyclohexane ng/m³ 9.6 ± 0.7 12.9 ± 1 28.9 ± 2 39 ± 2.7 Nonadecane ng/m³ 62.4 ± 6.6 63.9 ± 6.7 142.5 ± 14.9 184.9 ± 19.2 Tridecylcyclohexane ng/m³ 7.95 ± 0.55 10.1 ± 0.6 5.5 ± 0.4 18.6667 ± 1.1 Eicosane ng/m³ 21.4 ± 4.8 23.7 ± 5.2 68.8 ± 15.1 85.7 ± 18.7 Tetradecylcyclohexane ng/m³ 2.8 ± 0.25 1.8 ± 0.2 4.3 ± 0.3 7.1 ± 0.4 Heneicosane ng/m³ 5.5 ± 0.6 2.3 ± 0.3 23.8 ± 1.9 34.1 ± 2.6 Pentadecylcyclohexane ng/m³ 0.9 ± 0.3 1 ± 0.2 6 ± 0.7 4.6 ± 0.6 Docosane ng/m³ 1.7 ± 0.25 3.5 ± 0.6 6.6 ± 0.9 16.5 ± 2.1 Hexadecylcyclohexane ng/m³ 0.3 ± 0.2 0.1 ± 0.2 0.6 ± 0.2 1.3 ± 0.3 Tricosane ng/m³ 2.4 ± 0.4 2.4 ± 0.5 2.3 ± 0.6 7.8 ± 1.5
HEI Research Report 184 McDonald Additional Materials I.B Available only on the Web 135
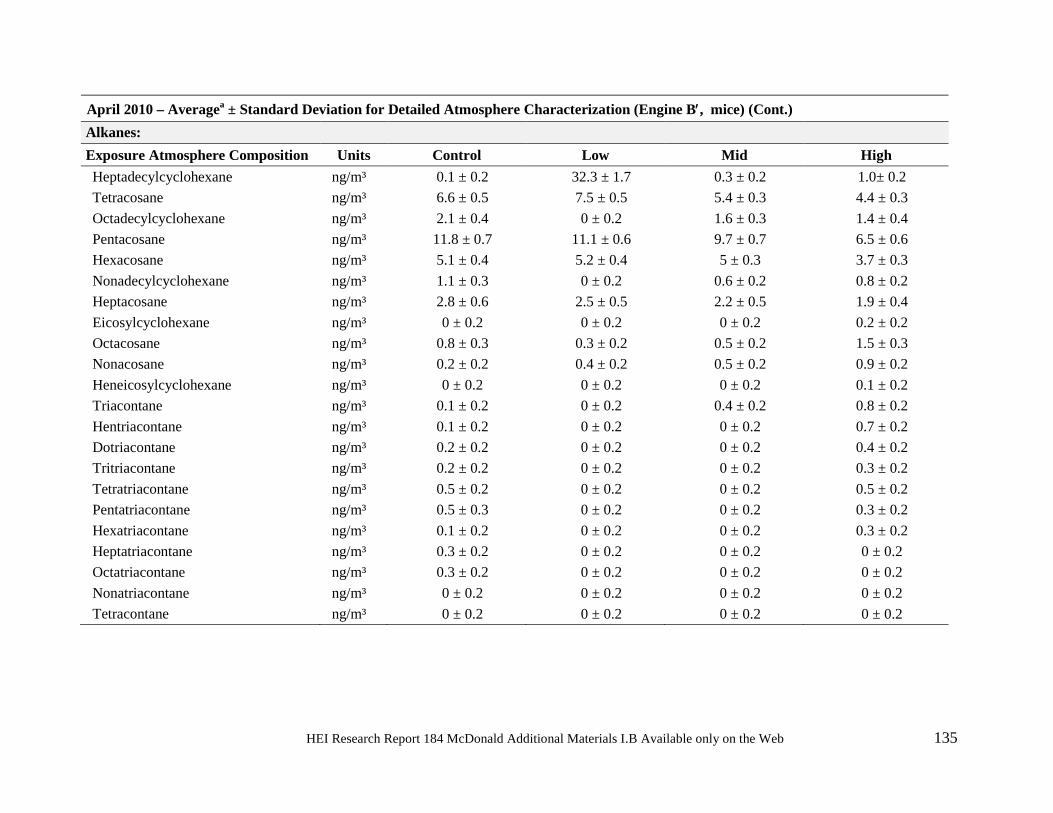
April 2010 – Averagea ± Standard Deviation for Detailed Atmosphere Characterization (Engine B′, mice) (Cont.) Alkanes: Exposure Atmosphere Composition Units Control Low Mid High Heptadecylcyclohexane ng/m³ 0.1 ± 0.2 32.3 ± 1.7 0.3 ± 0.2 1.0± 0.2 Tetracosane ng/m³ 6.6 ± 0.5 7.5 ± 0.5 5.4 ± 0.3 4.4 ± 0.3 Octadecylcyclohexane ng/m³ 2.1 ± 0.4 0 ± 0.2 1.6 ± 0.3 1.4 ± 0.4 Pentacosane ng/m³ 11.8 ± 0.7 11.1 ± 0.6 9.7 ± 0.7 6.5 ± 0.6 Hexacosane ng/m³ 5.1 ± 0.4 5.2 ± 0.4 5 ± 0.3 3.7 ± 0.3 Nonadecylcyclohexane ng/m³ 1.1 ± 0.3 0 ± 0.2 0.6 ± 0.2 0.8 ± 0.2 Heptacosane ng/m³ 2.8 ± 0.6 2.5 ± 0.5 2.2 ± 0.5 1.9 ± 0.4 Eicosylcyclohexane ng/m³ 0 ± 0.2 0 ± 0.2 0 ± 0.2 0.2 ± 0.2 Octacosane ng/m³ 0.8 ± 0.3 0.3 ± 0.2 0.5 ± 0.2 1.5 ± 0.3 Nonacosane ng/m³ 0.2 ± 0.2 0.4 ± 0.2 0.5 ± 0.2 0.9 ± 0.2 Heneicosylcyclohexane ng/m³ 0 ± 0.2 0 ± 0.2 0 ± 0.2 0.1 ± 0.2 Triacontane ng/m³ 0.1 ± 0.2 0 ± 0.2 0.4 ± 0.2 0.8 ± 0.2 Hentriacontane ng/m³ 0.1 ± 0.2 0 ± 0.2 0 ± 0.2 0.7 ± 0.2 Dotriacontane ng/m³ 0.2 ± 0.2 0 ± 0.2 0 ± 0.2 0.4 ± 0.2 Tritriacontane ng/m³ 0.2 ± 0.2 0 ± 0.2 0 ± 0.2 0.3 ± 0.2 Tetratriacontane ng/m³ 0.5 ± 0.2 0 ± 0.2 0 ± 0.2 0.5 ± 0.2 Pentatriacontane ng/m³ 0.5 ± 0.3 0 ± 0.2 0 ± 0.2 0.3 ± 0.2 Hexatriacontane ng/m³ 0.1 ± 0.2 0 ± 0.2 0 ± 0.2 0.3 ± 0.2 Heptatriacontane ng/m³ 0.3 ± 0.2 0 ± 0.2 0 ± 0.2 0 ± 0.2 Octatriacontane ng/m³ 0.3 ± 0.2 0 ± 0.2 0 ± 0.2 0 ± 0.2 Nonatriacontane ng/m³ 0 ± 0.2 0 ± 0.2 0 ± 0.2 0 ± 0.2 Tetracontane ng/m³ 0 ± 0.2 0 ± 0.2 0 ± 0.2 0 ± 0.2
HEI Research Report 184 McDonald Additional Materials I.B Available only on the Web 136
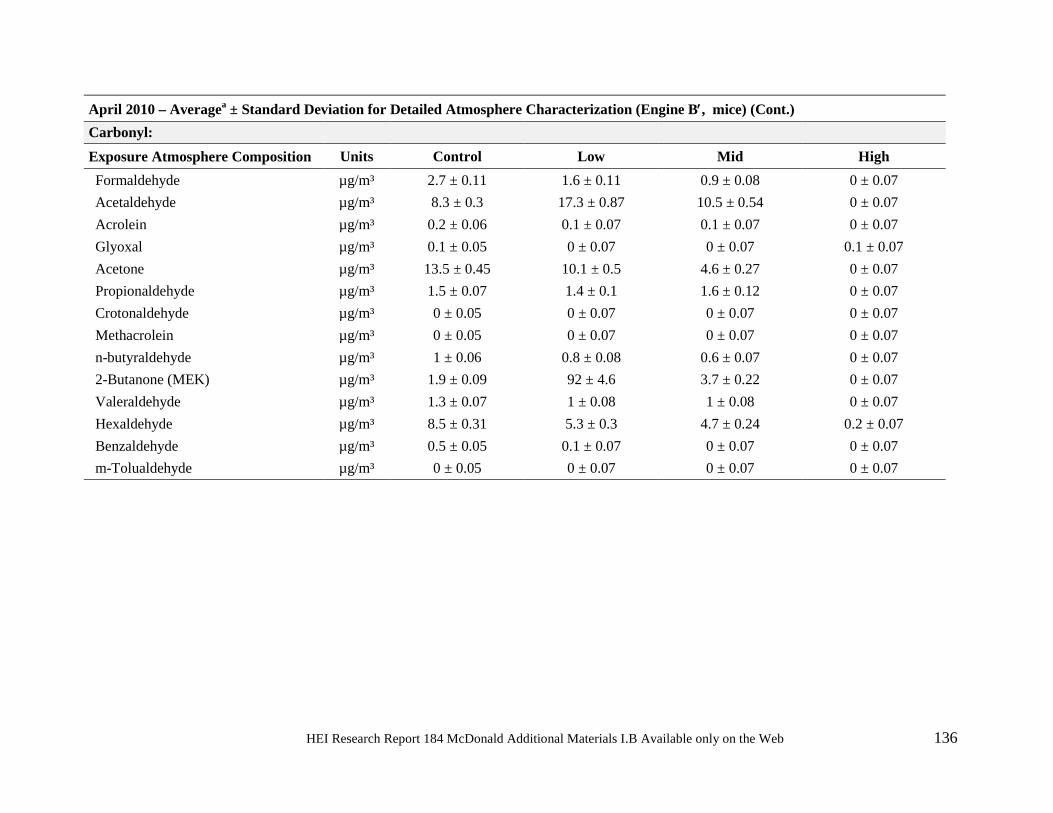
April 2010 – Averagea ± Standard Deviation for Detailed Atmosphere Characterization (Engine B′, mice) (Cont.) Carbonyl: Exposure Atmosphere Composition Units Control Low Mid High Formaldehyde µg/m³ 2.7 ± 0.11 1.6 ± 0.11 0.9 ± 0.08 0 ± 0.07 Acetaldehyde µg/m³ 8.3 ± 0.3 17.3 ± 0.87 10.5 ± 0.54 0 ± 0.07 Acrolein µg/m³ 0.2 ± 0.06 0.1 ± 0.07 0.1 ± 0.07 0 ± 0.07 Glyoxal µg/m³ 0.1 ± 0.05 0 ± 0.07 0 ± 0.07 0.1 ± 0.07 Acetone µg/m³ 13.5 ± 0.45 10.1 ± 0.5 4.6 ± 0.27 0 ± 0.07 Propionaldehyde µg/m³ 1.5 ± 0.07 1.4 ± 0.1 1.6 ± 0.12 0 ± 0.07 Crotonaldehyde µg/m³ 0 ± 0.05 0 ± 0.07 0 ± 0.07 0 ± 0.07 Methacrolein µg/m³ 0 ± 0.05 0 ± 0.07 0 ± 0.07 0 ± 0.07 n-butyraldehyde µg/m³ 1 ± 0.06 0.8 ± 0.08 0.6 ± 0.07 0 ± 0.07 2-Butanone (MEK) µg/m³ 1.9 ± 0.09 92 ± 4.6 3.7 ± 0.22 0 ± 0.07 Valeraldehyde µg/m³ 1.3 ± 0.07 1 ± 0.08 1 ± 0.08 0 ± 0.07 Hexaldehyde µg/m³ 8.5 ± 0.31 5.3 ± 0.3 4.7 ± 0.24 0.2 ± 0.07 Benzaldehyde µg/m³ 0.5 ± 0.05 0.1 ± 0.07 0 ± 0.07 0 ± 0.07 m-Tolualdehyde µg/m³ 0 ± 0.05 0 ± 0.07 0 ± 0.07 0 ± 0.07
HEI Research Report 184 McDonald Additional Materials I.B Available only on the Web 137
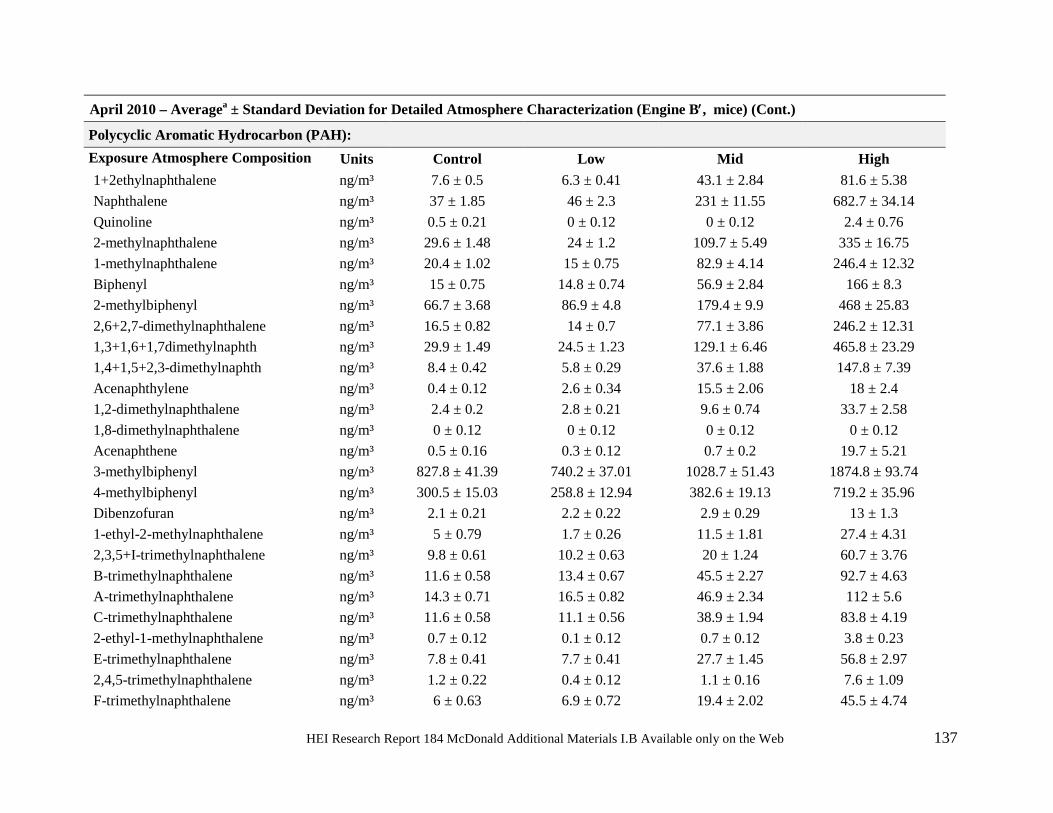
April 2010 – Averagea ± Standard Deviation for Detailed Atmosphere Characterization (Engine B′, mice) (Cont.)
Polycyclic Aromatic Hydrocarbon (PAH): Exposure Atmosphere Composition Units Control Low Mid High 1+2ethylnaphthalene ng/m³ 7.6 ± 0.5 6.3 ± 0.41 43.1 ± 2.84 81.6 ± 5.38 Naphthalene ng/m³ 37 ± 1.85 46 ± 2.3 231 ± 11.55 682.7 ± 34.14 Quinoline ng/m³ 0.5 ± 0.21 0 ± 0.12 0 ± 0.12 2.4 ± 0.76 2-methylnaphthalene ng/m³ 29.6 ± 1.48 24 ± 1.2 109.7 ± 5.49 335 ± 16.75 1-methylnaphthalene ng/m³ 20.4 ± 1.02 15 ± 0.75 82.9 ± 4.14 246.4 ± 12.32 Biphenyl ng/m³ 15 ± 0.75 14.8 ± 0.74 56.9 ± 2.84 166 ± 8.3 2-methylbiphenyl ng/m³ 66.7 ± 3.68 86.9 ± 4.8 179.4 ± 9.9 468 ± 25.83 2,6+2,7-dimethylnaphthalene ng/m³ 16.5 ± 0.82 14 ± 0.7 77.1 ± 3.86 246.2 ± 12.31 1,3+1,6+1,7dimethylnaphth ng/m³ 29.9 ± 1.49 24.5 ± 1.23 129.1 ± 6.46 465.8 ± 23.29 1,4+1,5+2,3-dimethylnaphth ng/m³ 8.4 ± 0.42 5.8 ± 0.29 37.6 ± 1.88 147.8 ± 7.39 Acenaphthylene ng/m³ 0.4 ± 0.12 2.6 ± 0.34 15.5 ± 2.06 18 ± 2.4 1,2-dimethylnaphthalene ng/m³ 2.4 ± 0.2 2.8 ± 0.21 9.6 ± 0.74 33.7 ± 2.58 1,8-dimethylnaphthalene ng/m³ 0 ± 0.12 0 ± 0.12 0 ± 0.12 0 ± 0.12 Acenaphthene ng/m³ 0.5 ± 0.16 0.3 ± 0.12 0.7 ± 0.2 19.7 ± 5.21 3-methylbiphenyl ng/m³ 827.8 ± 41.39 740.2 ± 37.01 1028.7 ± 51.43 1874.8 ± 93.74 4-methylbiphenyl ng/m³ 300.5 ± 15.03 258.8 ± 12.94 382.6 ± 19.13 719.2 ± 35.96 Dibenzofuran ng/m³ 2.1 ± 0.21 2.2 ± 0.22 2.9 ± 0.29 13 ± 1.3 1-ethyl-2-methylnaphthalene ng/m³ 5 ± 0.79 1.7 ± 0.26 11.5 ± 1.81 27.4 ± 4.31 2,3,5+I-trimethylnaphthalene ng/m³ 9.8 ± 0.61 10.2 ± 0.63 20 ± 1.24 60.7 ± 3.76 B-trimethylnaphthalene ng/m³ 11.6 ± 0.58 13.4 ± 0.67 45.5 ± 2.27 92.7 ± 4.63 A-trimethylnaphthalene ng/m³ 14.3 ± 0.71 16.5 ± 0.82 46.9 ± 2.34 112 ± 5.6 C-trimethylnaphthalene ng/m³ 11.6 ± 0.58 11.1 ± 0.56 38.9 ± 1.94 83.8 ± 4.19 2-ethyl-1-methylnaphthalene ng/m³ 0.7 ± 0.12 0.1 ± 0.12 0.7 ± 0.12 3.8 ± 0.23 E-trimethylnaphthalene ng/m³ 7.8 ± 0.41 7.7 ± 0.41 27.7 ± 1.45 56.8 ± 2.97 2,4,5-trimethylnaphthalene ng/m³ 1.2 ± 0.22 0.4 ± 0.12 1.1 ± 0.16 7.6 ± 1.09 F-trimethylnaphthalene ng/m³ 6 ± 0.63 6.9 ± 0.72 19.4 ± 2.02 45.5 ± 4.74
HEI Research Report 184 McDonald Additional Materials I.B Available only on the Web 138
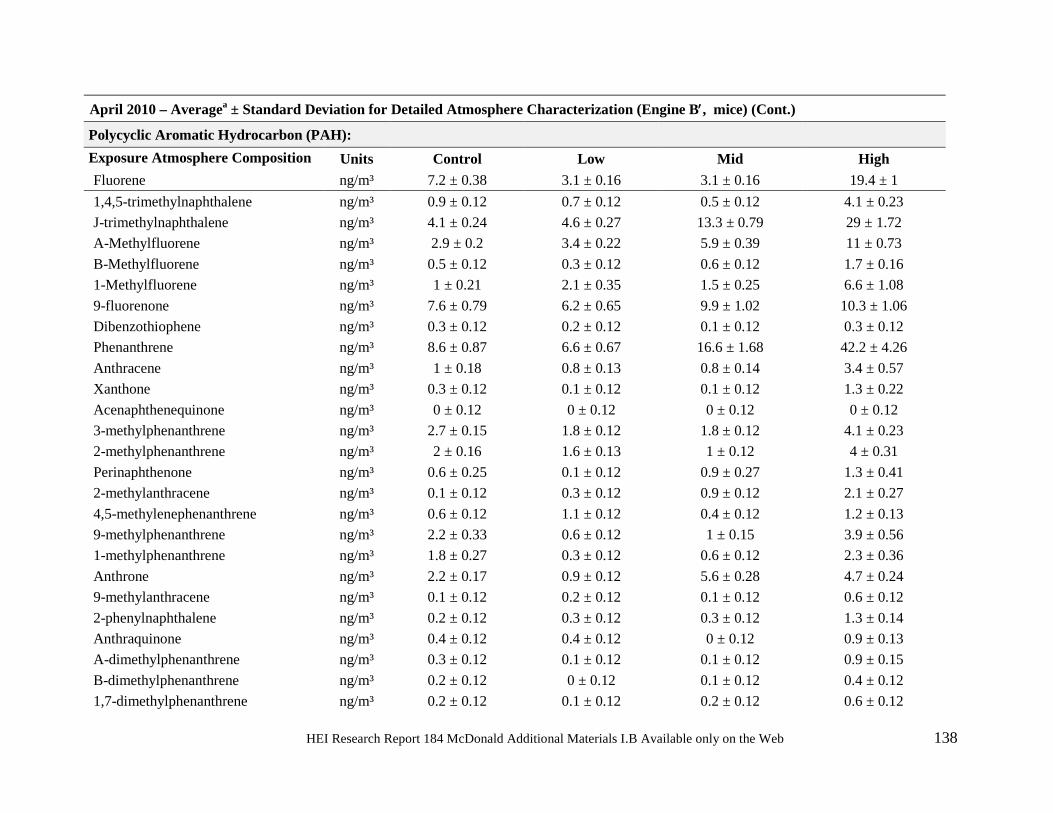
April 2010 – Averagea ± Standard Deviation for Detailed Atmosphere Characterization (Engine B′, mice) (Cont.)
Polycyclic Aromatic Hydrocarbon (PAH): Exposure Atmosphere Composition Units Control Low Mid High Fluorene ng/m³ 7.2 ± 0.38 3.1 ± 0.16 3.1 ± 0.16 19.4 ± 1 1,4,5-trimethylnaphthalene ng/m³ 0.9 ± 0.12 0.7 ± 0.12 0.5 ± 0.12 4.1 ± 0.23 J-trimethylnaphthalene ng/m³ 4.1 ± 0.24 4.6 ± 0.27 13.3 ± 0.79 29 ± 1.72 A-Methylfluorene ng/m³ 2.9 ± 0.2 3.4 ± 0.22 5.9 ± 0.39 11 ± 0.73 B-Methylfluorene ng/m³ 0.5 ± 0.12 0.3 ± 0.12 0.6 ± 0.12 1.7 ± 0.16 1-Methylfluorene ng/m³ 1 ± 0.21 2.1 ± 0.35 1.5 ± 0.25 6.6 ± 1.08 9-fluorenone ng/m³ 7.6 ± 0.79 6.2 ± 0.65 9.9 ± 1.02 10.3 ± 1.06 Dibenzothiophene ng/m³ 0.3 ± 0.12 0.2 ± 0.12 0.1 ± 0.12 0.3 ± 0.12 Phenanthrene ng/m³ 8.6 ± 0.87 6.6 ± 0.67 16.6 ± 1.68 42.2 ± 4.26 Anthracene ng/m³ 1 ± 0.18 0.8 ± 0.13 0.8 ± 0.14 3.4 ± 0.57 Xanthone ng/m³ 0.3 ± 0.12 0.1 ± 0.12 0.1 ± 0.12 1.3 ± 0.22 Acenaphthenequinone ng/m³ 0 ± 0.12 0 ± 0.12 0 ± 0.12 0 ± 0.12 3-methylphenanthrene ng/m³ 2.7 ± 0.15 1.8 ± 0.12 1.8 ± 0.12 4.1 ± 0.23 2-methylphenanthrene ng/m³ 2 ± 0.16 1.6 ± 0.13 1 ± 0.12 4 ± 0.31 Perinaphthenone ng/m³ 0.6 ± 0.25 0.1 ± 0.12 0.9 ± 0.27 1.3 ± 0.41 2-methylanthracene ng/m³ 0.1 ± 0.12 0.3 ± 0.12 0.9 ± 0.12 2.1 ± 0.27 4,5-methylenephenanthrene ng/m³ 0.6 ± 0.12 1.1 ± 0.12 0.4 ± 0.12 1.2 ± 0.13 9-methylphenanthrene ng/m³ 2.2 ± 0.33 0.6 ± 0.12 1 ± 0.15 3.9 ± 0.56 1-methylphenanthrene ng/m³ 1.8 ± 0.27 0.3 ± 0.12 0.6 ± 0.12 2.3 ± 0.36 Anthrone ng/m³ 2.2 ± 0.17 0.9 ± 0.12 5.6 ± 0.28 4.7 ± 0.24 9-methylanthracene ng/m³ 0.1 ± 0.12 0.2 ± 0.12 0.1 ± 0.12 0.6 ± 0.12 2-phenylnaphthalene ng/m³ 0.2 ± 0.12 0.3 ± 0.12 0.3 ± 0.12 1.3 ± 0.14 Anthraquinone ng/m³ 0.4 ± 0.12 0.4 ± 0.12 0 ± 0.12 0.9 ± 0.13 A-dimethylphenanthrene ng/m³ 0.3 ± 0.12 0.1 ± 0.12 0.1 ± 0.12 0.9 ± 0.15 B-dimethylphenanthrene ng/m³ 0.2 ± 0.12 0 ± 0.12 0.1 ± 0.12 0.4 ± 0.12 1,7-dimethylphenanthrene ng/m³ 0.2 ± 0.12 0.1 ± 0.12 0.2 ± 0.12 0.6 ± 0.12
HEI Research Report 184 McDonald Additional Materials I.B Available only on the Web 139
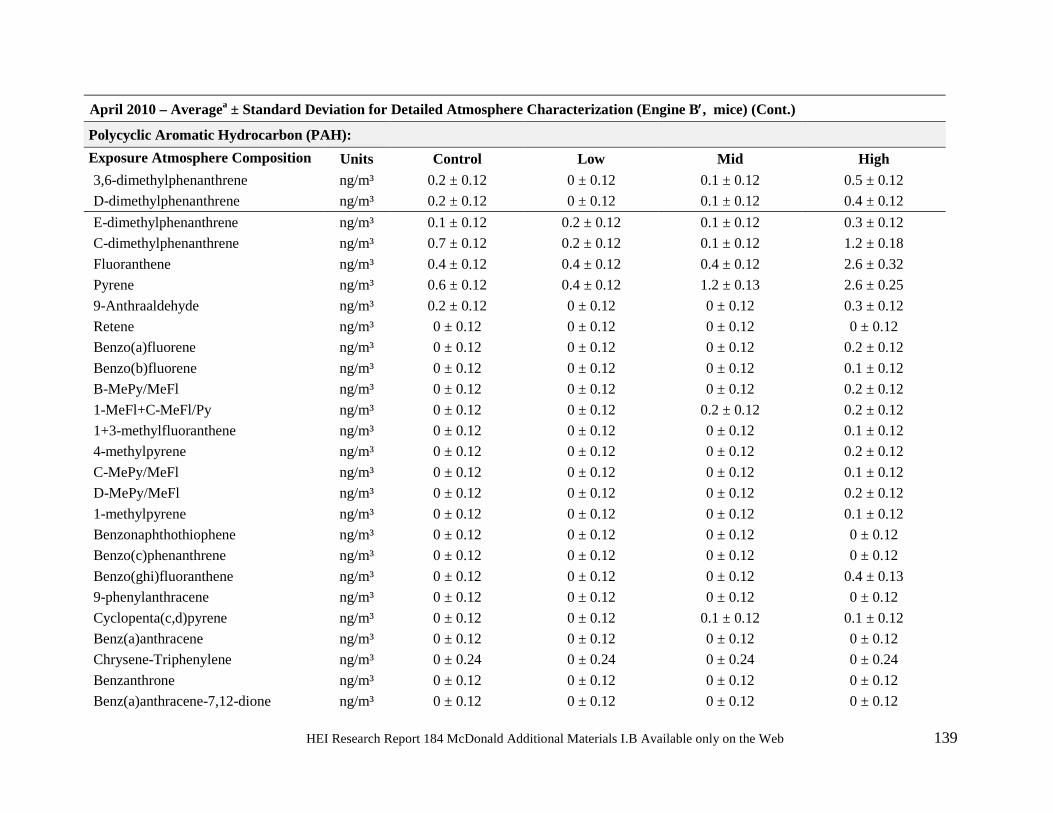
April 2010 – Averagea ± Standard Deviation for Detailed Atmosphere Characterization (Engine B′, mice) (Cont.)
Polycyclic Aromatic Hydrocarbon (PAH): Exposure Atmosphere Composition Units Control Low Mid High 3,6-dimethylphenanthrene ng/m³ 0.2 ± 0.12 0 ± 0.12 0.1 ± 0.12 0.5 ± 0.12 D-dimethylphenanthrene ng/m³ 0.2 ± 0.12 0 ± 0.12 0.1 ± 0.12 0.4 ± 0.12 E-dimethylphenanthrene ng/m³ 0.1 ± 0.12 0.2 ± 0.12 0.1 ± 0.12 0.3 ± 0.12 C-dimethylphenanthrene ng/m³ 0.7 ± 0.12 0.2 ± 0.12 0.1 ± 0.12 1.2 ± 0.18 Fluoranthene ng/m³ 0.4 ± 0.12 0.4 ± 0.12 0.4 ± 0.12 2.6 ± 0.32 Pyrene ng/m³ 0.6 ± 0.12 0.4 ± 0.12 1.2 ± 0.13 2.6 ± 0.25 9-Anthraaldehyde ng/m³ 0.2 ± 0.12 0 ± 0.12 0 ± 0.12 0.3 ± 0.12 Retene ng/m³ 0 ± 0.12 0 ± 0.12 0 ± 0.12 0 ± 0.12 Benzo(a)fluorene ng/m³ 0 ± 0.12 0 ± 0.12 0 ± 0.12 0.2 ± 0.12 Benzo(b)fluorene ng/m³ 0 ± 0.12 0 ± 0.12 0 ± 0.12 0.1 ± 0.12 B-MePy/MeFl ng/m³ 0 ± 0.12 0 ± 0.12 0 ± 0.12 0.2 ± 0.12 1-MeFl+C-MeFl/Py ng/m³ 0 ± 0.12 0 ± 0.12 0.2 ± 0.12 0.2 ± 0.12 1+3-methylfluoranthene ng/m³ 0 ± 0.12 0 ± 0.12 0 ± 0.12 0.1 ± 0.12 4-methylpyrene ng/m³ 0 ± 0.12 0 ± 0.12 0 ± 0.12 0.2 ± 0.12 C-MePy/MeFl ng/m³ 0 ± 0.12 0 ± 0.12 0 ± 0.12 0.1 ± 0.12 D-MePy/MeFl ng/m³ 0 ± 0.12 0 ± 0.12 0 ± 0.12 0.2 ± 0.12 1-methylpyrene ng/m³ 0 ± 0.12 0 ± 0.12 0 ± 0.12 0.1 ± 0.12 Benzonaphthothiophene ng/m³ 0 ± 0.12 0 ± 0.12 0 ± 0.12 0 ± 0.12 Benzo(c)phenanthrene ng/m³ 0 ± 0.12 0 ± 0.12 0 ± 0.12 0 ± 0.12 Benzo(ghi)fluoranthene ng/m³ 0 ± 0.12 0 ± 0.12 0 ± 0.12 0.4 ± 0.13 9-phenylanthracene ng/m³ 0 ± 0.12 0 ± 0.12 0 ± 0.12 0 ± 0.12 Cyclopenta(c,d)pyrene ng/m³ 0 ± 0.12 0 ± 0.12 0.1 ± 0.12 0.1 ± 0.12 Benz(a)anthracene ng/m³ 0 ± 0.12 0 ± 0.12 0 ± 0.12 0 ± 0.12 Chrysene-Triphenylene ng/m³ 0 ± 0.24 0 ± 0.24 0 ± 0.24 0 ± 0.24 Benzanthrone ng/m³ 0 ± 0.12 0 ± 0.12 0 ± 0.12 0 ± 0.12 Benz(a)anthracene-7,12-dione ng/m³ 0 ± 0.12 0 ± 0.12 0 ± 0.12 0 ± 0.12
HEI Research Report 184 McDonald Additional Materials I.B Available only on the Web 140
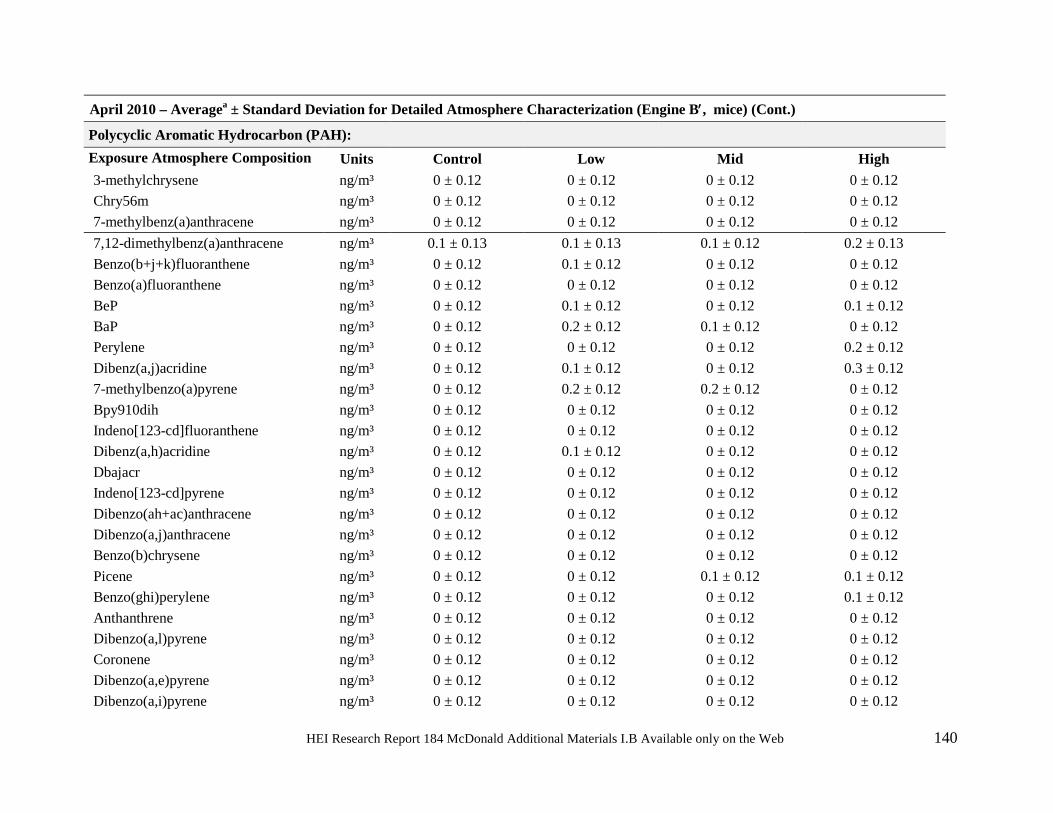
April 2010 – Averagea ± Standard Deviation for Detailed Atmosphere Characterization (Engine B′, mice) (Cont.)
Polycyclic Aromatic Hydrocarbon (PAH): Exposure Atmosphere Composition Units Control Low Mid High 3-methylchrysene ng/m³ 0 ± 0.12 0 ± 0.12 0 ± 0.12 0 ± 0.12 Chry56m ng/m³ 0 ± 0.12 0 ± 0.12 0 ± 0.12 0 ± 0.12 7-methylbenz(a)anthracene ng/m³ 0 ± 0.12 0 ± 0.12 0 ± 0.12 0 ± 0.12 7,12-dimethylbenz(a)anthracene ng/m³ 0.1 ± 0.13 0.1 ± 0.13 0.1 ± 0.12 0.2 ± 0.13 Benzo(b+j+k)fluoranthene ng/m³ 0 ± 0.12 0.1 ± 0.12 0 ± 0.12 0 ± 0.12 Benzo(a)fluoranthene ng/m³ 0 ± 0.12 0 ± 0.12 0 ± 0.12 0 ± 0.12 BeP ng/m³ 0 ± 0.12 0.1 ± 0.12 0 ± 0.12 0.1 ± 0.12 BaP ng/m³ 0 ± 0.12 0.2 ± 0.12 0.1 ± 0.12 0 ± 0.12 Perylene ng/m³ 0 ± 0.12 0 ± 0.12 0 ± 0.12 0.2 ± 0.12 Dibenz(a,j)acridine ng/m³ 0 ± 0.12 0.1 ± 0.12 0 ± 0.12 0.3 ± 0.12 7-methylbenzo(a)pyrene ng/m³ 0 ± 0.12 0.2 ± 0.12 0.2 ± 0.12 0 ± 0.12 Bpy910dih ng/m³ 0 ± 0.12 0 ± 0.12 0 ± 0.12 0 ± 0.12 Indeno[123-cd]fluoranthene ng/m³ 0 ± 0.12 0 ± 0.12 0 ± 0.12 0 ± 0.12 Dibenz(a,h)acridine ng/m³ 0 ± 0.12 0.1 ± 0.12 0 ± 0.12 0 ± 0.12 Dbajacr ng/m³ 0 ± 0.12 0 ± 0.12 0 ± 0.12 0 ± 0.12 Indeno[123-cd]pyrene ng/m³ 0 ± 0.12 0 ± 0.12 0 ± 0.12 0 ± 0.12 Dibenzo(ah+ac)anthracene ng/m³ 0 ± 0.12 0 ± 0.12 0 ± 0.12 0 ± 0.12 Dibenzo(a,j)anthracene ng/m³ 0 ± 0.12 0 ± 0.12 0 ± 0.12 0 ± 0.12 Benzo(b)chrysene ng/m³ 0 ± 0.12 0 ± 0.12 0 ± 0.12 0 ± 0.12 Picene ng/m³ 0 ± 0.12 0 ± 0.12 0.1 ± 0.12 0.1 ± 0.12 Benzo(ghi)perylene ng/m³ 0 ± 0.12 0 ± 0.12 0 ± 0.12 0.1 ± 0.12 Anthanthrene ng/m³ 0 ± 0.12 0 ± 0.12 0 ± 0.12 0 ± 0.12 Dibenzo(a,l)pyrene ng/m³ 0 ± 0.12 0 ± 0.12 0 ± 0.12 0 ± 0.12 Coronene ng/m³ 0 ± 0.12 0 ± 0.12 0 ± 0.12 0 ± 0.12 Dibenzo(a,e)pyrene ng/m³ 0 ± 0.12 0 ± 0.12 0 ± 0.12 0 ± 0.12 Dibenzo(a,i)pyrene ng/m³ 0 ± 0.12 0 ± 0.12 0 ± 0.12 0 ± 0.12
HEI Research Report 184 McDonald Additional Materials I.B Available only on the Web 141
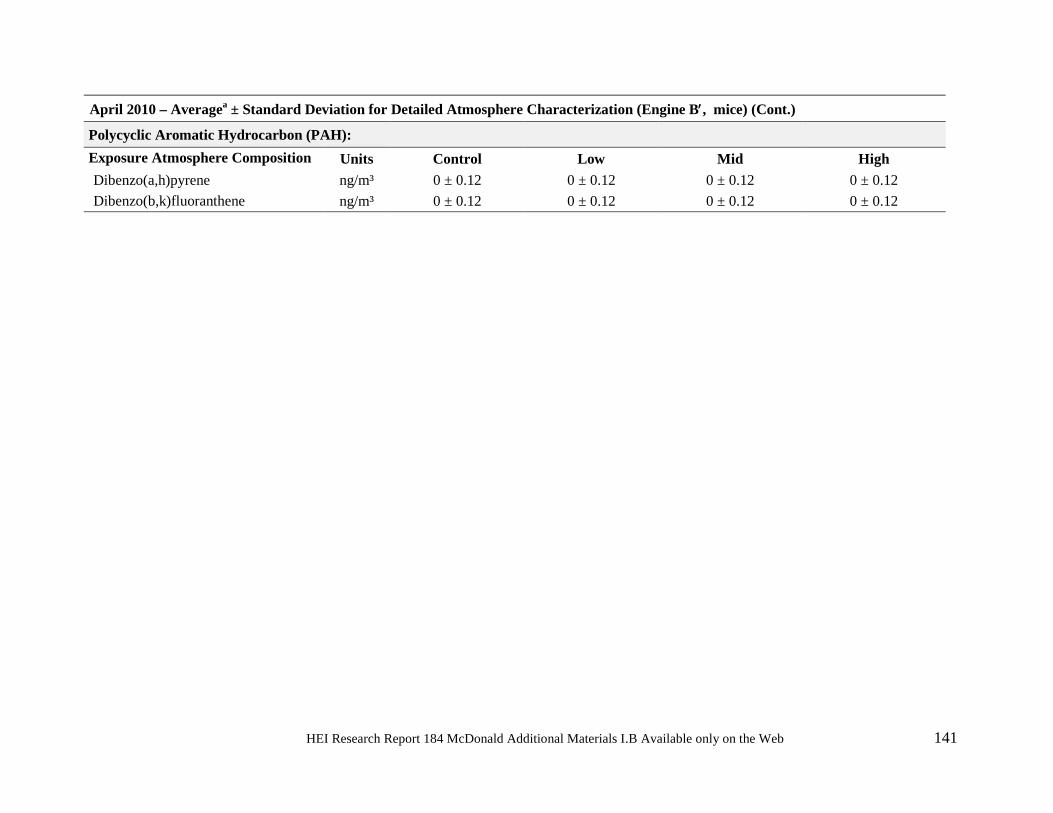
April 2010 – Averagea ± Standard Deviation for Detailed Atmosphere Characterization (Engine B′, mice) (Cont.)
Polycyclic Aromatic Hydrocarbon (PAH): Exposure Atmosphere Composition Units Control Low Mid High Dibenzo(a,h)pyrene ng/m³ 0 ± 0.12 0 ± 0.12 0 ± 0.12 0 ± 0.12 Dibenzo(b,k)fluoranthene ng/m³ 0 ± 0.12 0 ± 0.12 0 ± 0.12 0 ± 0.12
HEI Research Report 184 McDonald Additional Materials I.B Available only on the Web 142
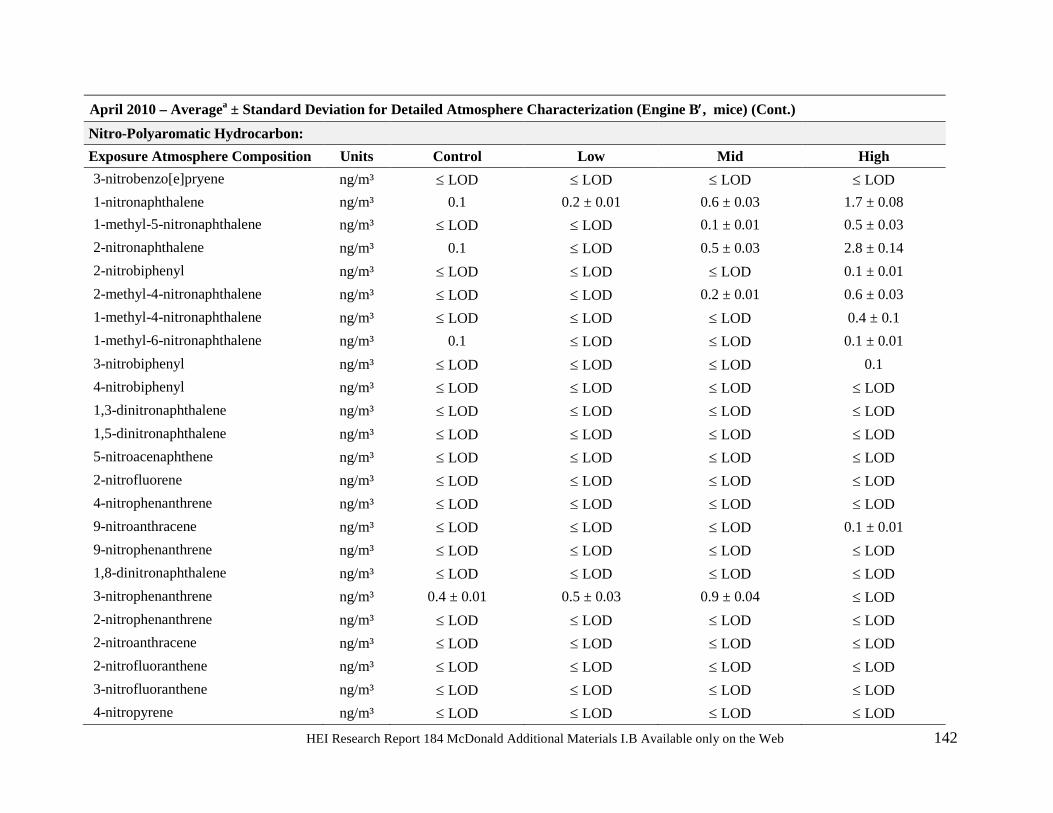
April 2010 – Averagea ± Standard Deviation for Detailed Atmosphere Characterization (Engine B′, mice) (Cont.) Nitro-Polyaromatic Hydrocarbon: Exposure Atmosphere Composition Units Control Low Mid High 3-nitrobenzo[e]pryene ng/m³ ≤ LOD ≤ LOD ≤ LOD ≤ LOD 1-nitronaphthalene ng/m³ 0.1 0.2 ± 0.01 0.6 ± 0.03 1.7 ± 0.08 1-methyl-5-nitronaphthalene ng/m³ ≤ LOD ≤ LOD 0.1 ± 0.01 0.5 ± 0.03 2-nitronaphthalene ng/m³ 0.1 ≤ LOD 0.5 ± 0.03 2.8 ± 0.14 2-nitrobiphenyl ng/m³ ≤ LOD ≤ LOD ≤ LOD 0.1 ± 0.01 2-methyl-4-nitronaphthalene ng/m³ ≤ LOD ≤ LOD 0.2 ± 0.01 0.6 ± 0.03 1-methyl-4-nitronaphthalene ng/m³ ≤ LOD ≤ LOD ≤ LOD 0.4 ± 0.1 1-methyl-6-nitronaphthalene ng/m³ 0.1 ≤ LOD ≤ LOD 0.1 ± 0.01 3-nitrobiphenyl ng/m³ ≤ LOD ≤ LOD ≤ LOD 0.1 4-nitrobiphenyl ng/m³ ≤ LOD ≤ LOD ≤ LOD ≤ LOD 1,3-dinitronaphthalene ng/m³ ≤ LOD ≤ LOD ≤ LOD ≤ LOD 1,5-dinitronaphthalene ng/m³ ≤ LOD ≤ LOD ≤ LOD ≤ LOD 5-nitroacenaphthene ng/m³ ≤ LOD ≤ LOD ≤ LOD ≤ LOD 2-nitrofluorene ng/m³ ≤ LOD ≤ LOD ≤ LOD ≤ LOD 4-nitrophenanthrene ng/m³ ≤ LOD ≤ LOD ≤ LOD ≤ LOD 9-nitroanthracene ng/m³ ≤ LOD ≤ LOD ≤ LOD 0.1 ± 0.01 9-nitrophenanthrene ng/m³ ≤ LOD ≤ LOD ≤ LOD ≤ LOD 1,8-dinitronaphthalene ng/m³ ≤ LOD ≤ LOD ≤ LOD ≤ LOD 3-nitrophenanthrene ng/m³ 0.4 ± 0.01 0.5 ± 0.03 0.9 ± 0.04 ≤ LOD 2-nitrophenanthrene ng/m³ ≤ LOD ≤ LOD ≤ LOD ≤ LOD 2-nitroanthracene ng/m³ ≤ LOD ≤ LOD ≤ LOD ≤ LOD 2-nitrofluoranthene ng/m³ ≤ LOD ≤ LOD ≤ LOD ≤ LOD 3-nitrofluoranthene ng/m³ ≤ LOD ≤ LOD ≤ LOD ≤ LOD 4-nitropyrene ng/m³ ≤ LOD ≤ LOD ≤ LOD ≤ LOD
HEI Research Report 184 McDonald Additional Materials I.B Available only on the Web 143
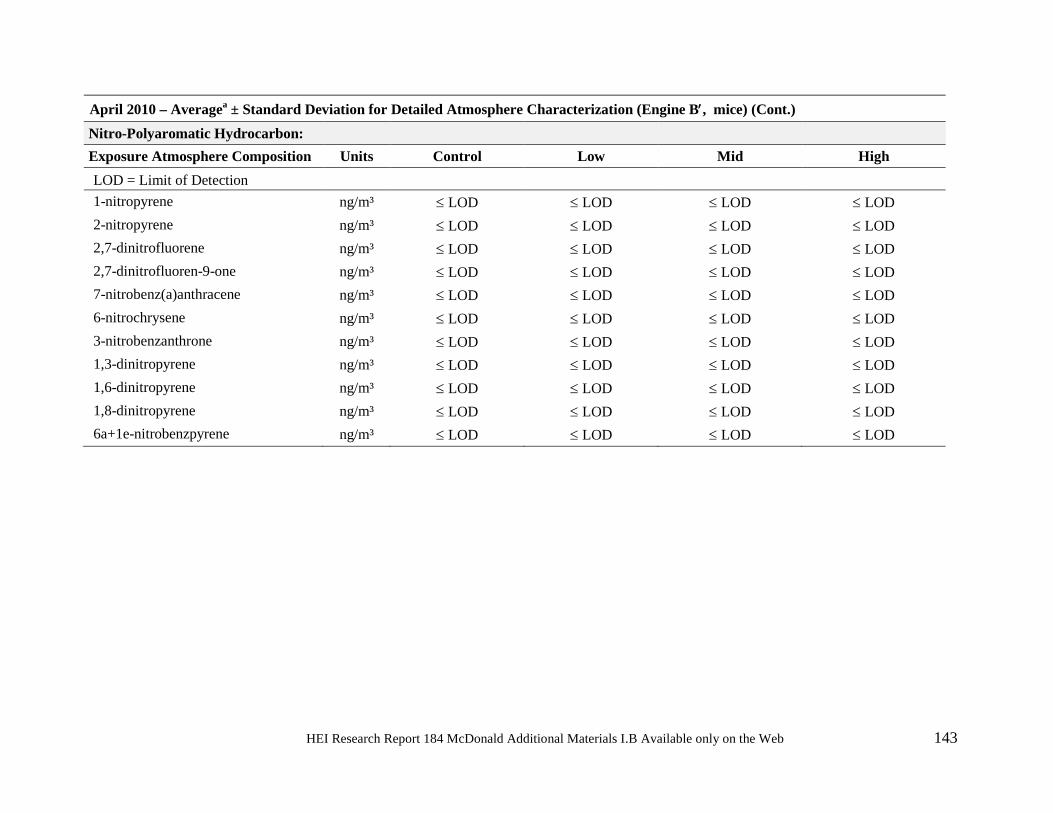
April 2010 – Averagea ± Standard Deviation for Detailed Atmosphere Characterization (Engine B′, mice) (Cont.) Nitro-Polyaromatic Hydrocarbon: Exposure Atmosphere Composition Units Control Low Mid High LOD = Limit of Detection 1-nitropyrene ng/m³ ≤ LOD ≤ LOD ≤ LOD ≤ LOD 2-nitropyrene ng/m³ ≤ LOD ≤ LOD ≤ LOD ≤ LOD 2,7-dinitrofluorene ng/m³ ≤ LOD ≤ LOD ≤ LOD ≤ LOD 2,7-dinitrofluoren-9-one ng/m³ ≤ LOD ≤ LOD ≤ LOD ≤ LOD 7-nitrobenz(a)anthracene ng/m³ ≤ LOD ≤ LOD ≤ LOD ≤ LOD 6-nitrochrysene ng/m³ ≤ LOD ≤ LOD ≤ LOD ≤ LOD 3-nitrobenzanthrone ng/m³ ≤ LOD ≤ LOD ≤ LOD ≤ LOD 1,3-dinitropyrene ng/m³ ≤ LOD ≤ LOD ≤ LOD ≤ LOD 1,6-dinitropyrene ng/m³ ≤ LOD ≤ LOD ≤ LOD ≤ LOD 1,8-dinitropyrene ng/m³ ≤ LOD ≤ LOD ≤ LOD ≤ LOD 6a+1e-nitrobenzpyrene ng/m³ ≤ LOD ≤ LOD ≤ LOD ≤ LOD
HEI Research Report 184 McDonald Additional Materials I.B Available only on the Web 144
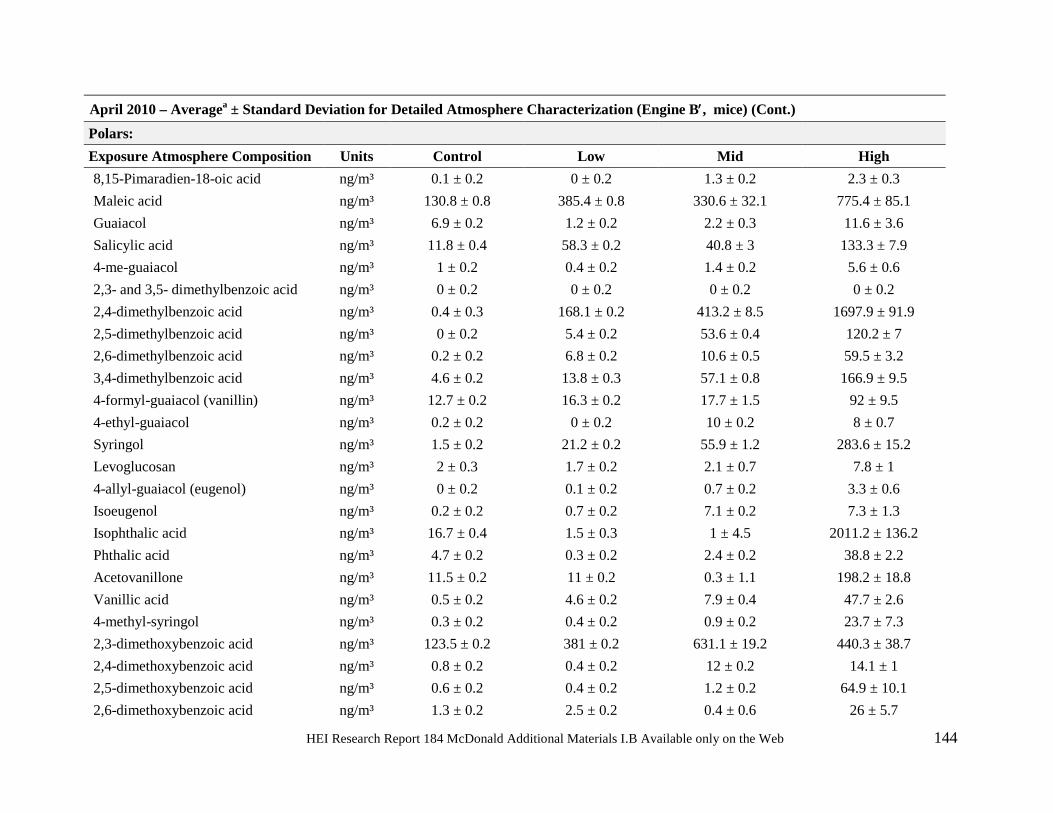
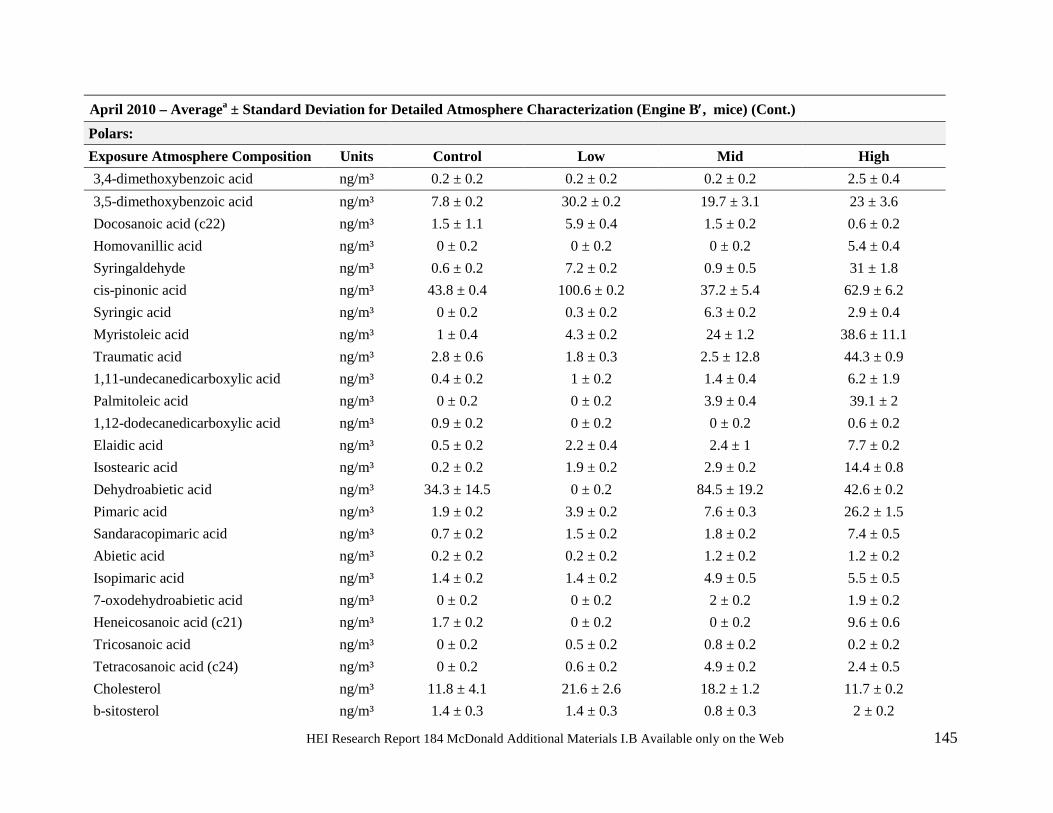
April 2010 – Averagea ± Standard Deviation for Detailed Atmosphere Characterization (Engine B′, mice) (Cont.) Polars: Exposure Atmosphere Composition Units Control Low Mid High 8,15-Pimaradien-18-oic acid ng/m³ 0.1 ± 0.2 0 ± 0.2 1.3 ± 0.2 2.3 ± 0.3 Maleic acid ng/m³ 130.8 ± 0.8 385.4 ± 0.8 330.6 ± 32.1 775.4 ± 85.1 Guaiacol ng/m³ 6.9 ± 0.2 1.2 ± 0.2 2.2 ± 0.3 11.6 ± 3.6 Salicylic acid ng/m³ 11.8 ± 0.4 58.3 ± 0.2 40.8 ± 3 133.3 ± 7.9 4-me-guaiacol ng/m³ 1 ± 0.2 0.4 ± 0.2 1.4 ± 0.2 5.6 ± 0.6 2,3- and 3,5- dimethylbenzoic acid ng/m³ 0 ± 0.2 0 ± 0.2 0 ± 0.2 0 ± 0.2 2,4-dimethylbenzoic acid ng/m³ 0.4 ± 0.3 168.1 ± 0.2 413.2 ± 8.5 1697.9 ± 91.9 2,5-dimethylbenzoic acid ng/m³ 0 ± 0.2 5.4 ± 0.2 53.6 ± 0.4 120.2 ± 7 2,6-dimethylbenzoic acid ng/m³ 0.2 ± 0.2 6.8 ± 0.2 10.6 ± 0.5 59.5 ± 3.2 3,4-dimethylbenzoic acid ng/m³ 4.6 ± 0.2 13.8 ± 0.3 57.1 ± 0.8 166.9 ± 9.5 4-formyl-guaiacol (vanillin) ng/m³ 12.7 ± 0.2 16.3 ± 0.2 17.7 ± 1.5 92 ± 9.5 4-ethyl-guaiacol ng/m³ 0.2 ± 0.2 0 ± 0.2 10 ± 0.2 8 ± 0.7 Syringol ng/m³ 1.5 ± 0.2 21.2 ± 0.2 55.9 ± 1.2 283.6 ± 15.2 Levoglucosan ng/m³ 2 ± 0.3 1.7 ± 0.2 2.1 ± 0.7 7.8 ± 1 4-allyl-guaiacol (eugenol) ng/m³ 0 ± 0.2 0.1 ± 0.2 0.7 ± 0.2 3.3 ± 0.6 Isoeugenol ng/m³ 0.2 ± 0.2 0.7 ± 0.2 7.1 ± 0.2 7.3 ± 1.3 Isophthalic acid ng/m³ 16.7 ± 0.4 1.5 ± 0.3 1 ± 4.5 2011.2 ± 136.2 Phthalic acid ng/m³ 4.7 ± 0.2 0.3 ± 0.2 2.4 ± 0.2 38.8 ± 2.2 Acetovanillone ng/m³ 11.5 ± 0.2 11 ± 0.2 0.3 ± 1.1 198.2 ± 18.8 Vanillic acid ng/m³ 0.5 ± 0.2 4.6 ± 0.2 7.9 ± 0.4 47.7 ± 2.6 4-methyl-syringol ng/m³ 0.3 ± 0.2 0.4 ± 0.2 0.9 ± 0.2 23.7 ± 7.3 2,3-dimethoxybenzoic acid ng/m³ 123.5 ± 0.2 381 ± 0.2 631.1 ± 19.2 440.3 ± 38.7 2,4-dimethoxybenzoic acid ng/m³ 0.8 ± 0.2 0.4 ± 0.2 12 ± 0.2 14.1 ± 1 2,5-dimethoxybenzoic acid ng/m³ 0.6 ± 0.2 0.4 ± 0.2 1.2 ± 0.2 64.9 ± 10.1 2,6-dimethoxybenzoic acid ng/m³ 1.3 ± 0.2 2.5 ± 0.2 0.4 ± 0.6 26 ± 5.7
HEI Research Report 184 McDonald Additional Materials I.B Available only on the Web 145
April 2010 – Averagea ± Standard Deviation for Detailed Atmosphere Characterization (Engine B′, mice) (Cont.) Polars: Exposure Atmosphere Composition Units Control Low Mid High 3,4-dimethoxybenzoic acid ng/m³ 0.2 ± 0.2 0.2 ± 0.2 0.2 ± 0.2 2.5 ± 0.4 3,5-dimethoxybenzoic acid ng/m³ 7.8 ± 0.2 30.2 ± 0.2 19.7 ± 3.1 23 ± 3.6 Docosanoic acid (c22) ng/m³ 1.5 ± 1.1 5.9 ± 0.4 1.5 ± 0.2 0.6 ± 0.2 Homovanillic acid ng/m³ 0 ± 0.2 0 ± 0.2 0 ± 0.2 5.4 ± 0.4 Syringaldehyde ng/m³ 0.6 ± 0.2 7.2 ± 0.2 0.9 ± 0.5 31 ± 1.8 cis-pinonic acid ng/m³ 43.8 ± 0.4 100.6 ± 0.2 37.2 ± 5.4 62.9 ± 6.2 Syringic acid ng/m³ 0 ± 0.2 0.3 ± 0.2 6.3 ± 0.2 2.9 ± 0.4 Myristoleic acid ng/m³ 1 ± 0.4 4.3 ± 0.2 24 ± 1.2 38.6 ± 11.1 Traumatic acid ng/m³ 2.8 ± 0.6 1.8 ± 0.3 2.5 ± 12.8 44.3 ± 0.9 1,11-undecanedicarboxylic acid ng/m³ 0.4 ± 0.2 1 ± 0.2 1.4 ± 0.4 6.2 ± 1.9 Palmitoleic acid ng/m³ 0 ± 0.2 0 ± 0.2 3.9 ± 0.4 39.1 ± 2 1,12-dodecanedicarboxylic acid ng/m³ 0.9 ± 0.2 0 ± 0.2 0 ± 0.2 0.6 ± 0.2 Elaidic acid ng/m³ 0.5 ± 0.2 2.2 ± 0.4 2.4 ± 1 7.7 ± 0.2 Isostearic acid ng/m³ 0.2 ± 0.2 1.9 ± 0.2 2.9 ± 0.2 14.4 ± 0.8 Dehydroabietic acid ng/m³ 34.3 ± 14.5 0 ± 0.2 84.5 ± 19.2 42.6 ± 0.2 Pimaric acid ng/m³ 1.9 ± 0.2 3.9 ± 0.2 7.6 ± 0.3 26.2 ± 1.5 Sandaracopimaric acid ng/m³ 0.7 ± 0.2 1.5 ± 0.2 1.8 ± 0.2 7.4 ± 0.5 Abietic acid ng/m³ 0.2 ± 0.2 0.2 ± 0.2 1.2 ± 0.2 1.2 ± 0.2 Isopimaric acid ng/m³ 1.4 ± 0.2 1.4 ± 0.2 4.9 ± 0.5 5.5 ± 0.5 7-oxodehydroabietic acid ng/m³ 0 ± 0.2 0 ± 0.2 2 ± 0.2 1.9 ± 0.2 Heneicosanoic acid (c21) ng/m³ 1.7 ± 0.2 0 ± 0.2 0 ± 0.2 9.6 ± 0.6 Tricosanoic acid ng/m³ 0 ± 0.2 0.5 ± 0.2 0.8 ± 0.2 0.2 ± 0.2 Tetracosanoic acid (c24) ng/m³ 0 ± 0.2 0.6 ± 0.2 4.9 ± 0.2 2.4 ± 0.5 Cholesterol ng/m³ 11.8 ± 4.1 21.6 ± 2.6 18.2 ± 1.2 11.7 ± 0.2 b-sitosterol ng/m³ 1.4 ± 0.3 1.4 ± 0.3 0.8 ± 0.3 2 ± 0.2
HEI Research Report 184 McDonald Additional Materials I.B Available only on the Web 146
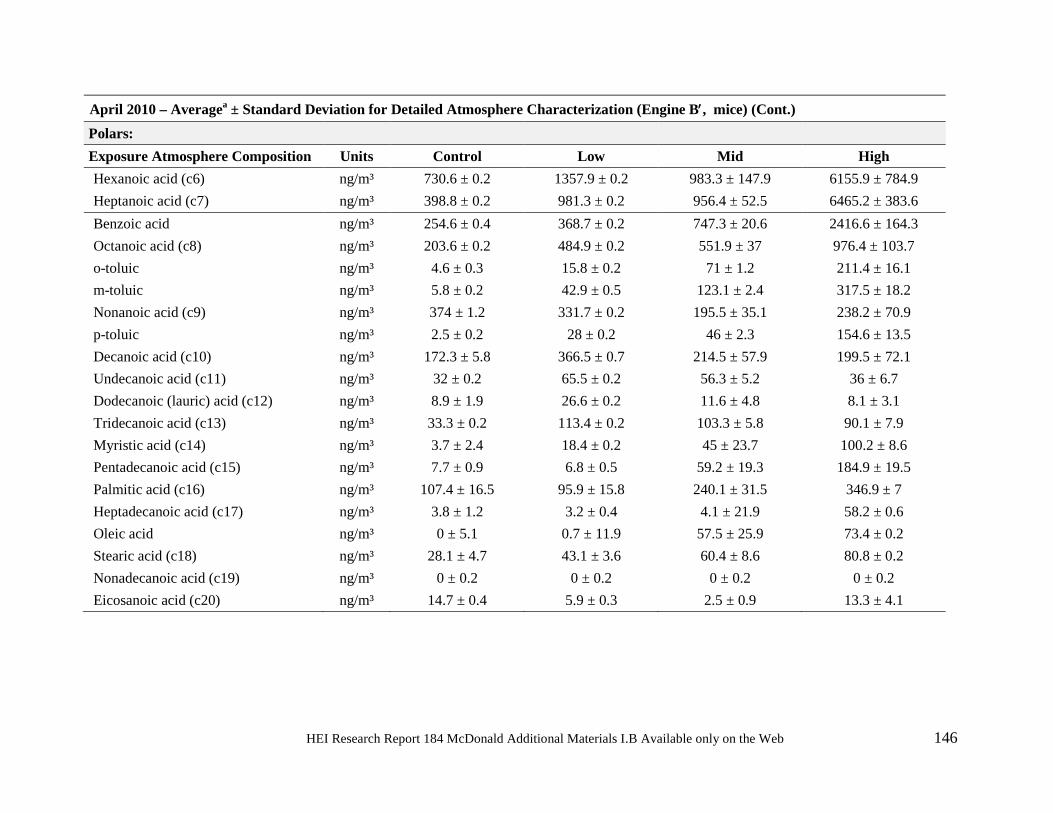
April 2010 – Averagea ± Standard Deviation for Detailed Atmosphere Characterization (Engine B′, mice) (Cont.) Polars: Exposure Atmosphere Composition Units Control Low Mid High Hexanoic acid (c6) ng/m³ 730.6 ± 0.2 1357.9 ± 0.2 983.3 ± 147.9 6155.9 ± 784.9 Heptanoic acid (c7) ng/m³ 398.8 ± 0.2 981.3 ± 0.2 956.4 ± 52.5 6465.2 ± 383.6 Benzoic acid ng/m³ 254.6 ± 0.4 368.7 ± 0.2 747.3 ± 20.6 2416.6 ± 164.3 Octanoic acid (c8) ng/m³ 203.6 ± 0.2 484.9 ± 0.2 551.9 ± 37 976.4 ± 103.7 o-toluic ng/m³ 4.6 ± 0.3 15.8 ± 0.2 71 ± 1.2 211.4 ± 16.1 m-toluic ng/m³ 5.8 ± 0.2 42.9 ± 0.5 123.1 ± 2.4 317.5 ± 18.2 Nonanoic acid (c9) ng/m³ 374 ± 1.2 331.7 ± 0.2 195.5 ± 35.1 238.2 ± 70.9 p-toluic ng/m³ 2.5 ± 0.2 28 ± 0.2 46 ± 2.3 154.6 ± 13.5 Decanoic acid (c10) ng/m³ 172.3 ± 5.8 366.5 ± 0.7 214.5 ± 57.9 199.5 ± 72.1 Undecanoic acid (c11) ng/m³ 32 ± 0.2 65.5 ± 0.2 56.3 ± 5.2 36 ± 6.7 Dodecanoic (lauric) acid (c12) ng/m³ 8.9 ± 1.9 26.6 ± 0.2 11.6 ± 4.8 8.1 ± 3.1 Tridecanoic acid (c13) ng/m³ 33.3 ± 0.2 113.4 ± 0.2 103.3 ± 5.8 90.1 ± 7.9 Myristic acid (c14) ng/m³ 3.7 ± 2.4 18.4 ± 0.2 45 ± 23.7 100.2 ± 8.6 Pentadecanoic acid (c15) ng/m³ 7.7 ± 0.9 6.8 ± 0.5 59.2 ± 19.3 184.9 ± 19.5 Palmitic acid (c16) ng/m³ 107.4 ± 16.5 95.9 ± 15.8 240.1 ± 31.5 346.9 ± 7 Heptadecanoic acid (c17) ng/m³ 3.8 ± 1.2 3.2 ± 0.4 4.1 ± 21.9 58.2 ± 0.6 Oleic acid ng/m³ 0 ± 5.1 0.7 ± 11.9 57.5 ± 25.9 73.4 ± 0.2 Stearic acid (c18) ng/m³ 28.1 ± 4.7 43.1 ± 3.6 60.4 ± 8.6 80.8 ± 0.2 Nonadecanoic acid (c19) ng/m³ 0 ± 0.2 0 ± 0.2 0 ± 0.2 0 ± 0.2 Eicosanoic acid (c20) ng/m³ 14.7 ± 0.4 5.9 ± 0.3 2.5 ± 0.9 13.3 ± 4.1
HEI Research Report 184 McDonald Additional Materials I.B Available only on the Web 147
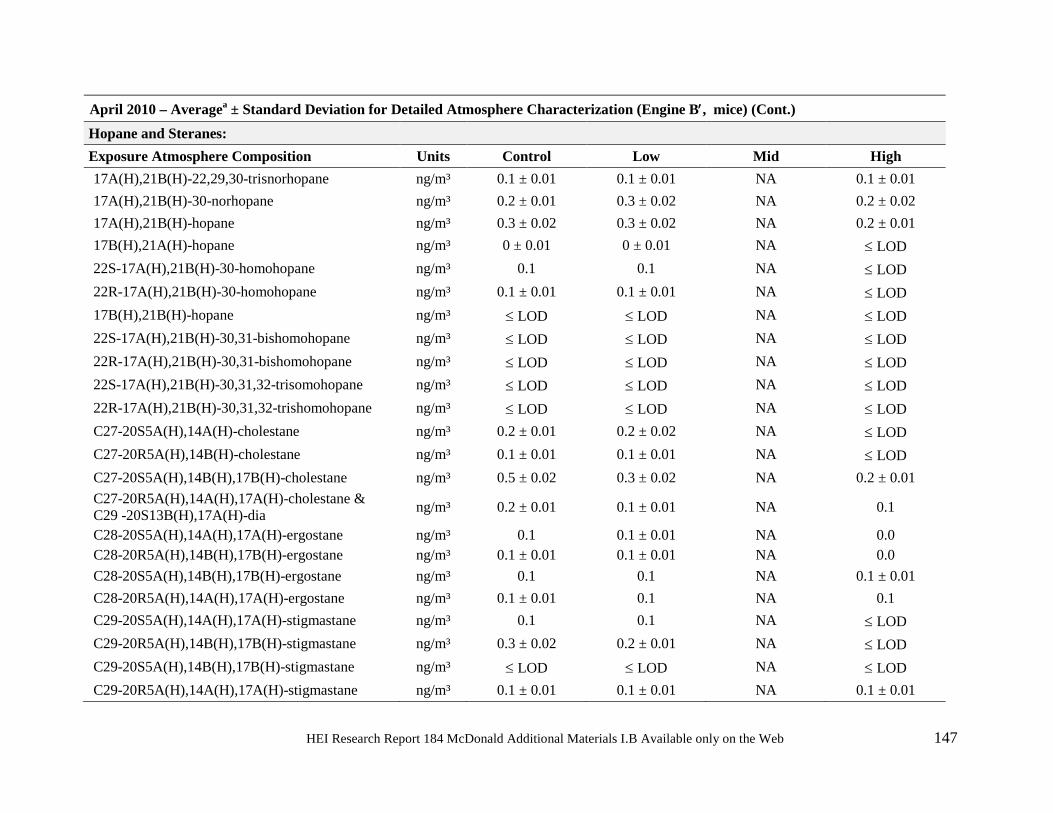
April 2010 – Averagea ± Standard Deviation for Detailed Atmosphere Characterization (Engine B′, mice) (Cont.) Hopane and Steranes: Exposure Atmosphere Composition Units Control Low Mid High 17A(H),21B(H)-22,29,30-trisnorhopane ng/m³ 0.1 ± 0.01 0.1 ± 0.01 NA 0.1 ± 0.01 17A(H),21B(H)-30-norhopane ng/m³ 0.2 ± 0.01 0.3 ± 0.02 NA 0.2 ± 0.02 17A(H),21B(H)-hopane ng/m³ 0.3 ± 0.02 0.3 ± 0.02 NA 0.2 ± 0.01 17B(H),21A(H)-hopane ng/m³ 0 ± 0.01 0 ± 0.01 NA ≤ LOD 22S-17A(H),21B(H)-30-homohopane ng/m³ 0.1 0.1 NA ≤ LOD 22R-17A(H),21B(H)-30-homohopane ng/m³ 0.1 ± 0.01 0.1 ± 0.01 NA ≤ LOD 17B(H),21B(H)-hopane ng/m³ ≤ LOD ≤ LOD NA ≤ LOD 22S-17A(H),21B(H)-30,31-bishomohopane ng/m³ ≤ LOD ≤ LOD NA ≤ LOD 22R-17A(H),21B(H)-30,31-bishomohopane ng/m³ ≤ LOD ≤ LOD NA ≤ LOD 22S-17A(H),21B(H)-30,31,32-trisomohopane ng/m³ ≤ LOD ≤ LOD NA ≤ LOD 22R-17A(H),21B(H)-30,31,32-trishomohopane ng/m³ ≤ LOD ≤ LOD NA ≤ LOD C27-20S5A(H),14A(H)-cholestane ng/m³ 0.2 ± 0.01 0.2 ± 0.02 NA ≤ LOD C27-20R5A(H),14B(H)-cholestane ng/m³ 0.1 ± 0.01 0.1 ± 0.01 NA ≤ LOD C27-20S5A(H),14B(H),17B(H)-cholestane ng/m³ 0.5 ± 0.02 0.3 ± 0.02 NA 0.2 ± 0.01 C27-20R5A(H),14A(H),17A(H)-cholestane & C29 -20S13B(H),17A(H)-dia ng/m³ 0.2 ± 0.01 0.1 ± 0.01 NA 0.1
C28-20S5A(H),14A(H),17A(H)-ergostane ng/m³ 0.1 0.1 ± 0.01 NA 0.0 C28-20R5A(H),14B(H),17B(H)-ergostane ng/m³ 0.1 ± 0.01 0.1 ± 0.01 NA 0.0 C28-20S5A(H),14B(H),17B(H)-ergostane ng/m³ 0.1 0.1 NA 0.1 ± 0.01 C28-20R5A(H),14A(H),17A(H)-ergostane ng/m³ 0.1 ± 0.01 0.1 NA 0.1 C29-20S5A(H),14A(H),17A(H)-stigmastane ng/m³ 0.1 0.1 NA ≤ LOD C29-20R5A(H),14B(H),17B(H)-stigmastane ng/m³ 0.3 ± 0.02 0.2 ± 0.01 NA ≤ LOD C29-20S5A(H),14B(H),17B(H)-stigmastane ng/m³ ≤ LOD ≤ LOD NA ≤ LOD C29-20R5A(H),14A(H),17A(H)-stigmastane ng/m³ 0.1 ± 0.01 0.1 ± 0.01 NA 0.1 ± 0.01
HEI Research Report 184 McDonald Additional Materials I.B Available only on the Web 148
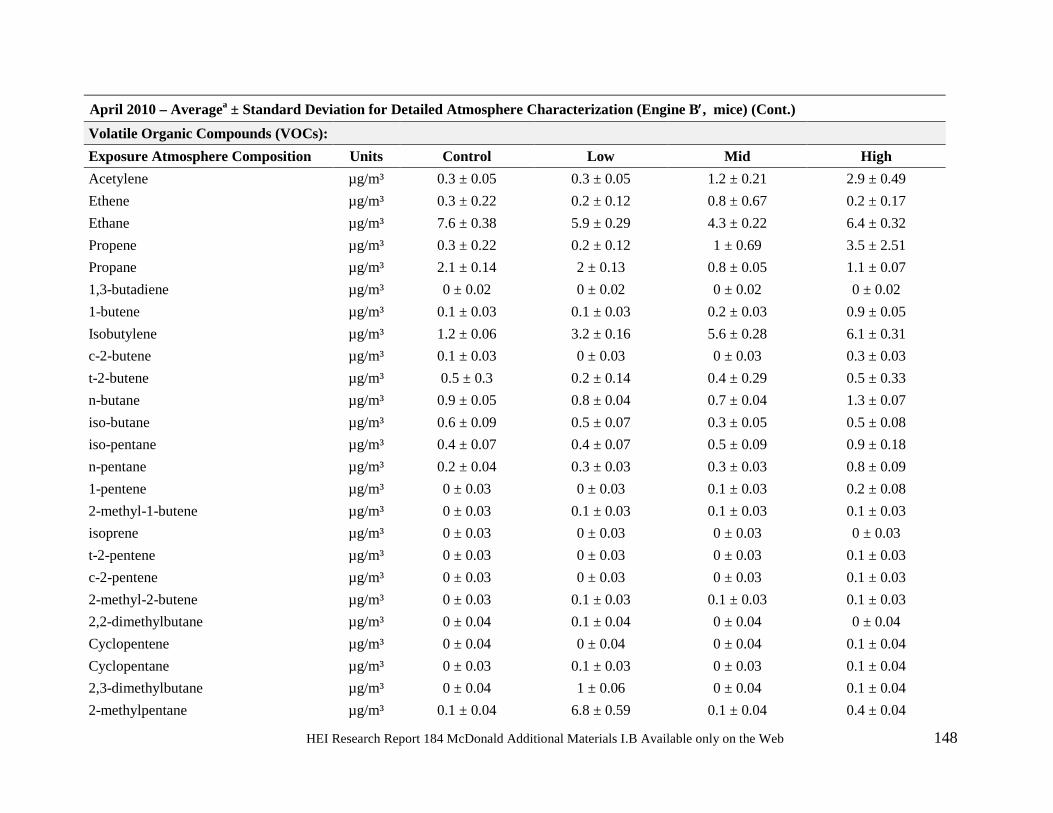
April 2010 – Averagea ± Standard Deviation for Detailed Atmosphere Characterization (Engine B′, mice) (Cont.) Volatile Organic Compounds (VOCs): Exposure Atmosphere Composition Units Control Low Mid High Acetylene µg/m³ 0.3 ± 0.05 0.3 ± 0.05 1.2 ± 0.21 2.9 ± 0.49 Ethene µg/m³ 0.3 ± 0.22 0.2 ± 0.12 0.8 ± 0.67 0.2 ± 0.17 Ethane µg/m³ 7.6 ± 0.38 5.9 ± 0.29 4.3 ± 0.22 6.4 ± 0.32 Propene µg/m³ 0.3 ± 0.22 0.2 ± 0.12 1 ± 0.69 3.5 ± 2.51 Propane µg/m³ 2.1 ± 0.14 2 ± 0.13 0.8 ± 0.05 1.1 ± 0.07 1,3-butadiene µg/m³ 0 ± 0.02 0 ± 0.02 0 ± 0.02 0 ± 0.02 1-butene µg/m³ 0.1 ± 0.03 0.1 ± 0.03 0.2 ± 0.03 0.9 ± 0.05 Isobutylene µg/m³ 1.2 ± 0.06 3.2 ± 0.16 5.6 ± 0.28 6.1 ± 0.31 c-2-butene µg/m³ 0.1 ± 0.03 0 ± 0.03 0 ± 0.03 0.3 ± 0.03 t-2-butene µg/m³ 0.5 ± 0.3 0.2 ± 0.14 0.4 ± 0.29 0.5 ± 0.33 n-butane µg/m³ 0.9 ± 0.05 0.8 ± 0.04 0.7 ± 0.04 1.3 ± 0.07 iso-butane µg/m³ 0.6 ± 0.09 0.5 ± 0.07 0.3 ± 0.05 0.5 ± 0.08 iso-pentane µg/m³ 0.4 ± 0.07 0.4 ± 0.07 0.5 ± 0.09 0.9 ± 0.18 n-pentane µg/m³ 0.2 ± 0.04 0.3 ± 0.03 0.3 ± 0.03 0.8 ± 0.09 1-pentene µg/m³ 0 ± 0.03 0 ± 0.03 0.1 ± 0.03 0.2 ± 0.08 2-methyl-1-butene µg/m³ 0 ± 0.03 0.1 ± 0.03 0.1 ± 0.03 0.1 ± 0.03 isoprene µg/m³ 0 ± 0.03 0 ± 0.03 0 ± 0.03 0 ± 0.03 t-2-pentene µg/m³ 0 ± 0.03 0 ± 0.03 0 ± 0.03 0.1 ± 0.03 c-2-pentene µg/m³ 0 ± 0.03 0 ± 0.03 0 ± 0.03 0.1 ± 0.03 2-methyl-2-butene µg/m³ 0 ± 0.03 0.1 ± 0.03 0.1 ± 0.03 0.1 ± 0.03 2,2-dimethylbutane µg/m³ 0 ± 0.04 0.1 ± 0.04 0 ± 0.04 0 ± 0.04 Cyclopentene µg/m³ 0 ± 0.04 0 ± 0.04 0 ± 0.04 0.1 ± 0.04 Cyclopentane µg/m³ 0 ± 0.03 0.1 ± 0.03 0 ± 0.03 0.1 ± 0.04 2,3-dimethylbutane µg/m³ 0 ± 0.04 1 ± 0.06 0 ± 0.04 0.1 ± 0.04 2-methylpentane µg/m³ 0.1 ± 0.04 6.8 ± 0.59 0.1 ± 0.04 0.4 ± 0.04
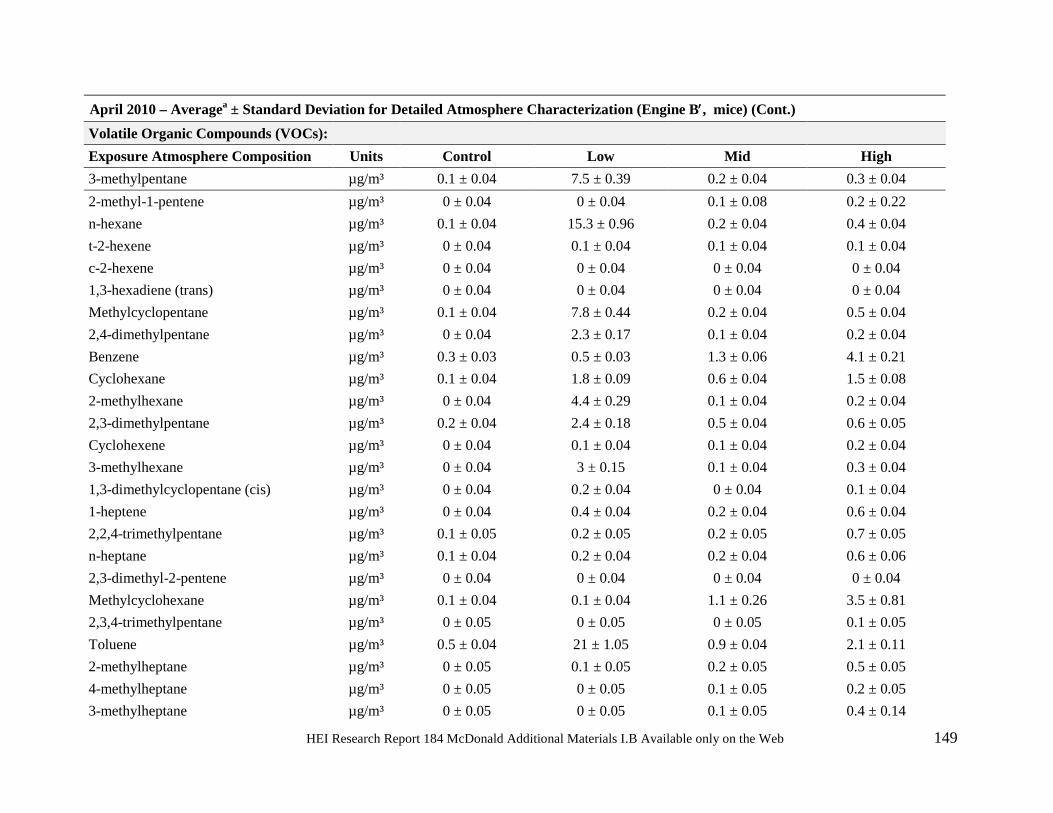
HEI Research Report 184 McDonald Additional Materials I.B Available only on the Web 149
April 2010 – Averagea ± Standard Deviation for Detailed Atmosphere Characterization (Engine B′, mice) (Cont.) Volatile Organic Compounds (VOCs): Exposure Atmosphere Composition Units Control Low Mid High 3-methylpentane µg/m³ 0.1 ± 0.04 7.5 ± 0.39 0.2 ± 0.04 0.3 ± 0.04 2-methyl-1-pentene µg/m³ 0 ± 0.04 0 ± 0.04 0.1 ± 0.08 0.2 ± 0.22 n-hexane µg/m³ 0.1 ± 0.04 15.3 ± 0.96 0.2 ± 0.04 0.4 ± 0.04 t-2-hexene µg/m³ 0 ± 0.04 0.1 ± 0.04 0.1 ± 0.04 0.1 ± 0.04 c-2-hexene µg/m³ 0 ± 0.04 0 ± 0.04 0 ± 0.04 0 ± 0.04 1,3-hexadiene (trans) µg/m³ 0 ± 0.04 0 ± 0.04 0 ± 0.04 0 ± 0.04 Methylcyclopentane µg/m³ 0.1 ± 0.04 7.8 ± 0.44 0.2 ± 0.04 0.5 ± 0.04 2,4-dimethylpentane µg/m³ 0 ± 0.04 2.3 ± 0.17 0.1 ± 0.04 0.2 ± 0.04 Benzene µg/m³ 0.3 ± 0.03 0.5 ± 0.03 1.3 ± 0.06 4.1 ± 0.21 Cyclohexane µg/m³ 0.1 ± 0.04 1.8 ± 0.09 0.6 ± 0.04 1.5 ± 0.08 2-methylhexane µg/m³ 0 ± 0.04 4.4 ± 0.29 0.1 ± 0.04 0.2 ± 0.04 2,3-dimethylpentane µg/m³ 0.2 ± 0.04 2.4 ± 0.18 0.5 ± 0.04 0.6 ± 0.05 Cyclohexene µg/m³ 0 ± 0.04 0.1 ± 0.04 0.1 ± 0.04 0.2 ± 0.04 3-methylhexane µg/m³ 0 ± 0.04 3 ± 0.15 0.1 ± 0.04 0.3 ± 0.04 1,3-dimethylcyclopentane (cis) µg/m³ 0 ± 0.04 0.2 ± 0.04 0 ± 0.04 0.1 ± 0.04 1-heptene µg/m³ 0 ± 0.04 0.4 ± 0.04 0.2 ± 0.04 0.6 ± 0.04 2,2,4-trimethylpentane µg/m³ 0.1 ± 0.05 0.2 ± 0.05 0.2 ± 0.05 0.7 ± 0.05 n-heptane µg/m³ 0.1 ± 0.04 0.2 ± 0.04 0.2 ± 0.04 0.6 ± 0.06 2,3-dimethyl-2-pentene µg/m³ 0 ± 0.04 0 ± 0.04 0 ± 0.04 0 ± 0.04 Methylcyclohexane µg/m³ 0.1 ± 0.04 0.1 ± 0.04 1.1 ± 0.26 3.5 ± 0.81 2,3,4-trimethylpentane µg/m³ 0 ± 0.05 0 ± 0.05 0 ± 0.05 0.1 ± 0.05 Toluene µg/m³ 0.5 ± 0.04 21 ± 1.05 0.9 ± 0.04 2.1 ± 0.11 2-methylheptane µg/m³ 0 ± 0.05 0.1 ± 0.05 0.2 ± 0.05 0.5 ± 0.05 4-methylheptane µg/m³ 0 ± 0.05 0 ± 0.05 0.1 ± 0.05 0.2 ± 0.05 3-methylheptane µg/m³ 0 ± 0.05 0 ± 0.05 0.1 ± 0.05 0.4 ± 0.14
HEI Research Report 184 McDonald Additional Materials I.B Available only on the Web 150
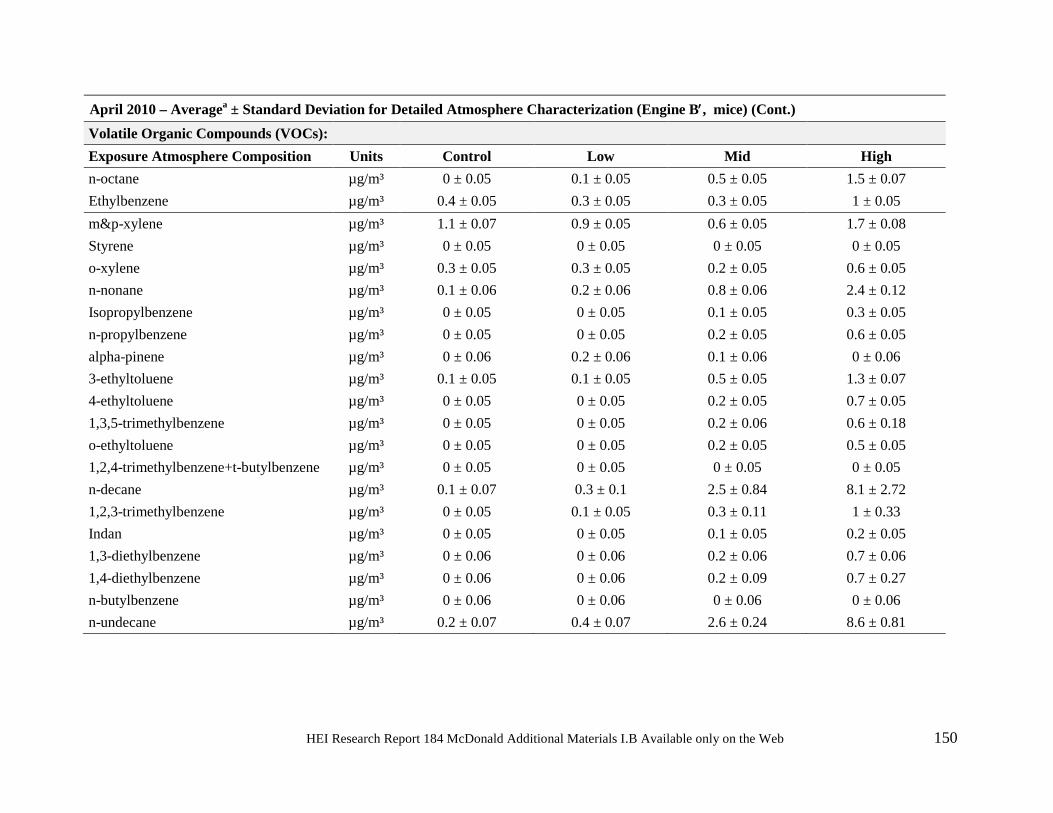
April 2010 – Averagea ± Standard Deviation for Detailed Atmosphere Characterization (Engine B′, mice) (Cont.) Volatile Organic Compounds (VOCs): Exposure Atmosphere Composition Units Control Low Mid High n-octane µg/m³ 0 ± 0.05 0.1 ± 0.05 0.5 ± 0.05 1.5 ± 0.07 Ethylbenzene µg/m³ 0.4 ± 0.05 0.3 ± 0.05 0.3 ± 0.05 1 ± 0.05 m&p-xylene µg/m³ 1.1 ± 0.07 0.9 ± 0.05 0.6 ± 0.05 1.7 ± 0.08 Styrene µg/m³ 0 ± 0.05 0 ± 0.05 0 ± 0.05 0 ± 0.05 o-xylene µg/m³ 0.3 ± 0.05 0.3 ± 0.05 0.2 ± 0.05 0.6 ± 0.05 n-nonane µg/m³ 0.1 ± 0.06 0.2 ± 0.06 0.8 ± 0.06 2.4 ± 0.12 Isopropylbenzene µg/m³ 0 ± 0.05 0 ± 0.05 0.1 ± 0.05 0.3 ± 0.05 n-propylbenzene µg/m³ 0 ± 0.05 0 ± 0.05 0.2 ± 0.05 0.6 ± 0.05 alpha-pinene µg/m³ 0 ± 0.06 0.2 ± 0.06 0.1 ± 0.06 0 ± 0.06 3-ethyltoluene µg/m³ 0.1 ± 0.05 0.1 ± 0.05 0.5 ± 0.05 1.3 ± 0.07 4-ethyltoluene µg/m³ 0 ± 0.05 0 ± 0.05 0.2 ± 0.05 0.7 ± 0.05 1,3,5-trimethylbenzene µg/m³ 0 ± 0.05 0 ± 0.05 0.2 ± 0.06 0.6 ± 0.18 o-ethyltoluene µg/m³ 0 ± 0.05 0 ± 0.05 0.2 ± 0.05 0.5 ± 0.05 1,2,4-trimethylbenzene+t-butylbenzene µg/m³ 0 ± 0.05 0 ± 0.05 0 ± 0.05 0 ± 0.05 n-decane µg/m³ 0.1 ± 0.07 0.3 ± 0.1 2.5 ± 0.84 8.1 ± 2.72 1,2,3-trimethylbenzene µg/m³ 0 ± 0.05 0.1 ± 0.05 0.3 ± 0.11 1 ± 0.33 Indan µg/m³ 0 ± 0.05 0 ± 0.05 0.1 ± 0.05 0.2 ± 0.05 1,3-diethylbenzene µg/m³ 0 ± 0.06 0 ± 0.06 0.2 ± 0.06 0.7 ± 0.06 1,4-diethylbenzene µg/m³ 0 ± 0.06 0 ± 0.06 0.2 ± 0.09 0.7 ± 0.27 n-butylbenzene µg/m³ 0 ± 0.06 0 ± 0.06 0 ± 0.06 0 ± 0.06 n-undecane µg/m³ 0.2 ± 0.07 0.4 ± 0.07 2.6 ± 0.24 8.6 ± 0.81

ACES: Phase 3B: Characterization of Exposure Atmospheres
Appendix F.
Sept 2010 – Average ± Standard Deviation for Detailed Atmosphere Characterization
HEI Research Report 184 McDonald Additional Materials I.B Available only on the Web 152
152
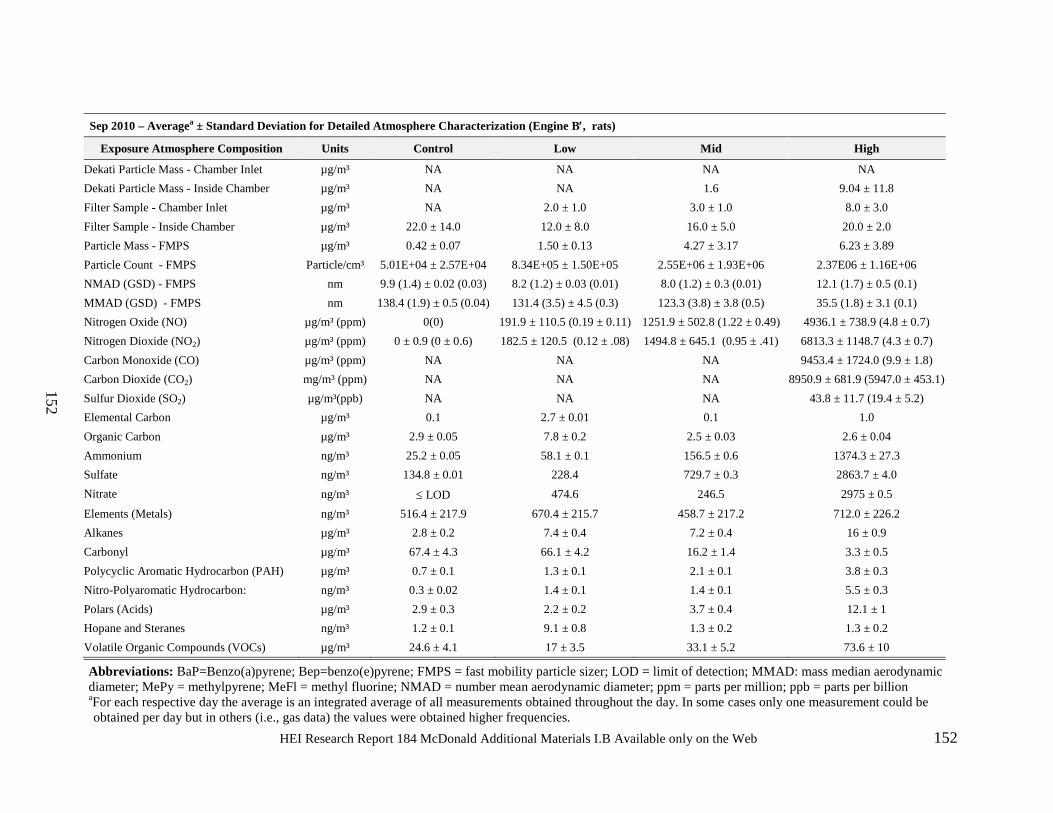
Sep 2010 – Averagea ± Standard Deviation for Detailed Atmosphere Characterization (Engine B′, rats)
Exposure Atmosphere Composition Units Control Low Mid High
Dekati Particle Mass - Chamber Inlet µg/m³ NA NA NA NA Dekati Particle Mass - Inside Chamber µg/m³ NA NA 1.6 9.04 ± 11.8 Filter Sample - Chamber Inlet µg/m³ NA 2.0 ± 1.0 3.0 ± 1.0 8.0 ± 3.0 Filter Sample - Inside Chamber µg/m³ 22.0 ± 14.0 12.0 ± 8.0 16.0 ± 5.0 20.0 ± 2.0 Particle Mass - FMPS µg/m³ 0.42 ± 0.07 1.50 ± 0.13 4.27 ± 3.17 6.23 ± 3.89 Particle Count - FMPS Particle/cm³ 5.01E+04 ± 2.57E+04 8.34E+05 ± 1.50E+05 2.55E+06 ± 1.93E+06 2.37E06 ± 1.16E+06 NMAD (GSD) - FMPS nm 9.9 (1.4) ± 0.02 (0.03) 8.2 (1.2) ± 0.03 (0.01) 8.0 (1.2) ± 0.3 (0.01) 12.1 (1.7) ± 0.5 (0.1) MMAD (GSD) - FMPS nm 138.4 (1.9) ± 0.5 (0.04) 131.4 (3.5) ± 4.5 (0.3) 123.3 (3.8) ± 3.8 (0.5) 35.5 (1.8) ± 3.1 (0.1) Nitrogen Oxide (NO) µg/m³ (ppm) 0(0) 191.9 ± 110.5 (0.19 ± 0.11) 1251.9 ± 502.8 (1.22 ± 0.49) 4936.1 ± 738.9 (4.8 ± 0.7) Nitrogen Dioxide (NO2) µg/m³ (ppm) 0 ± 0.9 (0 ± 0.6) 182.5 ± 120.5 (0.12 ± .08) 1494.8 ± 645.1 (0.95 ± .41) 6813.3 ± 1148.7 (4.3 ± 0.7) Carbon Monoxide (CO) µg/m³ (ppm) NA NA NA 9453.4 ± 1724.0 (9.9 ± 1.8) Carbon Dioxide (CO2) mg/m³ (ppm) NA NA NA 8950.9 ± 681.9 (5947.0 ± 453.1) Sulfur Dioxide (SO2) µg/m³(ppb) NA NA NA 43.8 ± 11.7 (19.4 ± 5.2) Elemental Carbon µg/m³ 0.1 2.7 ± 0.01 0.1 1.0 Organic Carbon µg/m³ 2.9 ± 0.05 7.8 ± 0.2 2.5 ± 0.03 2.6 ± 0.04 Ammonium ng/m³ 25.2 ± 0.05 58.1 ± 0.1 156.5 ± 0.6 1374.3 ± 27.3 Sulfate ng/m³ 134.8 ± 0.01 228.4 729.7 ± 0.3 2863.7 ± 4.0 Nitrate ng/m³ ≤ LOD 474.6 246.5 2975 ± 0.5 Elements (Metals) ng/m³ 516.4 ± 217.9 670.4 ± 215.7 458.7 ± 217.2 712.0 ± 226.2 Alkanes µg/m³ 2.8 ± 0.2 7.4 ± 0.4 7.2 ± 0.4 16 ± 0.9 Carbonyl µg/m³ 67.4 ± 4.3 66.1 ± 4.2 16.2 ± 1.4 3.3 ± 0.5 Polycyclic Aromatic Hydrocarbon (PAH) µg/m³ 0.7 ± 0.1 1.3 ± 0.1 2.1 ± 0.1 3.8 ± 0.3 Nitro-Polyaromatic Hydrocarbon: ng/m³ 0.3 ± 0.02 1.4 ± 0.1 1.4 ± 0.1 5.5 ± 0.3 Polars (Acids) µg/m³ 2.9 ± 0.3 2.2 ± 0.2 3.7 ± 0.4 12.1 ± 1 Hopane and Steranes ng/m³ 1.2 ± 0.1 9.1 ± 0.8 1.3 ± 0.2 1.3 ± 0.2 Volatile Organic Compounds (VOCs) µg/m³ 24.6 ± 4.1 17 ± 3.5 33.1 ± 5.2 73.6 ± 10
Abbreviations: BaP=Benzo(a)pyrene; Bep=benzo(e)pyrene; FMPS = fast mobility particle sizer; LOD = limit of detection; MMAD: mass median aerodynamic diameter; MePy = methylpyrene; MeFl = methyl fluorine; NMAD = number mean aerodynamic diameter; ppm = parts per million; ppb = parts per billion aFor each respective day the average is an integrated average of all measurements obtained throughout the day. In some cases only one measurement could be obtained per day but in others (i.e., gas data) the values were obtained higher frequencies.
HEI Research Report 184 McDonald Additional Materials I.B Available only on the Web 153
153
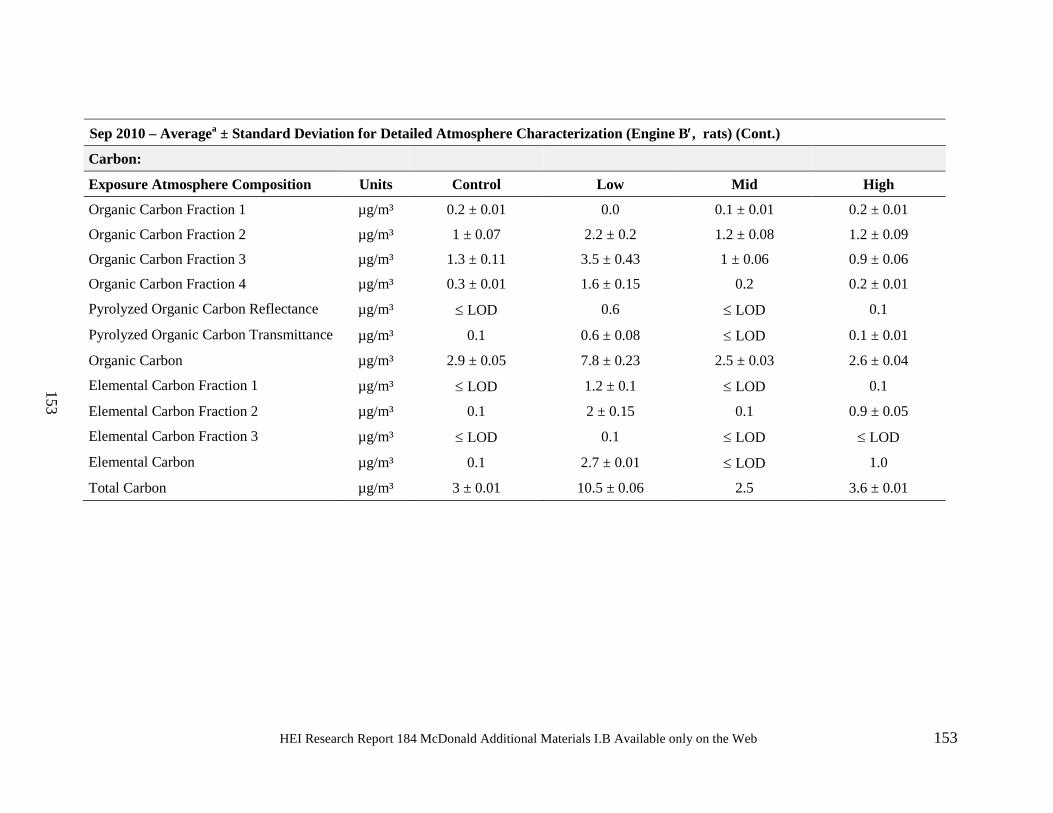
Sep 2010 – Averagea ± Standard Deviation for Detailed Atmosphere Characterization (Engine B′, rats) (Cont.)
Carbon: Exposure Atmosphere Composition Units Control Low Mid High
Organic Carbon Fraction 1 µg/m³ 0.2 ± 0.01 0.0 0.1 ± 0.01 0.2 ± 0.01 Organic Carbon Fraction 2 µg/m³ 1 ± 0.07 2.2 ± 0.2 1.2 ± 0.08 1.2 ± 0.09 Organic Carbon Fraction 3 µg/m³ 1.3 ± 0.11 3.5 ± 0.43 1 ± 0.06 0.9 ± 0.06 Organic Carbon Fraction 4 µg/m³ 0.3 ± 0.01 1.6 ± 0.15 0.2 0.2 ± 0.01 Pyrolyzed Organic Carbon Reflectance µg/m³ ≤ LOD 0.6 ≤ LOD 0.1 Pyrolyzed Organic Carbon Transmittance µg/m³ 0.1 0.6 ± 0.08 ≤ LOD 0.1 ± 0.01 Organic Carbon µg/m³ 2.9 ± 0.05 7.8 ± 0.23 2.5 ± 0.03 2.6 ± 0.04 Elemental Carbon Fraction 1 µg/m³ ≤ LOD 1.2 ± 0.1 ≤ LOD 0.1 Elemental Carbon Fraction 2 µg/m³ 0.1 2 ± 0.15 0.1 0.9 ± 0.05 Elemental Carbon Fraction 3 µg/m³ ≤ LOD 0.1 ≤ LOD ≤ LOD Elemental Carbon µg/m³ 0.1 2.7 ± 0.01 ≤ LOD 1.0 Total Carbon µg/m³ 3 ± 0.01 10.5 ± 0.06 2.5 3.6 ± 0.01
HEI Research Report 184 McDonald Additional Materials I.B Available only on the Web 154
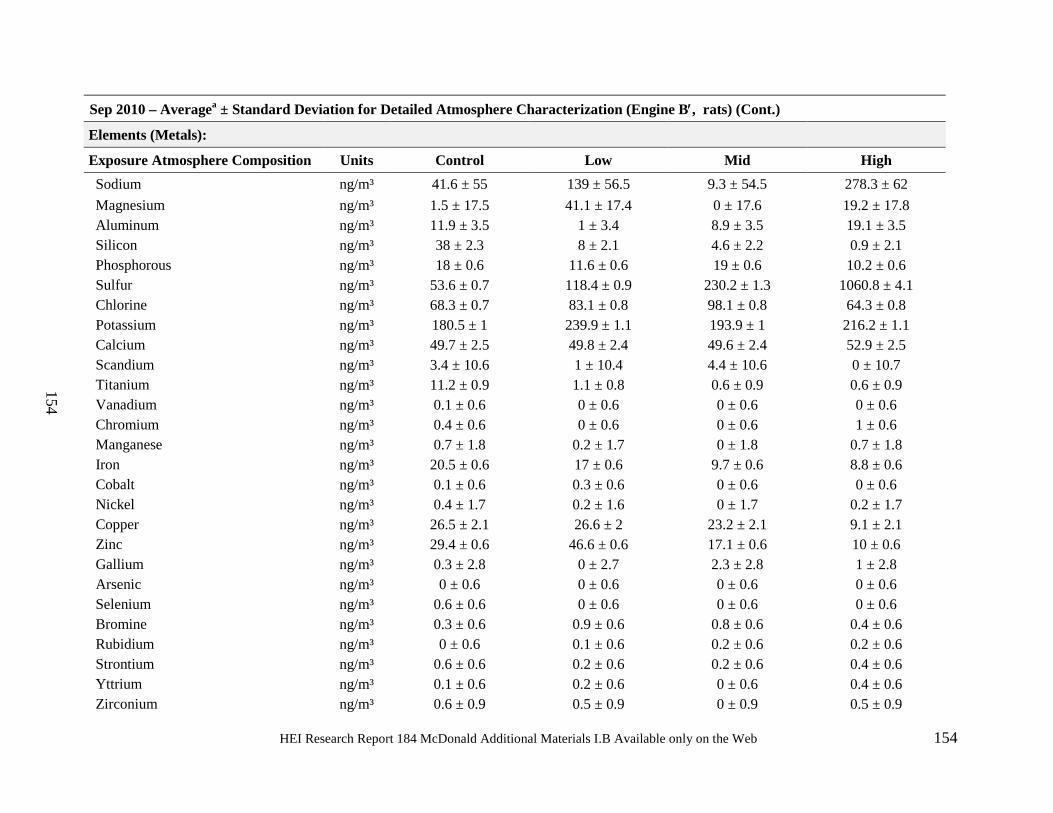
154
Sep 2010 – Averagea ± Standard Deviation for Detailed Atmosphere Characterization (Engine B′, rats) (Cont.)
Elements (Metals): Exposure Atmosphere Composition Units Control Low Mid High Sodium ng/m³ 41.6 ± 55 139 ± 56.5 9.3 ± 54.5 278.3 ± 62 Magnesium ng/m³ 1.5 ± 17.5 41.1 ± 17.4 0 ± 17.6 19.2 ± 17.8 Aluminum ng/m³ 11.9 ± 3.5 1 ± 3.4 8.9 ± 3.5 19.1 ± 3.5 Silicon ng/m³ 38 ± 2.3 8 ± 2.1 4.6 ± 2.2 0.9 ± 2.1 Phosphorous ng/m³ 18 ± 0.6 11.6 ± 0.6 19 ± 0.6 10.2 ± 0.6 Sulfur ng/m³ 53.6 ± 0.7 118.4 ± 0.9 230.2 ± 1.3 1060.8 ± 4.1 Chlorine ng/m³ 68.3 ± 0.7 83.1 ± 0.8 98.1 ± 0.8 64.3 ± 0.8 Potassium ng/m³ 180.5 ± 1 239.9 ± 1.1 193.9 ± 1 216.2 ± 1.1 Calcium ng/m³ 49.7 ± 2.5 49.8 ± 2.4 49.6 ± 2.4 52.9 ± 2.5 Scandium ng/m³ 3.4 ± 10.6 1 ± 10.4 4.4 ± 10.6 0 ± 10.7 Titanium ng/m³ 11.2 ± 0.9 1.1 ± 0.8 0.6 ± 0.9 0.6 ± 0.9 Vanadium ng/m³ 0.1 ± 0.6 0 ± 0.6 0 ± 0.6 0 ± 0.6 Chromium ng/m³ 0.4 ± 0.6 0 ± 0.6 0 ± 0.6 1 ± 0.6 Manganese ng/m³ 0.7 ± 1.8 0.2 ± 1.7 0 ± 1.8 0.7 ± 1.8 Iron ng/m³ 20.5 ± 0.6 17 ± 0.6 9.7 ± 0.6 8.8 ± 0.6 Cobalt ng/m³ 0.1 ± 0.6 0.3 ± 0.6 0 ± 0.6 0 ± 0.6 Nickel ng/m³ 0.4 ± 1.7 0.2 ± 1.6 0 ± 1.7 0.2 ± 1.7 Copper ng/m³ 26.5 ± 2.1 26.6 ± 2 23.2 ± 2.1 9.1 ± 2.1 Zinc ng/m³ 29.4 ± 0.6 46.6 ± 0.6 17.1 ± 0.6 10 ± 0.6 Gallium ng/m³ 0.3 ± 2.8 0 ± 2.7 2.3 ± 2.8 1 ± 2.8 Arsenic ng/m³ 0 ± 0.6 0 ± 0.6 0 ± 0.6 0 ± 0.6 Selenium ng/m³ 0.6 ± 0.6 0 ± 0.6 0 ± 0.6 0 ± 0.6 Bromine ng/m³ 0.3 ± 0.6 0.9 ± 0.6 0.8 ± 0.6 0.4 ± 0.6 Rubidium ng/m³ 0 ± 0.6 0.1 ± 0.6 0.2 ± 0.6 0.2 ± 0.6 Strontium ng/m³ 0.6 ± 0.6 0.2 ± 0.6 0.2 ± 0.6 0.4 ± 0.6 Yttrium ng/m³ 0.1 ± 0.6 0.2 ± 0.6 0 ± 0.6 0.4 ± 0.6 Zirconium ng/m³ 0.6 ± 0.9 0.5 ± 0.9 0 ± 0.9 0.5 ± 0.9
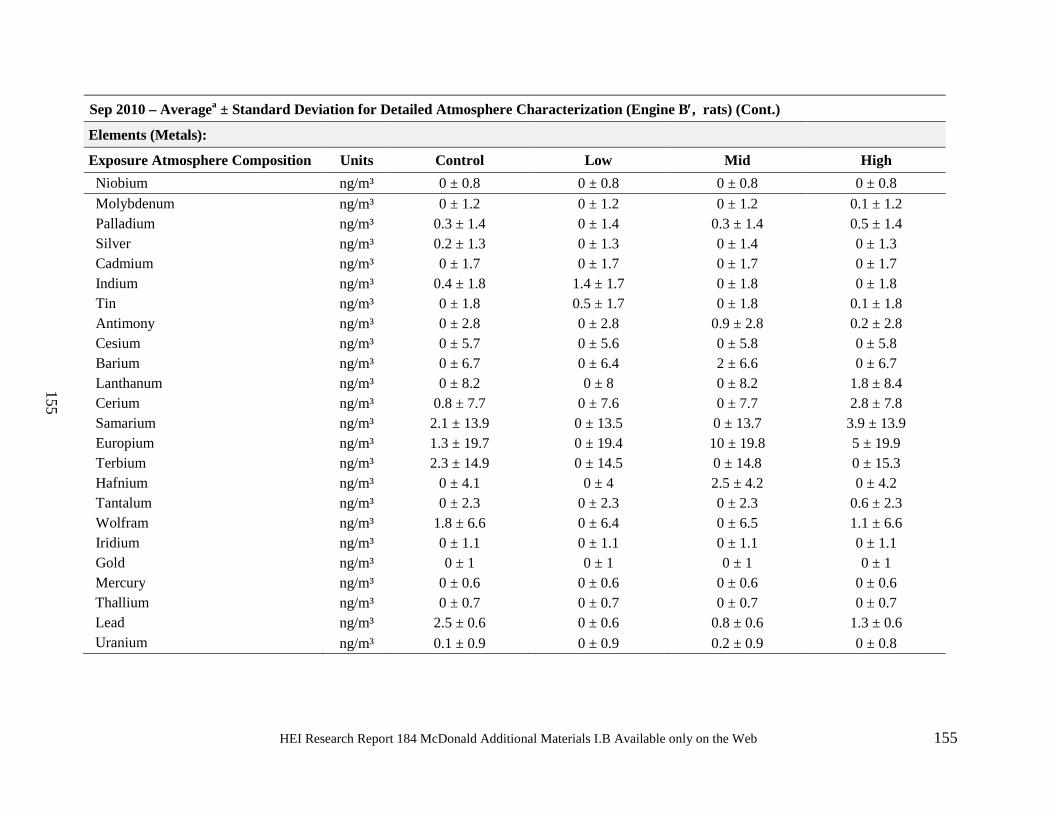
HEI Research Report 184 McDonald Additional Materials I.B Available only on the Web 155
155
Sep 2010 – Averagea ± Standard Deviation for Detailed Atmosphere Characterization (Engine B′, rats) (Cont.)
Elements (Metals): Exposure Atmosphere Composition Units Control Low Mid High Niobium ng/m³ 0 ± 0.8 0 ± 0.8 0 ± 0.8 0 ± 0.8 Molybdenum ng/m³ 0 ± 1.2 0 ± 1.2 0 ± 1.2 0.1 ± 1.2 Palladium ng/m³ 0.3 ± 1.4 0 ± 1.4 0.3 ± 1.4 0.5 ± 1.4 Silver ng/m³ 0.2 ± 1.3 0 ± 1.3 0 ± 1.4 0 ± 1.3 Cadmium ng/m³ 0 ± 1.7 0 ± 1.7 0 ± 1.7 0 ± 1.7 Indium ng/m³ 0.4 ± 1.8 1.4 ± 1.7 0 ± 1.8 0 ± 1.8 Tin ng/m³ 0 ± 1.8 0.5 ± 1.7 0 ± 1.8 0.1 ± 1.8 Antimony ng/m³ 0 ± 2.8 0 ± 2.8 0.9 ± 2.8 0.2 ± 2.8 Cesium ng/m³ 0 ± 5.7 0 ± 5.6 0 ± 5.8 0 ± 5.8 Barium ng/m³ 0 ± 6.7 0 ± 6.4 2 ± 6.6 0 ± 6.7 Lanthanum ng/m³ 0 ± 8.2 0 ± 8 0 ± 8.2 1.8 ± 8.4 Cerium ng/m³ 0.8 ± 7.7 0 ± 7.6 0 ± 7.7 2.8 ± 7.8 Samarium ng/m³ 2.1 ± 13.9 0 ± 13.5 0 ± 13.7 3.9 ± 13.9 Europium ng/m³ 1.3 ± 19.7 0 ± 19.4 10 ± 19.8 5 ± 19.9 Terbium ng/m³ 2.3 ± 14.9 0 ± 14.5 0 ± 14.8 0 ± 15.3 Hafnium ng/m³ 0 ± 4.1 0 ± 4 2.5 ± 4.2 0 ± 4.2 Tantalum ng/m³ 0 ± 2.3 0 ± 2.3 0 ± 2.3 0.6 ± 2.3 Wolfram ng/m³ 1.8 ± 6.6 0 ± 6.4 0 ± 6.5 1.1 ± 6.6 Iridium ng/m³ 0 ± 1.1 0 ± 1.1 0 ± 1.1 0 ± 1.1 Gold ng/m³ 0 ± 1 0 ± 1 0 ± 1 0 ± 1 Mercury ng/m³ 0 ± 0.6 0 ± 0.6 0 ± 0.6 0 ± 0.6 Thallium ng/m³ 0 ± 0.7 0 ± 0.7 0 ± 0.7 0 ± 0.7 Lead ng/m³ 2.5 ± 0.6 0 ± 0.6 0.8 ± 0.6 1.3 ± 0.6 Uranium ng/m³ 0.1 ± 0.9 0 ± 0.9 0.2 ± 0.9 0 ± 0.8
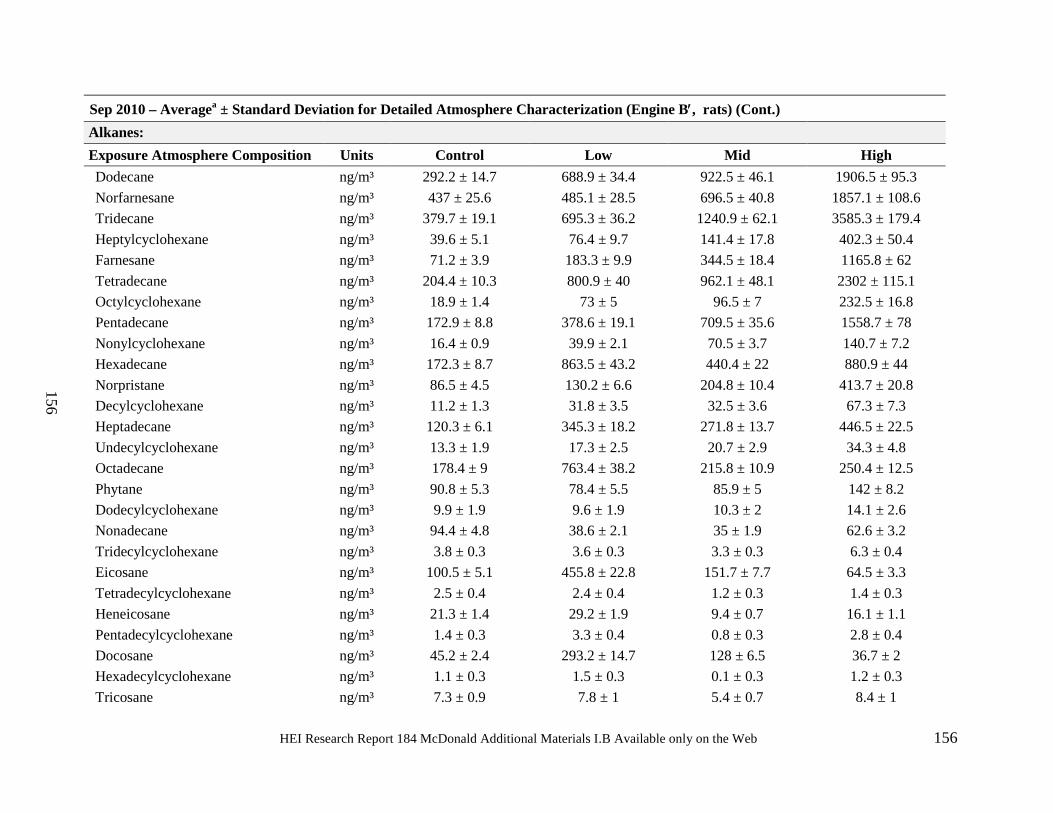
HEI Research Report 184 McDonald Additional Materials I.B Available only on the Web 156
156
Sep 2010 – Averagea ± Standard Deviation for Detailed Atmosphere Characterization (Engine B′, rats) (Cont.) Alkanes: Exposure Atmosphere Composition Units Control Low Mid High Dodecane ng/m³ 292.2 ± 14.7 688.9 ± 34.4 922.5 ± 46.1 1906.5 ± 95.3 Norfarnesane ng/m³ 437 ± 25.6 485.1 ± 28.5 696.5 ± 40.8 1857.1 ± 108.6 Tridecane ng/m³ 379.7 ± 19.1 695.3 ± 36.2 1240.9 ± 62.1 3585.3 ± 179.4 Heptylcyclohexane ng/m³ 39.6 ± 5.1 76.4 ± 9.7 141.4 ± 17.8 402.3 ± 50.4 Farnesane ng/m³ 71.2 ± 3.9 183.3 ± 9.9 344.5 ± 18.4 1165.8 ± 62 Tetradecane ng/m³ 204.4 ± 10.3 800.9 ± 40 962.1 ± 48.1 2302 ± 115.1 Octylcyclohexane ng/m³ 18.9 ± 1.4 73 ± 5 96.5 ± 7 232.5 ± 16.8 Pentadecane ng/m³ 172.9 ± 8.8 378.6 ± 19.1 709.5 ± 35.6 1558.7 ± 78 Nonylcyclohexane ng/m³ 16.4 ± 0.9 39.9 ± 2.1 70.5 ± 3.7 140.7 ± 7.2 Hexadecane ng/m³ 172.3 ± 8.7 863.5 ± 43.2 440.4 ± 22 880.9 ± 44 Norpristane ng/m³ 86.5 ± 4.5 130.2 ± 6.6 204.8 ± 10.4 413.7 ± 20.8 Decylcyclohexane ng/m³ 11.2 ± 1.3 31.8 ± 3.5 32.5 ± 3.6 67.3 ± 7.3 Heptadecane ng/m³ 120.3 ± 6.1 345.3 ± 18.2 271.8 ± 13.7 446.5 ± 22.5 Undecylcyclohexane ng/m³ 13.3 ± 1.9 17.3 ± 2.5 20.7 ± 2.9 34.3 ± 4.8 Octadecane ng/m³ 178.4 ± 9 763.4 ± 38.2 215.8 ± 10.9 250.4 ± 12.5 Phytane ng/m³ 90.8 ± 5.3 78.4 ± 5.5 85.9 ± 5 142 ± 8.2 Dodecylcyclohexane ng/m³ 9.9 ± 1.9 9.6 ± 1.9 10.3 ± 2 14.1 ± 2.6 Nonadecane ng/m³ 94.4 ± 4.8 38.6 ± 2.1 35 ± 1.9 62.6 ± 3.2 Tridecylcyclohexane ng/m³ 3.8 ± 0.3 3.6 ± 0.3 3.3 ± 0.3 6.3 ± 0.4 Eicosane ng/m³ 100.5 ± 5.1 455.8 ± 22.8 151.7 ± 7.7 64.5 ± 3.3 Tetradecylcyclohexane ng/m³ 2.5 ± 0.4 2.4 ± 0.4 1.2 ± 0.3 1.4 ± 0.3 Heneicosane ng/m³ 21.3 ± 1.4 29.2 ± 1.9 9.4 ± 0.7 16.1 ± 1.1 Pentadecylcyclohexane ng/m³ 1.4 ± 0.3 3.3 ± 0.4 0.8 ± 0.3 2.8 ± 0.4 Docosane ng/m³ 45.2 ± 2.4 293.2 ± 14.7 128 ± 6.5 36.7 ± 2 Hexadecylcyclohexane ng/m³ 1.1 ± 0.3 1.5 ± 0.3 0.1 ± 0.3 1.2 ± 0.3 Tricosane ng/m³ 7.3 ± 0.9 7.8 ± 1 5.4 ± 0.7 8.4 ± 1
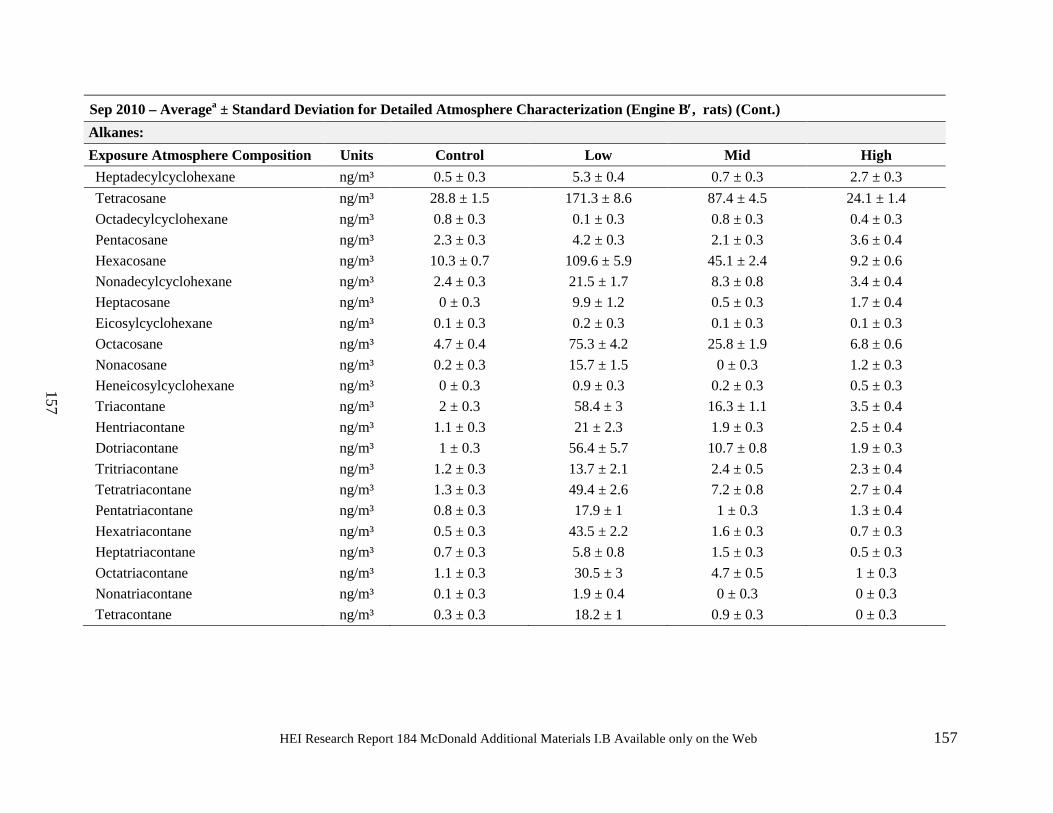
HEI Research Report 184 McDonald Additional Materials I.B Available only on the Web 157
157
Sep 2010 – Averagea ± Standard Deviation for Detailed Atmosphere Characterization (Engine B′, rats) (Cont.) Alkanes: Exposure Atmosphere Composition Units Control Low Mid High Heptadecylcyclohexane ng/m³ 0.5 ± 0.3 5.3 ± 0.4 0.7 ± 0.3 2.7 ± 0.3 Tetracosane ng/m³ 28.8 ± 1.5 171.3 ± 8.6 87.4 ± 4.5 24.1 ± 1.4 Octadecylcyclohexane ng/m³ 0.8 ± 0.3 0.1 ± 0.3 0.8 ± 0.3 0.4 ± 0.3 Pentacosane ng/m³ 2.3 ± 0.3 4.2 ± 0.3 2.1 ± 0.3 3.6 ± 0.4 Hexacosane ng/m³ 10.3 ± 0.7 109.6 ± 5.9 45.1 ± 2.4 9.2 ± 0.6 Nonadecylcyclohexane ng/m³ 2.4 ± 0.3 21.5 ± 1.7 8.3 ± 0.8 3.4 ± 0.4 Heptacosane ng/m³ 0 ± 0.3 9.9 ± 1.2 0.5 ± 0.3 1.7 ± 0.4 Eicosylcyclohexane ng/m³ 0.1 ± 0.3 0.2 ± 0.3 0.1 ± 0.3 0.1 ± 0.3 Octacosane ng/m³ 4.7 ± 0.4 75.3 ± 4.2 25.8 ± 1.9 6.8 ± 0.6 Nonacosane ng/m³ 0.2 ± 0.3 15.7 ± 1.5 0 ± 0.3 1.2 ± 0.3 Heneicosylcyclohexane ng/m³ 0 ± 0.3 0.9 ± 0.3 0.2 ± 0.3 0.5 ± 0.3 Triacontane ng/m³ 2 ± 0.3 58.4 ± 3 16.3 ± 1.1 3.5 ± 0.4 Hentriacontane ng/m³ 1.1 ± 0.3 21 ± 2.3 1.9 ± 0.3 2.5 ± 0.4 Dotriacontane ng/m³ 1 ± 0.3 56.4 ± 5.7 10.7 ± 0.8 1.9 ± 0.3 Tritriacontane ng/m³ 1.2 ± 0.3 13.7 ± 2.1 2.4 ± 0.5 2.3 ± 0.4 Tetratriacontane ng/m³ 1.3 ± 0.3 49.4 ± 2.6 7.2 ± 0.8 2.7 ± 0.4 Pentatriacontane ng/m³ 0.8 ± 0.3 17.9 ± 1 1 ± 0.3 1.3 ± 0.4 Hexatriacontane ng/m³ 0.5 ± 0.3 43.5 ± 2.2 1.6 ± 0.3 0.7 ± 0.3 Heptatriacontane ng/m³ 0.7 ± 0.3 5.8 ± 0.8 1.5 ± 0.3 0.5 ± 0.3 Octatriacontane ng/m³ 1.1 ± 0.3 30.5 ± 3 4.7 ± 0.5 1 ± 0.3 Nonatriacontane ng/m³ 0.1 ± 0.3 1.9 ± 0.4 0 ± 0.3 0 ± 0.3 Tetracontane ng/m³ 0.3 ± 0.3 18.2 ± 1 0.9 ± 0.3 0 ± 0.3
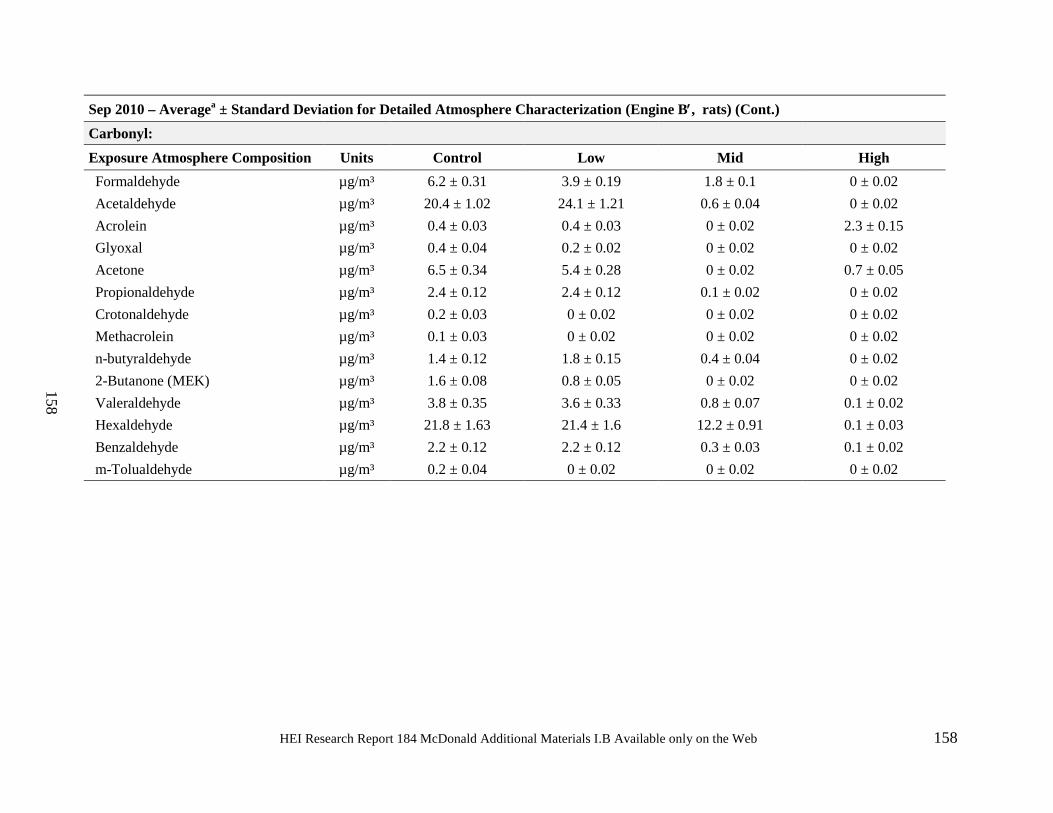
HEI Research Report 184 McDonald Additional Materials I.B Available only on the Web 158
158
Sep 2010 – Averagea ± Standard Deviation for Detailed Atmosphere Characterization (Engine B′, rats) (Cont.) Carbonyl: Exposure Atmosphere Composition Units Control Low Mid High Formaldehyde µg/m³ 6.2 ± 0.31 3.9 ± 0.19 1.8 ± 0.1 0 ± 0.02 Acetaldehyde µg/m³ 20.4 ± 1.02 24.1 ± 1.21 0.6 ± 0.04 0 ± 0.02 Acrolein µg/m³ 0.4 ± 0.03 0.4 ± 0.03 0 ± 0.02 2.3 ± 0.15 Glyoxal µg/m³ 0.4 ± 0.04 0.2 ± 0.02 0 ± 0.02 0 ± 0.02 Acetone µg/m³ 6.5 ± 0.34 5.4 ± 0.28 0 ± 0.02 0.7 ± 0.05 Propionaldehyde µg/m³ 2.4 ± 0.12 2.4 ± 0.12 0.1 ± 0.02 0 ± 0.02 Crotonaldehyde µg/m³ 0.2 ± 0.03 0 ± 0.02 0 ± 0.02 0 ± 0.02 Methacrolein µg/m³ 0.1 ± 0.03 0 ± 0.02 0 ± 0.02 0 ± 0.02 n-butyraldehyde µg/m³ 1.4 ± 0.12 1.8 ± 0.15 0.4 ± 0.04 0 ± 0.02 2-Butanone (MEK) µg/m³ 1.6 ± 0.08 0.8 ± 0.05 0 ± 0.02 0 ± 0.02 Valeraldehyde µg/m³ 3.8 ± 0.35 3.6 ± 0.33 0.8 ± 0.07 0.1 ± 0.02 Hexaldehyde µg/m³ 21.8 ± 1.63 21.4 ± 1.6 12.2 ± 0.91 0.1 ± 0.03 Benzaldehyde µg/m³ 2.2 ± 0.12 2.2 ± 0.12 0.3 ± 0.03 0.1 ± 0.02 m-Tolualdehyde µg/m³ 0.2 ± 0.04 0 ± 0.02 0 ± 0.02 0 ± 0.02
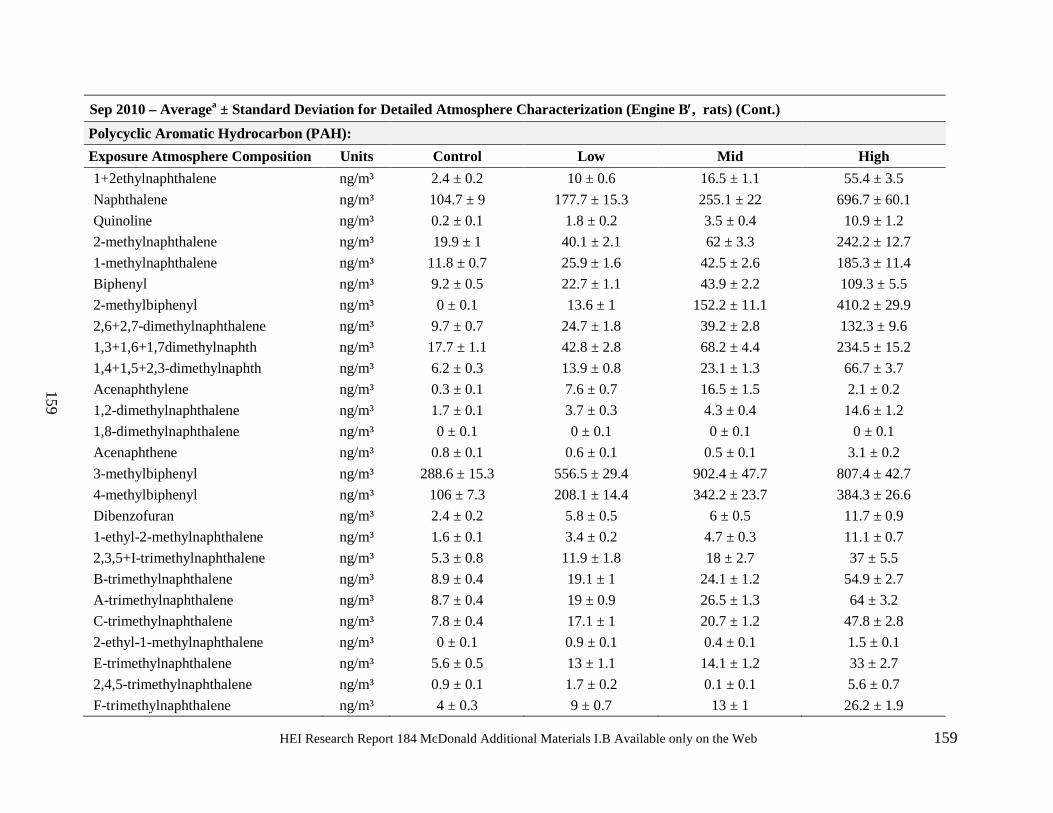
HEI Research Report 184 McDonald Additional Materials I.B Available only on the Web 159
159
Sep 2010 – Averagea ± Standard Deviation for Detailed Atmosphere Characterization (Engine B′, rats) (Cont.) Polycyclic Aromatic Hydrocarbon (PAH): Exposure Atmosphere Composition Units Control Low Mid High 1+2ethylnaphthalene ng/m³ 2.4 ± 0.2 10 ± 0.6 16.5 ± 1.1 55.4 ± 3.5 Naphthalene ng/m³ 104.7 ± 9 177.7 ± 15.3 255.1 ± 22 696.7 ± 60.1 Quinoline ng/m³ 0.2 ± 0.1 1.8 ± 0.2 3.5 ± 0.4 10.9 ± 1.2 2-methylnaphthalene ng/m³ 19.9 ± 1 40.1 ± 2.1 62 ± 3.3 242.2 ± 12.7 1-methylnaphthalene ng/m³ 11.8 ± 0.7 25.9 ± 1.6 42.5 ± 2.6 185.3 ± 11.4 Biphenyl ng/m³ 9.2 ± 0.5 22.7 ± 1.1 43.9 ± 2.2 109.3 ± 5.5 2-methylbiphenyl ng/m³ 0 ± 0.1 13.6 ± 1 152.2 ± 11.1 410.2 ± 29.9 2,6+2,7-dimethylnaphthalene ng/m³ 9.7 ± 0.7 24.7 ± 1.8 39.2 ± 2.8 132.3 ± 9.6 1,3+1,6+1,7dimethylnaphth ng/m³ 17.7 ± 1.1 42.8 ± 2.8 68.2 ± 4.4 234.5 ± 15.2 1,4+1,5+2,3-dimethylnaphth ng/m³ 6.2 ± 0.3 13.9 ± 0.8 23.1 ± 1.3 66.7 ± 3.7 Acenaphthylene ng/m³ 0.3 ± 0.1 7.6 ± 0.7 16.5 ± 1.5 2.1 ± 0.2 1,2-dimethylnaphthalene ng/m³ 1.7 ± 0.1 3.7 ± 0.3 4.3 ± 0.4 14.6 ± 1.2 1,8-dimethylnaphthalene ng/m³ 0 ± 0.1 0 ± 0.1 0 ± 0.1 0 ± 0.1 Acenaphthene ng/m³ 0.8 ± 0.1 0.6 ± 0.1 0.5 ± 0.1 3.1 ± 0.2 3-methylbiphenyl ng/m³ 288.6 ± 15.3 556.5 ± 29.4 902.4 ± 47.7 807.4 ± 42.7 4-methylbiphenyl ng/m³ 106 ± 7.3 208.1 ± 14.4 342.2 ± 23.7 384.3 ± 26.6 Dibenzofuran ng/m³ 2.4 ± 0.2 5.8 ± 0.5 6 ± 0.5 11.7 ± 0.9 1-ethyl-2-methylnaphthalene ng/m³ 1.6 ± 0.1 3.4 ± 0.2 4.7 ± 0.3 11.1 ± 0.7 2,3,5+I-trimethylnaphthalene ng/m³ 5.3 ± 0.8 11.9 ± 1.8 18 ± 2.7 37 ± 5.5 B-trimethylnaphthalene ng/m³ 8.9 ± 0.4 19.1 ± 1 24.1 ± 1.2 54.9 ± 2.7 A-trimethylnaphthalene ng/m³ 8.7 ± 0.4 19 ± 0.9 26.5 ± 1.3 64 ± 3.2 C-trimethylnaphthalene ng/m³ 7.8 ± 0.4 17.1 ± 1 20.7 ± 1.2 47.8 ± 2.8 2-ethyl-1-methylnaphthalene ng/m³ 0 ± 0.1 0.9 ± 0.1 0.4 ± 0.1 1.5 ± 0.1 E-trimethylnaphthalene ng/m³ 5.6 ± 0.5 13 ± 1.1 14.1 ± 1.2 33 ± 2.7 2,4,5-trimethylnaphthalene ng/m³ 0.9 ± 0.1 1.7 ± 0.2 0.1 ± 0.1 5.6 ± 0.7 F-trimethylnaphthalene ng/m³ 4 ± 0.3 9 ± 0.7 13 ± 1 26.2 ± 1.9
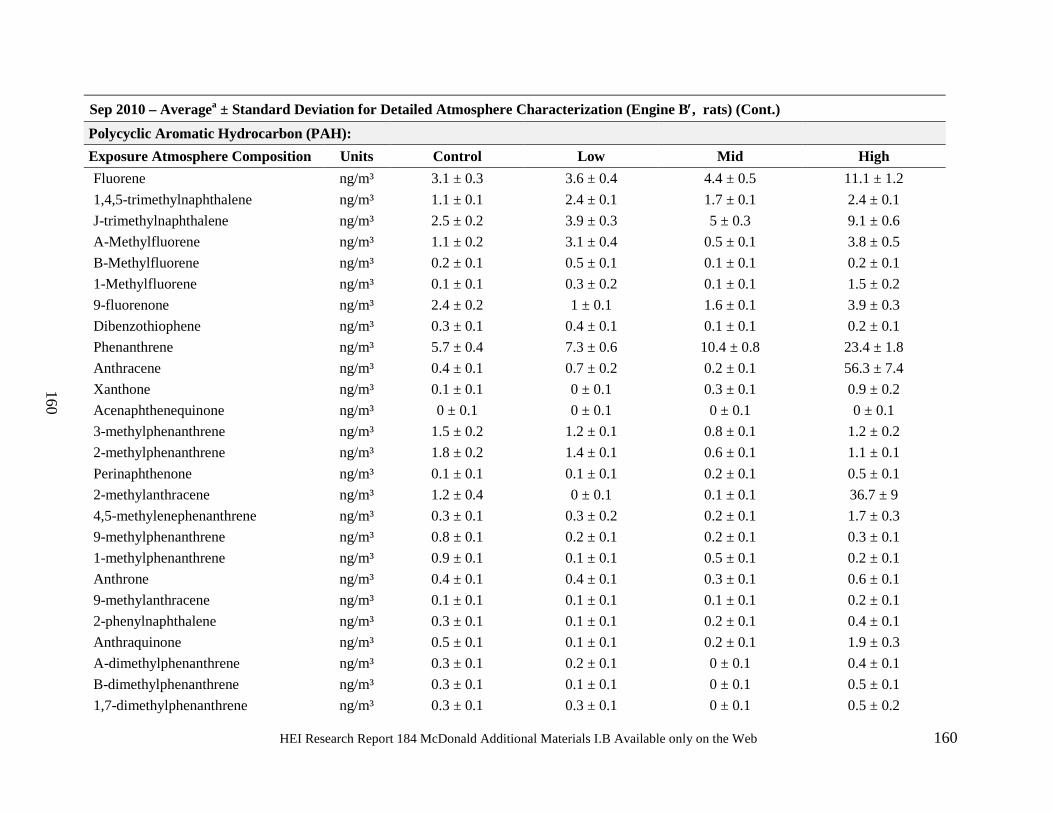
HEI Research Report 184 McDonald Additional Materials I.B Available only on the Web 160
160
Sep 2010 – Averagea ± Standard Deviation for Detailed Atmosphere Characterization (Engine B′, rats) (Cont.) Polycyclic Aromatic Hydrocarbon (PAH): Exposure Atmosphere Composition Units Control Low Mid High Fluorene ng/m³ 3.1 ± 0.3 3.6 ± 0.4 4.4 ± 0.5 11.1 ± 1.2 1,4,5-trimethylnaphthalene ng/m³ 1.1 ± 0.1 2.4 ± 0.1 1.7 ± 0.1 2.4 ± 0.1 J-trimethylnaphthalene ng/m³ 2.5 ± 0.2 3.9 ± 0.3 5 ± 0.3 9.1 ± 0.6 A-Methylfluorene ng/m³ 1.1 ± 0.2 3.1 ± 0.4 0.5 ± 0.1 3.8 ± 0.5 B-Methylfluorene ng/m³ 0.2 ± 0.1 0.5 ± 0.1 0.1 ± 0.1 0.2 ± 0.1 1-Methylfluorene ng/m³ 0.1 ± 0.1 0.3 ± 0.2 0.1 ± 0.1 1.5 ± 0.2 9-fluorenone ng/m³ 2.4 ± 0.2 1 ± 0.1 1.6 ± 0.1 3.9 ± 0.3 Dibenzothiophene ng/m³ 0.3 ± 0.1 0.4 ± 0.1 0.1 ± 0.1 0.2 ± 0.1 Phenanthrene ng/m³ 5.7 ± 0.4 7.3 ± 0.6 10.4 ± 0.8 23.4 ± 1.8 Anthracene ng/m³ 0.4 ± 0.1 0.7 ± 0.2 0.2 ± 0.1 56.3 ± 7.4 Xanthone ng/m³ 0.1 ± 0.1 0 ± 0.1 0.3 ± 0.1 0.9 ± 0.2 Acenaphthenequinone ng/m³ 0 ± 0.1 0 ± 0.1 0 ± 0.1 0 ± 0.1 3-methylphenanthrene ng/m³ 1.5 ± 0.2 1.2 ± 0.1 0.8 ± 0.1 1.2 ± 0.2 2-methylphenanthrene ng/m³ 1.8 ± 0.2 1.4 ± 0.1 0.6 ± 0.1 1.1 ± 0.1 Perinaphthenone ng/m³ 0.1 ± 0.1 0.1 ± 0.1 0.2 ± 0.1 0.5 ± 0.1 2-methylanthracene ng/m³ 1.2 ± 0.4 0 ± 0.1 0.1 ± 0.1 36.7 ± 9 4,5-methylenephenanthrene ng/m³ 0.3 ± 0.1 0.3 ± 0.2 0.2 ± 0.1 1.7 ± 0.3 9-methylphenanthrene ng/m³ 0.8 ± 0.1 0.2 ± 0.1 0.2 ± 0.1 0.3 ± 0.1 1-methylphenanthrene ng/m³ 0.9 ± 0.1 0.1 ± 0.1 0.5 ± 0.1 0.2 ± 0.1 Anthrone ng/m³ 0.4 ± 0.1 0.4 ± 0.1 0.3 ± 0.1 0.6 ± 0.1 9-methylanthracene ng/m³ 0.1 ± 0.1 0.1 ± 0.1 0.1 ± 0.1 0.2 ± 0.1 2-phenylnaphthalene ng/m³ 0.3 ± 0.1 0.1 ± 0.1 0.2 ± 0.1 0.4 ± 0.1 Anthraquinone ng/m³ 0.5 ± 0.1 0.1 ± 0.1 0.2 ± 0.1 1.9 ± 0.3 A-dimethylphenanthrene ng/m³ 0.3 ± 0.1 0.2 ± 0.1 0 ± 0.1 0.4 ± 0.1 B-dimethylphenanthrene ng/m³ 0.3 ± 0.1 0.1 ± 0.1 0 ± 0.1 0.5 ± 0.1 1,7-dimethylphenanthrene ng/m³ 0.3 ± 0.1 0.3 ± 0.1 0 ± 0.1 0.5 ± 0.2
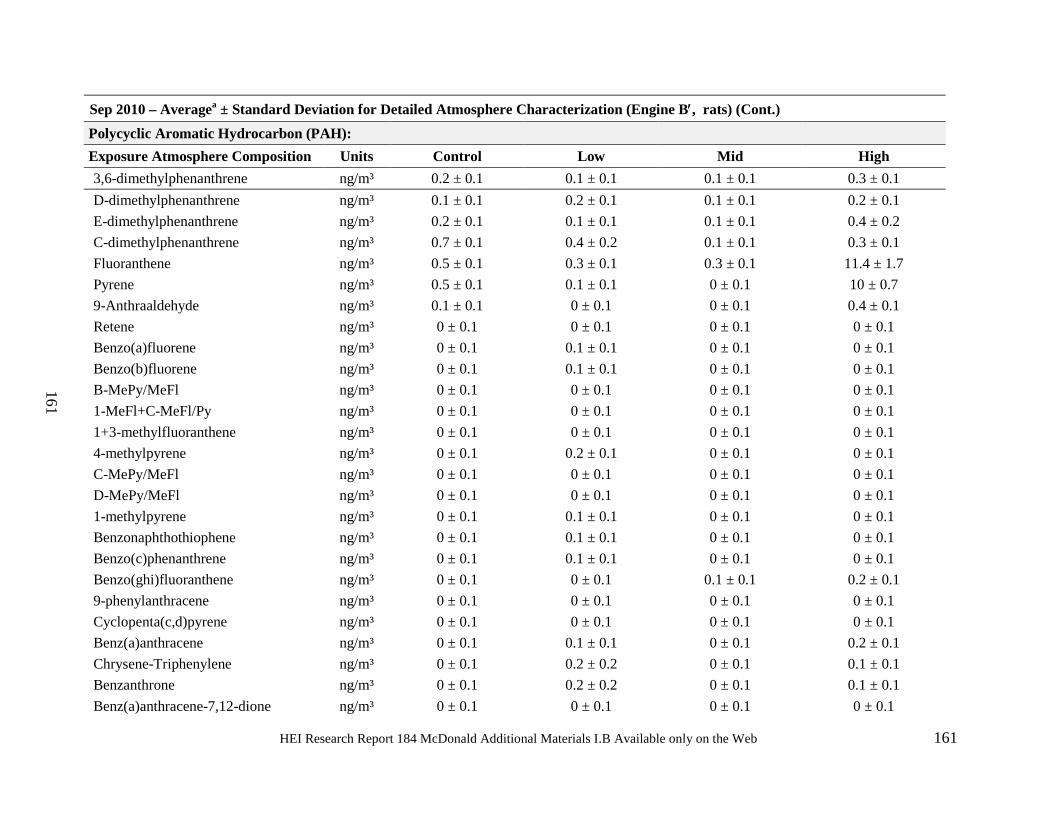
HEI Research Report 184 McDonald Additional Materials I.B Available only on the Web 161
161
Sep 2010 – Averagea ± Standard Deviation for Detailed Atmosphere Characterization (Engine B′, rats) (Cont.) Polycyclic Aromatic Hydrocarbon (PAH): Exposure Atmosphere Composition Units Control Low Mid High 3,6-dimethylphenanthrene ng/m³ 0.2 ± 0.1 0.1 ± 0.1 0.1 ± 0.1 0.3 ± 0.1 D-dimethylphenanthrene ng/m³ 0.1 ± 0.1 0.2 ± 0.1 0.1 ± 0.1 0.2 ± 0.1 E-dimethylphenanthrene ng/m³ 0.2 ± 0.1 0.1 ± 0.1 0.1 ± 0.1 0.4 ± 0.2 C-dimethylphenanthrene ng/m³ 0.7 ± 0.1 0.4 ± 0.2 0.1 ± 0.1 0.3 ± 0.1 Fluoranthene ng/m³ 0.5 ± 0.1 0.3 ± 0.1 0.3 ± 0.1 11.4 ± 1.7 Pyrene ng/m³ 0.5 ± 0.1 0.1 ± 0.1 0 ± 0.1 10 ± 0.7 9-Anthraaldehyde ng/m³ 0.1 ± 0.1 0 ± 0.1 0 ± 0.1 0.4 ± 0.1 Retene ng/m³ 0 ± 0.1 0 ± 0.1 0 ± 0.1 0 ± 0.1 Benzo(a)fluorene ng/m³ 0 ± 0.1 0.1 ± 0.1 0 ± 0.1 0 ± 0.1 Benzo(b)fluorene ng/m³ 0 ± 0.1 0.1 ± 0.1 0 ± 0.1 0 ± 0.1 B-MePy/MeFl ng/m³ 0 ± 0.1 0 ± 0.1 0 ± 0.1 0 ± 0.1 1-MeFl+C-MeFl/Py ng/m³ 0 ± 0.1 0 ± 0.1 0 ± 0.1 0 ± 0.1 1+3-methylfluoranthene ng/m³ 0 ± 0.1 0 ± 0.1 0 ± 0.1 0 ± 0.1 4-methylpyrene ng/m³ 0 ± 0.1 0.2 ± 0.1 0 ± 0.1 0 ± 0.1 C-MePy/MeFl ng/m³ 0 ± 0.1 0 ± 0.1 0 ± 0.1 0 ± 0.1 D-MePy/MeFl ng/m³ 0 ± 0.1 0 ± 0.1 0 ± 0.1 0 ± 0.1 1-methylpyrene ng/m³ 0 ± 0.1 0.1 ± 0.1 0 ± 0.1 0 ± 0.1 Benzonaphthothiophene ng/m³ 0 ± 0.1 0.1 ± 0.1 0 ± 0.1 0 ± 0.1 Benzo(c)phenanthrene ng/m³ 0 ± 0.1 0.1 ± 0.1 0 ± 0.1 0 ± 0.1 Benzo(ghi)fluoranthene ng/m³ 0 ± 0.1 0 ± 0.1 0.1 ± 0.1 0.2 ± 0.1 9-phenylanthracene ng/m³ 0 ± 0.1 0 ± 0.1 0 ± 0.1 0 ± 0.1 Cyclopenta(c,d)pyrene ng/m³ 0 ± 0.1 0 ± 0.1 0 ± 0.1 0 ± 0.1 Benz(a)anthracene ng/m³ 0 ± 0.1 0.1 ± 0.1 0 ± 0.1 0.2 ± 0.1 Chrysene-Triphenylene ng/m³ 0 ± 0.1 0.2 ± 0.2 0 ± 0.1 0.1 ± 0.1 Benzanthrone ng/m³ 0 ± 0.1 0.2 ± 0.2 0 ± 0.1 0.1 ± 0.1 Benz(a)anthracene-7,12-dione ng/m³ 0 ± 0.1 0 ± 0.1 0 ± 0.1 0 ± 0.1
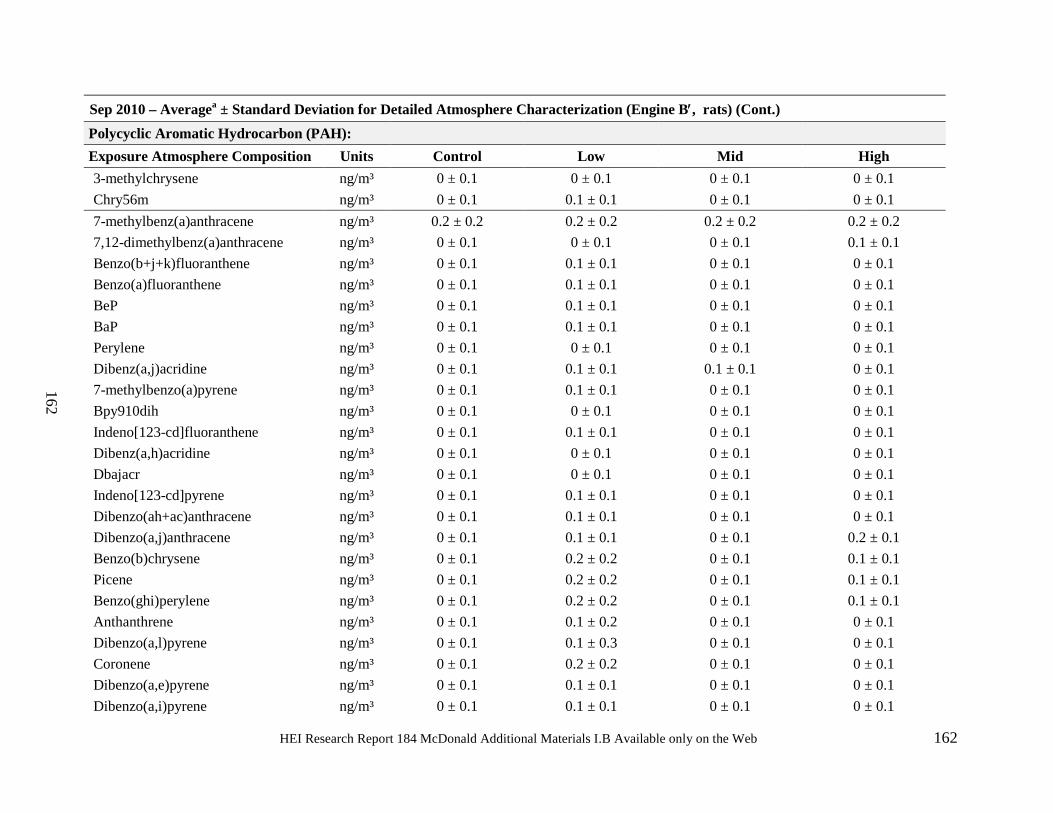
HEI Research Report 184 McDonald Additional Materials I.B Available only on the Web 162
162
Sep 2010 – Averagea ± Standard Deviation for Detailed Atmosphere Characterization (Engine B′, rats) (Cont.) Polycyclic Aromatic Hydrocarbon (PAH): Exposure Atmosphere Composition Units Control Low Mid High 3-methylchrysene ng/m³ 0 ± 0.1 0 ± 0.1 0 ± 0.1 0 ± 0.1 Chry56m ng/m³ 0 ± 0.1 0.1 ± 0.1 0 ± 0.1 0 ± 0.1 7-methylbenz(a)anthracene ng/m³ 0.2 ± 0.2 0.2 ± 0.2 0.2 ± 0.2 0.2 ± 0.2 7,12-dimethylbenz(a)anthracene ng/m³ 0 ± 0.1 0 ± 0.1 0 ± 0.1 0.1 ± 0.1 Benzo(b+j+k)fluoranthene ng/m³ 0 ± 0.1 0.1 ± 0.1 0 ± 0.1 0 ± 0.1 Benzo(a)fluoranthene ng/m³ 0 ± 0.1 0.1 ± 0.1 0 ± 0.1 0 ± 0.1 BeP ng/m³ 0 ± 0.1 0.1 ± 0.1 0 ± 0.1 0 ± 0.1 BaP ng/m³ 0 ± 0.1 0.1 ± 0.1 0 ± 0.1 0 ± 0.1 Perylene ng/m³ 0 ± 0.1 0 ± 0.1 0 ± 0.1 0 ± 0.1 Dibenz(a,j)acridine ng/m³ 0 ± 0.1 0.1 ± 0.1 0.1 ± 0.1 0 ± 0.1 7-methylbenzo(a)pyrene ng/m³ 0 ± 0.1 0.1 ± 0.1 0 ± 0.1 0 ± 0.1 Bpy910dih ng/m³ 0 ± 0.1 0 ± 0.1 0 ± 0.1 0 ± 0.1 Indeno[123-cd]fluoranthene ng/m³ 0 ± 0.1 0.1 ± 0.1 0 ± 0.1 0 ± 0.1 Dibenz(a,h)acridine ng/m³ 0 ± 0.1 0 ± 0.1 0 ± 0.1 0 ± 0.1 Dbajacr ng/m³ 0 ± 0.1 0 ± 0.1 0 ± 0.1 0 ± 0.1 Indeno[123-cd]pyrene ng/m³ 0 ± 0.1 0.1 ± 0.1 0 ± 0.1 0 ± 0.1 Dibenzo(ah+ac)anthracene ng/m³ 0 ± 0.1 0.1 ± 0.1 0 ± 0.1 0 ± 0.1 Dibenzo(a,j)anthracene ng/m³ 0 ± 0.1 0.1 ± 0.1 0 ± 0.1 0.2 ± 0.1 Benzo(b)chrysene ng/m³ 0 ± 0.1 0.2 ± 0.2 0 ± 0.1 0.1 ± 0.1 Picene ng/m³ 0 ± 0.1 0.2 ± 0.2 0 ± 0.1 0.1 ± 0.1 Benzo(ghi)perylene ng/m³ 0 ± 0.1 0.2 ± 0.2 0 ± 0.1 0.1 ± 0.1 Anthanthrene ng/m³ 0 ± 0.1 0.1 ± 0.2 0 ± 0.1 0 ± 0.1 Dibenzo(a,l)pyrene ng/m³ 0 ± 0.1 0.1 ± 0.3 0 ± 0.1 0 ± 0.1 Coronene ng/m³ 0 ± 0.1 0.2 ± 0.2 0 ± 0.1 0 ± 0.1 Dibenzo(a,e)pyrene ng/m³ 0 ± 0.1 0.1 ± 0.1 0 ± 0.1 0 ± 0.1 Dibenzo(a,i)pyrene ng/m³ 0 ± 0.1 0.1 ± 0.1 0 ± 0.1 0 ± 0.1
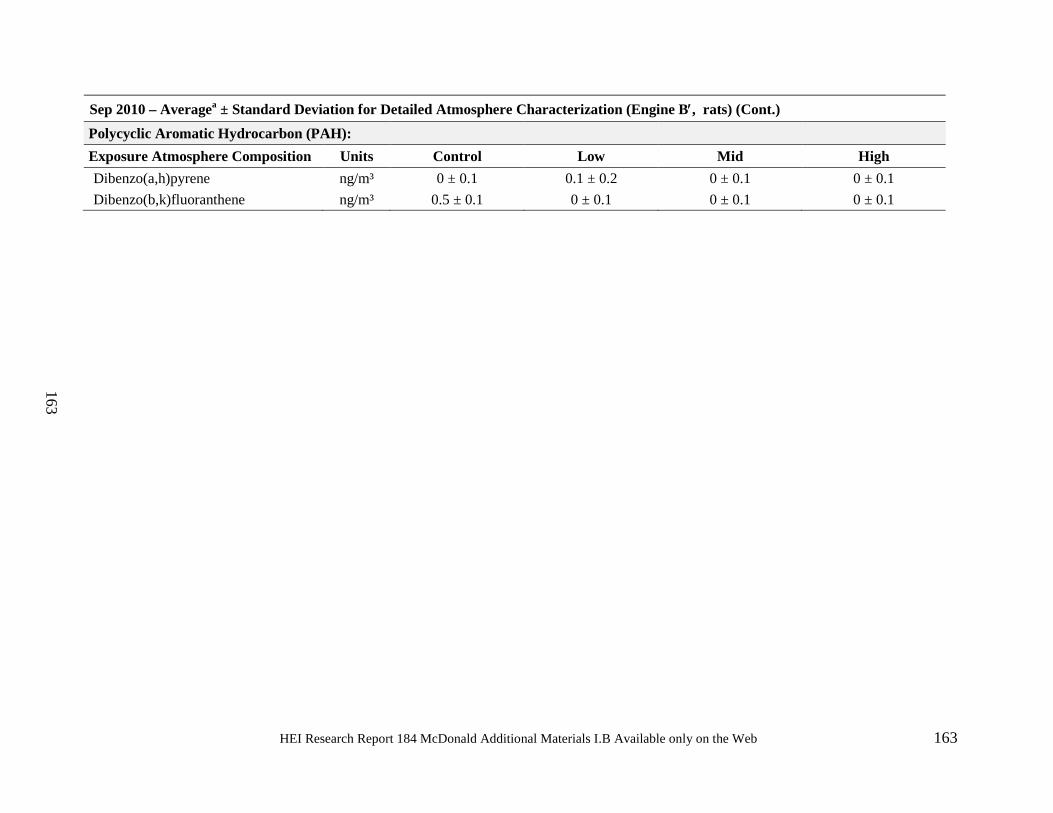
HEI Research Report 184 McDonald Additional Materials I.B Available only on the Web 163
163
Sep 2010 – Averagea ± Standard Deviation for Detailed Atmosphere Characterization (Engine B′, rats) (Cont.) Polycyclic Aromatic Hydrocarbon (PAH): Exposure Atmosphere Composition Units Control Low Mid High Dibenzo(a,h)pyrene ng/m³ 0 ± 0.1 0.1 ± 0.2 0 ± 0.1 0 ± 0.1 Dibenzo(b,k)fluoranthene ng/m³ 0.5 ± 0.1 0 ± 0.1 0 ± 0.1 0 ± 0.1
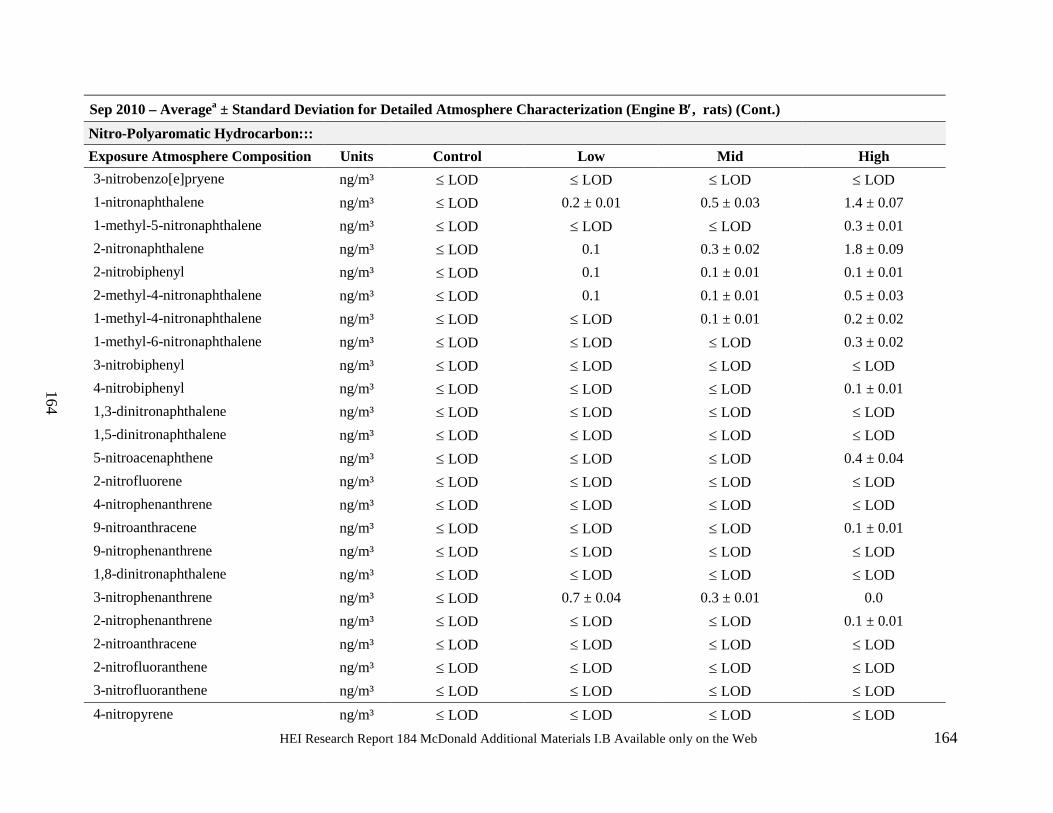
HEI Research Report 184 McDonald Additional Materials I.B Available only on the Web 164
164
Sep 2010 – Averagea ± Standard Deviation for Detailed Atmosphere Characterization (Engine B′, rats) (Cont.) Nitro-Polyaromatic Hydrocarbon::: Exposure Atmosphere Composition Units Control Low Mid High 3-nitrobenzo[e]pryene ng/m³ ≤ LOD ≤ LOD ≤ LOD ≤ LOD 1-nitronaphthalene ng/m³ ≤ LOD 0.2 ± 0.01 0.5 ± 0.03 1.4 ± 0.07 1-methyl-5-nitronaphthalene ng/m³ ≤ LOD ≤ LOD ≤ LOD 0.3 ± 0.01 2-nitronaphthalene ng/m³ ≤ LOD 0.1 0.3 ± 0.02 1.8 ± 0.09 2-nitrobiphenyl ng/m³ ≤ LOD 0.1 0.1 ± 0.01 0.1 ± 0.01 2-methyl-4-nitronaphthalene ng/m³ ≤ LOD 0.1 0.1 ± 0.01 0.5 ± 0.03 1-methyl-4-nitronaphthalene ng/m³ ≤ LOD ≤ LOD 0.1 ± 0.01 0.2 ± 0.02 1-methyl-6-nitronaphthalene ng/m³ ≤ LOD ≤ LOD ≤ LOD 0.3 ± 0.02 3-nitrobiphenyl ng/m³ ≤ LOD ≤ LOD ≤ LOD ≤ LOD 4-nitrobiphenyl ng/m³ ≤ LOD ≤ LOD ≤ LOD 0.1 ± 0.01 1,3-dinitronaphthalene ng/m³ ≤ LOD ≤ LOD ≤ LOD ≤ LOD 1,5-dinitronaphthalene ng/m³ ≤ LOD ≤ LOD ≤ LOD ≤ LOD 5-nitroacenaphthene ng/m³ ≤ LOD ≤ LOD ≤ LOD 0.4 ± 0.04 2-nitrofluorene ng/m³ ≤ LOD ≤ LOD ≤ LOD ≤ LOD 4-nitrophenanthrene ng/m³ ≤ LOD ≤ LOD ≤ LOD ≤ LOD 9-nitroanthracene ng/m³ ≤ LOD ≤ LOD ≤ LOD 0.1 ± 0.01 9-nitrophenanthrene ng/m³ ≤ LOD ≤ LOD ≤ LOD ≤ LOD 1,8-dinitronaphthalene ng/m³ ≤ LOD ≤ LOD ≤ LOD ≤ LOD 3-nitrophenanthrene ng/m³ ≤ LOD 0.7 ± 0.04 0.3 ± 0.01 0.0 2-nitrophenanthrene ng/m³ ≤ LOD ≤ LOD ≤ LOD 0.1 ± 0.01 2-nitroanthracene ng/m³ ≤ LOD ≤ LOD ≤ LOD ≤ LOD 2-nitrofluoranthene ng/m³ ≤ LOD ≤ LOD ≤ LOD ≤ LOD 3-nitrofluoranthene ng/m³ ≤ LOD ≤ LOD ≤ LOD ≤ LOD 4-nitropyrene ng/m³ ≤ LOD ≤ LOD ≤ LOD ≤ LOD
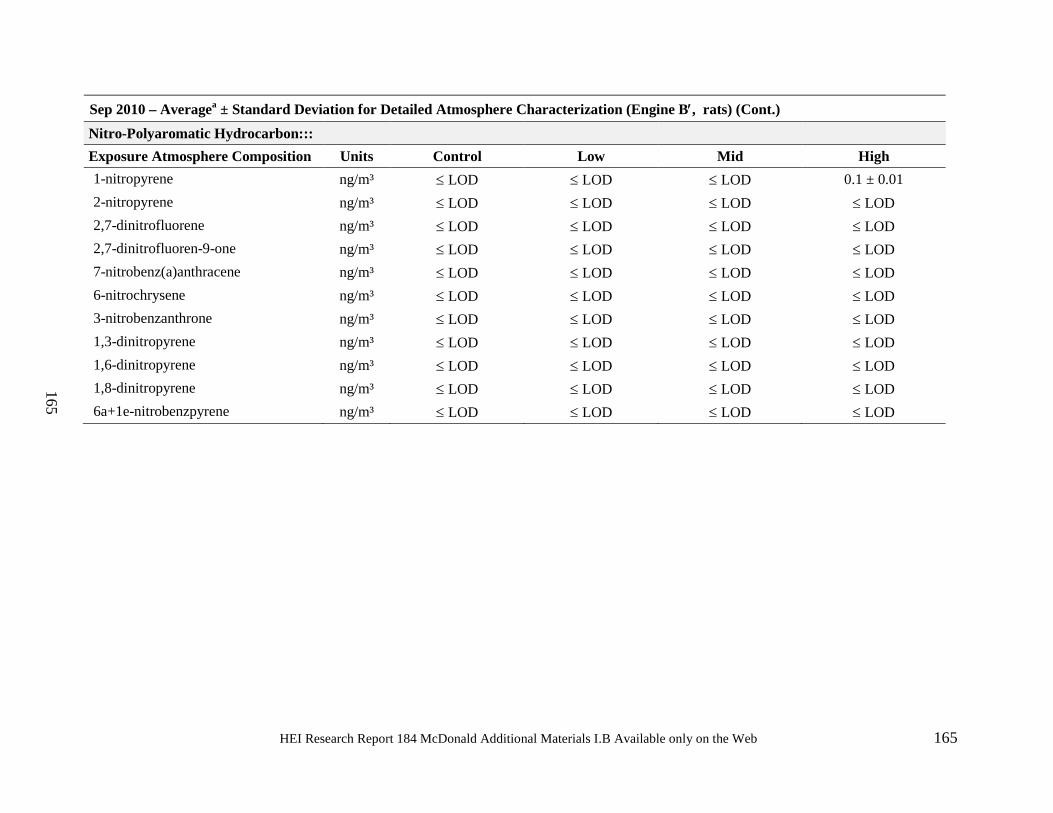
HEI Research Report 184 McDonald Additional Materials I.B Available only on the Web 165
165
Sep 2010 – Averagea ± Standard Deviation for Detailed Atmosphere Characterization (Engine B′, rats) (Cont.) Nitro-Polyaromatic Hydrocarbon::: Exposure Atmosphere Composition Units Control Low Mid High 1-nitropyrene ng/m³ ≤ LOD ≤ LOD ≤ LOD 0.1 ± 0.01 2-nitropyrene ng/m³ ≤ LOD ≤ LOD ≤ LOD ≤ LOD 2,7-dinitrofluorene ng/m³ ≤ LOD ≤ LOD ≤ LOD ≤ LOD 2,7-dinitrofluoren-9-one ng/m³ ≤ LOD ≤ LOD ≤ LOD ≤ LOD 7-nitrobenz(a)anthracene ng/m³ ≤ LOD ≤ LOD ≤ LOD ≤ LOD 6-nitrochrysene ng/m³ ≤ LOD ≤ LOD ≤ LOD ≤ LOD 3-nitrobenzanthrone ng/m³ ≤ LOD ≤ LOD ≤ LOD ≤ LOD 1,3-dinitropyrene ng/m³ ≤ LOD ≤ LOD ≤ LOD ≤ LOD 1,6-dinitropyrene ng/m³ ≤ LOD ≤ LOD ≤ LOD ≤ LOD 1,8-dinitropyrene ng/m³ ≤ LOD ≤ LOD ≤ LOD ≤ LOD 6a+1e-nitrobenzpyrene ng/m³ ≤ LOD ≤ LOD ≤ LOD ≤ LOD
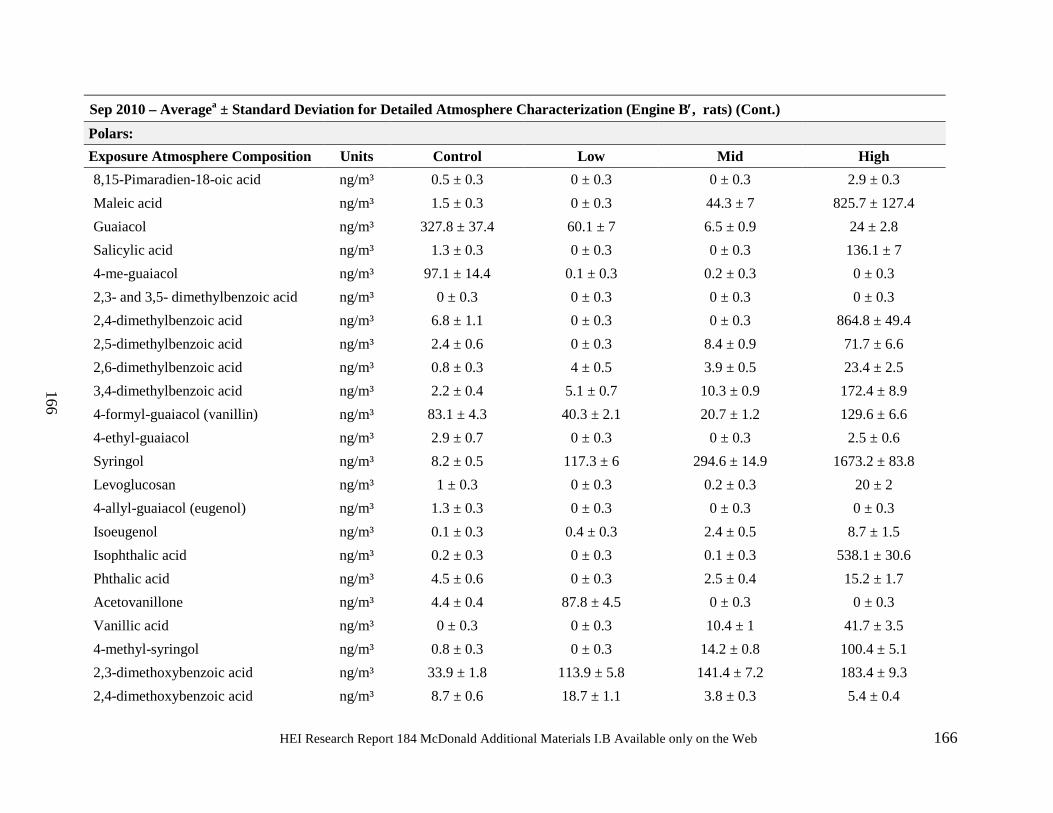
HEI Research Report 184 McDonald Additional Materials I.B Available only on the Web 166
166
Sep 2010 – Averagea ± Standard Deviation for Detailed Atmosphere Characterization (Engine B′, rats) (Cont.) Polars: Exposure Atmosphere Composition Units Control Low Mid High 8,15-Pimaradien-18-oic acid ng/m³ 0.5 ± 0.3 0 ± 0.3 0 ± 0.3 2.9 ± 0.3 Maleic acid ng/m³ 1.5 ± 0.3 0 ± 0.3 44.3 ± 7 825.7 ± 127.4 Guaiacol ng/m³ 327.8 ± 37.4 60.1 ± 7 6.5 ± 0.9 24 ± 2.8 Salicylic acid ng/m³ 1.3 ± 0.3 0 ± 0.3 0 ± 0.3 136.1 ± 7 4-me-guaiacol ng/m³ 97.1 ± 14.4 0.1 ± 0.3 0.2 ± 0.3 0 ± 0.3 2,3- and 3,5- dimethylbenzoic acid ng/m³ 0 ± 0.3 0 ± 0.3 0 ± 0.3 0 ± 0.3 2,4-dimethylbenzoic acid ng/m³ 6.8 ± 1.1 0 ± 0.3 0 ± 0.3 864.8 ± 49.4 2,5-dimethylbenzoic acid ng/m³ 2.4 ± 0.6 0 ± 0.3 8.4 ± 0.9 71.7 ± 6.6 2,6-dimethylbenzoic acid ng/m³ 0.8 ± 0.3 4 ± 0.5 3.9 ± 0.5 23.4 ± 2.5 3,4-dimethylbenzoic acid ng/m³ 2.2 ± 0.4 5.1 ± 0.7 10.3 ± 0.9 172.4 ± 8.9 4-formyl-guaiacol (vanillin) ng/m³ 83.1 ± 4.3 40.3 ± 2.1 20.7 ± 1.2 129.6 ± 6.6 4-ethyl-guaiacol ng/m³ 2.9 ± 0.7 0 ± 0.3 0 ± 0.3 2.5 ± 0.6 Syringol ng/m³ 8.2 ± 0.5 117.3 ± 6 294.6 ± 14.9 1673.2 ± 83.8 Levoglucosan ng/m³ 1 ± 0.3 0 ± 0.3 0.2 ± 0.3 20 ± 2 4-allyl-guaiacol (eugenol) ng/m³ 1.3 ± 0.3 0 ± 0.3 0 ± 0.3 0 ± 0.3 Isoeugenol ng/m³ 0.1 ± 0.3 0.4 ± 0.3 2.4 ± 0.5 8.7 ± 1.5 Isophthalic acid ng/m³ 0.2 ± 0.3 0 ± 0.3 0.1 ± 0.3 538.1 ± 30.6 Phthalic acid ng/m³ 4.5 ± 0.6 0 ± 0.3 2.5 ± 0.4 15.2 ± 1.7 Acetovanillone ng/m³ 4.4 ± 0.4 87.8 ± 4.5 0 ± 0.3 0 ± 0.3 Vanillic acid ng/m³ 0 ± 0.3 0 ± 0.3 10.4 ± 1 41.7 ± 3.5 4-methyl-syringol ng/m³ 0.8 ± 0.3 0 ± 0.3 14.2 ± 0.8 100.4 ± 5.1 2,3-dimethoxybenzoic acid ng/m³ 33.9 ± 1.8 113.9 ± 5.8 141.4 ± 7.2 183.4 ± 9.3 2,4-dimethoxybenzoic acid ng/m³ 8.7 ± 0.6 18.7 ± 1.1 3.8 ± 0.3 5.4 ± 0.4
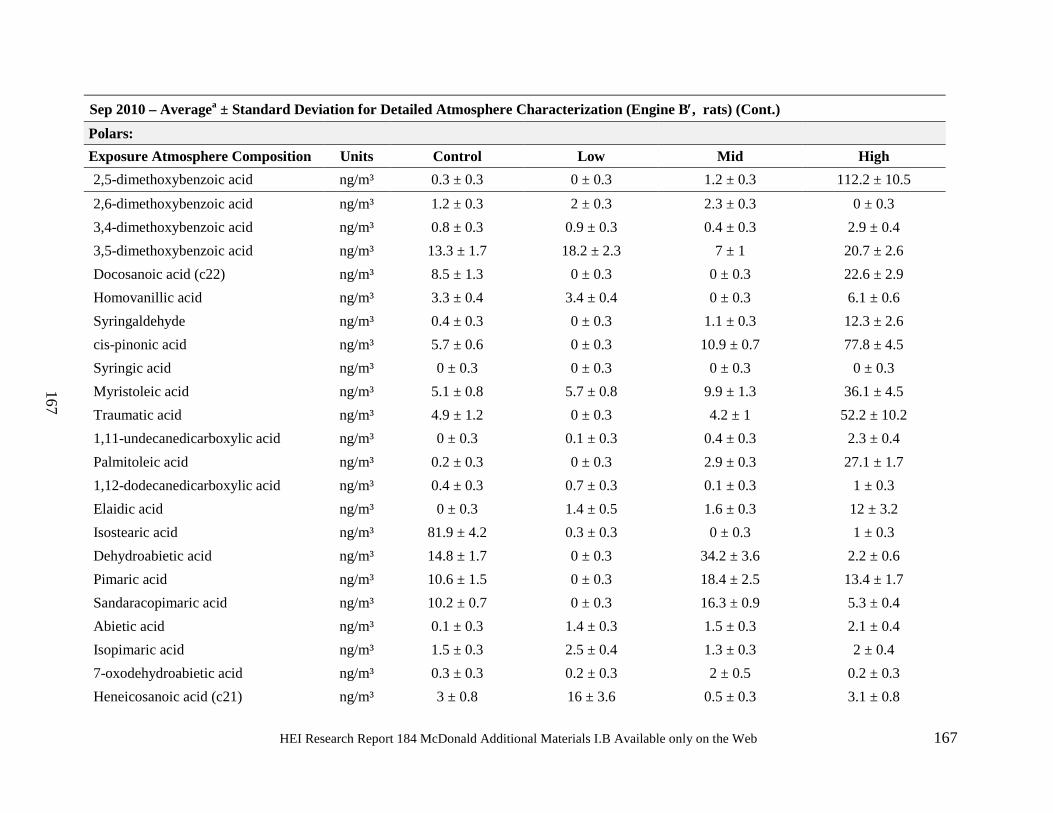
HEI Research Report 184 McDonald Additional Materials I.B Available only on the Web 167
167
Sep 2010 – Averagea ± Standard Deviation for Detailed Atmosphere Characterization (Engine B′, rats) (Cont.) Polars: Exposure Atmosphere Composition Units Control Low Mid High 2,5-dimethoxybenzoic acid ng/m³ 0.3 ± 0.3 0 ± 0.3 1.2 ± 0.3 112.2 ± 10.5 2,6-dimethoxybenzoic acid ng/m³ 1.2 ± 0.3 2 ± 0.3 2.3 ± 0.3 0 ± 0.3 3,4-dimethoxybenzoic acid ng/m³ 0.8 ± 0.3 0.9 ± 0.3 0.4 ± 0.3 2.9 ± 0.4 3,5-dimethoxybenzoic acid ng/m³ 13.3 ± 1.7 18.2 ± 2.3 7 ± 1 20.7 ± 2.6 Docosanoic acid (c22) ng/m³ 8.5 ± 1.3 0 ± 0.3 0 ± 0.3 22.6 ± 2.9 Homovanillic acid ng/m³ 3.3 ± 0.4 3.4 ± 0.4 0 ± 0.3 6.1 ± 0.6 Syringaldehyde ng/m³ 0.4 ± 0.3 0 ± 0.3 1.1 ± 0.3 12.3 ± 2.6 cis-pinonic acid ng/m³ 5.7 ± 0.6 0 ± 0.3 10.9 ± 0.7 77.8 ± 4.5 Syringic acid ng/m³ 0 ± 0.3 0 ± 0.3 0 ± 0.3 0 ± 0.3 Myristoleic acid ng/m³ 5.1 ± 0.8 5.7 ± 0.8 9.9 ± 1.3 36.1 ± 4.5 Traumatic acid ng/m³ 4.9 ± 1.2 0 ± 0.3 4.2 ± 1 52.2 ± 10.2 1,11-undecanedicarboxylic acid ng/m³ 0 ± 0.3 0.1 ± 0.3 0.4 ± 0.3 2.3 ± 0.4 Palmitoleic acid ng/m³ 0.2 ± 0.3 0 ± 0.3 2.9 ± 0.3 27.1 ± 1.7 1,12-dodecanedicarboxylic acid ng/m³ 0.4 ± 0.3 0.7 ± 0.3 0.1 ± 0.3 1 ± 0.3 Elaidic acid ng/m³ 0 ± 0.3 1.4 ± 0.5 1.6 ± 0.3 12 ± 3.2 Isostearic acid ng/m³ 81.9 ± 4.2 0.3 ± 0.3 0 ± 0.3 1 ± 0.3 Dehydroabietic acid ng/m³ 14.8 ± 1.7 0 ± 0.3 34.2 ± 3.6 2.2 ± 0.6 Pimaric acid ng/m³ 10.6 ± 1.5 0 ± 0.3 18.4 ± 2.5 13.4 ± 1.7 Sandaracopimaric acid ng/m³ 10.2 ± 0.7 0 ± 0.3 16.3 ± 0.9 5.3 ± 0.4 Abietic acid ng/m³ 0.1 ± 0.3 1.4 ± 0.3 1.5 ± 0.3 2.1 ± 0.4 Isopimaric acid ng/m³ 1.5 ± 0.3 2.5 ± 0.4 1.3 ± 0.3 2 ± 0.4 7-oxodehydroabietic acid ng/m³ 0.3 ± 0.3 0.2 ± 0.3 2 ± 0.5 0.2 ± 0.3 Heneicosanoic acid (c21) ng/m³ 3 ± 0.8 16 ± 3.6 0.5 ± 0.3 3.1 ± 0.8
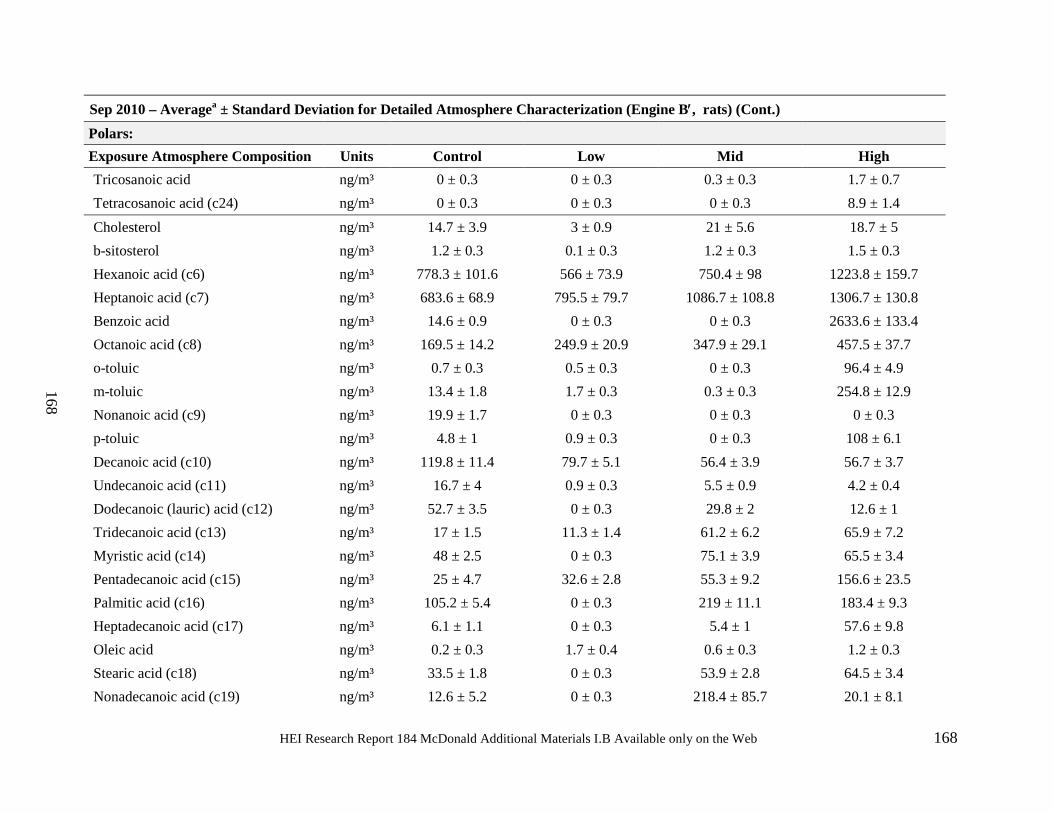
HEI Research Report 184 McDonald Additional Materials I.B Available only on the Web 168
168
Sep 2010 – Averagea ± Standard Deviation for Detailed Atmosphere Characterization (Engine B′, rats) (Cont.) Polars: Exposure Atmosphere Composition Units Control Low Mid High Tricosanoic acid ng/m³ 0 ± 0.3 0 ± 0.3 0.3 ± 0.3 1.7 ± 0.7 Tetracosanoic acid (c24) ng/m³ 0 ± 0.3 0 ± 0.3 0 ± 0.3 8.9 ± 1.4 Cholesterol ng/m³ 14.7 ± 3.9 3 ± 0.9 21 ± 5.6 18.7 ± 5 b-sitosterol ng/m³ 1.2 ± 0.3 0.1 ± 0.3 1.2 ± 0.3 1.5 ± 0.3 Hexanoic acid (c6) ng/m³ 778.3 ± 101.6 566 ± 73.9 750.4 ± 98 1223.8 ± 159.7 Heptanoic acid (c7) ng/m³ 683.6 ± 68.9 795.5 ± 79.7 1086.7 ± 108.8 1306.7 ± 130.8 Benzoic acid ng/m³ 14.6 ± 0.9 0 ± 0.3 0 ± 0.3 2633.6 ± 133.4 Octanoic acid (c8) ng/m³ 169.5 ± 14.2 249.9 ± 20.9 347.9 ± 29.1 457.5 ± 37.7 o-toluic ng/m³ 0.7 ± 0.3 0.5 ± 0.3 0 ± 0.3 96.4 ± 4.9 m-toluic ng/m³ 13.4 ± 1.8 1.7 ± 0.3 0.3 ± 0.3 254.8 ± 12.9 Nonanoic acid (c9) ng/m³ 19.9 ± 1.7 0 ± 0.3 0 ± 0.3 0 ± 0.3 p-toluic ng/m³ 4.8 ± 1 0.9 ± 0.3 0 ± 0.3 108 ± 6.1 Decanoic acid (c10) ng/m³ 119.8 ± 11.4 79.7 ± 5.1 56.4 ± 3.9 56.7 ± 3.7 Undecanoic acid (c11) ng/m³ 16.7 ± 4 0.9 ± 0.3 5.5 ± 0.9 4.2 ± 0.4 Dodecanoic (lauric) acid (c12) ng/m³ 52.7 ± 3.5 0 ± 0.3 29.8 ± 2 12.6 ± 1 Tridecanoic acid (c13) ng/m³ 17 ± 1.5 11.3 ± 1.4 61.2 ± 6.2 65.9 ± 7.2 Myristic acid (c14) ng/m³ 48 ± 2.5 0 ± 0.3 75.1 ± 3.9 65.5 ± 3.4 Pentadecanoic acid (c15) ng/m³ 25 ± 4.7 32.6 ± 2.8 55.3 ± 9.2 156.6 ± 23.5 Palmitic acid (c16) ng/m³ 105.2 ± 5.4 0 ± 0.3 219 ± 11.1 183.4 ± 9.3 Heptadecanoic acid (c17) ng/m³ 6.1 ± 1.1 0 ± 0.3 5.4 ± 1 57.6 ± 9.8 Oleic acid ng/m³ 0.2 ± 0.3 1.7 ± 0.4 0.6 ± 0.3 1.2 ± 0.3 Stearic acid (c18) ng/m³ 33.5 ± 1.8 0 ± 0.3 53.9 ± 2.8 64.5 ± 3.4 Nonadecanoic acid (c19) ng/m³ 12.6 ± 5.2 0 ± 0.3 218.4 ± 85.7 20.1 ± 8.1
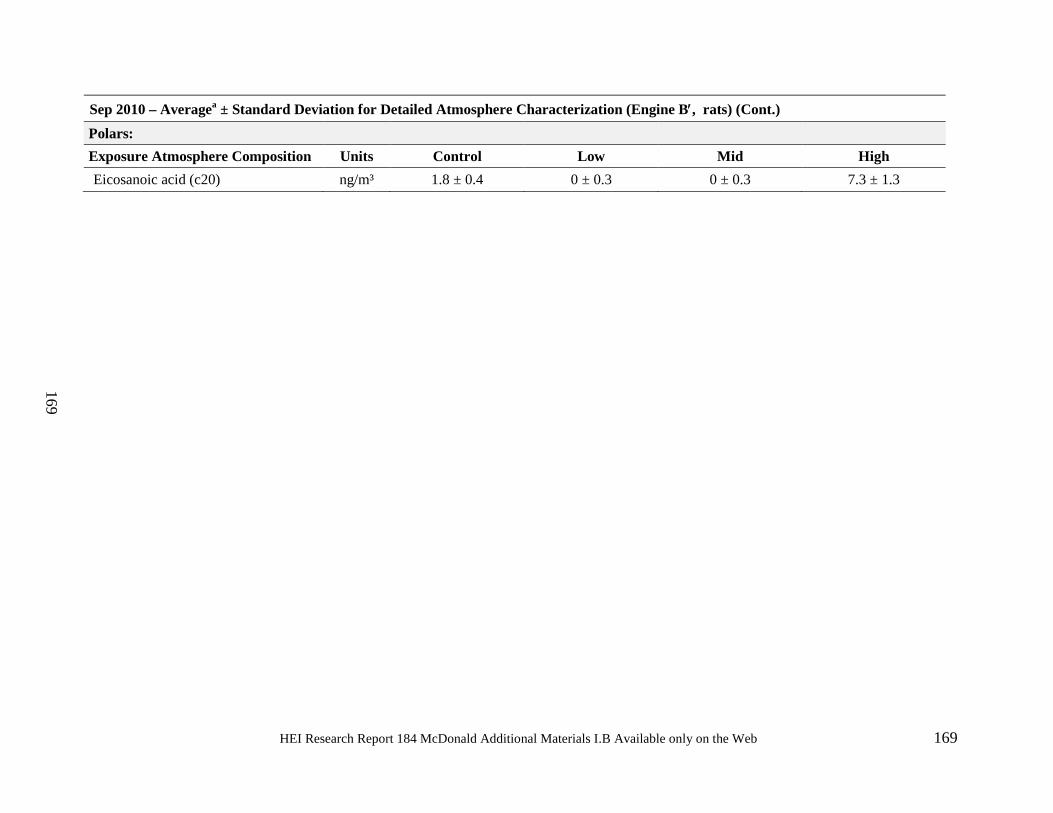
HEI Research Report 184 McDonald Additional Materials I.B Available only on the Web 169
169
Sep 2010 – Averagea ± Standard Deviation for Detailed Atmosphere Characterization (Engine B′, rats) (Cont.) Polars: Exposure Atmosphere Composition Units Control Low Mid High Eicosanoic acid (c20) ng/m³ 1.8 ± 0.4 0 ± 0.3 0 ± 0.3 7.3 ± 1.3
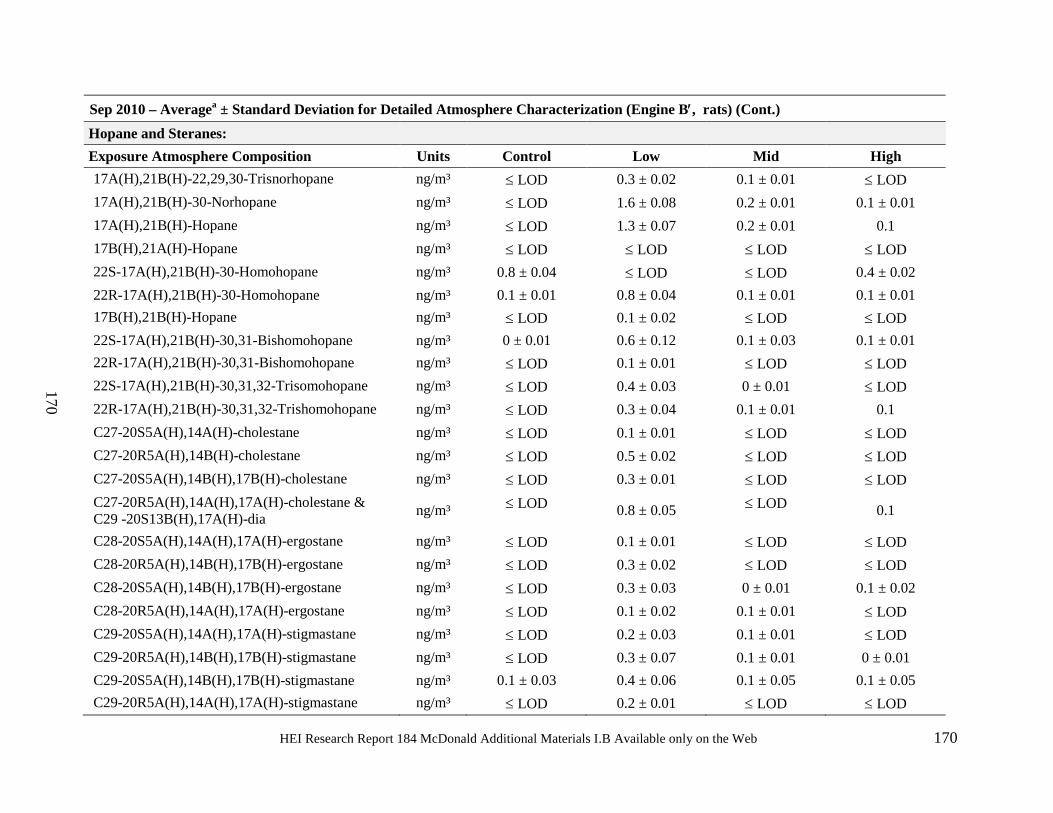
HEI Research Report 184 McDonald Additional Materials I.B Available only on the Web 170
170
Sep 2010 – Averagea ± Standard Deviation for Detailed Atmosphere Characterization (Engine B′, rats) (Cont.) Hopane and Steranes: Exposure Atmosphere Composition Units Control Low Mid High 17A(H),21B(H)-22,29,30-Trisnorhopane ng/m³ ≤ LOD 0.3 ± 0.02 0.1 ± 0.01 ≤ LOD 17A(H),21B(H)-30-Norhopane ng/m³ ≤ LOD 1.6 ± 0.08 0.2 ± 0.01 0.1 ± 0.01 17A(H),21B(H)-Hopane ng/m³ ≤ LOD 1.3 ± 0.07 0.2 ± 0.01 0.1 17B(H),21A(H)-Hopane ng/m³ ≤ LOD ≤ LOD ≤ LOD ≤ LOD 22S-17A(H),21B(H)-30-Homohopane ng/m³ 0.8 ± 0.04 ≤ LOD ≤ LOD 0.4 ± 0.02 22R-17A(H),21B(H)-30-Homohopane ng/m³ 0.1 ± 0.01 0.8 ± 0.04 0.1 ± 0.01 0.1 ± 0.01 17B(H),21B(H)-Hopane ng/m³ ≤ LOD 0.1 ± 0.02 ≤ LOD ≤ LOD 22S-17A(H),21B(H)-30,31-Bishomohopane ng/m³ 0 ± 0.01 0.6 ± 0.12 0.1 ± 0.03 0.1 ± 0.01 22R-17A(H),21B(H)-30,31-Bishomohopane ng/m³ ≤ LOD 0.1 ± 0.01 ≤ LOD ≤ LOD 22S-17A(H),21B(H)-30,31,32-Trisomohopane ng/m³ ≤ LOD 0.4 ± 0.03 0 ± 0.01 ≤ LOD 22R-17A(H),21B(H)-30,31,32-Trishomohopane ng/m³ ≤ LOD 0.3 ± 0.04 0.1 ± 0.01 0.1 C27-20S5A(H),14A(H)-cholestane ng/m³ ≤ LOD 0.1 ± 0.01 ≤ LOD ≤ LOD C27-20R5A(H),14B(H)-cholestane ng/m³ ≤ LOD 0.5 ± 0.02 ≤ LOD ≤ LOD C27-20S5A(H),14B(H),17B(H)-cholestane ng/m³ ≤ LOD 0.3 ± 0.01 ≤ LOD ≤ LOD C27-20R5A(H),14A(H),17A(H)-cholestane & C29 -20S13B(H),17A(H)-dia ng/m³ ≤ LOD 0.8 ± 0.05 ≤ LOD 0.1
C28-20S5A(H),14A(H),17A(H)-ergostane ng/m³ ≤ LOD 0.1 ± 0.01 ≤ LOD ≤ LOD C28-20R5A(H),14B(H),17B(H)-ergostane ng/m³ ≤ LOD 0.3 ± 0.02 ≤ LOD ≤ LOD C28-20S5A(H),14B(H),17B(H)-ergostane ng/m³ ≤ LOD 0.3 ± 0.03 0 ± 0.01 0.1 ± 0.02 C28-20R5A(H),14A(H),17A(H)-ergostane ng/m³ ≤ LOD 0.1 ± 0.02 0.1 ± 0.01 ≤ LOD C29-20S5A(H),14A(H),17A(H)-stigmastane ng/m³ ≤ LOD 0.2 ± 0.03 0.1 ± 0.01 ≤ LOD C29-20R5A(H),14B(H),17B(H)-stigmastane ng/m³ ≤ LOD 0.3 ± 0.07 0.1 ± 0.01 0 ± 0.01 C29-20S5A(H),14B(H),17B(H)-stigmastane ng/m³ 0.1 ± 0.03 0.4 ± 0.06 0.1 ± 0.05 0.1 ± 0.05 C29-20R5A(H),14A(H),17A(H)-stigmastane ng/m³ ≤ LOD 0.2 ± 0.01 ≤ LOD ≤ LOD
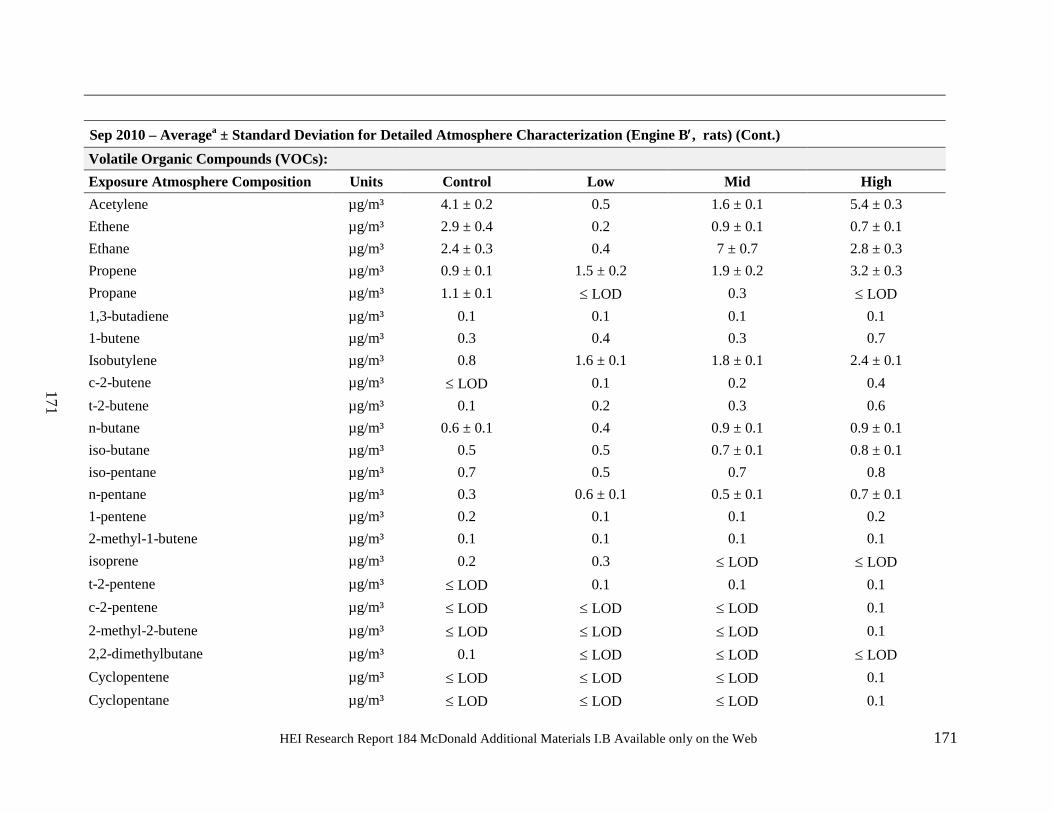
HEI Research Report 184 McDonald Additional Materials I.B Available only on the Web 171
171
Sep 2010 – Averagea ± Standard Deviation for Detailed Atmosphere Characterization (Engine B′, rats) (Cont.) Volatile Organic Compounds (VOCs): Exposure Atmosphere Composition Units Control Low Mid High Acetylene µg/m³ 4.1 ± 0.2 0.5 1.6 ± 0.1 5.4 ± 0.3 Ethene µg/m³ 2.9 ± 0.4 0.2 0.9 ± 0.1 0.7 ± 0.1 Ethane µg/m³ 2.4 ± 0.3 0.4 7 ± 0.7 2.8 ± 0.3 Propene µg/m³ 0.9 ± 0.1 1.5 ± 0.2 1.9 ± 0.2 3.2 ± 0.3 Propane µg/m³ 1.1 ± 0.1 ≤ LOD 0.3 ≤ LOD 1,3-butadiene µg/m³ 0.1 0.1 0.1 0.1 1-butene µg/m³ 0.3 0.4 0.3 0.7 Isobutylene µg/m³ 0.8 1.6 ± 0.1 1.8 ± 0.1 2.4 ± 0.1 c-2-butene µg/m³ ≤ LOD 0.1 0.2 0.4 t-2-butene µg/m³ 0.1 0.2 0.3 0.6 n-butane µg/m³ 0.6 ± 0.1 0.4 0.9 ± 0.1 0.9 ± 0.1 iso-butane µg/m³ 0.5 0.5 0.7 ± 0.1 0.8 ± 0.1 iso-pentane µg/m³ 0.7 0.5 0.7 0.8 n-pentane µg/m³ 0.3 0.6 ± 0.1 0.5 ± 0.1 0.7 ± 0.1 1-pentene µg/m³ 0.2 0.1 0.1 0.2 2-methyl-1-butene µg/m³ 0.1 0.1 0.1 0.1 isoprene µg/m³ 0.2 0.3 ≤ LOD ≤ LOD t-2-pentene µg/m³ ≤ LOD 0.1 0.1 0.1 c-2-pentene µg/m³ ≤ LOD ≤ LOD ≤ LOD 0.1 2-methyl-2-butene µg/m³ ≤ LOD ≤ LOD ≤ LOD 0.1 2,2-dimethylbutane µg/m³ 0.1 ≤ LOD ≤ LOD ≤ LOD Cyclopentene µg/m³ ≤ LOD ≤ LOD ≤ LOD 0.1 Cyclopentane µg/m³ ≤ LOD ≤ LOD ≤ LOD 0.1
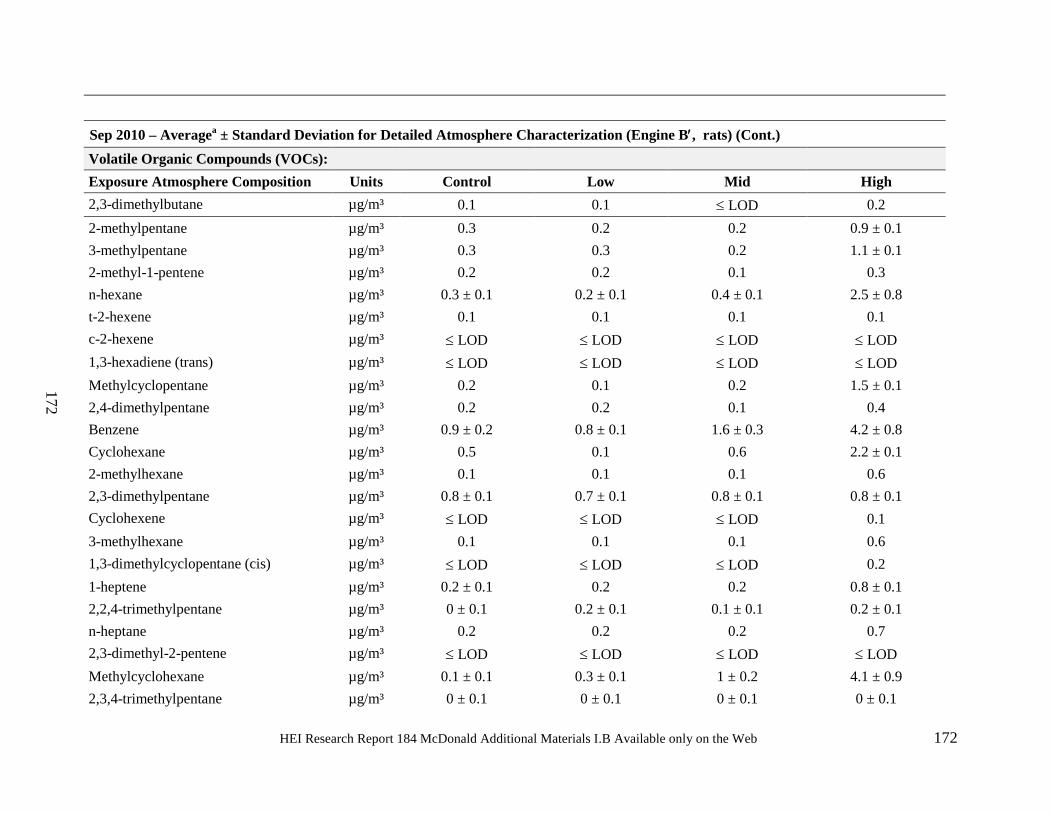
HEI Research Report 184 McDonald Additional Materials I.B Available only on the Web 172
172
Sep 2010 – Averagea ± Standard Deviation for Detailed Atmosphere Characterization (Engine B′, rats) (Cont.) Volatile Organic Compounds (VOCs): Exposure Atmosphere Composition Units Control Low Mid High 2,3-dimethylbutane µg/m³ 0.1 0.1 ≤ LOD 0.2 2-methylpentane µg/m³ 0.3 0.2 0.2 0.9 ± 0.1 3-methylpentane µg/m³ 0.3 0.3 0.2 1.1 ± 0.1 2-methyl-1-pentene µg/m³ 0.2 0.2 0.1 0.3 n-hexane µg/m³ 0.3 ± 0.1 0.2 ± 0.1 0.4 ± 0.1 2.5 ± 0.8 t-2-hexene µg/m³ 0.1 0.1 0.1 0.1 c-2-hexene µg/m³ ≤ LOD ≤ LOD ≤ LOD ≤ LOD 1,3-hexadiene (trans) µg/m³ ≤ LOD ≤ LOD ≤ LOD ≤ LOD Methylcyclopentane µg/m³ 0.2 0.1 0.2 1.5 ± 0.1 2,4-dimethylpentane µg/m³ 0.2 0.2 0.1 0.4 Benzene µg/m³ 0.9 ± 0.2 0.8 ± 0.1 1.6 ± 0.3 4.2 ± 0.8 Cyclohexane µg/m³ 0.5 0.1 0.6 2.2 ± 0.1 2-methylhexane µg/m³ 0.1 0.1 0.1 0.6 2,3-dimethylpentane µg/m³ 0.8 ± 0.1 0.7 ± 0.1 0.8 ± 0.1 0.8 ± 0.1 Cyclohexene µg/m³ ≤ LOD ≤ LOD ≤ LOD 0.1 3-methylhexane µg/m³ 0.1 0.1 0.1 0.6 1,3-dimethylcyclopentane (cis) µg/m³ ≤ LOD ≤ LOD ≤ LOD 0.2 1-heptene µg/m³ 0.2 ± 0.1 0.2 0.2 0.8 ± 0.1 2,2,4-trimethylpentane µg/m³ 0 ± 0.1 0.2 ± 0.1 0.1 ± 0.1 0.2 ± 0.1 n-heptane µg/m³ 0.2 0.2 0.2 0.7 2,3-dimethyl-2-pentene µg/m³ ≤ LOD ≤ LOD ≤ LOD ≤ LOD Methylcyclohexane µg/m³ 0.1 ± 0.1 0.3 ± 0.1 1 ± 0.2 4.1 ± 0.9 2,3,4-trimethylpentane µg/m³ 0 ± 0.1 0 ± 0.1 0 ± 0.1 0 ± 0.1
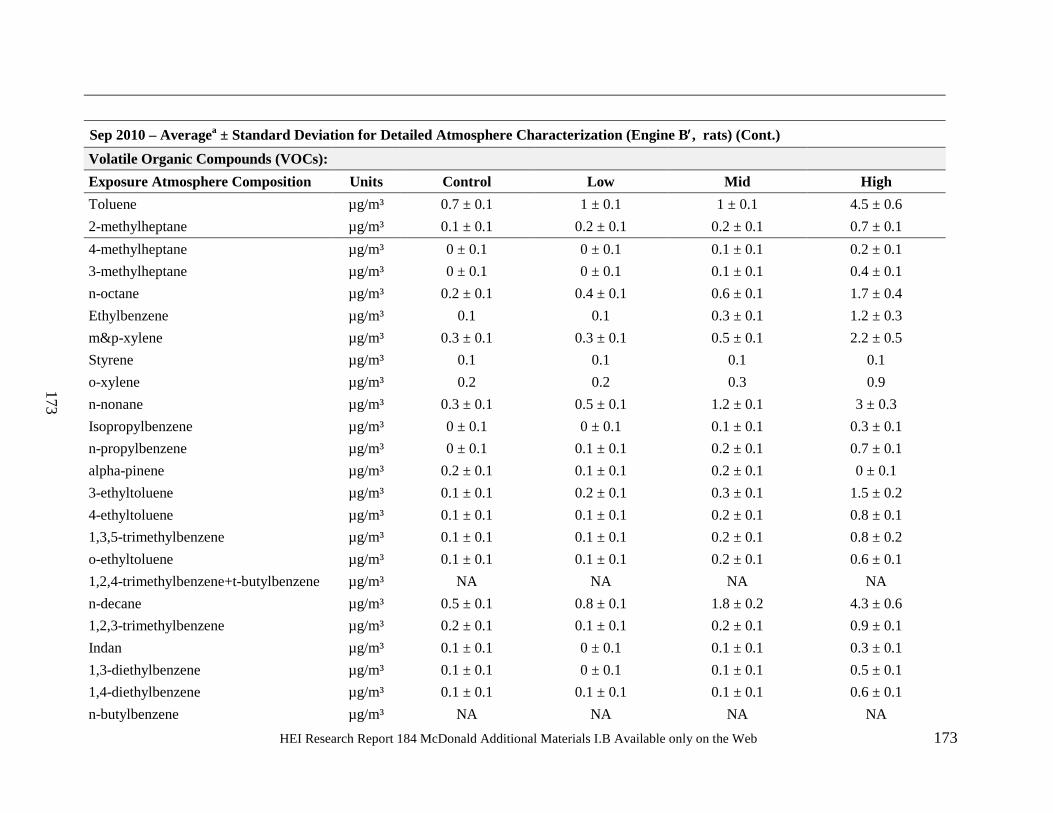
HEI Research Report 184 McDonald Additional Materials I.B Available only on the Web 173
173
Sep 2010 – Averagea ± Standard Deviation for Detailed Atmosphere Characterization (Engine B′, rats) (Cont.) Volatile Organic Compounds (VOCs): Exposure Atmosphere Composition Units Control Low Mid High Toluene µg/m³ 0.7 ± 0.1 1 ± 0.1 1 ± 0.1 4.5 ± 0.6 2-methylheptane µg/m³ 0.1 ± 0.1 0.2 ± 0.1 0.2 ± 0.1 0.7 ± 0.1 4-methylheptane µg/m³ 0 ± 0.1 0 ± 0.1 0.1 ± 0.1 0.2 ± 0.1 3-methylheptane µg/m³ 0 ± 0.1 0 ± 0.1 0.1 ± 0.1 0.4 ± 0.1 n-octane µg/m³ 0.2 ± 0.1 0.4 ± 0.1 0.6 ± 0.1 1.7 ± 0.4 Ethylbenzene µg/m³ 0.1 0.1 0.3 ± 0.1 1.2 ± 0.3 m&p-xylene µg/m³ 0.3 ± 0.1 0.3 ± 0.1 0.5 ± 0.1 2.2 ± 0.5 Styrene µg/m³ 0.1 0.1 0.1 0.1 o-xylene µg/m³ 0.2 0.2 0.3 0.9 n-nonane µg/m³ 0.3 ± 0.1 0.5 ± 0.1 1.2 ± 0.1 3 ± 0.3 Isopropylbenzene µg/m³ 0 ± 0.1 0 ± 0.1 0.1 ± 0.1 0.3 ± 0.1 n-propylbenzene µg/m³ 0 ± 0.1 0.1 ± 0.1 0.2 ± 0.1 0.7 ± 0.1 alpha-pinene µg/m³ 0.2 ± 0.1 0.1 ± 0.1 0.2 ± 0.1 0 ± 0.1 3-ethyltoluene µg/m³ 0.1 ± 0.1 0.2 ± 0.1 0.3 ± 0.1 1.5 ± 0.2 4-ethyltoluene µg/m³ 0.1 ± 0.1 0.1 ± 0.1 0.2 ± 0.1 0.8 ± 0.1 1,3,5-trimethylbenzene µg/m³ 0.1 ± 0.1 0.1 ± 0.1 0.2 ± 0.1 0.8 ± 0.2 o-ethyltoluene µg/m³ 0.1 ± 0.1 0.1 ± 0.1 0.2 ± 0.1 0.6 ± 0.1 1,2,4-trimethylbenzene+t-butylbenzene µg/m³ NA NA NA NA n-decane µg/m³ 0.5 ± 0.1 0.8 ± 0.1 1.8 ± 0.2 4.3 ± 0.6 1,2,3-trimethylbenzene µg/m³ 0.2 ± 0.1 0.1 ± 0.1 0.2 ± 0.1 0.9 ± 0.1 Indan µg/m³ 0.1 ± 0.1 0 ± 0.1 0.1 ± 0.1 0.3 ± 0.1 1,3-diethylbenzene µg/m³ 0.1 ± 0.1 0 ± 0.1 0.1 ± 0.1 0.5 ± 0.1 1,4-diethylbenzene µg/m³ 0.1 ± 0.1 0.1 ± 0.1 0.1 ± 0.1 0.6 ± 0.1 n-butylbenzene µg/m³ NA NA NA NA
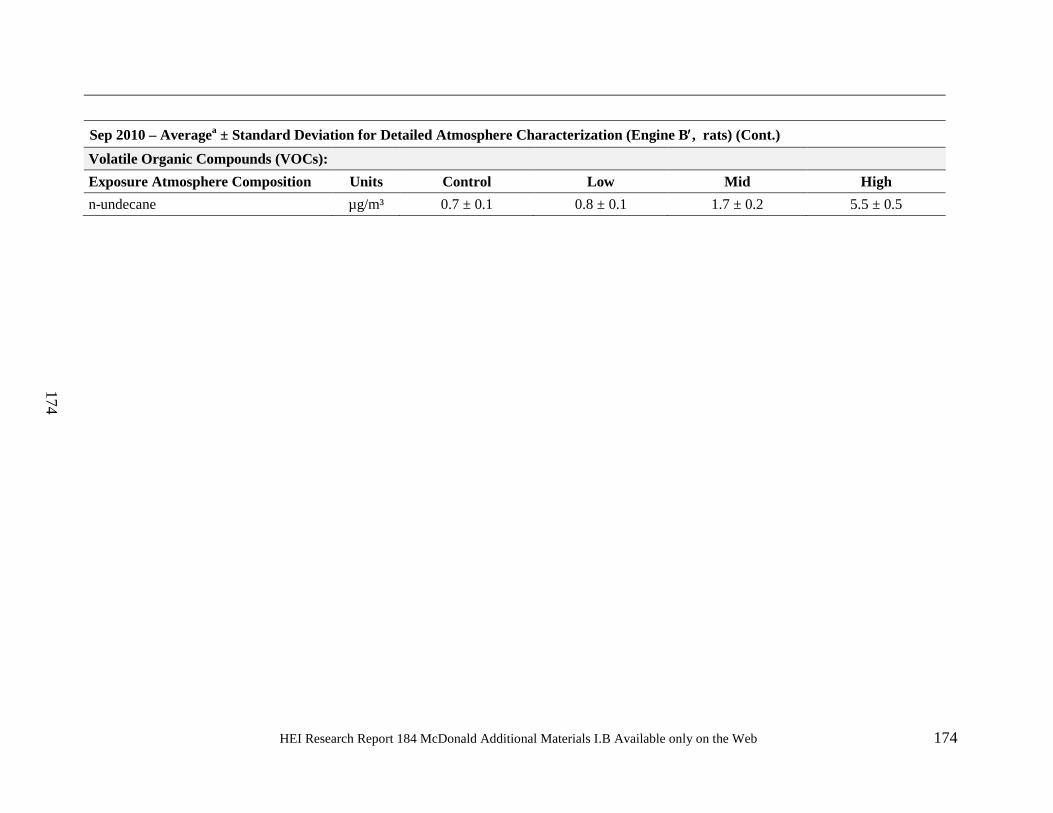
HEI Research Report 184 McDonald Additional Materials I.B Available only on the Web 174
174
Sep 2010 – Averagea ± Standard Deviation for Detailed Atmosphere Characterization (Engine B′, rats) (Cont.) Volatile Organic Compounds (VOCs): Exposure Atmosphere Composition Units Control Low Mid High n-undecane µg/m³ 0.7 ± 0.1 0.8 ± 0.1 1.7 ± 0.2 5.5 ± 0.5
ACES: Phase 3B: Characterization of Exposure Atmospheres
175
Appendix G.
April 2011 – Average ± Standard Deviation for Detailed Atmosphere Characterization
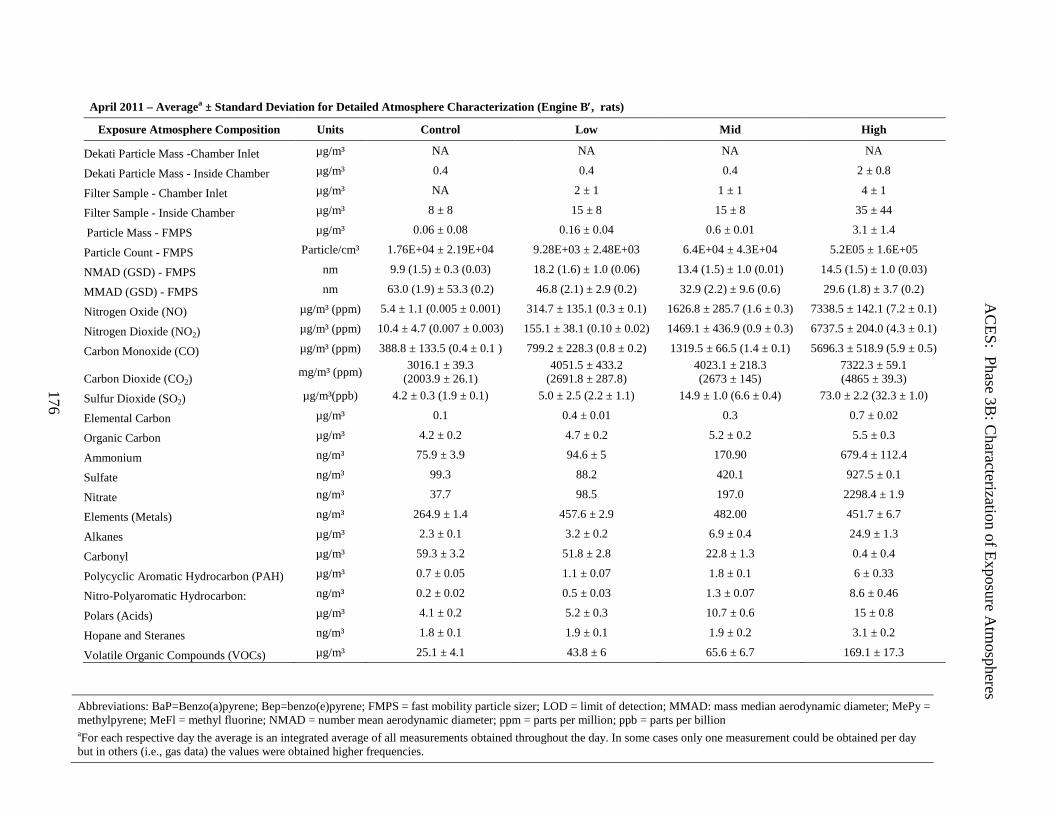
AC
ES: Phase 3B: C
haracterization of Exposure Atm
ospheres
176
April 2011 – Averagea ± Standard Deviation for Detailed Atmosphere Characterization (Engine B′, rats)
Exposure Atmosphere Composition Units Control Low Mid High
Dekati Particle Mass -Chamber Inlet µg/m³ NA NA NA NA
Dekati Particle Mass - Inside Chamber µg/m³ 0.4 0.4 0.4 2 ± 0.8
Filter Sample - Chamber Inlet µg/m³ NA 2 ± 1 1 ± 1 4 ± 1
Filter Sample - Inside Chamber µg/m³ 8 ± 8 15 ± 8 15 ± 8 35 ± 44
Particle Mass - FMPS µg/m³ 0.06 ± 0.08 0.16 ± 0.04 0.6 ± 0.01 3.1 ± 1.4
Particle Count - FMPS Particle/cm³ 1.76E+04 ± 2.19E+04 9.28E+03 ± 2.48E+03 6.4E+04 ± 4.3E+04 5.2E05 ± 1.6E+05
NMAD (GSD) - FMPS nm 9.9 (1.5) ± 0.3 (0.03) 18.2 (1.6) ± 1.0 (0.06) 13.4 (1.5) ± 1.0 (0.01) 14.5 (1.5) ± 1.0 (0.03)
MMAD (GSD) - FMPS nm 63.0 (1.9) ± 53.3 (0.2) 46.8 (2.1) ± 2.9 (0.2) 32.9 (2.2) ± 9.6 (0.6) 29.6 (1.8) ± 3.7 (0.2)
Nitrogen Oxide (NO) µg/m³ (ppm) 5.4 ± 1.1 (0.005 ± 0.001) 314.7 ± 135.1 (0.3 ± 0.1) 1626.8 ± 285.7 (1.6 ± 0.3) 7338.5 ± 142.1 (7.2 ± 0.1)
Nitrogen Dioxide (NO2) µg/m³ (ppm) 10.4 ± 4.7 (0.007 ± 0.003) 155.1 ± 38.1 (0.10 ± 0.02) 1469.1 ± 436.9 (0.9 ± 0.3) 6737.5 ± 204.0 (4.3 ± 0.1)
Carbon Monoxide (CO) µg/m³ (ppm) 388.8 ± 133.5 (0.4 ± 0.1 ) 799.2 ± 228.3 (0.8 ± 0.2) 1319.5 ± 66.5 (1.4 ± 0.1) 5696.3 ± 518.9 (5.9 ± 0.5)
Carbon Dioxide (CO2) mg/m³ (ppm) 3016.1 ± 39.3
(2003.9 ± 26.1) 4051.5 ± 433.2
(2691.8 ± 287.8) 4023.1 ± 218.3 (2673 ± 145)
7322.3 ± 59.1 (4865 ± 39.3)
Sulfur Dioxide (SO2) µg/m³(ppb) 4.2 ± 0.3 (1.9 ± 0.1) 5.0 ± 2.5 (2.2 ± 1.1) 14.9 ± 1.0 (6.6 ± 0.4) 73.0 ± 2.2 (32.3 ± 1.0)
Elemental Carbon µg/m³ 0.1 0.4 ± 0.01 0.3 0.7 ± 0.02
Organic Carbon µg/m³ 4.2 ± 0.2 4.7 ± 0.2 5.2 ± 0.2 5.5 ± 0.3
Ammonium ng/m³ 75.9 ± 3.9 94.6 ± 5 170.90 679.4 ± 112.4
Sulfate ng/m³ 99.3 88.2 420.1 927.5 ± 0.1
Nitrate ng/m³ 37.7 98.5 197.0 2298.4 ± 1.9
Elements (Metals) ng/m³ 264.9 ± 1.4 457.6 ± 2.9 482.00 451.7 ± 6.7
Alkanes µg/m³ 2.3 ± 0.1 3.2 ± 0.2 6.9 ± 0.4 24.9 ± 1.3
Carbonyl µg/m³ 59.3 ± 3.2 51.8 ± 2.8 22.8 ± 1.3 0.4 ± 0.4
Polycyclic Aromatic Hydrocarbon (PAH) µg/m³ 0.7 ± 0.05 1.1 ± 0.07 1.8 ± 0.1 6 ± 0.33
Nitro-Polyaromatic Hydrocarbon: ng/m³ 0.2 ± 0.02 0.5 ± 0.03 1.3 ± 0.07 8.6 ± 0.46
Polars (Acids) µg/m³ 4.1 ± 0.2 5.2 ± 0.3 10.7 ± 0.6 15 ± 0.8
Hopane and Steranes ng/m³ 1.8 ± 0.1 1.9 ± 0.1 1.9 ± 0.2 3.1 ± 0.2
Volatile Organic Compounds (VOCs) µg/m³ 25.1 ± 4.1 43.8 ± 6 65.6 ± 6.7 169.1 ± 17.3
Abbreviations: BaP=Benzo(a)pyrene; Bep=benzo(e)pyrene; FMPS = fast mobility particle sizer; LOD = limit of detection; MMAD: mass median aerodynamic diameter; MePy = methylpyrene; MeFl = methyl fluorine; NMAD = number mean aerodynamic diameter; ppm = parts per million; ppb = parts per billion aFor each respective day the average is an integrated average of all measurements obtained throughout the day. In some cases only one measurement could be obtained per day but in others (i.e., gas data) the values were obtained higher frequencies.
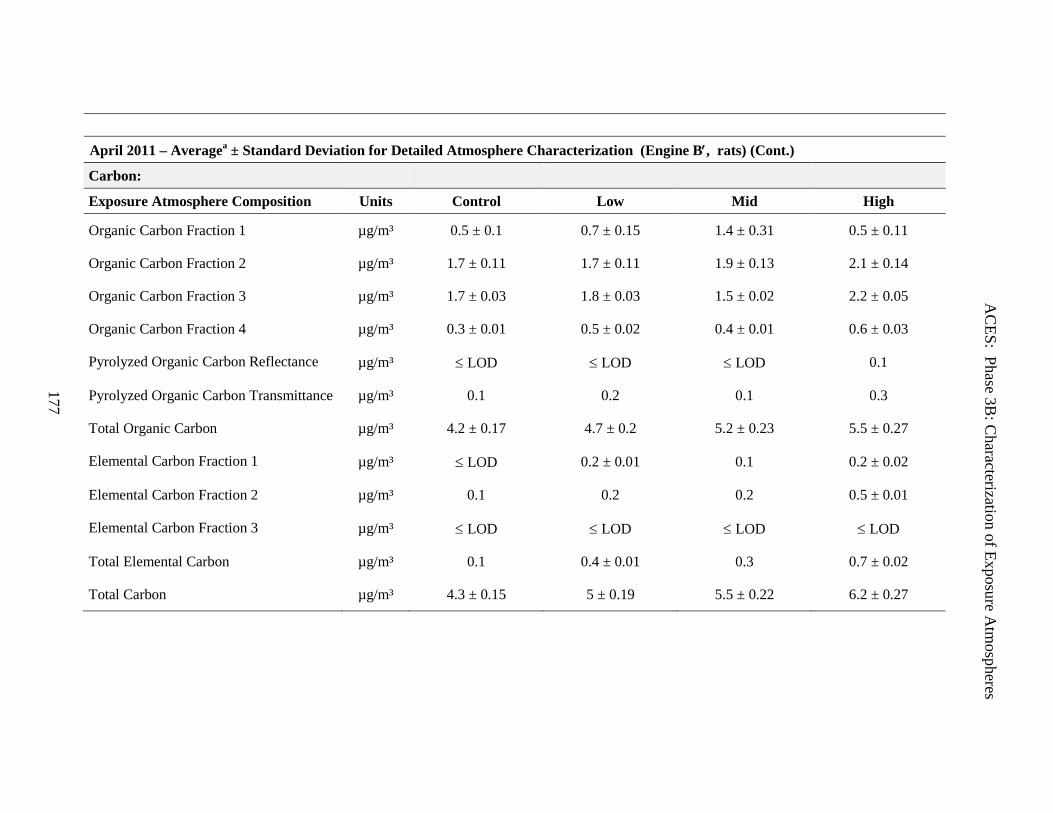
AC
ES: Phase 3B: C
haracterization of Exposure Atm
ospheres
177
April 2011 – Averagea ± Standard Deviation for Detailed Atmosphere Characterization (Engine B′, rats) (Cont.)
Carbon: Exposure Atmosphere Composition Units Control Low Mid High
Organic Carbon Fraction 1 µg/m³ 0.5 ± 0.1 0.7 ± 0.15 1.4 ± 0.31 0.5 ± 0.11
Organic Carbon Fraction 2 µg/m³ 1.7 ± 0.11 1.7 ± 0.11 1.9 ± 0.13 2.1 ± 0.14
Organic Carbon Fraction 3 µg/m³ 1.7 ± 0.03 1.8 ± 0.03 1.5 ± 0.02 2.2 ± 0.05
Organic Carbon Fraction 4 µg/m³ 0.3 ± 0.01 0.5 ± 0.02 0.4 ± 0.01 0.6 ± 0.03
Pyrolyzed Organic Carbon Reflectance µg/m³ ≤ LOD ≤ LOD ≤ LOD 0.1
Pyrolyzed Organic Carbon Transmittance µg/m³ 0.1 0.2 0.1 0.3
Total Organic Carbon µg/m³ 4.2 ± 0.17 4.7 ± 0.2 5.2 ± 0.23 5.5 ± 0.27
Elemental Carbon Fraction 1 µg/m³ ≤ LOD 0.2 ± 0.01 0.1 0.2 ± 0.02
Elemental Carbon Fraction 2 µg/m³ 0.1 0.2 0.2 0.5 ± 0.01
Elemental Carbon Fraction 3 µg/m³ ≤ LOD ≤ LOD ≤ LOD ≤ LOD
Total Elemental Carbon µg/m³ 0.1 0.4 ± 0.01 0.3 0.7 ± 0.02
Total Carbon µg/m³ 4.3 ± 0.15 5 ± 0.19 5.5 ± 0.22 6.2 ± 0.27
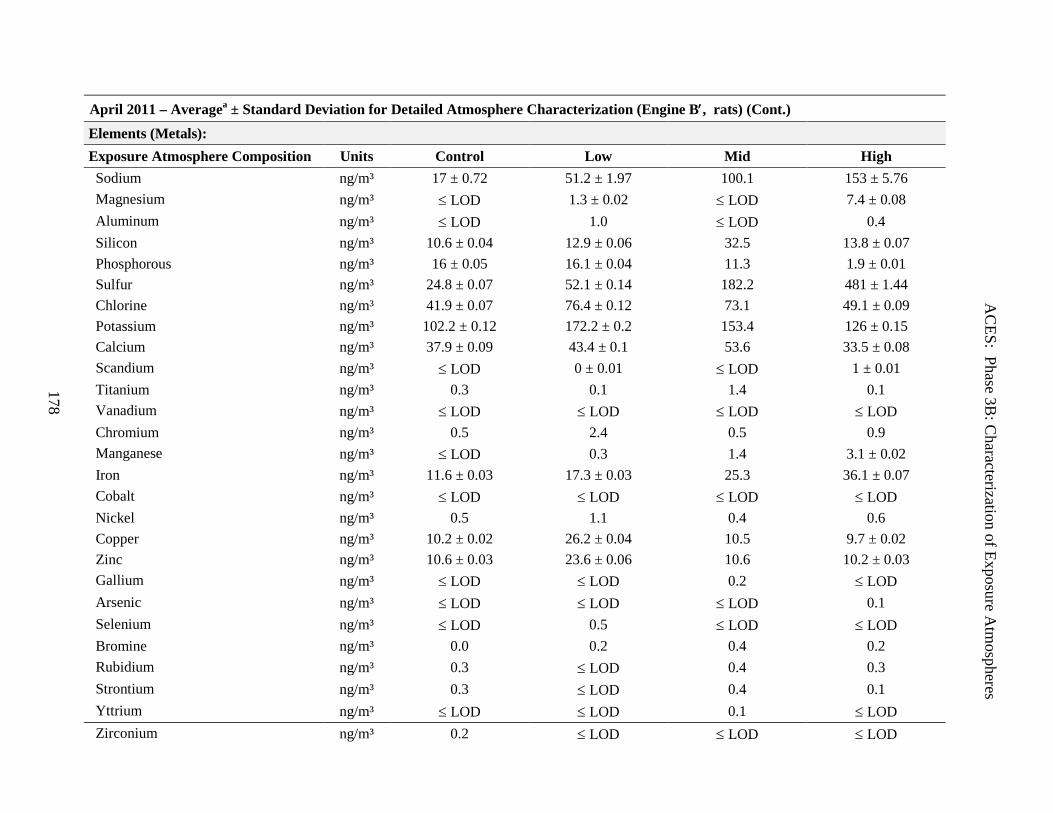
AC
ES: Phase 3B: C
haracterization of Exposure Atm
ospheres
178
April 2011 – Averagea ± Standard Deviation for Detailed Atmosphere Characterization (Engine B′, rats) (Cont.) Elements (Metals): Exposure Atmosphere Composition Units Control Low Mid High Sodium ng/m³ 17 ± 0.72 51.2 ± 1.97 100.1 153 ± 5.76 Magnesium ng/m³ ≤ LOD 1.3 ± 0.02 ≤ LOD 7.4 ± 0.08 Aluminum ng/m³ ≤ LOD 1.0 ≤ LOD 0.4 Silicon ng/m³ 10.6 ± 0.04 12.9 ± 0.06 32.5 13.8 ± 0.07 Phosphorous ng/m³ 16 ± 0.05 16.1 ± 0.04 11.3 1.9 ± 0.01 Sulfur ng/m³ 24.8 ± 0.07 52.1 ± 0.14 182.2 481 ± 1.44 Chlorine ng/m³ 41.9 ± 0.07 76.4 ± 0.12 73.1 49.1 ± 0.09 Potassium ng/m³ 102.2 ± 0.12 172.2 ± 0.2 153.4 126 ± 0.15 Calcium ng/m³ 37.9 ± 0.09 43.4 ± 0.1 53.6 33.5 ± 0.08 Scandium ng/m³ ≤ LOD 0 ± 0.01 ≤ LOD 1 ± 0.01 Titanium ng/m³ 0.3 0.1 1.4 0.1 Vanadium ng/m³ ≤ LOD ≤ LOD ≤ LOD ≤ LOD Chromium ng/m³ 0.5 2.4 0.5 0.9 Manganese ng/m³ ≤ LOD 0.3 1.4 3.1 ± 0.02 Iron ng/m³ 11.6 ± 0.03 17.3 ± 0.03 25.3 36.1 ± 0.07 Cobalt ng/m³ ≤ LOD ≤ LOD ≤ LOD ≤ LOD Nickel ng/m³ 0.5 1.1 0.4 0.6 Copper ng/m³ 10.2 ± 0.02 26.2 ± 0.04 10.5 9.7 ± 0.02 Zinc ng/m³ 10.6 ± 0.03 23.6 ± 0.06 10.6 10.2 ± 0.03 Gallium ng/m³ ≤ LOD ≤ LOD 0.2 ≤ LOD Arsenic ng/m³ ≤ LOD ≤ LOD ≤ LOD 0.1 Selenium ng/m³ ≤ LOD 0.5 ≤ LOD ≤ LOD Bromine ng/m³ 0.0 0.2 0.4 0.2 Rubidium ng/m³ 0.3 ≤ LOD 0.4 0.3 Strontium ng/m³ 0.3 ≤ LOD 0.4 0.1 Yttrium ng/m³ ≤ LOD ≤ LOD 0.1 ≤ LOD Zirconium ng/m³ 0.2 ≤ LOD ≤ LOD ≤ LOD
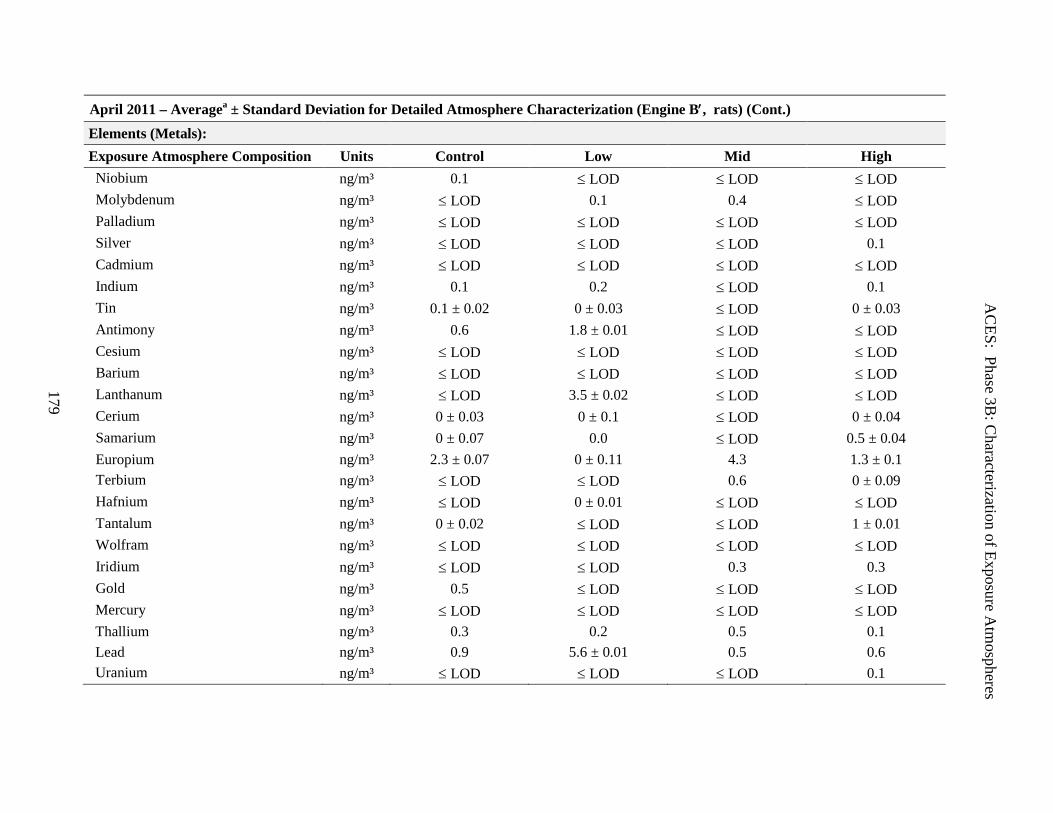
AC
ES: Phase 3B: C
haracterization of Exposure Atm
ospheres
179
April 2011 – Averagea ± Standard Deviation for Detailed Atmosphere Characterization (Engine B′, rats) (Cont.) Elements (Metals): Exposure Atmosphere Composition Units Control Low Mid High Niobium ng/m³ 0.1 ≤ LOD ≤ LOD ≤ LOD Molybdenum ng/m³ ≤ LOD 0.1 0.4 ≤ LOD Palladium ng/m³ ≤ LOD ≤ LOD ≤ LOD ≤ LOD Silver ng/m³ ≤ LOD ≤ LOD ≤ LOD 0.1 Cadmium ng/m³ ≤ LOD ≤ LOD ≤ LOD ≤ LOD Indium ng/m³ 0.1 0.2 ≤ LOD 0.1 Tin ng/m³ 0.1 ± 0.02 0 ± 0.03 ≤ LOD 0 ± 0.03 Antimony ng/m³ 0.6 1.8 ± 0.01 ≤ LOD ≤ LOD Cesium ng/m³ ≤ LOD ≤ LOD ≤ LOD ≤ LOD Barium ng/m³ ≤ LOD ≤ LOD ≤ LOD ≤ LOD Lanthanum ng/m³ ≤ LOD 3.5 ± 0.02 ≤ LOD ≤ LOD Cerium ng/m³ 0 ± 0.03 0 ± 0.1 ≤ LOD 0 ± 0.04 Samarium ng/m³ 0 ± 0.07 0.0 ≤ LOD 0.5 ± 0.04 Europium ng/m³ 2.3 ± 0.07 0 ± 0.11 4.3 1.3 ± 0.1 Terbium ng/m³ ≤ LOD ≤ LOD 0.6 0 ± 0.09 Hafnium ng/m³ ≤ LOD 0 ± 0.01 ≤ LOD ≤ LOD Tantalum ng/m³ 0 ± 0.02 ≤ LOD ≤ LOD 1 ± 0.01 Wolfram ng/m³ ≤ LOD ≤ LOD ≤ LOD ≤ LOD Iridium ng/m³ ≤ LOD ≤ LOD 0.3 0.3 Gold ng/m³ 0.5 ≤ LOD ≤ LOD ≤ LOD Mercury ng/m³ ≤ LOD ≤ LOD ≤ LOD ≤ LOD Thallium ng/m³ 0.3 0.2 0.5 0.1 Lead ng/m³ 0.9 5.6 ± 0.01 0.5 0.6 Uranium ng/m³ ≤ LOD ≤ LOD ≤ LOD 0.1
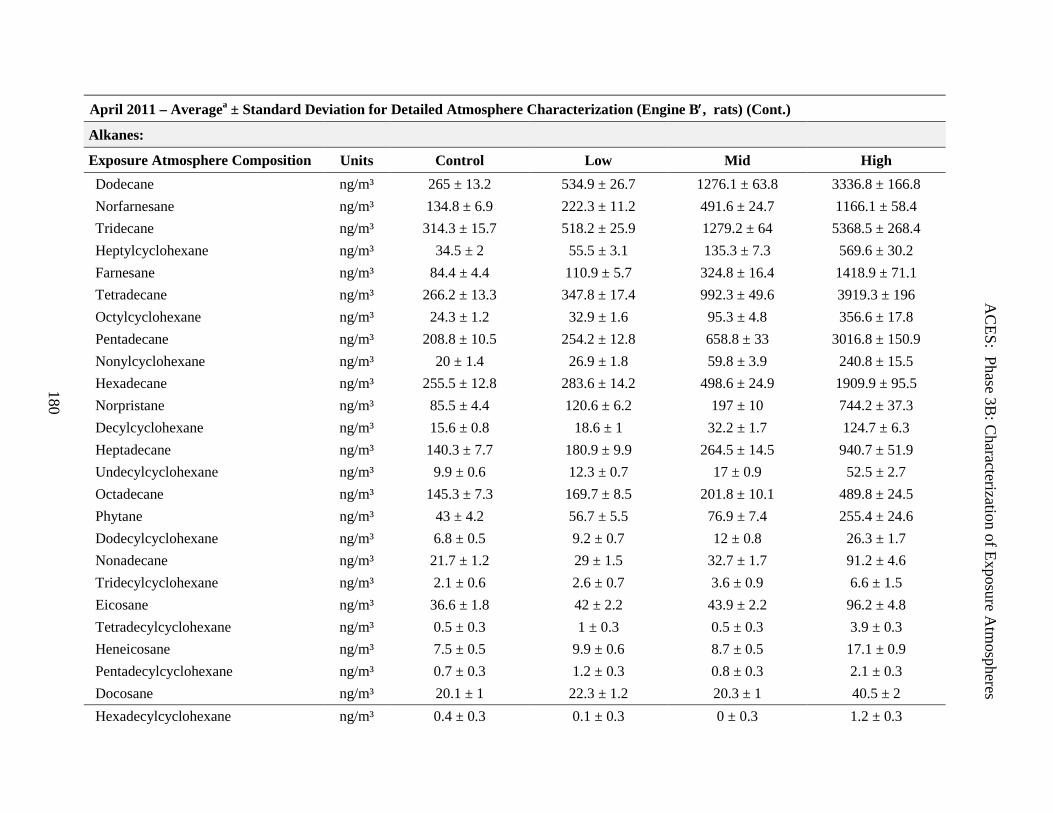
AC
ES: Phase 3B: C
haracterization of Exposure Atm
ospheres
180
April 2011 – Averagea ± Standard Deviation for Detailed Atmosphere Characterization (Engine B′, rats) (Cont.)
Alkanes:
Exposure Atmosphere Composition Units Control Low Mid High Dodecane ng/m³ 265 ± 13.2 534.9 ± 26.7 1276.1 ± 63.8 3336.8 ± 166.8 Norfarnesane ng/m³ 134.8 ± 6.9 222.3 ± 11.2 491.6 ± 24.7 1166.1 ± 58.4 Tridecane ng/m³ 314.3 ± 15.7 518.2 ± 25.9 1279.2 ± 64 5368.5 ± 268.4 Heptylcyclohexane ng/m³ 34.5 ± 2 55.5 ± 3.1 135.3 ± 7.3 569.6 ± 30.2 Farnesane ng/m³ 84.4 ± 4.4 110.9 ± 5.7 324.8 ± 16.4 1418.9 ± 71.1 Tetradecane ng/m³ 266.2 ± 13.3 347.8 ± 17.4 992.3 ± 49.6 3919.3 ± 196 Octylcyclohexane ng/m³ 24.3 ± 1.2 32.9 ± 1.6 95.3 ± 4.8 356.6 ± 17.8 Pentadecane ng/m³ 208.8 ± 10.5 254.2 ± 12.8 658.8 ± 33 3016.8 ± 150.9 Nonylcyclohexane ng/m³ 20 ± 1.4 26.9 ± 1.8 59.8 ± 3.9 240.8 ± 15.5 Hexadecane ng/m³ 255.5 ± 12.8 283.6 ± 14.2 498.6 ± 24.9 1909.9 ± 95.5 Norpristane ng/m³ 85.5 ± 4.4 120.6 ± 6.2 197 ± 10 744.2 ± 37.3 Decylcyclohexane ng/m³ 15.6 ± 0.8 18.6 ± 1 32.2 ± 1.7 124.7 ± 6.3 Heptadecane ng/m³ 140.3 ± 7.7 180.9 ± 9.9 264.5 ± 14.5 940.7 ± 51.9 Undecylcyclohexane ng/m³ 9.9 ± 0.6 12.3 ± 0.7 17 ± 0.9 52.5 ± 2.7 Octadecane ng/m³ 145.3 ± 7.3 169.7 ± 8.5 201.8 ± 10.1 489.8 ± 24.5 Phytane ng/m³ 43 ± 4.2 56.7 ± 5.5 76.9 ± 7.4 255.4 ± 24.6 Dodecylcyclohexane ng/m³ 6.8 ± 0.5 9.2 ± 0.7 12 ± 0.8 26.3 ± 1.7 Nonadecane ng/m³ 21.7 ± 1.2 29 ± 1.5 32.7 ± 1.7 91.2 ± 4.6 Tridecylcyclohexane ng/m³ 2.1 ± 0.6 2.6 ± 0.7 3.6 ± 0.9 6.6 ± 1.5 Eicosane ng/m³ 36.6 ± 1.8 42 ± 2.2 43.9 ± 2.2 96.2 ± 4.8 Tetradecylcyclohexane ng/m³ 0.5 ± 0.3 1 ± 0.3 0.5 ± 0.3 3.9 ± 0.3 Heneicosane ng/m³ 7.5 ± 0.5 9.9 ± 0.6 8.7 ± 0.5 17.1 ± 0.9 Pentadecylcyclohexane ng/m³ 0.7 ± 0.3 1.2 ± 0.3 0.8 ± 0.3 2.1 ± 0.3 Docosane ng/m³ 20.1 ± 1 22.3 ± 1.2 20.3 ± 1 40.5 ± 2 Hexadecylcyclohexane ng/m³ 0.4 ± 0.3 0.1 ± 0.3 0 ± 0.3 1.2 ± 0.3
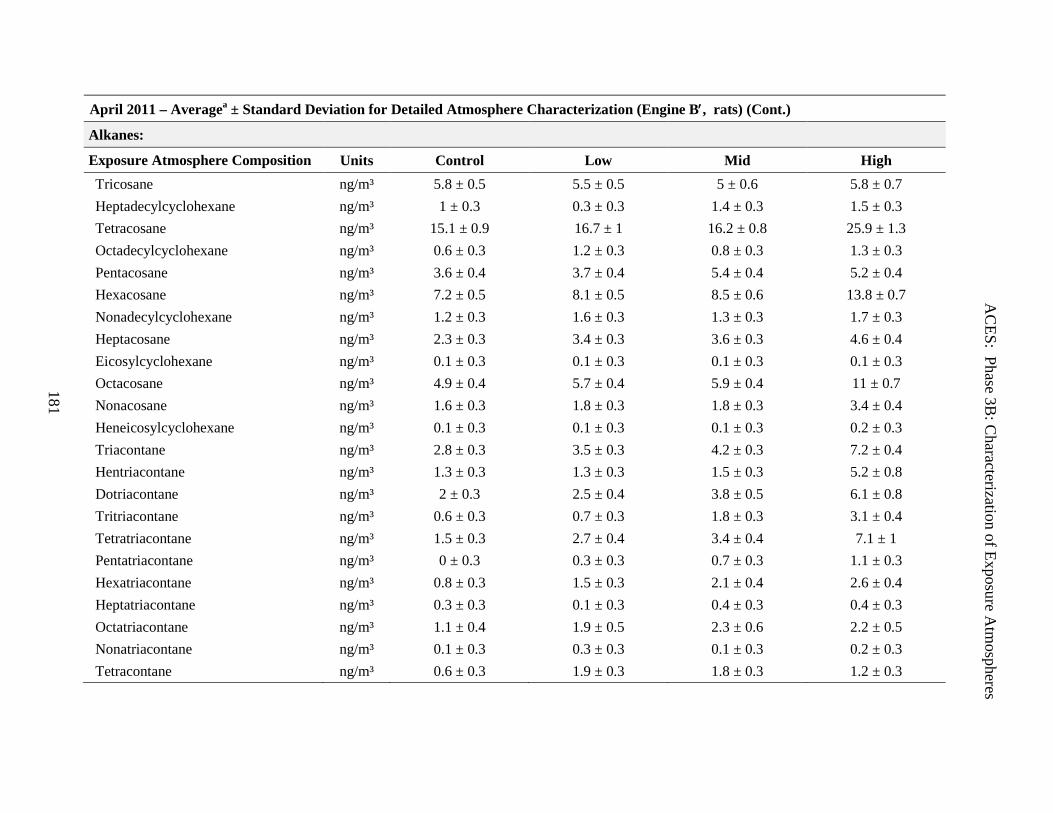
AC
ES: Phase 3B: C
haracterization of Exposure Atm
ospheres
181
April 2011 – Averagea ± Standard Deviation for Detailed Atmosphere Characterization (Engine B′, rats) (Cont.)
Alkanes:
Exposure Atmosphere Composition Units Control Low Mid High Tricosane ng/m³ 5.8 ± 0.5 5.5 ± 0.5 5 ± 0.6 5.8 ± 0.7 Heptadecylcyclohexane ng/m³ 1 ± 0.3 0.3 ± 0.3 1.4 ± 0.3 1.5 ± 0.3 Tetracosane ng/m³ 15.1 ± 0.9 16.7 ± 1 16.2 ± 0.8 25.9 ± 1.3 Octadecylcyclohexane ng/m³ 0.6 ± 0.3 1.2 ± 0.3 0.8 ± 0.3 1.3 ± 0.3 Pentacosane ng/m³ 3.6 ± 0.4 3.7 ± 0.4 5.4 ± 0.4 5.2 ± 0.4 Hexacosane ng/m³ 7.2 ± 0.5 8.1 ± 0.5 8.5 ± 0.6 13.8 ± 0.7 Nonadecylcyclohexane ng/m³ 1.2 ± 0.3 1.6 ± 0.3 1.3 ± 0.3 1.7 ± 0.3 Heptacosane ng/m³ 2.3 ± 0.3 3.4 ± 0.3 3.6 ± 0.3 4.6 ± 0.4 Eicosylcyclohexane ng/m³ 0.1 ± 0.3 0.1 ± 0.3 0.1 ± 0.3 0.1 ± 0.3 Octacosane ng/m³ 4.9 ± 0.4 5.7 ± 0.4 5.9 ± 0.4 11 ± 0.7 Nonacosane ng/m³ 1.6 ± 0.3 1.8 ± 0.3 1.8 ± 0.3 3.4 ± 0.4 Heneicosylcyclohexane ng/m³ 0.1 ± 0.3 0.1 ± 0.3 0.1 ± 0.3 0.2 ± 0.3 Triacontane ng/m³ 2.8 ± 0.3 3.5 ± 0.3 4.2 ± 0.3 7.2 ± 0.4 Hentriacontane ng/m³ 1.3 ± 0.3 1.3 ± 0.3 1.5 ± 0.3 5.2 ± 0.8 Dotriacontane ng/m³ 2 ± 0.3 2.5 ± 0.4 3.8 ± 0.5 6.1 ± 0.8 Tritriacontane ng/m³ 0.6 ± 0.3 0.7 ± 0.3 1.8 ± 0.3 3.1 ± 0.4 Tetratriacontane ng/m³ 1.5 ± 0.3 2.7 ± 0.4 3.4 ± 0.4 7.1 ± 1 Pentatriacontane ng/m³ 0 ± 0.3 0.3 ± 0.3 0.7 ± 0.3 1.1 ± 0.3 Hexatriacontane ng/m³ 0.8 ± 0.3 1.5 ± 0.3 2.1 ± 0.4 2.6 ± 0.4 Heptatriacontane ng/m³ 0.3 ± 0.3 0.1 ± 0.3 0.4 ± 0.3 0.4 ± 0.3 Octatriacontane ng/m³ 1.1 ± 0.4 1.9 ± 0.5 2.3 ± 0.6 2.2 ± 0.5 Nonatriacontane ng/m³ 0.1 ± 0.3 0.3 ± 0.3 0.1 ± 0.3 0.2 ± 0.3 Tetracontane ng/m³ 0.6 ± 0.3 1.9 ± 0.3 1.8 ± 0.3 1.2 ± 0.3
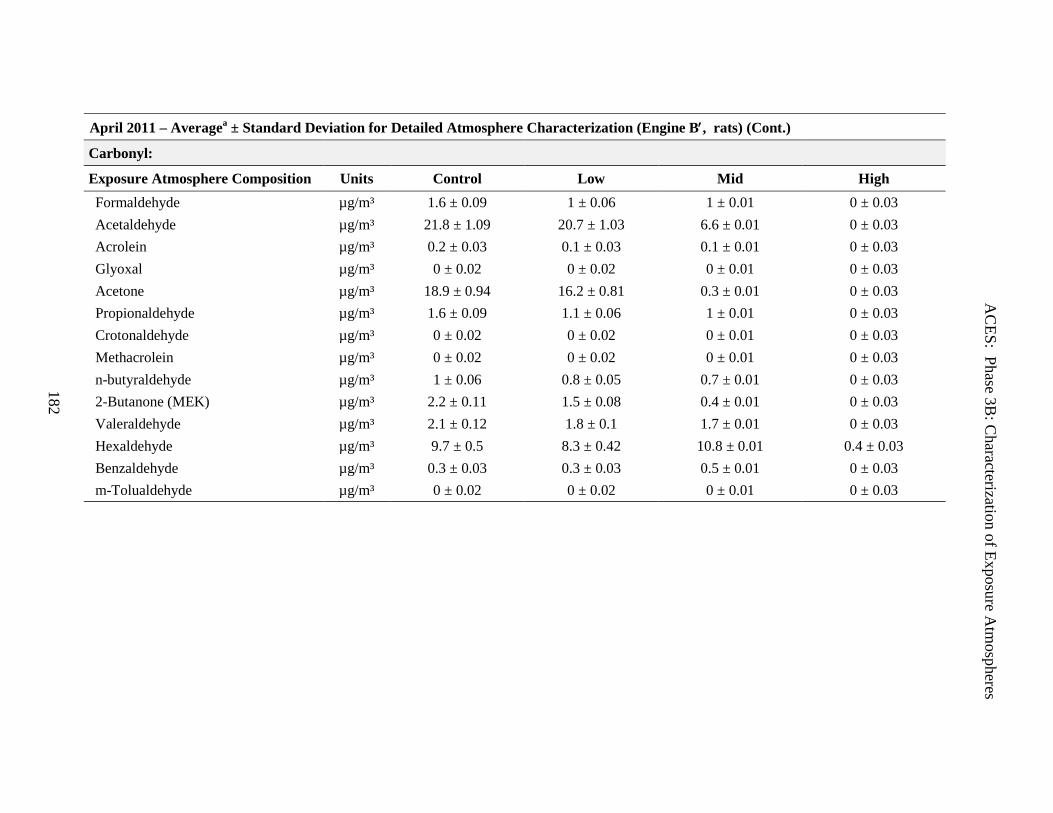
AC
ES: Phase 3B: C
haracterization of Exposure Atm
ospheres
182
April 2011 – Averagea ± Standard Deviation for Detailed Atmosphere Characterization (Engine B′, rats) (Cont.)
Carbonyl: Exposure Atmosphere Composition Units Control Low Mid High Formaldehyde µg/m³ 1.6 ± 0.09 1 ± 0.06 1 ± 0.01 0 ± 0.03 Acetaldehyde µg/m³ 21.8 ± 1.09 20.7 ± 1.03 6.6 ± 0.01 0 ± 0.03 Acrolein µg/m³ 0.2 ± 0.03 0.1 ± 0.03 0.1 ± 0.01 0 ± 0.03 Glyoxal µg/m³ 0 ± 0.02 0 ± 0.02 0 ± 0.01 0 ± 0.03 Acetone µg/m³ 18.9 ± 0.94 16.2 ± 0.81 0.3 ± 0.01 0 ± 0.03 Propionaldehyde µg/m³ 1.6 ± 0.09 1.1 ± 0.06 1 ± 0.01 0 ± 0.03 Crotonaldehyde µg/m³ 0 ± 0.02 0 ± 0.02 0 ± 0.01 0 ± 0.03 Methacrolein µg/m³ 0 ± 0.02 0 ± 0.02 0 ± 0.01 0 ± 0.03 n-butyraldehyde µg/m³ 1 ± 0.06 0.8 ± 0.05 0.7 ± 0.01 0 ± 0.03 2-Butanone (MEK) µg/m³ 2.2 ± 0.11 1.5 ± 0.08 0.4 ± 0.01 0 ± 0.03 Valeraldehyde µg/m³ 2.1 ± 0.12 1.8 ± 0.1 1.7 ± 0.01 0 ± 0.03 Hexaldehyde µg/m³ 9.7 ± 0.5 8.3 ± 0.42 10.8 ± 0.01 0.4 ± 0.03 Benzaldehyde µg/m³ 0.3 ± 0.03 0.3 ± 0.03 0.5 ± 0.01 0 ± 0.03 m-Tolualdehyde µg/m³ 0 ± 0.02 0 ± 0.02 0 ± 0.01 0 ± 0.03
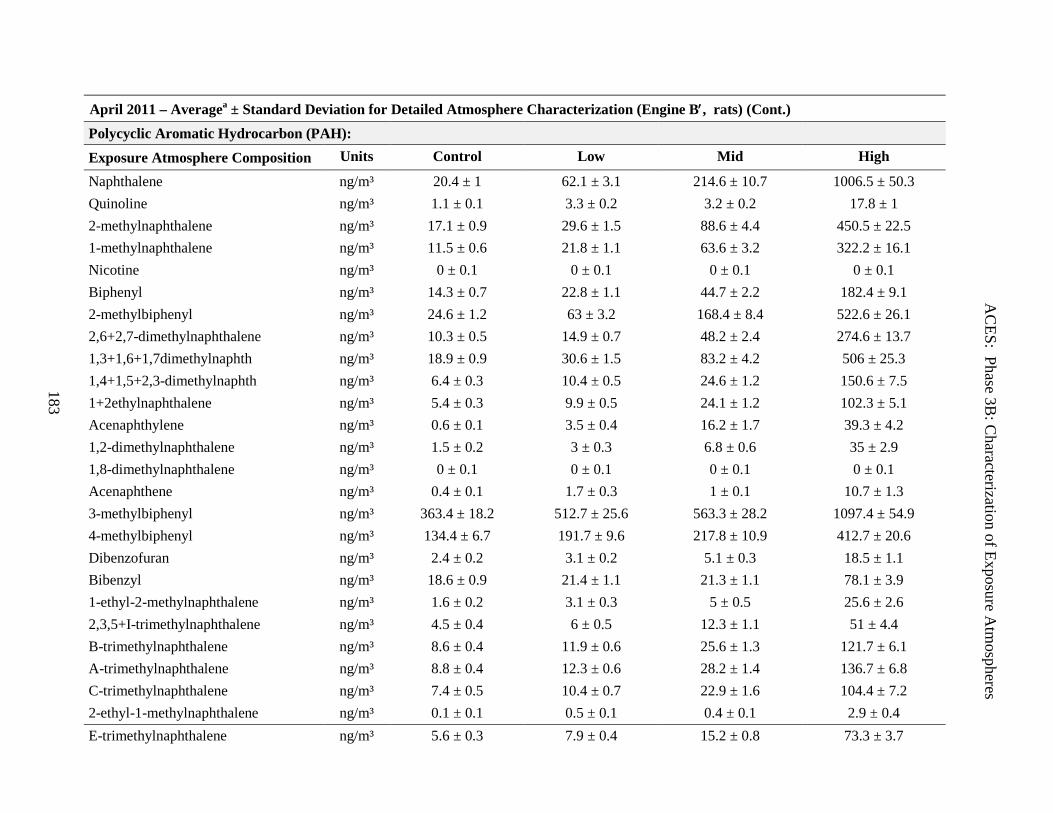
AC
ES: Phase 3B: C
haracterization of Exposure Atm
ospheres
183
April 2011 – Averagea ± Standard Deviation for Detailed Atmosphere Characterization (Engine B′, rats) (Cont.) Polycyclic Aromatic Hydrocarbon (PAH): Exposure Atmosphere Composition Units Control Low Mid High Naphthalene ng/m³ 20.4 ± 1 62.1 ± 3.1 214.6 ± 10.7 1006.5 ± 50.3 Quinoline ng/m³ 1.1 ± 0.1 3.3 ± 0.2 3.2 ± 0.2 17.8 ± 1 2-methylnaphthalene ng/m³ 17.1 ± 0.9 29.6 ± 1.5 88.6 ± 4.4 450.5 ± 22.5 1-methylnaphthalene ng/m³ 11.5 ± 0.6 21.8 ± 1.1 63.6 ± 3.2 322.2 ± 16.1 Nicotine ng/m³ 0 ± 0.1 0 ± 0.1 0 ± 0.1 0 ± 0.1 Biphenyl ng/m³ 14.3 ± 0.7 22.8 ± 1.1 44.7 ± 2.2 182.4 ± 9.1 2-methylbiphenyl ng/m³ 24.6 ± 1.2 63 ± 3.2 168.4 ± 8.4 522.6 ± 26.1 2,6+2,7-dimethylnaphthalene ng/m³ 10.3 ± 0.5 14.9 ± 0.7 48.2 ± 2.4 274.6 ± 13.7 1,3+1,6+1,7dimethylnaphth ng/m³ 18.9 ± 0.9 30.6 ± 1.5 83.2 ± 4.2 506 ± 25.3 1,4+1,5+2,3-dimethylnaphth ng/m³ 6.4 ± 0.3 10.4 ± 0.5 24.6 ± 1.2 150.6 ± 7.5 1+2ethylnaphthalene ng/m³ 5.4 ± 0.3 9.9 ± 0.5 24.1 ± 1.2 102.3 ± 5.1 Acenaphthylene ng/m³ 0.6 ± 0.1 3.5 ± 0.4 16.2 ± 1.7 39.3 ± 4.2 1,2-dimethylnaphthalene ng/m³ 1.5 ± 0.2 3 ± 0.3 6.8 ± 0.6 35 ± 2.9 1,8-dimethylnaphthalene ng/m³ 0 ± 0.1 0 ± 0.1 0 ± 0.1 0 ± 0.1 Acenaphthene ng/m³ 0.4 ± 0.1 1.7 ± 0.3 1 ± 0.1 10.7 ± 1.3 3-methylbiphenyl ng/m³ 363.4 ± 18.2 512.7 ± 25.6 563.3 ± 28.2 1097.4 ± 54.9 4-methylbiphenyl ng/m³ 134.4 ± 6.7 191.7 ± 9.6 217.8 ± 10.9 412.7 ± 20.6 Dibenzofuran ng/m³ 2.4 ± 0.2 3.1 ± 0.2 5.1 ± 0.3 18.5 ± 1.1 Bibenzyl ng/m³ 18.6 ± 0.9 21.4 ± 1.1 21.3 ± 1.1 78.1 ± 3.9 1-ethyl-2-methylnaphthalene ng/m³ 1.6 ± 0.2 3.1 ± 0.3 5 ± 0.5 25.6 ± 2.6 2,3,5+I-trimethylnaphthalene ng/m³ 4.5 ± 0.4 6 ± 0.5 12.3 ± 1.1 51 ± 4.4 B-trimethylnaphthalene ng/m³ 8.6 ± 0.4 11.9 ± 0.6 25.6 ± 1.3 121.7 ± 6.1 A-trimethylnaphthalene ng/m³ 8.8 ± 0.4 12.3 ± 0.6 28.2 ± 1.4 136.7 ± 6.8 C-trimethylnaphthalene ng/m³ 7.4 ± 0.5 10.4 ± 0.7 22.9 ± 1.6 104.4 ± 7.2 2-ethyl-1-methylnaphthalene ng/m³ 0.1 ± 0.1 0.5 ± 0.1 0.4 ± 0.1 2.9 ± 0.4 E-trimethylnaphthalene ng/m³ 5.6 ± 0.3 7.9 ± 0.4 15.2 ± 0.8 73.3 ± 3.7
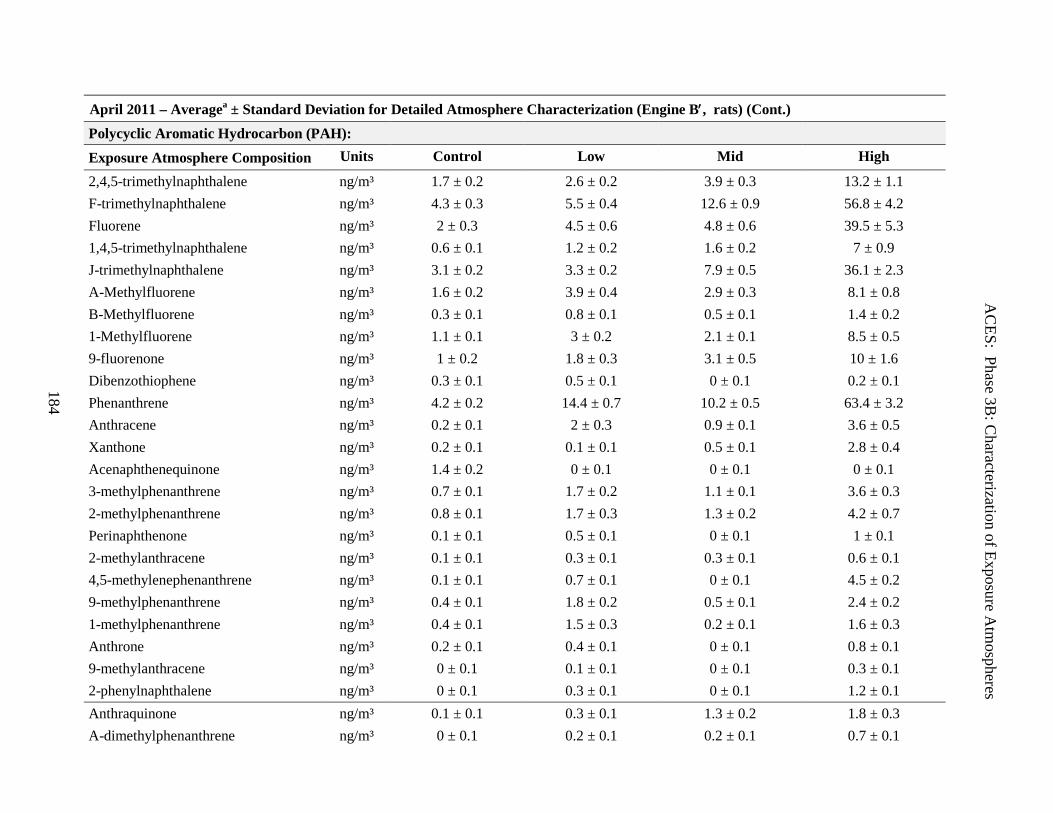
AC
ES: Phase 3B: C
haracterization of Exposure Atm
ospheres
184
April 2011 – Averagea ± Standard Deviation for Detailed Atmosphere Characterization (Engine B′, rats) (Cont.) Polycyclic Aromatic Hydrocarbon (PAH): Exposure Atmosphere Composition Units Control Low Mid High 2,4,5-trimethylnaphthalene ng/m³ 1.7 ± 0.2 2.6 ± 0.2 3.9 ± 0.3 13.2 ± 1.1 F-trimethylnaphthalene ng/m³ 4.3 ± 0.3 5.5 ± 0.4 12.6 ± 0.9 56.8 ± 4.2 Fluorene ng/m³ 2 ± 0.3 4.5 ± 0.6 4.8 ± 0.6 39.5 ± 5.3 1,4,5-trimethylnaphthalene ng/m³ 0.6 ± 0.1 1.2 ± 0.2 1.6 ± 0.2 7 ± 0.9 J-trimethylnaphthalene ng/m³ 3.1 ± 0.2 3.3 ± 0.2 7.9 ± 0.5 36.1 ± 2.3 A-Methylfluorene ng/m³ 1.6 ± 0.2 3.9 ± 0.4 2.9 ± 0.3 8.1 ± 0.8 B-Methylfluorene ng/m³ 0.3 ± 0.1 0.8 ± 0.1 0.5 ± 0.1 1.4 ± 0.2 1-Methylfluorene ng/m³ 1.1 ± 0.1 3 ± 0.2 2.1 ± 0.1 8.5 ± 0.5 9-fluorenone ng/m³ 1 ± 0.2 1.8 ± 0.3 3.1 ± 0.5 10 ± 1.6 Dibenzothiophene ng/m³ 0.3 ± 0.1 0.5 ± 0.1 0 ± 0.1 0.2 ± 0.1 Phenanthrene ng/m³ 4.2 ± 0.2 14.4 ± 0.7 10.2 ± 0.5 63.4 ± 3.2 Anthracene ng/m³ 0.2 ± 0.1 2 ± 0.3 0.9 ± 0.1 3.6 ± 0.5 Xanthone ng/m³ 0.2 ± 0.1 0.1 ± 0.1 0.5 ± 0.1 2.8 ± 0.4 Acenaphthenequinone ng/m³ 1.4 ± 0.2 0 ± 0.1 0 ± 0.1 0 ± 0.1 3-methylphenanthrene ng/m³ 0.7 ± 0.1 1.7 ± 0.2 1.1 ± 0.1 3.6 ± 0.3 2-methylphenanthrene ng/m³ 0.8 ± 0.1 1.7 ± 0.3 1.3 ± 0.2 4.2 ± 0.7 Perinaphthenone ng/m³ 0.1 ± 0.1 0.5 ± 0.1 0 ± 0.1 1 ± 0.1 2-methylanthracene ng/m³ 0.1 ± 0.1 0.3 ± 0.1 0.3 ± 0.1 0.6 ± 0.1 4,5-methylenephenanthrene ng/m³ 0.1 ± 0.1 0.7 ± 0.1 0 ± 0.1 4.5 ± 0.2 9-methylphenanthrene ng/m³ 0.4 ± 0.1 1.8 ± 0.2 0.5 ± 0.1 2.4 ± 0.2 1-methylphenanthrene ng/m³ 0.4 ± 0.1 1.5 ± 0.3 0.2 ± 0.1 1.6 ± 0.3 Anthrone ng/m³ 0.2 ± 0.1 0.4 ± 0.1 0 ± 0.1 0.8 ± 0.1 9-methylanthracene ng/m³ 0 ± 0.1 0.1 ± 0.1 0 ± 0.1 0.3 ± 0.1 2-phenylnaphthalene ng/m³ 0 ± 0.1 0.3 ± 0.1 0 ± 0.1 1.2 ± 0.1 Anthraquinone ng/m³ 0.1 ± 0.1 0.3 ± 0.1 1.3 ± 0.2 1.8 ± 0.3 A-dimethylphenanthrene ng/m³ 0 ± 0.1 0.2 ± 0.1 0.2 ± 0.1 0.7 ± 0.1
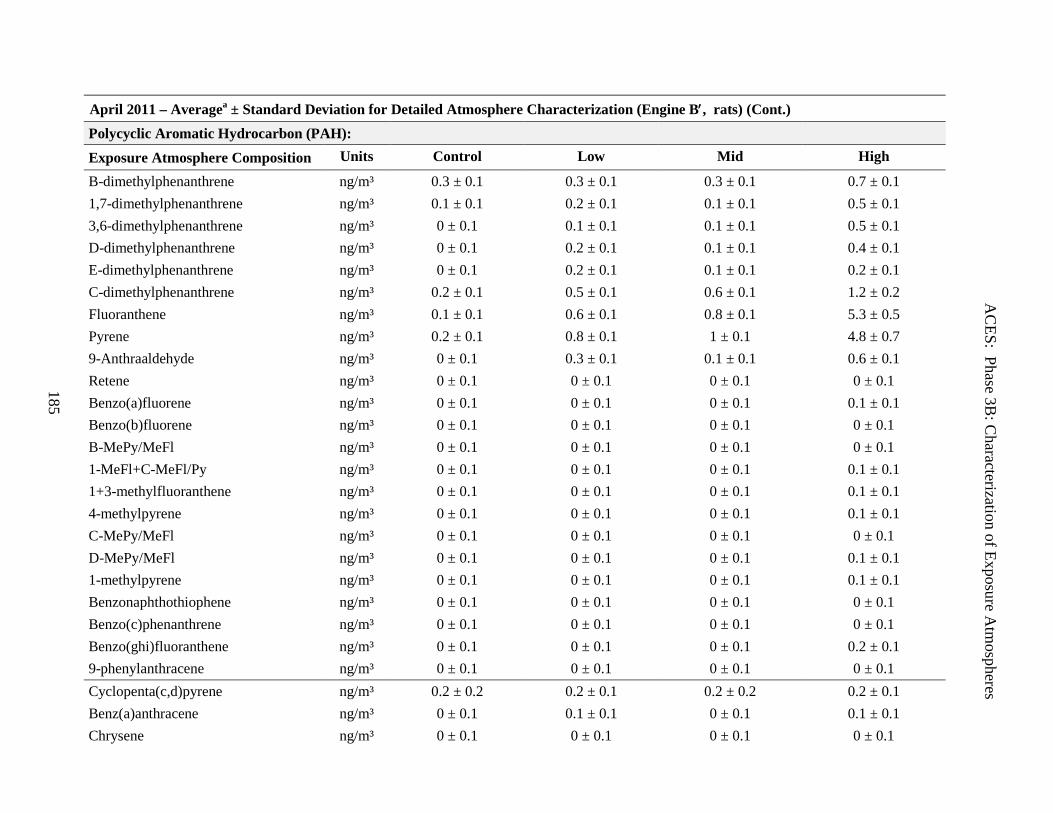
AC
ES: Phase 3B: C
haracterization of Exposure Atm
ospheres
185
April 2011 – Averagea ± Standard Deviation for Detailed Atmosphere Characterization (Engine B′, rats) (Cont.) Polycyclic Aromatic Hydrocarbon (PAH): Exposure Atmosphere Composition Units Control Low Mid High B-dimethylphenanthrene ng/m³ 0.3 ± 0.1 0.3 ± 0.1 0.3 ± 0.1 0.7 ± 0.1 1,7-dimethylphenanthrene ng/m³ 0.1 ± 0.1 0.2 ± 0.1 0.1 ± 0.1 0.5 ± 0.1 3,6-dimethylphenanthrene ng/m³ 0 ± 0.1 0.1 ± 0.1 0.1 ± 0.1 0.5 ± 0.1 D-dimethylphenanthrene ng/m³ 0 ± 0.1 0.2 ± 0.1 0.1 ± 0.1 0.4 ± 0.1 E-dimethylphenanthrene ng/m³ 0 ± 0.1 0.2 ± 0.1 0.1 ± 0.1 0.2 ± 0.1 C-dimethylphenanthrene ng/m³ 0.2 ± 0.1 0.5 ± 0.1 0.6 ± 0.1 1.2 ± 0.2 Fluoranthene ng/m³ 0.1 ± 0.1 0.6 ± 0.1 0.8 ± 0.1 5.3 ± 0.5 Pyrene ng/m³ 0.2 ± 0.1 0.8 ± 0.1 1 ± 0.1 4.8 ± 0.7 9-Anthraaldehyde ng/m³ 0 ± 0.1 0.3 ± 0.1 0.1 ± 0.1 0.6 ± 0.1 Retene ng/m³ 0 ± 0.1 0 ± 0.1 0 ± 0.1 0 ± 0.1 Benzo(a)fluorene ng/m³ 0 ± 0.1 0 ± 0.1 0 ± 0.1 0.1 ± 0.1 Benzo(b)fluorene ng/m³ 0 ± 0.1 0 ± 0.1 0 ± 0.1 0 ± 0.1 B-MePy/MeFl ng/m³ 0 ± 0.1 0 ± 0.1 0 ± 0.1 0 ± 0.1 1-MeFl+C-MeFl/Py ng/m³ 0 ± 0.1 0 ± 0.1 0 ± 0.1 0.1 ± 0.1 1+3-methylfluoranthene ng/m³ 0 ± 0.1 0 ± 0.1 0 ± 0.1 0.1 ± 0.1 4-methylpyrene ng/m³ 0 ± 0.1 0 ± 0.1 0 ± 0.1 0.1 ± 0.1 C-MePy/MeFl ng/m³ 0 ± 0.1 0 ± 0.1 0 ± 0.1 0 ± 0.1 D-MePy/MeFl ng/m³ 0 ± 0.1 0 ± 0.1 0 ± 0.1 0.1 ± 0.1 1-methylpyrene ng/m³ 0 ± 0.1 0 ± 0.1 0 ± 0.1 0.1 ± 0.1 Benzonaphthothiophene ng/m³ 0 ± 0.1 0 ± 0.1 0 ± 0.1 0 ± 0.1 Benzo(c)phenanthrene ng/m³ 0 ± 0.1 0 ± 0.1 0 ± 0.1 0 ± 0.1 Benzo(ghi)fluoranthene ng/m³ 0 ± 0.1 0 ± 0.1 0 ± 0.1 0.2 ± 0.1 9-phenylanthracene ng/m³ 0 ± 0.1 0 ± 0.1 0 ± 0.1 0 ± 0.1 Cyclopenta(c,d)pyrene ng/m³ 0.2 ± 0.2 0.2 ± 0.1 0.2 ± 0.2 0.2 ± 0.1 Benz(a)anthracene ng/m³ 0 ± 0.1 0.1 ± 0.1 0 ± 0.1 0.1 ± 0.1 Chrysene ng/m³ 0 ± 0.1 0 ± 0.1 0 ± 0.1 0 ± 0.1
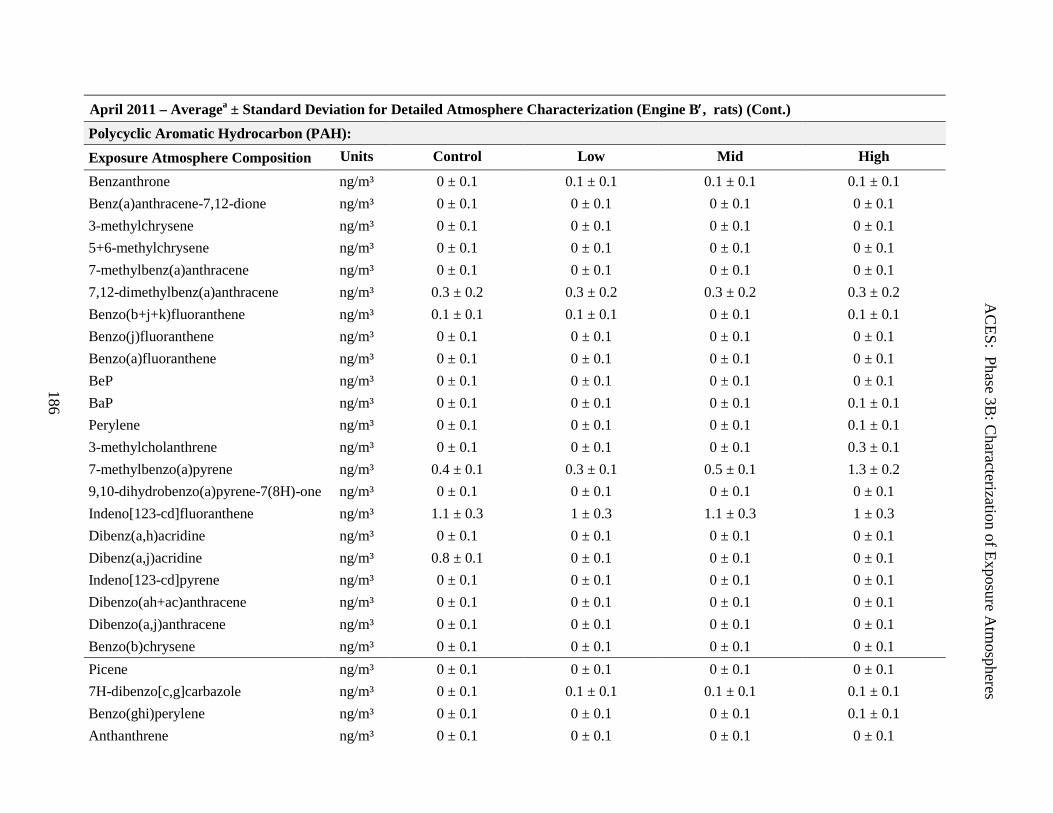
AC
ES: Phase 3B: C
haracterization of Exposure Atm
ospheres
186
April 2011 – Averagea ± Standard Deviation for Detailed Atmosphere Characterization (Engine B′, rats) (Cont.) Polycyclic Aromatic Hydrocarbon (PAH): Exposure Atmosphere Composition Units Control Low Mid High Benzanthrone ng/m³ 0 ± 0.1 0.1 ± 0.1 0.1 ± 0.1 0.1 ± 0.1 Benz(a)anthracene-7,12-dione ng/m³ 0 ± 0.1 0 ± 0.1 0 ± 0.1 0 ± 0.1 3-methylchrysene ng/m³ 0 ± 0.1 0 ± 0.1 0 ± 0.1 0 ± 0.1 5+6-methylchrysene ng/m³ 0 ± 0.1 0 ± 0.1 0 ± 0.1 0 ± 0.1 7-methylbenz(a)anthracene ng/m³ 0 ± 0.1 0 ± 0.1 0 ± 0.1 0 ± 0.1 7,12-dimethylbenz(a)anthracene ng/m³ 0.3 ± 0.2 0.3 ± 0.2 0.3 ± 0.2 0.3 ± 0.2 Benzo(b+j+k)fluoranthene ng/m³ 0.1 ± 0.1 0.1 ± 0.1 0 ± 0.1 0.1 ± 0.1 Benzo(j)fluoranthene ng/m³ 0 ± 0.1 0 ± 0.1 0 ± 0.1 0 ± 0.1 Benzo(a)fluoranthene ng/m³ 0 ± 0.1 0 ± 0.1 0 ± 0.1 0 ± 0.1 BeP ng/m³ 0 ± 0.1 0 ± 0.1 0 ± 0.1 0 ± 0.1 BaP ng/m³ 0 ± 0.1 0 ± 0.1 0 ± 0.1 0.1 ± 0.1 Perylene ng/m³ 0 ± 0.1 0 ± 0.1 0 ± 0.1 0.1 ± 0.1 3-methylcholanthrene ng/m³ 0 ± 0.1 0 ± 0.1 0 ± 0.1 0.3 ± 0.1 7-methylbenzo(a)pyrene ng/m³ 0.4 ± 0.1 0.3 ± 0.1 0.5 ± 0.1 1.3 ± 0.2 9,10-dihydrobenzo(a)pyrene-7(8H)-one ng/m³ 0 ± 0.1 0 ± 0.1 0 ± 0.1 0 ± 0.1 Indeno[123-cd]fluoranthene ng/m³ 1.1 ± 0.3 1 ± 0.3 1.1 ± 0.3 1 ± 0.3 Dibenz(a,h)acridine ng/m³ 0 ± 0.1 0 ± 0.1 0 ± 0.1 0 ± 0.1 Dibenz(a,j)acridine ng/m³ 0.8 ± 0.1 0 ± 0.1 0 ± 0.1 0 ± 0.1 Indeno[123-cd]pyrene ng/m³ 0 ± 0.1 0 ± 0.1 0 ± 0.1 0 ± 0.1 Dibenzo(ah+ac)anthracene ng/m³ 0 ± 0.1 0 ± 0.1 0 ± 0.1 0 ± 0.1 Dibenzo(a,j)anthracene ng/m³ 0 ± 0.1 0 ± 0.1 0 ± 0.1 0 ± 0.1 Benzo(b)chrysene ng/m³ 0 ± 0.1 0 ± 0.1 0 ± 0.1 0 ± 0.1 Picene ng/m³ 0 ± 0.1 0 ± 0.1 0 ± 0.1 0 ± 0.1 7H-dibenzo[c,g]carbazole ng/m³ 0 ± 0.1 0.1 ± 0.1 0.1 ± 0.1 0.1 ± 0.1 Benzo(ghi)perylene ng/m³ 0 ± 0.1 0 ± 0.1 0 ± 0.1 0.1 ± 0.1 Anthanthrene ng/m³ 0 ± 0.1 0 ± 0.1 0 ± 0.1 0 ± 0.1
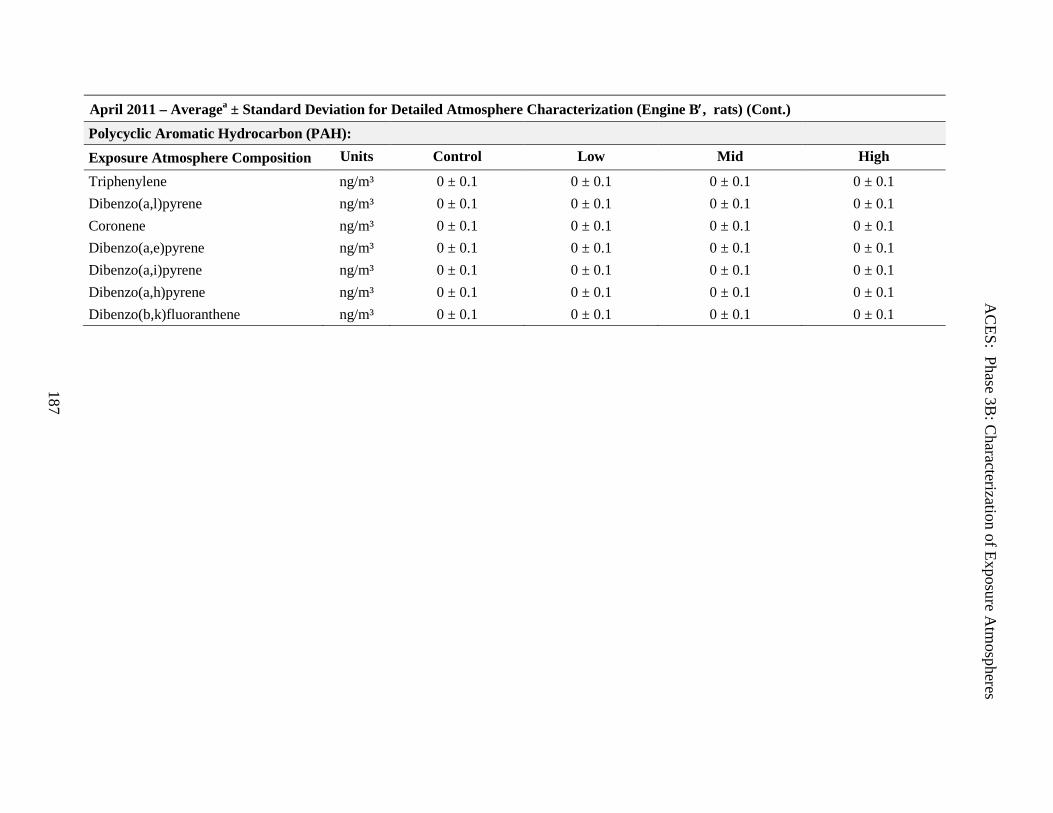
AC
ES: Phase 3B: C
haracterization of Exposure Atm
ospheres
187
April 2011 – Averagea ± Standard Deviation for Detailed Atmosphere Characterization (Engine B′, rats) (Cont.) Polycyclic Aromatic Hydrocarbon (PAH): Exposure Atmosphere Composition Units Control Low Mid High Triphenylene ng/m³ 0 ± 0.1 0 ± 0.1 0 ± 0.1 0 ± 0.1 Dibenzo(a,l)pyrene ng/m³ 0 ± 0.1 0 ± 0.1 0 ± 0.1 0 ± 0.1 Coronene ng/m³ 0 ± 0.1 0 ± 0.1 0 ± 0.1 0 ± 0.1 Dibenzo(a,e)pyrene ng/m³ 0 ± 0.1 0 ± 0.1 0 ± 0.1 0 ± 0.1 Dibenzo(a,i)pyrene ng/m³ 0 ± 0.1 0 ± 0.1 0 ± 0.1 0 ± 0.1 Dibenzo(a,h)pyrene ng/m³ 0 ± 0.1 0 ± 0.1 0 ± 0.1 0 ± 0.1 Dibenzo(b,k)fluoranthene ng/m³ 0 ± 0.1 0 ± 0.1 0 ± 0.1 0 ± 0.1
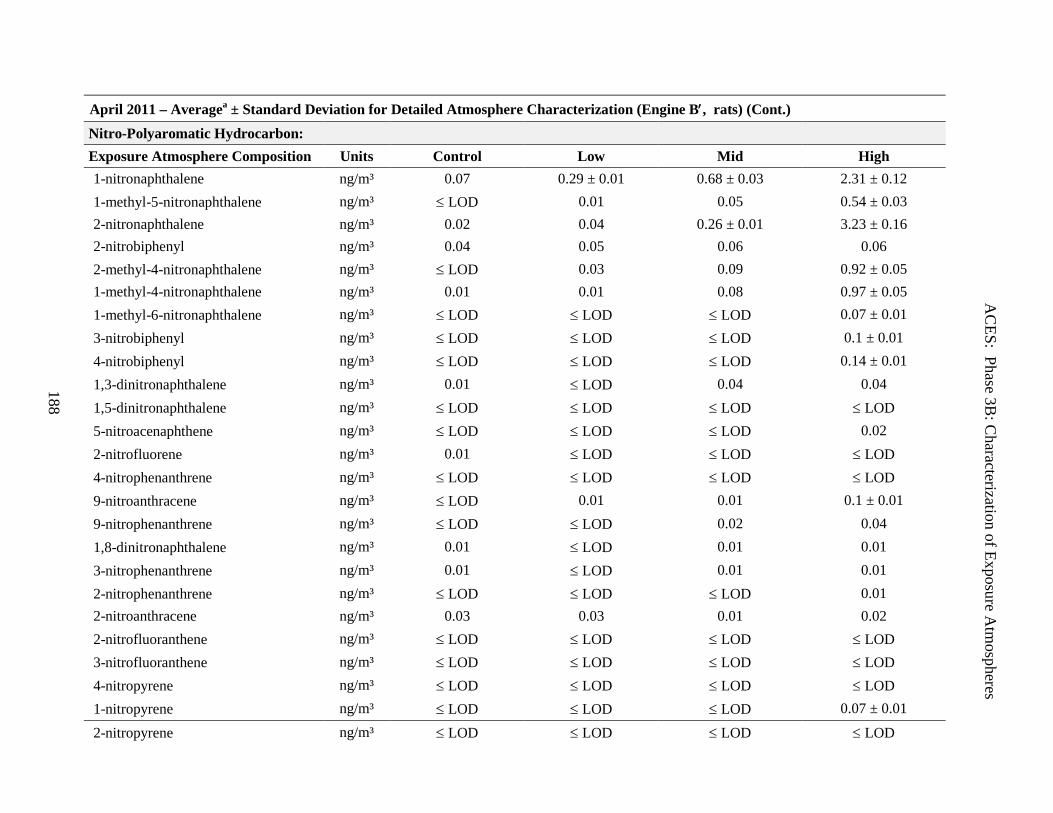
AC
ES: Phase 3B: C
haracterization of Exposure Atm
ospheres
188
April 2011 – Averagea ± Standard Deviation for Detailed Atmosphere Characterization (Engine B′, rats) (Cont.) Nitro-Polyaromatic Hydrocarbon: Exposure Atmosphere Composition Units Control Low Mid High 1-nitronaphthalene ng/m³ 0.07 0.29 ± 0.01 0.68 ± 0.03 2.31 ± 0.12 1-methyl-5-nitronaphthalene ng/m³ ≤ LOD 0.01 0.05 0.54 ± 0.03 2-nitronaphthalene ng/m³ 0.02 0.04 0.26 ± 0.01 3.23 ± 0.16 2-nitrobiphenyl ng/m³ 0.04 0.05 0.06 0.06 2-methyl-4-nitronaphthalene ng/m³ ≤ LOD 0.03 0.09 0.92 ± 0.05 1-methyl-4-nitronaphthalene ng/m³ 0.01 0.01 0.08 0.97 ± 0.05 1-methyl-6-nitronaphthalene ng/m³ ≤ LOD ≤ LOD ≤ LOD 0.07 ± 0.01 3-nitrobiphenyl ng/m³ ≤ LOD ≤ LOD ≤ LOD 0.1 ± 0.01 4-nitrobiphenyl ng/m³ ≤ LOD ≤ LOD ≤ LOD 0.14 ± 0.01 1,3-dinitronaphthalene ng/m³ 0.01 ≤ LOD 0.04 0.04 1,5-dinitronaphthalene ng/m³ ≤ LOD ≤ LOD ≤ LOD ≤ LOD 5-nitroacenaphthene ng/m³ ≤ LOD ≤ LOD ≤ LOD 0.02 2-nitrofluorene ng/m³ 0.01 ≤ LOD ≤ LOD ≤ LOD 4-nitrophenanthrene ng/m³ ≤ LOD ≤ LOD ≤ LOD ≤ LOD 9-nitroanthracene ng/m³ ≤ LOD 0.01 0.01 0.1 ± 0.01 9-nitrophenanthrene ng/m³ ≤ LOD ≤ LOD 0.02 0.04 1,8-dinitronaphthalene ng/m³ 0.01 ≤ LOD 0.01 0.01 3-nitrophenanthrene ng/m³ 0.01 ≤ LOD 0.01 0.01 2-nitrophenanthrene ng/m³ ≤ LOD ≤ LOD ≤ LOD 0.01 2-nitroanthracene ng/m³ 0.03 0.03 0.01 0.02 2-nitrofluoranthene ng/m³ ≤ LOD ≤ LOD ≤ LOD ≤ LOD 3-nitrofluoranthene ng/m³ ≤ LOD ≤ LOD ≤ LOD ≤ LOD 4-nitropyrene ng/m³ ≤ LOD ≤ LOD ≤ LOD ≤ LOD 1-nitropyrene ng/m³ ≤ LOD ≤ LOD ≤ LOD 0.07 ± 0.01 2-nitropyrene ng/m³ ≤ LOD ≤ LOD ≤ LOD ≤ LOD
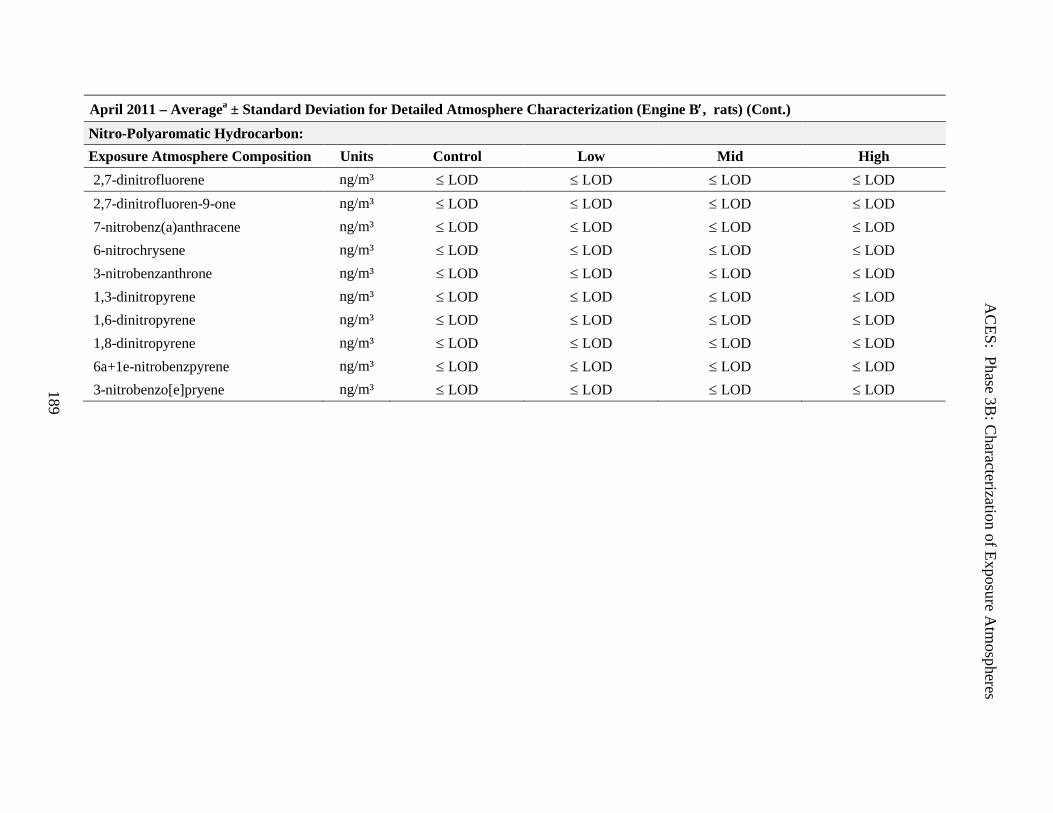
AC
ES: Phase 3B: C
haracterization of Exposure Atm
ospheres
189
April 2011 – Averagea ± Standard Deviation for Detailed Atmosphere Characterization (Engine B′, rats) (Cont.) Nitro-Polyaromatic Hydrocarbon: Exposure Atmosphere Composition Units Control Low Mid High 2,7-dinitrofluorene ng/m³ ≤ LOD ≤ LOD ≤ LOD ≤ LOD 2,7-dinitrofluoren-9-one ng/m³ ≤ LOD ≤ LOD ≤ LOD ≤ LOD 7-nitrobenz(a)anthracene ng/m³ ≤ LOD ≤ LOD ≤ LOD ≤ LOD 6-nitrochrysene ng/m³ ≤ LOD ≤ LOD ≤ LOD ≤ LOD 3-nitrobenzanthrone ng/m³ ≤ LOD ≤ LOD ≤ LOD ≤ LOD 1,3-dinitropyrene ng/m³ ≤ LOD ≤ LOD ≤ LOD ≤ LOD 1,6-dinitropyrene ng/m³ ≤ LOD ≤ LOD ≤ LOD ≤ LOD 1,8-dinitropyrene ng/m³ ≤ LOD ≤ LOD ≤ LOD ≤ LOD 6a+1e-nitrobenzpyrene ng/m³ ≤ LOD ≤ LOD ≤ LOD ≤ LOD 3-nitrobenzo[e]pryene ng/m³ ≤ LOD ≤ LOD ≤ LOD ≤ LOD
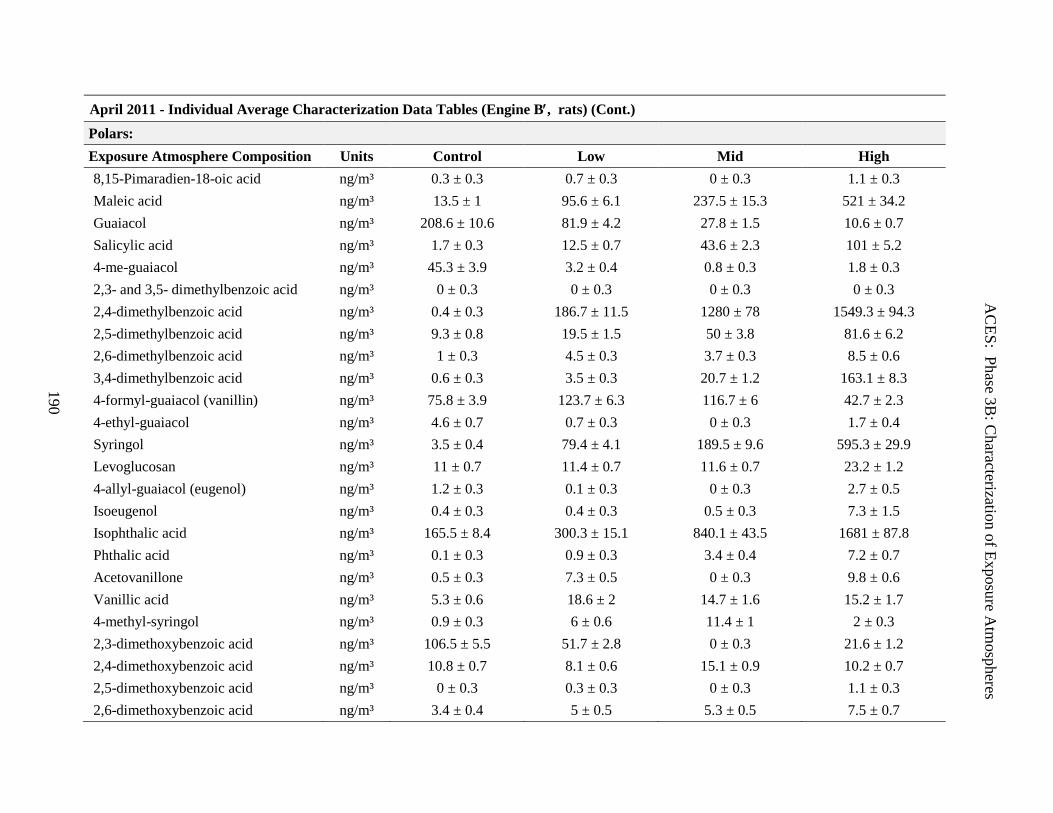
AC
ES: Phase 3B: C
haracterization of Exposure Atm
ospheres
190
April 2011 - Individual Average Characterization Data Tables (Engine B′, rats) (Cont.) Polars: Exposure Atmosphere Composition Units Control Low Mid High 8,15-Pimaradien-18-oic acid ng/m³ 0.3 ± 0.3 0.7 ± 0.3 0 ± 0.3 1.1 ± 0.3 Maleic acid ng/m³ 13.5 ± 1 95.6 ± 6.1 237.5 ± 15.3 521 ± 34.2 Guaiacol ng/m³ 208.6 ± 10.6 81.9 ± 4.2 27.8 ± 1.5 10.6 ± 0.7 Salicylic acid ng/m³ 1.7 ± 0.3 12.5 ± 0.7 43.6 ± 2.3 101 ± 5.2 4-me-guaiacol ng/m³ 45.3 ± 3.9 3.2 ± 0.4 0.8 ± 0.3 1.8 ± 0.3 2,3- and 3,5- dimethylbenzoic acid ng/m³ 0 ± 0.3 0 ± 0.3 0 ± 0.3 0 ± 0.3 2,4-dimethylbenzoic acid ng/m³ 0.4 ± 0.3 186.7 ± 11.5 1280 ± 78 1549.3 ± 94.3 2,5-dimethylbenzoic acid ng/m³ 9.3 ± 0.8 19.5 ± 1.5 50 ± 3.8 81.6 ± 6.2 2,6-dimethylbenzoic acid ng/m³ 1 ± 0.3 4.5 ± 0.3 3.7 ± 0.3 8.5 ± 0.6 3,4-dimethylbenzoic acid ng/m³ 0.6 ± 0.3 3.5 ± 0.3 20.7 ± 1.2 163.1 ± 8.3 4-formyl-guaiacol (vanillin) ng/m³ 75.8 ± 3.9 123.7 ± 6.3 116.7 ± 6 42.7 ± 2.3 4-ethyl-guaiacol ng/m³ 4.6 ± 0.7 0.7 ± 0.3 0 ± 0.3 1.7 ± 0.4 Syringol ng/m³ 3.5 ± 0.4 79.4 ± 4.1 189.5 ± 9.6 595.3 ± 29.9 Levoglucosan ng/m³ 11 ± 0.7 11.4 ± 0.7 11.6 ± 0.7 23.2 ± 1.2 4-allyl-guaiacol (eugenol) ng/m³ 1.2 ± 0.3 0.1 ± 0.3 0 ± 0.3 2.7 ± 0.5 Isoeugenol ng/m³ 0.4 ± 0.3 0.4 ± 0.3 0.5 ± 0.3 7.3 ± 1.5 Isophthalic acid ng/m³ 165.5 ± 8.4 300.3 ± 15.1 840.1 ± 43.5 1681 ± 87.8 Phthalic acid ng/m³ 0.1 ± 0.3 0.9 ± 0.3 3.4 ± 0.4 7.2 ± 0.7 Acetovanillone ng/m³ 0.5 ± 0.3 7.3 ± 0.5 0 ± 0.3 9.8 ± 0.6 Vanillic acid ng/m³ 5.3 ± 0.6 18.6 ± 2 14.7 ± 1.6 15.2 ± 1.7 4-methyl-syringol ng/m³ 0.9 ± 0.3 6 ± 0.6 11.4 ± 1 2 ± 0.3 2,3-dimethoxybenzoic acid ng/m³ 106.5 ± 5.5 51.7 ± 2.8 0 ± 0.3 21.6 ± 1.2 2,4-dimethoxybenzoic acid ng/m³ 10.8 ± 0.7 8.1 ± 0.6 15.1 ± 0.9 10.2 ± 0.7 2,5-dimethoxybenzoic acid ng/m³ 0 ± 0.3 0.3 ± 0.3 0 ± 0.3 1.1 ± 0.3 2,6-dimethoxybenzoic acid ng/m³ 3.4 ± 0.4 5 ± 0.5 5.3 ± 0.5 7.5 ± 0.7
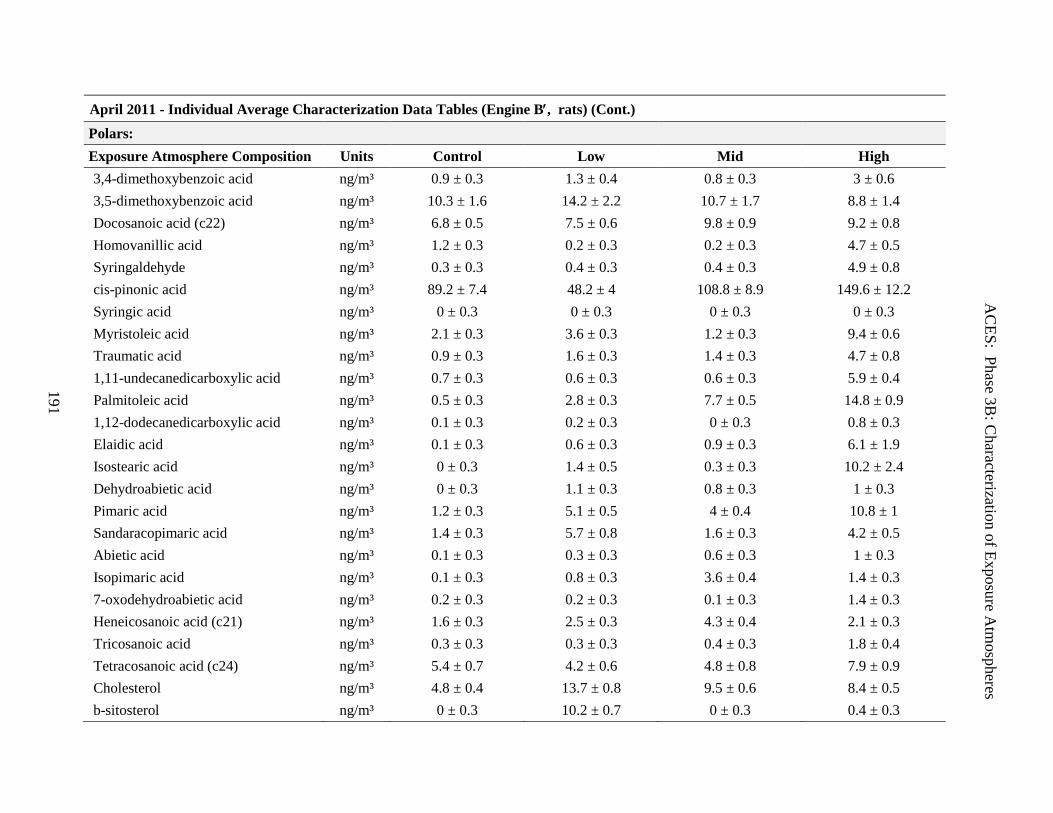
AC
ES: Phase 3B: C
haracterization of Exposure Atm
ospheres
191
April 2011 - Individual Average Characterization Data Tables (Engine B′, rats) (Cont.) Polars: Exposure Atmosphere Composition Units Control Low Mid High 3,4-dimethoxybenzoic acid ng/m³ 0.9 ± 0.3 1.3 ± 0.4 0.8 ± 0.3 3 ± 0.6 3,5-dimethoxybenzoic acid ng/m³ 10.3 ± 1.6 14.2 ± 2.2 10.7 ± 1.7 8.8 ± 1.4 Docosanoic acid (c22) ng/m³ 6.8 ± 0.5 7.5 ± 0.6 9.8 ± 0.9 9.2 ± 0.8 Homovanillic acid ng/m³ 1.2 ± 0.3 0.2 ± 0.3 0.2 ± 0.3 4.7 ± 0.5 Syringaldehyde ng/m³ 0.3 ± 0.3 0.4 ± 0.3 0.4 ± 0.3 4.9 ± 0.8 cis-pinonic acid ng/m³ 89.2 ± 7.4 48.2 ± 4 108.8 ± 8.9 149.6 ± 12.2 Syringic acid ng/m³ 0 ± 0.3 0 ± 0.3 0 ± 0.3 0 ± 0.3 Myristoleic acid ng/m³ 2.1 ± 0.3 3.6 ± 0.3 1.2 ± 0.3 9.4 ± 0.6 Traumatic acid ng/m³ 0.9 ± 0.3 1.6 ± 0.3 1.4 ± 0.3 4.7 ± 0.8 1,11-undecanedicarboxylic acid ng/m³ 0.7 ± 0.3 0.6 ± 0.3 0.6 ± 0.3 5.9 ± 0.4 Palmitoleic acid ng/m³ 0.5 ± 0.3 2.8 ± 0.3 7.7 ± 0.5 14.8 ± 0.9 1,12-dodecanedicarboxylic acid ng/m³ 0.1 ± 0.3 0.2 ± 0.3 0 ± 0.3 0.8 ± 0.3 Elaidic acid ng/m³ 0.1 ± 0.3 0.6 ± 0.3 0.9 ± 0.3 6.1 ± 1.9 Isostearic acid ng/m³ 0 ± 0.3 1.4 ± 0.5 0.3 ± 0.3 10.2 ± 2.4 Dehydroabietic acid ng/m³ 0 ± 0.3 1.1 ± 0.3 0.8 ± 0.3 1 ± 0.3 Pimaric acid ng/m³ 1.2 ± 0.3 5.1 ± 0.5 4 ± 0.4 10.8 ± 1 Sandaracopimaric acid ng/m³ 1.4 ± 0.3 5.7 ± 0.8 1.6 ± 0.3 4.2 ± 0.5 Abietic acid ng/m³ 0.1 ± 0.3 0.3 ± 0.3 0.6 ± 0.3 1 ± 0.3 Isopimaric acid ng/m³ 0.1 ± 0.3 0.8 ± 0.3 3.6 ± 0.4 1.4 ± 0.3 7-oxodehydroabietic acid ng/m³ 0.2 ± 0.3 0.2 ± 0.3 0.1 ± 0.3 1.4 ± 0.3 Heneicosanoic acid (c21) ng/m³ 1.6 ± 0.3 2.5 ± 0.3 4.3 ± 0.4 2.1 ± 0.3 Tricosanoic acid ng/m³ 0.3 ± 0.3 0.3 ± 0.3 0.4 ± 0.3 1.8 ± 0.4 Tetracosanoic acid (c24) ng/m³ 5.4 ± 0.7 4.2 ± 0.6 4.8 ± 0.8 7.9 ± 0.9 Cholesterol ng/m³ 4.8 ± 0.4 13.7 ± 0.8 9.5 ± 0.6 8.4 ± 0.5 b-sitosterol ng/m³ 0 ± 0.3 10.2 ± 0.7 0 ± 0.3 0.4 ± 0.3
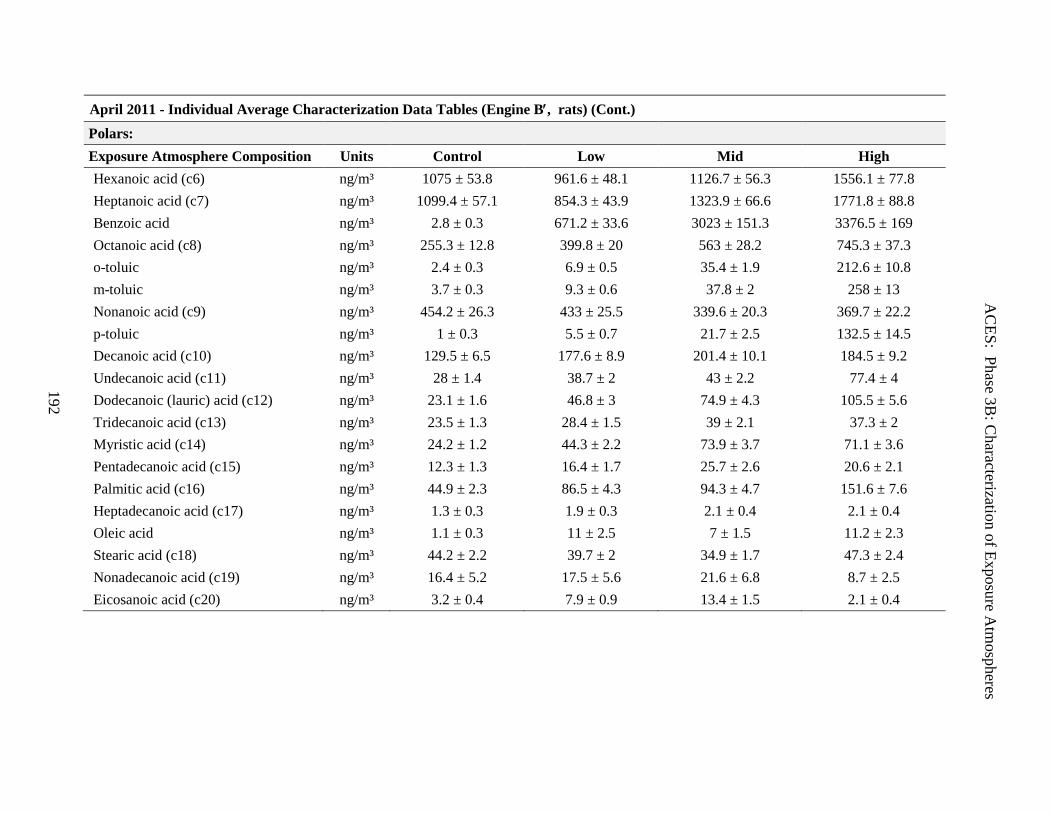
AC
ES: Phase 3B: C
haracterization of Exposure Atm
ospheres
192
April 2011 - Individual Average Characterization Data Tables (Engine B′, rats) (Cont.) Polars: Exposure Atmosphere Composition Units Control Low Mid High Hexanoic acid (c6) ng/m³ 1075 ± 53.8 961.6 ± 48.1 1126.7 ± 56.3 1556.1 ± 77.8 Heptanoic acid (c7) ng/m³ 1099.4 ± 57.1 854.3 ± 43.9 1323.9 ± 66.6 1771.8 ± 88.8 Benzoic acid ng/m³ 2.8 ± 0.3 671.2 ± 33.6 3023 ± 151.3 3376.5 ± 169 Octanoic acid (c8) ng/m³ 255.3 ± 12.8 399.8 ± 20 563 ± 28.2 745.3 ± 37.3 o-toluic ng/m³ 2.4 ± 0.3 6.9 ± 0.5 35.4 ± 1.9 212.6 ± 10.8 m-toluic ng/m³ 3.7 ± 0.3 9.3 ± 0.6 37.8 ± 2 258 ± 13 Nonanoic acid (c9) ng/m³ 454.2 ± 26.3 433 ± 25.5 339.6 ± 20.3 369.7 ± 22.2 p-toluic ng/m³ 1 ± 0.3 5.5 ± 0.7 21.7 ± 2.5 132.5 ± 14.5 Decanoic acid (c10) ng/m³ 129.5 ± 6.5 177.6 ± 8.9 201.4 ± 10.1 184.5 ± 9.2 Undecanoic acid (c11) ng/m³ 28 ± 1.4 38.7 ± 2 43 ± 2.2 77.4 ± 4 Dodecanoic (lauric) acid (c12) ng/m³ 23.1 ± 1.6 46.8 ± 3 74.9 ± 4.3 105.5 ± 5.6 Tridecanoic acid (c13) ng/m³ 23.5 ± 1.3 28.4 ± 1.5 39 ± 2.1 37.3 ± 2 Myristic acid (c14) ng/m³ 24.2 ± 1.2 44.3 ± 2.2 73.9 ± 3.7 71.1 ± 3.6 Pentadecanoic acid (c15) ng/m³ 12.3 ± 1.3 16.4 ± 1.7 25.7 ± 2.6 20.6 ± 2.1 Palmitic acid (c16) ng/m³ 44.9 ± 2.3 86.5 ± 4.3 94.3 ± 4.7 151.6 ± 7.6 Heptadecanoic acid (c17) ng/m³ 1.3 ± 0.3 1.9 ± 0.3 2.1 ± 0.4 2.1 ± 0.4 Oleic acid ng/m³ 1.1 ± 0.3 11 ± 2.5 7 ± 1.5 11.2 ± 2.3 Stearic acid (c18) ng/m³ 44.2 ± 2.2 39.7 ± 2 34.9 ± 1.7 47.3 ± 2.4 Nonadecanoic acid (c19) ng/m³ 16.4 ± 5.2 17.5 ± 5.6 21.6 ± 6.8 8.7 ± 2.5 Eicosanoic acid (c20) ng/m³ 3.2 ± 0.4 7.9 ± 0.9 13.4 ± 1.5 2.1 ± 0.4
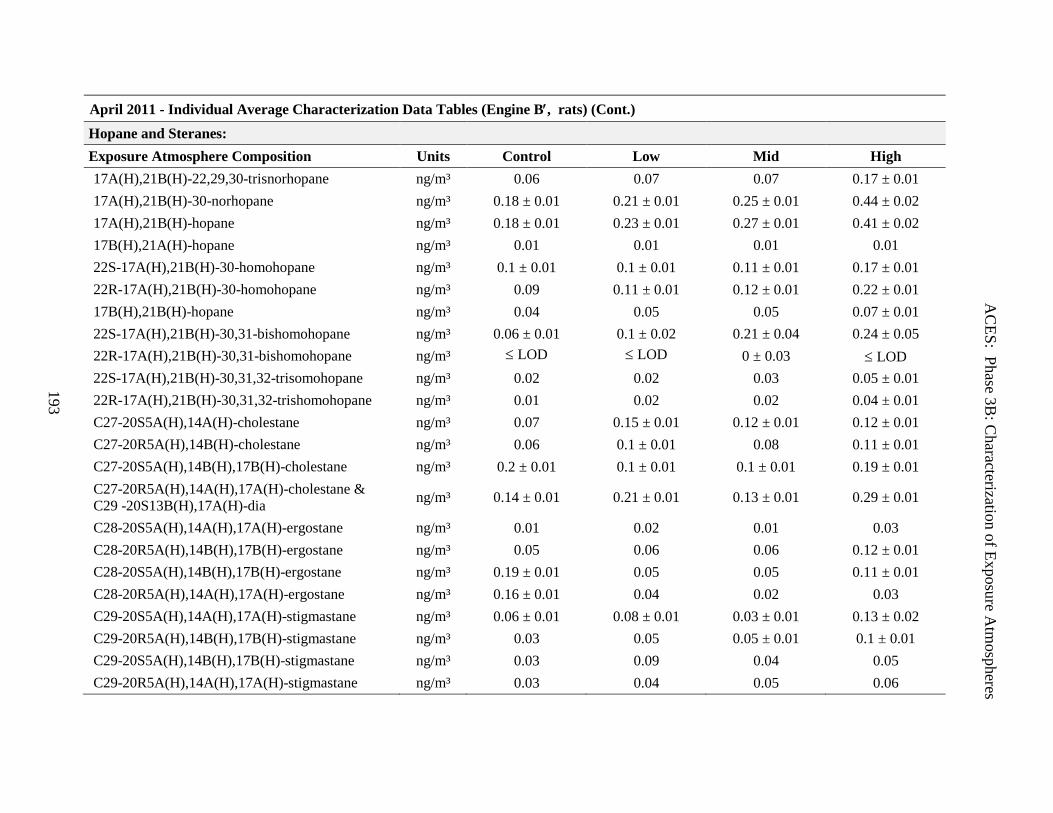
AC
ES: Phase 3B: C
haracterization of Exposure Atm
ospheres
193
April 2011 - Individual Average Characterization Data Tables (Engine B′, rats) (Cont.) Hopane and Steranes: Exposure Atmosphere Composition Units Control Low Mid High 17A(H),21B(H)-22,29,30-trisnorhopane ng/m³ 0.06 0.07 0.07 0.17 ± 0.01 17A(H),21B(H)-30-norhopane ng/m³ 0.18 ± 0.01 0.21 ± 0.01 0.25 ± 0.01 0.44 ± 0.02 17A(H),21B(H)-hopane ng/m³ 0.18 ± 0.01 0.23 ± 0.01 0.27 ± 0.01 0.41 ± 0.02 17B(H),21A(H)-hopane ng/m³ 0.01 0.01 0.01 0.01 22S-17A(H),21B(H)-30-homohopane ng/m³ 0.1 ± 0.01 0.1 ± 0.01 0.11 ± 0.01 0.17 ± 0.01 22R-17A(H),21B(H)-30-homohopane ng/m³ 0.09 0.11 ± 0.01 0.12 ± 0.01 0.22 ± 0.01 17B(H),21B(H)-hopane ng/m³ 0.04 0.05 0.05 0.07 ± 0.01 22S-17A(H),21B(H)-30,31-bishomohopane ng/m³ 0.06 ± 0.01 0.1 ± 0.02 0.21 ± 0.04 0.24 ± 0.05 22R-17A(H),21B(H)-30,31-bishomohopane ng/m³ ≤ LOD ≤ LOD 0 ± 0.03 ≤ LOD 22S-17A(H),21B(H)-30,31,32-trisomohopane ng/m³ 0.02 0.02 0.03 0.05 ± 0.01 22R-17A(H),21B(H)-30,31,32-trishomohopane ng/m³ 0.01 0.02 0.02 0.04 ± 0.01 C27-20S5A(H),14A(H)-cholestane ng/m³ 0.07 0.15 ± 0.01 0.12 ± 0.01 0.12 ± 0.01 C27-20R5A(H),14B(H)-cholestane ng/m³ 0.06 0.1 ± 0.01 0.08 0.11 ± 0.01 C27-20S5A(H),14B(H),17B(H)-cholestane ng/m³ 0.2 ± 0.01 0.1 ± 0.01 0.1 ± 0.01 0.19 ± 0.01 C27-20R5A(H),14A(H),17A(H)-cholestane & C29 -20S13B(H),17A(H)-dia ng/m³ 0.14 ± 0.01 0.21 ± 0.01 0.13 ± 0.01 0.29 ± 0.01
C28-20S5A(H),14A(H),17A(H)-ergostane ng/m³ 0.01 0.02 0.01 0.03 C28-20R5A(H),14B(H),17B(H)-ergostane ng/m³ 0.05 0.06 0.06 0.12 ± 0.01 C28-20S5A(H),14B(H),17B(H)-ergostane ng/m³ 0.19 ± 0.01 0.05 0.05 0.11 ± 0.01 C28-20R5A(H),14A(H),17A(H)-ergostane ng/m³ 0.16 ± 0.01 0.04 0.02 0.03 C29-20S5A(H),14A(H),17A(H)-stigmastane ng/m³ 0.06 ± 0.01 0.08 ± 0.01 0.03 ± 0.01 0.13 ± 0.02 C29-20R5A(H),14B(H),17B(H)-stigmastane ng/m³ 0.03 0.05 0.05 ± 0.01 0.1 ± 0.01 C29-20S5A(H),14B(H),17B(H)-stigmastane ng/m³ 0.03 0.09 0.04 0.05 C29-20R5A(H),14A(H),17A(H)-stigmastane ng/m³ 0.03 0.04 0.05 0.06
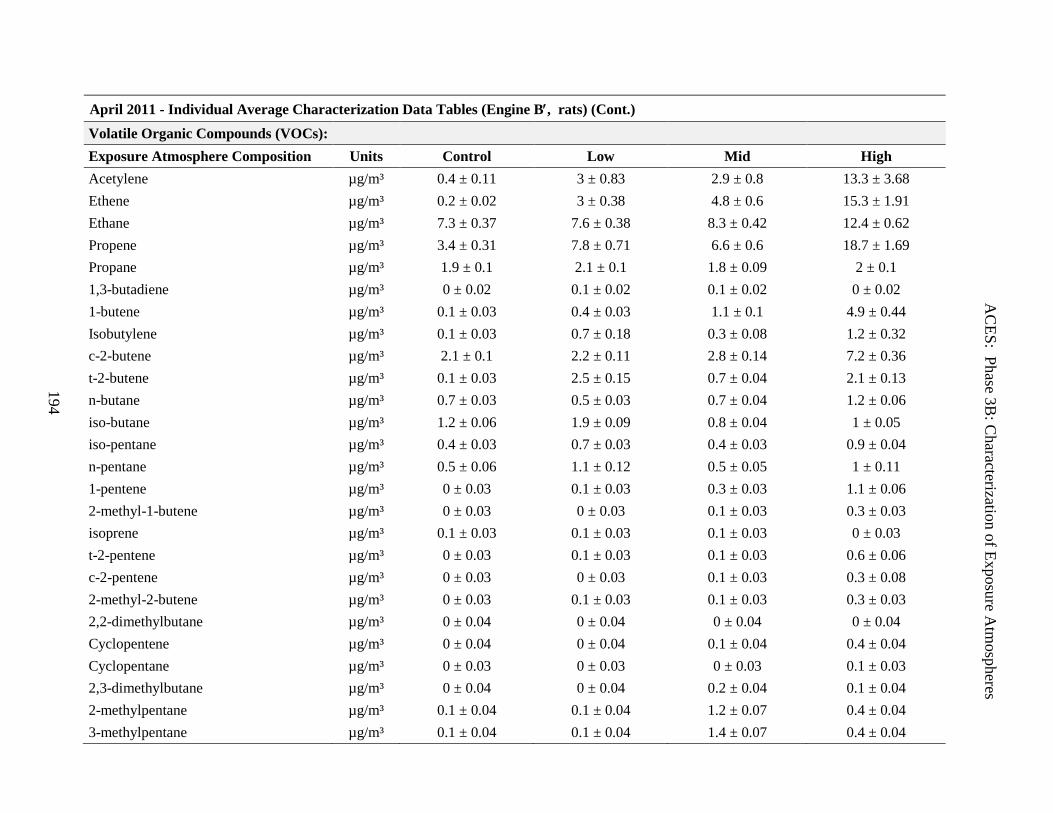
AC
ES: Phase 3B: C
haracterization of Exposure Atm
ospheres
194
April 2011 - Individual Average Characterization Data Tables (Engine B′, rats) (Cont.) Volatile Organic Compounds (VOCs): Exposure Atmosphere Composition Units Control Low Mid High Acetylene µg/m³ 0.4 ± 0.11 3 ± 0.83 2.9 ± 0.8 13.3 ± 3.68 Ethene µg/m³ 0.2 ± 0.02 3 ± 0.38 4.8 ± 0.6 15.3 ± 1.91 Ethane µg/m³ 7.3 ± 0.37 7.6 ± 0.38 8.3 ± 0.42 12.4 ± 0.62 Propene µg/m³ 3.4 ± 0.31 7.8 ± 0.71 6.6 ± 0.6 18.7 ± 1.69 Propane µg/m³ 1.9 ± 0.1 2.1 ± 0.1 1.8 ± 0.09 2 ± 0.1 1,3-butadiene µg/m³ 0 ± 0.02 0.1 ± 0.02 0.1 ± 0.02 0 ± 0.02 1-butene µg/m³ 0.1 ± 0.03 0.4 ± 0.03 1.1 ± 0.1 4.9 ± 0.44 Isobutylene µg/m³ 0.1 ± 0.03 0.7 ± 0.18 0.3 ± 0.08 1.2 ± 0.32 c-2-butene µg/m³ 2.1 ± 0.1 2.2 ± 0.11 2.8 ± 0.14 7.2 ± 0.36 t-2-butene µg/m³ 0.1 ± 0.03 2.5 ± 0.15 0.7 ± 0.04 2.1 ± 0.13 n-butane µg/m³ 0.7 ± 0.03 0.5 ± 0.03 0.7 ± 0.04 1.2 ± 0.06 iso-butane µg/m³ 1.2 ± 0.06 1.9 ± 0.09 0.8 ± 0.04 1 ± 0.05 iso-pentane µg/m³ 0.4 ± 0.03 0.7 ± 0.03 0.4 ± 0.03 0.9 ± 0.04 n-pentane µg/m³ 0.5 ± 0.06 1.1 ± 0.12 0.5 ± 0.05 1 ± 0.11 1-pentene µg/m³ 0 ± 0.03 0.1 ± 0.03 0.3 ± 0.03 1.1 ± 0.06 2-methyl-1-butene µg/m³ 0 ± 0.03 0 ± 0.03 0.1 ± 0.03 0.3 ± 0.03 isoprene µg/m³ 0.1 ± 0.03 0.1 ± 0.03 0.1 ± 0.03 0 ± 0.03 t-2-pentene µg/m³ 0 ± 0.03 0.1 ± 0.03 0.1 ± 0.03 0.6 ± 0.06 c-2-pentene µg/m³ 0 ± 0.03 0 ± 0.03 0.1 ± 0.03 0.3 ± 0.08 2-methyl-2-butene µg/m³ 0 ± 0.03 0.1 ± 0.03 0.1 ± 0.03 0.3 ± 0.03 2,2-dimethylbutane µg/m³ 0 ± 0.04 0 ± 0.04 0 ± 0.04 0 ± 0.04 Cyclopentene µg/m³ 0 ± 0.04 0 ± 0.04 0.1 ± 0.04 0.4 ± 0.04 Cyclopentane µg/m³ 0 ± 0.03 0 ± 0.03 0 ± 0.03 0.1 ± 0.03 2,3-dimethylbutane µg/m³ 0 ± 0.04 0 ± 0.04 0.2 ± 0.04 0.1 ± 0.04 2-methylpentane µg/m³ 0.1 ± 0.04 0.1 ± 0.04 1.2 ± 0.07 0.4 ± 0.04 3-methylpentane µg/m³ 0.1 ± 0.04 0.1 ± 0.04 1.4 ± 0.07 0.4 ± 0.04
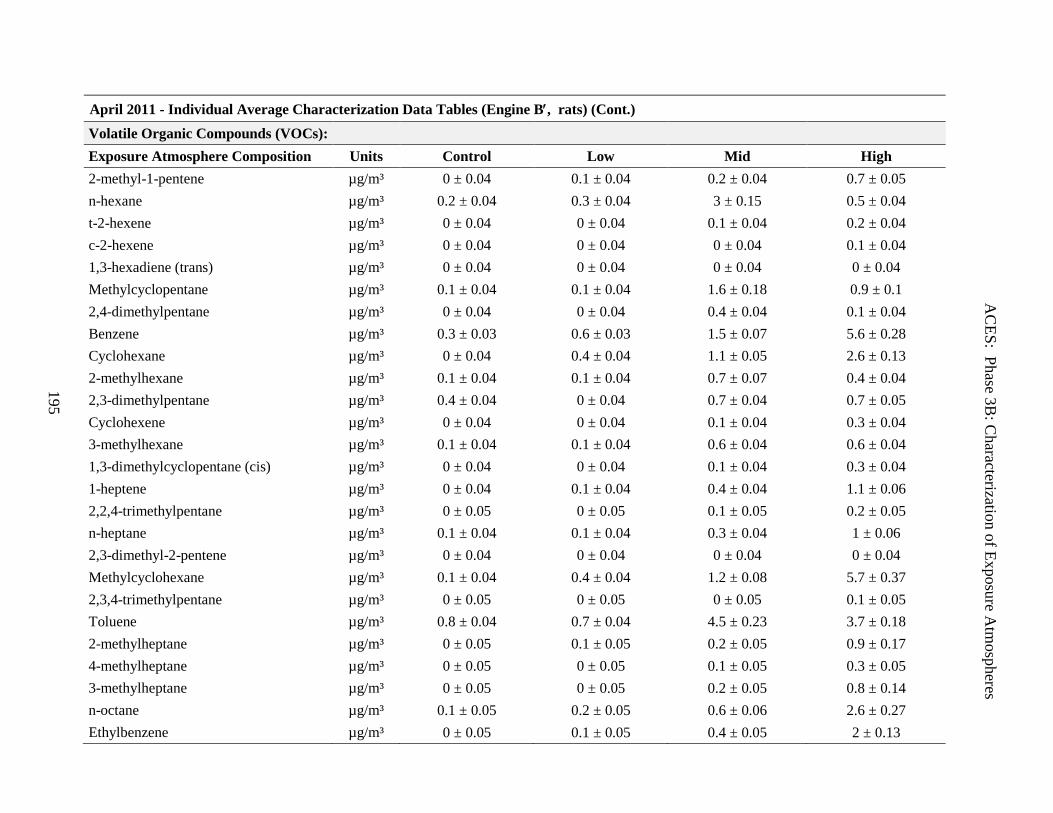
AC
ES: Phase 3B: C
haracterization of Exposure Atm
ospheres
195
April 2011 - Individual Average Characterization Data Tables (Engine B′, rats) (Cont.) Volatile Organic Compounds (VOCs): Exposure Atmosphere Composition Units Control Low Mid High 2-methyl-1-pentene µg/m³ 0 ± 0.04 0.1 ± 0.04 0.2 ± 0.04 0.7 ± 0.05 n-hexane µg/m³ 0.2 ± 0.04 0.3 ± 0.04 3 ± 0.15 0.5 ± 0.04 t-2-hexene µg/m³ 0 ± 0.04 0 ± 0.04 0.1 ± 0.04 0.2 ± 0.04 c-2-hexene µg/m³ 0 ± 0.04 0 ± 0.04 0 ± 0.04 0.1 ± 0.04 1,3-hexadiene (trans) µg/m³ 0 ± 0.04 0 ± 0.04 0 ± 0.04 0 ± 0.04 Methylcyclopentane µg/m³ 0.1 ± 0.04 0.1 ± 0.04 1.6 ± 0.18 0.9 ± 0.1 2,4-dimethylpentane µg/m³ 0 ± 0.04 0 ± 0.04 0.4 ± 0.04 0.1 ± 0.04 Benzene µg/m³ 0.3 ± 0.03 0.6 ± 0.03 1.5 ± 0.07 5.6 ± 0.28 Cyclohexane µg/m³ 0 ± 0.04 0.4 ± 0.04 1.1 ± 0.05 2.6 ± 0.13 2-methylhexane µg/m³ 0.1 ± 0.04 0.1 ± 0.04 0.7 ± 0.07 0.4 ± 0.04 2,3-dimethylpentane µg/m³ 0.4 ± 0.04 0 ± 0.04 0.7 ± 0.04 0.7 ± 0.05 Cyclohexene µg/m³ 0 ± 0.04 0 ± 0.04 0.1 ± 0.04 0.3 ± 0.04 3-methylhexane µg/m³ 0.1 ± 0.04 0.1 ± 0.04 0.6 ± 0.04 0.6 ± 0.04 1,3-dimethylcyclopentane (cis) µg/m³ 0 ± 0.04 0 ± 0.04 0.1 ± 0.04 0.3 ± 0.04 1-heptene µg/m³ 0 ± 0.04 0.1 ± 0.04 0.4 ± 0.04 1.1 ± 0.06 2,2,4-trimethylpentane µg/m³ 0 ± 0.05 0 ± 0.05 0.1 ± 0.05 0.2 ± 0.05 n-heptane µg/m³ 0.1 ± 0.04 0.1 ± 0.04 0.3 ± 0.04 1 ± 0.06 2,3-dimethyl-2-pentene µg/m³ 0 ± 0.04 0 ± 0.04 0 ± 0.04 0 ± 0.04 Methylcyclohexane µg/m³ 0.1 ± 0.04 0.4 ± 0.04 1.2 ± 0.08 5.7 ± 0.37 2,3,4-trimethylpentane µg/m³ 0 ± 0.05 0 ± 0.05 0 ± 0.05 0.1 ± 0.05 Toluene µg/m³ 0.8 ± 0.04 0.7 ± 0.04 4.5 ± 0.23 3.7 ± 0.18 2-methylheptane µg/m³ 0 ± 0.05 0.1 ± 0.05 0.2 ± 0.05 0.9 ± 0.17 4-methylheptane µg/m³ 0 ± 0.05 0 ± 0.05 0.1 ± 0.05 0.3 ± 0.05 3-methylheptane µg/m³ 0 ± 0.05 0 ± 0.05 0.2 ± 0.05 0.8 ± 0.14 n-octane µg/m³ 0.1 ± 0.05 0.2 ± 0.05 0.6 ± 0.06 2.6 ± 0.27 Ethylbenzene µg/m³ 0 ± 0.05 0.1 ± 0.05 0.4 ± 0.05 2 ± 0.13
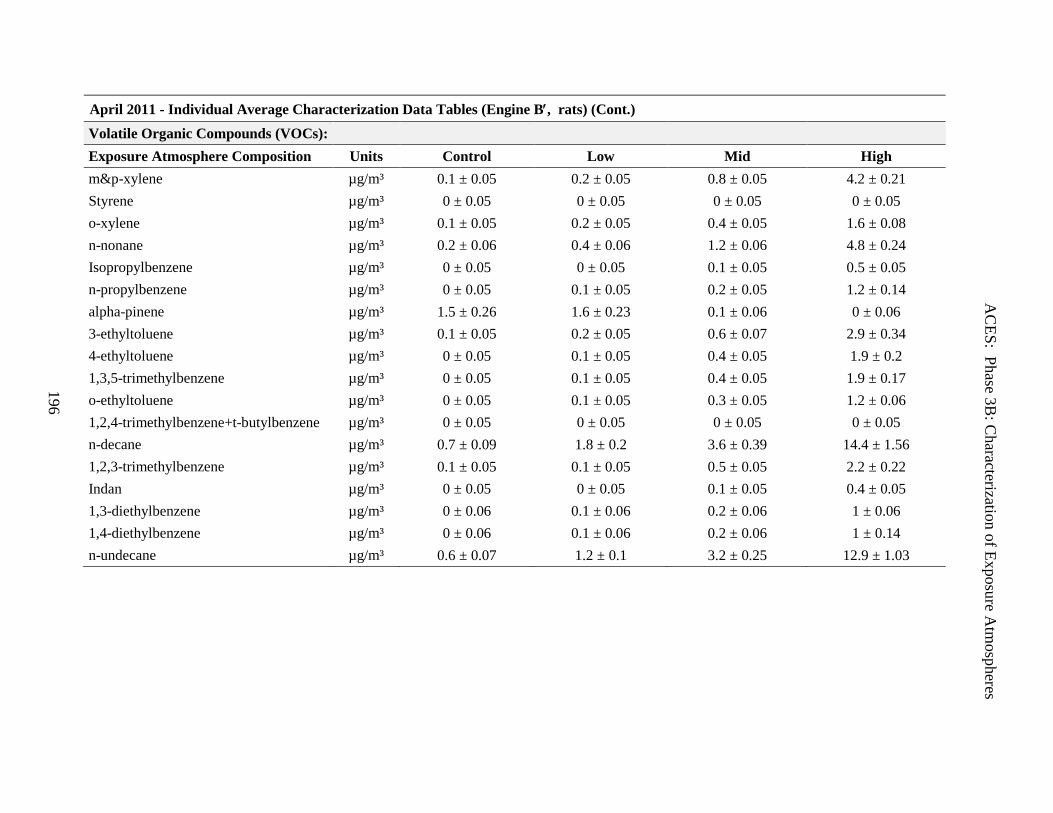
AC
ES: Phase 3B: C
haracterization of Exposure Atm
ospheres
196
April 2011 - Individual Average Characterization Data Tables (Engine B′, rats) (Cont.) Volatile Organic Compounds (VOCs): Exposure Atmosphere Composition Units Control Low Mid High m&p-xylene µg/m³ 0.1 ± 0.05 0.2 ± 0.05 0.8 ± 0.05 4.2 ± 0.21 Styrene µg/m³ 0 ± 0.05 0 ± 0.05 0 ± 0.05 0 ± 0.05 o-xylene µg/m³ 0.1 ± 0.05 0.2 ± 0.05 0.4 ± 0.05 1.6 ± 0.08 n-nonane µg/m³ 0.2 ± 0.06 0.4 ± 0.06 1.2 ± 0.06 4.8 ± 0.24 Isopropylbenzene µg/m³ 0 ± 0.05 0 ± 0.05 0.1 ± 0.05 0.5 ± 0.05 n-propylbenzene µg/m³ 0 ± 0.05 0.1 ± 0.05 0.2 ± 0.05 1.2 ± 0.14 alpha-pinene µg/m³ 1.5 ± 0.26 1.6 ± 0.23 0.1 ± 0.06 0 ± 0.06 3-ethyltoluene µg/m³ 0.1 ± 0.05 0.2 ± 0.05 0.6 ± 0.07 2.9 ± 0.34 4-ethyltoluene µg/m³ 0 ± 0.05 0.1 ± 0.05 0.4 ± 0.05 1.9 ± 0.2 1,3,5-trimethylbenzene µg/m³ 0 ± 0.05 0.1 ± 0.05 0.4 ± 0.05 1.9 ± 0.17 o-ethyltoluene µg/m³ 0 ± 0.05 0.1 ± 0.05 0.3 ± 0.05 1.2 ± 0.06 1,2,4-trimethylbenzene+t-butylbenzene µg/m³ 0 ± 0.05 0 ± 0.05 0 ± 0.05 0 ± 0.05 n-decane µg/m³ 0.7 ± 0.09 1.8 ± 0.2 3.6 ± 0.39 14.4 ± 1.56 1,2,3-trimethylbenzene µg/m³ 0.1 ± 0.05 0.1 ± 0.05 0.5 ± 0.05 2.2 ± 0.22 Indan µg/m³ 0 ± 0.05 0 ± 0.05 0.1 ± 0.05 0.4 ± 0.05 1,3-diethylbenzene µg/m³ 0 ± 0.06 0.1 ± 0.06 0.2 ± 0.06 1 ± 0.06 1,4-diethylbenzene µg/m³ 0 ± 0.06 0.1 ± 0.06 0.2 ± 0.06 1 ± 0.14 n-undecane µg/m³ 0.6 ± 0.07 1.2 ± 0.1 3.2 ± 0.25 12.9 ± 1.03
ACES: Phase 3B: Characterization of Exposure Atmospheres
HEI Research Report 184 McDonald Additional Materials I.B Available only on the Web 197
Appendix H.
April 2012 – Average ± Standard Deviation for Detailed Atmosphere Characterization
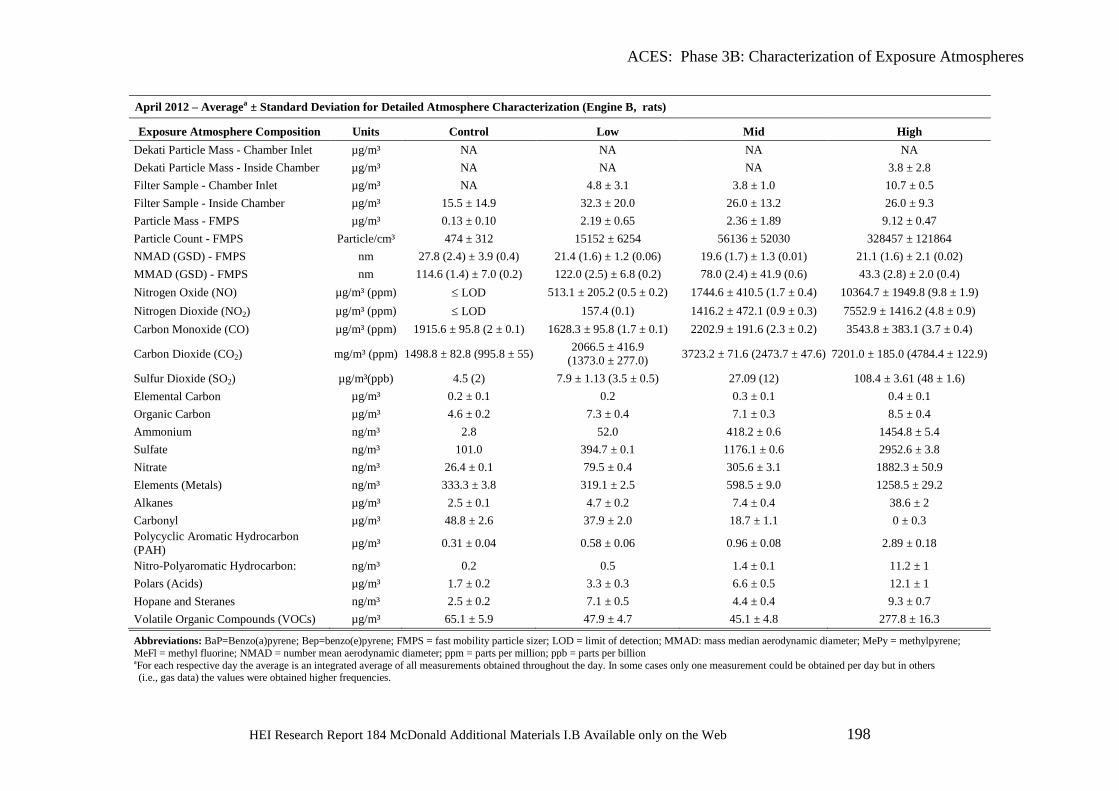
ACES: Phase 3B: Characterization of Exposure Atmospheres
HEI Research Report 184 McDonald Additional Materials I.B Available only on the Web 198
April 2012 – Averagea ± Standard Deviation for Detailed Atmosphere Characterization (Engine B, rats)
Exposure Atmosphere Composition Units Control Low Mid High Dekati Particle Mass - Chamber Inlet µg/m³ NA NA NA NA Dekati Particle Mass - Inside Chamber µg/m³ NA NA NA 3.8 ± 2.8 Filter Sample - Chamber Inlet µg/m³ NA 4.8 ± 3.1 3.8 ± 1.0 10.7 ± 0.5 Filter Sample - Inside Chamber µg/m³ 15.5 ± 14.9 32.3 ± 20.0 26.0 ± 13.2 26.0 ± 9.3 Particle Mass - FMPS µg/m³ 0.13 ± 0.10 2.19 ± 0.65 2.36 ± 1.89 9.12 ± 0.47 Particle Count - FMPS Particle/cm³ 474 ± 312 15152 ± 6254 56136 ± 52030 328457 ± 121864 NMAD (GSD) - FMPS nm 27.8 (2.4) ± 3.9 (0.4) 21.4 (1.6) ± 1.2 (0.06) 19.6 (1.7) ± 1.3 (0.01) 21.1 (1.6) ± 2.1 (0.02) MMAD (GSD) - FMPS nm 114.6 (1.4) ± 7.0 (0.2) 122.0 (2.5) ± 6.8 (0.2) 78.0 (2.4) ± 41.9 (0.6) 43.3 (2.8) ± 2.0 (0.4) Nitrogen Oxide (NO) µg/m³ (ppm) ≤ LOD 513.1 ± 205.2 (0.5 ± 0.2) 1744.6 ± 410.5 (1.7 ± 0.4) 10364.7 ± 1949.8 (9.8 ± 1.9) Nitrogen Dioxide (NO2) µg/m³ (ppm) ≤ LOD 157.4 (0.1) 1416.2 ± 472.1 (0.9 ± 0.3) 7552.9 ± 1416.2 (4.8 ± 0.9) Carbon Monoxide (CO) µg/m³ (ppm) 1915.6 ± 95.8 (2 ± 0.1) 1628.3 ± 95.8 (1.7 ± 0.1) 2202.9 ± 191.6 (2.3 ± 0.2) 3543.8 ± 383.1 (3.7 ± 0.4)
Carbon Dioxide (CO2) mg/m³ (ppm) 1498.8 ± 82.8 (995.8 ± 55) 2066.5 ± 416.9 (1373.0 ± 277.0) 3723.2 ± 71.6 (2473.7 ± 47.6) 7201.0 ± 185.0 (4784.4 ± 122.9)
Sulfur Dioxide (SO2) µg/m³(ppb) 4.5 (2) 7.9 ± 1.13 (3.5 ± 0.5) 27.09 (12) 108.4 ± 3.61 (48 ± 1.6) Elemental Carbon µg/m³ 0.2 ± 0.1 0.2 0.3 ± 0.1 0.4 ± 0.1 Organic Carbon µg/m³ 4.6 ± 0.2 7.3 ± 0.4 7.1 ± 0.3 8.5 ± 0.4 Ammonium ng/m³ 2.8 52.0 418.2 ± 0.6 1454.8 ± 5.4 Sulfate ng/m³ 101.0 394.7 ± 0.1 1176.1 ± 0.6 2952.6 ± 3.8 Nitrate ng/m³ 26.4 ± 0.1 79.5 ± 0.4 305.6 ± 3.1 1882.3 ± 50.9 Elements (Metals) ng/m³ 333.3 ± 3.8 319.1 ± 2.5 598.5 ± 9.0 1258.5 ± 29.2 Alkanes µg/m³ 2.5 ± 0.1 4.7 ± 0.2 7.4 ± 0.4 38.6 ± 2 Carbonyl µg/m³ 48.8 ± 2.6 37.9 ± 2.0 18.7 ± 1.1 0 ± 0.3 Polycyclic Aromatic Hydrocarbon (PAH) µg/m³ 0.31 ± 0.04 0.58 ± 0.06 0.96 ± 0.08 2.89 ± 0.18
Nitro-Polyaromatic Hydrocarbon: ng/m³ 0.2 0.5 1.4 ± 0.1 11.2 ± 1 Polars (Acids) µg/m³ 1.7 ± 0.2 3.3 ± 0.3 6.6 ± 0.5 12.1 ± 1 Hopane and Steranes ng/m³ 2.5 ± 0.2 7.1 ± 0.5 4.4 ± 0.4 9.3 ± 0.7 Volatile Organic Compounds (VOCs) µg/m³ 65.1 ± 5.9 47.9 ± 4.7 45.1 ± 4.8 277.8 ± 16.3
Abbreviations: BaP=Benzo(a)pyrene; Bep=benzo(e)pyrene; FMPS = fast mobility particle sizer; LOD = limit of detection; MMAD: mass median aerodynamic diameter; MePy = methylpyrene; MeFl = methyl fluorine; NMAD = number mean aerodynamic diameter; ppm = parts per million; ppb = parts per billion aFor each respective day the average is an integrated average of all measurements obtained throughout the day. In some cases only one measurement could be obtained per day but in others (i.e., gas data) the values were obtained higher frequencies.
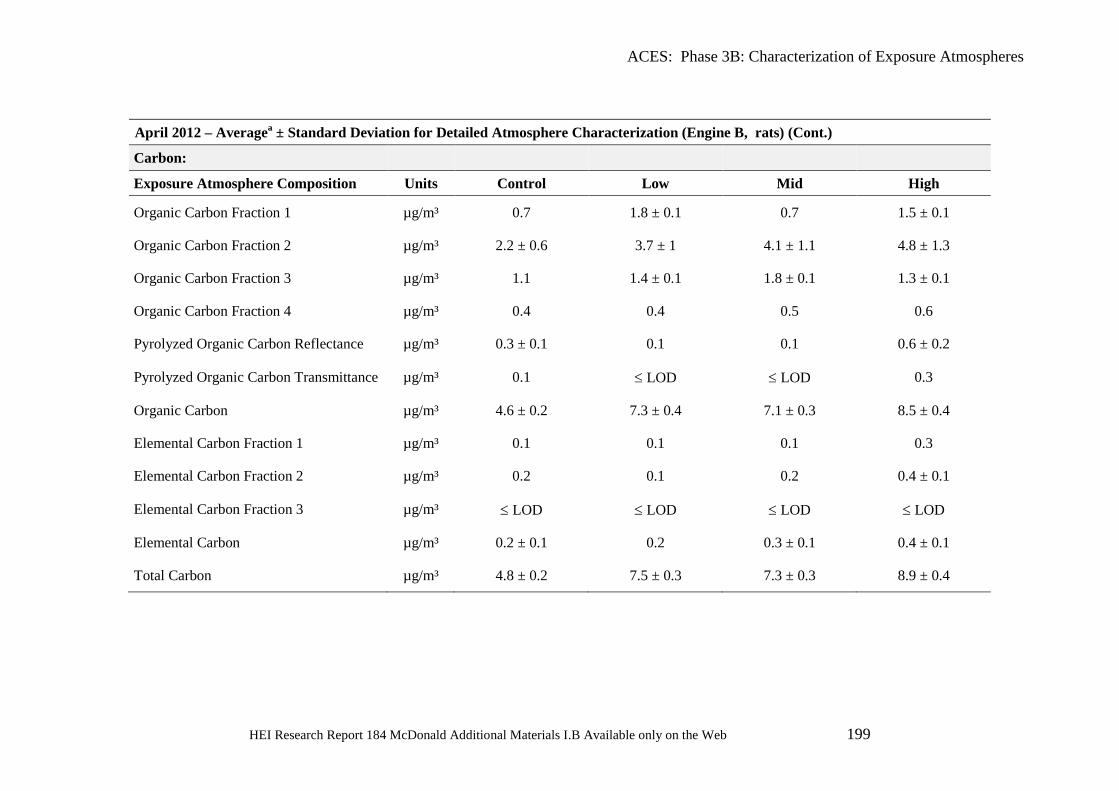
ACES: Phase 3B: Characterization of Exposure Atmospheres
HEI Research Report 184 McDonald Additional Materials I.B Available only on the Web 199
April 2012 – Averagea ± Standard Deviation for Detailed Atmosphere Characterization (Engine B, rats) (Cont.)
Carbon: Exposure Atmosphere Composition Units Control Low Mid High
Organic Carbon Fraction 1 µg/m³ 0.7 1.8 ± 0.1 0.7 1.5 ± 0.1
Organic Carbon Fraction 2 µg/m³ 2.2 ± 0.6 3.7 ± 1 4.1 ± 1.1 4.8 ± 1.3
Organic Carbon Fraction 3 µg/m³ 1.1 1.4 ± 0.1 1.8 ± 0.1 1.3 ± 0.1
Organic Carbon Fraction 4 µg/m³ 0.4 0.4 0.5 0.6
Pyrolyzed Organic Carbon Reflectance µg/m³ 0.3 ± 0.1 0.1 0.1 0.6 ± 0.2
Pyrolyzed Organic Carbon Transmittance µg/m³ 0.1 ≤ LOD ≤ LOD 0.3
Organic Carbon µg/m³ 4.6 ± 0.2 7.3 ± 0.4 7.1 ± 0.3 8.5 ± 0.4
Elemental Carbon Fraction 1 µg/m³ 0.1 0.1 0.1 0.3
Elemental Carbon Fraction 2 µg/m³ 0.2 0.1 0.2 0.4 ± 0.1
Elemental Carbon Fraction 3 µg/m³ ≤ LOD ≤ LOD ≤ LOD ≤ LOD
Elemental Carbon µg/m³ 0.2 ± 0.1 0.2 0.3 ± 0.1 0.4 ± 0.1
Total Carbon µg/m³ 4.8 ± 0.2 7.5 ± 0.3 7.3 ± 0.3 8.9 ± 0.4
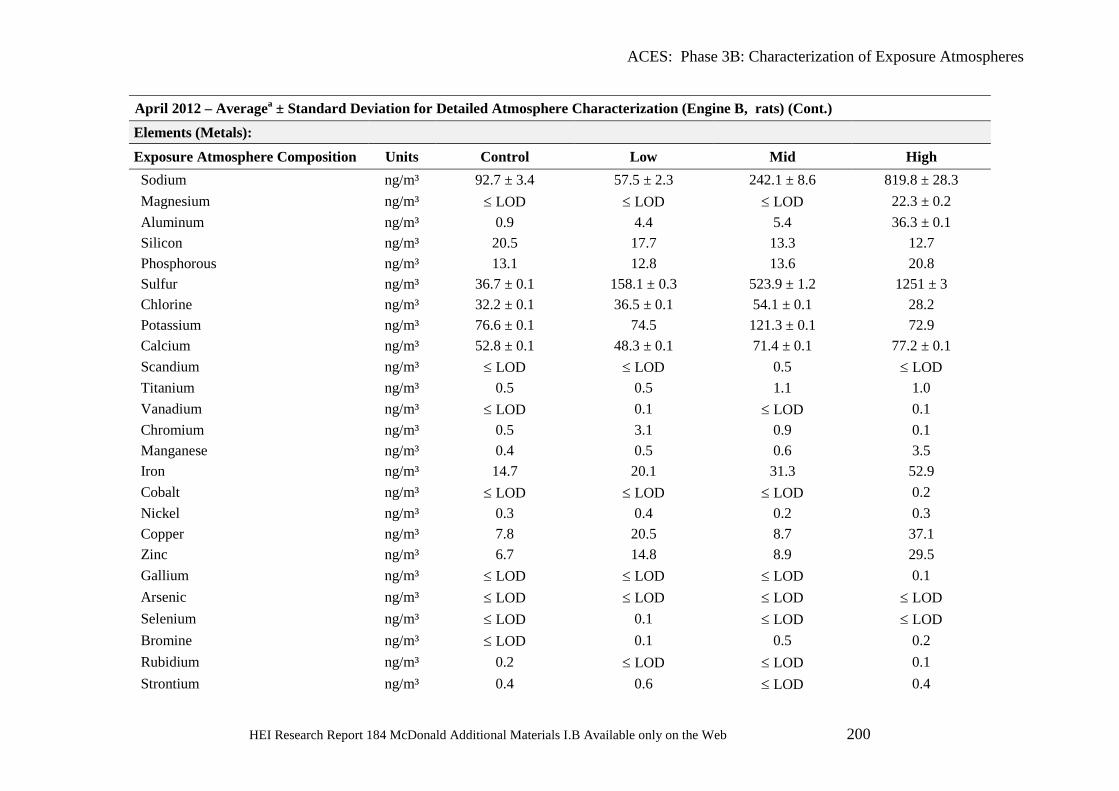
ACES: Phase 3B: Characterization of Exposure Atmospheres
HEI Research Report 184 McDonald Additional Materials I.B Available only on the Web 200
April 2012 – Averagea ± Standard Deviation for Detailed Atmosphere Characterization (Engine B, rats) (Cont.) Elements (Metals): Exposure Atmosphere Composition Units Control Low Mid High Sodium ng/m³ 92.7 ± 3.4 57.5 ± 2.3 242.1 ± 8.6 819.8 ± 28.3 Magnesium ng/m³ ≤ LOD ≤ LOD ≤ LOD 22.3 ± 0.2 Aluminum ng/m³ 0.9 4.4 5.4 36.3 ± 0.1 Silicon ng/m³ 20.5 17.7 13.3 12.7 Phosphorous ng/m³ 13.1 12.8 13.6 20.8 Sulfur ng/m³ 36.7 ± 0.1 158.1 ± 0.3 523.9 ± 1.2 1251 ± 3 Chlorine ng/m³ 32.2 ± 0.1 36.5 ± 0.1 54.1 ± 0.1 28.2 Potassium ng/m³ 76.6 ± 0.1 74.5 121.3 ± 0.1 72.9 Calcium ng/m³ 52.8 ± 0.1 48.3 ± 0.1 71.4 ± 0.1 77.2 ± 0.1 Scandium ng/m³ ≤ LOD ≤ LOD 0.5 ≤ LOD Titanium ng/m³ 0.5 0.5 1.1 1.0 Vanadium ng/m³ ≤ LOD 0.1 ≤ LOD 0.1 Chromium ng/m³ 0.5 3.1 0.9 0.1 Manganese ng/m³ 0.4 0.5 0.6 3.5 Iron ng/m³ 14.7 20.1 31.3 52.9 Cobalt ng/m³ ≤ LOD ≤ LOD ≤ LOD 0.2 Nickel ng/m³ 0.3 0.4 0.2 0.3 Copper ng/m³ 7.8 20.5 8.7 37.1 Zinc ng/m³ 6.7 14.8 8.9 29.5 Gallium ng/m³ ≤ LOD ≤ LOD ≤ LOD 0.1 Arsenic ng/m³ ≤ LOD ≤ LOD ≤ LOD ≤ LOD Selenium ng/m³ ≤ LOD 0.1 ≤ LOD ≤ LOD Bromine ng/m³ ≤ LOD 0.1 0.5 0.2 Rubidium ng/m³ 0.2 ≤ LOD ≤ LOD 0.1 Strontium ng/m³ 0.4 0.6 ≤ LOD 0.4
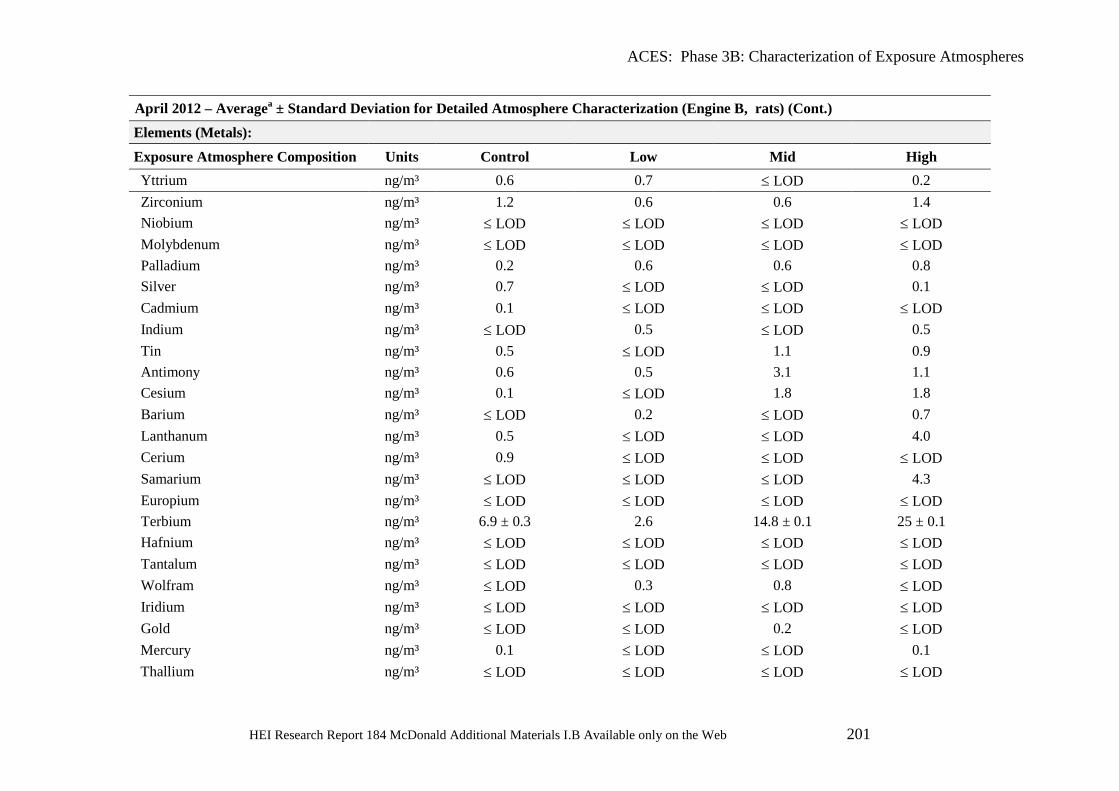
ACES: Phase 3B: Characterization of Exposure Atmospheres
HEI Research Report 184 McDonald Additional Materials I.B Available only on the Web 201
April 2012 – Averagea ± Standard Deviation for Detailed Atmosphere Characterization (Engine B, rats) (Cont.) Elements (Metals): Exposure Atmosphere Composition Units Control Low Mid High Yttrium ng/m³ 0.6 0.7 ≤ LOD 0.2 Zirconium ng/m³ 1.2 0.6 0.6 1.4 Niobium ng/m³ ≤ LOD ≤ LOD ≤ LOD ≤ LOD Molybdenum ng/m³ ≤ LOD ≤ LOD ≤ LOD ≤ LOD Palladium ng/m³ 0.2 0.6 0.6 0.8 Silver ng/m³ 0.7 ≤ LOD ≤ LOD 0.1 Cadmium ng/m³ 0.1 ≤ LOD ≤ LOD ≤ LOD Indium ng/m³ ≤ LOD 0.5 ≤ LOD 0.5 Tin ng/m³ 0.5 ≤ LOD 1.1 0.9 Antimony ng/m³ 0.6 0.5 3.1 1.1 Cesium ng/m³ 0.1 ≤ LOD 1.8 1.8 Barium ng/m³ ≤ LOD 0.2 ≤ LOD 0.7 Lanthanum ng/m³ 0.5 ≤ LOD ≤ LOD 4.0 Cerium ng/m³ 0.9 ≤ LOD ≤ LOD ≤ LOD Samarium ng/m³ ≤ LOD ≤ LOD ≤ LOD 4.3 Europium ng/m³ ≤ LOD ≤ LOD ≤ LOD ≤ LOD Terbium ng/m³ 6.9 ± 0.3 2.6 14.8 ± 0.1 25 ± 0.1 Hafnium ng/m³ ≤ LOD ≤ LOD ≤ LOD ≤ LOD Tantalum ng/m³ ≤ LOD ≤ LOD ≤ LOD ≤ LOD Wolfram ng/m³ ≤ LOD 0.3 0.8 ≤ LOD Iridium ng/m³ ≤ LOD ≤ LOD ≤ LOD ≤ LOD Gold ng/m³ ≤ LOD ≤ LOD 0.2 ≤ LOD Mercury ng/m³ 0.1 ≤ LOD ≤ LOD 0.1 Thallium ng/m³ ≤ LOD ≤ LOD ≤ LOD ≤ LOD
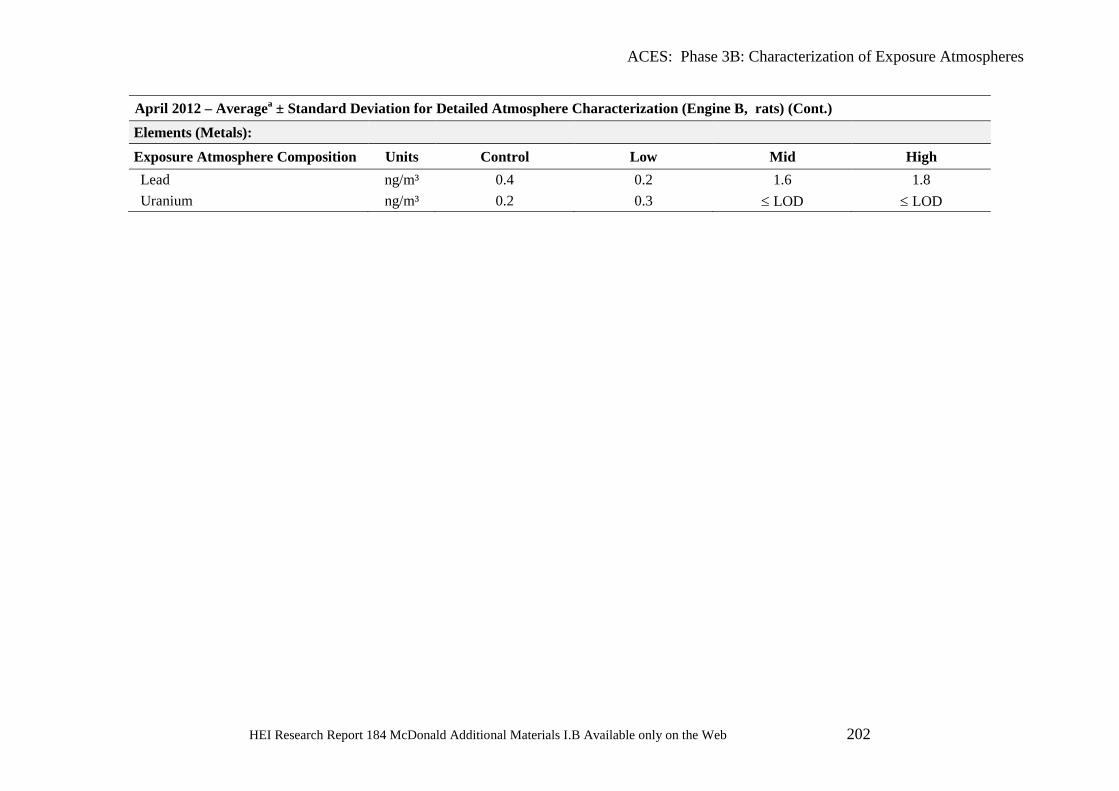
ACES: Phase 3B: Characterization of Exposure Atmospheres
HEI Research Report 184 McDonald Additional Materials I.B Available only on the Web 202
April 2012 – Averagea ± Standard Deviation for Detailed Atmosphere Characterization (Engine B, rats) (Cont.) Elements (Metals): Exposure Atmosphere Composition Units Control Low Mid High Lead ng/m³ 0.4 0.2 1.6 1.8 Uranium ng/m³ 0.2 0.3 ≤ LOD ≤ LOD
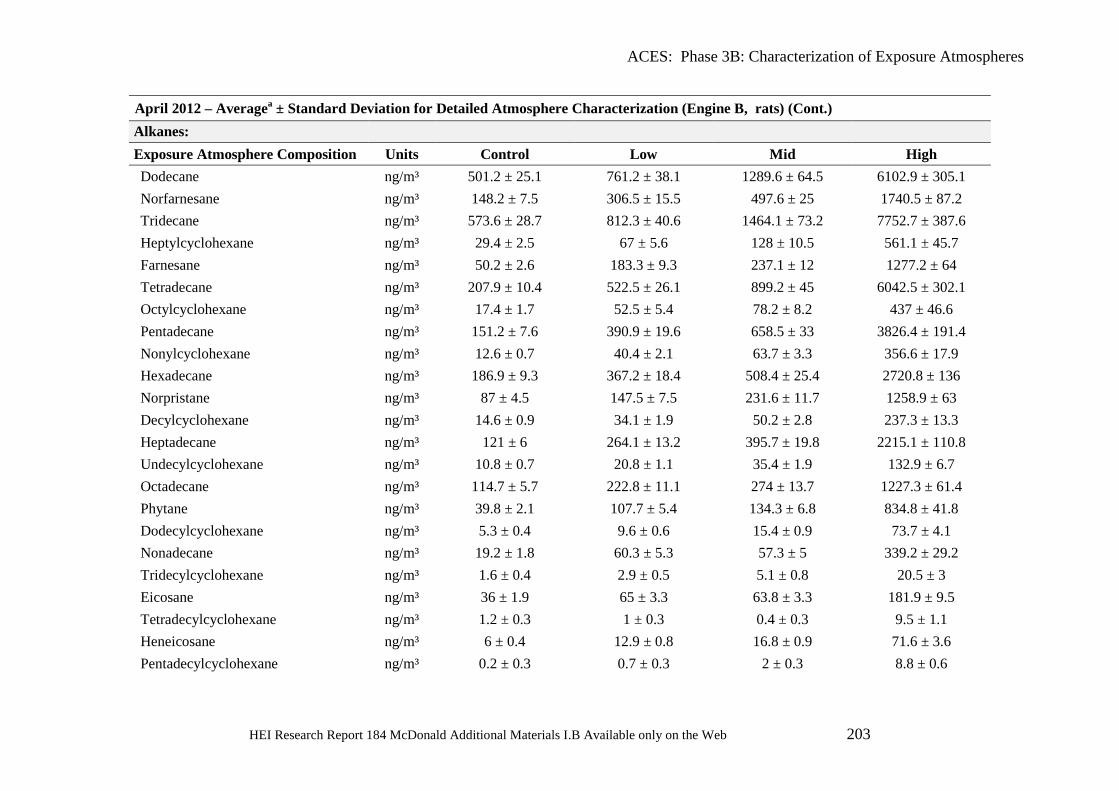
ACES: Phase 3B: Characterization of Exposure Atmospheres
HEI Research Report 184 McDonald Additional Materials I.B Available only on the Web 203
April 2012 – Averagea ± Standard Deviation for Detailed Atmosphere Characterization (Engine B, rats) (Cont.) Alkanes: Exposure Atmosphere Composition Units Control Low Mid High Dodecane ng/m³ 501.2 ± 25.1 761.2 ± 38.1 1289.6 ± 64.5 6102.9 ± 305.1 Norfarnesane ng/m³ 148.2 ± 7.5 306.5 ± 15.5 497.6 ± 25 1740.5 ± 87.2 Tridecane ng/m³ 573.6 ± 28.7 812.3 ± 40.6 1464.1 ± 73.2 7752.7 ± 387.6 Heptylcyclohexane ng/m³ 29.4 ± 2.5 67 ± 5.6 128 ± 10.5 561.1 ± 45.7 Farnesane ng/m³ 50.2 ± 2.6 183.3 ± 9.3 237.1 ± 12 1277.2 ± 64 Tetradecane ng/m³ 207.9 ± 10.4 522.5 ± 26.1 899.2 ± 45 6042.5 ± 302.1 Octylcyclohexane ng/m³ 17.4 ± 1.7 52.5 ± 5.4 78.2 ± 8.2 437 ± 46.6 Pentadecane ng/m³ 151.2 ± 7.6 390.9 ± 19.6 658.5 ± 33 3826.4 ± 191.4 Nonylcyclohexane ng/m³ 12.6 ± 0.7 40.4 ± 2.1 63.7 ± 3.3 356.6 ± 17.9 Hexadecane ng/m³ 186.9 ± 9.3 367.2 ± 18.4 508.4 ± 25.4 2720.8 ± 136 Norpristane ng/m³ 87 ± 4.5 147.5 ± 7.5 231.6 ± 11.7 1258.9 ± 63 Decylcyclohexane ng/m³ 14.6 ± 0.9 34.1 ± 1.9 50.2 ± 2.8 237.3 ± 13.3 Heptadecane ng/m³ 121 ± 6 264.1 ± 13.2 395.7 ± 19.8 2215.1 ± 110.8 Undecylcyclohexane ng/m³ 10.8 ± 0.7 20.8 ± 1.1 35.4 ± 1.9 132.9 ± 6.7 Octadecane ng/m³ 114.7 ± 5.7 222.8 ± 11.1 274 ± 13.7 1227.3 ± 61.4 Phytane ng/m³ 39.8 ± 2.1 107.7 ± 5.4 134.3 ± 6.8 834.8 ± 41.8 Dodecylcyclohexane ng/m³ 5.3 ± 0.4 9.6 ± 0.6 15.4 ± 0.9 73.7 ± 4.1 Nonadecane ng/m³ 19.2 ± 1.8 60.3 ± 5.3 57.3 ± 5 339.2 ± 29.2 Tridecylcyclohexane ng/m³ 1.6 ± 0.4 2.9 ± 0.5 5.1 ± 0.8 20.5 ± 3 Eicosane ng/m³ 36 ± 1.9 65 ± 3.3 63.8 ± 3.3 181.9 ± 9.5 Tetradecylcyclohexane ng/m³ 1.2 ± 0.3 1 ± 0.3 0.4 ± 0.3 9.5 ± 1.1 Heneicosane ng/m³ 6 ± 0.4 12.9 ± 0.8 16.8 ± 0.9 71.6 ± 3.6 Pentadecylcyclohexane ng/m³ 0.2 ± 0.3 0.7 ± 0.3 2 ± 0.3 8.8 ± 0.6
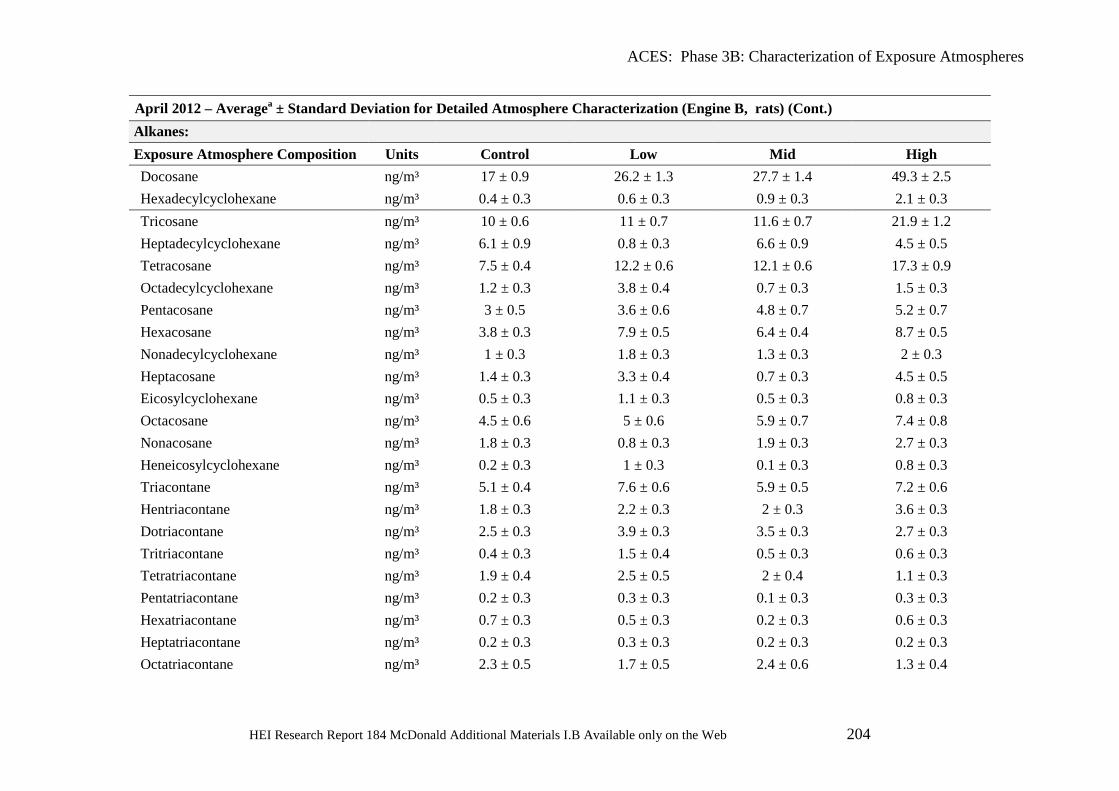
ACES: Phase 3B: Characterization of Exposure Atmospheres
HEI Research Report 184 McDonald Additional Materials I.B Available only on the Web 204
April 2012 – Averagea ± Standard Deviation for Detailed Atmosphere Characterization (Engine B, rats) (Cont.) Alkanes: Exposure Atmosphere Composition Units Control Low Mid High Docosane ng/m³ 17 ± 0.9 26.2 ± 1.3 27.7 ± 1.4 49.3 ± 2.5 Hexadecylcyclohexane ng/m³ 0.4 ± 0.3 0.6 ± 0.3 0.9 ± 0.3 2.1 ± 0.3 Tricosane ng/m³ 10 ± 0.6 11 ± 0.7 11.6 ± 0.7 21.9 ± 1.2 Heptadecylcyclohexane ng/m³ 6.1 ± 0.9 0.8 ± 0.3 6.6 ± 0.9 4.5 ± 0.5 Tetracosane ng/m³ 7.5 ± 0.4 12.2 ± 0.6 12.1 ± 0.6 17.3 ± 0.9 Octadecylcyclohexane ng/m³ 1.2 ± 0.3 3.8 ± 0.4 0.7 ± 0.3 1.5 ± 0.3 Pentacosane ng/m³ 3 ± 0.5 3.6 ± 0.6 4.8 ± 0.7 5.2 ± 0.7 Hexacosane ng/m³ 3.8 ± 0.3 7.9 ± 0.5 6.4 ± 0.4 8.7 ± 0.5 Nonadecylcyclohexane ng/m³ 1 ± 0.3 1.8 ± 0.3 1.3 ± 0.3 2 ± 0.3 Heptacosane ng/m³ 1.4 ± 0.3 3.3 ± 0.4 0.7 ± 0.3 4.5 ± 0.5 Eicosylcyclohexane ng/m³ 0.5 ± 0.3 1.1 ± 0.3 0.5 ± 0.3 0.8 ± 0.3 Octacosane ng/m³ 4.5 ± 0.6 5 ± 0.6 5.9 ± 0.7 7.4 ± 0.8 Nonacosane ng/m³ 1.8 ± 0.3 0.8 ± 0.3 1.9 ± 0.3 2.7 ± 0.3 Heneicosylcyclohexane ng/m³ 0.2 ± 0.3 1 ± 0.3 0.1 ± 0.3 0.8 ± 0.3 Triacontane ng/m³ 5.1 ± 0.4 7.6 ± 0.6 5.9 ± 0.5 7.2 ± 0.6 Hentriacontane ng/m³ 1.8 ± 0.3 2.2 ± 0.3 2 ± 0.3 3.6 ± 0.3 Dotriacontane ng/m³ 2.5 ± 0.3 3.9 ± 0.3 3.5 ± 0.3 2.7 ± 0.3 Tritriacontane ng/m³ 0.4 ± 0.3 1.5 ± 0.4 0.5 ± 0.3 0.6 ± 0.3 Tetratriacontane ng/m³ 1.9 ± 0.4 2.5 ± 0.5 2 ± 0.4 1.1 ± 0.3 Pentatriacontane ng/m³ 0.2 ± 0.3 0.3 ± 0.3 0.1 ± 0.3 0.3 ± 0.3 Hexatriacontane ng/m³ 0.7 ± 0.3 0.5 ± 0.3 0.2 ± 0.3 0.6 ± 0.3 Heptatriacontane ng/m³ 0.2 ± 0.3 0.3 ± 0.3 0.2 ± 0.3 0.2 ± 0.3 Octatriacontane ng/m³ 2.3 ± 0.5 1.7 ± 0.5 2.4 ± 0.6 1.3 ± 0.4
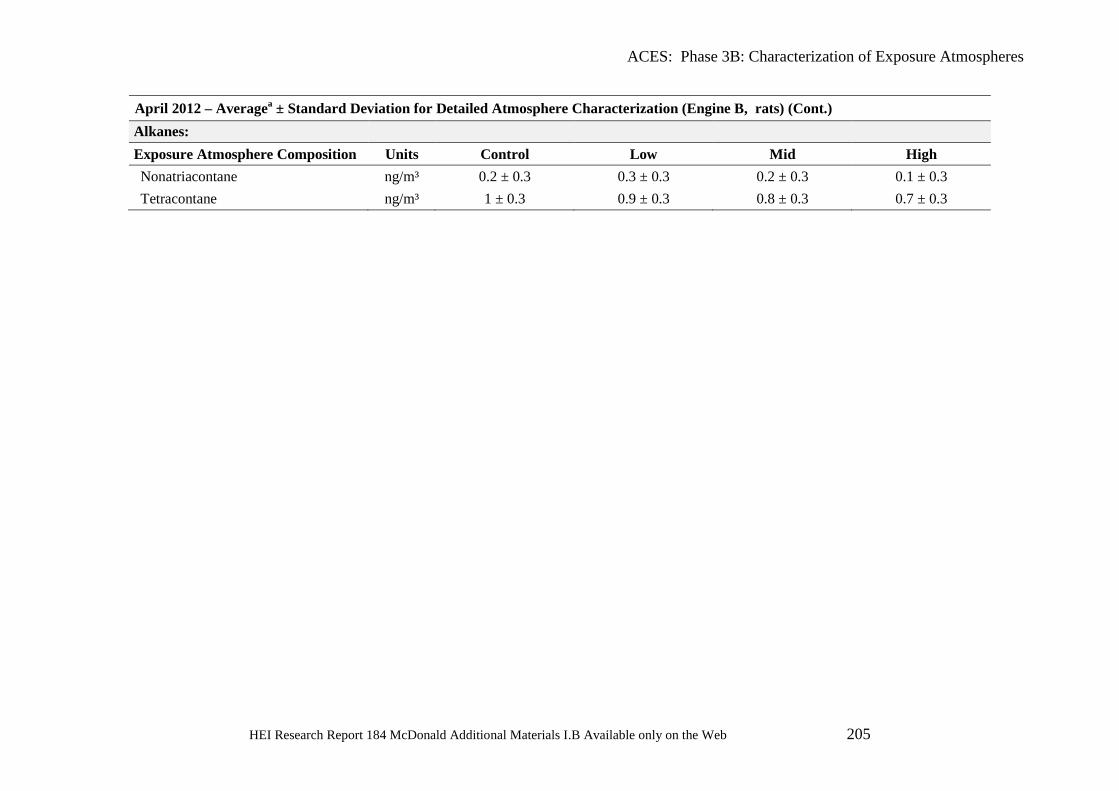
ACES: Phase 3B: Characterization of Exposure Atmospheres
HEI Research Report 184 McDonald Additional Materials I.B Available only on the Web 205
April 2012 – Averagea ± Standard Deviation for Detailed Atmosphere Characterization (Engine B, rats) (Cont.) Alkanes: Exposure Atmosphere Composition Units Control Low Mid High Nonatriacontane ng/m³ 0.2 ± 0.3 0.3 ± 0.3 0.2 ± 0.3 0.1 ± 0.3 Tetracontane ng/m³ 1 ± 0.3 0.9 ± 0.3 0.8 ± 0.3 0.7 ± 0.3
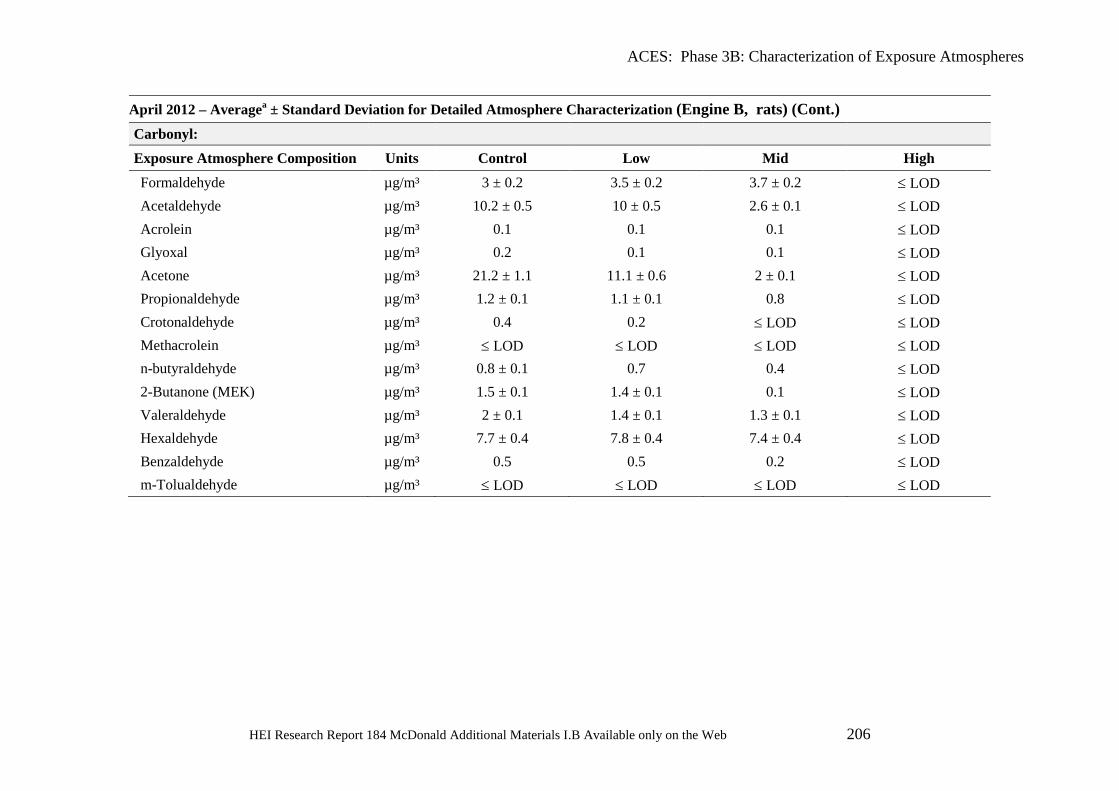
ACES: Phase 3B: Characterization of Exposure Atmospheres
HEI Research Report 184 McDonald Additional Materials I.B Available only on the Web 206
April 2012 – Averagea ± Standard Deviation for Detailed Atmosphere Characterization (Engine B, rats) (Cont.) Carbonyl: Exposure Atmosphere Composition Units Control Low Mid High Formaldehyde µg/m³ 3 ± 0.2 3.5 ± 0.2 3.7 ± 0.2 ≤ LOD Acetaldehyde µg/m³ 10.2 ± 0.5 10 ± 0.5 2.6 ± 0.1 ≤ LOD Acrolein µg/m³ 0.1 0.1 0.1 ≤ LOD Glyoxal µg/m³ 0.2 0.1 0.1 ≤ LOD Acetone µg/m³ 21.2 ± 1.1 11.1 ± 0.6 2 ± 0.1 ≤ LOD Propionaldehyde µg/m³ 1.2 ± 0.1 1.1 ± 0.1 0.8 ≤ LOD Crotonaldehyde µg/m³ 0.4 0.2 ≤ LOD ≤ LOD Methacrolein µg/m³ ≤ LOD ≤ LOD ≤ LOD ≤ LOD n-butyraldehyde µg/m³ 0.8 ± 0.1 0.7 0.4 ≤ LOD 2-Butanone (MEK) µg/m³ 1.5 ± 0.1 1.4 ± 0.1 0.1 ≤ LOD Valeraldehyde µg/m³ 2 ± 0.1 1.4 ± 0.1 1.3 ± 0.1 ≤ LOD Hexaldehyde µg/m³ 7.7 ± 0.4 7.8 ± 0.4 7.4 ± 0.4 ≤ LOD Benzaldehyde µg/m³ 0.5 0.5 0.2 ≤ LOD m-Tolualdehyde µg/m³ ≤ LOD ≤ LOD ≤ LOD ≤ LOD
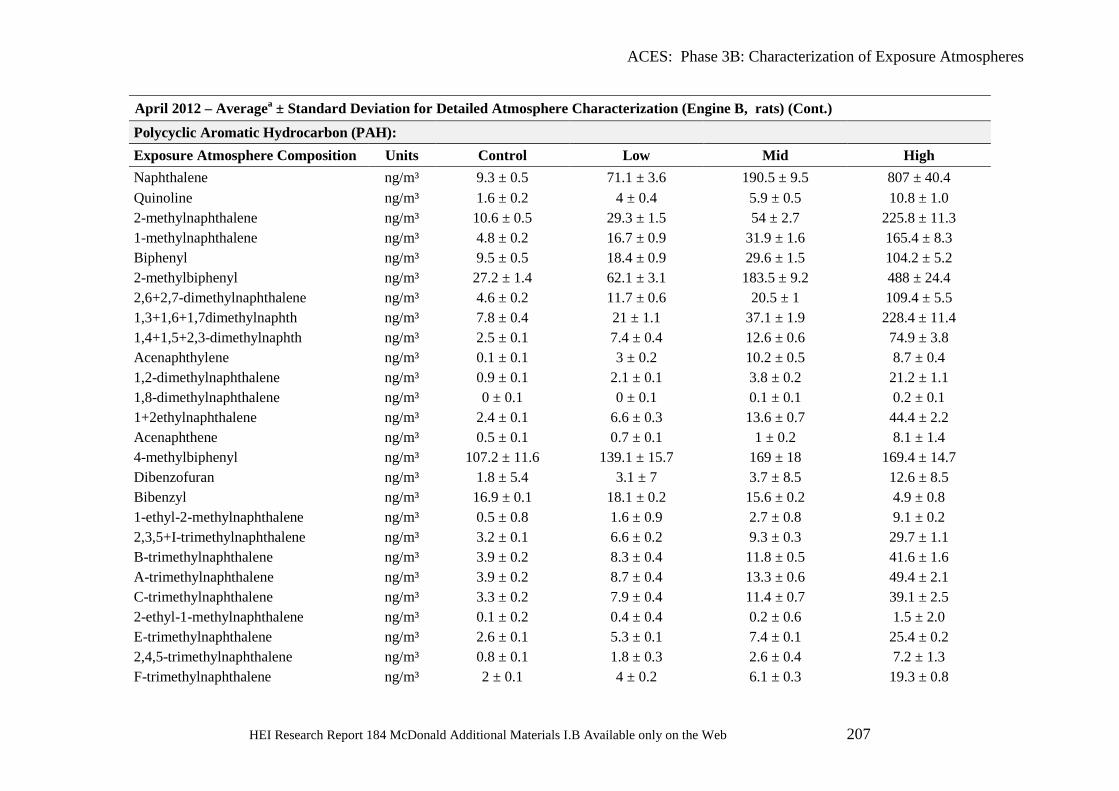
ACES: Phase 3B: Characterization of Exposure Atmospheres
HEI Research Report 184 McDonald Additional Materials I.B Available only on the Web 207
April 2012 – Averagea ± Standard Deviation for Detailed Atmosphere Characterization (Engine B, rats) (Cont.) Polycyclic Aromatic Hydrocarbon (PAH): Exposure Atmosphere Composition Units Control Low Mid High Naphthalene ng/m³ 9.3 ± 0.5 71.1 ± 3.6 190.5 ± 9.5 807 ± 40.4 Quinoline ng/m³ 1.6 ± 0.2 4 ± 0.4 5.9 ± 0.5 10.8 ± 1.0 2-methylnaphthalene ng/m³ 10.6 ± 0.5 29.3 ± 1.5 54 ± 2.7 225.8 ± 11.3 1-methylnaphthalene ng/m³ 4.8 ± 0.2 16.7 ± 0.9 31.9 ± 1.6 165.4 ± 8.3 Biphenyl ng/m³ 9.5 ± 0.5 18.4 ± 0.9 29.6 ± 1.5 104.2 ± 5.2 2-methylbiphenyl ng/m³ 27.2 ± 1.4 62.1 ± 3.1 183.5 ± 9.2 488 ± 24.4 2,6+2,7-dimethylnaphthalene ng/m³ 4.6 ± 0.2 11.7 ± 0.6 20.5 ± 1 109.4 ± 5.5 1,3+1,6+1,7dimethylnaphth ng/m³ 7.8 ± 0.4 21 ± 1.1 37.1 ± 1.9 228.4 ± 11.4 1,4+1,5+2,3-dimethylnaphth ng/m³ 2.5 ± 0.1 7.4 ± 0.4 12.6 ± 0.6 74.9 ± 3.8 Acenaphthylene ng/m³ 0.1 ± 0.1 3 ± 0.2 10.2 ± 0.5 8.7 ± 0.4 1,2-dimethylnaphthalene ng/m³ 0.9 ± 0.1 2.1 ± 0.1 3.8 ± 0.2 21.2 ± 1.1 1,8-dimethylnaphthalene ng/m³ 0 ± 0.1 0 ± 0.1 0.1 ± 0.1 0.2 ± 0.1 1+2ethylnaphthalene ng/m³ 2.4 ± 0.1 6.6 ± 0.3 13.6 ± 0.7 44.4 ± 2.2 Acenaphthene ng/m³ 0.5 ± 0.1 0.7 ± 0.1 1 ± 0.2 8.1 ± 1.4 4-methylbiphenyl ng/m³ 107.2 ± 11.6 139.1 ± 15.7 169 ± 18 169.4 ± 14.7 Dibenzofuran ng/m³ 1.8 ± 5.4 3.1 ± 7 3.7 ± 8.5 12.6 ± 8.5 Bibenzyl ng/m³ 16.9 ± 0.1 18.1 ± 0.2 15.6 ± 0.2 4.9 ± 0.8 1-ethyl-2-methylnaphthalene ng/m³ 0.5 ± 0.8 1.6 ± 0.9 2.7 ± 0.8 9.1 ± 0.2 2,3,5+I-trimethylnaphthalene ng/m³ 3.2 ± 0.1 6.6 ± 0.2 9.3 ± 0.3 29.7 ± 1.1 B-trimethylnaphthalene ng/m³ 3.9 ± 0.2 8.3 ± 0.4 11.8 ± 0.5 41.6 ± 1.6 A-trimethylnaphthalene ng/m³ 3.9 ± 0.2 8.7 ± 0.4 13.3 ± 0.6 49.4 ± 2.1 C-trimethylnaphthalene ng/m³ 3.3 ± 0.2 7.9 ± 0.4 11.4 ± 0.7 39.1 ± 2.5 2-ethyl-1-methylnaphthalene ng/m³ 0.1 ± 0.2 0.4 ± 0.4 0.2 ± 0.6 1.5 ± 2.0 E-trimethylnaphthalene ng/m³ 2.6 ± 0.1 5.3 ± 0.1 7.4 ± 0.1 25.4 ± 0.2 2,4,5-trimethylnaphthalene ng/m³ 0.8 ± 0.1 1.8 ± 0.3 2.6 ± 0.4 7.2 ± 1.3 F-trimethylnaphthalene ng/m³ 2 ± 0.1 4 ± 0.2 6.1 ± 0.3 19.3 ± 0.8
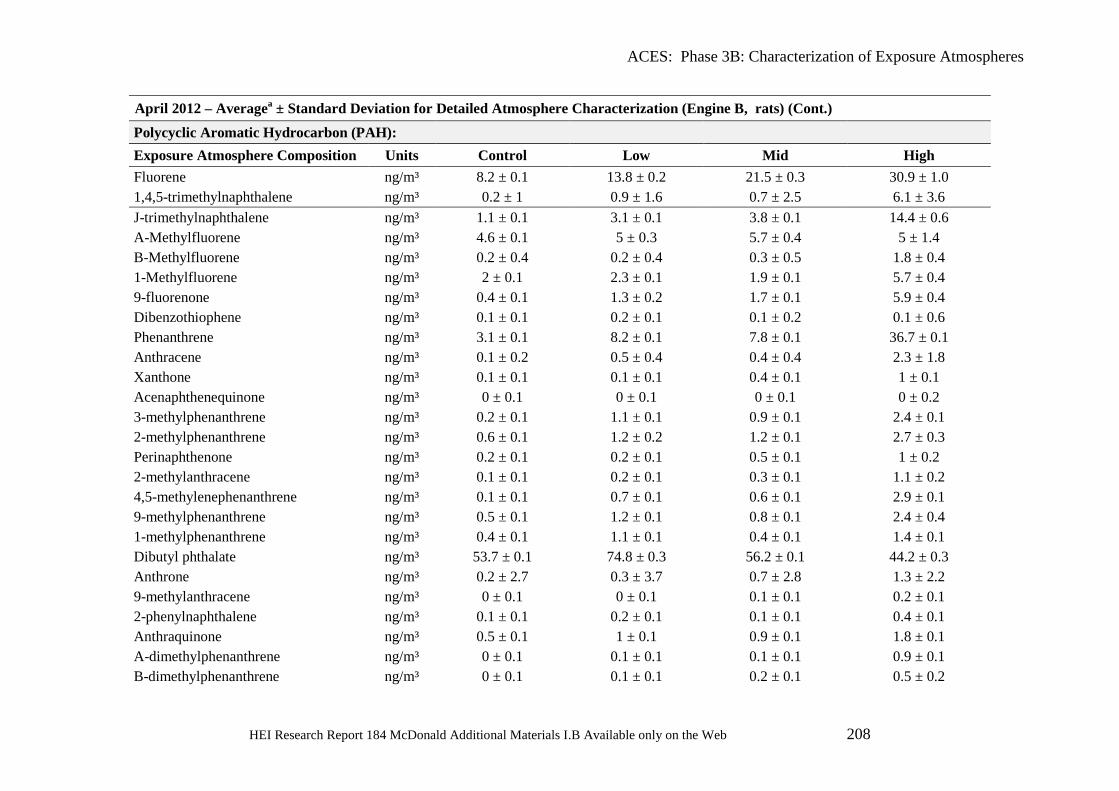
ACES: Phase 3B: Characterization of Exposure Atmospheres
HEI Research Report 184 McDonald Additional Materials I.B Available only on the Web 208
April 2012 – Averagea ± Standard Deviation for Detailed Atmosphere Characterization (Engine B, rats) (Cont.) Polycyclic Aromatic Hydrocarbon (PAH): Exposure Atmosphere Composition Units Control Low Mid High Fluorene ng/m³ 8.2 ± 0.1 13.8 ± 0.2 21.5 ± 0.3 30.9 ± 1.0 1,4,5-trimethylnaphthalene ng/m³ 0.2 ± 1 0.9 ± 1.6 0.7 ± 2.5 6.1 ± 3.6 J-trimethylnaphthalene ng/m³ 1.1 ± 0.1 3.1 ± 0.1 3.8 ± 0.1 14.4 ± 0.6 A-Methylfluorene ng/m³ 4.6 ± 0.1 5 ± 0.3 5.7 ± 0.4 5 ± 1.4 B-Methylfluorene ng/m³ 0.2 ± 0.4 0.2 ± 0.4 0.3 ± 0.5 1.8 ± 0.4 1-Methylfluorene ng/m³ 2 ± 0.1 2.3 ± 0.1 1.9 ± 0.1 5.7 ± 0.4 9-fluorenone ng/m³ 0.4 ± 0.1 1.3 ± 0.2 1.7 ± 0.1 5.9 ± 0.4 Dibenzothiophene ng/m³ 0.1 ± 0.1 0.2 ± 0.1 0.1 ± 0.2 0.1 ± 0.6 Phenanthrene ng/m³ 3.1 ± 0.1 8.2 ± 0.1 7.8 ± 0.1 36.7 ± 0.1 Anthracene ng/m³ 0.1 ± 0.2 0.5 ± 0.4 0.4 ± 0.4 2.3 ± 1.8 Xanthone ng/m³ 0.1 ± 0.1 0.1 ± 0.1 0.4 ± 0.1 1 ± 0.1 Acenaphthenequinone ng/m³ 0 ± 0.1 0 ± 0.1 0 ± 0.1 0 ± 0.2 3-methylphenanthrene ng/m³ 0.2 ± 0.1 1.1 ± 0.1 0.9 ± 0.1 2.4 ± 0.1 2-methylphenanthrene ng/m³ 0.6 ± 0.1 1.2 ± 0.2 1.2 ± 0.1 2.7 ± 0.3 Perinaphthenone ng/m³ 0.2 ± 0.1 0.2 ± 0.1 0.5 ± 0.1 1 ± 0.2 2-methylanthracene ng/m³ 0.1 ± 0.1 0.2 ± 0.1 0.3 ± 0.1 1.1 ± 0.2 4,5-methylenephenanthrene ng/m³ 0.1 ± 0.1 0.7 ± 0.1 0.6 ± 0.1 2.9 ± 0.1 9-methylphenanthrene ng/m³ 0.5 ± 0.1 1.2 ± 0.1 0.8 ± 0.1 2.4 ± 0.4 1-methylphenanthrene ng/m³ 0.4 ± 0.1 1.1 ± 0.1 0.4 ± 0.1 1.4 ± 0.1 Dibutyl phthalate ng/m³ 53.7 ± 0.1 74.8 ± 0.3 56.2 ± 0.1 44.2 ± 0.3 Anthrone ng/m³ 0.2 ± 2.7 0.3 ± 3.7 0.7 ± 2.8 1.3 ± 2.2 9-methylanthracene ng/m³ 0 ± 0.1 0 ± 0.1 0.1 ± 0.1 0.2 ± 0.1 2-phenylnaphthalene ng/m³ 0.1 ± 0.1 0.2 ± 0.1 0.1 ± 0.1 0.4 ± 0.1 Anthraquinone ng/m³ 0.5 ± 0.1 1 ± 0.1 0.9 ± 0.1 1.8 ± 0.1 A-dimethylphenanthrene ng/m³ 0 ± 0.1 0.1 ± 0.1 0.1 ± 0.1 0.9 ± 0.1 B-dimethylphenanthrene ng/m³ 0 ± 0.1 0.1 ± 0.1 0.2 ± 0.1 0.5 ± 0.2
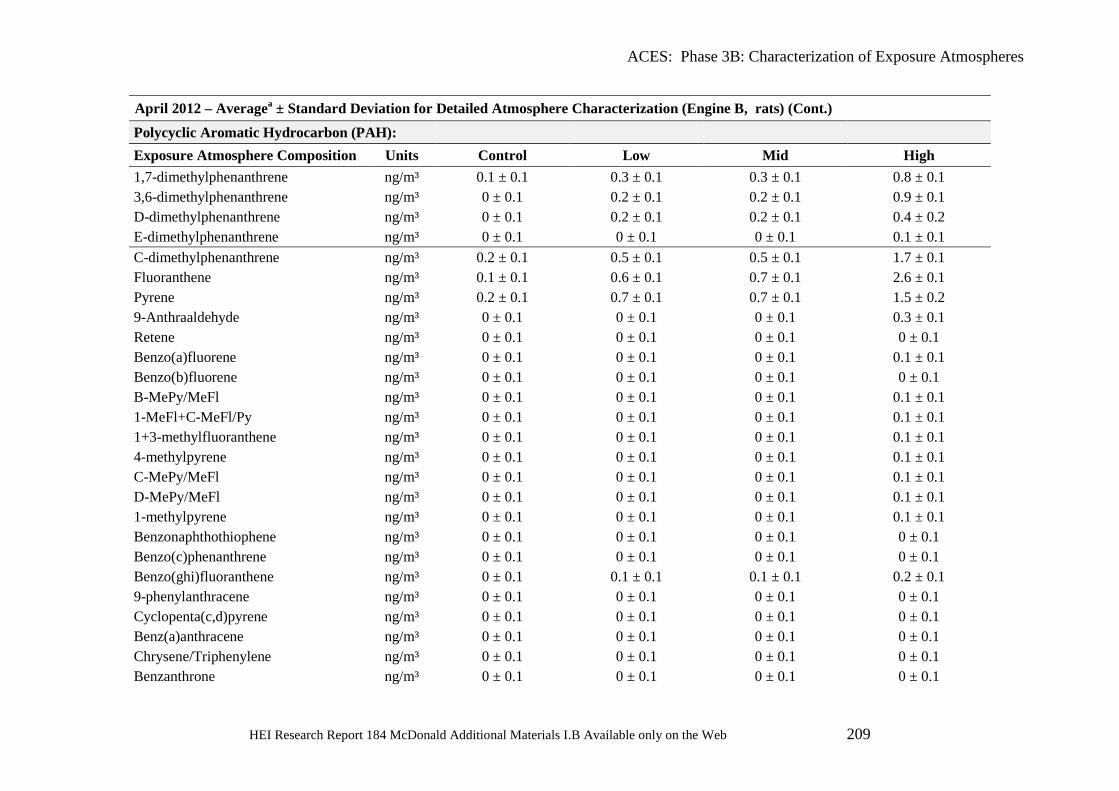
ACES: Phase 3B: Characterization of Exposure Atmospheres
HEI Research Report 184 McDonald Additional Materials I.B Available only on the Web 209
April 2012 – Averagea ± Standard Deviation for Detailed Atmosphere Characterization (Engine B, rats) (Cont.) Polycyclic Aromatic Hydrocarbon (PAH): Exposure Atmosphere Composition Units Control Low Mid High 1,7-dimethylphenanthrene ng/m³ 0.1 ± 0.1 0.3 ± 0.1 0.3 ± 0.1 0.8 ± 0.1 3,6-dimethylphenanthrene ng/m³ 0 ± 0.1 0.2 ± 0.1 0.2 ± 0.1 0.9 ± 0.1 D-dimethylphenanthrene ng/m³ 0 ± 0.1 0.2 ± 0.1 0.2 ± 0.1 0.4 ± 0.2 E-dimethylphenanthrene ng/m³ 0 ± 0.1 0 ± 0.1 0 ± 0.1 0.1 ± 0.1 C-dimethylphenanthrene ng/m³ 0.2 ± 0.1 0.5 ± 0.1 0.5 ± 0.1 1.7 ± 0.1 Fluoranthene ng/m³ 0.1 ± 0.1 0.6 ± 0.1 0.7 ± 0.1 2.6 ± 0.1 Pyrene ng/m³ 0.2 ± 0.1 0.7 ± 0.1 0.7 ± 0.1 1.5 ± 0.2 9-Anthraaldehyde ng/m³ 0 ± 0.1 0 ± 0.1 0 ± 0.1 0.3 ± 0.1 Retene ng/m³ 0 ± 0.1 0 ± 0.1 0 ± 0.1 0 ± 0.1 Benzo(a)fluorene ng/m³ 0 ± 0.1 0 ± 0.1 0 ± 0.1 0.1 ± 0.1 Benzo(b)fluorene ng/m³ 0 ± 0.1 0 ± 0.1 0 ± 0.1 0 ± 0.1 B-MePy/MeFl ng/m³ 0 ± 0.1 0 ± 0.1 0 ± 0.1 0.1 ± 0.1 1-MeFl+C-MeFl/Py ng/m³ 0 ± 0.1 0 ± 0.1 0 ± 0.1 0.1 ± 0.1 1+3-methylfluoranthene ng/m³ 0 ± 0.1 0 ± 0.1 0 ± 0.1 0.1 ± 0.1 4-methylpyrene ng/m³ 0 ± 0.1 0 ± 0.1 0 ± 0.1 0.1 ± 0.1 C-MePy/MeFl ng/m³ 0 ± 0.1 0 ± 0.1 0 ± 0.1 0.1 ± 0.1 D-MePy/MeFl ng/m³ 0 ± 0.1 0 ± 0.1 0 ± 0.1 0.1 ± 0.1 1-methylpyrene ng/m³ 0 ± 0.1 0 ± 0.1 0 ± 0.1 0.1 ± 0.1 Benzonaphthothiophene ng/m³ 0 ± 0.1 0 ± 0.1 0 ± 0.1 0 ± 0.1 Benzo(c)phenanthrene ng/m³ 0 ± 0.1 0 ± 0.1 0 ± 0.1 0 ± 0.1 Benzo(ghi)fluoranthene ng/m³ 0 ± 0.1 0.1 ± 0.1 0.1 ± 0.1 0.2 ± 0.1 9-phenylanthracene ng/m³ 0 ± 0.1 0 ± 0.1 0 ± 0.1 0 ± 0.1 Cyclopenta(c,d)pyrene ng/m³ 0 ± 0.1 0 ± 0.1 0 ± 0.1 0 ± 0.1 Benz(a)anthracene ng/m³ 0 ± 0.1 0 ± 0.1 0 ± 0.1 0 ± 0.1 Chrysene/Triphenylene ng/m³ 0 ± 0.1 0 ± 0.1 0 ± 0.1 0 ± 0.1 Benzanthrone ng/m³ 0 ± 0.1 0 ± 0.1 0 ± 0.1 0 ± 0.1
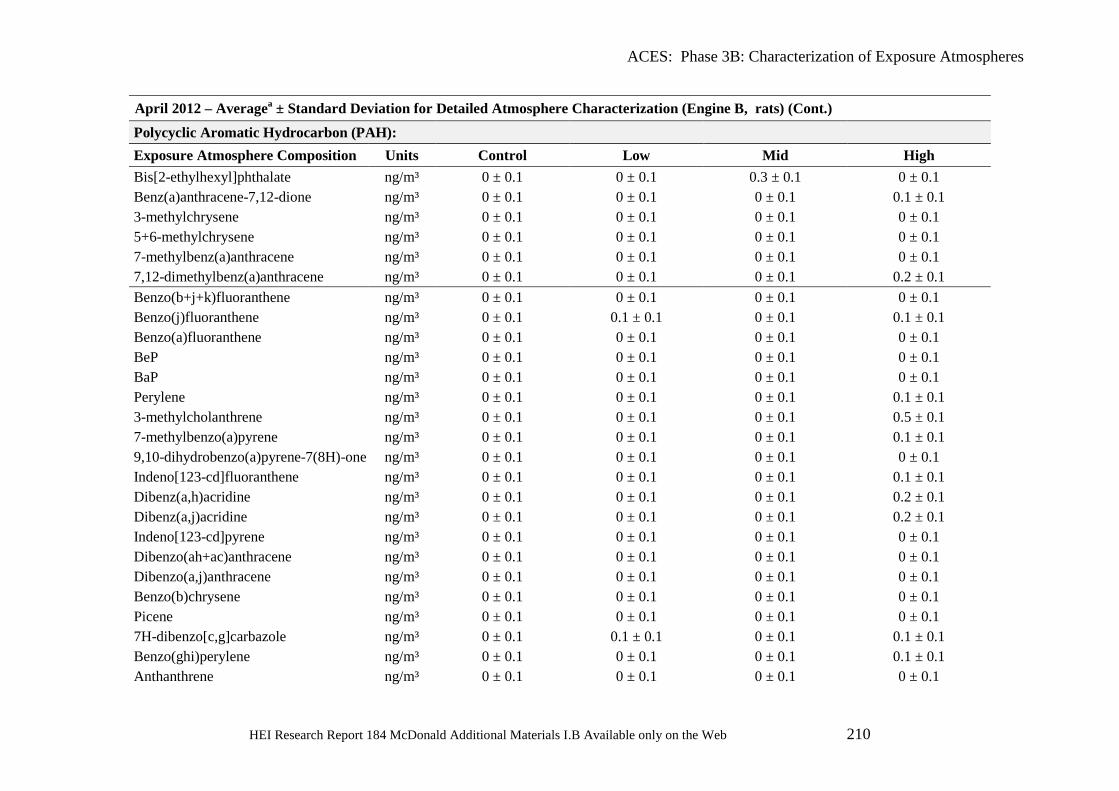
ACES: Phase 3B: Characterization of Exposure Atmospheres
HEI Research Report 184 McDonald Additional Materials I.B Available only on the Web 210
April 2012 – Averagea ± Standard Deviation for Detailed Atmosphere Characterization (Engine B, rats) (Cont.) Polycyclic Aromatic Hydrocarbon (PAH): Exposure Atmosphere Composition Units Control Low Mid High Bis[2-ethylhexyl]phthalate ng/m³ 0 ± 0.1 0 ± 0.1 0.3 ± 0.1 0 ± 0.1 Benz(a)anthracene-7,12-dione ng/m³ 0 ± 0.1 0 ± 0.1 0 ± 0.1 0.1 ± 0.1 3-methylchrysene ng/m³ 0 ± 0.1 0 ± 0.1 0 ± 0.1 0 ± 0.1 5+6-methylchrysene ng/m³ 0 ± 0.1 0 ± 0.1 0 ± 0.1 0 ± 0.1 7-methylbenz(a)anthracene ng/m³ 0 ± 0.1 0 ± 0.1 0 ± 0.1 0 ± 0.1 7,12-dimethylbenz(a)anthracene ng/m³ 0 ± 0.1 0 ± 0.1 0 ± 0.1 0.2 ± 0.1 Benzo(b+j+k)fluoranthene ng/m³ 0 ± 0.1 0 ± 0.1 0 ± 0.1 0 ± 0.1 Benzo(j)fluoranthene ng/m³ 0 ± 0.1 0.1 ± 0.1 0 ± 0.1 0.1 ± 0.1 Benzo(a)fluoranthene ng/m³ 0 ± 0.1 0 ± 0.1 0 ± 0.1 0 ± 0.1 BeP ng/m³ 0 ± 0.1 0 ± 0.1 0 ± 0.1 0 ± 0.1 BaP ng/m³ 0 ± 0.1 0 ± 0.1 0 ± 0.1 0 ± 0.1 Perylene ng/m³ 0 ± 0.1 0 ± 0.1 0 ± 0.1 0.1 ± 0.1 3-methylcholanthrene ng/m³ 0 ± 0.1 0 ± 0.1 0 ± 0.1 0.5 ± 0.1 7-methylbenzo(a)pyrene ng/m³ 0 ± 0.1 0 ± 0.1 0 ± 0.1 0.1 ± 0.1 9,10-dihydrobenzo(a)pyrene-7(8H)-one ng/m³ 0 ± 0.1 0 ± 0.1 0 ± 0.1 0 ± 0.1 Indeno[123-cd]fluoranthene ng/m³ 0 ± 0.1 0 ± 0.1 0 ± 0.1 0.1 ± 0.1 Dibenz(a,h)acridine ng/m³ 0 ± 0.1 0 ± 0.1 0 ± 0.1 0.2 ± 0.1 Dibenz(a,j)acridine ng/m³ 0 ± 0.1 0 ± 0.1 0 ± 0.1 0.2 ± 0.1 Indeno[123-cd]pyrene ng/m³ 0 ± 0.1 0 ± 0.1 0 ± 0.1 0 ± 0.1 Dibenzo(ah+ac)anthracene ng/m³ 0 ± 0.1 0 ± 0.1 0 ± 0.1 0 ± 0.1 Dibenzo(a,j)anthracene ng/m³ 0 ± 0.1 0 ± 0.1 0 ± 0.1 0 ± 0.1 Benzo(b)chrysene ng/m³ 0 ± 0.1 0 ± 0.1 0 ± 0.1 0 ± 0.1 Picene ng/m³ 0 ± 0.1 0 ± 0.1 0 ± 0.1 0 ± 0.1 7H-dibenzo[c,g]carbazole ng/m³ 0 ± 0.1 0.1 ± 0.1 0 ± 0.1 0.1 ± 0.1 Benzo(ghi)perylene ng/m³ 0 ± 0.1 0 ± 0.1 0 ± 0.1 0.1 ± 0.1 Anthanthrene ng/m³ 0 ± 0.1 0 ± 0.1 0 ± 0.1 0 ± 0.1
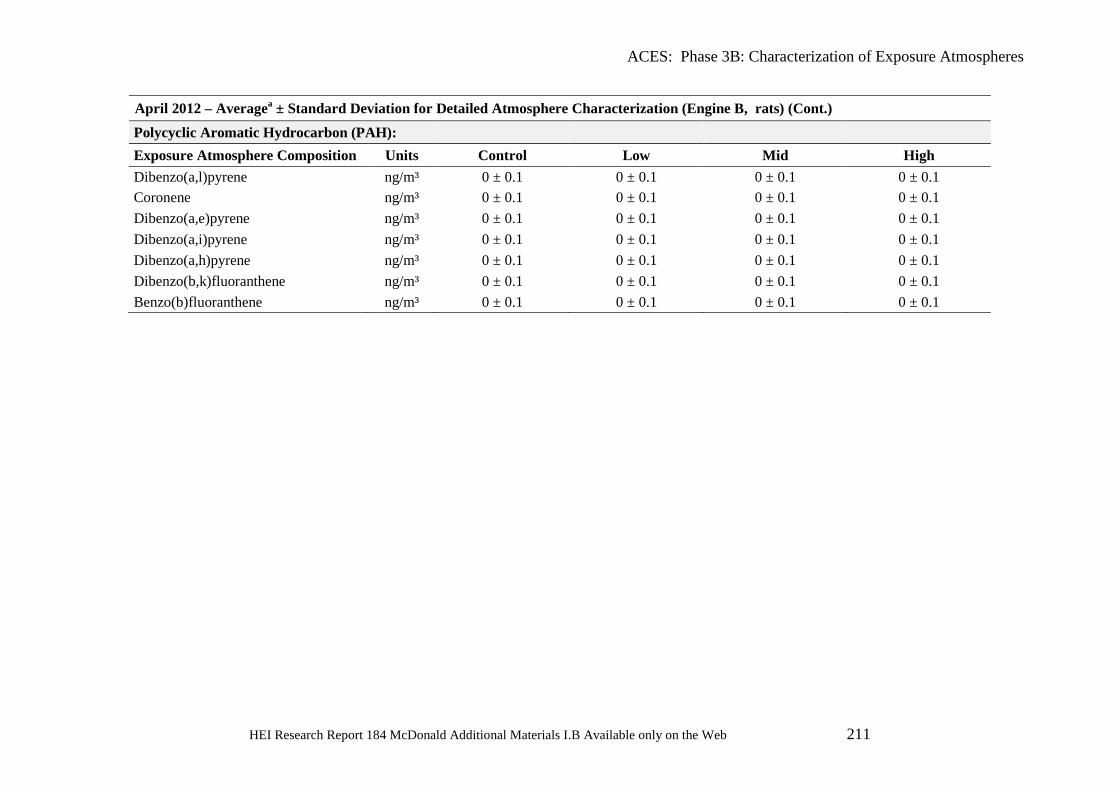
ACES: Phase 3B: Characterization of Exposure Atmospheres
HEI Research Report 184 McDonald Additional Materials I.B Available only on the Web 211
April 2012 – Averagea ± Standard Deviation for Detailed Atmosphere Characterization (Engine B, rats) (Cont.) Polycyclic Aromatic Hydrocarbon (PAH): Exposure Atmosphere Composition Units Control Low Mid High Dibenzo(a,l)pyrene ng/m³ 0 ± 0.1 0 ± 0.1 0 ± 0.1 0 ± 0.1 Coronene ng/m³ 0 ± 0.1 0 ± 0.1 0 ± 0.1 0 ± 0.1 Dibenzo(a,e)pyrene ng/m³ 0 ± 0.1 0 ± 0.1 0 ± 0.1 0 ± 0.1 Dibenzo(a,i)pyrene ng/m³ 0 ± 0.1 0 ± 0.1 0 ± 0.1 0 ± 0.1 Dibenzo(a,h)pyrene ng/m³ 0 ± 0.1 0 ± 0.1 0 ± 0.1 0 ± 0.1 Dibenzo(b,k)fluoranthene ng/m³ 0 ± 0.1 0 ± 0.1 0 ± 0.1 0 ± 0.1 Benzo(b)fluoranthene ng/m³ 0 ± 0.1 0 ± 0.1 0 ± 0.1 0 ± 0.1
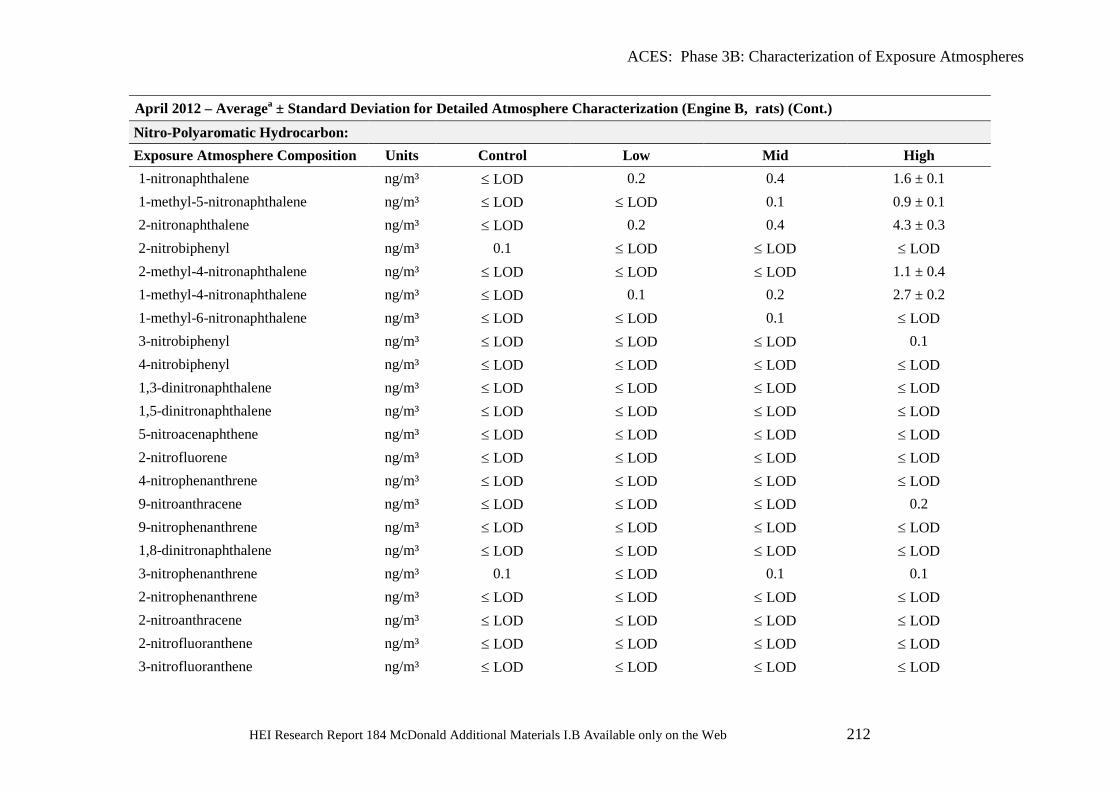
ACES: Phase 3B: Characterization of Exposure Atmospheres
HEI Research Report 184 McDonald Additional Materials I.B Available only on the Web 212
April 2012 – Averagea ± Standard Deviation for Detailed Atmosphere Characterization (Engine B, rats) (Cont.) Nitro-Polyaromatic Hydrocarbon: Exposure Atmosphere Composition Units Control Low Mid High 1-nitronaphthalene ng/m³ ≤ LOD 0.2 0.4 1.6 ± 0.1 1-methyl-5-nitronaphthalene ng/m³ ≤ LOD ≤ LOD 0.1 0.9 ± 0.1 2-nitronaphthalene ng/m³ ≤ LOD 0.2 0.4 4.3 ± 0.3 2-nitrobiphenyl ng/m³ 0.1 ≤ LOD ≤ LOD ≤ LOD 2-methyl-4-nitronaphthalene ng/m³ ≤ LOD ≤ LOD ≤ LOD 1.1 ± 0.4 1-methyl-4-nitronaphthalene ng/m³ ≤ LOD 0.1 0.2 2.7 ± 0.2 1-methyl-6-nitronaphthalene ng/m³ ≤ LOD ≤ LOD 0.1 ≤ LOD 3-nitrobiphenyl ng/m³ ≤ LOD ≤ LOD ≤ LOD 0.1 4-nitrobiphenyl ng/m³ ≤ LOD ≤ LOD ≤ LOD ≤ LOD 1,3-dinitronaphthalene ng/m³ ≤ LOD ≤ LOD ≤ LOD ≤ LOD 1,5-dinitronaphthalene ng/m³ ≤ LOD ≤ LOD ≤ LOD ≤ LOD 5-nitroacenaphthene ng/m³ ≤ LOD ≤ LOD ≤ LOD ≤ LOD 2-nitrofluorene ng/m³ ≤ LOD ≤ LOD ≤ LOD ≤ LOD 4-nitrophenanthrene ng/m³ ≤ LOD ≤ LOD ≤ LOD ≤ LOD 9-nitroanthracene ng/m³ ≤ LOD ≤ LOD ≤ LOD 0.2 9-nitrophenanthrene ng/m³ ≤ LOD ≤ LOD ≤ LOD ≤ LOD 1,8-dinitronaphthalene ng/m³ ≤ LOD ≤ LOD ≤ LOD ≤ LOD 3-nitrophenanthrene ng/m³ 0.1 ≤ LOD 0.1 0.1 2-nitrophenanthrene ng/m³ ≤ LOD ≤ LOD ≤ LOD ≤ LOD 2-nitroanthracene ng/m³ ≤ LOD ≤ LOD ≤ LOD ≤ LOD 2-nitrofluoranthene ng/m³ ≤ LOD ≤ LOD ≤ LOD ≤ LOD 3-nitrofluoranthene ng/m³ ≤ LOD ≤ LOD ≤ LOD ≤ LOD
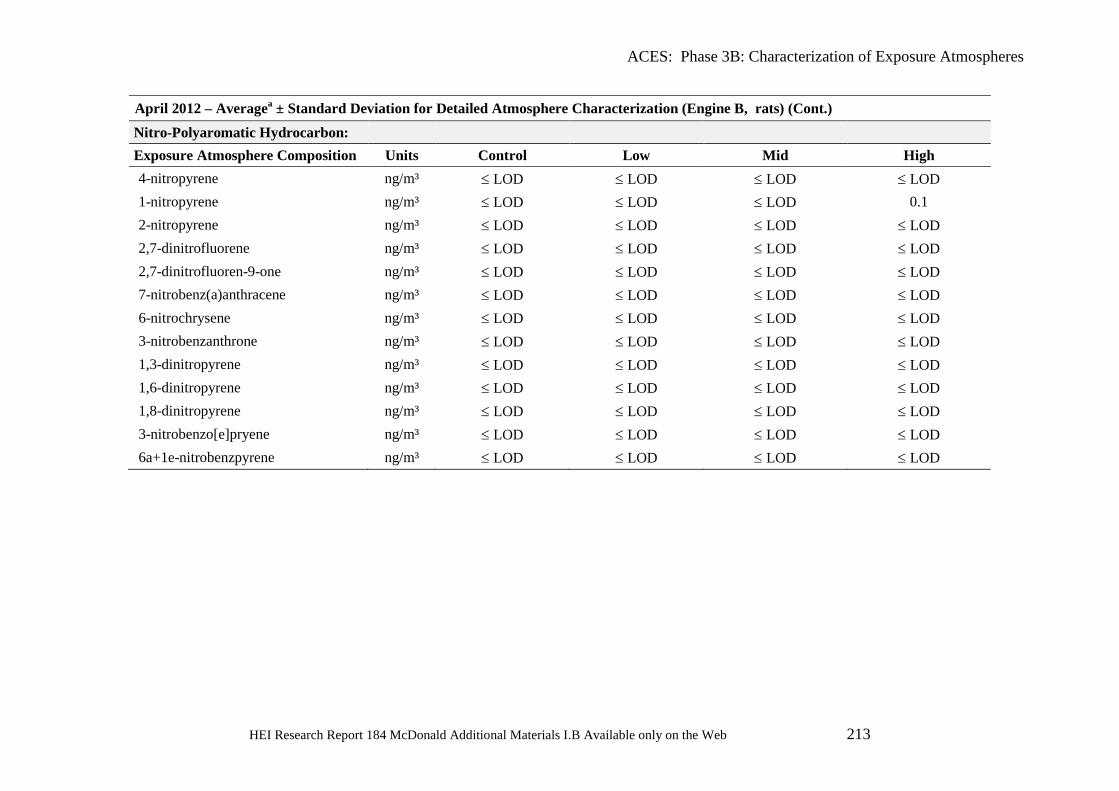
ACES: Phase 3B: Characterization of Exposure Atmospheres
HEI Research Report 184 McDonald Additional Materials I.B Available only on the Web 213
April 2012 – Averagea ± Standard Deviation for Detailed Atmosphere Characterization (Engine B, rats) (Cont.) Nitro-Polyaromatic Hydrocarbon: Exposure Atmosphere Composition Units Control Low Mid High 4-nitropyrene ng/m³ ≤ LOD ≤ LOD ≤ LOD ≤ LOD 1-nitropyrene ng/m³ ≤ LOD ≤ LOD ≤ LOD 0.1 2-nitropyrene ng/m³ ≤ LOD ≤ LOD ≤ LOD ≤ LOD 2,7-dinitrofluorene ng/m³ ≤ LOD ≤ LOD ≤ LOD ≤ LOD 2,7-dinitrofluoren-9-one ng/m³ ≤ LOD ≤ LOD ≤ LOD ≤ LOD 7-nitrobenz(a)anthracene ng/m³ ≤ LOD ≤ LOD ≤ LOD ≤ LOD 6-nitrochrysene ng/m³ ≤ LOD ≤ LOD ≤ LOD ≤ LOD 3-nitrobenzanthrone ng/m³ ≤ LOD ≤ LOD ≤ LOD ≤ LOD 1,3-dinitropyrene ng/m³ ≤ LOD ≤ LOD ≤ LOD ≤ LOD 1,6-dinitropyrene ng/m³ ≤ LOD ≤ LOD ≤ LOD ≤ LOD 1,8-dinitropyrene ng/m³ ≤ LOD ≤ LOD ≤ LOD ≤ LOD 3-nitrobenzo[e]pryene ng/m³ ≤ LOD ≤ LOD ≤ LOD ≤ LOD 6a+1e-nitrobenzpyrene ng/m³ ≤ LOD ≤ LOD ≤ LOD ≤ LOD
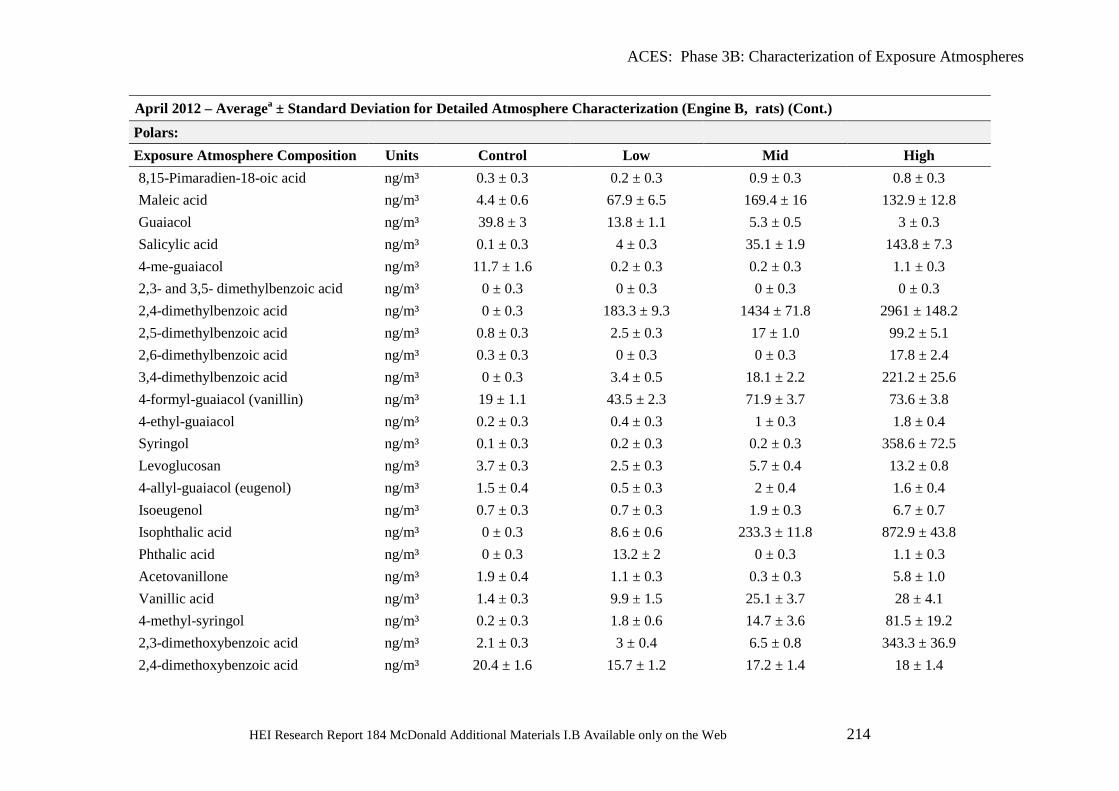
ACES: Phase 3B: Characterization of Exposure Atmospheres
HEI Research Report 184 McDonald Additional Materials I.B Available only on the Web 214
April 2012 – Averagea ± Standard Deviation for Detailed Atmosphere Characterization (Engine B, rats) (Cont.) Polars: Exposure Atmosphere Composition Units Control Low Mid High 8,15-Pimaradien-18-oic acid ng/m³ 0.3 ± 0.3 0.2 ± 0.3 0.9 ± 0.3 0.8 ± 0.3 Maleic acid ng/m³ 4.4 ± 0.6 67.9 ± 6.5 169.4 ± 16 132.9 ± 12.8 Guaiacol ng/m³ 39.8 ± 3 13.8 ± 1.1 5.3 ± 0.5 3 ± 0.3 Salicylic acid ng/m³ 0.1 ± 0.3 4 ± 0.3 35.1 ± 1.9 143.8 ± 7.3 4-me-guaiacol ng/m³ 11.7 ± 1.6 0.2 ± 0.3 0.2 ± 0.3 1.1 ± 0.3 2,3- and 3,5- dimethylbenzoic acid ng/m³ 0 ± 0.3 0 ± 0.3 0 ± 0.3 0 ± 0.3 2,4-dimethylbenzoic acid ng/m³ 0 ± 0.3 183.3 ± 9.3 1434 ± 71.8 2961 ± 148.2 2,5-dimethylbenzoic acid ng/m³ 0.8 ± 0.3 2.5 ± 0.3 17 ± 1.0 99.2 ± 5.1 2,6-dimethylbenzoic acid ng/m³ 0.3 ± 0.3 0 ± 0.3 0 ± 0.3 17.8 ± 2.4 3,4-dimethylbenzoic acid ng/m³ 0 ± 0.3 3.4 ± 0.5 18.1 ± 2.2 221.2 ± 25.6 4-formyl-guaiacol (vanillin) ng/m³ 19 ± 1.1 43.5 ± 2.3 71.9 ± 3.7 73.6 ± 3.8 4-ethyl-guaiacol ng/m³ 0.2 ± 0.3 0.4 ± 0.3 1 ± 0.3 1.8 ± 0.4 Syringol ng/m³ 0.1 ± 0.3 0.2 ± 0.3 0.2 ± 0.3 358.6 ± 72.5 Levoglucosan ng/m³ 3.7 ± 0.3 2.5 ± 0.3 5.7 ± 0.4 13.2 ± 0.8 4-allyl-guaiacol (eugenol) ng/m³ 1.5 ± 0.4 0.5 ± 0.3 2 ± 0.4 1.6 ± 0.4 Isoeugenol ng/m³ 0.7 ± 0.3 0.7 ± 0.3 1.9 ± 0.3 6.7 ± 0.7 Isophthalic acid ng/m³ 0 ± 0.3 8.6 ± 0.6 233.3 ± 11.8 872.9 ± 43.8 Phthalic acid ng/m³ 0 ± 0.3 13.2 ± 2 0 ± 0.3 1.1 ± 0.3 Acetovanillone ng/m³ 1.9 ± 0.4 1.1 ± 0.3 0.3 ± 0.3 5.8 ± 1.0 Vanillic acid ng/m³ 1.4 ± 0.3 9.9 ± 1.5 25.1 ± 3.7 28 ± 4.1 4-methyl-syringol ng/m³ 0.2 ± 0.3 1.8 ± 0.6 14.7 ± 3.6 81.5 ± 19.2 2,3-dimethoxybenzoic acid ng/m³ 2.1 ± 0.3 3 ± 0.4 6.5 ± 0.8 343.3 ± 36.9 2,4-dimethoxybenzoic acid ng/m³ 20.4 ± 1.6 15.7 ± 1.2 17.2 ± 1.4 18 ± 1.4
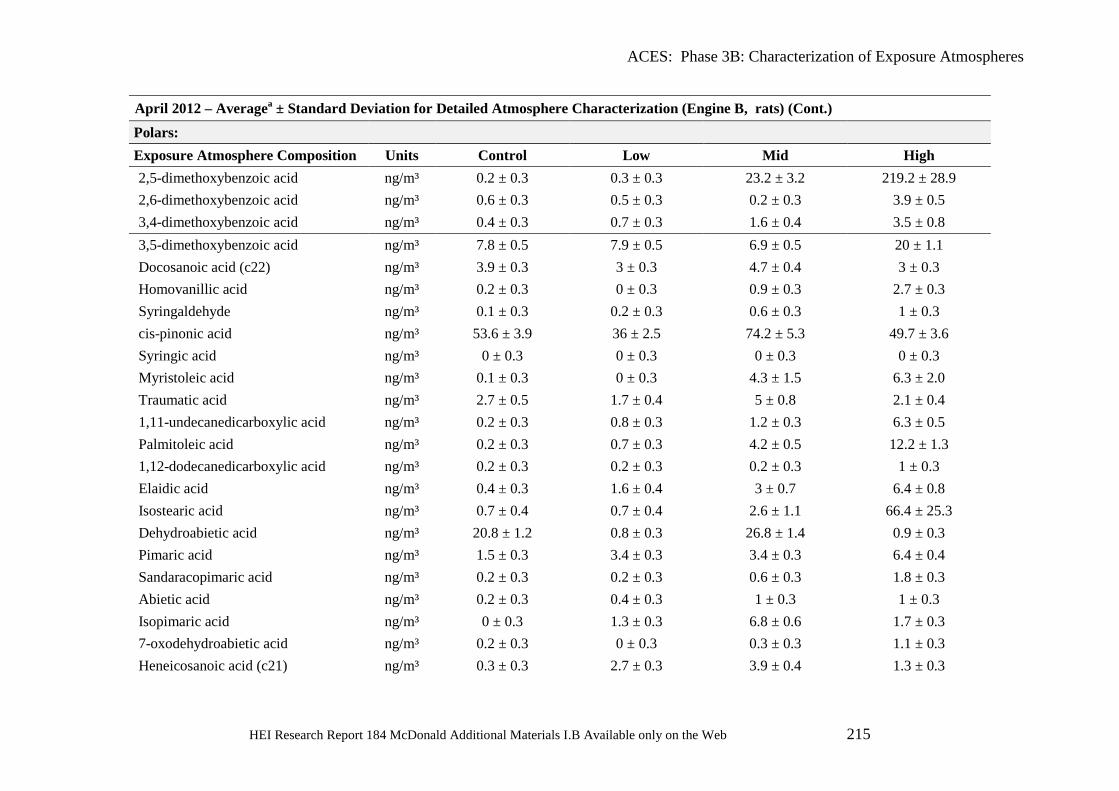
ACES: Phase 3B: Characterization of Exposure Atmospheres
HEI Research Report 184 McDonald Additional Materials I.B Available only on the Web 215
April 2012 – Averagea ± Standard Deviation for Detailed Atmosphere Characterization (Engine B, rats) (Cont.) Polars: Exposure Atmosphere Composition Units Control Low Mid High 2,5-dimethoxybenzoic acid ng/m³ 0.2 ± 0.3 0.3 ± 0.3 23.2 ± 3.2 219.2 ± 28.9 2,6-dimethoxybenzoic acid ng/m³ 0.6 ± 0.3 0.5 ± 0.3 0.2 ± 0.3 3.9 ± 0.5 3,4-dimethoxybenzoic acid ng/m³ 0.4 ± 0.3 0.7 ± 0.3 1.6 ± 0.4 3.5 ± 0.8 3,5-dimethoxybenzoic acid ng/m³ 7.8 ± 0.5 7.9 ± 0.5 6.9 ± 0.5 20 ± 1.1 Docosanoic acid (c22) ng/m³ 3.9 ± 0.3 3 ± 0.3 4.7 ± 0.4 3 ± 0.3 Homovanillic acid ng/m³ 0.2 ± 0.3 0 ± 0.3 0.9 ± 0.3 2.7 ± 0.3 Syringaldehyde ng/m³ 0.1 ± 0.3 0.2 ± 0.3 0.6 ± 0.3 1 ± 0.3 cis-pinonic acid ng/m³ 53.6 ± 3.9 36 ± 2.5 74.2 ± 5.3 49.7 ± 3.6 Syringic acid ng/m³ 0 ± 0.3 0 ± 0.3 0 ± 0.3 0 ± 0.3 Myristoleic acid ng/m³ 0.1 ± 0.3 0 ± 0.3 4.3 ± 1.5 6.3 ± 2.0 Traumatic acid ng/m³ 2.7 ± 0.5 1.7 ± 0.4 5 ± 0.8 2.1 ± 0.4 1,11-undecanedicarboxylic acid ng/m³ 0.2 ± 0.3 0.8 ± 0.3 1.2 ± 0.3 6.3 ± 0.5 Palmitoleic acid ng/m³ 0.2 ± 0.3 0.7 ± 0.3 4.2 ± 0.5 12.2 ± 1.3 1,12-dodecanedicarboxylic acid ng/m³ 0.2 ± 0.3 0.2 ± 0.3 0.2 ± 0.3 1 ± 0.3 Elaidic acid ng/m³ 0.4 ± 0.3 1.6 ± 0.4 3 ± 0.7 6.4 ± 0.8 Isostearic acid ng/m³ 0.7 ± 0.4 0.7 ± 0.4 2.6 ± 1.1 66.4 ± 25.3 Dehydroabietic acid ng/m³ 20.8 ± 1.2 0.8 ± 0.3 26.8 ± 1.4 0.9 ± 0.3 Pimaric acid ng/m³ 1.5 ± 0.3 3.4 ± 0.3 3.4 ± 0.3 6.4 ± 0.4 Sandaracopimaric acid ng/m³ 0.2 ± 0.3 0.2 ± 0.3 0.6 ± 0.3 1.8 ± 0.3 Abietic acid ng/m³ 0.2 ± 0.3 0.4 ± 0.3 1 ± 0.3 1 ± 0.3 Isopimaric acid ng/m³ 0 ± 0.3 1.3 ± 0.3 6.8 ± 0.6 1.7 ± 0.3 7-oxodehydroabietic acid ng/m³ 0.2 ± 0.3 0 ± 0.3 0.3 ± 0.3 1.1 ± 0.3 Heneicosanoic acid (c21) ng/m³ 0.3 ± 0.3 2.7 ± 0.3 3.9 ± 0.4 1.3 ± 0.3
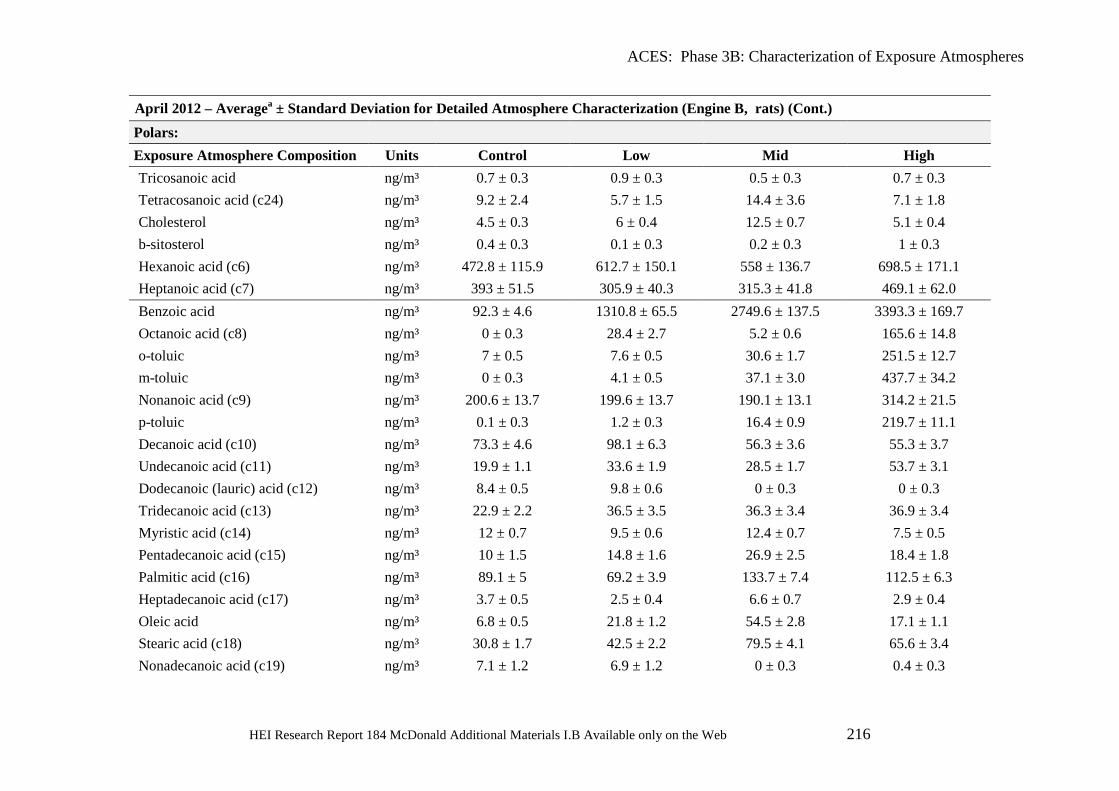
ACES: Phase 3B: Characterization of Exposure Atmospheres
HEI Research Report 184 McDonald Additional Materials I.B Available only on the Web 216
April 2012 – Averagea ± Standard Deviation for Detailed Atmosphere Characterization (Engine B, rats) (Cont.) Polars: Exposure Atmosphere Composition Units Control Low Mid High Tricosanoic acid ng/m³ 0.7 ± 0.3 0.9 ± 0.3 0.5 ± 0.3 0.7 ± 0.3 Tetracosanoic acid (c24) ng/m³ 9.2 ± 2.4 5.7 ± 1.5 14.4 ± 3.6 7.1 ± 1.8 Cholesterol ng/m³ 4.5 ± 0.3 6 ± 0.4 12.5 ± 0.7 5.1 ± 0.4 b-sitosterol ng/m³ 0.4 ± 0.3 0.1 ± 0.3 0.2 ± 0.3 1 ± 0.3 Hexanoic acid (c6) ng/m³ 472.8 ± 115.9 612.7 ± 150.1 558 ± 136.7 698.5 ± 171.1 Heptanoic acid (c7) ng/m³ 393 ± 51.5 305.9 ± 40.3 315.3 ± 41.8 469.1 ± 62.0 Benzoic acid ng/m³ 92.3 ± 4.6 1310.8 ± 65.5 2749.6 ± 137.5 3393.3 ± 169.7 Octanoic acid (c8) ng/m³ 0 ± 0.3 28.4 ± 2.7 5.2 ± 0.6 165.6 ± 14.8 o-toluic ng/m³ 7 ± 0.5 7.6 ± 0.5 30.6 ± 1.7 251.5 ± 12.7 m-toluic ng/m³ 0 ± 0.3 4.1 ± 0.5 37.1 ± 3.0 437.7 ± 34.2 Nonanoic acid (c9) ng/m³ 200.6 ± 13.7 199.6 ± 13.7 190.1 ± 13.1 314.2 ± 21.5 p-toluic ng/m³ 0.1 ± 0.3 1.2 ± 0.3 16.4 ± 0.9 219.7 ± 11.1 Decanoic acid (c10) ng/m³ 73.3 ± 4.6 98.1 ± 6.3 56.3 ± 3.6 55.3 ± 3.7 Undecanoic acid (c11) ng/m³ 19.9 ± 1.1 33.6 ± 1.9 28.5 ± 1.7 53.7 ± 3.1 Dodecanoic (lauric) acid (c12) ng/m³ 8.4 ± 0.5 9.8 ± 0.6 0 ± 0.3 0 ± 0.3 Tridecanoic acid (c13) ng/m³ 22.9 ± 2.2 36.5 ± 3.5 36.3 ± 3.4 36.9 ± 3.4 Myristic acid (c14) ng/m³ 12 ± 0.7 9.5 ± 0.6 12.4 ± 0.7 7.5 ± 0.5 Pentadecanoic acid (c15) ng/m³ 10 ± 1.5 14.8 ± 1.6 26.9 ± 2.5 18.4 ± 1.8 Palmitic acid (c16) ng/m³ 89.1 ± 5 69.2 ± 3.9 133.7 ± 7.4 112.5 ± 6.3 Heptadecanoic acid (c17) ng/m³ 3.7 ± 0.5 2.5 ± 0.4 6.6 ± 0.7 2.9 ± 0.4 Oleic acid ng/m³ 6.8 ± 0.5 21.8 ± 1.2 54.5 ± 2.8 17.1 ± 1.1 Stearic acid (c18) ng/m³ 30.8 ± 1.7 42.5 ± 2.2 79.5 ± 4.1 65.6 ± 3.4 Nonadecanoic acid (c19) ng/m³ 7.1 ± 1.2 6.9 ± 1.2 0 ± 0.3 0.4 ± 0.3
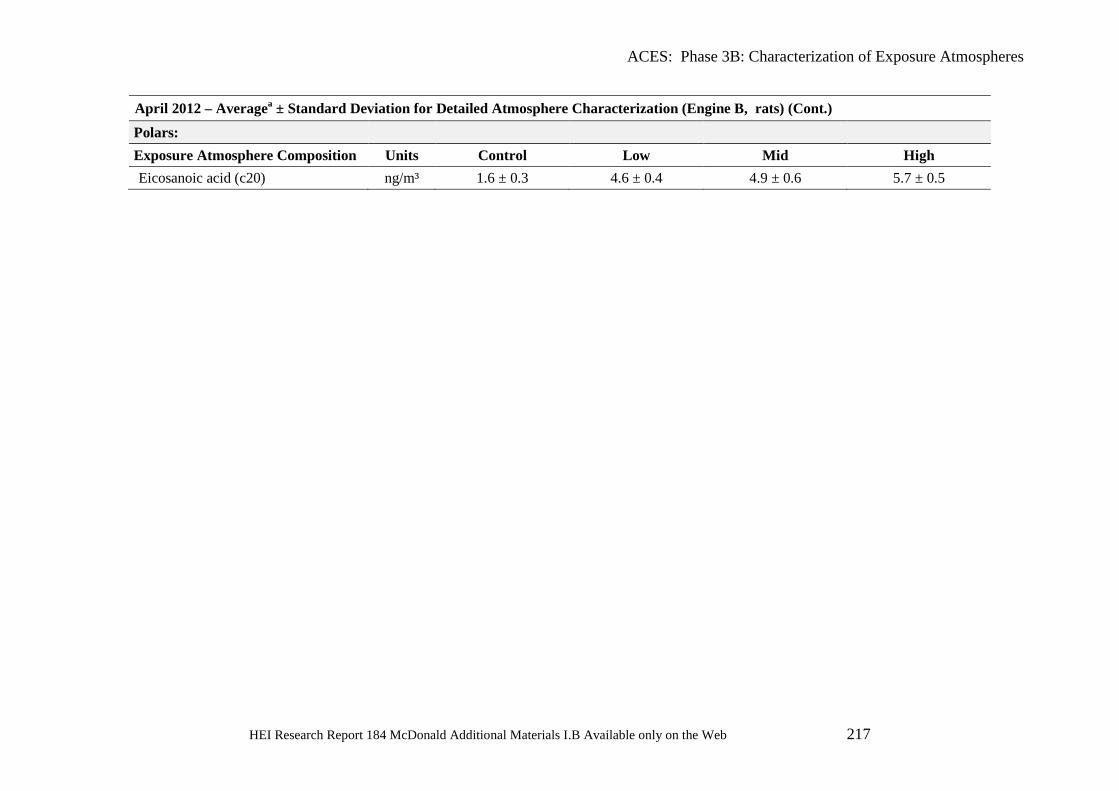
ACES: Phase 3B: Characterization of Exposure Atmospheres
HEI Research Report 184 McDonald Additional Materials I.B Available only on the Web 217
April 2012 – Averagea ± Standard Deviation for Detailed Atmosphere Characterization (Engine B, rats) (Cont.) Polars: Exposure Atmosphere Composition Units Control Low Mid High Eicosanoic acid (c20) ng/m³ 1.6 ± 0.3 4.6 ± 0.4 4.9 ± 0.6 5.7 ± 0.5
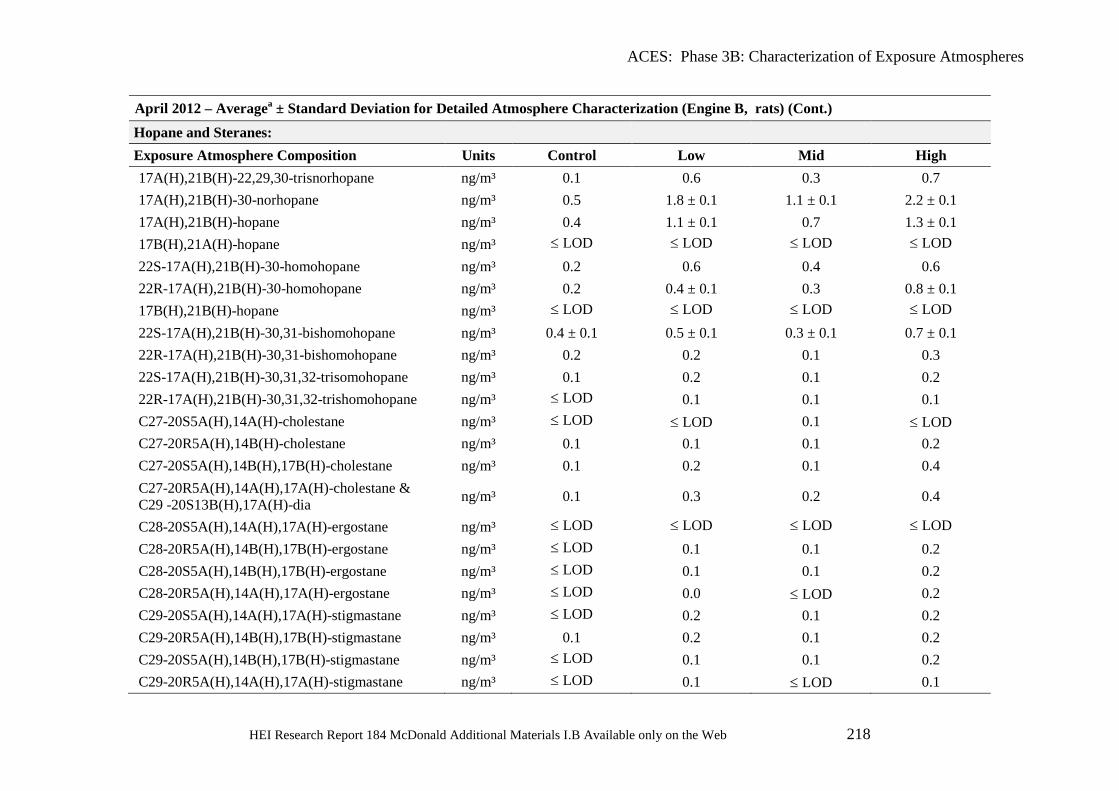
ACES: Phase 3B: Characterization of Exposure Atmospheres
HEI Research Report 184 McDonald Additional Materials I.B Available only on the Web 218
April 2012 – Averagea ± Standard Deviation for Detailed Atmosphere Characterization (Engine B, rats) (Cont.) Hopane and Steranes: Exposure Atmosphere Composition Units Control Low Mid High 17A(H),21B(H)-22,29,30-trisnorhopane ng/m³ 0.1 0.6 0.3 0.7 17A(H),21B(H)-30-norhopane ng/m³ 0.5 1.8 ± 0.1 1.1 ± 0.1 2.2 ± 0.1 17A(H),21B(H)-hopane ng/m³ 0.4 1.1 ± 0.1 0.7 1.3 ± 0.1 17B(H),21A(H)-hopane ng/m³ ≤ LOD ≤ LOD ≤ LOD ≤ LOD 22S-17A(H),21B(H)-30-homohopane ng/m³ 0.2 0.6 0.4 0.6 22R-17A(H),21B(H)-30-homohopane ng/m³ 0.2 0.4 ± 0.1 0.3 0.8 ± 0.1 17B(H),21B(H)-hopane ng/m³ ≤ LOD ≤ LOD ≤ LOD ≤ LOD 22S-17A(H),21B(H)-30,31-bishomohopane ng/m³ 0.4 ± 0.1 0.5 ± 0.1 0.3 ± 0.1 0.7 ± 0.1 22R-17A(H),21B(H)-30,31-bishomohopane ng/m³ 0.2 0.2 0.1 0.3 22S-17A(H),21B(H)-30,31,32-trisomohopane ng/m³ 0.1 0.2 0.1 0.2 22R-17A(H),21B(H)-30,31,32-trishomohopane ng/m³ ≤ LOD 0.1 0.1 0.1 C27-20S5A(H),14A(H)-cholestane ng/m³ ≤ LOD ≤ LOD 0.1 ≤ LOD C27-20R5A(H),14B(H)-cholestane ng/m³ 0.1 0.1 0.1 0.2 C27-20S5A(H),14B(H),17B(H)-cholestane ng/m³ 0.1 0.2 0.1 0.4 C27-20R5A(H),14A(H),17A(H)-cholestane & C29 -20S13B(H),17A(H)-dia ng/m³ 0.1 0.3 0.2 0.4
C28-20S5A(H),14A(H),17A(H)-ergostane ng/m³ ≤ LOD ≤ LOD ≤ LOD ≤ LOD C28-20R5A(H),14B(H),17B(H)-ergostane ng/m³ ≤ LOD 0.1 0.1 0.2 C28-20S5A(H),14B(H),17B(H)-ergostane ng/m³ ≤ LOD 0.1 0.1 0.2 C28-20R5A(H),14A(H),17A(H)-ergostane ng/m³ ≤ LOD 0.0 ≤ LOD 0.2 C29-20S5A(H),14A(H),17A(H)-stigmastane ng/m³ ≤ LOD 0.2 0.1 0.2 C29-20R5A(H),14B(H),17B(H)-stigmastane ng/m³ 0.1 0.2 0.1 0.2 C29-20S5A(H),14B(H),17B(H)-stigmastane ng/m³ ≤ LOD 0.1 0.1 0.2 C29-20R5A(H),14A(H),17A(H)-stigmastane ng/m³ ≤ LOD 0.1 ≤ LOD 0.1
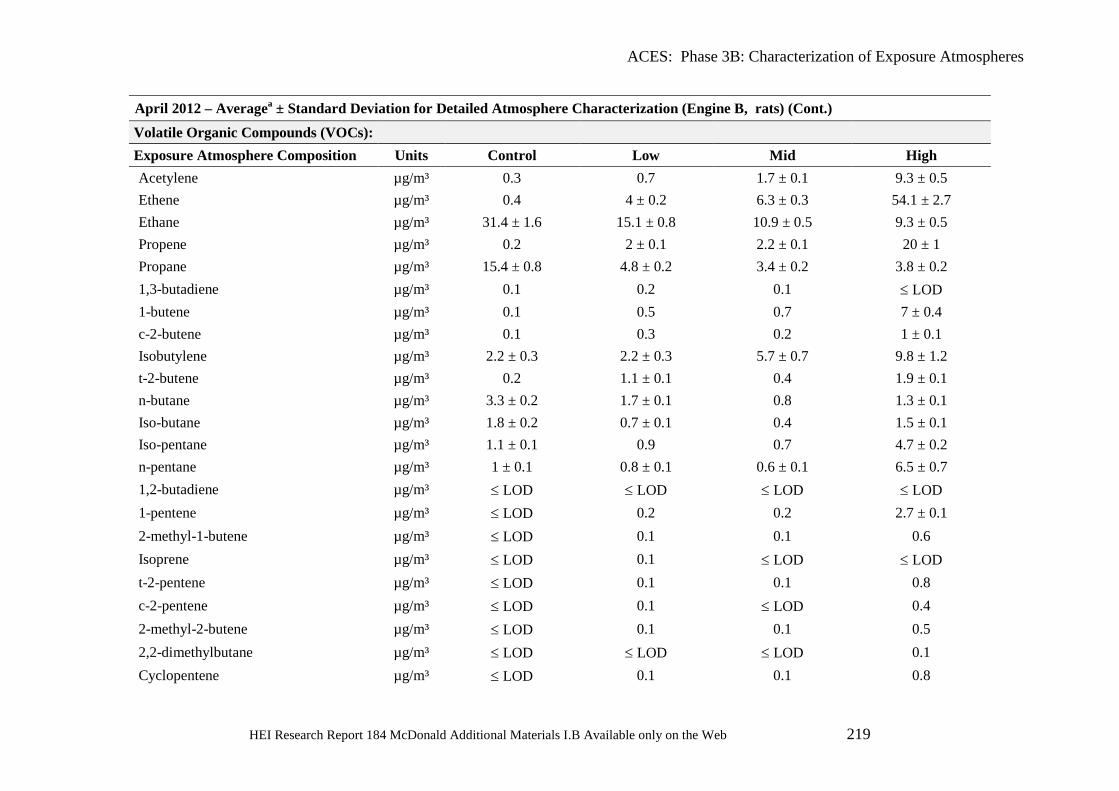
ACES: Phase 3B: Characterization of Exposure Atmospheres
HEI Research Report 184 McDonald Additional Materials I.B Available only on the Web 219
April 2012 – Averagea ± Standard Deviation for Detailed Atmosphere Characterization (Engine B, rats) (Cont.) Volatile Organic Compounds (VOCs): Exposure Atmosphere Composition Units Control Low Mid High Acetylene µg/m³ 0.3 0.7 1.7 ± 0.1 9.3 ± 0.5 Ethene µg/m³ 0.4 4 ± 0.2 6.3 ± 0.3 54.1 ± 2.7 Ethane µg/m³ 31.4 ± 1.6 15.1 ± 0.8 10.9 ± 0.5 9.3 ± 0.5 Propene µg/m³ 0.2 2 ± 0.1 2.2 ± 0.1 20 ± 1 Propane µg/m³ 15.4 ± 0.8 4.8 ± 0.2 3.4 ± 0.2 3.8 ± 0.2 1,3-butadiene µg/m³ 0.1 0.2 0.1 ≤ LOD 1-butene µg/m³ 0.1 0.5 0.7 7 ± 0.4 c-2-butene µg/m³ 0.1 0.3 0.2 1 ± 0.1 Isobutylene µg/m³ 2.2 ± 0.3 2.2 ± 0.3 5.7 ± 0.7 9.8 ± 1.2 t-2-butene µg/m³ 0.2 1.1 ± 0.1 0.4 1.9 ± 0.1 n-butane µg/m³ 3.3 ± 0.2 1.7 ± 0.1 0.8 1.3 ± 0.1 Iso-butane µg/m³ 1.8 ± 0.2 0.7 ± 0.1 0.4 1.5 ± 0.1 Iso-pentane µg/m³ 1.1 ± 0.1 0.9 0.7 4.7 ± 0.2 n-pentane µg/m³ 1 ± 0.1 0.8 ± 0.1 0.6 ± 0.1 6.5 ± 0.7 1,2-butadiene µg/m³ ≤ LOD ≤ LOD ≤ LOD ≤ LOD 1-pentene µg/m³ ≤ LOD 0.2 0.2 2.7 ± 0.1 2-methyl-1-butene µg/m³ ≤ LOD 0.1 0.1 0.6 Isoprene µg/m³ ≤ LOD 0.1 ≤ LOD ≤ LOD t-2-pentene µg/m³ ≤ LOD 0.1 0.1 0.8 c-2-pentene µg/m³ ≤ LOD 0.1 ≤ LOD 0.4 2-methyl-2-butene µg/m³ ≤ LOD 0.1 0.1 0.5 2,2-dimethylbutane µg/m³ ≤ LOD ≤ LOD ≤ LOD 0.1 Cyclopentene µg/m³ ≤ LOD 0.1 0.1 0.8
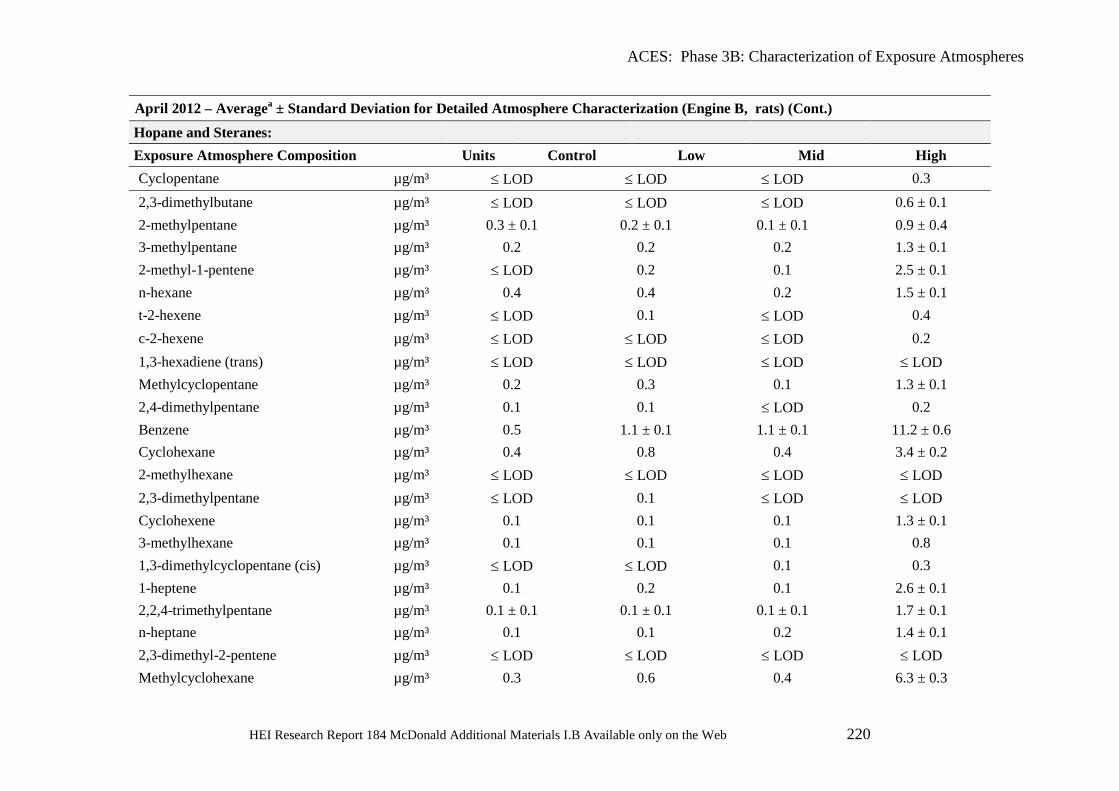
ACES: Phase 3B: Characterization of Exposure Atmospheres
HEI Research Report 184 McDonald Additional Materials I.B Available only on the Web 220
April 2012 – Averagea ± Standard Deviation for Detailed Atmosphere Characterization (Engine B, rats) (Cont.) Hopane and Steranes: Exposure Atmosphere Composition Units Control Low Mid High Cyclopentane µg/m³ ≤ LOD ≤ LOD ≤ LOD 0.3 2,3-dimethylbutane µg/m³ ≤ LOD ≤ LOD ≤ LOD 0.6 ± 0.1 2-methylpentane µg/m³ 0.3 ± 0.1 0.2 ± 0.1 0.1 ± 0.1 0.9 ± 0.4 3-methylpentane µg/m³ 0.2 0.2 0.2 1.3 ± 0.1 2-methyl-1-pentene µg/m³ ≤ LOD 0.2 0.1 2.5 ± 0.1 n-hexane µg/m³ 0.4 0.4 0.2 1.5 ± 0.1 t-2-hexene µg/m³ ≤ LOD 0.1 ≤ LOD 0.4 c-2-hexene µg/m³ ≤ LOD ≤ LOD ≤ LOD 0.2 1,3-hexadiene (trans) µg/m³ ≤ LOD ≤ LOD ≤ LOD ≤ LOD Methylcyclopentane µg/m³ 0.2 0.3 0.1 1.3 ± 0.1 2,4-dimethylpentane µg/m³ 0.1 0.1 ≤ LOD 0.2 Benzene µg/m³ 0.5 1.1 ± 0.1 1.1 ± 0.1 11.2 ± 0.6 Cyclohexane µg/m³ 0.4 0.8 0.4 3.4 ± 0.2 2-methylhexane µg/m³ ≤ LOD ≤ LOD ≤ LOD ≤ LOD 2,3-dimethylpentane µg/m³ ≤ LOD 0.1 ≤ LOD ≤ LOD Cyclohexene µg/m³ 0.1 0.1 0.1 1.3 ± 0.1 3-methylhexane µg/m³ 0.1 0.1 0.1 0.8 1,3-dimethylcyclopentane (cis) µg/m³ ≤ LOD ≤ LOD 0.1 0.3 1-heptene µg/m³ 0.1 0.2 0.1 2.6 ± 0.1 2,2,4-trimethylpentane µg/m³ 0.1 ± 0.1 0.1 ± 0.1 0.1 ± 0.1 1.7 ± 0.1 n-heptane µg/m³ 0.1 0.1 0.2 1.4 ± 0.1 2,3-dimethyl-2-pentene µg/m³ ≤ LOD ≤ LOD ≤ LOD ≤ LOD Methylcyclohexane µg/m³ 0.3 0.6 0.4 6.3 ± 0.3
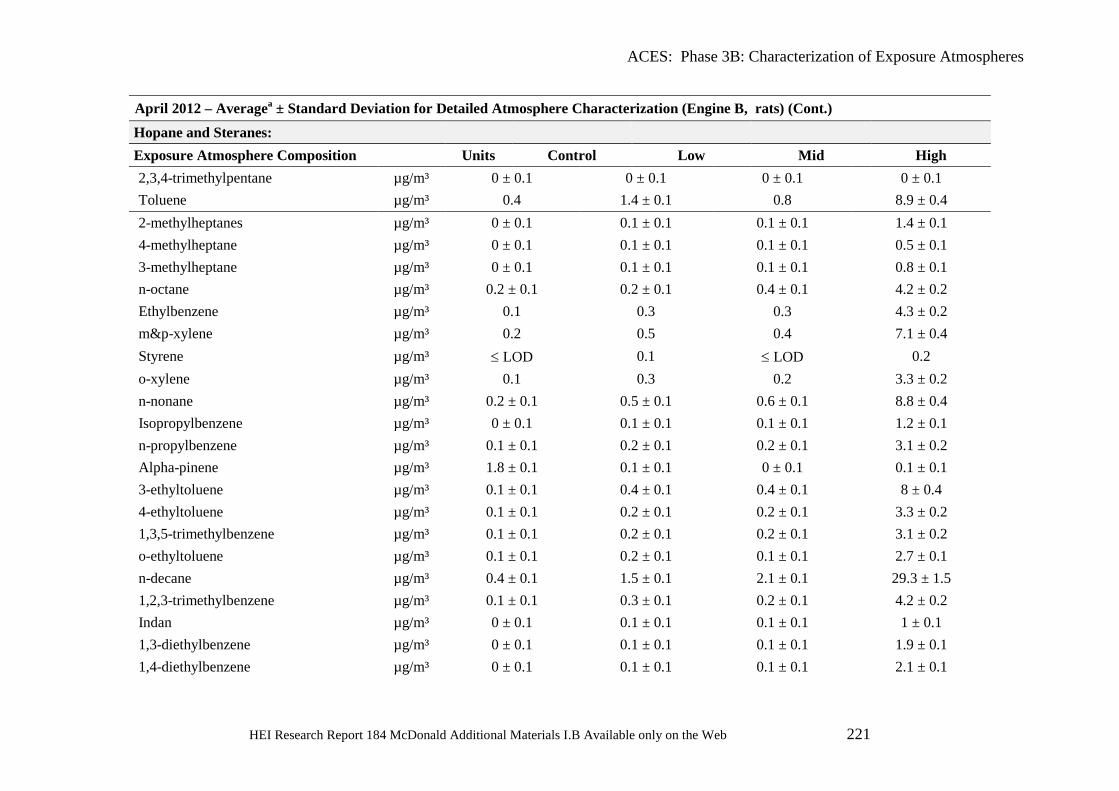
ACES: Phase 3B: Characterization of Exposure Atmospheres
HEI Research Report 184 McDonald Additional Materials I.B Available only on the Web 221
April 2012 – Averagea ± Standard Deviation for Detailed Atmosphere Characterization (Engine B, rats) (Cont.) Hopane and Steranes: Exposure Atmosphere Composition Units Control Low Mid High 2,3,4-trimethylpentane µg/m³ 0 ± 0.1 0 ± 0.1 0 ± 0.1 0 ± 0.1 Toluene µg/m³ 0.4 1.4 ± 0.1 0.8 8.9 ± 0.4 2-methylheptanes µg/m³ 0 ± 0.1 0.1 ± 0.1 0.1 ± 0.1 1.4 ± 0.1 4-methylheptane µg/m³ 0 ± 0.1 0.1 ± 0.1 0.1 ± 0.1 0.5 ± 0.1 3-methylheptane µg/m³ 0 ± 0.1 0.1 ± 0.1 0.1 ± 0.1 0.8 ± 0.1 n-octane µg/m³ 0.2 ± 0.1 0.2 ± 0.1 0.4 ± 0.1 4.2 ± 0.2 Ethylbenzene µg/m³ 0.1 0.3 0.3 4.3 ± 0.2 m&p-xylene µg/m³ 0.2 0.5 0.4 7.1 ± 0.4 Styrene µg/m³ ≤ LOD 0.1 ≤ LOD 0.2 o-xylene µg/m³ 0.1 0.3 0.2 3.3 ± 0.2 n-nonane µg/m³ 0.2 ± 0.1 0.5 ± 0.1 0.6 ± 0.1 8.8 ± 0.4 Isopropylbenzene µg/m³ 0 ± 0.1 0.1 ± 0.1 0.1 ± 0.1 1.2 ± 0.1 n-propylbenzene µg/m³ 0.1 ± 0.1 0.2 ± 0.1 0.2 ± 0.1 3.1 ± 0.2 Alpha-pinene µg/m³ 1.8 ± 0.1 0.1 ± 0.1 0 ± 0.1 0.1 ± 0.1 3-ethyltoluene µg/m³ 0.1 ± 0.1 0.4 ± 0.1 0.4 ± 0.1 8 ± 0.4 4-ethyltoluene µg/m³ 0.1 ± 0.1 0.2 ± 0.1 0.2 ± 0.1 3.3 ± 0.2 1,3,5-trimethylbenzene µg/m³ 0.1 ± 0.1 0.2 ± 0.1 0.2 ± 0.1 3.1 ± 0.2 o-ethyltoluene µg/m³ 0.1 ± 0.1 0.2 ± 0.1 0.1 ± 0.1 2.7 ± 0.1 n-decane µg/m³ 0.4 ± 0.1 1.5 ± 0.1 2.1 ± 0.1 29.3 ± 1.5 1,2,3-trimethylbenzene µg/m³ 0.1 ± 0.1 0.3 ± 0.1 0.2 ± 0.1 4.2 ± 0.2 Indan µg/m³ 0 ± 0.1 0.1 ± 0.1 0.1 ± 0.1 1 ± 0.1 1,3-diethylbenzene µg/m³ 0 ± 0.1 0.1 ± 0.1 0.1 ± 0.1 1.9 ± 0.1 1,4-diethylbenzene µg/m³ 0 ± 0.1 0.1 ± 0.1 0.1 ± 0.1 2.1 ± 0.1
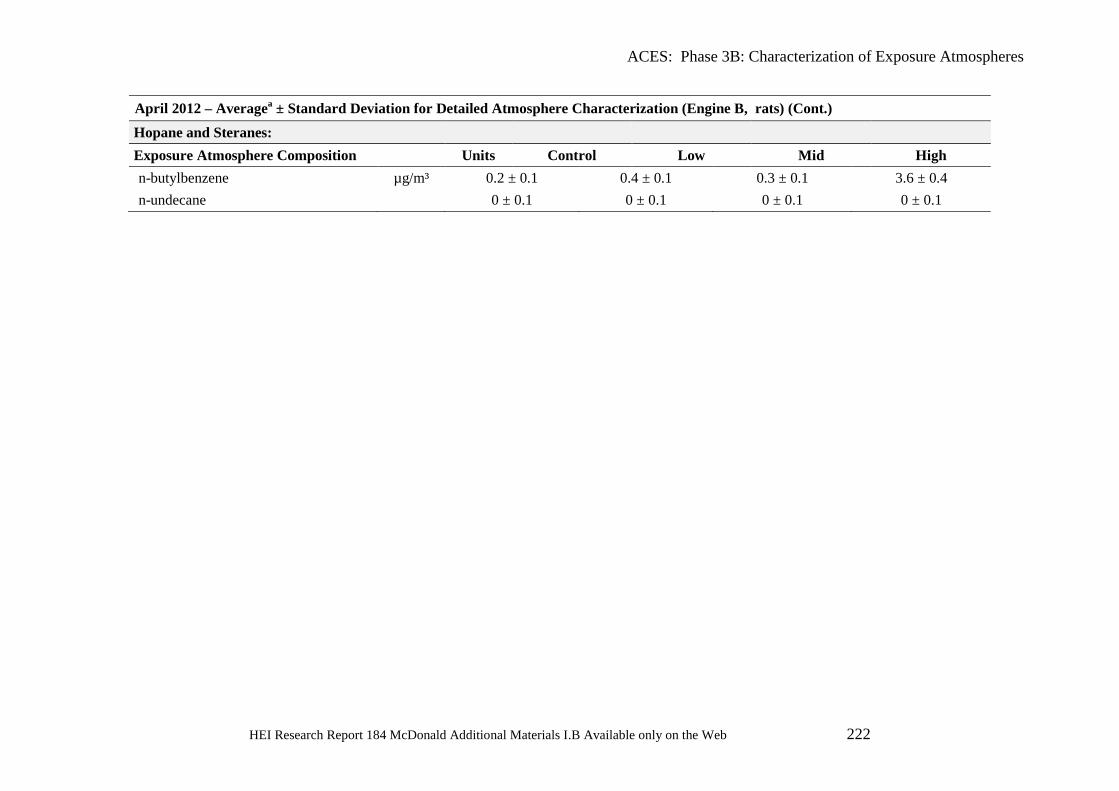
ACES: Phase 3B: Characterization of Exposure Atmospheres
HEI Research Report 184 McDonald Additional Materials I.B Available only on the Web 222
April 2012 – Averagea ± Standard Deviation for Detailed Atmosphere Characterization (Engine B, rats) (Cont.) Hopane and Steranes: Exposure Atmosphere Composition Units Control Low Mid High n-butylbenzene µg/m³ 0.2 ± 0.1 0.4 ± 0.1 0.3 ± 0.1 3.6 ± 0.4 n-undecane
0 ± 0.1 0 ± 0.1 0 ± 0.1 0 ± 0.1
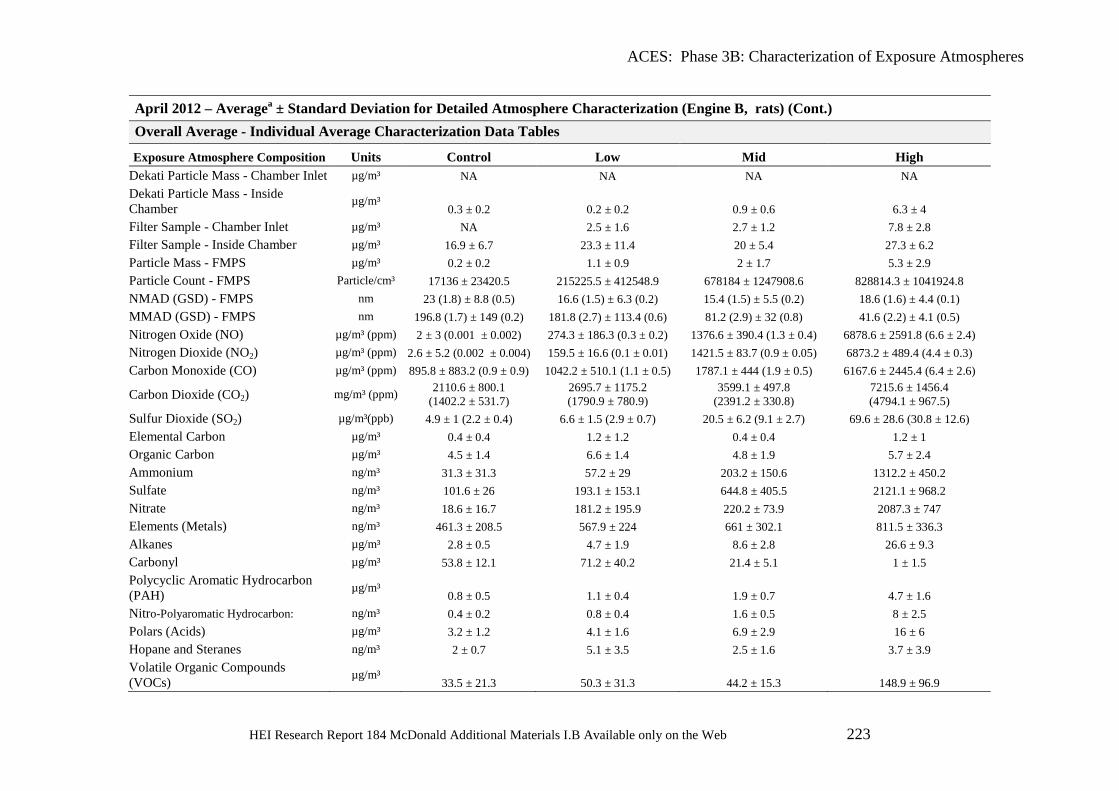
ACES: Phase 3B: Characterization of Exposure Atmospheres
HEI Research Report 184 McDonald Additional Materials I.B Available only on the Web 223
April 2012 – Averagea ± Standard Deviation for Detailed Atmosphere Characterization (Engine B, rats) (Cont.) Overall Average - Individual Average Characterization Data Tables
Exposure Atmosphere Composition Units Control Low Mid High Dekati Particle Mass - Chamber Inlet µg/m³ NA NA NA NA Dekati Particle Mass - Inside Chamber µg/m³
0.3 ± 0.2 0.2 ± 0.2 0.9 ± 0.6 6.3 ± 4 Filter Sample - Chamber Inlet µg/m³ NA 2.5 ± 1.6 2.7 ± 1.2 7.8 ± 2.8 Filter Sample - Inside Chamber µg/m³ 16.9 ± 6.7 23.3 ± 11.4 20 ± 5.4 27.3 ± 6.2 Particle Mass - FMPS µg/m³ 0.2 ± 0.2 1.1 ± 0.9 2 ± 1.7 5.3 ± 2.9 Particle Count - FMPS Particle/cm³ 17136 ± 23420.5 215225.5 ± 412548.9 678184 ± 1247908.6 828814.3 ± 1041924.8 NMAD (GSD) - FMPS nm 23 (1.8) ± 8.8 (0.5) 16.6 (1.5) ± 6.3 (0.2) 15.4 (1.5) ± 5.5 (0.2) 18.6 (1.6) ± 4.4 (0.1) MMAD (GSD) - FMPS nm 196.8 (1.7) ± 149 (0.2) 181.8 (2.7) ± 113.4 (0.6) 81.2 (2.9) ± 32 (0.8) 41.6 (2.2) ± 4.1 (0.5) Nitrogen Oxide (NO) µg/m³ (ppm) 2 ± 3 (0.001 ± 0.002) 274.3 ± 186.3 (0.3 ± 0.2) 1376.6 ± 390.4 (1.3 ± 0.4) 6878.6 ± 2591.8 (6.6 ± 2.4) Nitrogen Dioxide (NO2) µg/m³ (ppm) 2.6 ± 5.2 (0.002 ± 0.004) 159.5 ± 16.6 (0.1 ± 0.01) 1421.5 ± 83.7 (0.9 ± 0.05) 6873.2 ± 489.4 (4.4 ± 0.3) Carbon Monoxide (CO) µg/m³ (ppm) 895.8 ± 883.2 (0.9 ± 0.9) 1042.2 ± 510.1 (1.1 ± 0.5) 1787.1 ± 444 (1.9 ± 0.5) 6167.6 ± 2445.4 (6.4 ± 2.6)
Carbon Dioxide (CO2) mg/m³ (ppm) 2110.6 ± 800.1 (1402.2 ± 531.7)
2695.7 ± 1175.2 (1790.9 ± 780.9)
3599.1 ± 497.8 (2391.2 ± 330.8)
7215.6 ± 1456.4 (4794.1 ± 967.5)
Sulfur Dioxide (SO2) µg/m³(ppb) 4.9 ± 1 (2.2 ± 0.4) 6.6 ± 1.5 (2.9 ± 0.7) 20.5 ± 6.2 (9.1 ± 2.7) 69.6 ± 28.6 (30.8 ± 12.6) Elemental Carbon µg/m³ 0.4 ± 0.4 1.2 ± 1.2 0.4 ± 0.4 1.2 ± 1 Organic Carbon µg/m³ 4.5 ± 1.4 6.6 ± 1.4 4.8 ± 1.9 5.7 ± 2.4 Ammonium ng/m³ 31.3 ± 31.3 57.2 ± 29 203.2 ± 150.6 1312.2 ± 450.2 Sulfate ng/m³ 101.6 ± 26 193.1 ± 153.1 644.8 ± 405.5 2121.1 ± 968.2 Nitrate ng/m³ 18.6 ± 16.7 181.2 ± 195.9 220.2 ± 73.9 2087.3 ± 747 Elements (Metals) ng/m³ 461.3 ± 208.5 567.9 ± 224 661 ± 302.1 811.5 ± 336.3 Alkanes µg/m³ 2.8 ± 0.5 4.7 ± 1.9 8.6 ± 2.8 26.6 ± 9.3 Carbonyl µg/m³ 53.8 ± 12.1 71.2 ± 40.2 21.4 ± 5.1 1 ± 1.5 Polycyclic Aromatic Hydrocarbon (PAH) µg/m³
0.8 ± 0.5 1.1 ± 0.4 1.9 ± 0.7 4.7 ± 1.6 Nitro-Polyaromatic Hydrocarbon: ng/m³ 0.4 ± 0.2 0.8 ± 0.4 1.6 ± 0.5 8 ± 2.5 Polars (Acids) µg/m³ 3.2 ± 1.2 4.1 ± 1.6 6.9 ± 2.9 16 ± 6 Hopane and Steranes ng/m³ 2 ± 0.7 5.1 ± 3.5 2.5 ± 1.6 3.7 ± 3.9 Volatile Organic Compounds (VOCs) µg/m³
33.5 ± 21.3 50.3 ± 31.3 44.2 ± 15.3 148.9 ± 96.9


![WenQuanYi Micro Hei [Scale=0.9]WenQuanYi Micro Hei Mono](https://img.pdfslide.net/doc/110x75/61d6cb71438ad45b233ace00/wenquanyi-micro-hei-scale09wenquanyi-micro-hei-mono-.jpg)