Embed Size (px)
Citation preview
EMX User’s Manual
Additional Techniques 5This chapter provides instructions for procedures that are routinefor some users, but may be infrequently encountered by others.Specifically, the chapter will describe manually tuning the EMXspectrometer, changing cavities, fine tuning the AFC, and per-forming automated 2D experiments.
Manually Tuning a Microwave Bridge 5.1The Auto Tune routine of the EMX software is effective at tun-ing the cavity and bridge under most circumstances. However,there are some circumstances where automatic tuning may havedifficulties. Lossy samples such as water can be problematic,particularly when you work at high microwave power levels.Following these instructions will help you to tune the spectrom-eter under these adverse conditions.
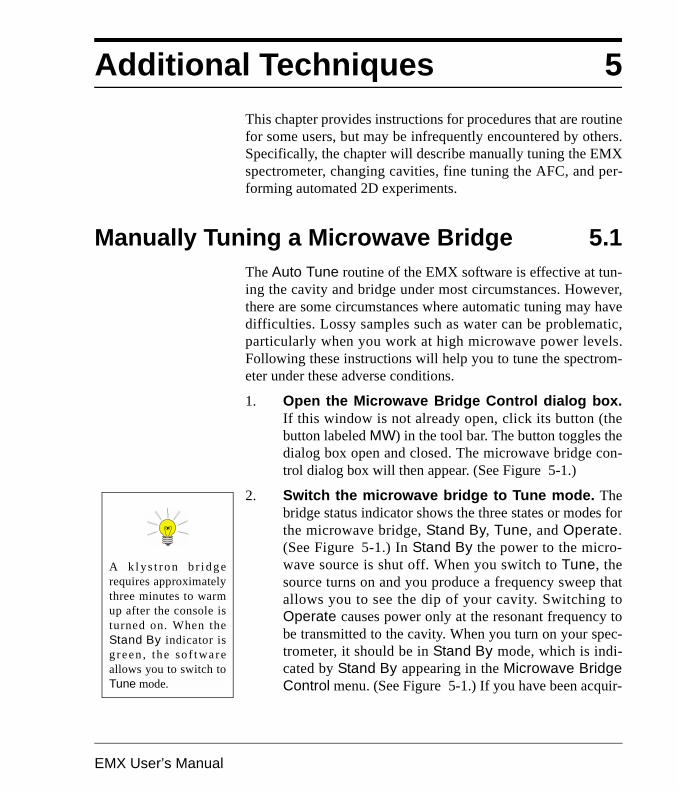
1. Open the Microwave Bridge Control dialog box.If this window is not already open, click its button (thebutton labeled MW) in the tool bar. The button toggles thedialog box open and closed. The microwave bridge con-trol dialog box will then appear. (See Figure 5-1.)
2. Switch the microwave bridge to Tune mode. Thebridge status indicator shows the three states or modes forthe microwave bridge, Stand By, Tune, and Operate.(See Figure 5-1.) In Stand By the power to the micro-wave source is shut off. When you switch to Tune, thesource turns on and you produce a frequency sweep thatallows you to see the dip of your cavity. Switching toOperate causes power only at the resonant frequency tobe transmitted to the cavity. When you turn on your spec-trometer, it should be in Stand By mode, which is indi-cated by Stand By appearing in the Microwave BridgeControl menu. (See Figure 5-1.) If you have been acquir-
A k l ys t ro n b r i d g erequires approximatelythree minutes to warmup after the console isturned on. When theStand By indicator isg reen , the sof twareallows you to switch toTune mode.
Manually Tuning a Microwave Bridge
5-2
ing spectra already, your bridge will probably be in Oper-ate mode. Click the Tune button in the dialog box tochange to the Tune mode.
3. Set the microwave attenuator to 25 dB. The micro-wave attenuation is set by clicking the arrows on eitherside of the attenuation display. (See Figure 5-1.) Thearrows on the left side change the attenuation in 10 dBsteps; the arrows on the right side change the attenuationin 1 dB steps.
Figure 5-1 The Microwave Bridge Control dialog box.
TuneButton
AttenuationDisplay
MicrowaveBridgeControlButton
FrequencySlider
BiasSlider
SignalPhaseSlider
IrisButtons
AFC & DiodeMeter
You may notice thatLEVELED a n dUNCALIBRATEDappear in the bridge sta-tus indicator. Do not bea l a r me d b y t h eUNCALIBRATED indi-cator; this is normalduring Tune.
Manually Tuning a Microwave Bridge
EMX User’s Manual 5-3
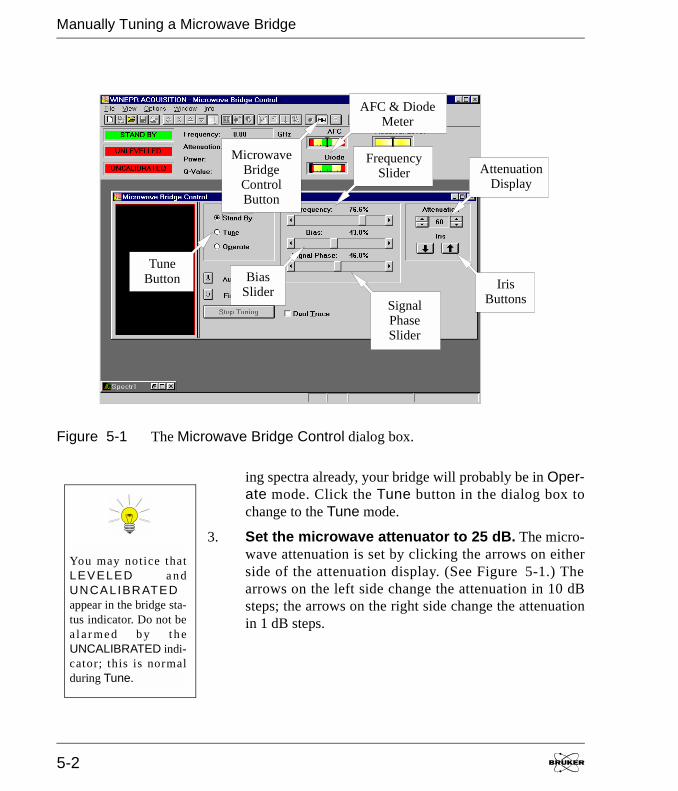
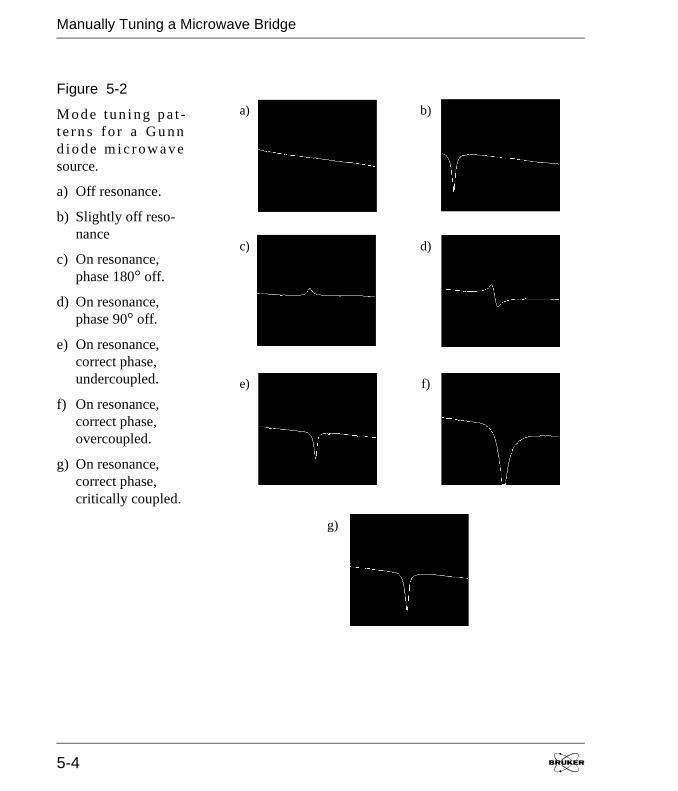
4. Observe the mode pattern on the display moni-tor. (Gunn Diode Microwave Sources) This modepattern is a display of the microwave power reflectedfrom the microwave cavity and the reference arm poweras a function of the microwave frequency. The mode pat-tern should resemble one of the mode tuning patterns inFigure 5-2. If the mode pattern amplitude is too small,increase the microwave power in 1 dB steps by decreasingthe attenuation. If the mode pattern amplitude is too large,decrease the microwave power in 1 dB steps by increasingthe attenuation.
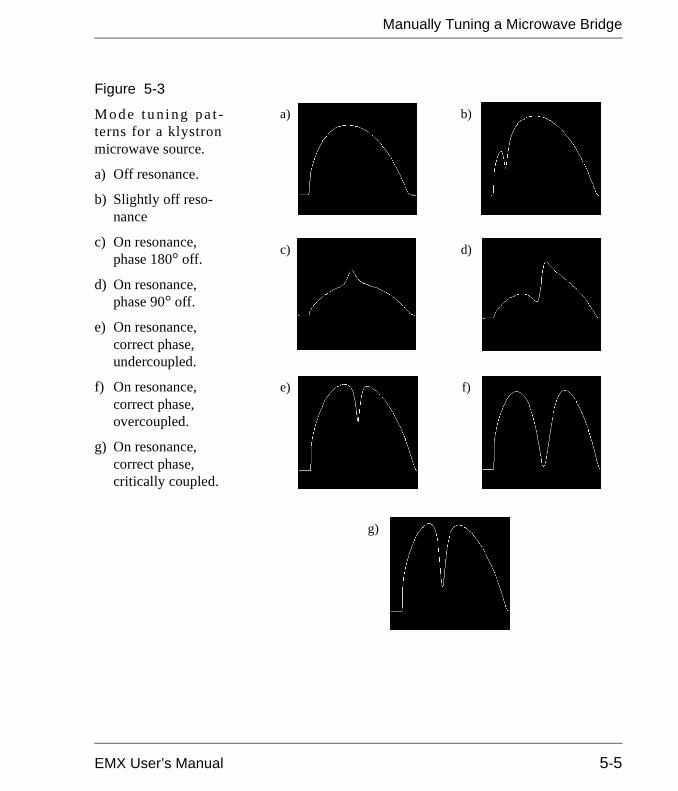
5. Observe the mode pattern on the display moni-tor. (Klystron Microwave Sources) This mode pat-tern is a display of the microwave power reflected fromthe microwave cavity and the reference arm power as afunction of the microwave frequency. The mode patternshould resemble one of the mode tuning patterns inFigure 5-3. If the mode pattern amplitude is too small,increase the microwave power in 1 dB steps by decreasingthe attenuation. If the mode pattern amplitude is too large,decrease the microwave power in 1 dB steps by increasingthe attenuation.
There are two types ofmicrowave sources. Theletter G in the micro-wave bridge designation(i.e ER 041 XG) on thefront panel identifies aGunn source. The letterK designates a klystronsource. Perhaps the sur-est method to identifythe type of source is bycomparing the modepa t t e r n w i th e i t he rF i g u re 5 -2 o rFigure 5-3.
Manually Tuning a Microwave Bridge
5-4
Figure 5-2
M o d e tu n i n g p a t -t e r n s f o r a G u n nd io d e m i c r o w a v esource.
a) Off resonance.
b) Slightly off reso-nance
c) On resonance, phase 180° off.
d) On resonance, phase 90° off.
e) On resonance, correct phase, undercoupled.
f) On resonance, correct phase, overcoupled.
g) On resonance, correct phase, critically coupled.
a) b)
c) d)
e) f)
g)
Manually Tuning a Microwave Bridge
EMX User’s Manual 5-5
Figure 5-3
M o d e t u n i n g p a t -terns for a klystronmicrowave source.
a) Off resonance.
b) Slightly off reso-nance
c) On resonance, phase 180° off.
d) On resonance, phase 90° off.
e) On resonance, correct phase, undercoupled.
f) On resonance, correct phase, overcoupled.
g) On resonance, correct phase, critically coupled.
a) b)
c) d)
e) f)
g)
Manually Tuning a Microwave Bridge
5-6
6. Tune the microwave source. Adjust the Frequencyslider bar to locate and center the mode pattern “dip” onthe display monitor. Clicking the left or right arrows willstep the parameter value downwards or upwards. Clickingto the left or right of the square steps the parameter valuedownward or upward faster than when using the arrows.Keeping the mouse button pressed repeats the action auto-matically. The value of the parameter is indicated graphi-cally by the position of the square in the slider bar. Youcan also vary the parameter by clicking and dragging thesquare. The “dip” corresponds to the microwave powerabsorbed by the cavity, and thus, is not reflected back tothe detector diode. By centering the “dip” on the displaymonitor, the microwave source is set to oscillate at thesame frequency as the cavity resonant frequency.
7. Clean the sample tube to be inserted into thecavity. Wiping the outside of the sample tube with tissuepaper is usually adequate. It is vital to avoid contaminat-ing the microwave cavity as paramagnetic contaminantsmay result in spurious EPR signals or distorted base linesin your EPR spectra.
The resonant frequencyof a Bruker ER 4102STc av i ty i s us ua l lyapproximately 9.8 GHz.
A cryostat will drop thefrequency to approxi-mately 9.4 GHz.
Manually Tuning a Microwave Bridge
EMX User’s Manual 5-7
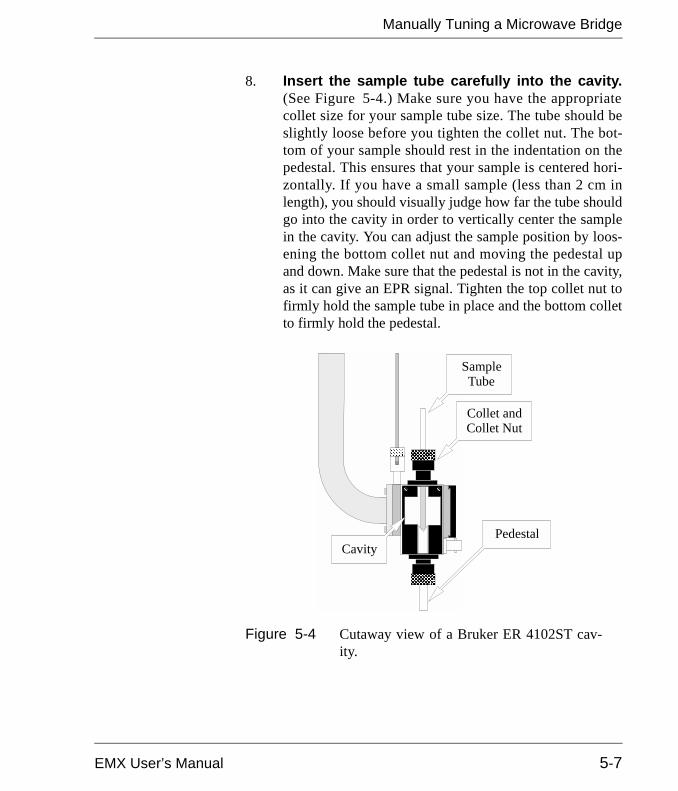
8. Insert the sample tube carefully into the cavity.(See Figure 5-4.) Make sure you have the appropriatecollet size for your sample tube size. The tube should beslightly loose before you tighten the collet nut. The bot-tom of your sample should rest in the indentation on thepedestal. This ensures that your sample is centered hori-zontally. If you have a small sample (less than 2 cm inlength), you should visually judge how far the tube shouldgo into the cavity in order to vertically center the samplein the cavity. You can adjust the sample position by loos-ening the bottom collet nut and moving the pedestal upand down. Make sure that the pedestal is not in the cavity,as it can give an EPR signal. Tighten the top collet nut tofirmly hold the sample tube in place and the bottom colletto firmly hold the pedestal.
Figure 5-4 Cutaway view of a Bruker ER 4102ST cav-ity.
SampleTube
CavityPedestal
Collet andCollet Nut

Manually Tuning a Microwave Bridge
5-8
9. Retune the microwave source. Repeat the procedureof Step 6. You may notice a shift in the frequency, width,and depth of the cavity “dip” when you insert the sample.This is an indication that the microwave field patterns inthe cavity are perturbed by the sample and tube. Lossyand conductive samples will appreciably perturb the fieldpatterns, resulting in large shifts in the resonant frequency.Highly conductive samples tend to increase the resonantfrequency by decreasing the effective cavity volume.Lossy samples will decrease the resonant frequencybecause of their large dielectric constants.
10. Tune the signal (reference) phase. (Gunn DiodeMicrowave Sources) While the “dip” is in the centerof the display, adjust the Signal Phase slider bar (SeeFigure 5-1.), until the depth of the dip is maximized andthe “dip” looks somewhat symmetric. (See Figure 5-2.)We shall fine-tune this phase later, but this procedure getsus close to the correct phase.
11. Tune the signal (reference) phase. (KlystronMicrowave Sources) While the “dip” is in the centerof the display, adjust the Signal Phase slider bar (SeeFigure 5-1.), until the shoulders on each side of the “dip”appear to be approximately the same height and the “dip”looks somewhat symmetric. (See Figure 5-3.) We shallfine-tune this phase later, but this procedure gets us closeto the correct phase.
Steps 10 and 11 assumeyou have bias in the ref-erence arm. (You usu-al ly do!) If the Biass l i de r ba r (Se eFigure 5-1.) is all theway to the lef t s ide ,move it towards the mid-dle to ensure sufficientbias. Otherwise, leave itbe.
Manually Tuning a Microwave Bridge
EMX User’s Manual 5-9
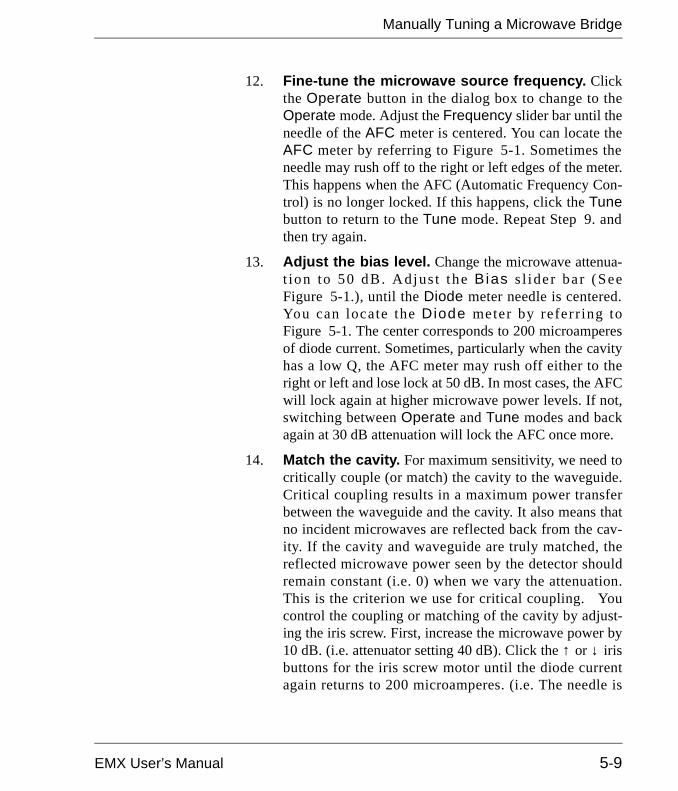
12. Fine-tune the microwave source frequency. Clickthe Operate button in the dialog box to change to theOperate mode. Adjust the Frequency slider bar until theneedle of the AFC meter is centered. You can locate theAFC meter by referring to Figure 5-1. Sometimes theneedle may rush off to the right or left edges of the meter.This happens when the AFC (Automatic Frequency Con-trol) is no longer locked. If this happens, click the Tunebutton to return to the Tune mode. Repeat Step 9. andthen try again.
13. Adjust the bias level. Change the microwave attenua-t ion to 50 dB. Adjus t the Bias s l ide r ba r (SeeFigure 5-1.), until the Diode meter needle is centered.You can locate the Diode meter by refer r ing toFigure 5-1. The center corresponds to 200 microamperesof diode current. Sometimes, particularly when the cavityhas a low Q, the AFC meter may rush off either to theright or left and lose lock at 50 dB. In most cases, the AFCwill lock again at higher microwave power levels. If not,switching between Operate and Tune modes and backagain at 30 dB attenuation will lock the AFC once more.
14. Match the cavity. For maximum sensitivity, we need tocritically couple (or match) the cavity to the waveguide.Critical coupling results in a maximum power transferbetween the waveguide and the cavity. It also means thatno incident microwaves are reflected back from the cav-ity. If the cavity and waveguide are truly matched, thereflected microwave power seen by the detector shouldremain constant (i.e. 0) when we vary the attenuation.This is the criterion we use for critical coupling. Youcontrol the coupling or matching of the cavity by adjust-ing the iris screw. First, increase the microwave power by10 dB. (i.e. attenuator setting 40 dB). Click the ↑ or ↓ irisbuttons for the iris screw motor until the diode currentagain returns to 200 microamperes. (i.e. The needle is
Manually Tuning a Microwave Bridge
5-10
centered.) Repeat the procedure (-10 dB steps in the atten-uator setting and adjust the current to 200 microampereswith the iris screw) until you have reached an attenuatorsetting of 10 dB. You will notice that as you increase themicrowave power, the diode current becomes more sensi-tive to the position of the iris screw. Another thing youmay notice is that the AFC meter also changes with theiris screw position. Simply adjust the frequency slider baruntil the needle is centered again. When you have reached10 dB microwave attenuation, adjust the Signal Phaseslider bar until you achieve a local maximum in the diodecurrent. You should not have to adjust it very much. Ver-ify that you have achieved critical coupling by changingthe microwave attenuation from 10 dB to 50 dB with vir-tually no change in the diode current. Repeat the matchingand bias level adjustment procedures if necessary. If youneed to operate at power levels greater than 20 mW (10dB), set the attenuator to 0 dB and once again adjust thediode current to 200 microamperes with the iris screw.The current can sometimes drift because the high micro-wave power starts to heat the sample. If this happens, waita minute or two and readjust the coupling.
Changing EPR Cavities
EMX User’s Manual 5-11
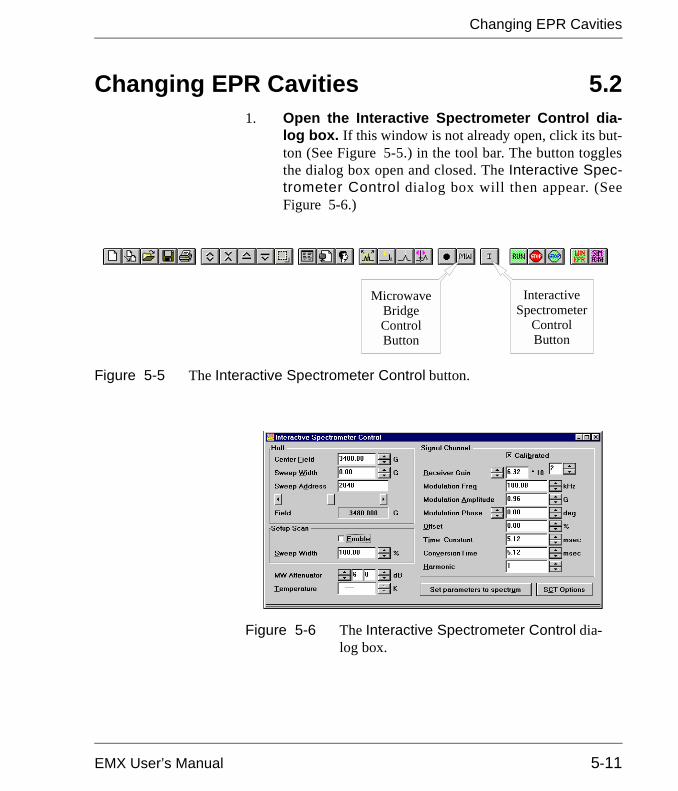
Changing EPR Cavities 5.21. Open the Interactive Spectrometer Control dia-
log box. If this window is not already open, click its but-ton (See Figure 5-5.) in the tool bar. The button togglesthe dialog box open and closed. The Interactive Spec-trometer Control dialog box will then appear. (SeeFigure 5-6.)
Figure 5-5 The Interactive Spectrometer Control button.
InteractiveSpectrometer
ControlButton
MicrowaveBridgeControlButton
Figure 5-6 The Interactive Spectrometer Control dia-log box.
Changing EPR Cavities
5-12
2. Set the modulation amplitude to zero. Enter a valueof 0.00 in the Modulation Amplitude box.
3. Set the magnetic field to the minimal value. Enterin a value of 0.00 in the Sweep Width box and a value of0.00 in the Center Field box.
4. Close the Interactive Spectrometer Control dia-log box. Click the Interactive Spectrometer Control(the button labeled I) in the tool bar. The button togglesthe dialog box on and off. The Interactive SpectrometerControl dialog box will then disappear. (See Figure 5-5and Figure 5-6.)
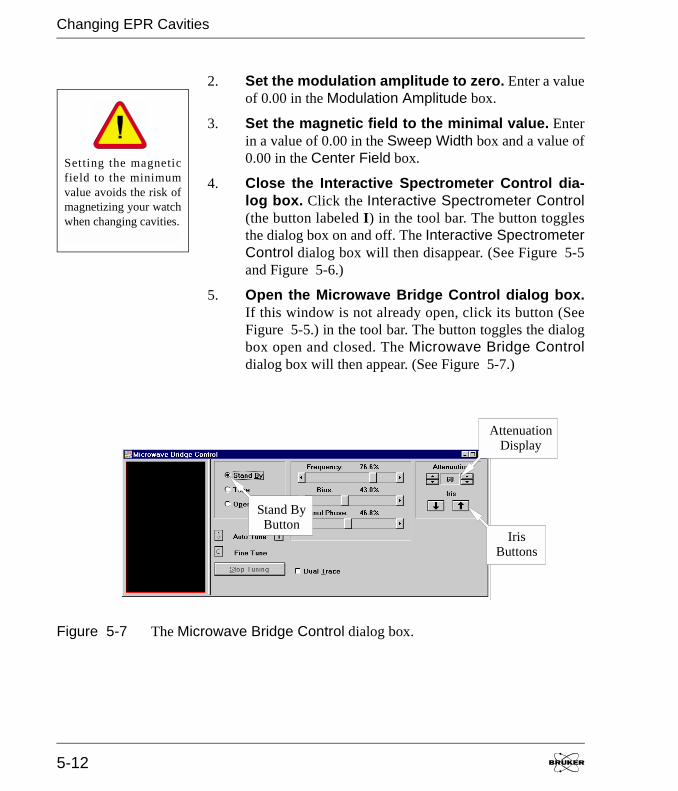
5. Open the Microwave Bridge Control dialog box.If this window is not already open, click its button (SeeFigure 5-5.) in the tool bar. The button toggles the dialogbox open and closed. The Microwave Bridge Controldialog box will then appear. (See Figure 5-7.)
Setting the magneticfield to the minimumvalue avoids the risk ofmagnetizing your watchwhen changing cavities.
Figure 5-7 The Microwave Bridge Control dialog box.
AttenuationDisplay
IrisButtons
Stand ByButton
Changing EPR Cavities
EMX User’s Manual 5-13
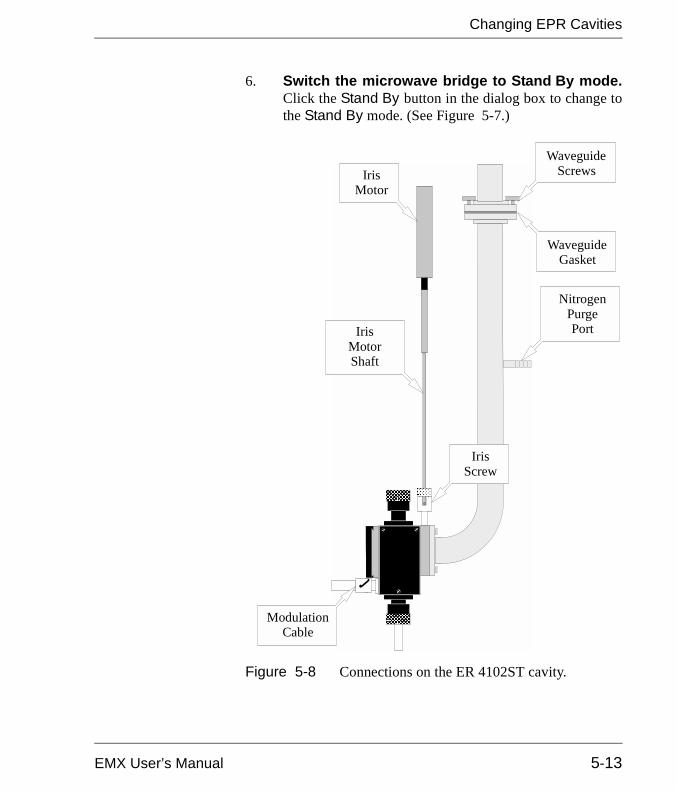
6. Switch the microwave bridge to Stand By mode.Click the Stand By button in the dialog box to change tothe Stand By mode. (See Figure 5-7.)
Figure 5-8 Connections on the ER 4102ST cavity.
IrisScrew
ModulationCable
IrisMotor
IrisMotorShaft
NitrogenPurgePort
WaveguideGasket
WaveguideScrews
Changing EPR Cavities
5-14
7. Disconnect accessories. If a variable temperaturedewar assembly is installed, disconnect the coolant trans-fer line and the thermocouple connections from the cavity.
8. Disconnect the modulation cable from the cavity.This is the twinax cable labeled with a white connectorand attached to the front of the cavity. (See Figure 5-8.)
9. Disconnect the nitrogen purge line from the porton the waveguide. The port is half way down thewaveguide attached to the cavity. (See Figure 5-8.)
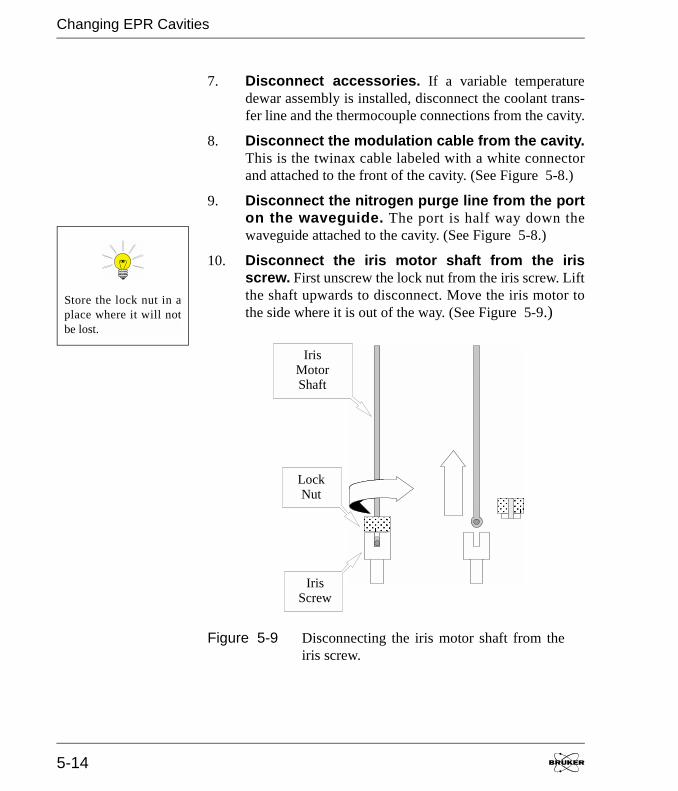
10. Disconnect the iris motor shaft from the irisscrew. First unscrew the lock nut from the iris screw. Liftthe shaft upwards to disconnect. Move the iris motor tothe side where it is out of the way. (See Figure 5-9.)
Figure 5-9 Disconnecting the iris motor shaft from theiris screw.
Store the lock nut in aplace where it will notbe lost.
IrisScrew
IrisMotorShaft
LockNut
Changing EPR Cavities
EMX User’s Manual 5-15
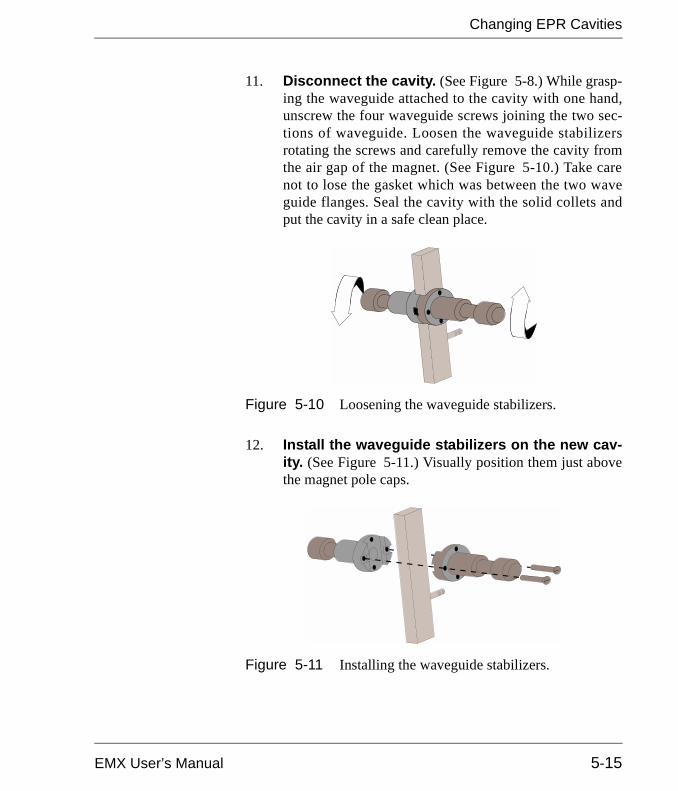
11. Disconnect the cavity. (See Figure 5-8.) While grasp-ing the waveguide attached to the cavity with one hand,unscrew the four waveguide screws joining the two sec-tions of waveguide. Loosen the waveguide stabilizersrotating the screws and carefully remove the cavity fromthe air gap of the magnet. (See Figure 5-10.) Take carenot to lose the gasket which was between the two waveguide flanges. Seal the cavity with the solid collets andput the cavity in a safe clean place.
12. Install the waveguide stabilizers on the new cav-ity. (See Figure 5-11.) Visually position them just abovethe magnet pole caps.
Figure 5-10 Loosening the waveguide stabilizers.
Figure 5-11 Installing the waveguide stabilizers.
Changing EPR Cavities
5-16
13. Attach the appropriate size collet and pedestalon the cavity.
14. Screw in the iris. Manually turn the iris screwuntil it is almost all the way in. The iris screw willstop rotating. It may be a good idea to back the screw out1/2 turn after it hits the bottom. This will further decreaseyour chances of accidentally breaking the iris screw dur-ing the tune procedure.
15. Click and hold the down Iris Button. Activate thisbutton (See Figure 5-1.) until the iris motor stops; this isthe lower limit of the motor. With the iris motor in itslower limit, reattach the iris motor drive to the iris screw.
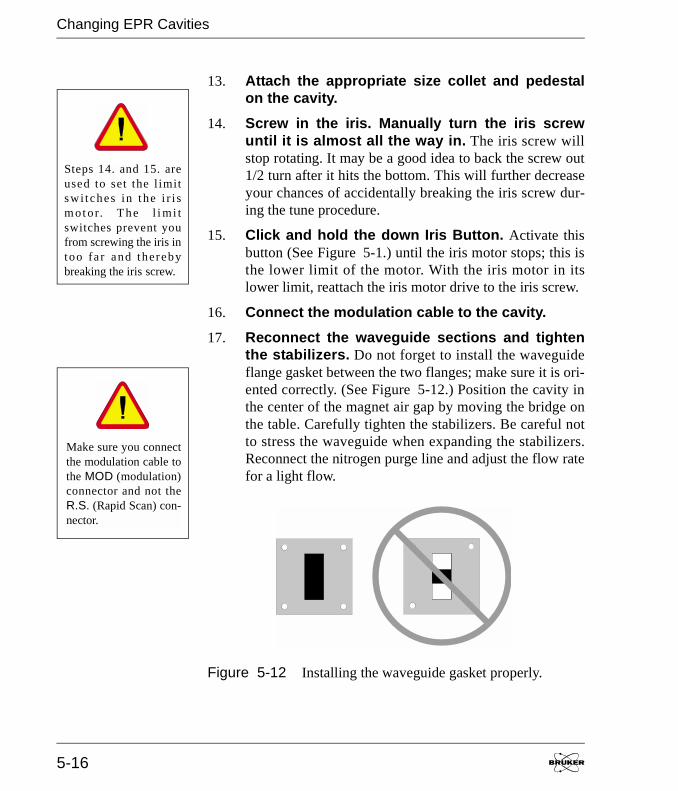
16. Connect the modulation cable to the cavity.17. Reconnect the waveguide sections and tighten
the stabilizers. Do not forget to install the waveguideflange gasket between the two flanges; make sure it is ori-ented correctly. (See Figure 5-12.) Position the cavity inthe center of the magnet air gap by moving the bridge onthe table. Carefully tighten the stabilizers. Be careful notto stress the waveguide when expanding the stabilizers.Reconnect the nitrogen purge line and adjust the flow ratefor a light flow.
Figure 5-12 Installing the waveguide gasket properly.
Steps 14. and 15. areused to set the l imitswi t ches in t he i r i sm ot or. Th e l i mi tswitches prevent youfrom screwing the iris intoo fa r and therebybreaking the iris screw.
Make sure you connectthe modulation cable tothe MOD (modulation)connector and not theR.S. (Rapid Scan) con-nector.
Changing EPR Cavities
EMX User’s Manual 5-17
18. Reconnect the iris motor shaft to the iris screw.The procedure here is like Step 10. performed in reverse.Reposition the iris screw motor. Screw the lock nut ontothe iris screw. Click and hold the up iris button in theMicrowave Bridge Control dialog box until the irisscrew is approximately half way out.
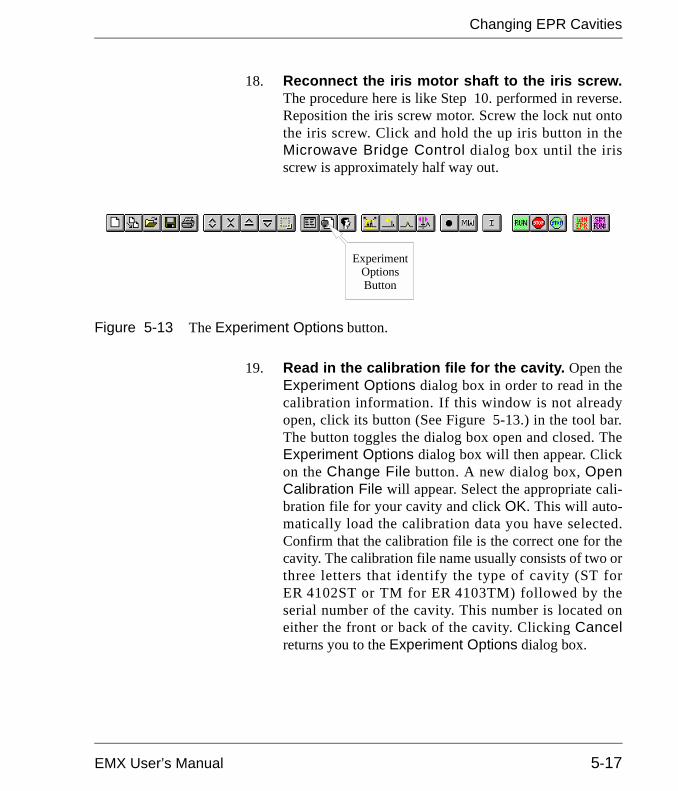
19. Read in the calibration file for the cavity. Open theExperiment Options dialog box in order to read in thecalibration information. If this window is not alreadyopen, click its button (See Figure 5-13.) in the tool bar.The button toggles the dialog box open and closed. TheExperiment Options dialog box will then appear. Clickon the Change File button. A new dialog box, OpenCalibration File will appear. Select the appropriate cali-bration file for your cavity and click OK. This will auto-matically load the calibration data you have selected.Confirm that the calibration file is the correct one for thecavity. The calibration file name usually consists of two orthree letters that identify the type of cavity (ST forER 4102ST or TM for ER 4103TM) followed by theserial number of the cavity. This number is located oneither the front or back of the cavity. Clicking Cancelreturns you to the Experiment Options dialog box.
Figure 5-13 The Experiment Options button.
ExperimentOptionsButton
Changing EPR Cavities
5-18
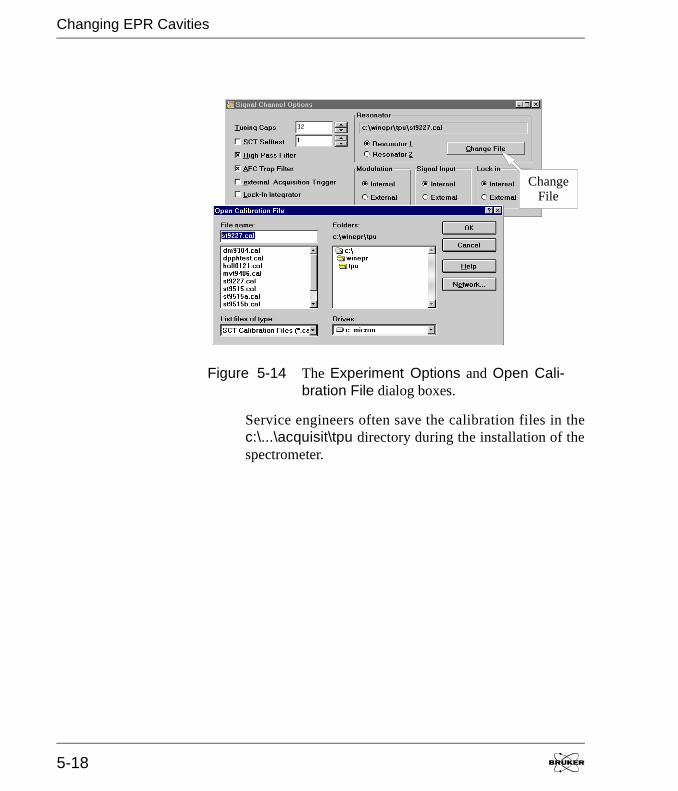
Service engineers often save the calibration files in thec:\...\acquisit\tpu directory during the installation of thespectrometer.
Figure 5-14 The Experiment Options and Open Cali-bration File dialog boxes.
ChangeFile
Fine AFC Tuning for Gunn Diode Bridges
EMX User’s Manual 5-19
Fine AFC Tuning for Gunn Diode Bridges 5.3The AFC (Automatic Frequency Control) is the circuitry used to“lock” the microwave source frequency to the resonant fre-quency of the cavity. In most cases, particularly if the micro-wave attenuation is less than 40 dB, the AFC works very wellwithout any need for you to fine-tune it. If you are performingexperiments in which low microwave powers are required, fol-lowing the instructions in this section will ensure that you willobtain optimal AFC performance. Please note that this proce-dure is not required for klystron bridges. You can determine thetype of bridge you have by looking at the model designation onthe front plate of the bridge. A model designation containing aG, for example ER 041 XG, indicates a microwave bridge with aGunn diode microwave source. In contrast, a bridge with amodel designation with a K, such as ER 041 XK, has a klystronmicrowave source.
The Fine-tuning Procedure 5.3.11. Set the FINE AFC potentiometer to zero. The
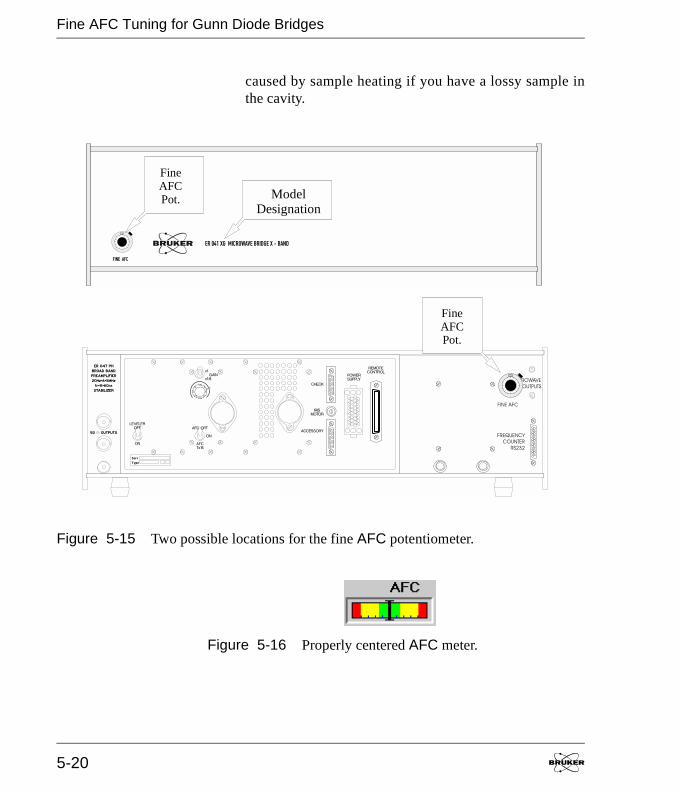
potentiometer for the AFC can appear in two differentlocations on the bridge depending on when your bridgewas manufactured. (See Figure 5-15.)
2. Tune the microwave bridge. Follow the procedures inSection 3.4 for automatic tuning or Section 5.1 for man-ual tuning. The frequency, bias, phase, and iris screwshould be adjusted so that the needles of the AFC andDiode meters remain centered as you change the micro-wave attenuation from 0 to 40 dB. (See Figure 5-16 andFigure 5-17.) Note that there may be a drift at 0 dB
Fine AFC Tuning for Gunn Diode Bridges
5-20
caused by sample heating if you have a lossy sample inthe cavity.
Figure 5-15 Two possible locations for the fine AFC potentiometer.
ModelDesignation
FineAFCPot.
FineAFCPot.
Figure 5-16 Properly centered AFC meter.
Fine AFC Tuning for Gunn Diode Bridges
EMX User’s Manual 5-21
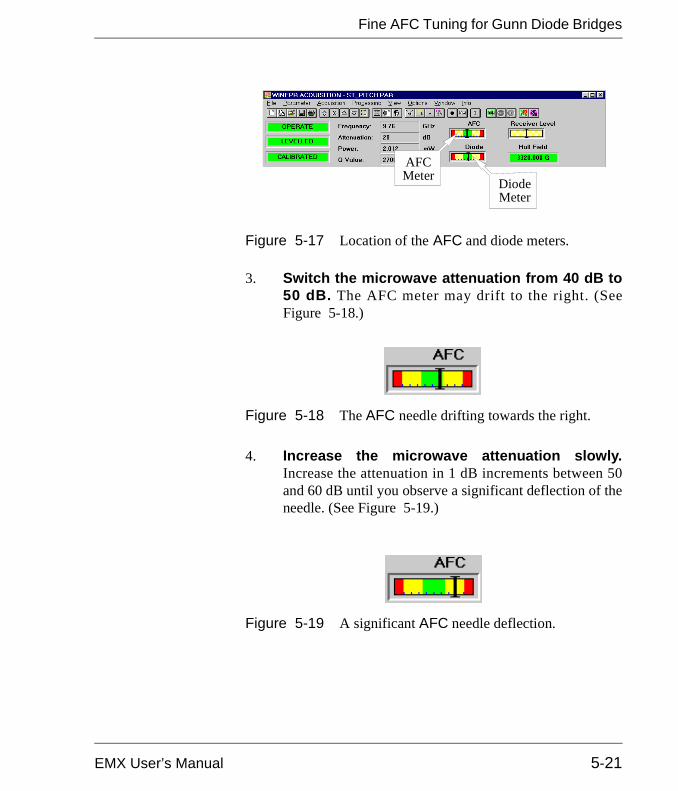
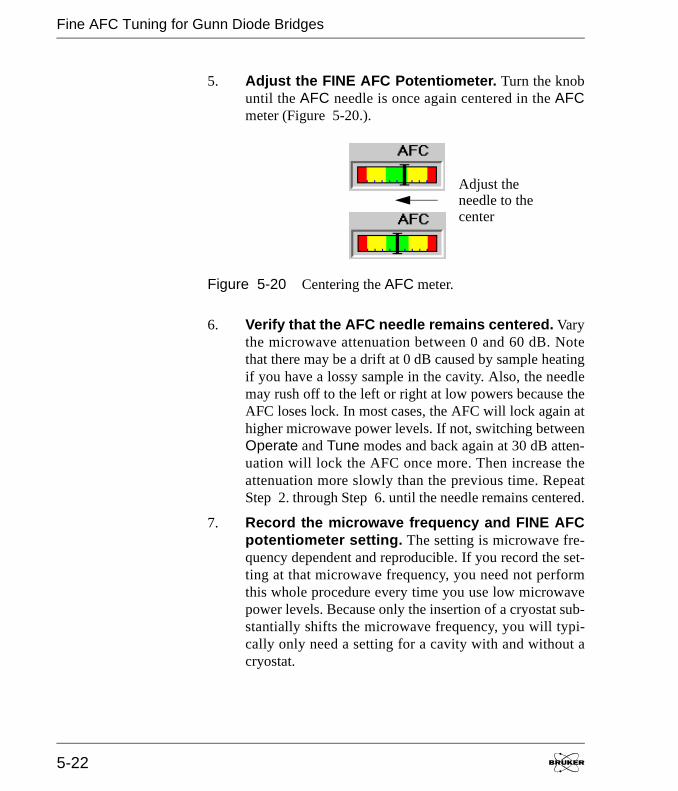
3. Switch the microwave attenuation from 40 dB to50 dB. The AFC meter may drift to the right. (SeeFigure 5-18.)
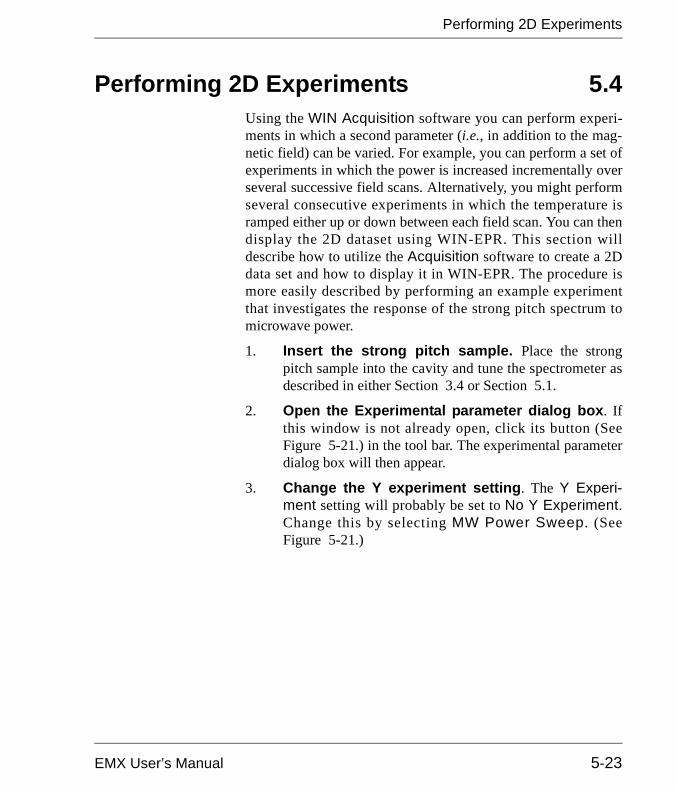
4. Increase the microwave attenuation slowly.Increase the attenuation in 1 dB increments between 50and 60 dB until you observe a significant deflection of theneedle. (See Figure 5-19.)
Figure 5-17 Location of the AFC and diode meters.
Figure 5-18 The AFC needle drifting towards the right.
Figure 5-19 A significant AFC needle deflection.
AFCMeter Diode
Meter
Fine AFC Tuning for Gunn Diode Bridges
5-22
5. Adjust the FINE AFC Potentiometer. Turn the knobuntil the AFC needle is once again centered in the AFCmeter (Figure 5-20.).
6. Verify that the AFC needle remains centered. Varythe microwave attenuation between 0 and 60 dB. Notethat there may be a drift at 0 dB caused by sample heatingif you have a lossy sample in the cavity. Also, the needlemay rush off to the left or right at low powers because theAFC loses lock. In most cases, the AFC will lock again athigher microwave power levels. If not, switching betweenOperate and Tune modes and back again at 30 dB atten-uation will lock the AFC once more. Then increase theattenuation more slowly than the previous time. RepeatStep 2. through Step 6. until the needle remains centered.
7. Record the microwave frequency and FINE AFCpotentiometer setting. The setting is microwave fre-quency dependent and reproducible. If you record the set-ting at that microwave frequency, you need not performthis whole procedure every time you use low microwavepower levels. Because only the insertion of a cryostat sub-stantially shifts the microwave frequency, you will typi-cally only need a setting for a cavity with and without acryostat.
Figure 5-20 Centering the AFC meter.
Adjust theneedle to thecenter
Performing 2D Experiments
EMX User’s Manual 5-23
Performing 2D Experiments 5.4Using the WIN Acquisition software you can perform experi-ments in which a second parameter (i.e., in addition to the mag-netic field) can be varied. For example, you can perform a set ofexperiments in which the power is increased incrementally overseveral successive field scans. Alternatively, you might performseveral consecutive experiments in which the temperature isramped either up or down between each field scan. You can thendisplay the 2D dataset using WIN-EPR. This section willdescribe how to utilize the Acquisition software to create a 2Ddata set and how to display it in WIN-EPR. The procedure ismore easily described by performing an example experimentthat investigates the response of the strong pitch spectrum tomicrowave power.
1. Insert the strong pitch sample. Place the strongpitch sample into the cavity and tune the spectrometer asdescribed in either Section 3.4 or Section 5.1.
2. Open the Experimental parameter dialog box. Ifthis window is not already open, click its button (SeeFigure 5-21.) in the tool bar. The experimental parameterdialog box will then appear.
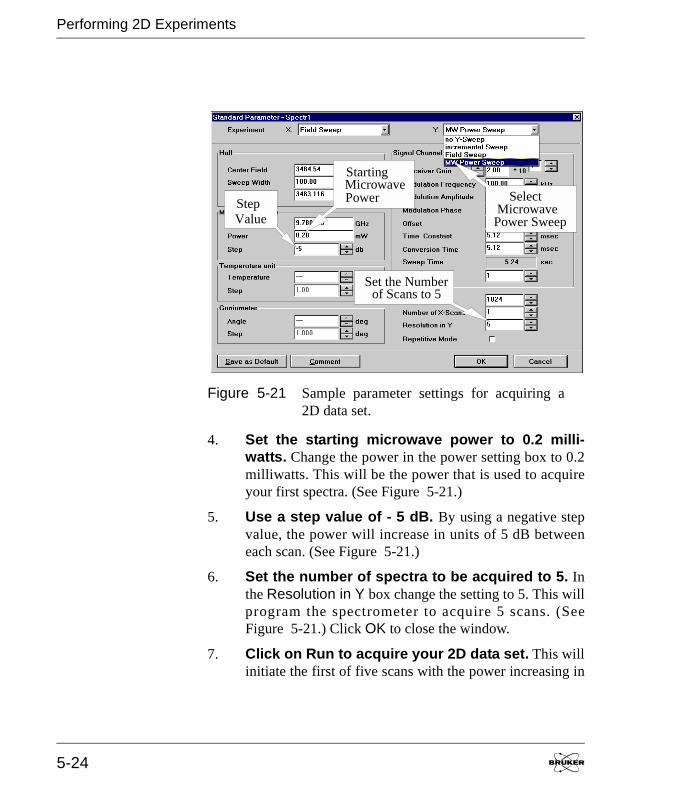
3. Change the Y experiment setting. The Y Experi-ment setting will probably be set to No Y Experiment.Change this by selecting MW Power Sweep. (SeeFigure 5-21.)
Performing 2D Experiments
5-24
4. Set the starting microwave power to 0.2 milli-watts. Change the power in the power setting box to 0.2milliwatts. This will be the power that is used to acquireyour first spectra. (See Figure 5-21.)
5. Use a step value of - 5 dB. By using a negative stepvalue, the power will increase in units of 5 dB betweeneach scan. (See Figure 5-21.)
6. Set the number of spectra to be acquired to 5. Inthe Resolution in Y box change the setting to 5. This willprogram the spectrometer to acquire 5 scans. (SeeFigure 5-21.) Click OK to close the window.
7. Click on Run to acquire your 2D data set. This willinitiate the first of five scans with the power increasing in
Figure 5-21 Sample parameter settings for acquiring a2D data set.
MicrowavePower Sweep
Select
Set the Numberof Scans to 5
StartingMicrowavePower
ValueStep
Performing 2D Experiments
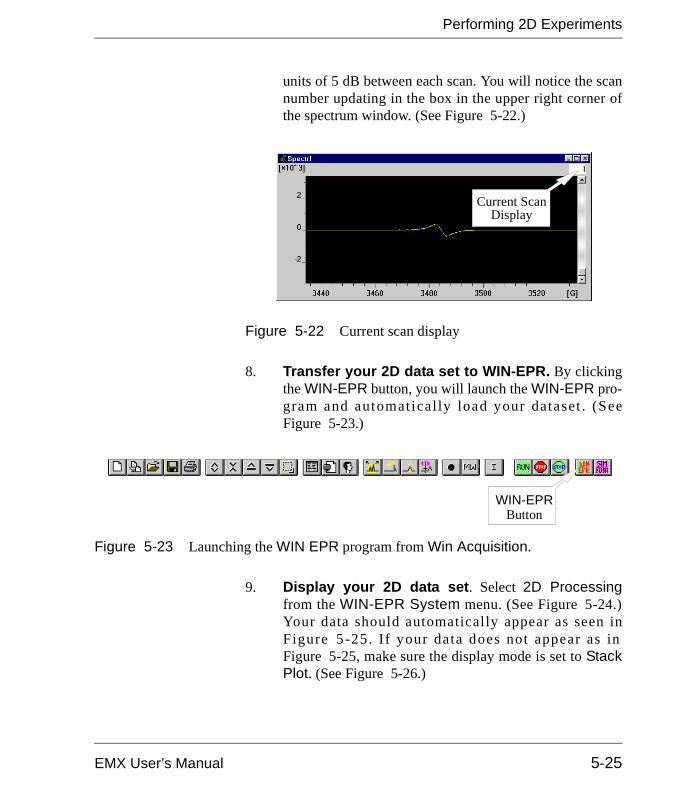
EMX User’s Manual 5-25
units of 5 dB between each scan. You will notice the scannumber updating in the box in the upper right corner ofthe spectrum window. (See Figure 5-22.)
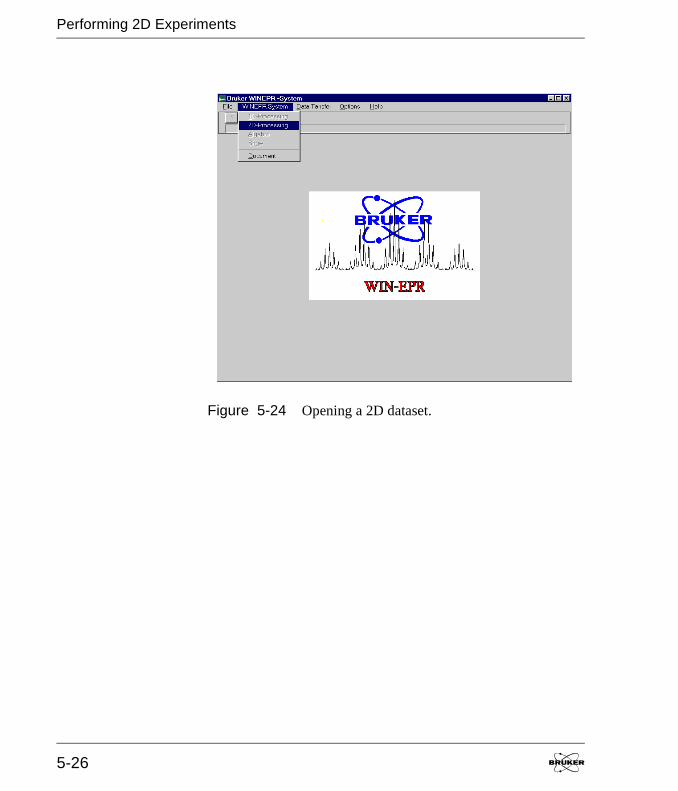
8. Transfer your 2D data set to WIN-EPR. By clickingthe WIN-EPR button, you will launch the WIN-EPR pro-gram and automatical ly load your dataset . (SeeFigure 5-23.)
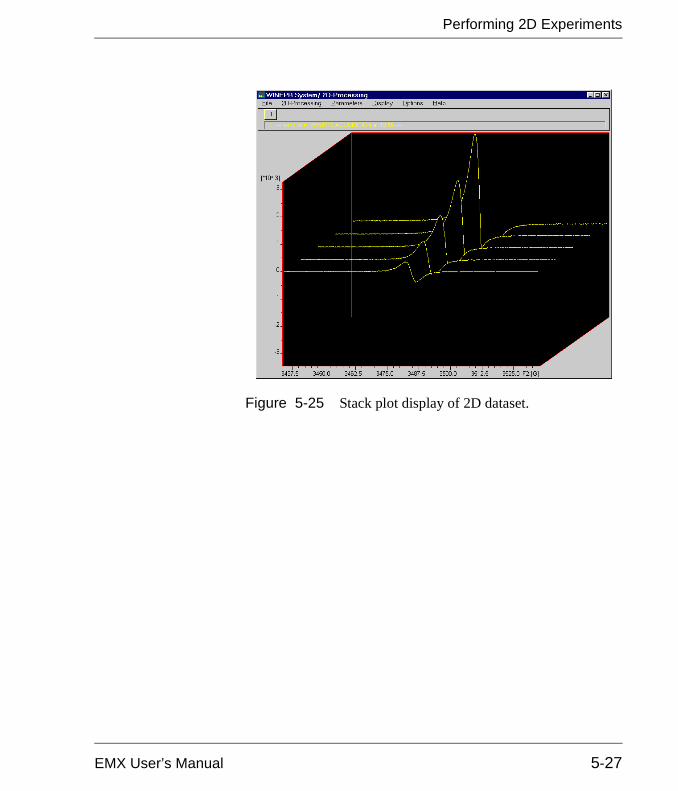
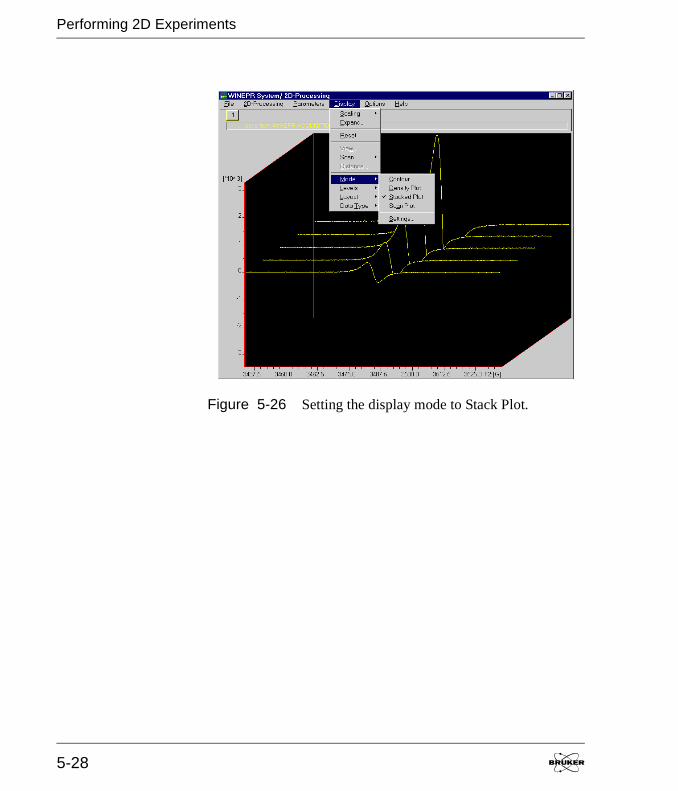
9. Display your 2D data set. Select 2D Processingfrom the WIN-EPR System menu. (See Figure 5-24.)Your data should automatically appear as seen inFigure 5-25. If your data does not appear as inFigure 5-25, make sure the display mode is set to StackPlot. (See Figure 5-26.)
Figure 5-22 Current scan display
Current ScanDisplay
Figure 5-23 Launching the WIN EPR program from Win Acquisition.
WIN-EPRButton
Performing 2D Experiments
5-26
Figure 5-24 Opening a 2D dataset.
Performing 2D Experiments
EMX User’s Manual 5-27
Figure 5-25 Stack plot display of 2D dataset.
Performing 2D Experiments
5-28
Figure 5-26 Setting the display mode to Stack Plot.
EMX User’s Manual
Helpful Hints 6This chapter contains useful and helpful hints to get the most outof your EMX spectrometer and its hardware. The first half ofthis chapter covers advice on what to do if you do not observe anEPR signal from your sample. The second half of the chapterconcerns itself with optimizing the performance of the EPRspectrometer for your particular sample and operating condi-tions. It is assumed that you are familiar with the material pre-sented in Chapter 2 and Chapter 3.
Hints for Finding EPR Signals 6.1• Make sure that the spectrometer is functioning
properly. If you followed the directions of Chapter 3, thisshould not be a problem. There are many common mistakes.Is the modulation cable connected properly to the cavity andconsole? Is the waveguide gasket installed properly? Iseverything turned on? Advice on troubleshooting is pre-sented in the next chapter.
• Scan over the correct magnetic field range. If you donot sweep over the correct magnetic field range, you willmiss your signals. This mistake occurs quite often whenusing a cryostat in the EPR cavity. Consult literature refer-ences to determine approximate g-values for the species inyour sample. You can then choose the appropriate magneticfield for your sample. Most organic radicals will have ag-value of approximately 2. This corresponds to a field forresonance of approximately 3480 Gauss at a microwave fre-quency of 9.8 GHz. Metal ions can have large departuresfrom g = 2 as well as large zero-field splittings, making it dif-ficult to guess where the resonance might occur. Performinga wide scan in your initial experiment will maximizes yourprobability of finding the EPR signal.
Cryostats shifts the res-onant frequency of thecavity and hence thefrequency of the spec-t romete r to a l owervalue. The field for res-onance of your EPR sig-nals will therefore belower than you wouldexpect for a cavity with-out a cryostat.
Hints for Finding EPR Signals
6-2
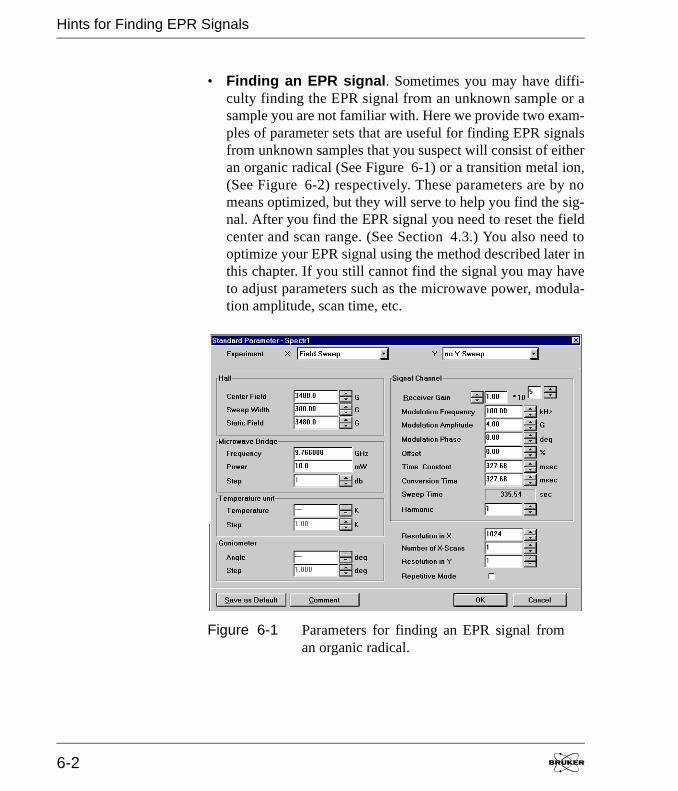
• Finding an EPR signal. Sometimes you may have diffi-culty finding the EPR signal from an unknown sample or asample you are not familiar with. Here we provide two exam-ples of parameter sets that are useful for finding EPR signalsfrom unknown samples that you suspect will consist of eitheran organic radical (See Figure 6-1) or a transition metal ion,(See Figure 6-2) respectively. These parameters are by nomeans optimized, but they will serve to help you find the sig-nal. After you find the EPR signal you need to reset the fieldcenter and scan range. (See Section 4.3.) You also need tooptimize your EPR signal using the method described later inthis chapter. If you still cannot find the signal you may haveto adjust parameters such as the microwave power, modula-tion amplitude, scan time, etc.
Figure 6-1 Parameters for finding an EPR signal froman organic radical.
Hints for Finding EPR Signals
EMX User’s Manual 6-3
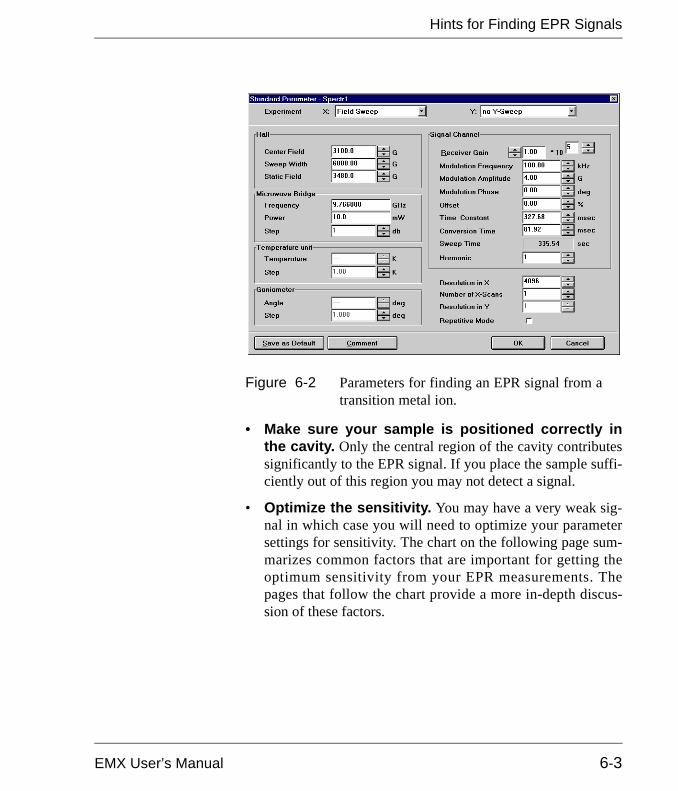
• Make sure your sample is positioned correctly inthe cavity. Only the central region of the cavity contributessignificantly to the EPR signal. If you place the sample suffi-ciently out of this region you may not detect a signal.
• Optimize the sensitivity. You may have a very weak sig-nal in which case you will need to optimize your parametersettings for sensitivity. The chart on the following page sum-marizes common factors that are important for getting theoptimum sensitivity from your EPR measurements. Thepages that follow the chart provide a more in-depth discus-sion of these factors.
Figure 6-2 Parameters for finding an EPR signal from atransition metal ion.
Hints for Finding EPR Signals
6-4
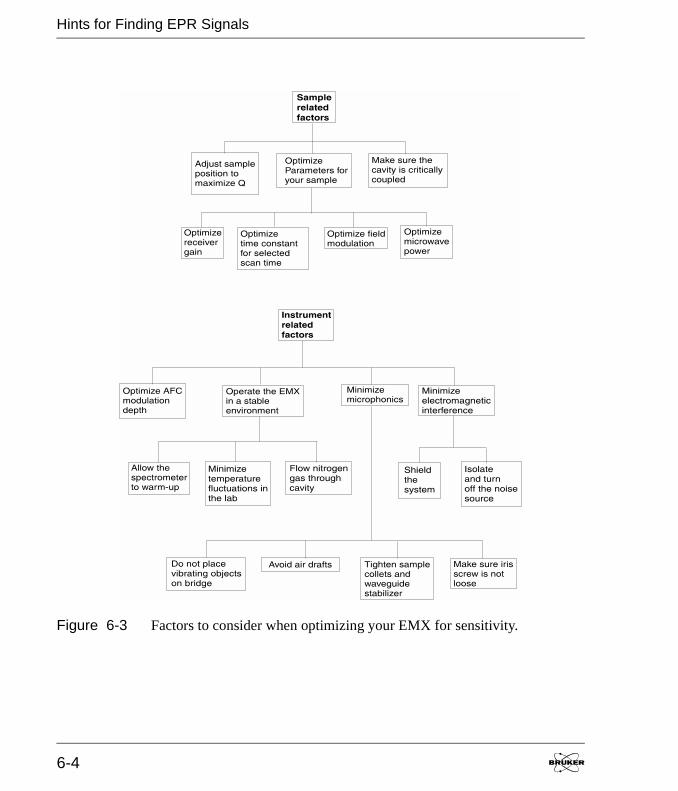
Figure 6-3 Factors to consider when optimizing your EMX for sensitivity.
Optimizing Sensitivity
EMX User’s Manual 6-5
Optimizing Sensitivity 6.2
Instrumental Factors 6.2.1• Minimize microphonics. Microphonics are unwanted
mechanical vibrations in the spectrometer. Depending on thenature and frequency of the microphonics, these vibrationsmay generate noise in your EPR spectrum. The most com-mon microphonic sources include the cavity, the sample andthe bridge. Prevent microphonic noise by securing thewaveguide with the waveguide stabilizers. Rigidly secure thesample in the cavity by tightening the collets on the cavitysample stack. Do not place objects on the microwave bridgethat may vibrate or are free to move. Avoid placing a fre-quency counter with a fan on top of the bridge.
• Maintain a controlled environment for the bestspectrometer performance. Air drafts past the spectrom-eter, especially the cavity, may induce temperature fluctua-tions or microphonics from sample vibration. Largefluctuations in the ambient temperature may degrade perfor-mance by reducing the frequency stability of the cavity. Veryhumid environments may cause water condensation. You canreduce condensation inside the cavity by maintaining a con-stant purging stream of dry nitrogen gas. Note that excessivegas flow rates can generate microphonic noise through sam-ple vibration.
• Minimize electrical interference. Noise pick-up fromelectromagnetic interference (EMI noise) may be encoun-tered in some environments. You may be able to minimizeEMI noise by shielding or perhaps by turning the noisesource off if generated by equipment near the spectrometer.There is often less EMI at night.
For better spectrometerstability, keep the spec-t rometer away f romwindows and ventila-tion ducts.
Optimizing Sensitivity
6-6
• Allow the spectrometer to warm-up. One hour is usu-ally adequate to achieve a stable operating temperature. Formaximum stability under extreme operating conditions suchas any combination of high microwave power, high magneticfield modulation amplitudes, and variable temperature work,allow the system to equilibrate under the same conditions asthe experiment will be performed.
• Carefully follow the procedure for positioning thesample inside the cavity. This is particularly importantfor samples exhibiting a large dielectric loss. Improper sam-ple positioning can perturb the microwave field mode pat-terns in the cavity, resulting in less than optimum sensitivity.
• Periodically check the iris coupling screw for tight-ness of fit. A worn iris screw thread will make the iris sus-ceptible to microphonics which can modulate the cavitycoupling.
• Critically couple the cavity. Best cavity performance isobtained with a critically coupled cavity. Maximum transferof power between the cavity and the waveguide occurs underthis condition.
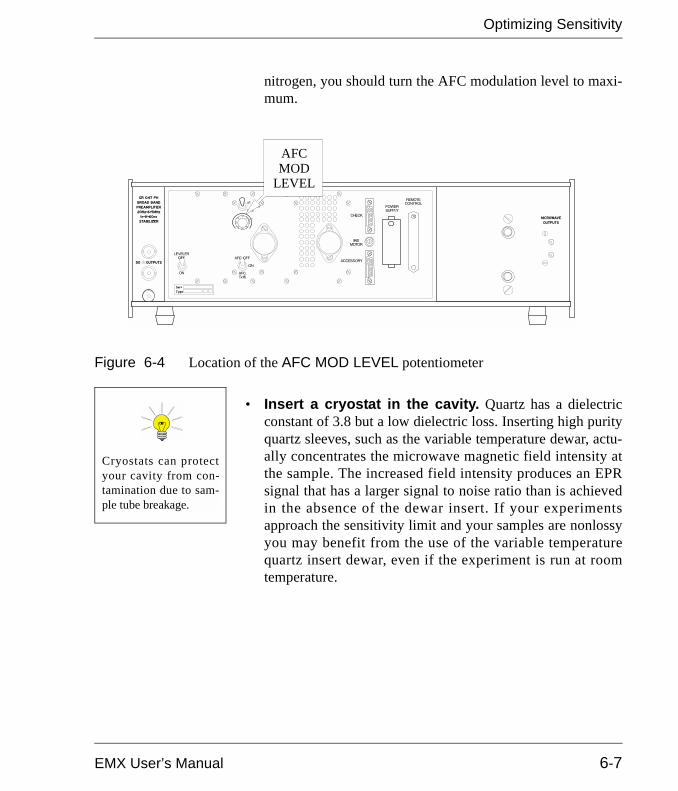
• Optimize the AFC. Adjust the AFC modulation depth tominimize the noise level observed in the absorption EPRspectrum at full incident microwave power. Adjustments ofthe AFC MOD LEVEL potentiometer, located on the rear ofthe microwave bridge, (Figure 6-4) should be made while inthe Operate mode with the sample inserted and the spec-trometer tuned as described in Section 3.4. You should makethis adjustment for all experiments limited by signal to noiseconsiderations. The optimum AFC modulation depth is afunction of the loaded cavity Q. Consequently, slight varia-tions in the optimum setting may be anticipated. If you areusing a finger dewar with a boiling refrigerant such as liquid
Optimizing Sensitivity
EMX User’s Manual 6-7
nitrogen, you should turn the AFC modulation level to maxi-mum.
• Insert a cryostat in the cavity. Quartz has a dielectricconstant of 3.8 but a low dielectric loss. Inserting high purityquartz sleeves, such as the variable temperature dewar, actu-ally concentrates the microwave magnetic field intensity atthe sample. The increased field intensity produces an EPRsignal that has a larger signal to noise ratio than is achievedin the absence of the dewar insert. If your experimentsapproach the sensitivity limit and your samples are nonlossyyou may benefit from the use of the variable temperaturequartz insert dewar, even if the experiment is run at roomtemperature.
Figure 6-4 Location of the AFC MOD LEVEL potentiometer
AFCMOD
LEVEL
Cryostats can protectyour cavity from con-tamination due to sam-ple tube breakage.
Optimizing Sensitivity
6-8
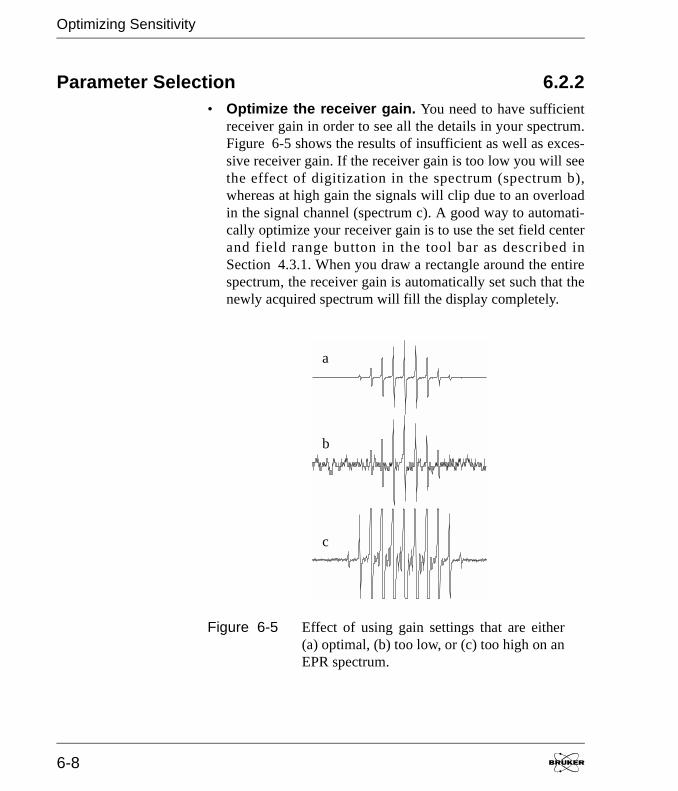
Parameter Selection 6.2.2• Optimize the receiver gain. You need to have sufficient
receiver gain in order to see all the details in your spectrum.Figure 6-5 shows the results of insufficient as well as exces-sive receiver gain. If the receiver gain is too low you will seethe effect of digitization in the spectrum (spectrum b),whereas at high gain the signals will clip due to an overloadin the signal channel (spectrum c). A good way to automati-cally optimize your receiver gain is to use the set field centerand field range button in the tool bar as described inSection 4.3.1. When you draw a rectangle around the entirespectrum, the receiver gain is automatically set such that thenewly acquired spectrum will fill the display completely.
Figure 6-5 Effect of using gain settings that are either(a) optimal, (b) too low, or (c) too high on anEPR spectrum.
a
b
c
Optimizing Sensitivity
EMX User’s Manual 6-9
• Optimize the conversion time. The conversion time youselect will affect the dynamic range of your experiments. Theconversion time is actually the amount of time the ana-log-to-digital converter spends integrating at one field posi-tion before moving to the next field value in the sweep. If youneed to resolve lines that are very intense as well as lines thatare very weak (i.e, carbon 13 satellites) within the same spec-trum you will need to use a sufficiently long conversion time.If the conversion time is too short the smaller signals will belost in the steps of the digitizer. The conversion time youselect will also determine the sweep time. That is, the sweeptime will be equal to the conversion time multiplied by thenumber of data points in the spectrum. (See selecting thenumber of data points below.)
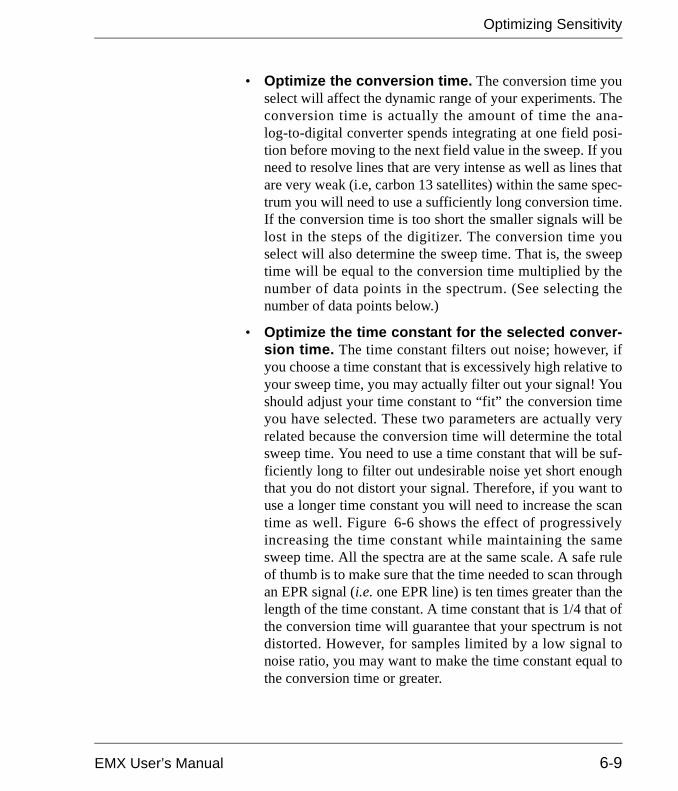
• Optimize the time constant for the selected conver-sion time. The time constant filters out noise; however, ifyou choose a time constant that is excessively high relative toyour sweep time, you may actually filter out your signal! Youshould adjust your time constant to “fit” the conversion timeyou have selected. These two parameters are actually veryrelated because the conversion time will determine the totalsweep time. You need to use a time constant that will be suf-ficiently long to filter out undesirable noise yet short enoughthat you do not distort your signal. Therefore, if you want touse a longer time constant you will need to increase the scantime as well. Figure 6-6 shows the effect of progressivelyincreasing the time constant while maintaining the samesweep time. All the spectra are at the same scale. A safe ruleof thumb is to make sure that the time needed to scan throughan EPR signal (i.e. one EPR line) is ten times greater than thelength of the time constant. A time constant that is 1/4 that ofthe conversion time will guarantee that your spectrum is notdistorted. However, for samples limited by a low signal tonoise ratio, you may want to make the time constant equal tothe conversion time or greater.
Optimizing Sensitivity
6-10
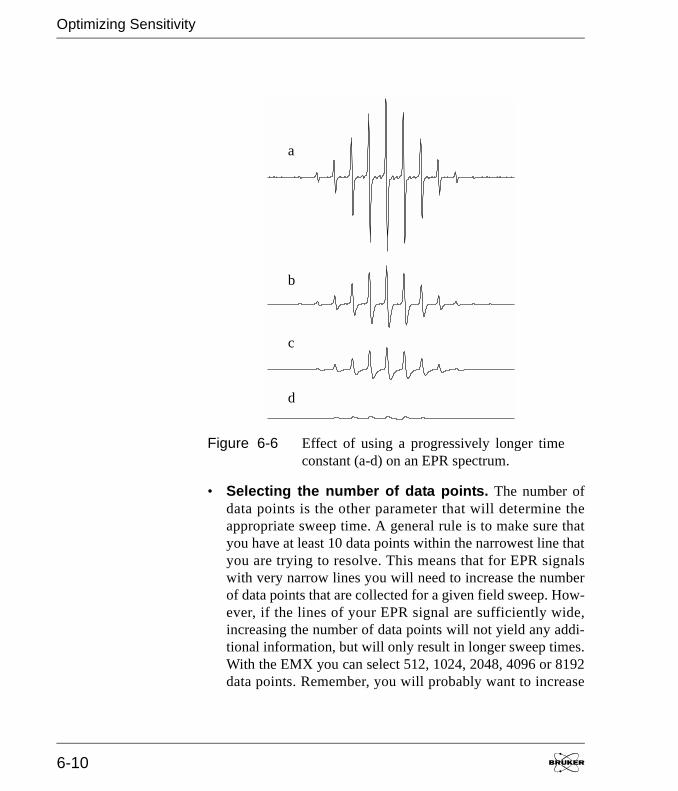
• Selecting the number of data points. The number ofdata points is the other parameter that will determine theappropriate sweep time. A general rule is to make sure thatyou have at least 10 data points within the narrowest line thatyou are trying to resolve. This means that for EPR signalswith very narrow lines you will need to increase the numberof data points that are collected for a given field sweep. How-ever, if the lines of your EPR signal are sufficiently wide,increasing the number of data points will not yield any addi-tional information, but will only result in longer sweep times.With the EMX you can select 512, 1024, 2048, 4096 or 8192data points. Remember, you will probably want to increase
Figure 6-6 Effect of using a progressively longer timeconstant (a-d) on an EPR spectrum.
a
b
d
c
Optimizing Sensitivity
EMX User’s Manual 6-11
the time constant by a factor of two as you double the numberof data points. Figure 6-7 shows the enhancement in resolu-tion achieved by increasing the number of data points.
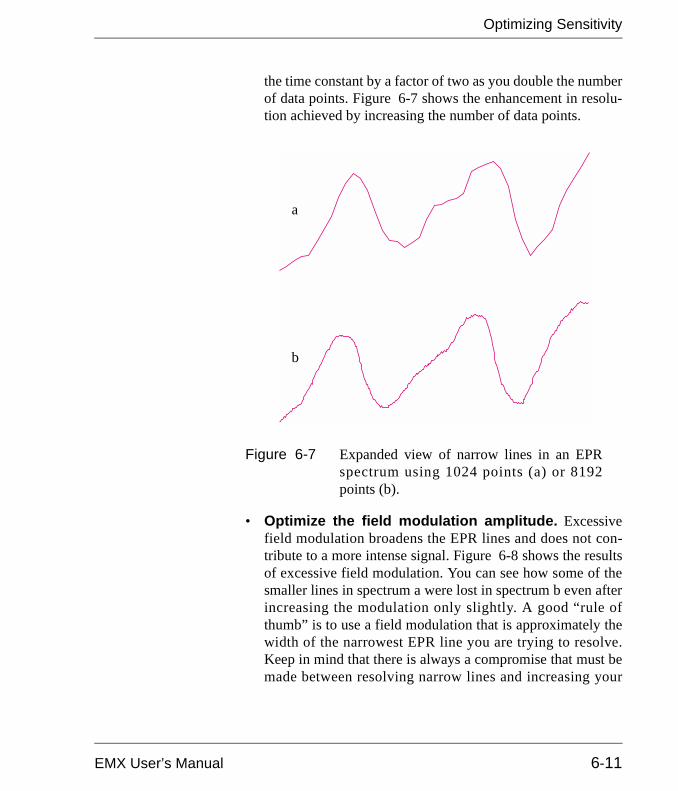
• Optimize the field modulation amplitude. Excessivefield modulation broadens the EPR lines and does not con-tribute to a more intense signal. Figure 6-8 shows the resultsof excessive field modulation. You can see how some of thesmaller lines in spectrum a were lost in spectrum b even afterincreasing the modulation only slightly. A good “rule ofthumb” is to use a field modulation that is approximately thewidth of the narrowest EPR line you are trying to resolve.Keep in mind that there is always a compromise that must bemade between resolving narrow lines and increasing your
Figure 6-7 Expanded view of narrow lines in an EPRspectrum using 1024 points (a) or 8192points (b).
b
a
Optimizing Sensitivity
6-12
signal to noise ratio. If you have a very weak signal, you mayneed to sacrifice resolution (i.e., by using a higher field mod-ulation) in order to even detect the signal. However, if youhave a high signal to noise ratio, you may choose to use amuch lower field modulation in order to maximize resolu-tion.
Figure 6-8 Effect of using progressively higher fieldmodulation (a-d) on an EPR spectrum.
a
b
c
d
Optimizing Sensitivity
EMX User’s Manual 6-13
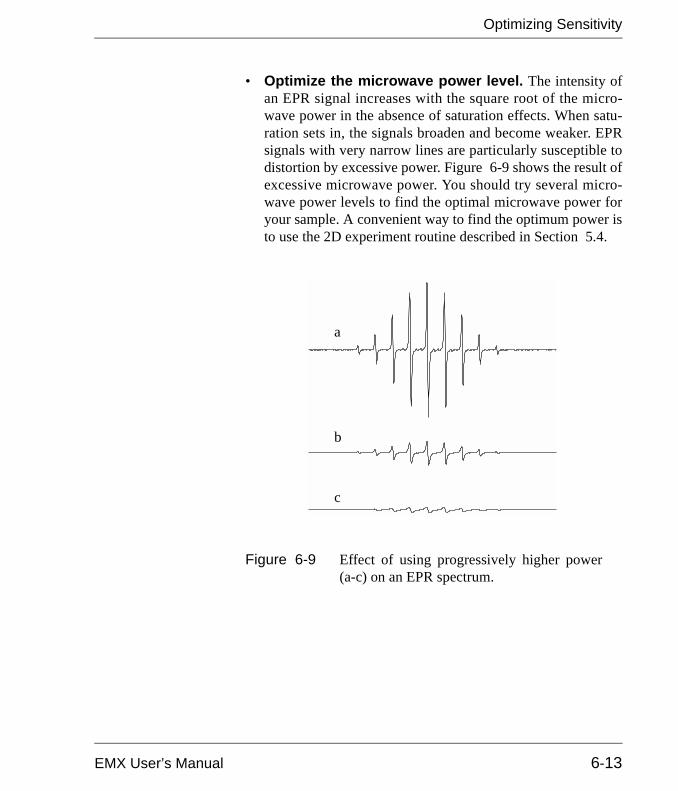
• Optimize the microwave power level. The intensity ofan EPR signal increases with the square root of the micro-wave power in the absence of saturation effects. When satu-ration sets in, the signals broaden and become weaker. EPRsignals with very narrow lines are particularly susceptible todistortion by excessive power. Figure 6-9 shows the result ofexcessive microwave power. You should try several micro-wave power levels to find the optimal microwave power foryour sample. A convenient way to find the optimum power isto use the 2D experiment routine described in Section 5.4.
Figure 6-9 Effect of using progressively higher power(a-c) on an EPR spectrum.
b
c
a
Optimizing Sensitivity
6-14
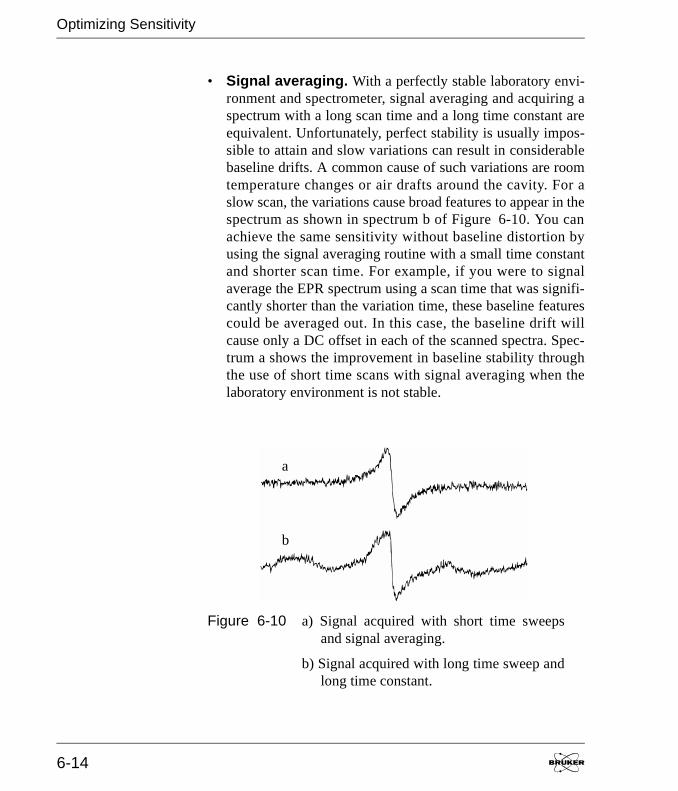
• Signal averaging. With a perfectly stable laboratory envi-ronment and spectrometer, signal averaging and acquiring aspectrum with a long scan time and a long time constant areequivalent. Unfortunately, perfect stability is usually impos-sible to attain and slow variations can result in considerablebaseline drifts. A common cause of such variations are roomtemperature changes or air drafts around the cavity. For aslow scan, the variations cause broad features to appear in thespectrum as shown in spectrum b of Figure 6-10. You canachieve the same sensitivity without baseline distortion byusing the signal averaging routine with a small time constantand shorter scan time. For example, if you were to signalaverage the EPR spectrum using a scan time that was signifi-cantly shorter than the variation time, these baseline featurescould be averaged out. In this case, the baseline drift willcause only a DC offset in each of the scanned spectra. Spec-trum a shows the improvement in baseline stability throughthe use of short time scans with signal averaging when thelaboratory environment is not stable.
Figure 6-10 a) Signal acquired with short time sweepsand signal averaging.
b) Signal acquired with long time sweep andlong time constant.
a
b
EMX User’s Manual
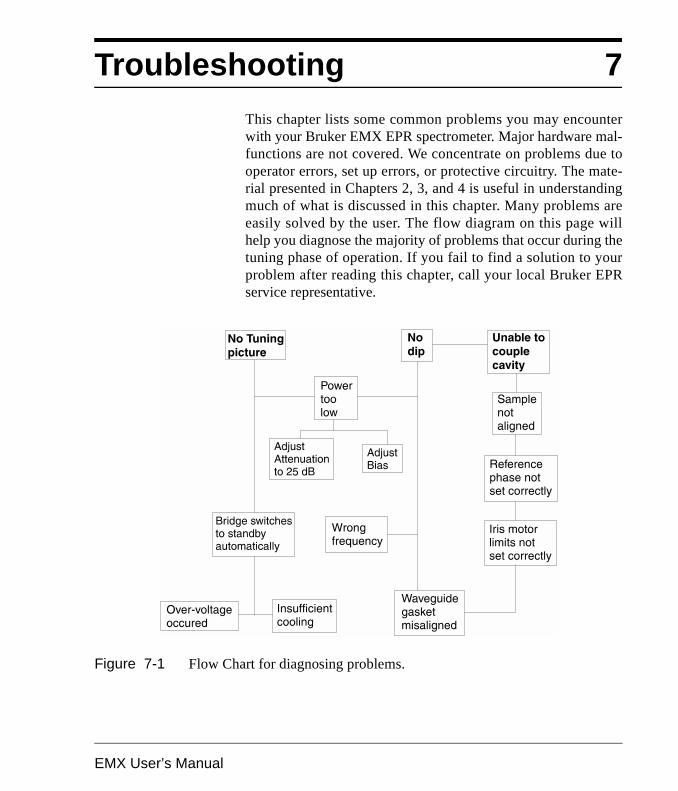
Troubleshooting 7This chapter lists some common problems you may encounterwith your Bruker EMX EPR spectrometer. Major hardware mal-functions are not covered. We concentrate on problems due tooperator errors, set up errors, or protective circuitry. The mate-rial presented in Chapters 2, 3, and 4 is useful in understandingmuch of what is discussed in this chapter. Many problems areeasily solved by the user. The flow diagram on this page willhelp you diagnose the majority of problems that occur during thetuning phase of operation. If you fail to find a solution to yourproblem after reading this chapter, call your local Bruker EPRservice representative.
Figure 7-1 Flow Chart for diagnosing problems.
... not ready!
7-2
... not ready! 7.1• If a warning dialog box appears when you first start the
Acquisition program with a message such as Field Control-ler not ready! or Signal Channel not ready!, you haveprobably forgotten to turn the console power supply on.
No Cavity Dip. 7.2• Waveguide gasket installed improperly. See
Figure 5-12 for the proper orientation of the gasket.
• Cavity undercoupled or overcoupled. First, look at themicrowave frequency where you normally expect the cavityto resonate and then adjust the iris screw for better coupling.This can occur when working with lossy samples such asaqueous solutions in flat cells or capillaries.
• You need more microwave power. If you are usinginsufficient microwave power, it can be difficult to see thecavity dip. We recommend setting the microwave attenuatorat 25 dB for the best visibility.
• You are not at the correct frequency. By putting the samplein, you will cause the cavity to resonate at a lower frequency.Thus, you will usually need to lower the frequency after youhave placed the sample in the cavity in order to see the dip.
Tuning Error
EMX User’s Manual 7-3
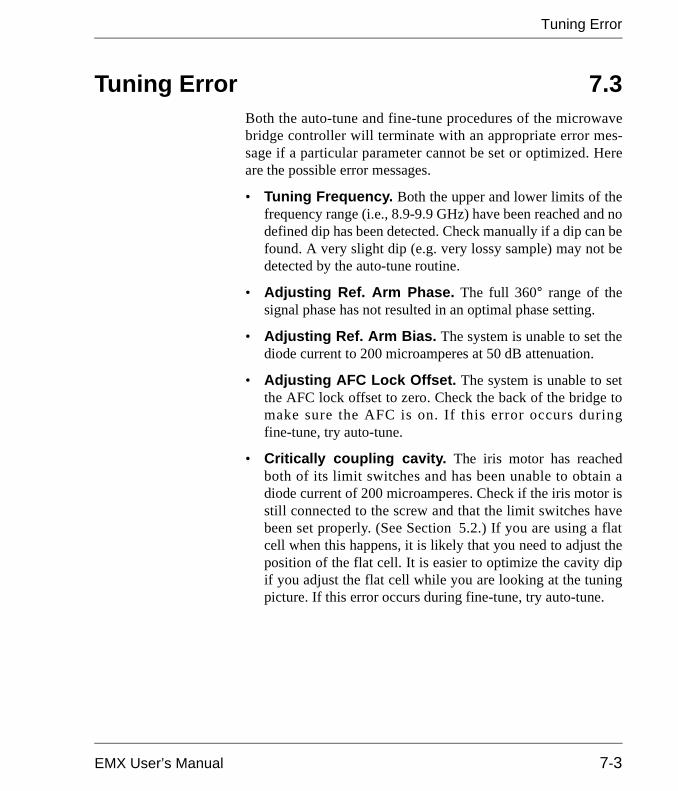
Tuning Error 7.3Both the auto-tune and fine-tune procedures of the microwavebridge controller will terminate with an appropriate error mes-sage if a particular parameter cannot be set or optimized. Hereare the possible error messages.
• Tuning Frequency. Both the upper and lower limits of thefrequency range (i.e., 8.9-9.9 GHz) have been reached and nodefined dip has been detected. Check manually if a dip can befound. A very slight dip (e.g. very lossy sample) may not bedetected by the auto-tune routine.
• Adjusting Ref. Arm Phase. The full 360° range of thesignal phase has not resulted in an optimal phase setting.
• Adjusting Ref. Arm Bias. The system is unable to set thediode current to 200 microamperes at 50 dB attenuation.
• Adjusting AFC Lock Offset. The system is unable to setthe AFC lock offset to zero. Check the back of the bridge tomake sure the AFC is on. If this error occurs duringfine-tune, try auto-tune.
• Critically coupling cavity. The iris motor has reachedboth of its limit switches and has been unable to obtain adiode current of 200 microamperes. Check if the iris motor isstill connected to the screw and that the limit switches havebeen set properly. (See Section 5.2.) If you are using a flatcell when this happens, it is likely that you need to adjust theposition of the flat cell. It is easier to optimize the cavity dipif you adjust the flat cell while you are looking at the tuningpicture. If this error occurs during fine-tune, try auto-tune.
No Tuning Picture
7-4
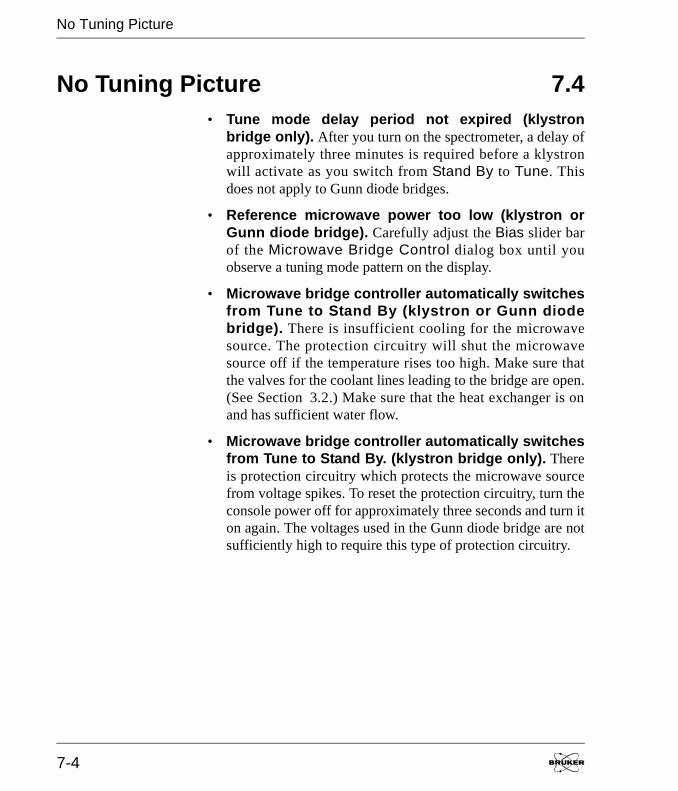
No Tuning Picture 7.4• Tune mode delay period not expired (klystron
bridge only). After you turn on the spectrometer, a delay ofapproximately three minutes is required before a klystronwill activate as you switch from Stand By to Tune. Thisdoes not apply to Gunn diode bridges.
• Reference microwave power too low (klystron orGunn diode bridge). Carefully adjust the Bias slider barof the Microwave Bridge Control dialog box until youobserve a tuning mode pattern on the display.
• Microwave bridge controller automatically switchesfrom Tune to Stand By (klystron or Gunn diodebridge). There is insufficient cooling for the microwavesource. The protection circuitry will shut the microwavesource off if the temperature rises too high. Make sure thatthe valves for the coolant lines leading to the bridge are open.(See Section 3.2.) Make sure that the heat exchanger is onand has sufficient water flow.
• Microwave bridge controller automatically switchesfrom Tune to Stand By. (klystron bridge only). Thereis protection circuitry which protects the microwave sourcefrom voltage spikes. To reset the protection circuitry, turn theconsole power off for approximately three seconds and turn iton again. The voltages used in the Gunn diode bridge are notsufficiently high to require this type of protection circuitry.
Unable to Critically Couple Cavity
EMX User’s Manual 7-5
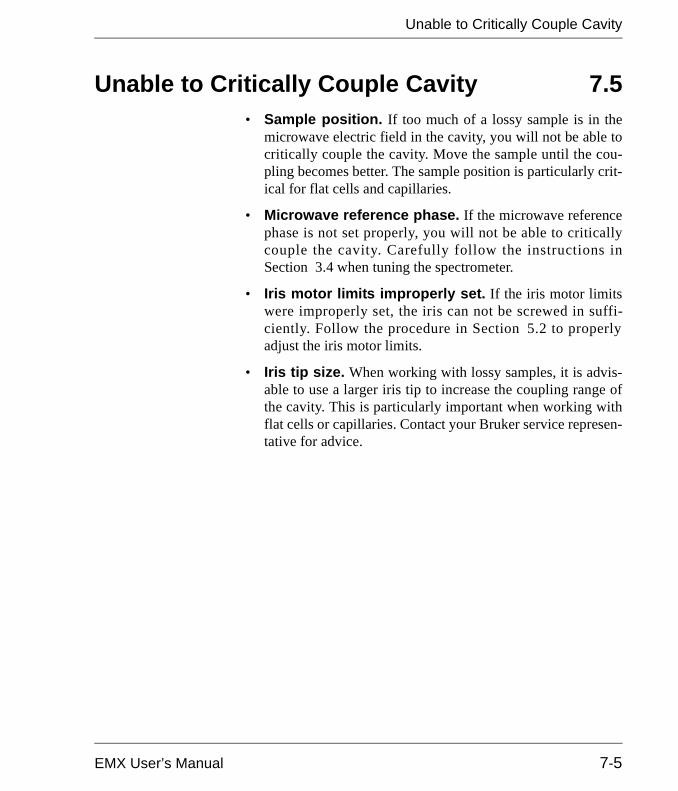
Unable to Critically Couple Cavity 7.5• Sample position. If too much of a lossy sample is in the
microwave electric field in the cavity, you will not be able tocritically couple the cavity. Move the sample until the cou-pling becomes better. The sample position is particularly crit-ical for flat cells and capillaries.
• Microwave reference phase. If the microwave referencephase is not set properly, you will not be able to criticallycouple the cavity. Carefully follow the instructions inSection 3.4 when tuning the spectrometer.
• Iris motor limits improperly set. If the iris motor limitswere improperly set, the iris can not be screwed in suffi-ciently. Follow the procedure in Section 5.2 to properlyadjust the iris motor limits.
• Iris tip size. When working with lossy samples, it is advis-able to use a larger iris tip to increase the coupling range ofthe cavity. This is particularly important when working withflat cells or capillaries. Contact your Bruker service represen-tative for advice.

Magnet Power Supply Shuts Down
7-6
Magnet Power Supply Shuts Down 7.6• Insufficient cooling capacity. Make sure that the heat
exchanger is on and that there is sufficient cold water flowingthrough it. Either the Ext. or Temp. warning LED's on themagnet power supply will light up with this fault.
• Hall probe inserted with the wrong polarity. The mag-netic field will go to the maximum field.
• Hall probe fallen out of the magnetic air gap. If theHall probe has fallen from the pole piece of the magnet, thepower supply may go to the maximum current value.
Baseline Distortion
EMX User’s Manual 7-7
Baseline Distortion 7.7• Linear baseline drifts. The use of very large modulation
fields can produce large eddy currents in the cavity sidewalls. These currents can interact with the magnetic field toproduce a torque on the cavity and create a resonant fre-quency shift. A linear field dependent or modulation ampli-tude dependent baseline is indicative of such an effect. Thisphenomenon should not be observed if the cavity end platesare properly fitted and torqued. Do not attempt to adjust thetorque on the plates. Contact your local Bruker EPR servicerepresentative.
• Slowly and randomly varying baseline. The use ofhigh microwave power or large modulation fields can heatthe cavity and the sample. The ensuing thermal drifts in thecoupling of the cavity, as well as the frequency of the cavity,can result in a fluctuating offset in the signal. Allow the tunedcavity and sample to come to thermal equilibrium before per-forming the final tuning of the cavity. Once the cavity isequilibrated and properly tuned under the equilibrated condi-tion, you can start acquiring a spectrum. Avoid air draftsaround the cavity, as they can randomly change the tempera-ture of the cavity and sample and hence, the baseline of thespectrum.
Baseline Distortion
7-8
• Variable temperature operation. Cavity frequency andcoupling instability may be induced during variable tempera-ture operation, especially at very low or very high tempera-tures. Increase the flow rate of the cavity and waveguidepurging gas as the operating temperature departs further fromroom temperature. Wait for the cavity to stabilize at each newoperating temperature before recording the spectrum. Retunethe cavity to compensate for any frequency shift andre-establish critical coupling at each temperature.
• Background signal. Your cavity, cryostat, sample tube, orsample may be contaminated. Call your local Bruker EPRService representative for advice. Never take the cavity apartto clean it.
Excessive Noise Output
EMX User’s Manual 7-9
Excessive Noise Output 7.8• Electromagnetic interference. Verify that laboratory
equipment is not a source of electromagnetic interference(EMI). If possible, turn off all other equipment in the labora-tory and observe spectrometer noise output. Determine ifradio, microwave, or TV broadcasting stations are operatingin proximity to the spectrometer. Record the noise level whileoperating at various times of the day and night. EMI relatednoise will often be reduced at night.
• Power line noise. Check the noise content of the ACpower lines feeding the spectrometer. Line transients ormomentary blackouts will drastically degrade the perfor-mance of high gain detection systems such as EPR spectrom-eters.
• Ground loops. Ground loops are very common and oftendifficult to avoid. Disconnect accessory equipment, espe-cially if it is plugged into remote AC outlets and observe thenoise level. Turn off the magnet power supply and observethe noise level. If the noise level changes during either ofthese tests, consult your local Bruker EPR service representa-tive for alternate installation planning.
Excessive Noise Output
7-10
• Microphonic generated noise. Secure the waveguideand cavity assembly by using the plastic waveguide stabiliz-ers. Secure the sample firmly in the collet. If you use a cry-ostat, make sure that the cryostat sits firmly in the cavity.Make sure that an excessive nitrogen gas flow rate throughthe cryostat does not vibrate the sample.
• Worn iris screw. Check for a worn iris coupling screw. Aniris screw that does not fit snugly in the waveguide may gen-erate noise by modulating the cavity coupling. Replace theworn iris screw with a new one.
• Boiling liquids. If you are using a dewar with a boilingrefrigerant such as liquid nitrogen, you will need to increasethe AFC modulation level.
Poor Sensitivity
EMX User’s Manual 7-11
Poor Sensitivity 7.9• Excessive microwave power. The microwave power
may be set too high, which will cause your sample to satu-rate. Optimize the power for your sample by recording spec-tra at a variety of power levels.
• Wrong cavity type for sample. The type of cavity youuse for a particular sample can make a large difference insensitivity. Consult the Bruker literature on the full line ofEPR cavities to determine which one is best for your sam-ples.
• Low cavity Q. The cavity Q can be degraded because ofimproper sample positioning. Having your sample positionedin the microwave electric field will reduce the sensitivity bydegrading the cavity Q, especially for samples with highdielectric loss. This can happen if you are using flat cells orcapillaries. Observe the Q value read-out in the microwavebridge dialog box when you are adjusting the sample posi-tion.
• Cavity not critically coupled. Maximum power is trans-ferred between the cavity and waveguide when the cavityproperly matches the impedance of the waveguide, (i.e., iscritically coupled.). A drastically undercoupled iris will nottransmit power to the cavity and so will not excite EPR tran-sitions. A drastically overcoupled cavity will have a lower Q,resulting in lower sensitivity. These effects can occur whenusing lossy samples such as aqueous solutions or conductingsamples.
Poor Sensitivity
7-12
• Water condensation. During low temperature operation,water can condense inside the cavity. Water, being a highdielectric loss material, will absorb the microwave power inthe cavity and destroy the cavity Q. Avoid condensation byusing a purging nitrogen gas flow through the cavity.
• Signal channel not calibrated. The modulation ampli-tude and phase of the signal channel may not be properly cal-ibrated. Make sure that you load the proper calibration fileinto the data system. Also, make sure that the Calibratedcheck button in the Interactive Spectrometer Control dia-log box is not un-checked.
• Receiver gain or modulation not optimized. SeeSection 6.2.2.
• Sample not positioned properly. Center your sample inthe cavity.
Poor Resolution
EMX User’s Manual 7-13
Poor Resolution 7.10• Microwave power set too high. Saturating microwave
power levels will broaden your resonance line. Verify that thelinewidth is independent of the microwave power level byrecording the spectrum at various power levels.
• Modulation amplitude set too high. Large field modu-lation amplitudes will broaden your resonance line, particu-larly as the modulation amplitude approaches the linewidth.Reduce the modulation amplitude to ensure that the spectrumis independent of the modulat ion ampl i tude. (SeeFigure 6-8.)
• Modulation frequency set too high. The spectral reso-lution is limited by the field equivalence of the modulationfrequency used. Reduce the modulation frequency to verifythat the linewidth is independent of the frequency. (SeeFigure 2-17.)
• Time constant too long for sweep time. A larger timeconstant will begin to filter out the high frequency compo-nents of your signal. Consequently, if the sweep rate is toofast relative to the time constant, the spectrum will appeardistorted and broadened. To avoid this problem make surethat the time required to sweep through one of your EPRlines is at least ten times the length of the time constant. (SeeFigure 6-6.)
Poor Resolution
7-14
• Magnetic field inhomogeneities or gradients.Extremely narrow lines, less than 20 milliGauss, may be lim-ited by magnetic field irregularities. Vary the position of thecavity in the magnet air gap. If the linewidth changes, checkfor magnetic objects in or around the magnet. If possible,suspend these objects by a string and watch for a deflectionin the same field strength as used in the experiment. Do notattempt this with the cavity in the magnet. The force of a fer-romagnetic object being pulled into the magnet air gap cancause serious damage to accessories in the air gap.
• Spectrometer not thermally stabilized. Be sure that thespectrometer has been turned on for several hours. Verify thatthe laboratory conditions are within specified limitations, i.e.,temperature fluctuations, etc.
Lineshape Distortion
EMX User’s Manual 7-15
Lineshape Distortion 7.11• Microwave power too high. The effect of saturating
microwave fields is to broaden the resonance. This is easilyapparent for single structureless lines; however, small split-tings may become unresolvable if strongly saturating levelsof microwave power is used. Lower the microwave poweruntil you obtain a power independent lineshape.
• Modulation amplitude too high. Large field modulationwill broaden the resonance line. Lower the modulationamplitude to a region where the lineshape is independent ofthe modulation amplitude. (See Figure 6-8.)
• Time constant too long for sweep time used. A saferule of thumb is that the time required to sweep through anEPR line should be ten times the length of the time constant.(See Figure 6-6.)
• Modulation frequency too high. The modulation fre-quency can determine the resolution of the experiment. Thespectral profile may also change, due to the effect of molecu-lar dynamics, if saturating microwave fields are applied.These effects are especially pronounced if the motional fre-quency for the spin dynamics is similar to the applied modu-lation frequency. The technique of saturation transfer is basedon this mechanism. The spectral profile may change mark-edly if the modulation frequency is varied while applyingstrong microwave fields. (See Figure 2-17.)
• Magnetic field gradients. These may produce highlyasymmetric lineshapes. Reposition the cavity within the mag-net air gap to check the magnet for homogeneity. Check formagnetic objects in or around air gap. Magnetic field inho-mogeneity could also broaden the response to obscure split-tings by overlapping spectral components.
Lineshape Distortion
7-16
• Anisotropic g matrix. A highly anisotropic g-matrix natu-rally produces asymmetric lines.
• Background signal. A strong background signal fromcontamination of the EPR cavity or the sample can distortyour EPR spectrum.
• High conductivity. High conductivity exhibited by sam-ples with mobile electrons will result in asymmetric linesknown as Dysonian lineshapes. This results from a mixing ofabsorption and dispersion components induced in the sampleitself.
• Lossy samples. If you put large lossy samples in a cavity,you can also obtain Dysonian lineshapes. Use progressivelysmaller capillaries until you obtain a symmetric lineshape.
• Microwave reference phase. The dispersion signal fromeasily saturated samples can be very large compared to theabsorption signal. To minimize the contribution of the disper-sion signal, carefully adjust the microwave reference phase.In addition, make sure that the AFC offset is close to zero.
• Magnetic field drifts. Magnetic field drift may produce anasymmetric or distorted line for samples exhibiting very nar-row resonance linewidths. This problem may arise for line-widths less than 20 mG. Use a field-frequency lock system toeliminate field drift problems.
Warning Noises
EMX User’s Manual 7-17
No Signal When Everything Works 7.12• Check cables. Make sure that all the cables are connected.
Check the modulation cable and the preamplifier cable.
• Sample position. If you have a small sample, make surethat the sample is centered in the cavity.
• Magnetic field values. Are you using the correct field val-ues to see your EPR signal? If you are using a cryostat,remember that the microwave frequency drops and hence thefield for resonance will also be lower. Is the Hall probe posi-tioned properly in the magnet?
Warning Noises 7.13• High pitched noise from the heat exchanger. The
heat exchanger will emit a high pitched noise when itrequires more distilled and deionized water.
• Funny noises from the iris motor. Stop turning the irismotor immediately. You may be breaking the iris screw.


![[PPT]Slide 1 - Department of Chemistry & Biochemistry |cbc-wb01x.chemistry.ohio-state.edu/~chisholm/archive... · Web viewFuel Cells: Fundamentals, Types, and Fuel Storage Carly Reed](https://img.pdfslide.net/doc/110x75/5aa3c74d7f8b9aa0108f0245/pptslide-1-department-of-chemistry-biochemistry-cbc-wb01x-chisholmarchiveweb.jpg)