Embed Size (px)
Citation preview
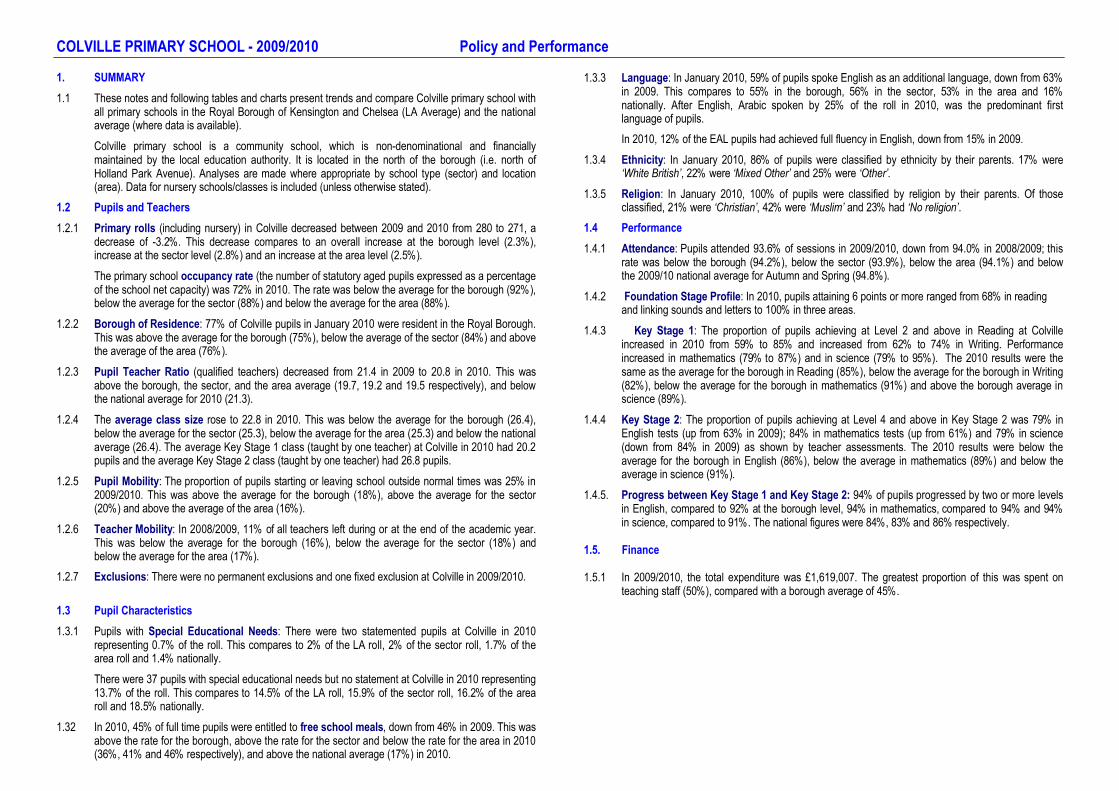
COLVILLE PRIMARY SCHOOL - 2009/2010 Policy and Performance
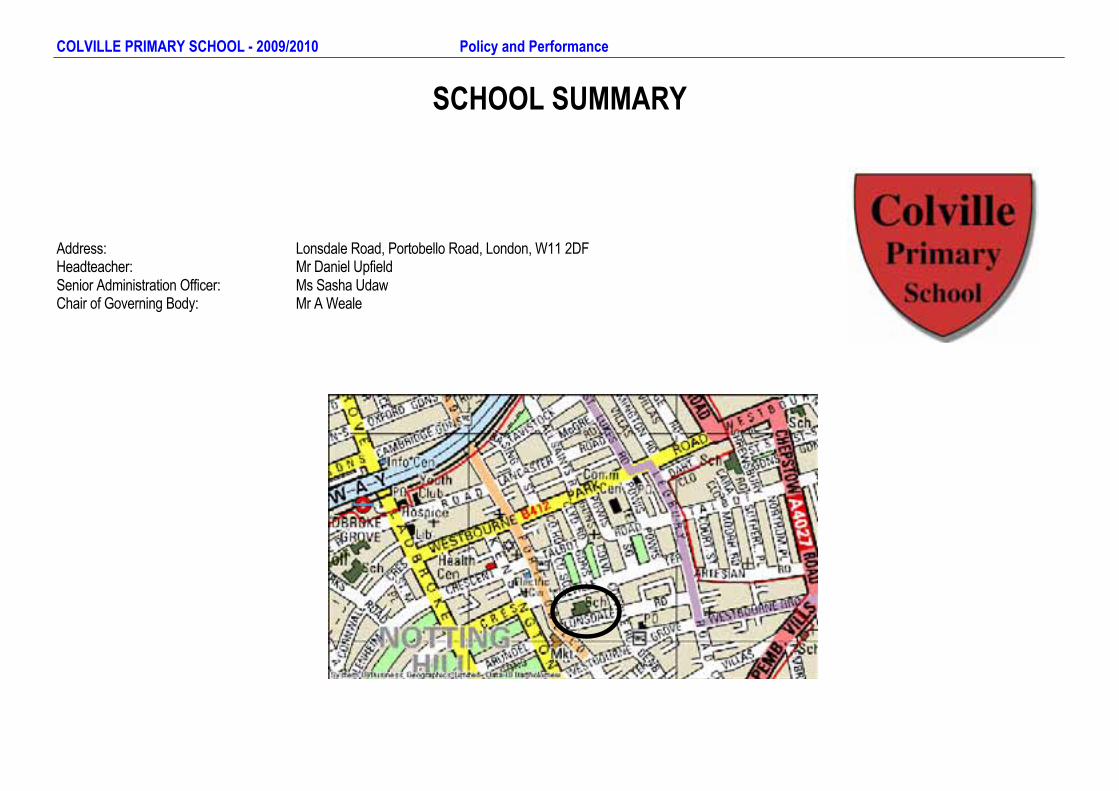
SCHOOL SUMMARY
Address: Lonsdale Road, Portobello Road, London, W11 2DFHeadteacher: Mr Daniel UpfieldSenior Administration Officer: Ms Sasha UdawChair of Governing Body: Mr A Weale

COLVILLE PRIMARY SCHOOL - 2009/2010 Policy and Performance
1. SUMMARY1.1 These notes and following tables and charts present trends and compare Colville primary school with
all primary schools in the Royal Borough of Kensington and Chelsea (LA Average) and the national average (where data is available).Colville primary school is a community school, which is non-denominational and financially maintained by the local education authority. It is located in the north of the borough (i.e. north of Holland Park Avenue). Analyses are made where appropriate by school type (sector) and location (area). Data for nursery schools/classes is included (unless otherwise stated).
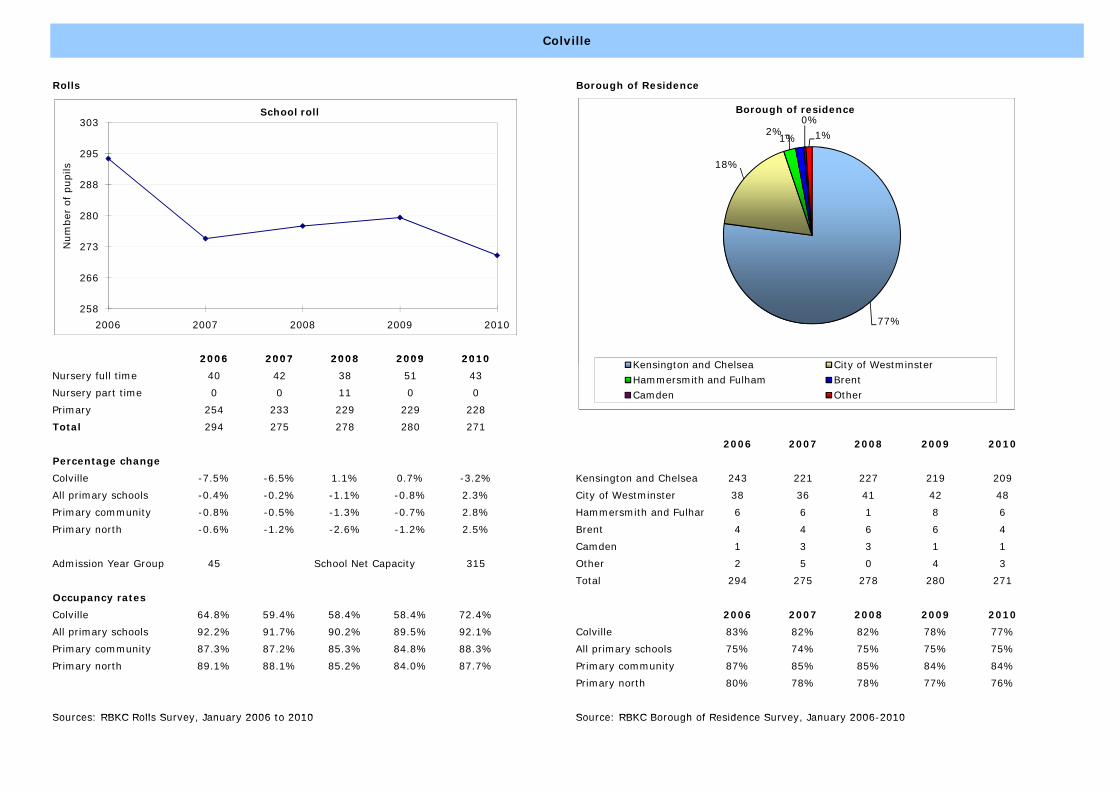
1.2 Pupils and Teachers1.2.1 Primary rolls (including nursery) in Colville decreased between 2009 and 2010 from 280 to 271, a
decrease of -3.2%. This decrease compares to an overall increase at the borough level (2.3%), increase at the sector level (2.8%) and an increase at the area level (2.5%). The primary school occupancy rate (the number of statutory aged pupils expressed as a percentage of the school net capacity) was 72% in 2010. The rate was below the average for the borough (92%), below the average for the sector (88%) and below the average for the area (88%).
1.2.2 Borough of Residence: 77% of Colville pupils in January 2010 were resident in the Royal Borough. This was above the average for the borough (75%), below the average of the sector (84%) and above the average of the area (76%).
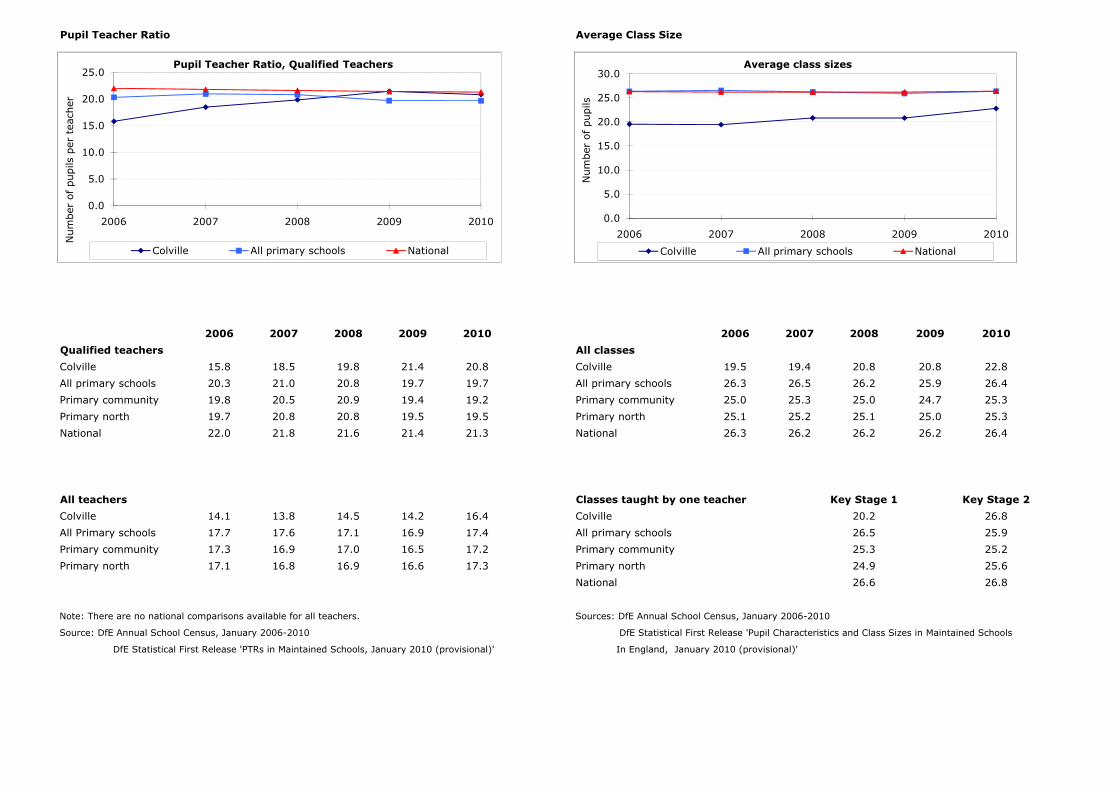
1.2.3 Pupil Teacher Ratio (qualified teachers) decreased from 21.4 in 2009 to 20.8 in 2010. This was above the borough, the sector, and the area average (19.7, 19.2 and 19.5 respectively), and belowthe national average for 2010 (21.3).
1.2.4 The average class size rose to 22.8 in 2010. This was below the average for the borough (26.4), below the average for the sector (25.3), below the average for the area (25.3) and below the national average (26.4). The average Key Stage 1 class (taught by one teacher) at Colville in 2010 had 20.2pupils and the average Key Stage 2 class (taught by one teacher) had 26.8 pupils.
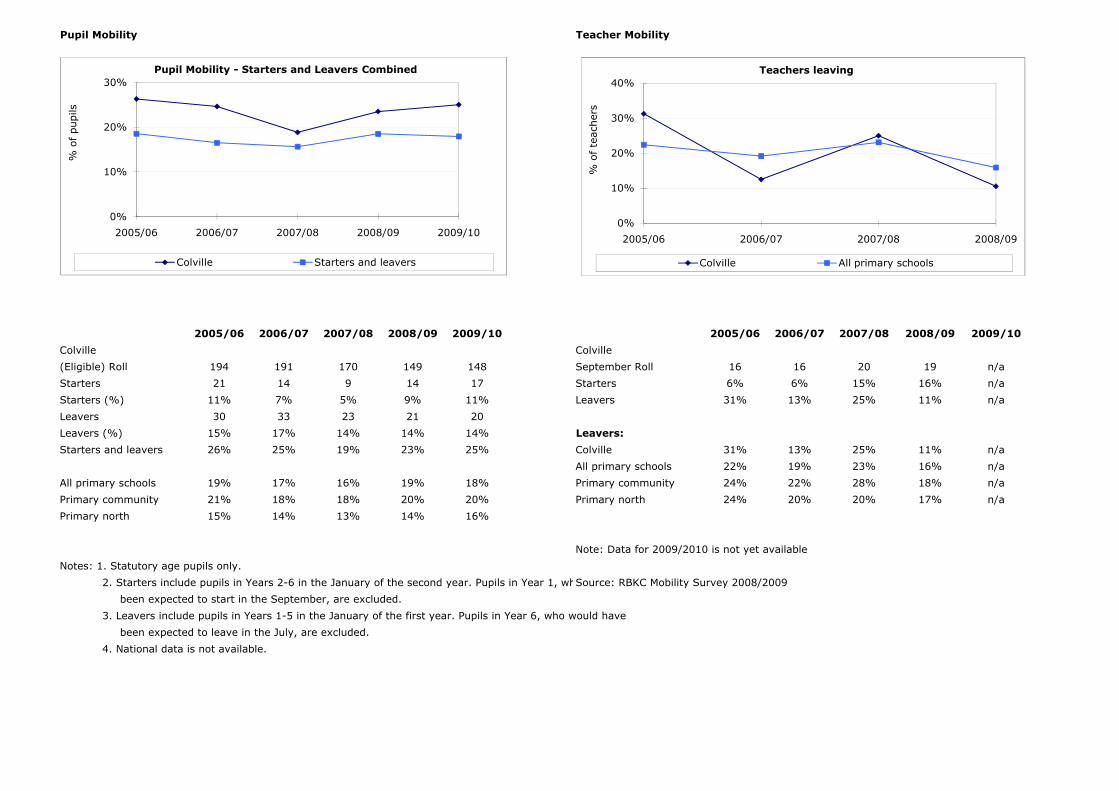
1.2.5 Pupil Mobility: The proportion of pupils starting or leaving school outside normal times was 25% in 2009/2010. This was above the average for the borough (18%), above the average for the sector (20%) and above the average of the area (16%).
1.2.6 Teacher Mobility: In 2008/2009, 11% of all teachers left during or at the end of the academic year. This was below the average for the borough (16%), below the average for the sector (18%) and below the average for the area (17%).
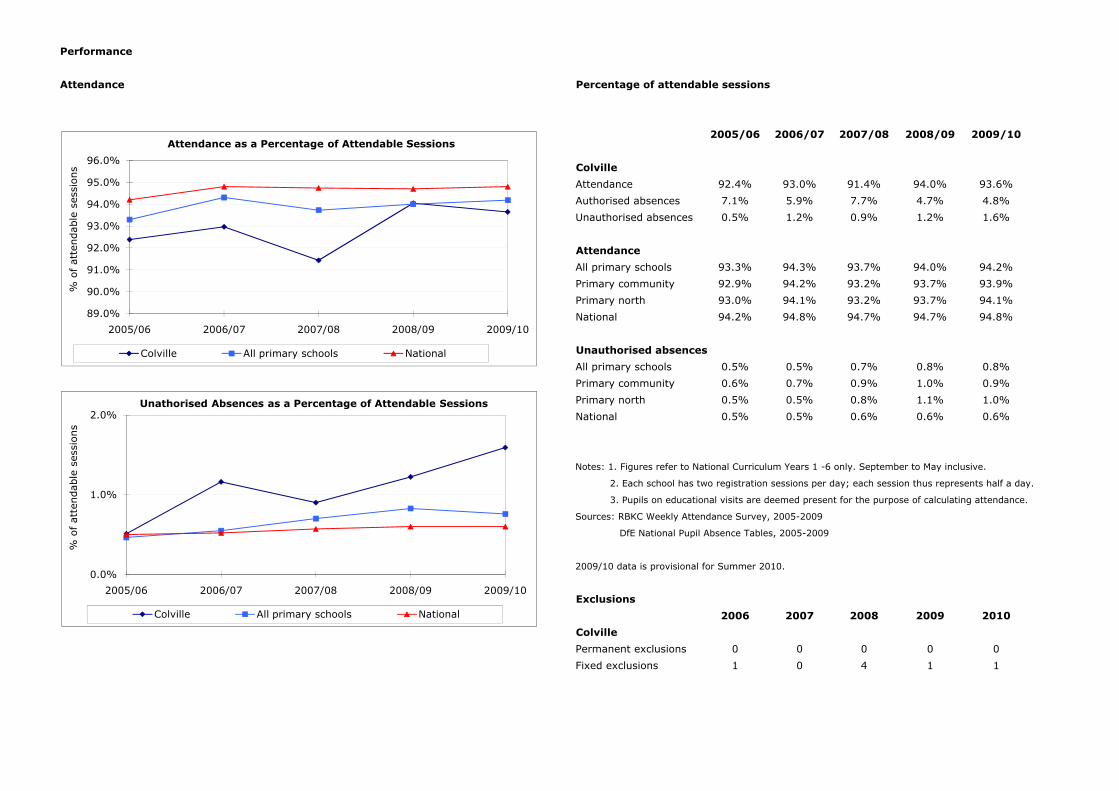
1.2.7 Exclusions: There were no permanent exclusions and one fixed exclusion at Colville in 2009/2010.
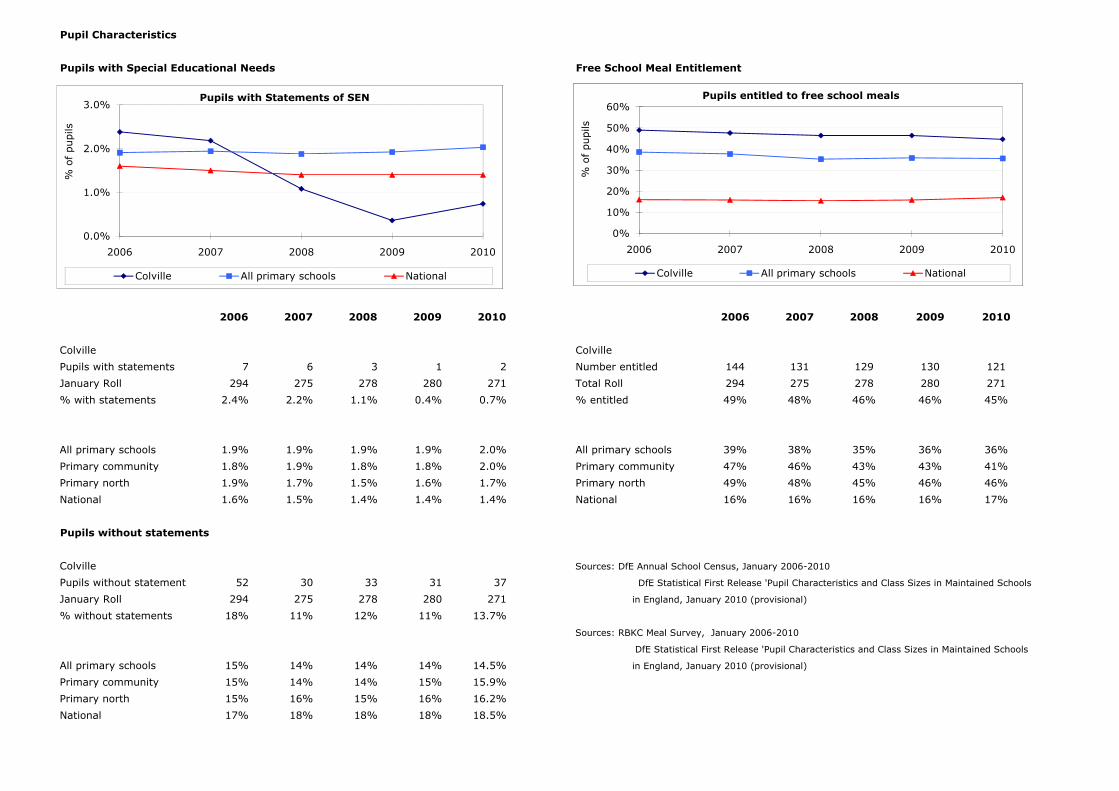
1.3 Pupil Characteristics1.3.1 Pupils with Special Educational Needs: There were two statemented pupils at Colville in 2010
representing 0.7% of the roll. This compares to 2% of the LA roll, 2% of the sector roll, 1.7% of thearea roll and 1.4% nationally.There were 37 pupils with special educational needs but no statement at Colville in 2010 representing 13.7% of the roll. This compares to 14.5% of the LA roll, 15.9% of the sector roll, 16.2% of the area roll and 18.5% nationally.
1.32 In 2010, 45% of full time pupils were entitled to free school meals, down from 46% in 2009. This was above the rate for the borough, above the rate for the sector and below the rate for the area in 2010(36%, 41% and 46% respectively), and above the national average (17%) in 2010.
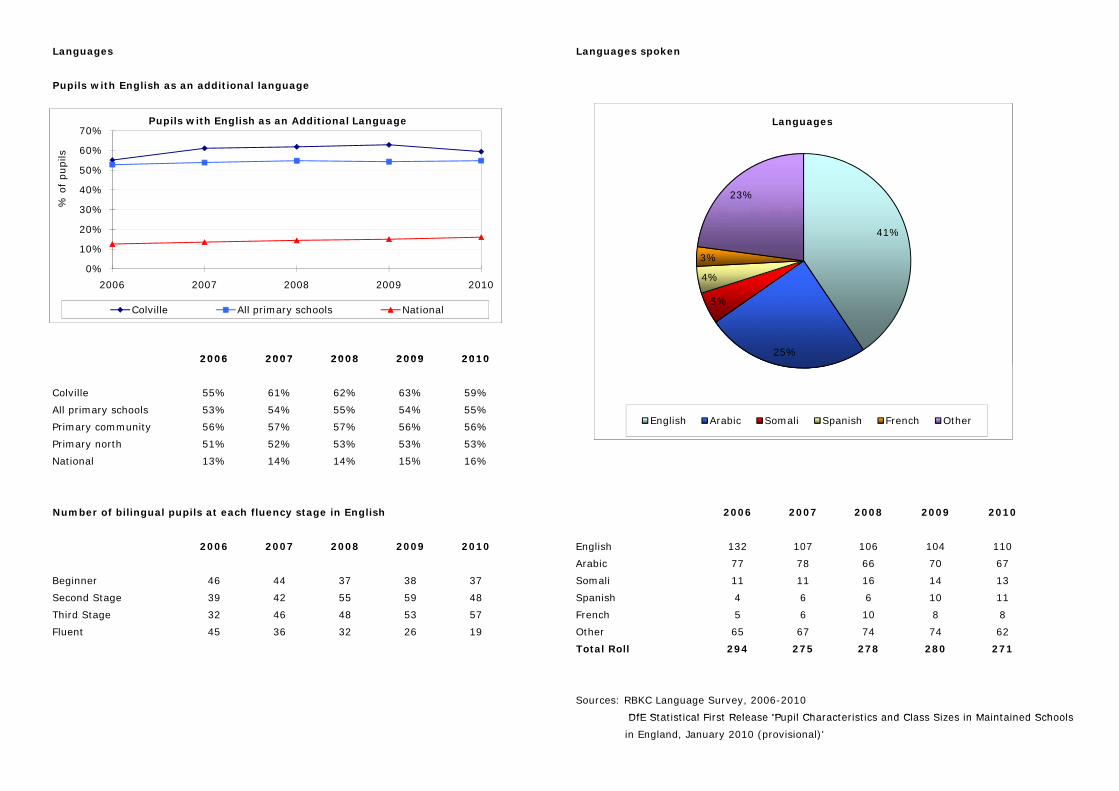
1.3.3 Language: In January 2010, 59% of pupils spoke English as an additional language, down from 63% in 2009. This compares to 55% in the borough, 56% in the sector, 53% in the area and 16% nationally. After English, Arabic spoken by 25% of the roll in 2010, was the predominant first language of pupils.In 2010, 12% of the EAL pupils had achieved full fluency in English, down from 15% in 2009.
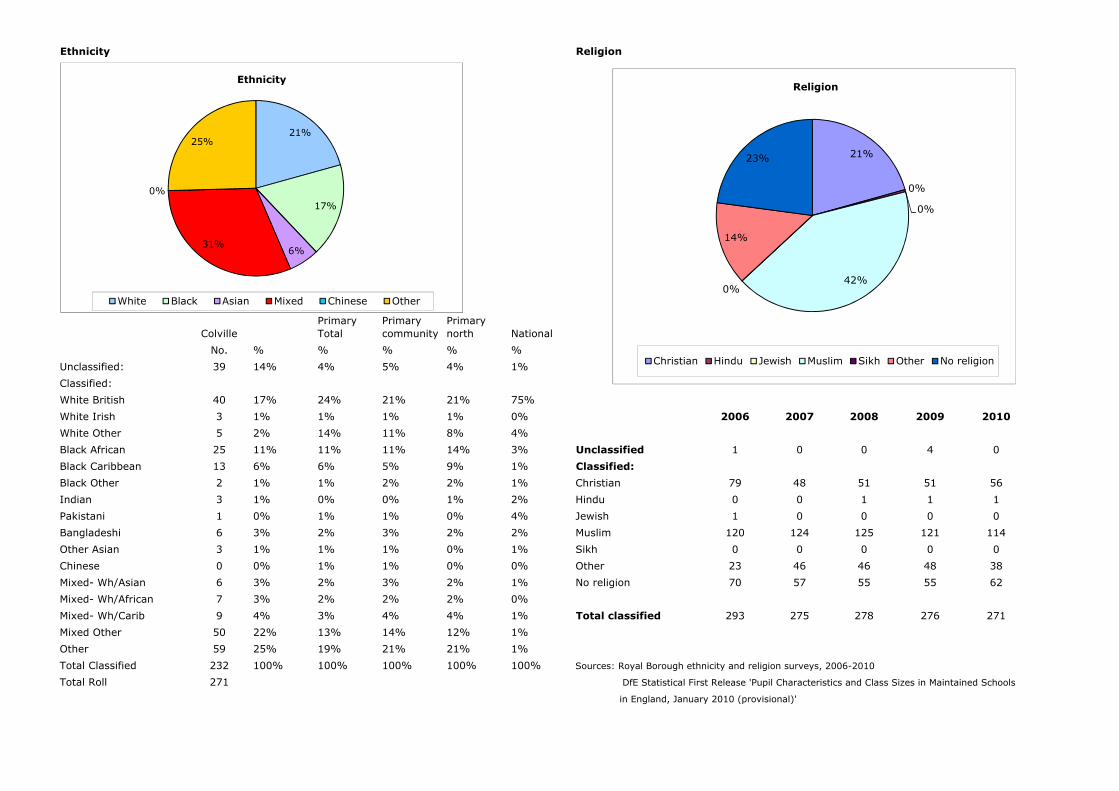
1.3.4 Ethnicity: In January 2010, 86% of pupils were classified by ethnicity by their parents. 17% were ‘White British’, 22% were ‘Mixed Other’ and 25% were ‘Other’.
1.3.5 Religion: In January 2010, 100% of pupils were classified by religion by their parents. Of those classified, 21% were ‘Christian’, 42% were ‘Muslim’ and 23% had ‘No religion’.
1.4 Performance1.4.1 Attendance: Pupils attended 93.6% of sessions in 2009/2010, down from 94.0% in 2008/2009; this
rate was below the borough (94.2%), below the sector (93.9%), below the area (94.1%) and below the 2009/10 national average for Autumn and Spring (94.8%).
1.4.2 Foundation Stage Profile: In 2010, pupils attaining 6 points or more ranged from 68% in readingand linking sounds and letters to 100% in three areas.
1.4.3 Key Stage 1: The proportion of pupils achieving at Level 2 and above in Reading at Colville increased in 2010 from 59% to 85% and increased from 62% to 74% in Writing. Performance increased in mathematics (79% to 87%) and in science (79% to 95%). The 2010 results were the same as the average for the borough in Reading (85%), below the average for the borough in Writing (82%), below the average for the borough in mathematics (91%) and above the borough average in science (89%).
1.4.4 Key Stage 2: The proportion of pupils achieving at Level 4 and above in Key Stage 2 was 79% in English tests (up from 63% in 2009); 84% in mathematics tests (up from 61%) and 79% in science (down from 84% in 2009) as shown by teacher assessments. The 2010 results were below the average for the borough in English (86%), below the average in mathematics (89%) and below the average in science (91%).
1.4.5. Progress between Key Stage 1 and Key Stage 2: 94% of pupils progressed by two or more levels in English, compared to 92% at the borough level, 94% in mathematics, compared to 94% and 94% in science, compared to 91%. The national figures were 84%, 83% and 86% respectively.
1.5. Finance
1.5.1 In 2009/2010, the total expenditure was £1,619,007. The greatest proportion of this was spent on teaching staff (50%), compared with a borough average of 45%.

Rolls Borough of Residence
2006 2007 2008 2009 2010
Colville
258
266
273
280
288
295
303
2006 2007 2008 2009 2010
Num
ber
of pupils
School roll
77%
18%
2%1%
0%
1%
Borough of residence
Kensington and Chelsea City of Westminster2006 2007 2008 2009 2010
Nursery full time 40 42 38 51 43
Nursery part time 0 0 11 0 0
Primary 254 233 229 229 228
Total 294 275 278 280 271
2006 2007 2008 2009 2010
Percentage change
Colville -7.5% -6.5% 1.1% 0.7% -3.2% Kensington and Chelsea 243 221 227 219 209
All primary schools -0.4% -0.2% -1.1% -0.8% 2.3% City of Westminster 38 36 41 42 48
Primary community -0.8% -0.5% -1.3% -0.7% 2.8% Hammersmith and Fulham 6 6 1 8 6
Primary north -0.6% -1.2% -2.6% -1.2% 2.5% Brent 4 4 6 6 4
Camden 1 3 3 1 1
Admission Year Group 45 School Net Capacity 315 Other 2 5 0 4 3
Total 294 275 278 280 271
Occupancy rates
Colville 64.8% 59.4% 58.4% 58.4% 72.4% 2006 2007 2008 2009 2010
All primary schools 92.2% 91.7% 90.2% 89.5% 92.1% Colville 83% 82% 82% 78% 77%
Primary community 87.3% 87.2% 85.3% 84.8% 88.3% All primary schools 75% 74% 75% 75% 75%
Primary north 89.1% 88.1% 85.2% 84.0% 87.7% Primary community 87% 85% 85% 84% 84%
Primary north 80% 78% 78% 77% 76%
Sources: RBKC Rolls Survey January 2006 to 2010 Source: RBKC Borough of Residence Survey January 2006 2010
258
266
273
280
288
295
303
2006 2007 2008 2009 2010
Num
ber
of pupils
School roll
77%
18%
2%1%
0%
1%
Borough of residence
Kensington and Chelsea City of WestminsterHammersmith and Fulham BrentCamden Other
Sources: RBKC Rolls Survey, January 2006 to 2010 Source: RBKC Borough of Residence Survey, January 2006-2010
258
266
273
280
288
295
303
2006 2007 2008 2009 2010
Num
ber
of pupils
School roll
77%
18%
2%1%
0%
1%
Borough of residence
Kensington and Chelsea City of WestminsterHammersmith and Fulham BrentCamden Other
Pupil Teacher Ratio Average Class Size
2006 2007 2008 2009 2010 2006 2007 2008 2009 2010
Qualified teachers All classes
Colville 15.8 18.5 19.8 21.4 20.8 Colville 19.5 19.4 20.8 20.8 22.8
All primary schools 20.3 21.0 20.8 19.7 19.7 All primary schools 26.3 26.5 26.2 25.9 26.4
Primary community 19.8 20.5 20.9 19.4 19.2 Primary community 25.0 25.3 25.0 24.7 25.3
Primary north 19.7 20.8 20.8 19.5 19.5 Primary north 25.1 25.2 25.1 25.0 25.3
National 22.0 21.8 21.6 21.4 21.3 National 26.3 26.2 26.2 26.2 26.4
All teachers Classes taught by one teacher Key Stage 1 Key Stage 2
Colville 14.1 13.8 14.5 14.2 16.4 Colville 20.2 26.8
All Primary schools 17.7 17.6 17.1 16.9 17.4 All primary schools 26.5 25.9
Primary community 17.3 16.9 17.0 16.5 17.2 Primary community 25.3 25.2
Primary north 17.1 16.8 16.9 16.6 17.3 Primary north 24.9 25.6
National 26.6 26.8
Note: There are no national comparisons available for all teachers. Sources: DfE Annual School Census, January 2006-2010
Source: DfE Annual School Census, January 2006-2010 DfE Statistical First Release 'Pupil Characteristics and Class Sizes in Maintained Schools
DfE Statistical First Release 'PTRs in Maintained Schools, January 2010 (provisional)' In England, January 2010 (provisional)'
0.0
5.0
10.0
15.0
20.0
25.0
2006 2007 2008 2009 2010
Num
ber
of pupils
per
tea
cher
Pupil Teacher Ratio, Qualified Teachers
Colville All primary schools National
0.0
5.0
10.0
15.0
20.0
25.0
30.0
2006 2007 2008 2009 2010
Num
ber
of pupils
Average class sizes
Colville All primary schools National
Pupil Mobility Teacher Mobility
2005/06 2006/07 2007/08 2008/09 2009/10 2005/06 2006/07 2007/08 2008/09 2009/10
Colville Colville
(Eligible) Roll 194 191 170 149 148 September Roll 16 16 20 19 n/a
Starters 21 14 9 14 17 Starters 6% 6% 15% 16% n/a
Starters (%) 11% 7% 5% 9% 11% Leavers 31% 13% 25% 11% n/a
Leavers 30 33 23 21 20
Leavers (%) 15% 17% 14% 14% 14% Leavers:
Starters and leavers 26% 25% 19% 23% 25% Colville 31% 13% 25% 11% n/a
All primary schools 22% 19% 23% 16% n/a
All primary schools 19% 17% 16% 19% 18% Primary community 24% 22% 28% 18% n/a
Primary community 21% 18% 18% 20% 20% Primary north 24% 20% 20% 17% n/a
Primary north 15% 14% 13% 14% 16%
Note: Data for 2009/2010 is not yet available
Notes: 1. Statutory age pupils only.
2. Starters include pupils in Years 2-6 in the January of the second year. Pupils in Year 1, who would have Source: RBKC Mobility Survey 2008/2009
been expected to start in the September, are excluded.
3. Leavers include pupils in Years 1-5 in the January of the first year. Pupils in Year 6, who would have
been expected to leave in the July, are excluded.
4. National data is not available.
0%
10%
20%
30%
2005/06 2006/07 2007/08 2008/09 2009/10
% o
f pupils
Pupil Mobility - Starters and Leavers Combined
Colville Starters and leavers
0%
10%
20%
30%
40%
2005/06 2006/07 2007/08 2008/09
% o
f te
acher
s
Teachers leaving
Colville All primary schools
Pupil Characteristics
Pupils with Special Educational Needs Free School Meal Entitlement
2006 2007 2008 2009 2010 2006 2007 2008 2009 2010
Colville Colville
Pupils with statements 7 6 3 1 2 Number entitled 144 131 129 130 121
January Roll 294 275 278 280 271 Total Roll 294 275 278 280 271
% with statements 2.4% 2.2% 1.1% 0.4% 0.7% % entitled 49% 48% 46% 46% 45%
All primary schools 1.9% 1.9% 1.9% 1.9% 2.0% All primary schools 39% 38% 35% 36% 36%
Primary community 1.8% 1.9% 1.8% 1.8% 2.0% Primary community 47% 46% 43% 43% 41%
Primary north 1.9% 1.7% 1.5% 1.6% 1.7% Primary north 49% 48% 45% 46% 46%
National 1.6% 1.5% 1.4% 1.4% 1.4% National 16% 16% 16% 16% 17%
Pupils without statements
Colville Sources: DfE Annual School Census, January 2006-2010
Pupils without statements 52 30 33 31 37 DfE Statistical First Release 'Pupil Characteristics and Class Sizes in Maintained Schools
January Roll 294 275 278 280 271 in England, January 2010 (provisional)
% without statements 18% 11% 12% 11% 13.7%
Sources: RBKC Meal Survey, January 2006-2010
DfE Statistical First Release 'Pupil Characteristics and Class Sizes in Maintained Schools
All primary schools 15% 14% 14% 14% 14.5% in England, January 2010 (provisional)
Primary community 15% 14% 14% 15% 15.9%
Primary north 15% 16% 15% 16% 16.2%
National 17% 18% 18% 18% 18.5%
0.0%
1.0%
2.0%
3.0%
2006 2007 2008 2009 2010
% o
f pupils
Pupils with Statements of SEN
Colville All primary schools National
0%
10%
20%
30%
40%
50%
60%
2006 2007 2008 2009 2010
% o
f pupils
Pupils entitled to free school meals
Colville All primary schools National
Languages Languages spoken
Pupils with English as an additional language
2006 2007 2008 2009 2010
0%
10%
20%
30%
40%
50%
60%
70%
2006 2007 2008 2009 2010
% o
f pupils
Pupils with English as an Additional Language
Colville All primary schools National
41%
25%
5%
4%
3%
23%
Languages
2006 2007 2008 2009 2010
Colville 55% 61% 62% 63% 59%
All primary schools 53% 54% 55% 54% 55%
Primary community 56% 57% 57% 56% 56%
Primary north 51% 52% 53% 53% 53%
National 13% 14% 14% 15% 16%
Number of bilingual pupils at each fluency stage in English 2006 2007 2008 2009 2010
2006 2007 2008 2009 2010 English 132 107 106 104 110
Arabic 77 78 66 70 67
Beginner 46 44 37 38 37 Somali 11 11 16 14 13
Second Stage 39 42 55 59 48 Spanish 4 6 6 10 11
Third Stage 32 46 48 53 57 French 5 6 10 8 8
Fluent 45 36 32 26 19 Other 65 67 74 74 62
Total Roll 294 275 278 280 271
Sources: RBKC Language Survey, 2006-2010
DfE Statistical First Release 'Pupil Characteristics and Class Sizes in Maintained Schools
0%
10%
20%
30%
40%
50%
60%
70%
2006 2007 2008 2009 2010
% o
f pupils
Pupils with English as an Additional Language
Colville All primary schools National
41%
25%
5%
4%
3%
23%
Languages
English Arabic Somali Spanish French Other
DfE Statistical First Release 'Pupil Characteristics and Class Sizes in Maintained Schools
in England, January 2010 (provisional)'
0%
10%
20%
30%
40%
50%
60%
70%
2006 2007 2008 2009 2010
% o
f pupils
Pupils with English as an Additional Language
Colville All primary schools National
41%
25%
5%
4%
3%
23%
Languages
English Arabic Somali Spanish French Other
Ethnicity Religion
Colville National
No. % % % % %
Unclassified: 39 14% 4% 5% 4% 1%
Classified:
White British 40 17% 24% 21% 21% 75%
White Irish 3 1% 1% 1% 1% 0% 2006 2007 2008 2009 2010
White Other 5 2% 14% 11% 8% 4%
Black African 25 11% 11% 11% 14% 3% Unclassified 1 0 0 4 0
Black Caribbean 13 6% 6% 5% 9% 1% Classified:
Black Other 2 1% 1% 2% 2% 1% Christian 79 48 51 51 56
Indian 3 1% 0% 0% 1% 2% Hindu 0 0 1 1 1
Pakistani 1 0% 1% 1% 0% 4% Jewish 1 0 0 0 0
Bangladeshi 6 3% 2% 3% 2% 2% Muslim 120 124 125 121 114
Other Asian 3 1% 1% 1% 0% 1% Sikh 0 0 0 0 0
Chinese 0 0% 1% 1% 0% 0% Other 23 46 46 48 38
Mixed- Wh/Asian 6 3% 2% 3% 2% 1% No religion 70 57 55 55 62
Mixed- Wh/African 7 3% 2% 2% 2% 0%
Mixed- Wh/Carib 9 4% 3% 4% 4% 1% Total classified 293 275 278 276 271
Mixed Other 50 22% 13% 14% 12% 1%
Other 59 25% 19% 21% 21% 1%
Total Classified 232 100% 100% 100% 100% 100% Sources: Royal Borough ethnicity and religion surveys, 2006-2010
Total Roll 271 DfE Statistical First Release 'Pupil Characteristics and Class Sizes in Maintained Schools
in England, January 2010 (provisional)'
Primary community
Primary north
Primary Total
21%
17%
6%31%
0%
25%
Ethnicity
White Black Asian Mixed Chinese Other
21%
0%
0%
42%0%
14%
23%
Religion
Christian Hindu Jewish Muslim Sikh Other No religion
Performance
Attendance Percentage of attendable sessions
2005/06 2006/07 2007/08 2008/09 2009/10
Colville
Attendance 92.4% 93.0% 91.4% 94.0% 93.6%
Authorised absences 7.1% 5.9% 7.7% 4.7% 4.8%
Unauthorised absences 0.5% 1.2% 0.9% 1.2% 1.6%
Attendance
All primary schools 93.3% 94.3% 93.7% 94.0% 94.2%
Primary community 92.9% 94.2% 93.2% 93.7% 93.9%
Primary north 93.0% 94.1% 93.2% 93.7% 94.1%
National 94.2% 94.8% 94.7% 94.7% 94.8%
Unauthorised absences
All primary schools 0.5% 0.5% 0.7% 0.8% 0.8%
Primary community 0.6% 0.7% 0.9% 1.0% 0.9%
Primary north 0.5% 0.5% 0.8% 1.1% 1.0%
National 0.5% 0.5% 0.6% 0.6% 0.6%
Notes: 1. Figures refer to National Curriculum Years 1 -6 only. September to May inclusive.
2. Each school has two registration sessions per day; each session thus represents half a day.
3. Pupils on educational visits are deemed present for the purpose of calculating attendance.
Sources: RBKC Weekly Attendance Survey, 2005-2009
DfE National Pupil Absence Tables, 2005-2009
2009/10 data is provisional for Summer 2010.
Exclusions
2006 2007 2008 2009 2010
Colville
Permanent exclusions 0 0 0 0 0
Fixed exclusions 1 0 4 1 1
89.0%
90.0%
91.0%
92.0%
93.0%
94.0%
95.0%
96.0%
2005/06 2006/07 2007/08 2008/09 2009/10
% o
f at
tendab
le s
essi
ons
Attendance as a Percentage of Attendable Sessions
Colville All primary schools National
0.0%
1.0%
2.0%
2005/06 2006/07 2007/08 2008/09 2009/10
% o
f at
tendab
le s
essi
ons
Unathorised Absences as a Percentage of Attendable Sessions
Colville All primary schools National
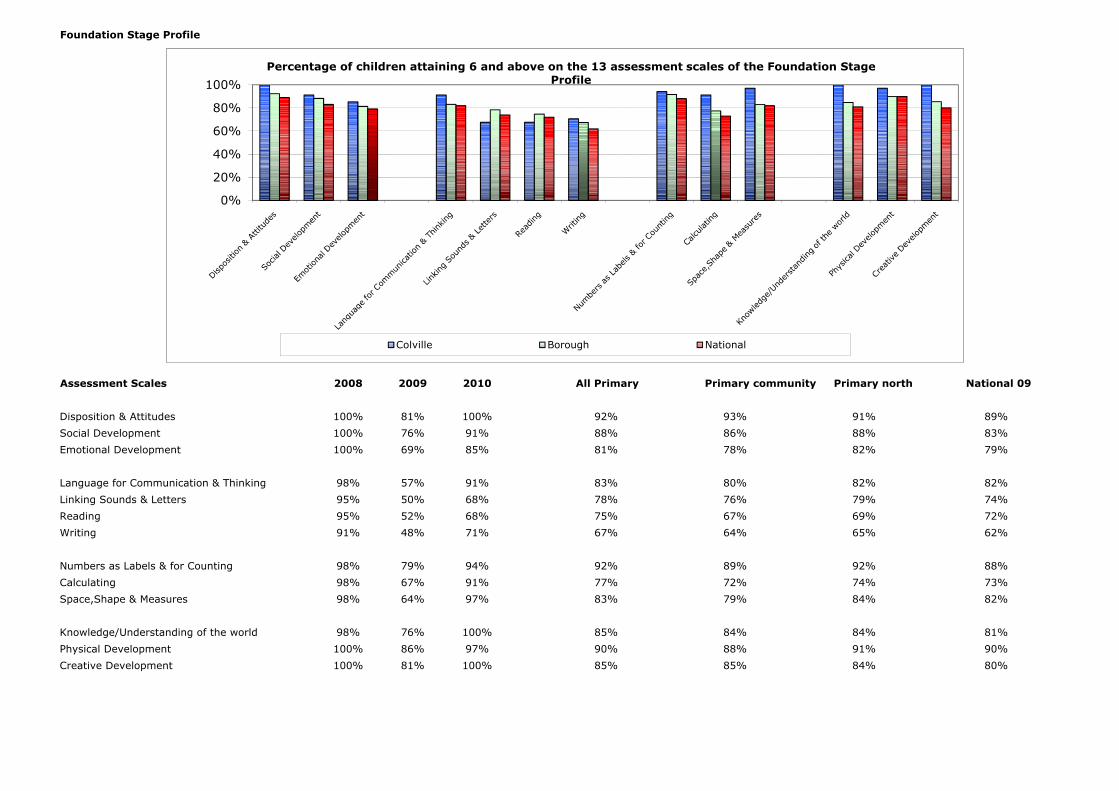
Foundation Stage Profile
Assessment Scales 2008 2009 2010 All Primary Primary community Primary north National 09
Disposition & Attitudes 100% 81% 100% 92% 93% 91% 89%
Social Development 100% 76% 91% 88% 86% 88% 83%
Emotional Development 100% 69% 85% 81% 78% 82% 79%
Language for Communication & Thinking 98% 57% 91% 83% 80% 82% 82%
Linking Sounds & Letters 95% 50% 68% 78% 76% 79% 74%
Reading 95% 52% 68% 75% 67% 69% 72%
Writing 91% 48% 71% 67% 64% 65% 62%
Numbers as Labels & for Counting 98% 79% 94% 92% 89% 92% 88%
Calculating 98% 67% 91% 77% 72% 74% 73%
Space,Shape & Measures 98% 64% 97% 83% 79% 84% 82%
Knowledge/Understanding of the world 98% 76% 100% 85% 84% 84% 81%
Physical Development 100% 86% 97% 90% 88% 91% 90%
Creative Development 100% 81% 100% 85% 85% 84% 80%
0%
20%
40%
60%
80%
100%
Percentage of children attaining 6 and above on the 13 assessment scales of the Foundation Stage Profile
Colville Borough National
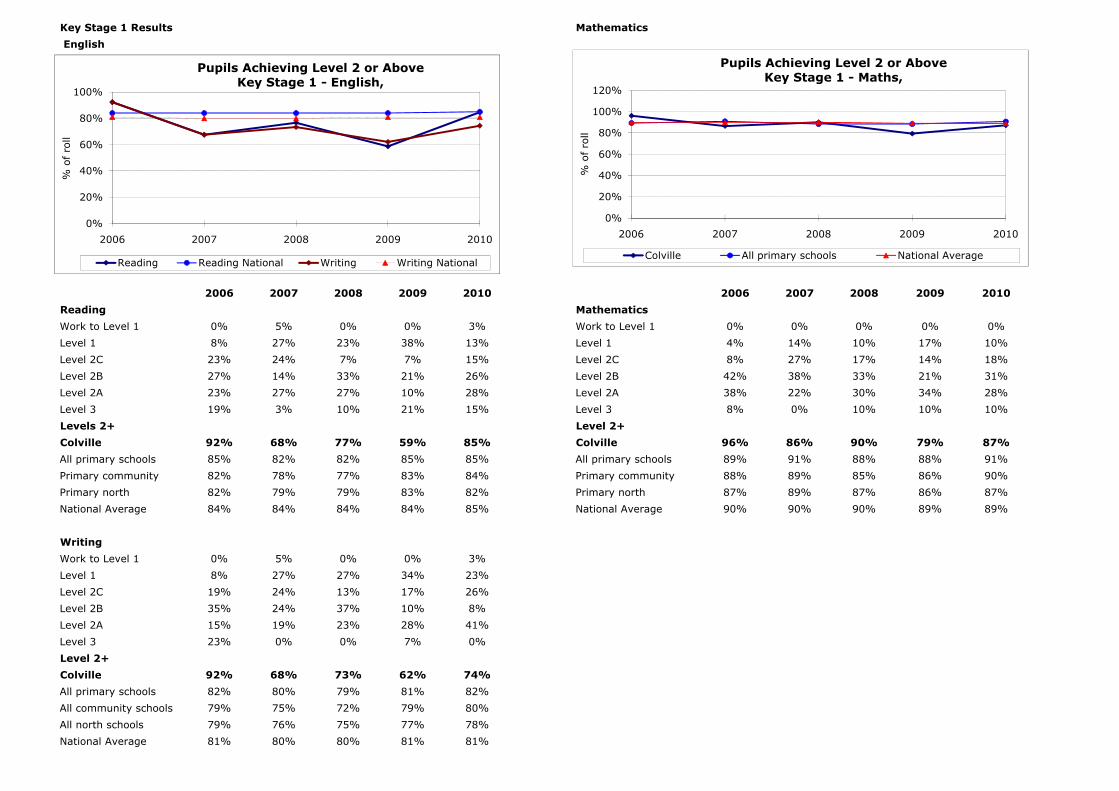
Key Stage 1 Results Mathematics
English
2006 2007 2008 2009 2010 2006 2007 2008 2009 2010
Reading Mathematics
Work to Level 1 0% 5% 0% 0% 3% Work to Level 1 0% 0% 0% 0% 0%
Level 1 8% 27% 23% 38% 13% Level 1 4% 14% 10% 17% 10%
Level 2C 23% 24% 7% 7% 15% Level 2C 8% 27% 17% 14% 18%
Level 2B 27% 14% 33% 21% 26% Level 2B 42% 38% 33% 21% 31%
Level 2A 23% 27% 27% 10% 28% Level 2A 38% 22% 30% 34% 28%
Level 3 19% 3% 10% 21% 15% Level 3 8% 0% 10% 10% 10%
Levels 2+ Level 2+
Colville 92% 68% 77% 59% 85% Colville 96% 86% 90% 79% 87%
All primary schools 85% 82% 82% 85% 85% All primary schools 89% 91% 88% 88% 91%
Primary community 82% 78% 77% 83% 84% Primary community 88% 89% 85% 86% 90%
Primary north 82% 79% 79% 83% 82% Primary north 87% 89% 87% 86% 87%
National Average 84% 84% 84% 84% 85% National Average 90% 90% 90% 89% 89%
Writing
Work to Level 1 0% 5% 0% 0% 3%
Level 1 8% 27% 27% 34% 23%
Level 2C 19% 24% 13% 17% 26%
Level 2B 35% 24% 37% 10% 8%
Level 2A 15% 19% 23% 28% 41%
Level 3 23% 0% 0% 7% 0%
Level 2+
Colville 92% 68% 73% 62% 74%
All primary schools 82% 80% 79% 81% 82%
All community schools 79% 75% 72% 79% 80%
All north schools 79% 76% 75% 77% 78%
National Average 81% 80% 80% 81% 81%
0%
20%
40%
60%
80%
100%
2006 2007 2008 2009 2010
% o
f ro
llPupils Achieving Level 2 or Above
Key Stage 1 - English,
Reading Reading National Writing Writing National
0%
20%
40%
60%
80%
100%
120%
2006 2007 2008 2009 2010
% o
f ro
ll
Pupils Achieving Level 2 or AboveKey Stage 1 - Maths,
Colville All primary schools National Average
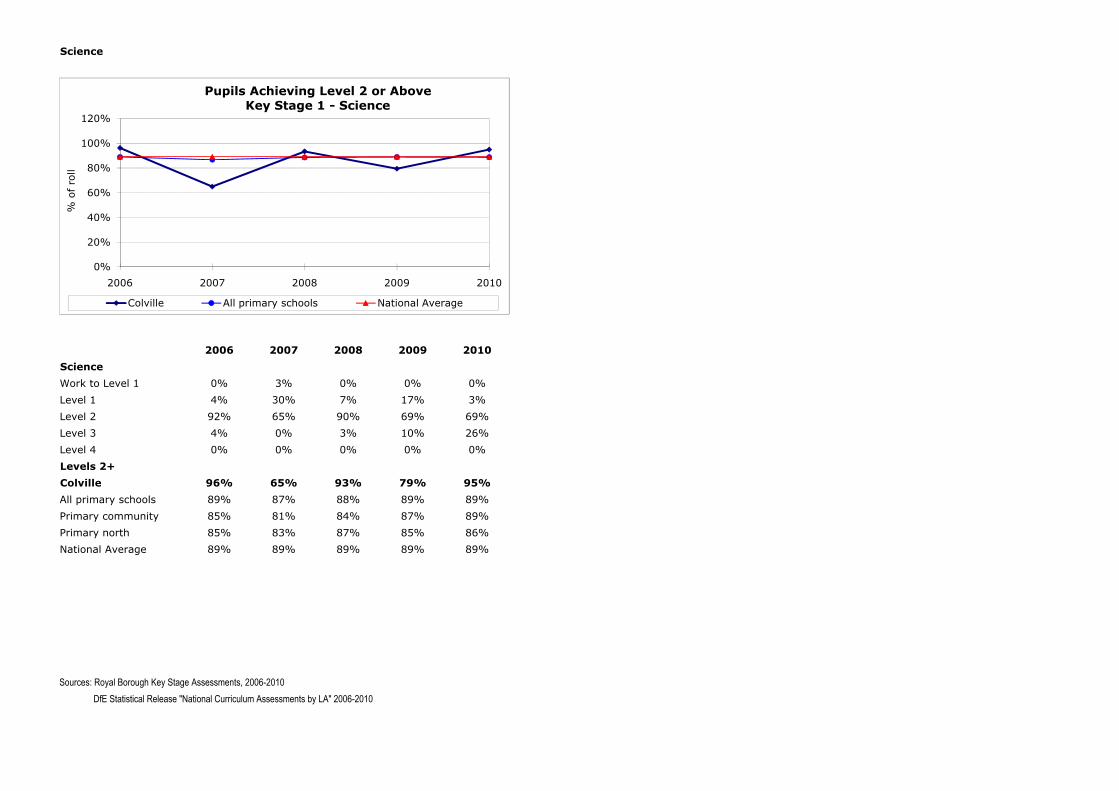
Science
2006 2007 2008 2009 2010
Science
Work to Level 1 0% 3% 0% 0% 0%
Level 1 4% 30% 7% 17% 3%
Level 2 92% 65% 90% 69% 69%
Level 3 4% 0% 3% 10% 26%
Level 4 0% 0% 0% 0% 0%
Levels 2+
Colville 96% 65% 93% 79% 95%
All primary schools 89% 87% 88% 89% 89%
Primary community 85% 81% 84% 87% 89%
Primary north 85% 83% 87% 85% 86%
National Average 89% 89% 89% 89% 89%
Sources: Royal Borough Key Stage Assessments, 2006-2010 DfE Statistical Release "National Curriculum Assessments by LA" 2006-2010
0%
20%
40%
60%
80%
100%
120%
2006 2007 2008 2009 2010
% o
f ro
ll
Pupils Achieving Level 2 or AboveKey Stage 1 - Science
Colville All primary schools National Average
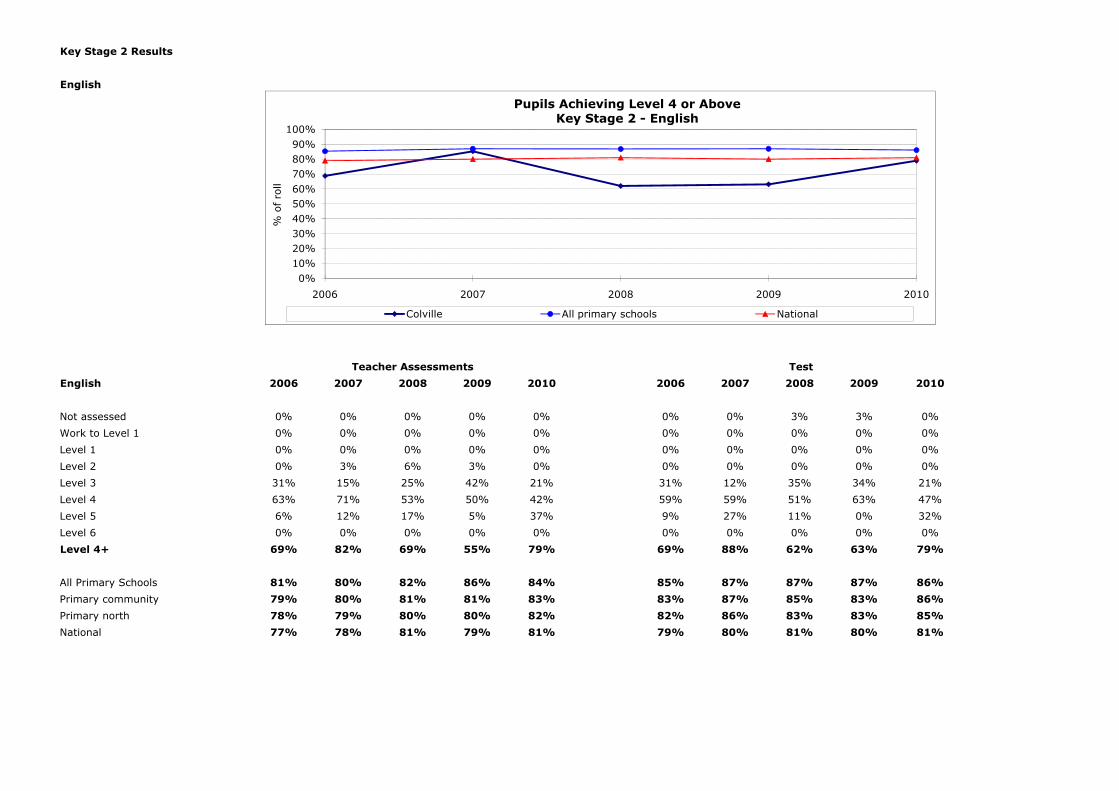
Key Stage 2 Results
English
English 2006 2007 2008 2009 2010 2006 2007 2008 2009 2010
Not assessed 0% 0% 0% 0% 0% 0% 0% 3% 3% 0%
Work to Level 1 0% 0% 0% 0% 0% 0% 0% 0% 0% 0%
Level 1 0% 0% 0% 0% 0% 0% 0% 0% 0% 0%
Level 2 0% 3% 6% 3% 0% 0% 0% 0% 0% 0%
Level 3 31% 15% 25% 42% 21% 31% 12% 35% 34% 21%
Level 4 63% 71% 53% 50% 42% 59% 59% 51% 63% 47%
Level 5 6% 12% 17% 5% 37% 9% 27% 11% 0% 32%
Level 6 0% 0% 0% 0% 0% 0% 0% 0% 0% 0%
Level 4+ 69% 82% 69% 55% 79% 69% 88% 62% 63% 79%
All Primary Schools 81% 80% 82% 86% 84% 85% 87% 87% 87% 86%
Primary community 79% 80% 81% 81% 83% 83% 87% 85% 83% 86%
Primary north 78% 79% 80% 80% 82% 82% 86% 83% 83% 85%
National 77% 78% 81% 79% 81% 79% 80% 81% 80% 81%
Teacher Assessments Test
0%
10%20%30%
40%50%60%
70%80%90%
100%
2006 2007 2008 2009 2010
% o
f ro
ll
Pupils Achieving Level 4 or AboveKey Stage 2 - English
Colville All primary schools National
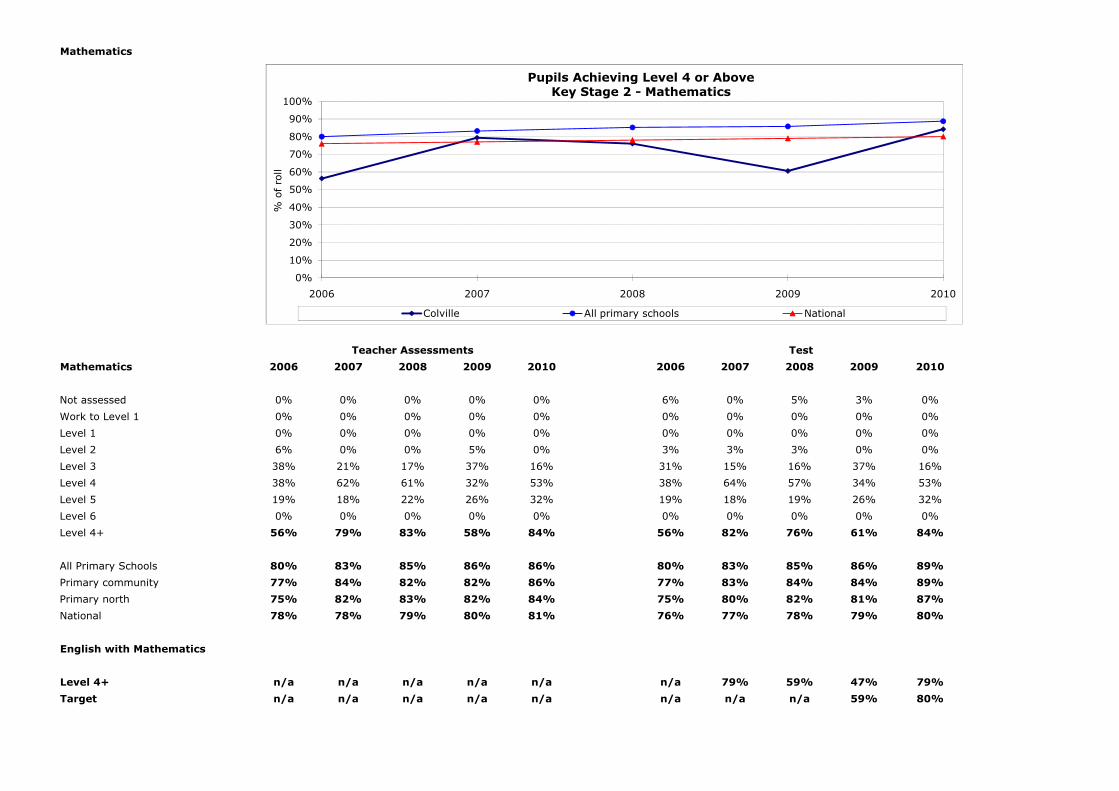
Mathematics
Mathematics 2006 2007 2008 2009 2010 2006 2007 2008 2009 2010
Not assessed 0% 0% 0% 0% 0% 6% 0% 5% 3% 0%
Work to Level 1 0% 0% 0% 0% 0% 0% 0% 0% 0% 0%
Level 1 0% 0% 0% 0% 0% 0% 0% 0% 0% 0%
Level 2 6% 0% 0% 5% 0% 3% 3% 3% 0% 0%
Level 3 38% 21% 17% 37% 16% 31% 15% 16% 37% 16%
Level 4 38% 62% 61% 32% 53% 38% 64% 57% 34% 53%
Level 5 19% 18% 22% 26% 32% 19% 18% 19% 26% 32%
Level 6 0% 0% 0% 0% 0% 0% 0% 0% 0% 0%
Level 4+ 56% 79% 83% 58% 84% 56% 82% 76% 61% 84%
All Primary Schools 80% 83% 85% 86% 86% 80% 83% 85% 86% 89%
Primary community 77% 84% 82% 82% 86% 77% 83% 84% 84% 89%
Primary north 75% 82% 83% 82% 84% 75% 80% 82% 81% 87%
National 78% 78% 79% 80% 81% 76% 77% 78% 79% 80%
English with Mathematics
Level 4+ n/a n/a n/a n/a n/a n/a 79% 59% 47% 79%
Target n/a n/a n/a n/a n/a n/a n/a n/a 59% 80%
Teacher Assessments Test
0%
10%
20%
30%
40%
50%
60%
70%
80%
90%
100%
2006 2007 2008 2009 2010
% o
f ro
ll
Pupils Achieving Level 4 or AboveKey Stage 2 - Mathematics
Colville All primary schools National
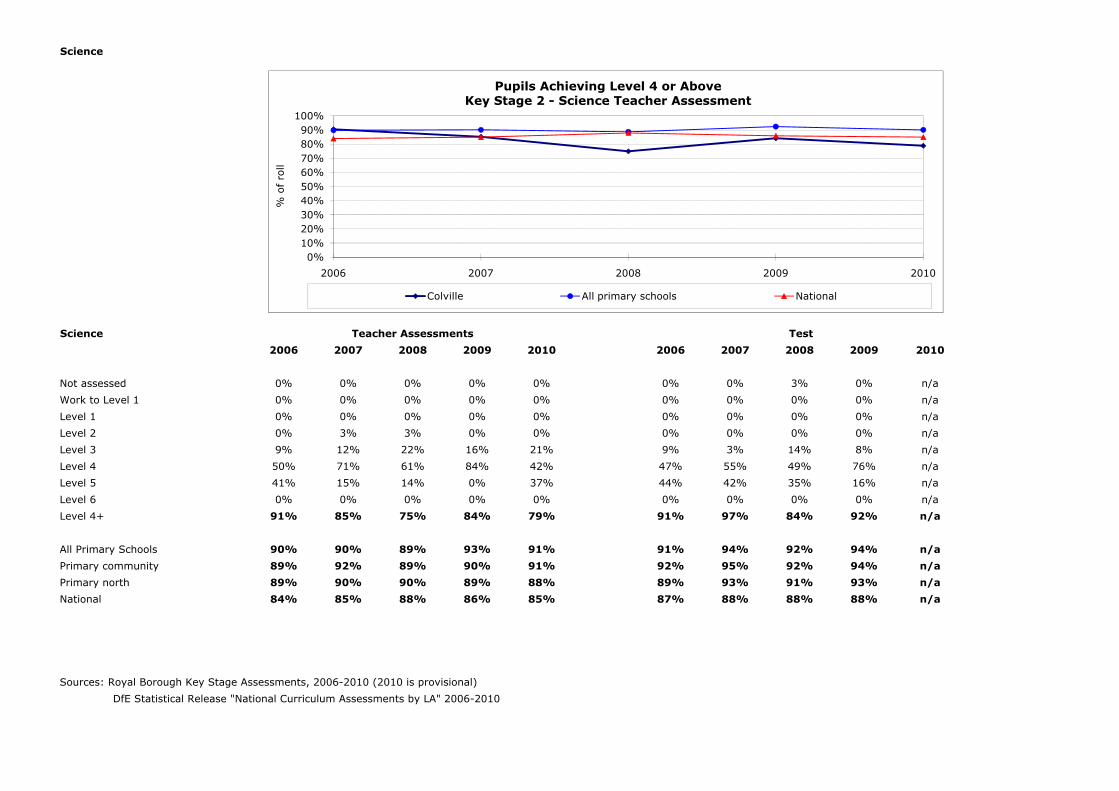
Science
Science
2006 2007 2008 2009 2010 2006 2007 2008 2009 2010
Not assessed 0% 0% 0% 0% 0% 0% 0% 3% 0% n/a
Work to Level 1 0% 0% 0% 0% 0% 0% 0% 0% 0% n/a
Level 1 0% 0% 0% 0% 0% 0% 0% 0% 0% n/a
Level 2 0% 3% 3% 0% 0% 0% 0% 0% 0% n/a
Level 3 9% 12% 22% 16% 21% 9% 3% 14% 8% n/a
Level 4 50% 71% 61% 84% 42% 47% 55% 49% 76% n/a
Level 5 41% 15% 14% 0% 37% 44% 42% 35% 16% n/a
Level 6 0% 0% 0% 0% 0% 0% 0% 0% 0% n/a
Level 4+ 91% 85% 75% 84% 79% 91% 97% 84% 92% n/a
All Primary Schools 90% 90% 89% 93% 91% 91% 94% 92% 94% n/a
Primary community 89% 92% 89% 90% 91% 92% 95% 92% 94% n/a
Primary north 89% 90% 90% 89% 88% 89% 93% 91% 93% n/a
National 84% 85% 88% 86% 85% 87% 88% 88% 88% n/a
Sources: Royal Borough Key Stage Assessments, 2006-2010 (2010 is provisional)
DfE Statistical Release "National Curriculum Assessments by LA" 2006-2010
Teacher Assessments Test
0%10%20%30%40%50%60%70%80%90%
100%
2006 2007 2008 2009 2010%
of ro
ll
Pupils Achieving Level 4 or AboveKey Stage 2 - Science Teacher Assessment
Colville All primary schools National
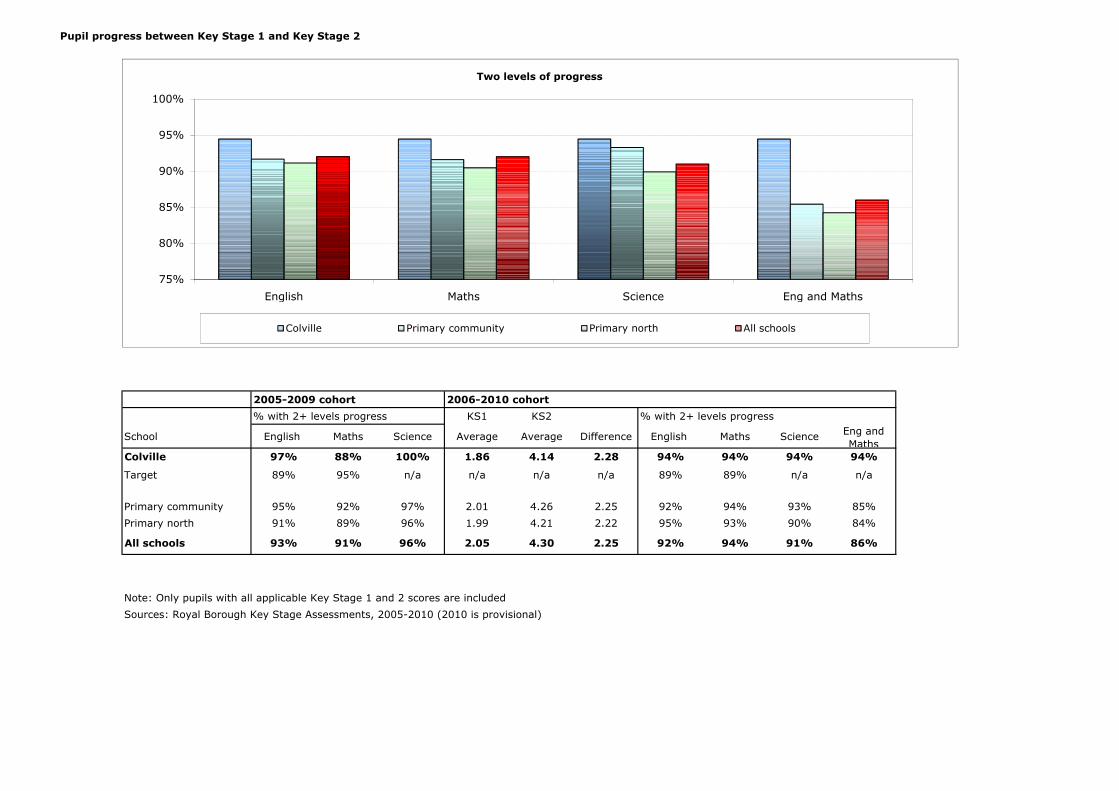
Pupil progress between Key Stage 1 and Key Stage 2
2005-2009 cohort 2006-2010 cohort
% with 2+ levels progress KS1 KS2 % with 2+ levels progress
School English Maths Science Average Average Difference English Maths Science Eng and Maths
Colville 97% 88% 100% 1.86 4.14 2.28 94% 94% 94% 94%
Target 89% 95% n/a n/a n/a n/a 89% 89% n/a n/a
Primary community 95% 92% 97% 2.01 4.26 2.25 92% 94% 93% 85%
Primary north 91% 89% 96% 1.99 4.21 2.22 95% 93% 90% 84%
All schools 93% 91% 96% 2.05 4.30 2.25 92% 94% 91% 86%
Note: Only pupils with all applicable Key Stage 1 and 2 scores are included
Sources: Royal Borough Key Stage Assessments, 2005-2010 (2010 is provisional)
75%
80%
85%
90%
95%
100%
English Maths Science Eng and Maths
Two levels of progress
Colville Primary community Primary north All schools
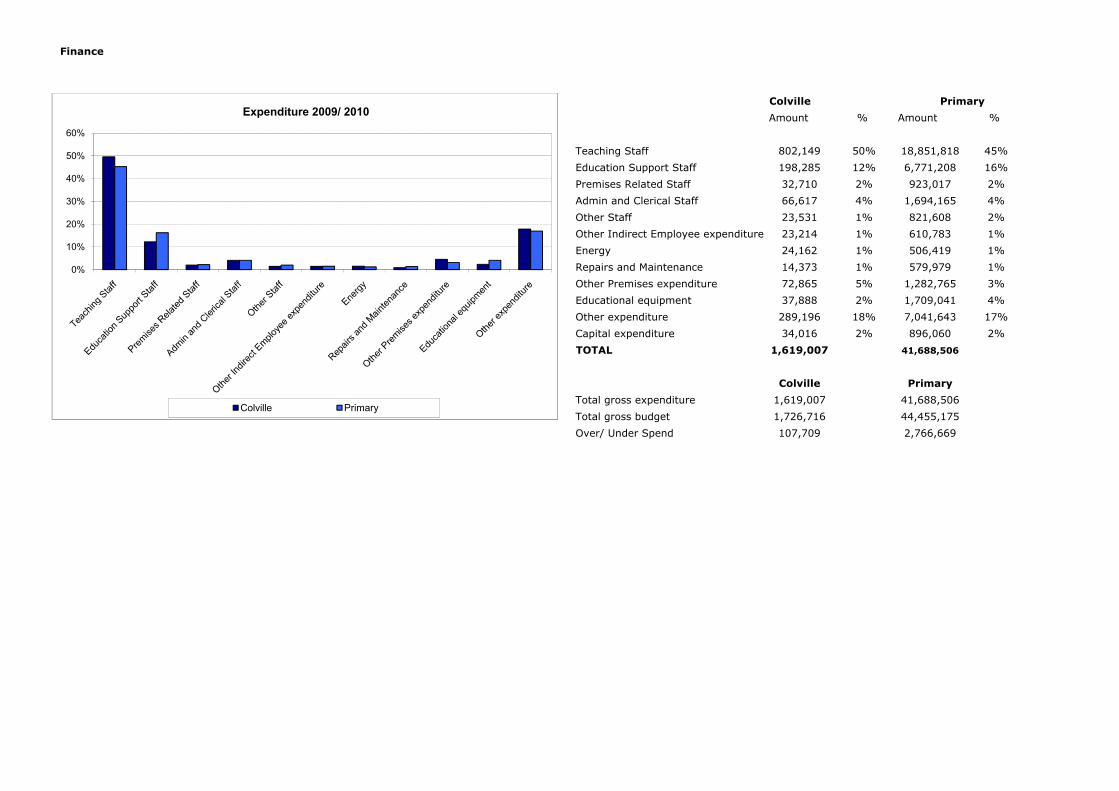
Finance
Colville
Amount % Amount %
Teaching Staff 802,149 50% 18,851,818 45%
Education Support Staff 198,285 12% 6,771,208 16%
Premises Related Staff 32,710 2% 923,017 2%
Admin and Clerical Staff 66,617 4% 1,694,165 4%
Other Staff 23,531 1% 821,608 2%
Other Indirect Employee expenditure 23,214 1% 610,783 1%
Energy 24,162 1% 506,419 1%
Repairs and Maintenance 14,373 1% 579,979 1%
Other Premises expenditure 72,865 5% 1,282,765 3%
Educational equipment 37,888 2% 1,709,041 4%
Other expenditure 289,196 18% 7,041,643 17%
Capital expenditure 34,016 2% 896,060 2%
TOTAL 1,619,007 41,688,506
Colville Primary
Total gross expenditure 1,619,007 41,688,506
Total gross budget 1,726,716 44,455,175
Over/ Under Spend 107,709 2,766,669
Primary
0%
10%
20%
30%
40%
50%
60%
Expenditure 2009/ 2010
Colville Primary