Embed Size (px)
Citation preview
Munasinghe Institute for DevelopmentM I N D
Addressing Climate Change and Sustainable Development Issues Together:
The Way Forward with Sustainomics
Professor Mohan Munasinghe
Vice-Chair, Intergovernmental Panel on Climate Change (IPCC), Geneva Chairman, Munasinghe Institute for Development (MIND), Colombo
Hon. Senior Advisor to the Government of Sri Lanka, Colombo
Distinguished International Visiting Scholar Lecture Series Elizabeth City State University, NC, USA
21 July 2008

Munasinghe Institute for DevelopmentM I N D
Mohan MunasingheFinance and Development, March 2008, pp.37-41
Paper (5 pages)
Munasinghe Institute for DevelopmentM I N D
Book
(650 pages)
Munasinghe Institute for DevelopmentM I N D
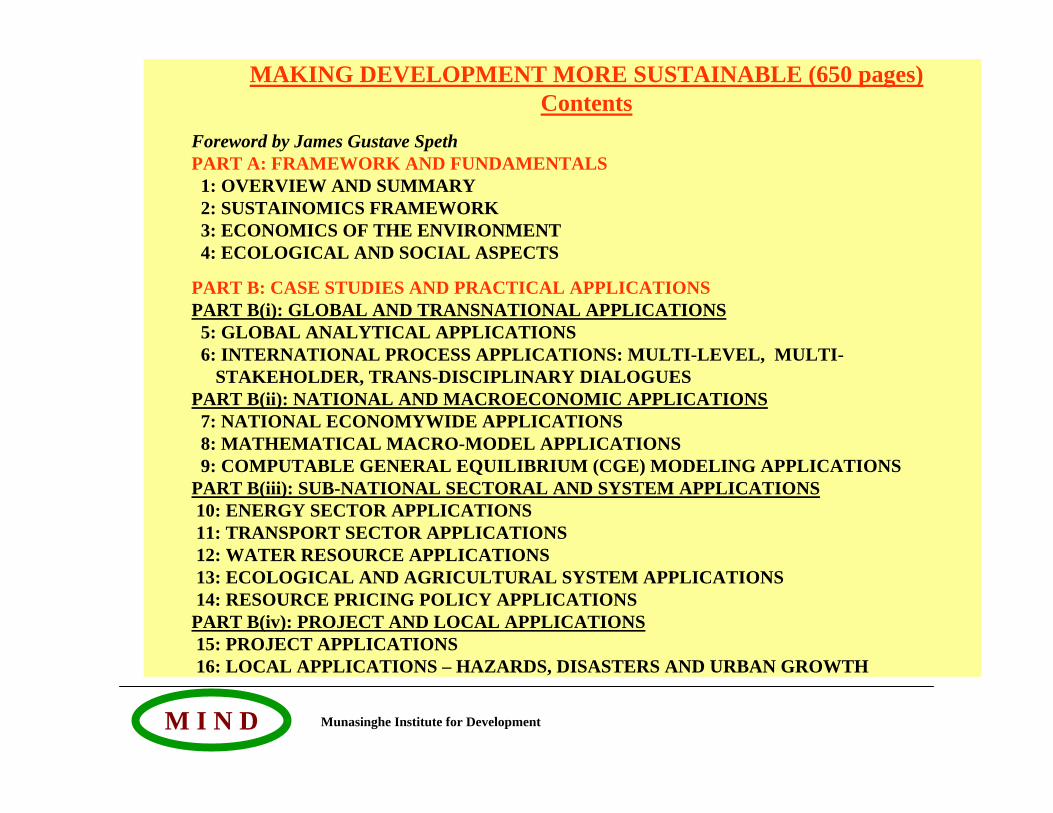
MAKING DEVELOPMENT MORE SUSTAINABLE (650 pages)Contents
Foreword by James Gustave SpethPART A: FRAMEWORK AND FUNDAMENTALS1: OVERVIEW AND SUMMARY 2: SUSTAINOMICS FRAMEWORK 3: ECONOMICS OF THE ENVIRONMENT 4: ECOLOGICAL AND SOCIAL ASPECTS
PART B: CASE STUDIES AND PRACTICAL APPLICATIONSPART B(i): GLOBAL AND TRANSNATIONAL APPLICATIONS5: GLOBAL ANALYTICAL APPLICATIONS 6: INTERNATIONAL PROCESS APPLICATIONS: MULTI-LEVEL, MULTI-
STAKEHOLDER, TRANS-DISCIPLINARY DIALOGUES PART B(ii): NATIONAL AND MACROECONOMIC APPLICATIONS7: NATIONAL ECONOMYWIDE APPLICATIONS 8: MATHEMATICAL MACRO-MODEL APPLICATIONS 9: COMPUTABLE GENERAL EQUILIBRIUM (CGE) MODELING APPLICATIONS
PART B(iii): SUB-NATIONAL SECTORAL AND SYSTEM APPLICATIONS10: ENERGY SECTOR APPLICATIONS 11: TRANSPORT SECTOR APPLICATIONS 12: WATER RESOURCE APPLICATIONS 13: ECOLOGICAL AND AGRICULTURAL SYSTEM APPLICATIONS 14: RESOURCE PRICING POLICY APPLICATIONS PART B(iv): PROJECT AND LOCAL APPLICATIONS15: PROJECT APPLICATIONS 16: LOCAL APPLICATIONS – HAZARDS, DISASTERS AND URBAN GROWTH
Munasinghe Institute for DevelopmentM I N D
WHY ? is climate a threat to future human development Climate Change (CC) undermines Sustainable Development (SD) and unfairly penalizes the poor
Munasinghe Institute for DevelopmentM I N D
WHY ?
HOW ?
is climate a threat to future human development Climate Change (CC) undermines Sustainable Development (SD) and unfairly penalizes the poor
can we move forward to transform risky current trends into a safer and better futureStart making development more sustainable (MDMS) now, using the Sustainomics framework

Munasinghe Institute for DevelopmentM I N D
WHY ?
HOW ?
WHAT? are the practical solutions and policy options to be implemented that will integrate CC responses into SD strategy (from global to local levels)Many examples of good practice available; US has a key role to play
is climate a threat to future human development Climate Change (CC) undermines Sustainable Development (SD) and unfairly penalizes the poor
can we move forward to transform risky current trends into a safer and better futureStart making development more sustainable (MDMS) now, using the Sustainomics framework
Munasinghe Institute for DevelopmentM I N D
Introduction to Climate Change
Brief Overview of IPCCAR4 Main Findings: Risk to Sustainable
Development
Munasinghe Institute for DevelopmentM I N D
IPCC Assessment ProcessIPCC was created in 1988 by WMO and UNEPFour assessment reports have been completed already, which have progressively improved our understanding of climate change:1. Climate Change 19902. Climate Change 19953. Climate Change 20014. Climate Change 2007 (AR4)
Several hundred lead authors wrote the AR4 report, while about 3000 leading scientists worldwide, were involved in reviewing and editing it.
Munasinghe Institute for DevelopmentM I N D
IPCC Fourth Assessment Report (AR4)Three Main Working Groups:I. Science of Climate ChangeII. Impacts, Adaptation and Vulnerability III. Mitigation
Synthesis Report
Task Force on National Greenhouse Gas InventoriesIPCC reports review the most recent and critical scientific information. They are policy relevant but not policy prescriptive.
Munasinghe Institute for DevelopmentM I N D
Evidence of Past and existing Climate Change
Munasinghe Institute for DevelopmentM I N D
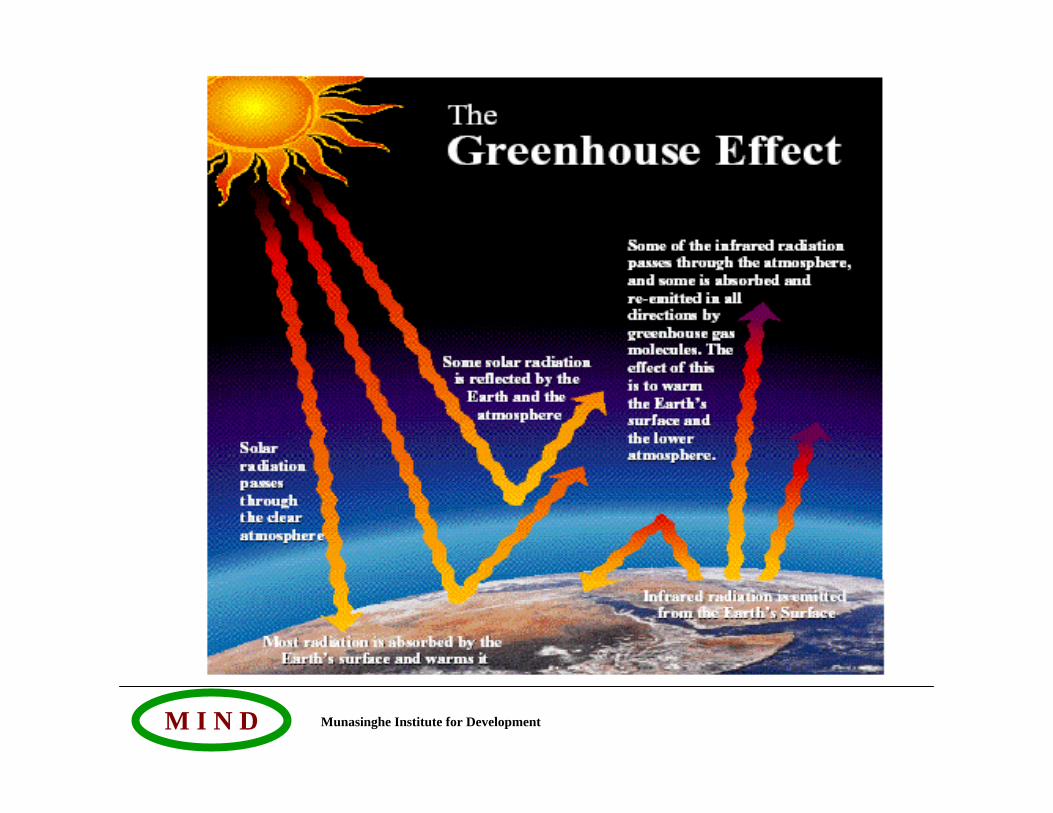
Munasinghe Institute for DevelopmentM I N D
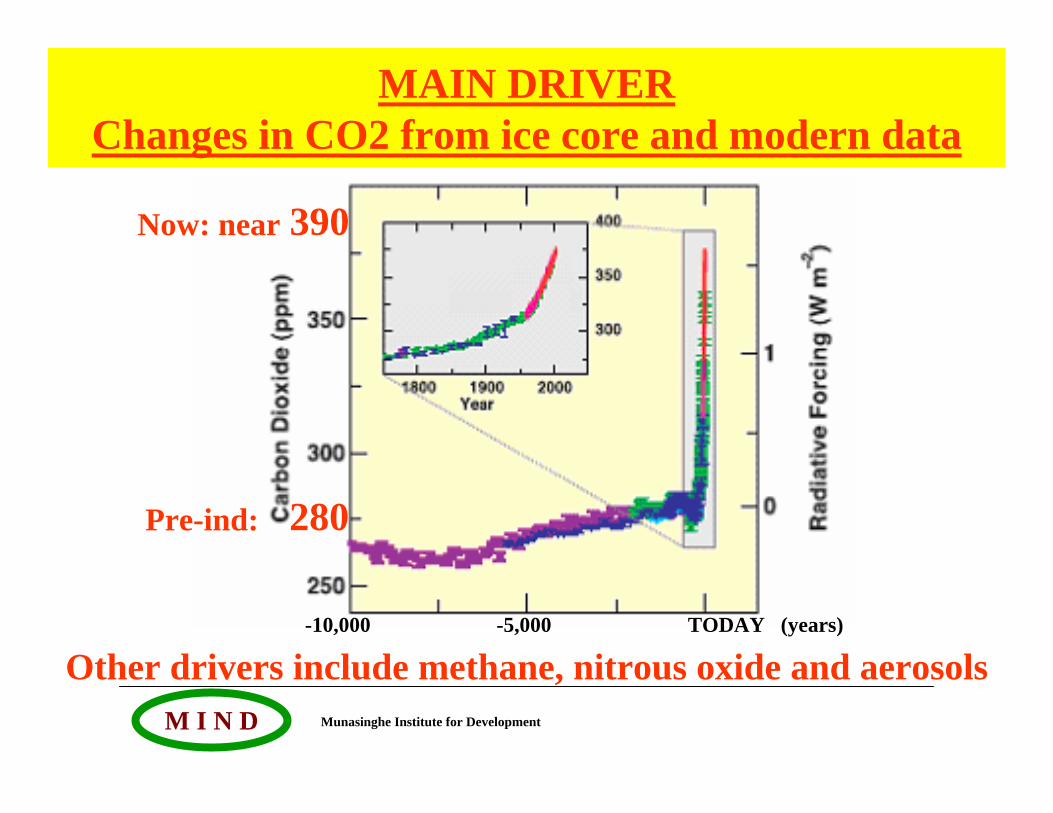
MAIN DRIVERChanges in CO2 from ice core and modern data
-10,000 -5,000 TODAY (years)
280Pre-ind:
390Now: near
Other drivers include methane, nitrous oxide and aerosols
Munasinghe Institute for DevelopmentM I N D
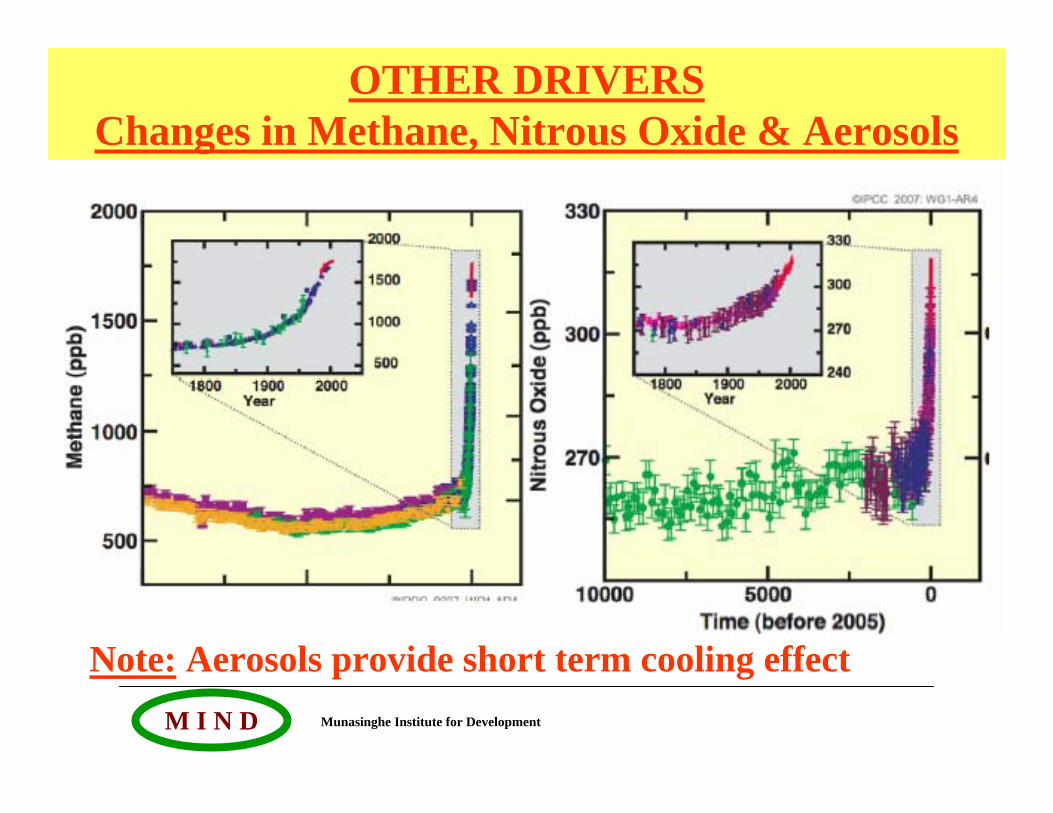
OTHER DRIVERSChanges in Methane, Nitrous Oxide & Aerosols
Note: Aerosols provide short term cooling effect
Munasinghe Institute for DevelopmentM I N D
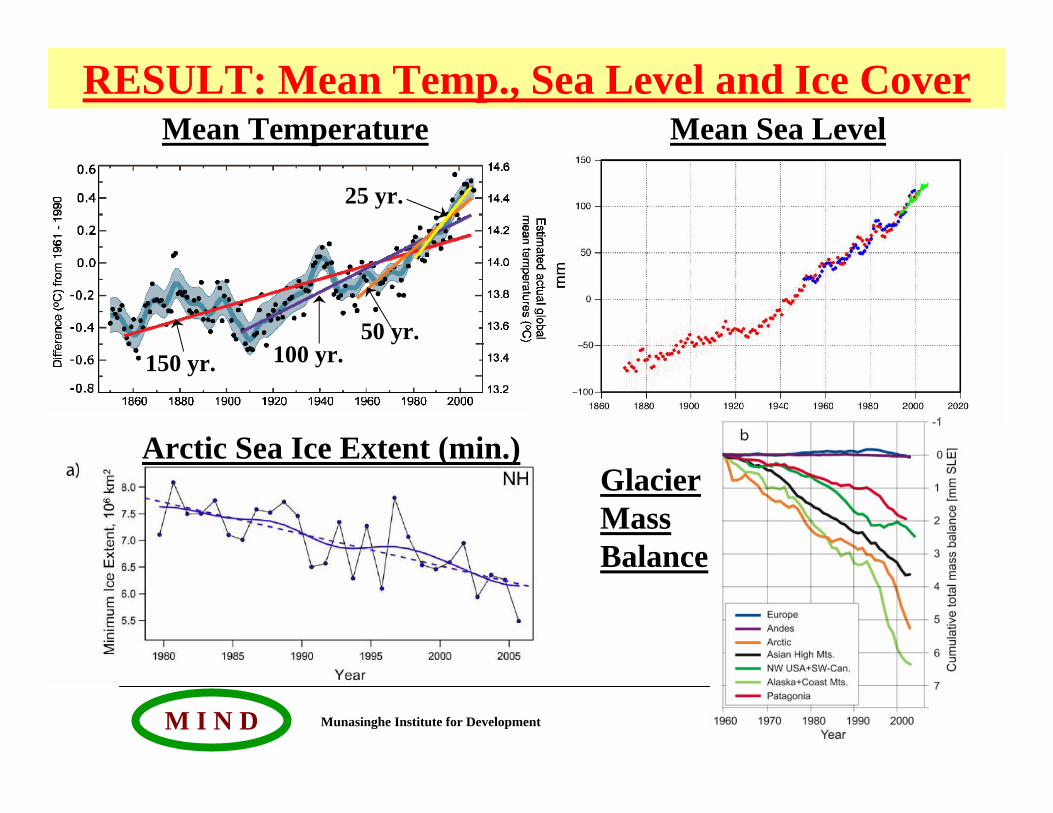
RESULT: Mean Temp., Sea Level and Ice CoverMean Sea Level
Arctic Sea Ice Extent (min.)
Mean Temperature
150 yr. 100 yr.50 yr.
25 yr.
Glacier Mass Balance
Munasinghe Institute for DevelopmentM I N D
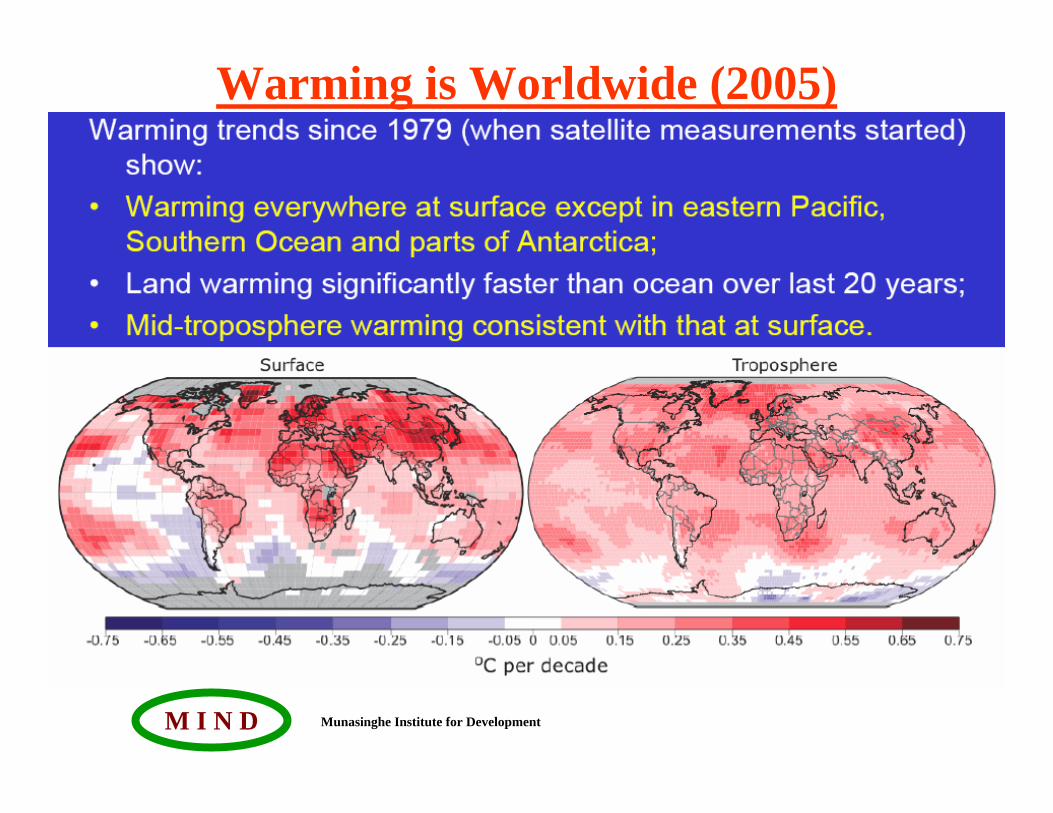
Warming is Worldwide (2005)
Munasinghe Institute for DevelopmentM I N D
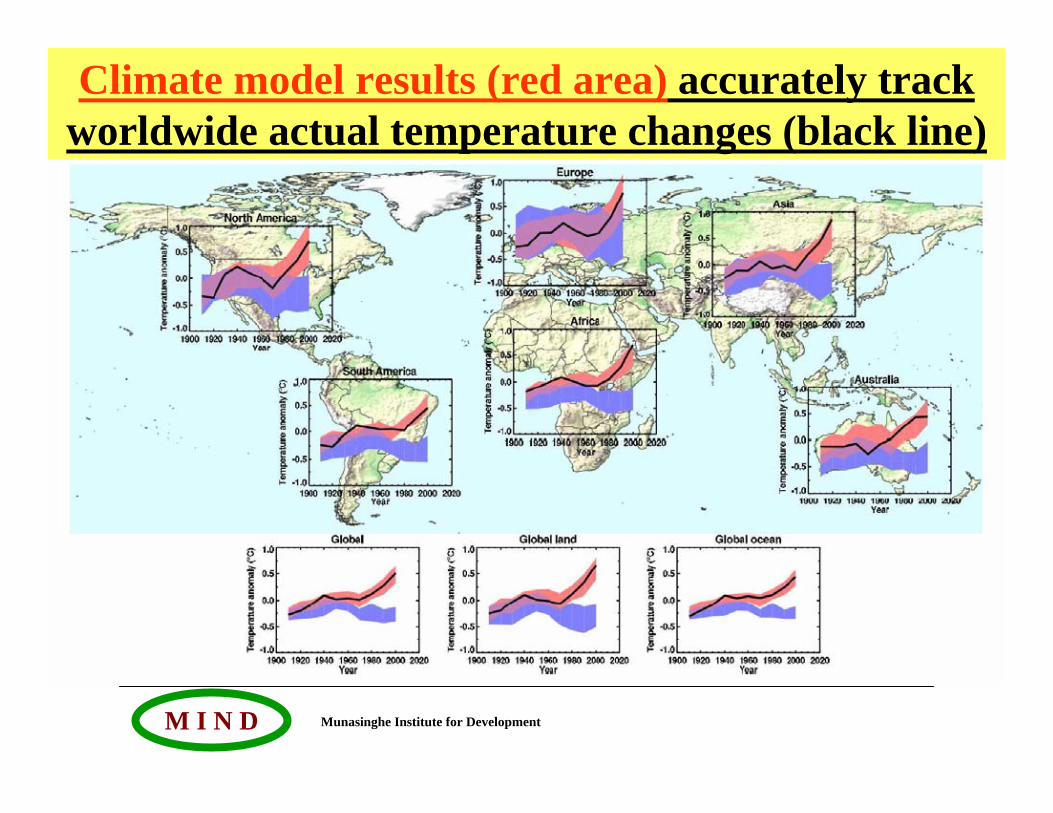
Climate model results (red area) accurately track worldwide actual temperature changes (black line)
Munasinghe Institute for DevelopmentM I N D
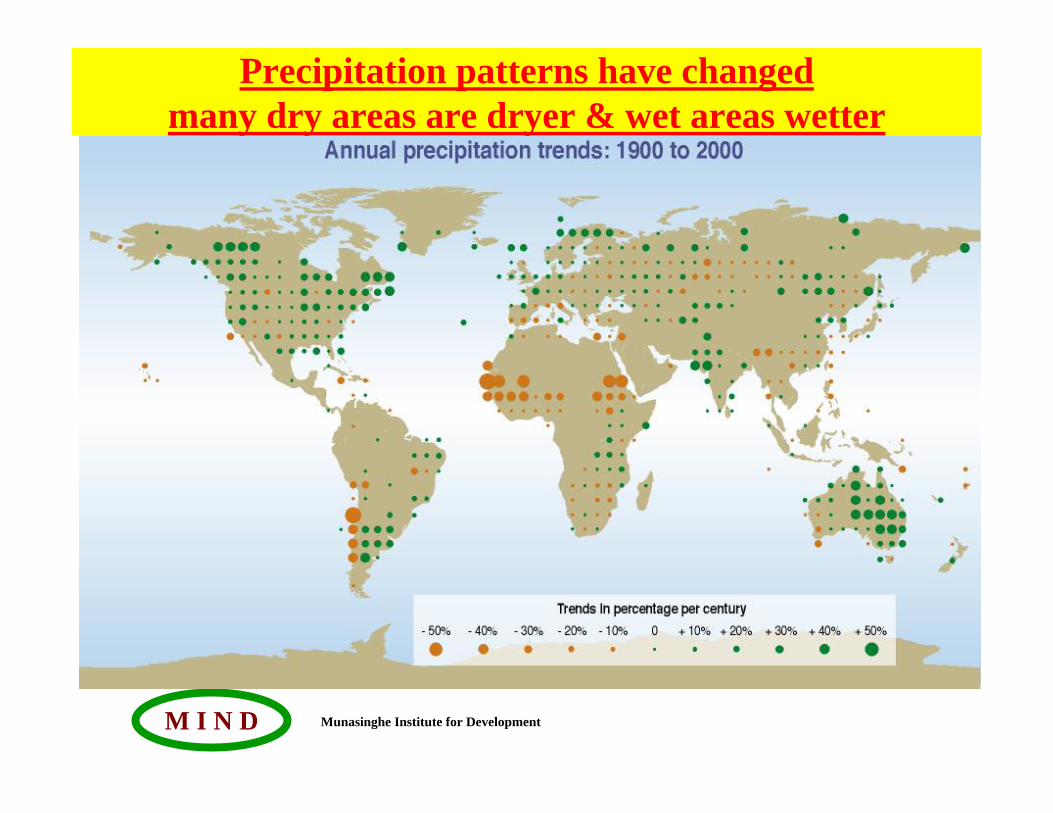
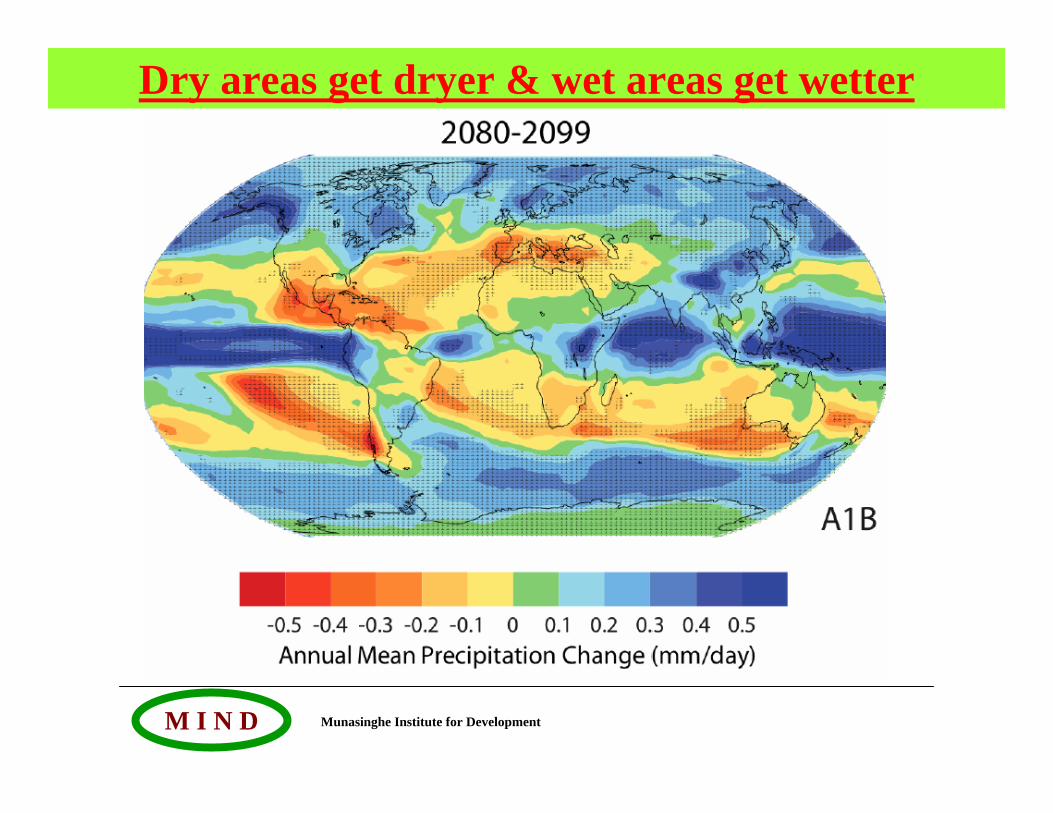
Precipitation patterns have changedmany dry areas are dryer & wet areas wetter
Munasinghe Institute for DevelopmentM I N D
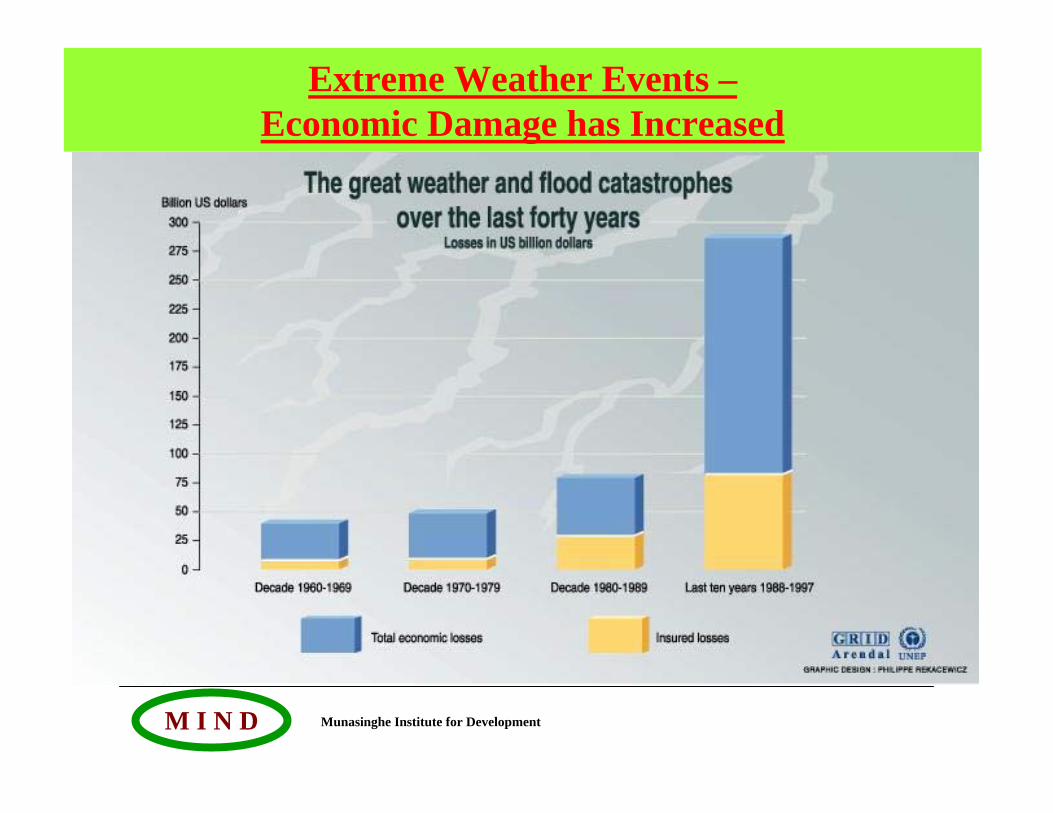
Extreme Weather Events –Economic Damage has Increased
Munasinghe Institute for DevelopmentM I N D
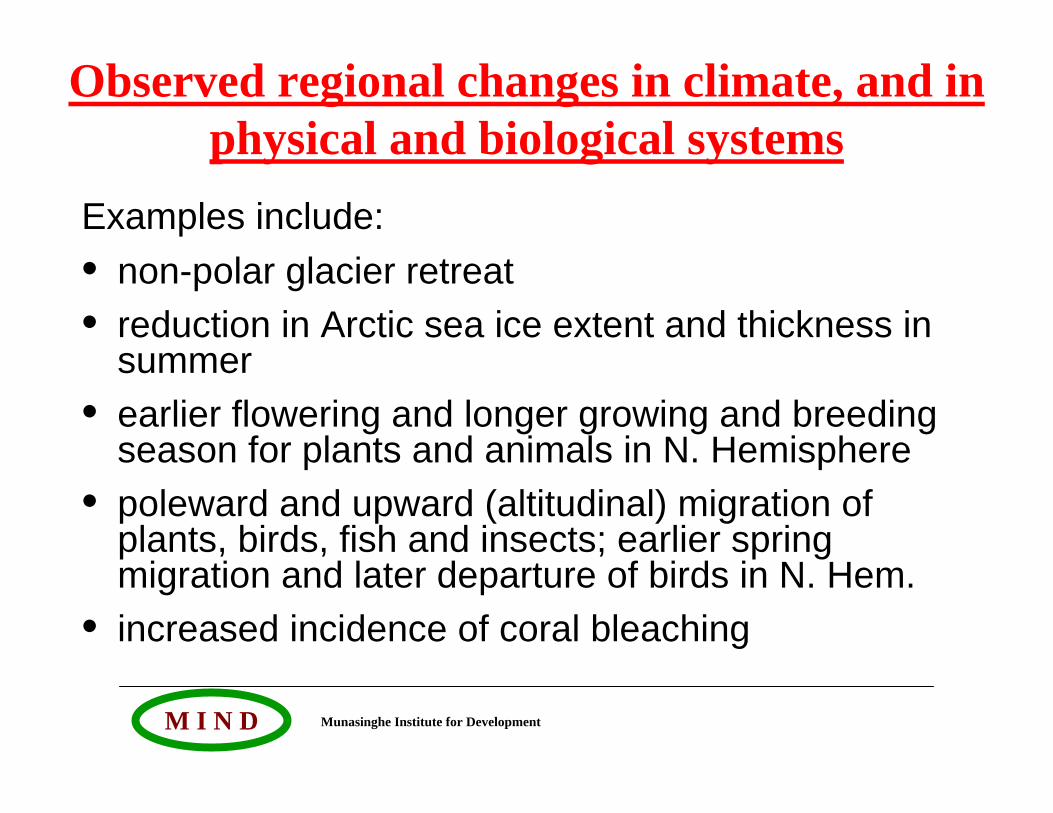
Examples include:• non-polar glacier retreat• reduction in Arctic sea ice extent and thickness in
summer• earlier flowering and longer growing and breeding
season for plants and animals in N. Hemisphere • poleward and upward (altitudinal) migration of
plants, birds, fish and insects; earlier spring migration and later departure of birds in N. Hem.
• increased incidence of coral bleaching
Observed regional changes in climate, and in physical and biological systems
Munasinghe Institute for DevelopmentM I N D
Predicting FutureClimate Change
Munasinghe Institute for DevelopmentM I N D
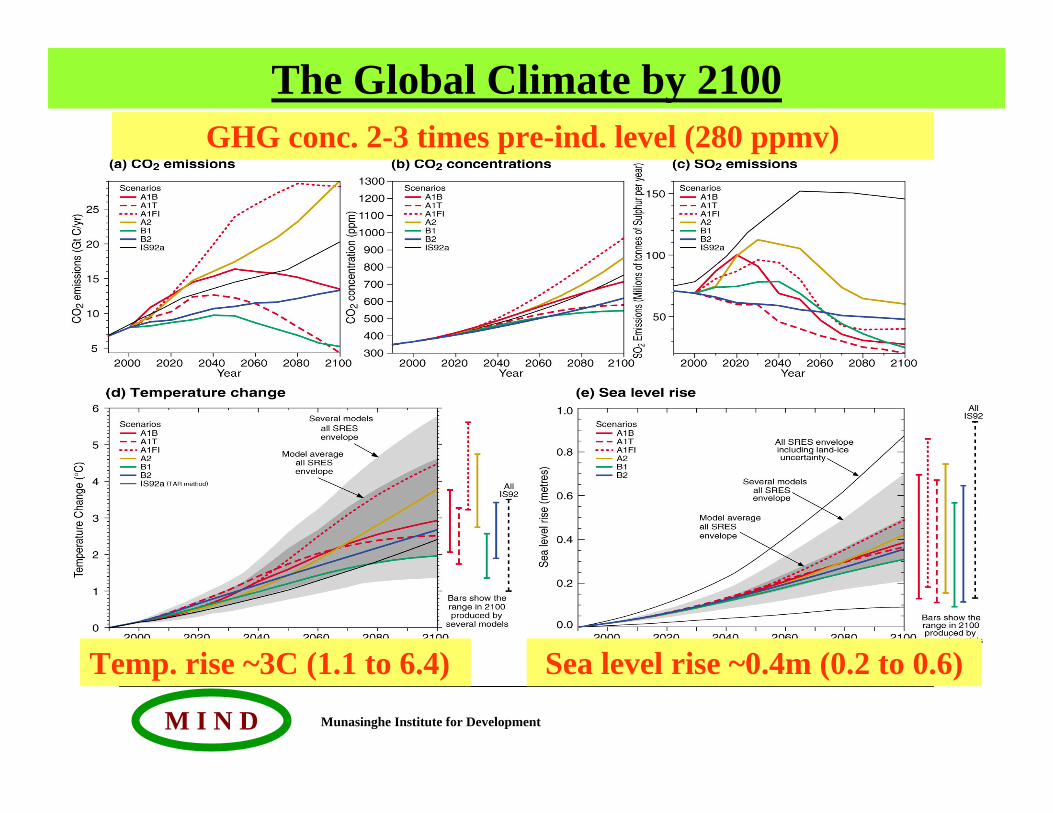
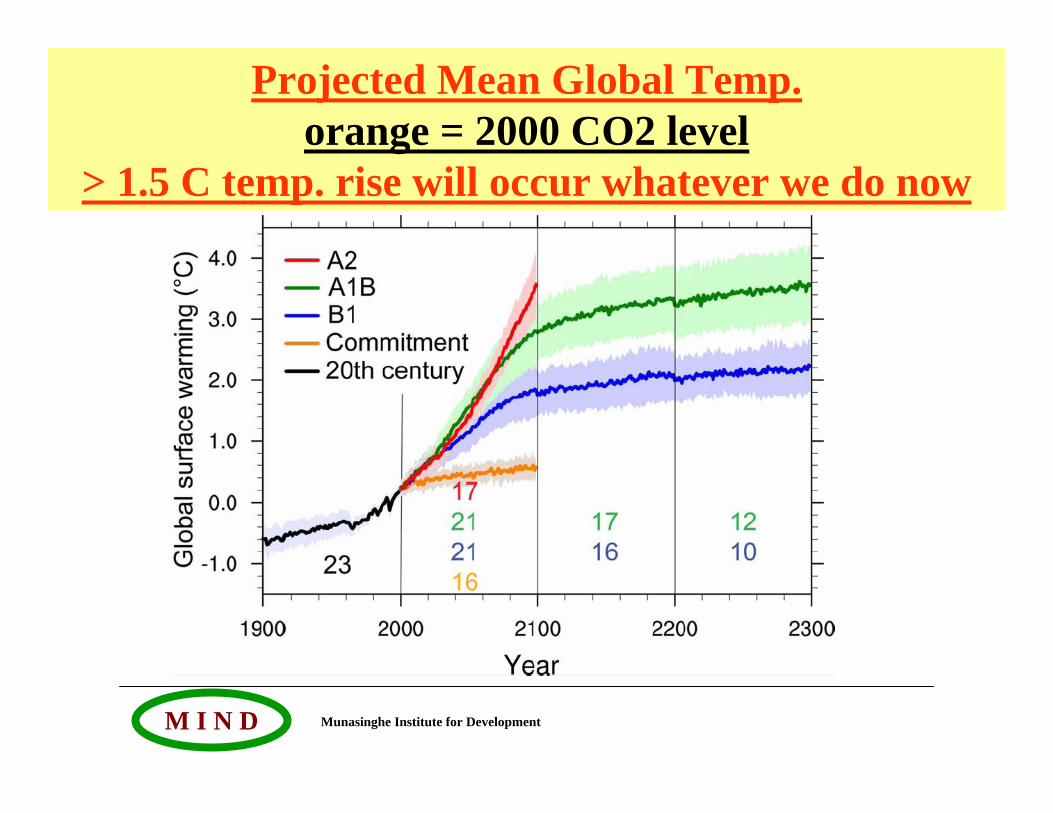
The Global Climate by 2100GHG conc. 2-3 times pre-ind. level (280 ppmv)
Temp. rise ~3C (1.1 to 6.4) Sea level rise ~0.4m (0.2 to 0.6)
Munasinghe Institute for DevelopmentM I N D
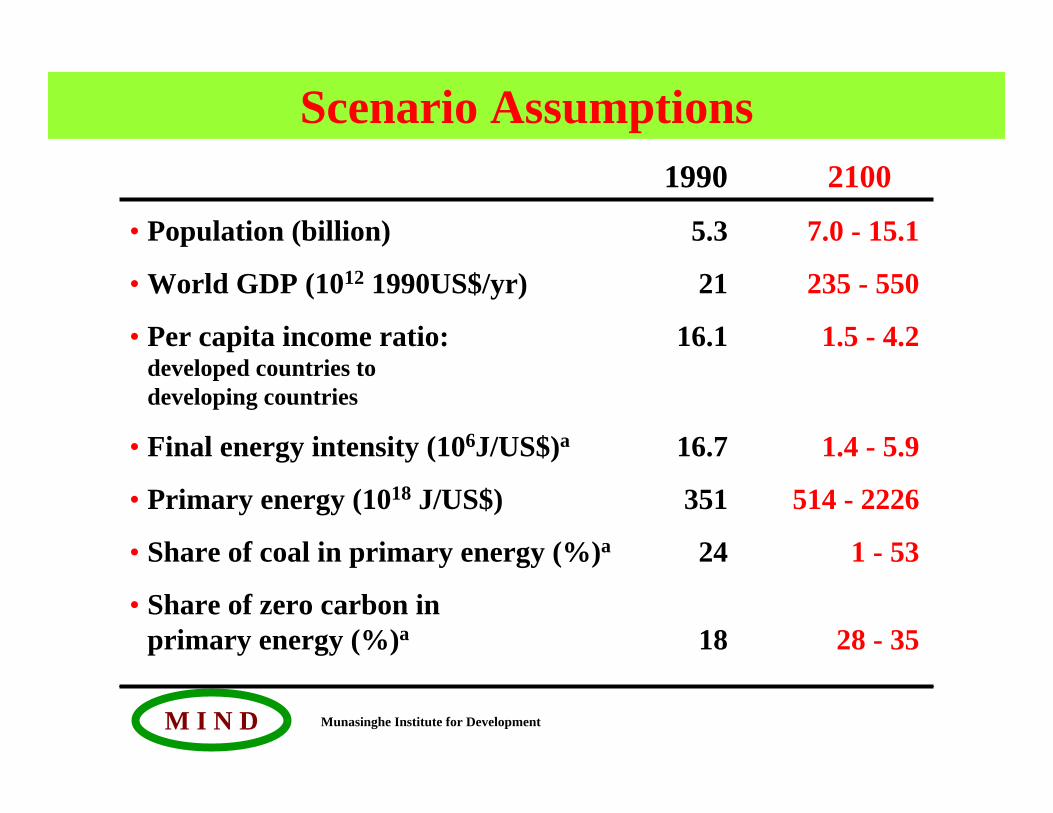
Scenario Assumptions
• Population (billion) 5.3 7.0 - 15.1
• World GDP (1012 1990US$/yr) 21 235 - 550
• Per capita income ratio: 16.1 1.5 - 4.2developed countries to developing countries
• Final energy intensity (106J/US$)a 16.7 1.4 - 5.9
• Primary energy (1018 J/US$) 351 514 - 2226
• Share of coal in primary energy (%)a 24 1 - 53
• Share of zero carbon in primary energy (%)a 18 28 - 35
1990 2100
Munasinghe Institute for DevelopmentM I N D
Projected Mean Global Temp.orange = 2000 CO2 level
> 1.5 C temp. rise will occur whatever we do now
Munasinghe Institute for DevelopmentM I N D
CC SDDeveloping countries are most vulnerable to climate change• Climate change is likely to impact disproportionately
upon the poorest countries and the poorest persons within countries, exacerbating inequities in health status and access to adequate food, clean water and other resources.
• Net market sector effects are expected to be negative in most developing countries
• Impacts will be worse - many areas already flood and drought prone, and economic sectors are climate sensitive
• Lower capacity to adapt because of a lack of financial, institutional and technological capacity and access to knowledge
Munasinghe Institute for DevelopmentM I N D
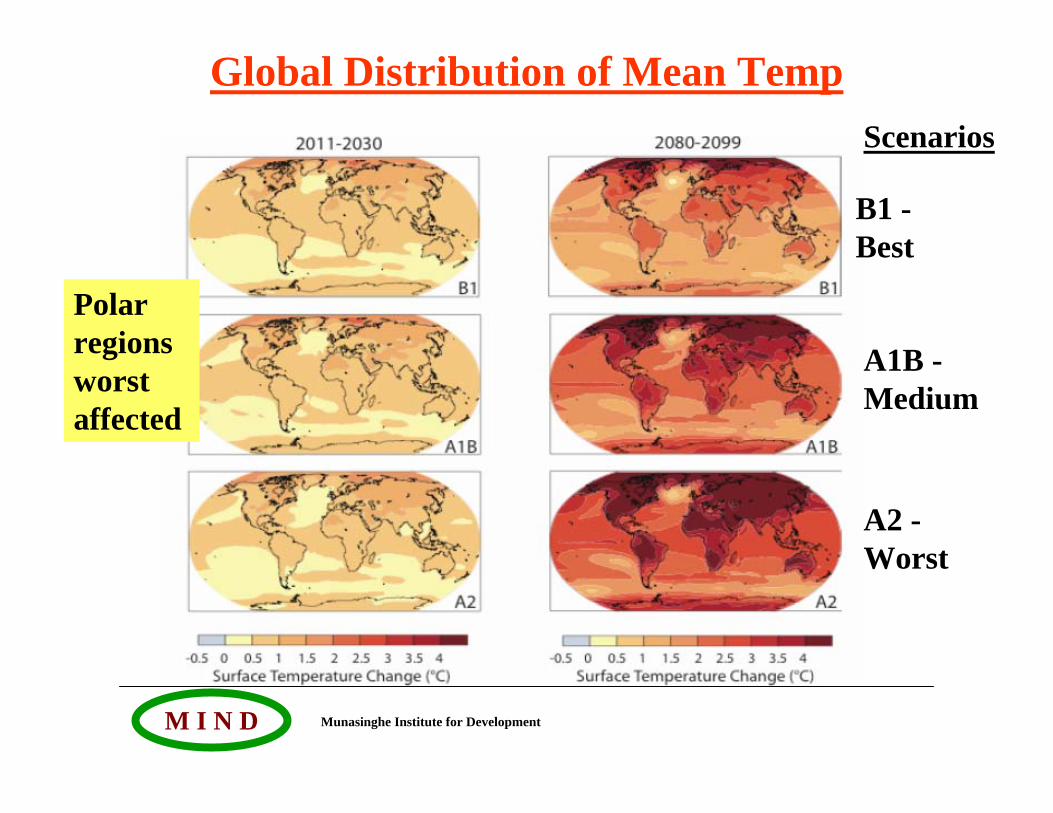
Global Distribution of Mean TempScenarios
B1 -Best
A1B -Medium
A2 -Worst
Polar regions worst affected
Munasinghe Institute for DevelopmentM I N D
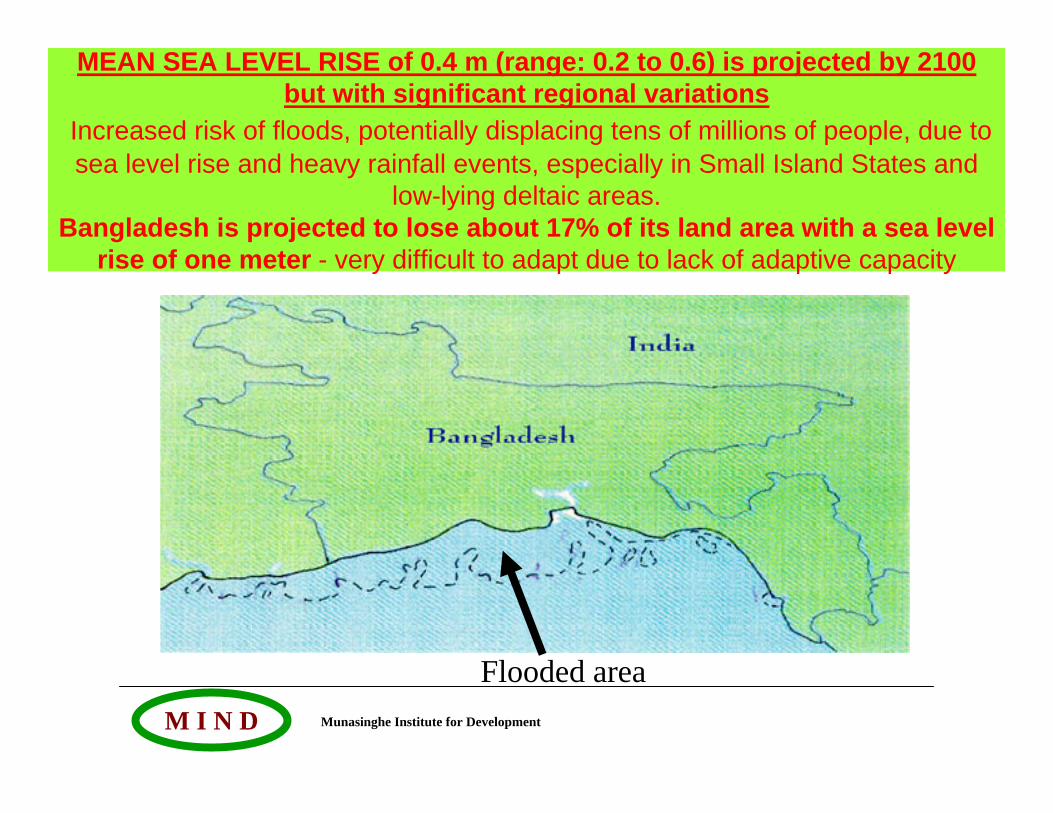
MEAN SEA LEVEL RISE of 0.4 m (range: 0.2 to 0.6) is projected by 2100 but with significant regional variations
Increased risk of floods, potentially displacing tens of millions of people, due to sea level rise and heavy rainfall events, especially in Small Island States and
low-lying deltaic areas. Bangladesh is projected to lose about 17% of its land area with a sea level
rise of one meter - very difficult to adapt due to lack of adaptive capacity
projected
Flooded area
Munasinghe Institute for DevelopmentM I N D
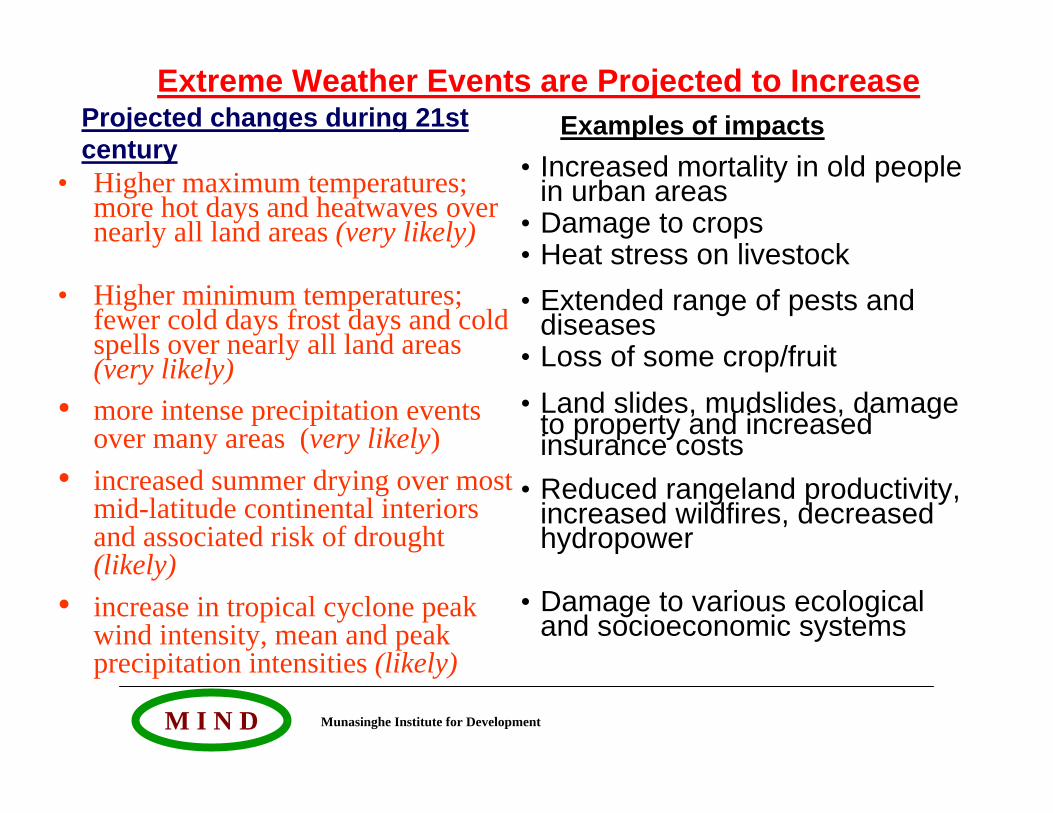
Extreme Weather Events are Projected to Increase
• Higher maximum temperatures; more hot days and heatwaves over nearly all land areas (very likely)
• Higher minimum temperatures; fewer cold days frost days and cold spells over nearly all land areas (very likely)
• more intense precipitation events over many areas (very likely)
• increased summer drying over most mid-latitude continental interiors and associated risk of drought (likely)
• increase in tropical cyclone peak wind intensity, mean and peak precipitation intensities (likely)
• Increased mortality in old people in urban areas
• Damage to crops• Heat stress on livestock• Extended range of pests and
diseases• Loss of some crop/fruit• Land slides, mudslides, damage
to property and increased insurance costs
• Reduced rangeland productivity, increased wildfires, decreased hydropower
• Damage to various ecological and socioeconomic systems
Projected changes during 21st century
Examples of impacts
Munasinghe Institute for DevelopmentM I N D
Dry areas get dryer & wet areas get wetter
Munasinghe Institute for DevelopmentM I N D
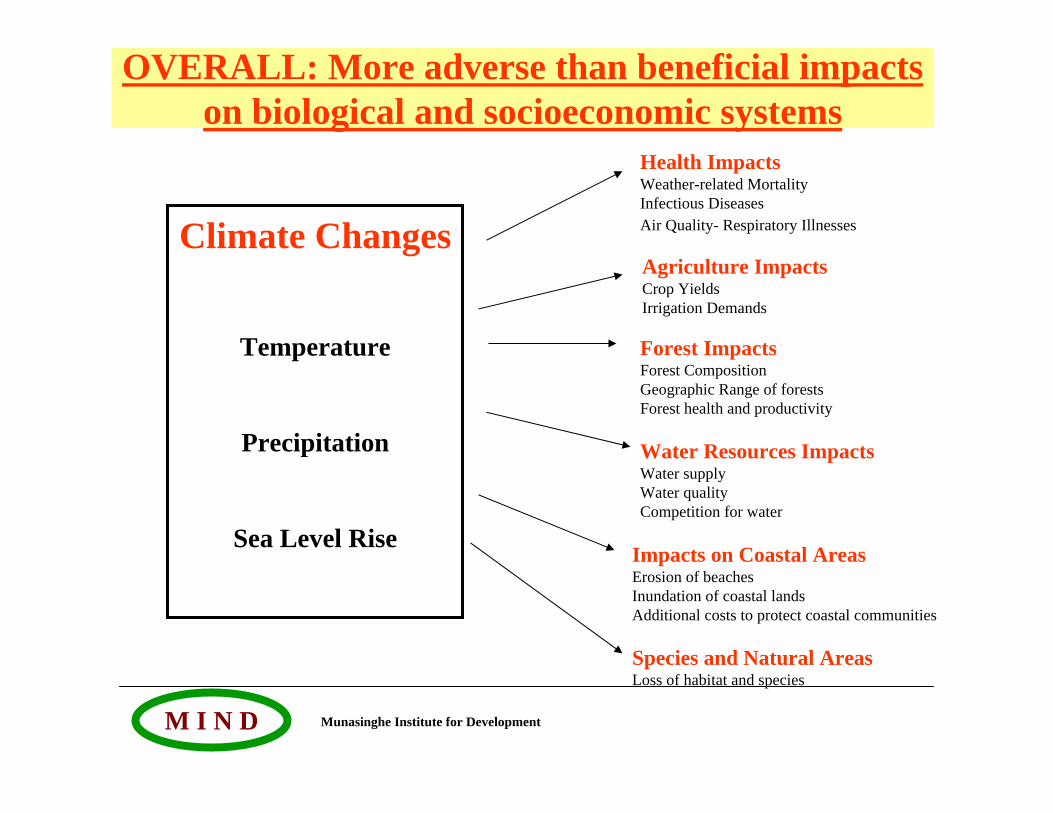
OVERALL: More adverse than beneficial impacts on biological and socioeconomic systems
Climate Changes
Temperature
Precipitation
Sea Level Rise
Health ImpactsWeather-related MortalityInfectious DiseasesAir Quality- Respiratory Illnesses
Agriculture ImpactsCrop YieldsIrrigation Demands
Forest ImpactsForest CompositionGeographic Range of forestsForest health and productivity
Water Resources ImpactsWater supplyWater qualityCompetition for water
Impacts on Coastal AreasErosion of beachesInundation of coastal landsAdditional costs to protect coastal communities
Species and Natural AreasLoss of habitat and species
Munasinghe Institute for DevelopmentM I N D
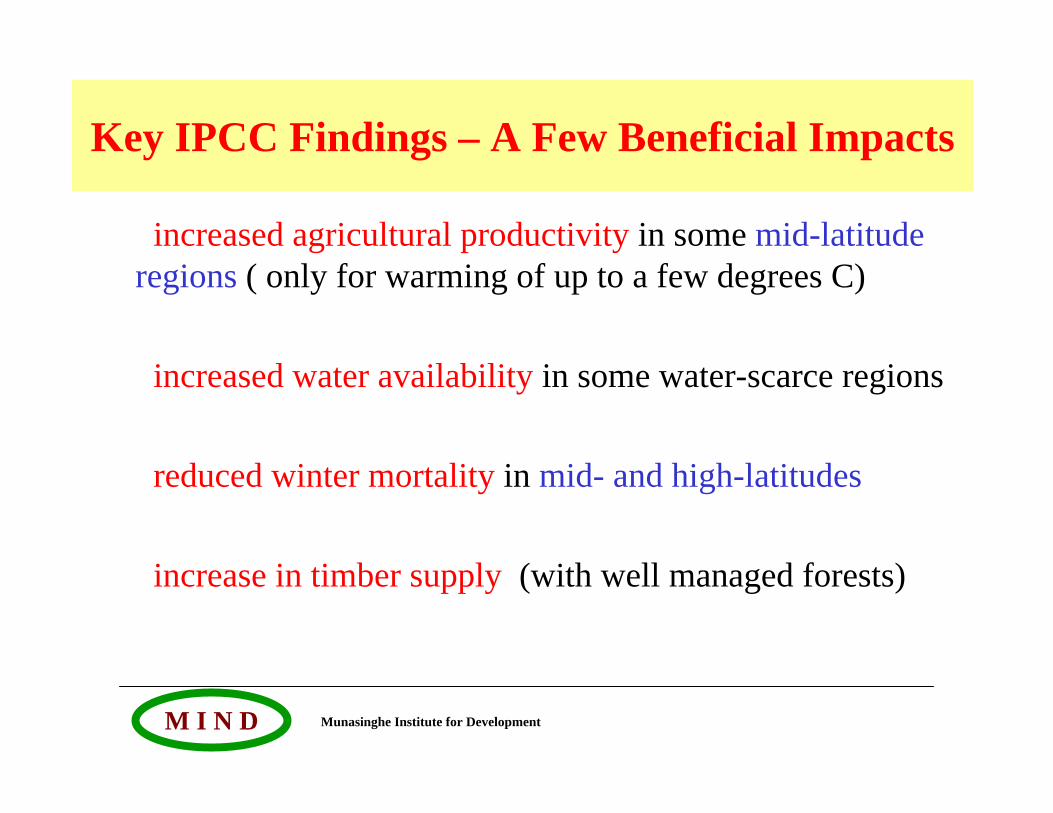
Key IPCC Findings – A Few Beneficial Impacts
increased agricultural productivity in some mid-latitude regions ( only for warming of up to a few degrees C)
increased water availability in some water-scarce regions
reduced winter mortality in mid- and high-latitudes
increase in timber supply (with well managed forests)
Munasinghe Institute for DevelopmentM I N D
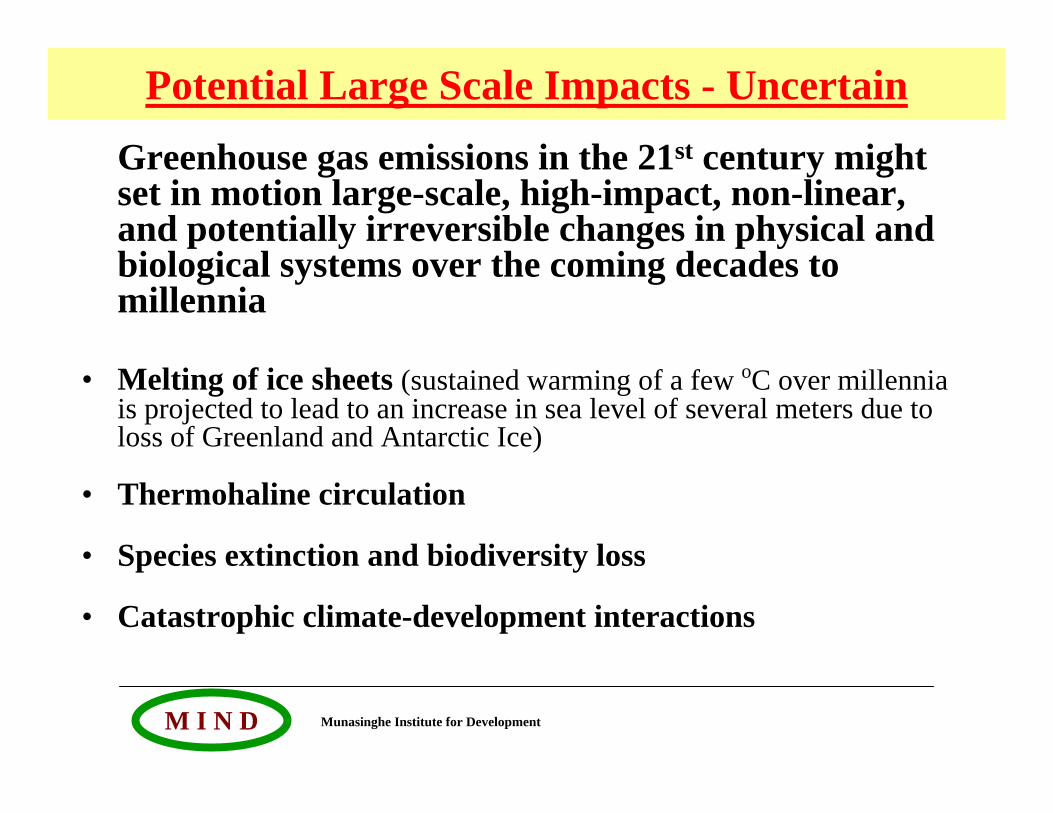
Greenhouse gas emissions in the 21st century might set in motion large-scale, high-impact, non-linear, and potentially irreversible changes in physical and biological systems over the coming decades to millennia
• Melting of ice sheets (sustained warming of a few oC over millennia is projected to lead to an increase in sea level of several meters due to loss of Greenland and Antarctic Ice)
• Thermohaline circulation
• Species extinction and biodiversity loss
• Catastrophic climate-development interactions
Potential Large Scale Impacts - Uncertain
Munasinghe Institute for DevelopmentM I N D
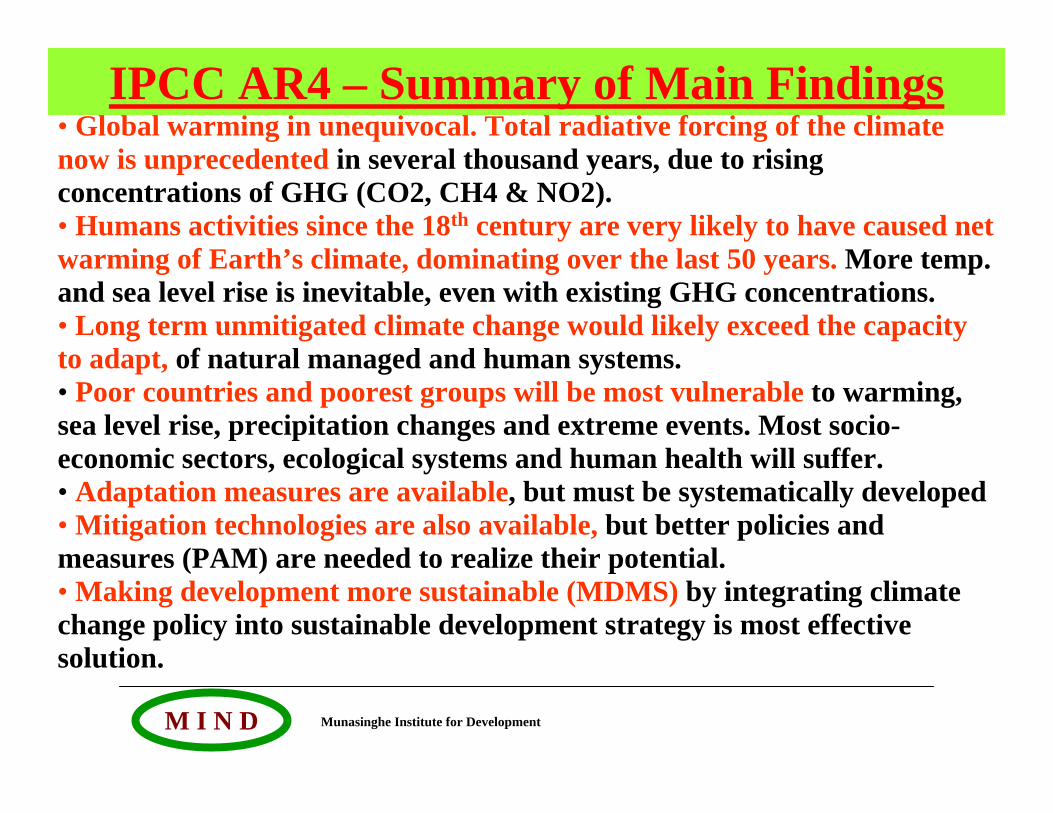
IPCC AR4 – Summary of Main Findings• Global warming in unequivocal. Total radiative forcing of the climate now is unprecedented in several thousand years, due to rising concentrations of GHG (CO2, CH4 & NO2). • Humans activities since the 18th century are very likely to have caused net warming of Earth’s climate, dominating over the last 50 years. More temp. and sea level rise is inevitable, even with existing GHG concentrations.• Long term unmitigated climate change would likely exceed the capacity to adapt, of natural managed and human systems.• Poor countries and poorest groups will be most vulnerable to warming, sea level rise, precipitation changes and extreme events. Most socio-economic sectors, ecological systems and human health will suffer.• Adaptation measures are available, but must be systematically developed • Mitigation technologies are also available, but better policies and measures (PAM) are needed to realize their potential. • Making development more sustainable (MDMS) by integrating climate change policy into sustainable development strategy is most effective solution.
Munasinghe Institute for DevelopmentM I N D
Why CC is important for SD
Key Motivations for Seeking More Sustainable
Development Paths
Munasinghe Institute for DevelopmentM I N D
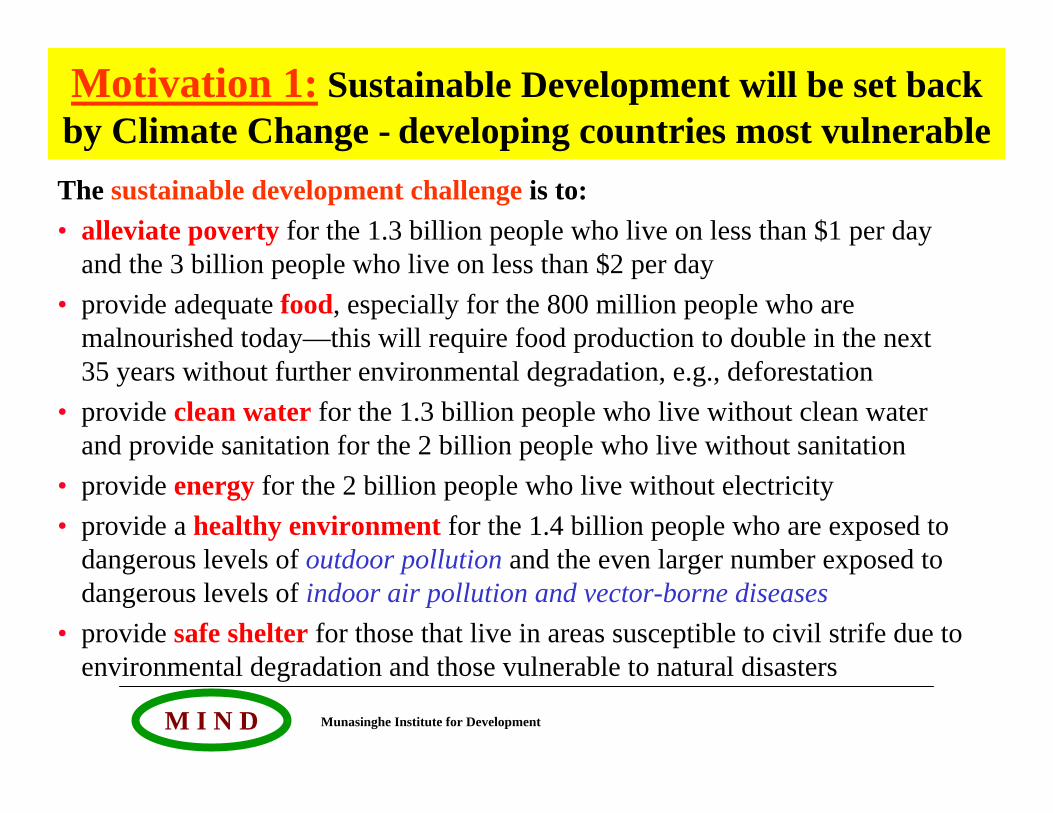
The sustainable development challenge is to:• alleviate poverty for the 1.3 billion people who live on less than $1 per day
and the 3 billion people who live on less than $2 per day• provide adequate food, especially for the 800 million people who are
malnourished today—this will require food production to double in the next 35 years without further environmental degradation, e.g., deforestation
• provide clean water for the 1.3 billion people who live without clean water and provide sanitation for the 2 billion people who live without sanitation
• provide energy for the 2 billion people who live without electricity• provide a healthy environment for the 1.4 billion people who are exposed to
dangerous levels of outdoor pollution and the even larger number exposed to dangerous levels of indoor air pollution and vector-borne diseases
• provide safe shelter for those that live in areas susceptible to civil strife due toenvironmental degradation and those vulnerable to natural disasters
Motivation 1: Sustainable Development will be set back by Climate Change - developing countries most vulnerable
Munasinghe Institute for DevelopmentM I N D
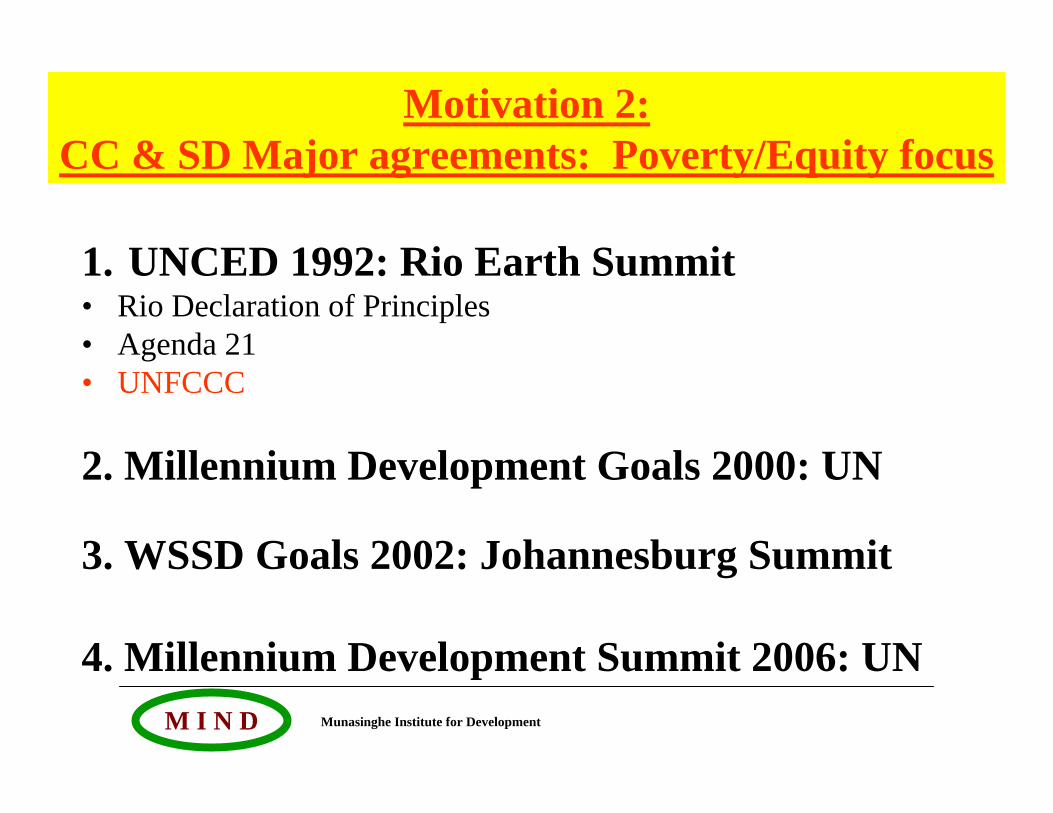
1. UNCED 1992: Rio Earth Summit• Rio Declaration of Principles• Agenda 21• UNFCCC
2. Millennium Development Goals 2000: UN
3. WSSD Goals 2002: Johannesburg Summit
4. Millennium Development Summit 2006: UN
Motivation 2:CC & SD Major agreements: Poverty/Equity focus
Munasinghe Institute for DevelopmentM I N D
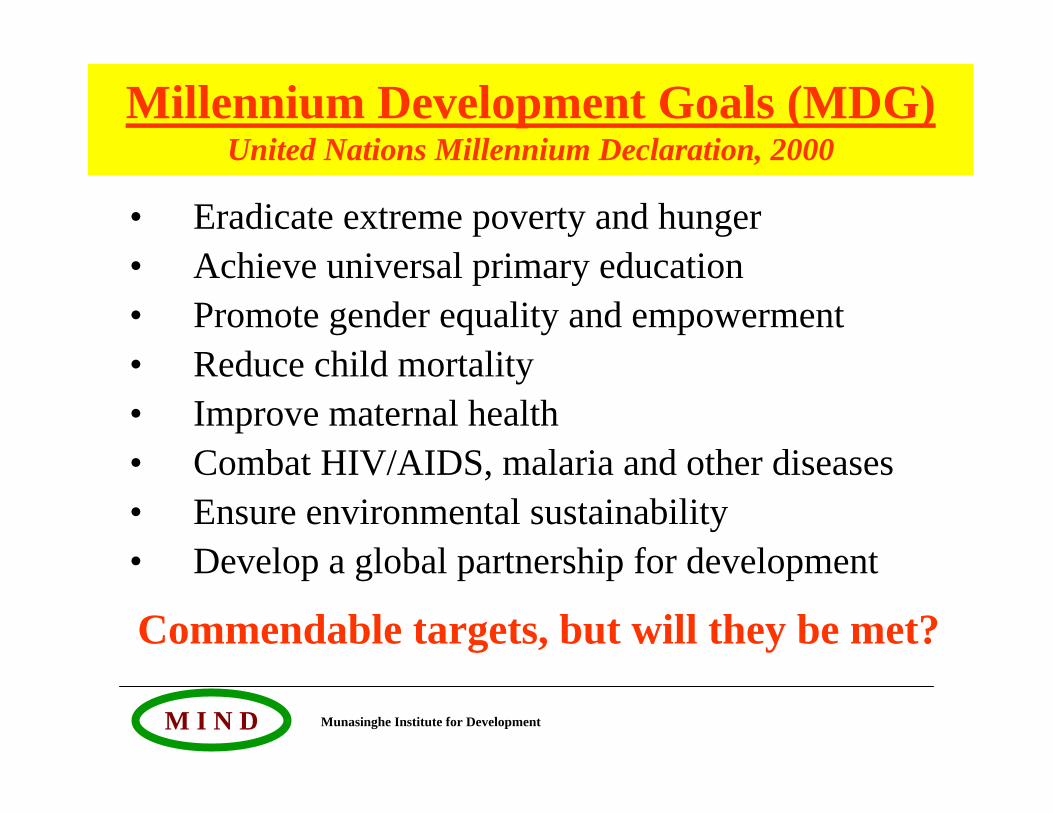
Millennium Development Goals (MDG)United Nations Millennium Declaration, 2000
• Eradicate extreme poverty and hunger• Achieve universal primary education• Promote gender equality and empowerment• Reduce child mortality• Improve maternal health• Combat HIV/AIDS, malaria and other diseases• Ensure environmental sustainability• Develop a global partnership for development
Commendable targets, but will they be met?
Munasinghe Institute for DevelopmentM I N D
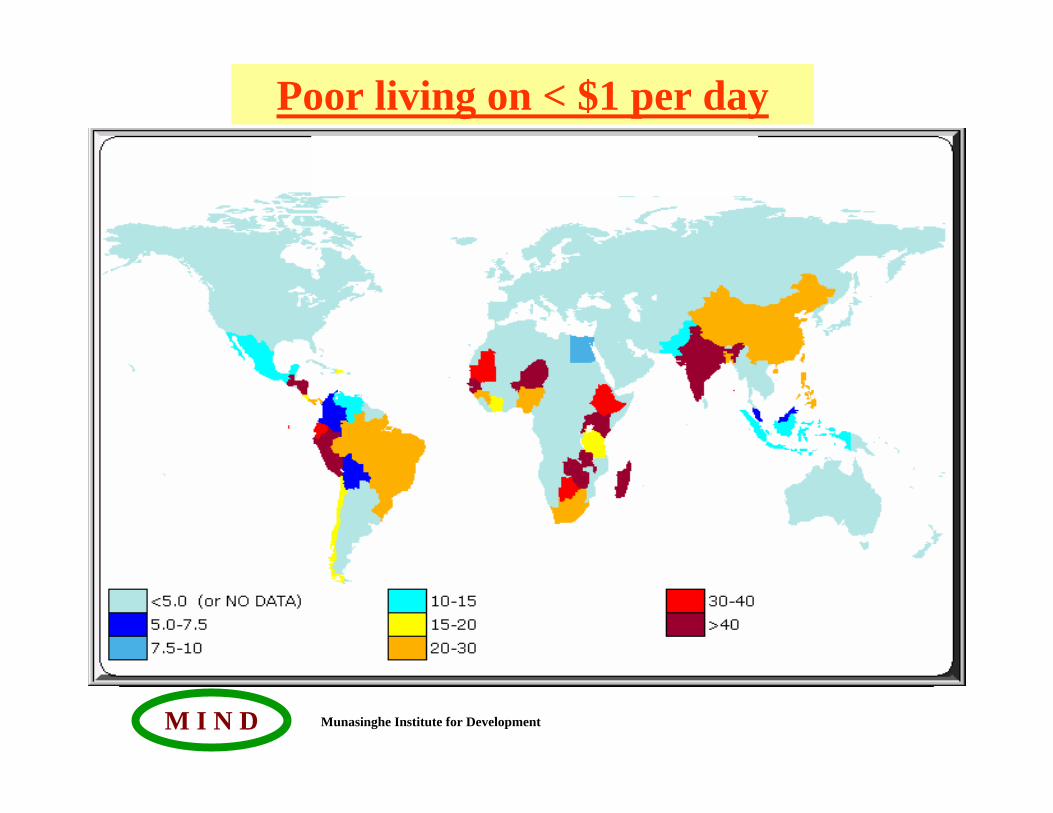
Poor living on < $1 per day
Munasinghe Institute for DevelopmentM I N D
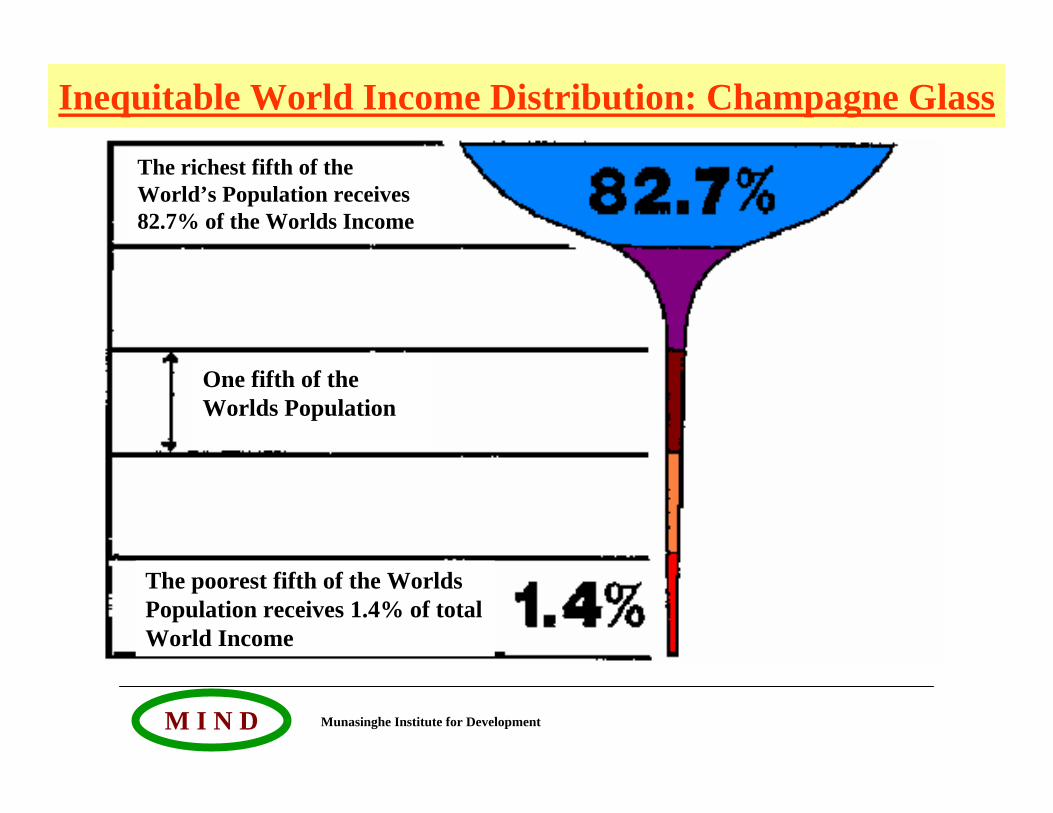
Inequitable World Income Distribution: Champagne Glass
The richest fifth of the World’s Population receives 82.7% of the Worlds Income
One fifth of the Worlds Population
The poorest fifth of the Worlds Population receives 1.4% of total World Income
Munasinghe Institute for DevelopmentM I N D
Article 2Stabilize atmospheric GHG concentrations to prevent ‘dangerous’ anthropogenic inteference in the climate system:• enable economic development to proceed in a sustainable manner• ensure food production is not threatened• allow ecosystems to adapt naturally____________________________________________UNFCCC also speaks of “common but differentiated responsibilities”
Motivation 3: UN Framework Convention on Climate Change 1992
Munasinghe Institute for DevelopmentM I N D
Adaptation Burden & Equity: CC SDAdaptation is the first priority of developing countries that
are most vulnerable to climate change• Climate change is likely to impact disproportionately
upon the poorest countries and the poorest persons within all countries, exacerbating inequities in health status and access to adequate food, clean water and other resources.
• Net economic effects will be negative in most developing countries
• Impacts will be worse - many areas are already flood and drought prone, and economic sectors are climate sensitive
• Lower capacity to adapt because of a lack of financial, institutional and technological capacity, and access to knowledge
Munasinghe Institute for DevelopmentM I N D
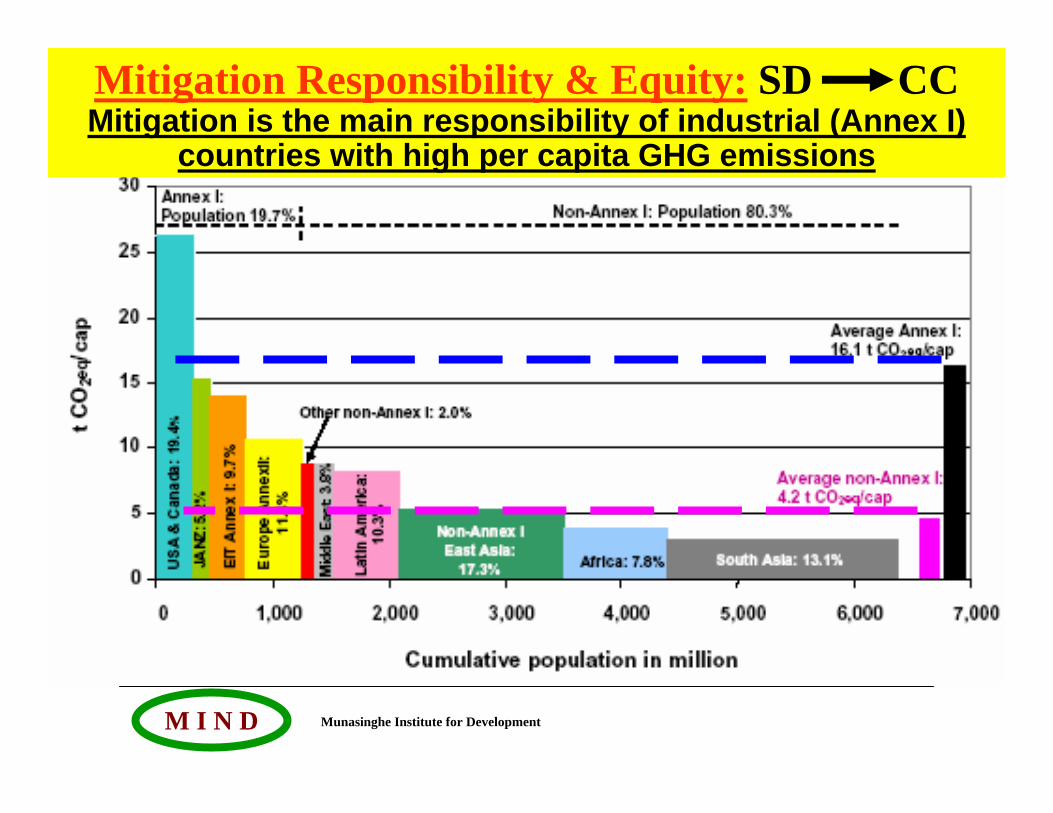
Per capita GHG emissions and population 2004Mitigation Responsibility & Equity: SD CCMitigation is the main responsibility of industrial (Annex I)
countries with high per capita GHG emissions
Munasinghe Institute for DevelopmentM I N D
Motivation 4:
Global Long Term Perspectives• Lessons of History
• Future Scenarios
Munasinghe Institute for DevelopmentM I N D
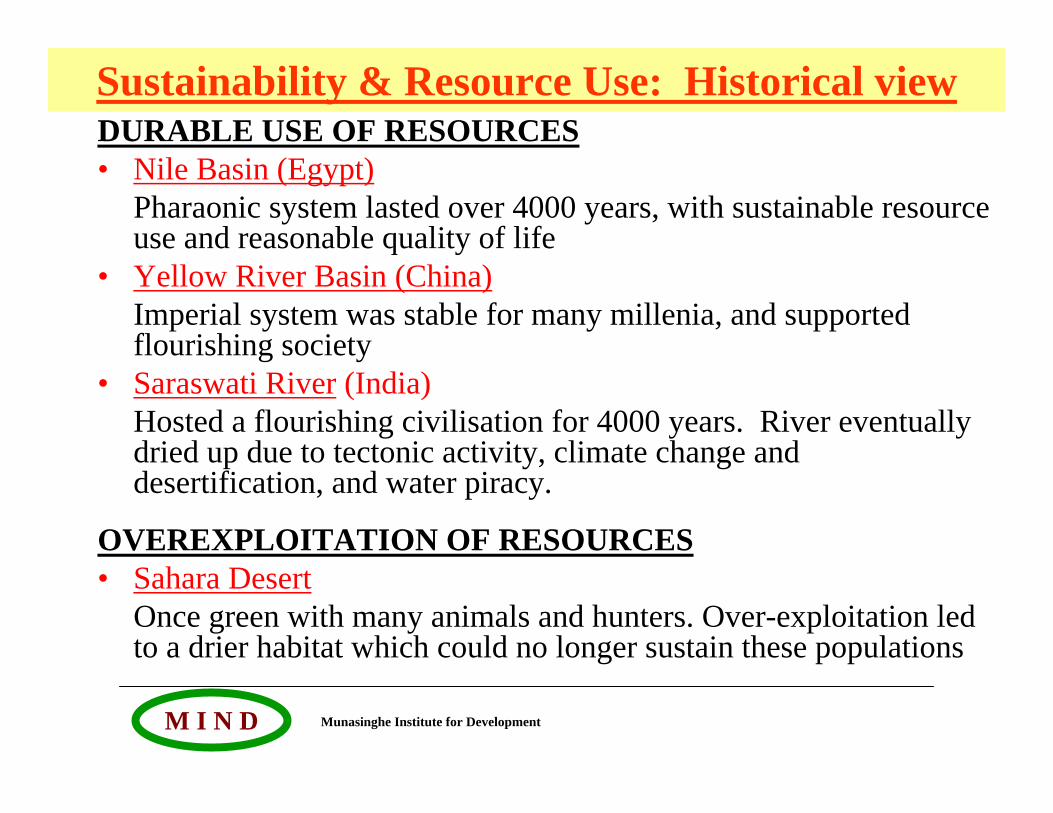
Sustainability & Resource Use: Historical viewDURABLE USE OF RESOURCES• Nile Basin (Egypt)
Pharaonic system lasted over 4000 years, with sustainable resource use and reasonable quality of life
• Yellow River Basin (China)Imperial system was stable for many millenia, and supported flourishing society
• Saraswati River (India)Hosted a flourishing civilisation for 4000 years. River eventually dried up due to tectonic activity, climate change and desertification, and water piracy.
OVEREXPLOITATION OF RESOURCES• Sahara Desert
Once green with many animals and hunters. Over-exploitation led to a drier habitat which could no longer sustain these populations
Munasinghe Institute for DevelopmentM I N D
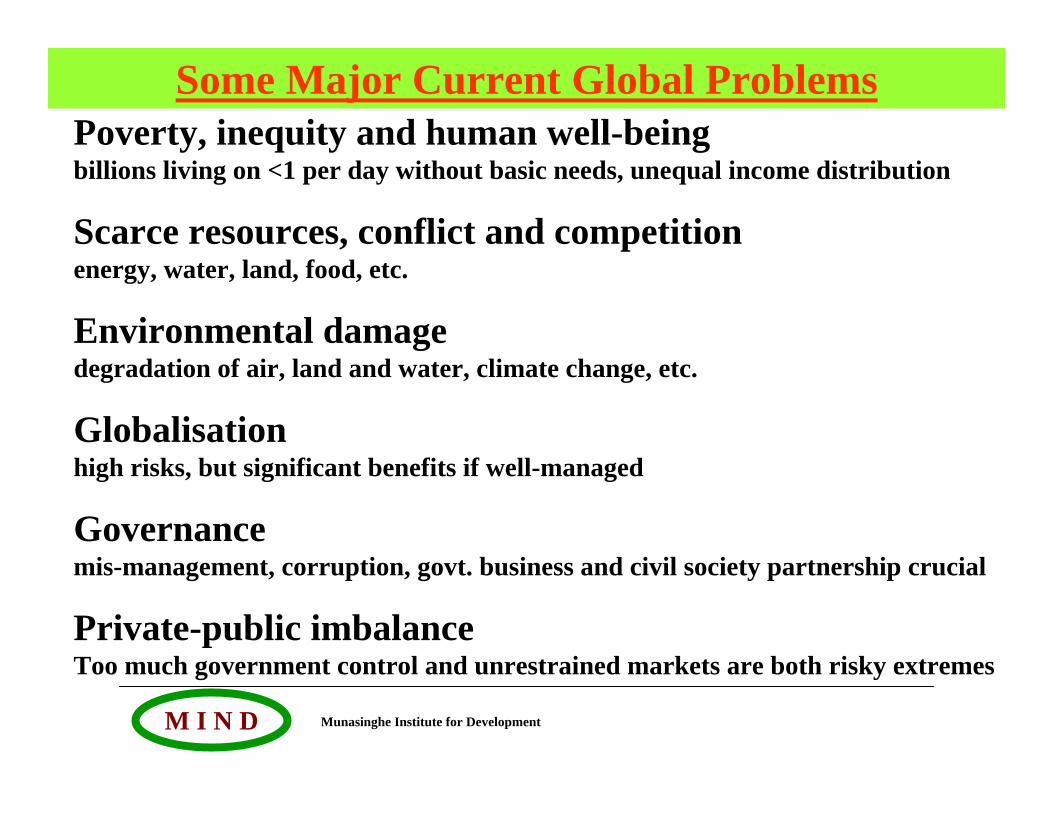
Some Major Current Global ProblemsPoverty, inequity and human well-beingbillions living on <1 per day without basic needs, unequal income distribution
Scarce resources, conflict and competitionenergy, water, land, food, etc.
Environmental damagedegradation of air, land and water, climate change, etc.
Globalisationhigh risks, but significant benefits if well-managed
Governancemis-management, corruption, govt. business and civil society partnership crucial
Private-public imbalanceToo much government control and unrestrained markets are both risky extremes
Munasinghe Institute for DevelopmentM I N D
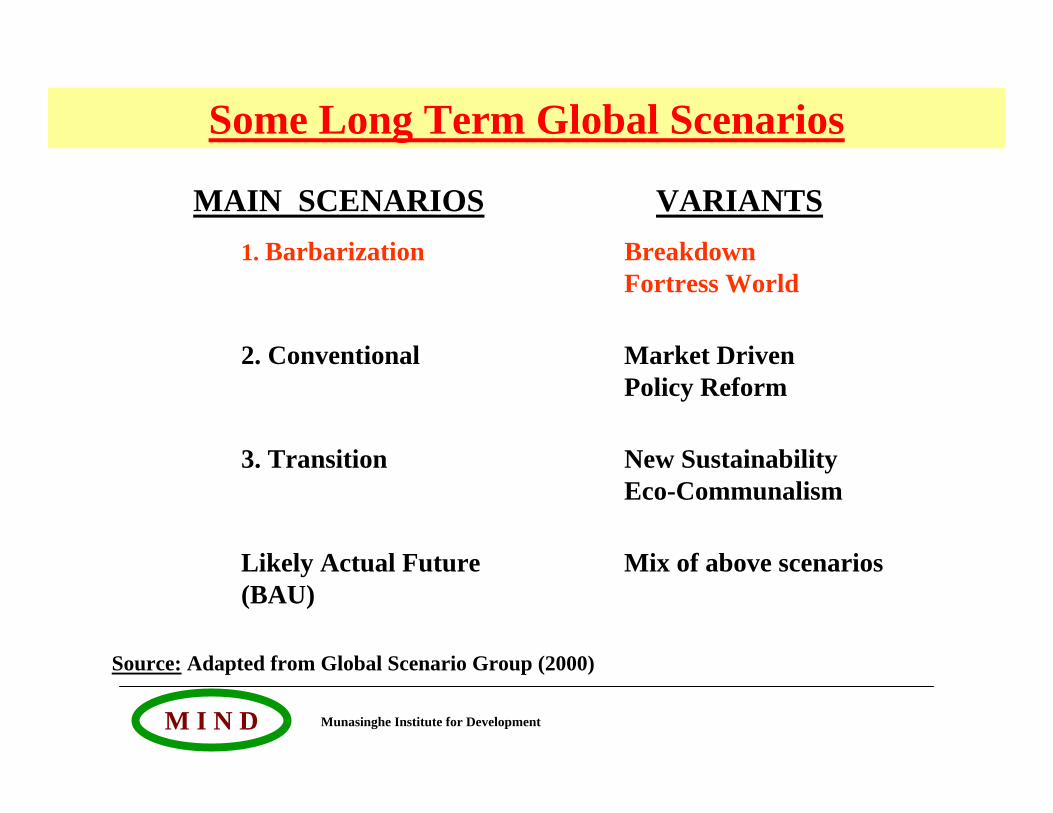
Some Long Term Global Scenarios
MAIN SCENARIOS VARIANTS1. Barbarization Breakdown
Fortress World
2. Conventional Market Driven Policy Reform
3. Transition New Sustainability Eco-Communalism
Likely Actual Future Mix of above scenarios(BAU)
Source: Adapted from Global Scenario Group (2000)
Munasinghe Institute for DevelopmentM I N D
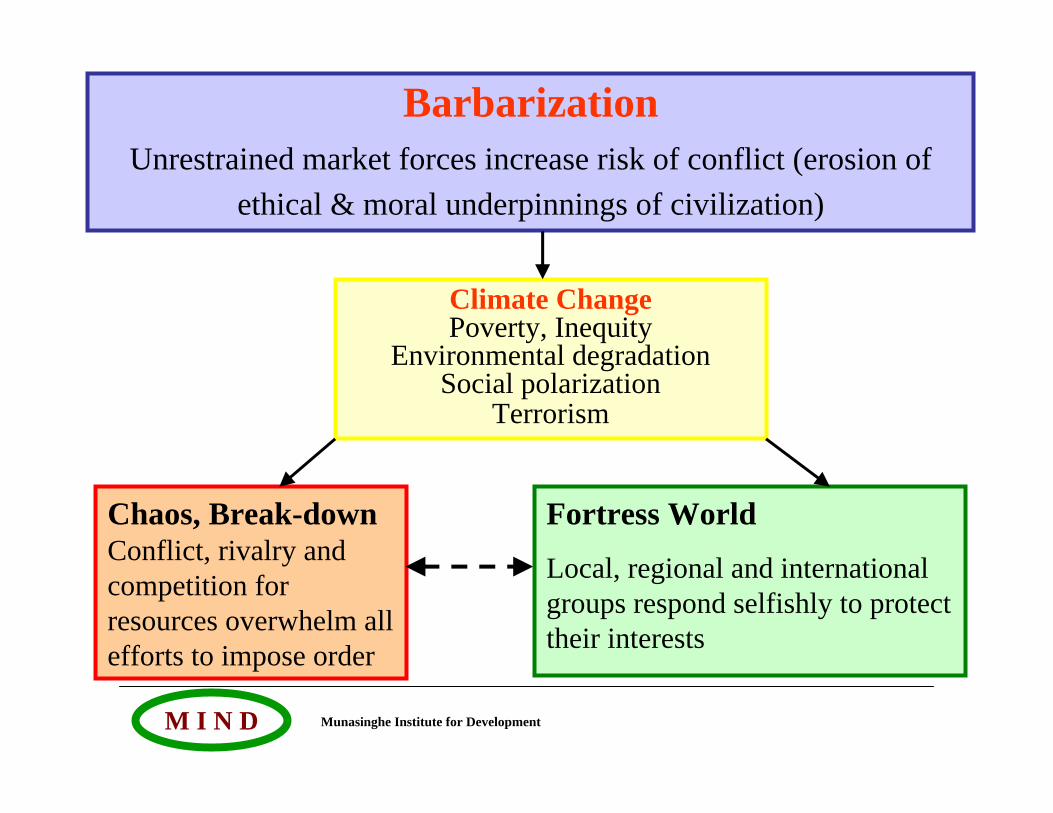
Climate ChangePoverty, Inequity
Environmental degradationSocial polarization
Terrorism
BarbarizationUnrestrained market forces increase risk of conflict (erosion of
ethical & moral underpinnings of civilization)
Chaos, Break-downConflict, rivalry and competition for resources overwhelm all efforts to impose order
Fortress World
Local, regional and international groups respond selfishly to protect their interests

Munasinghe Institute for DevelopmentM I N D
WHY ?
HOW ?
is climate a threat to future human development Climate Change (CC) undermines Sustainable Development (SD) and unfairly penalizes the poor
can we move forward to transform risky current trends into a safer and better futureStart making development more sustainable (MDMS) now, using the Sustainomics framework

Munasinghe Institute for DevelopmentM I N D
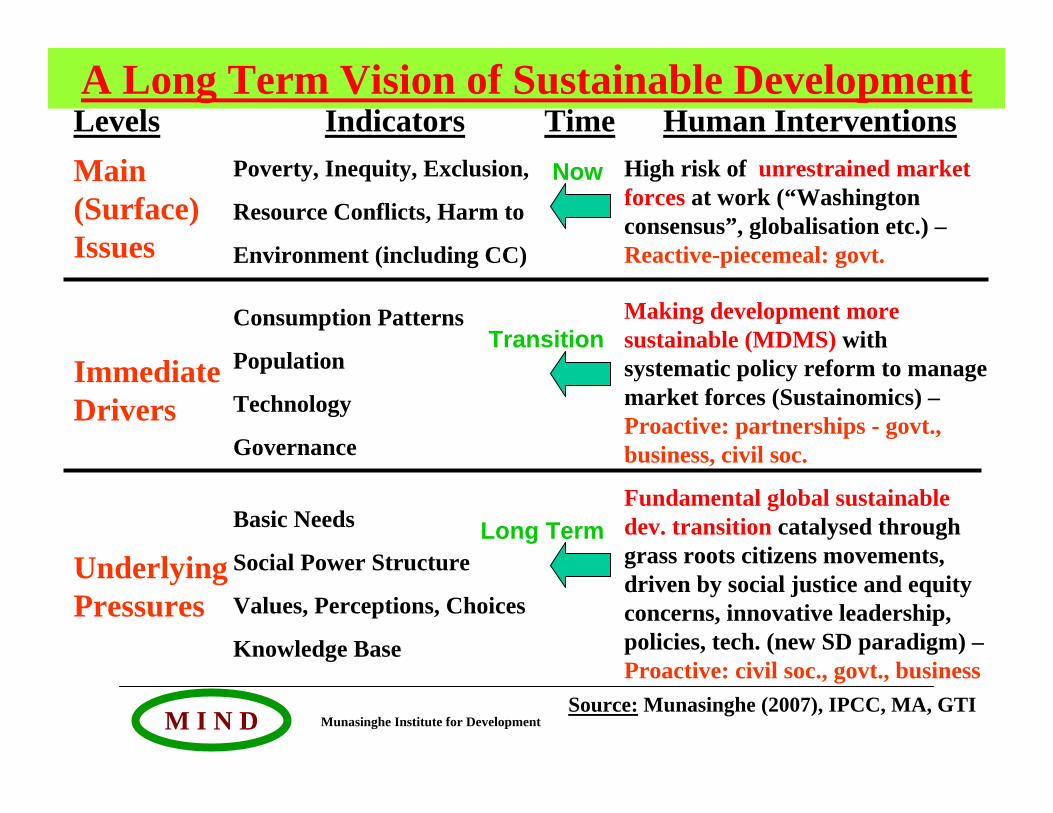
A Long Term Vision of Sustainable DevelopmentLevelsMain (Surface) Issues
ImmediateDrivers
UnderlyingPressures
IndicatorsPoverty, Inequity, Exclusion,
Resource Conflicts, Harm to
Environment (including CC)
Consumption Patterns
Population
Technology
Governance
Basic Needs
Social Power Structure
Values, Perceptions, Choices
Knowledge Base
Human InterventionsHigh risk of unrestrained market forces at work (“Washington consensus”, globalisation etc.) –Reactive-piecemeal: govt.
Making development more sustainable (MDMS) with systematic policy reform to manage market forces (Sustainomics) –Proactive: partnerships - govt., business, civil soc.
Fundamental global sustainable dev. transition catalysed through grass roots citizens movements, driven by social justice and equity concerns, innovative leadership, policies, tech. (new SD paradigm) –Proactive: civil soc., govt., business
Source: Munasinghe (2007), IPCC, MA, GTI
Now
Transition
Long Term
Time
Munasinghe Institute for DevelopmentM I N D
Tracing the Links Between Climate Change and
Sustainable Development(Sustainomics Framework)
Munasinghe Institute for DevelopmentM I N D
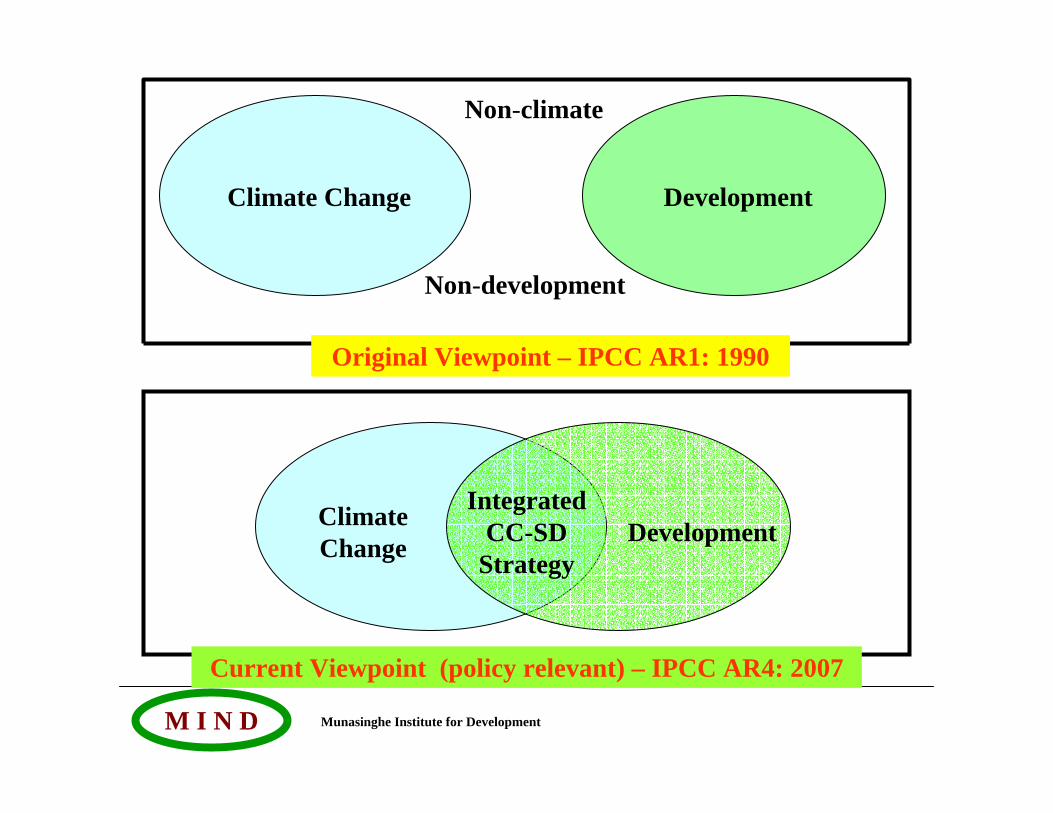
Climate Change Development
Non-climate
Non-development
`Integrated
CC-SDStrategy
Original Viewpoint – IPCC AR1: 1990
Current Viewpoint (policy relevant) – IPCC AR4: 2007
Climate Change Development
Munasinghe Institute for DevelopmentM I N D
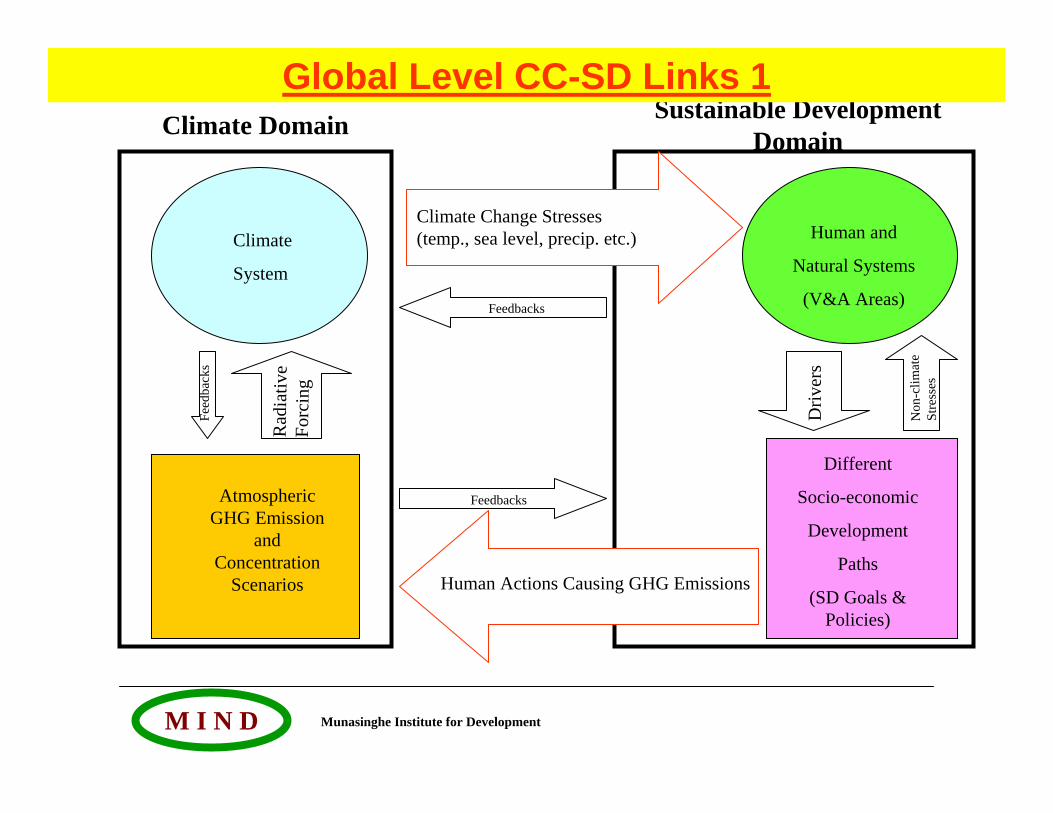
Rad
iativ
eFo
rcin
g
Climate
System
Feedbacks
Human and
Natural Systems
(V&A Areas)
Human Actions Causing GHG Emissions
Climate Domain Sustainable Development Domain
Feedbacks
Different
Socio-economic
Development
Paths
(SD Goals & Policies)
AtmosphericGHG Emission
and Concentration
Scenarios
Climate Change Stresses (temp., sea level, precip. etc.)
Driv
ers
Non
-clim
ate
Stre
sses
Feed
back
s
Global Level CC-SD Links 1

Munasinghe Institute for DevelopmentM I N D
Rad
iativ
eFo
rcin
g
Climate
System
Feedbacks
Human and
Natural Systems
(V&A Areas)
Human Actions Causing GHG Emissions
Climate Domain Sustainable Development Domain
Feedbacks
Different
Socio-economic
Development
Paths
(SD Goals & Policies)
Miti
g ati o
n
AtmosphericGHG Emission
and Concentration
Scenarios
Climate Change Stresses (temp., sea level, precip. etc.)
Ada
ptat
ion
AdaptiveCapacity
MitigativeCapacity
Econ. Soc. Envir.
Non
-clim
ate
Stre
sses
Feedbacks
Feedbacks
Feed
back
s
Global Level CC-SD Links 2
Munasinghe Institute for DevelopmentM I N D
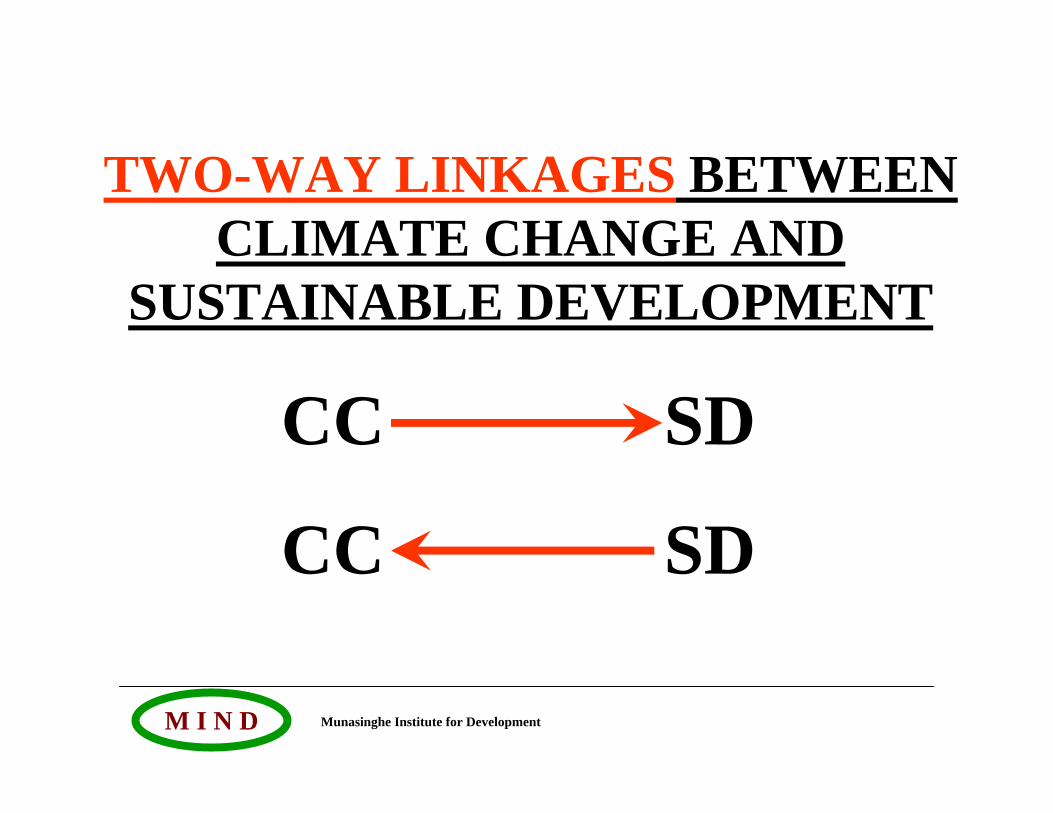
TWO-WAY LINKAGES BETWEEN CLIMATE CHANGE AND
SUSTAINABLE DEVELOPMENT
CC SD
CC SD
Munasinghe Institute for DevelopmentM I N D
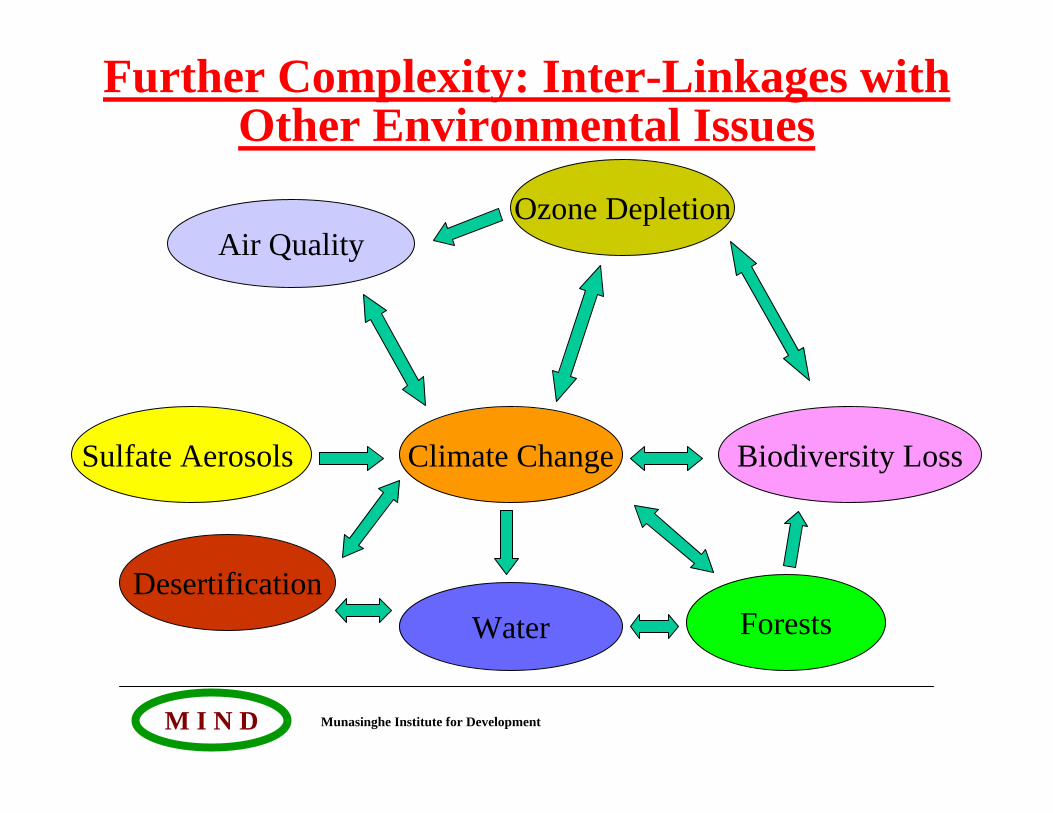
Further Complexity: Inter-Linkages with Other Environmental Issues
Water
Air QualityOzone Depletion
DesertificationForests
Sulfate Aerosols Climate Change Biodiversity Loss
Munasinghe Institute for DevelopmentM I N D
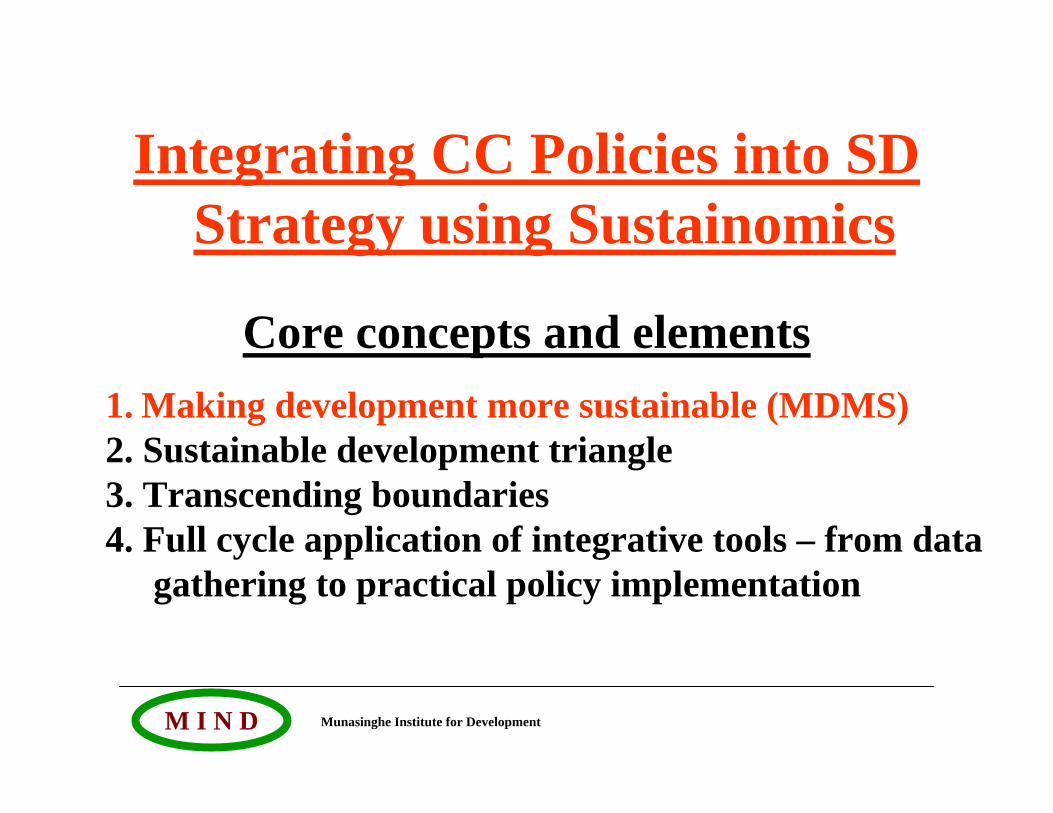
Integrating CC Policies into SD Strategy using Sustainomics
Core concepts and elements 1. Making development more sustainable (MDMS) 2. Sustainable development triangle3. Transcending boundaries4. Full cycle application of integrative tools – from data
gathering to practical policy implementation

Munasinghe Institute for DevelopmentM I N D
“development that meets the needs of the present without compromising the ability of future generations to meet their own needs”Source: Bruntland et al. (1987)
“process for improving the range of opportunitiesthat will enable individual human beings and communities to achieve their aspirations and full potential over a sustained period of time, while maintaining the resilience of economic, social and environmental systems”Source: Munasinghe (1992, Rio Earth Summit)
Understanding Sustainable Development: some (ideal) generic definitions
Munasinghe Institute for DevelopmentM I N D
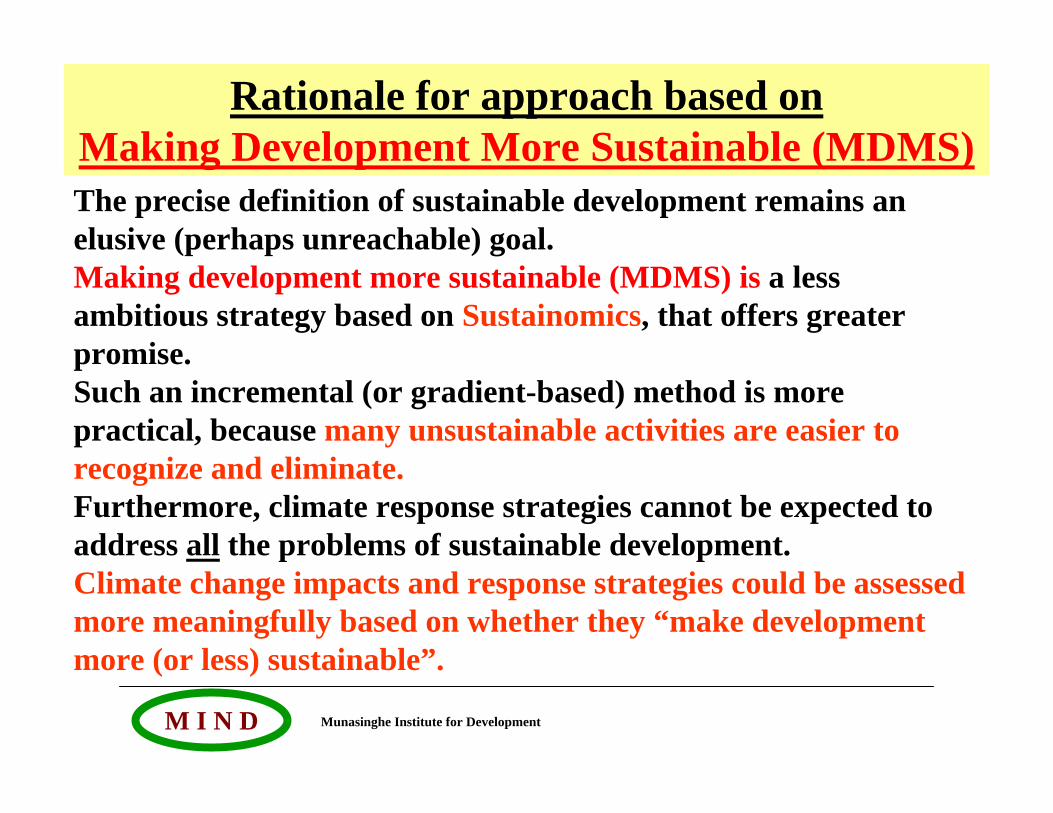
The precise definition of sustainable development remains an elusive (perhaps unreachable) goal. Making development more sustainable (MDMS) is a less ambitious strategy based on Sustainomics, that offers greater promise.Such an incremental (or gradient-based) method is more practical, because many unsustainable activities are easier to recognize and eliminate.Furthermore, climate response strategies cannot be expected to address all the problems of sustainable development. Climate change impacts and response strategies could be assessedmore meaningfully based on whether they “make development more (or less) sustainable”.
Rationale for approach based onMaking Development More Sustainable (MDMS)
Munasinghe Institute for DevelopmentM I N D
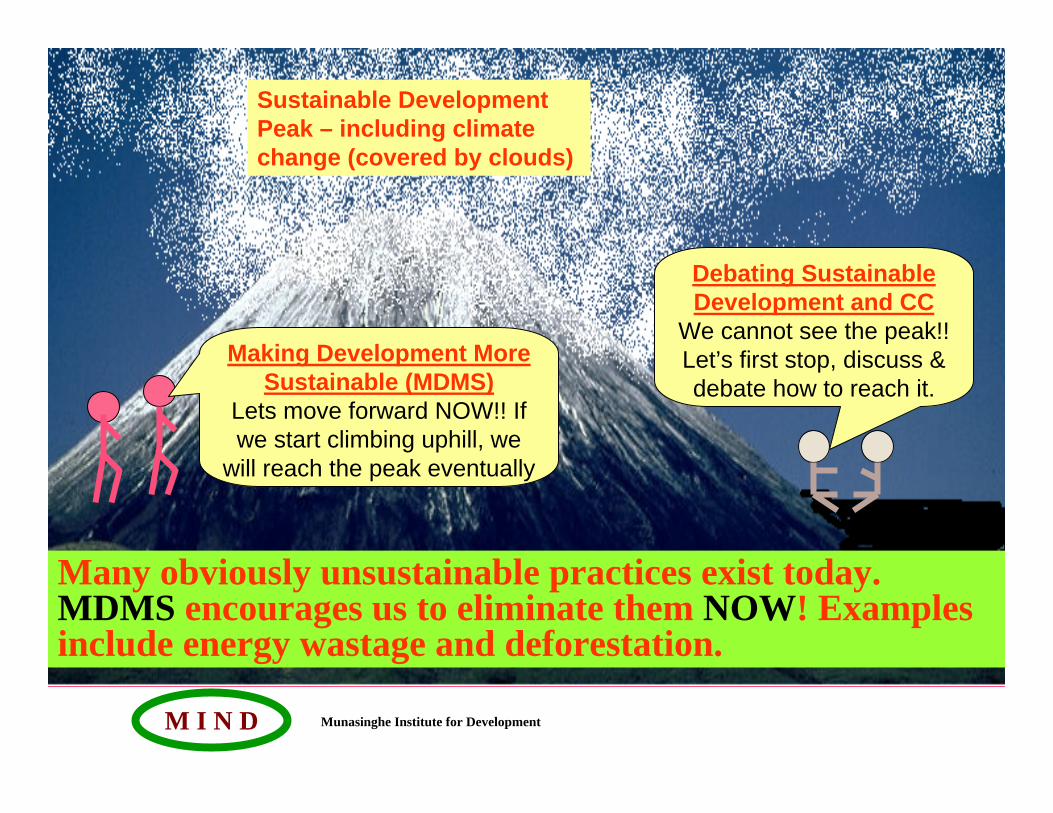
Making Development More Sustainable (MDMS)
Lets move forward NOW!! If we start climbing uphill, we
will reach the peak eventually
Debating Sustainable Development and CC
We cannot see the peak!! Let’s first stop, discuss & debate how to reach it.
Sustainable Development Peak – including climate change (covered by clouds)
Many obviously unsustainable practices exist today. MDMS encourages us to eliminate them NOW! Examples include energy wastage and deforestation.
Munasinghe Institute for DevelopmentM I N D
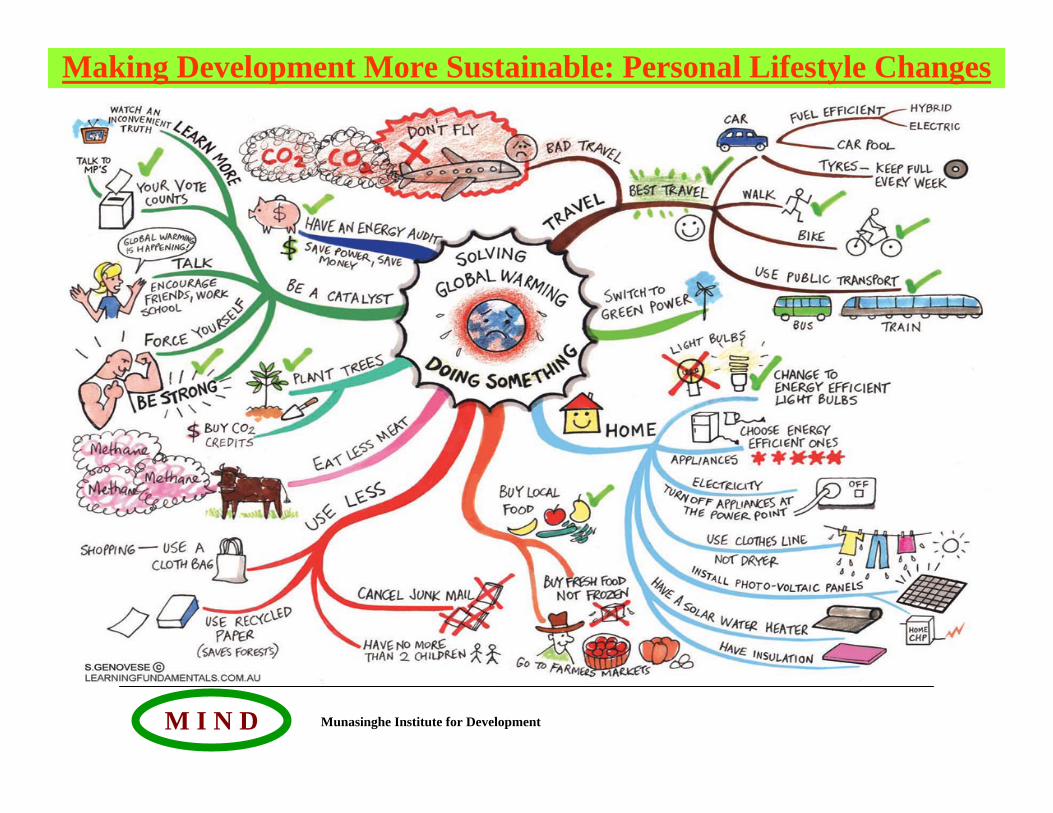
Making Development More Sustainable: Personal Lifestyle Changes
Munasinghe Institute for DevelopmentM I N D
MDMS: Corporate Social Responsibility
• Corporate Social Responsibility (CSR) is a concept whereby organizations consider the interests of society by taking responsibility for the impact of their activities on customers, suppliers, employees, shareholders, communities and the environment in all aspects of their operations.
• This obligation is seen to extend beyond the statutory and conventional obligation to comply with legislation and seek profits. It sees organizations voluntarily taking further steps to improve the quality of life for employees and their families as well as for the local community and society at large.
Munasinghe Institute for DevelopmentM I N D
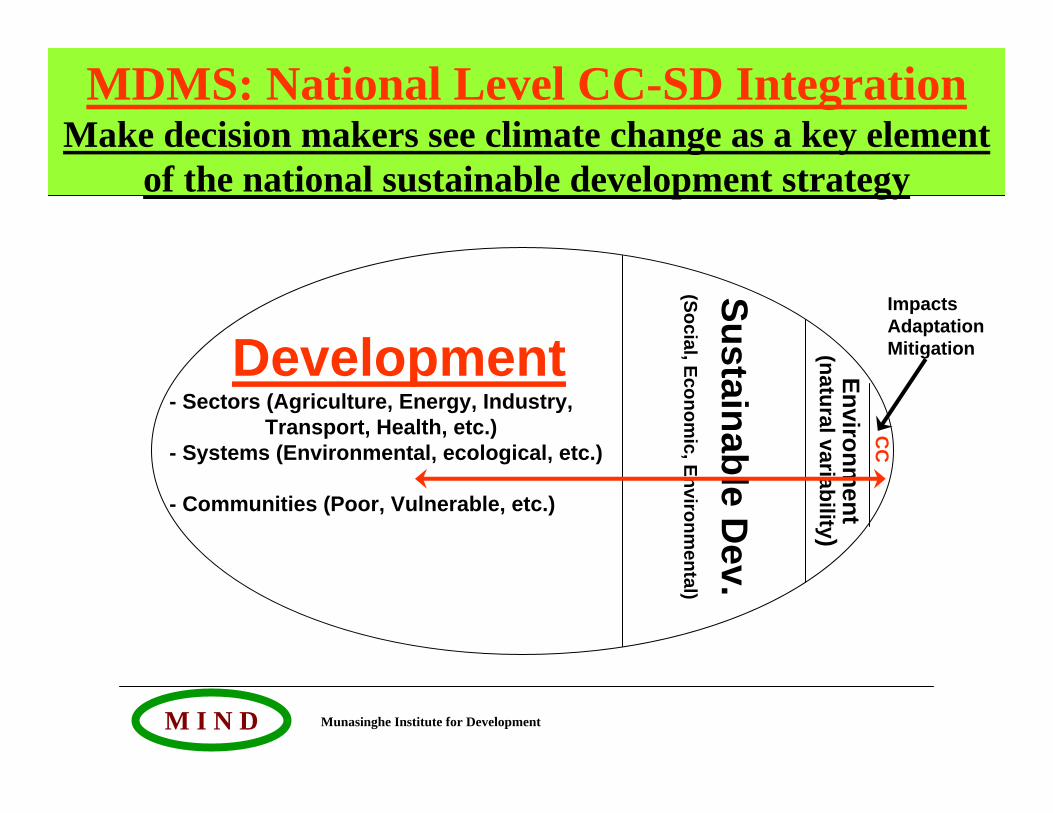
Development- Sectors (Agriculture, Energy, Industry,
Transport, Health, etc.)- Systems (Environmental, ecological, etc.)
- Communities (Poor, Vulnerable, etc.)
Sustainable Dev.
(Social, Economic, Environm
ental)
Environment
(natural variability)
CC
ImpactsAdaptationMitigation
MDMS: National Level CC-SD IntegrationMake decision makers see climate change as a key element
of the national sustainable development strategy
Munasinghe Institute for DevelopmentM I N D
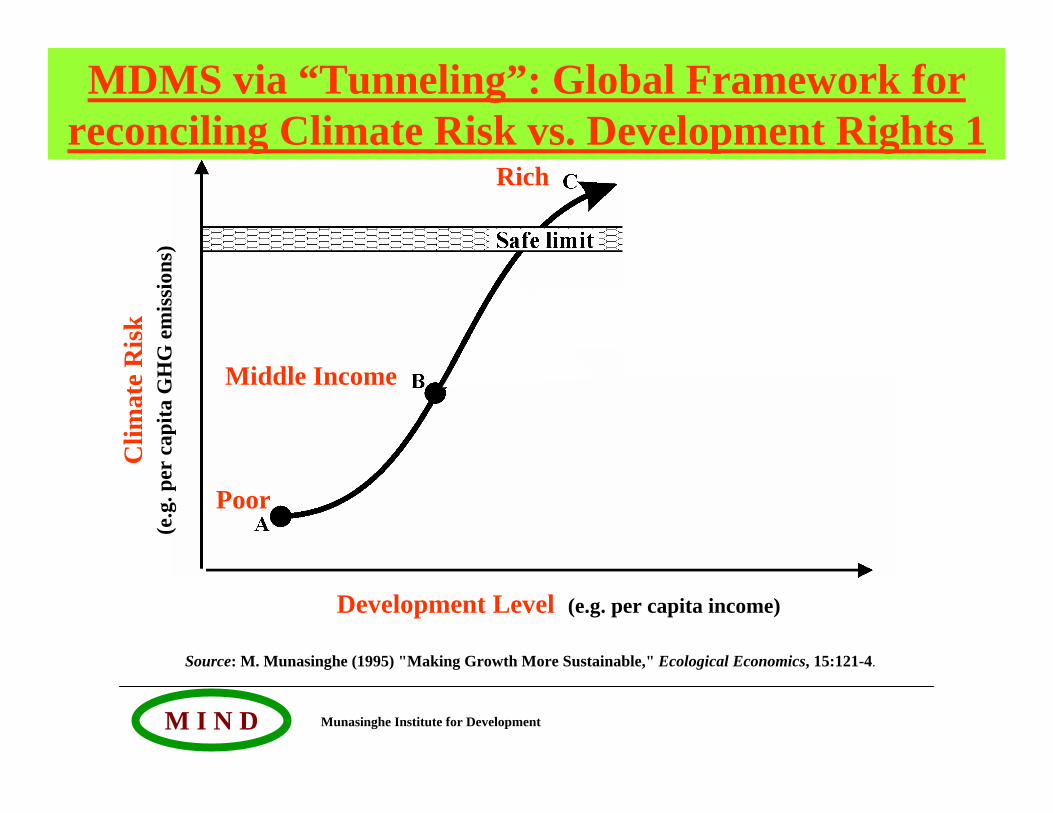
Making Development More Sustainable: Global “Tunneling” Framework for Reconciling Mitigation Burden and
Right to Develop
Climate Change Responses and Sustainable Development need not be
conflicting objectives
Munasinghe Institute for DevelopmentM I N D
Clim
ate
Ris
k(e
.g. p
er c
apita
GH
G e
mis
sion
s)
Development Level (e.g. per capita income)
MDMS via “Tunneling”: Global Framework for reconciling Climate Risk vs. Development Rights 1
Source: M. Munasinghe (1995) "Making Growth More Sustainable," Ecological Economics, 15:121-4.
Poor
Middle Income
Rich
Munasinghe Institute for DevelopmentM I N D
Clim
ate
Ris
k(e
.g. p
er c
apita
GH
G e
mis
sion
s)
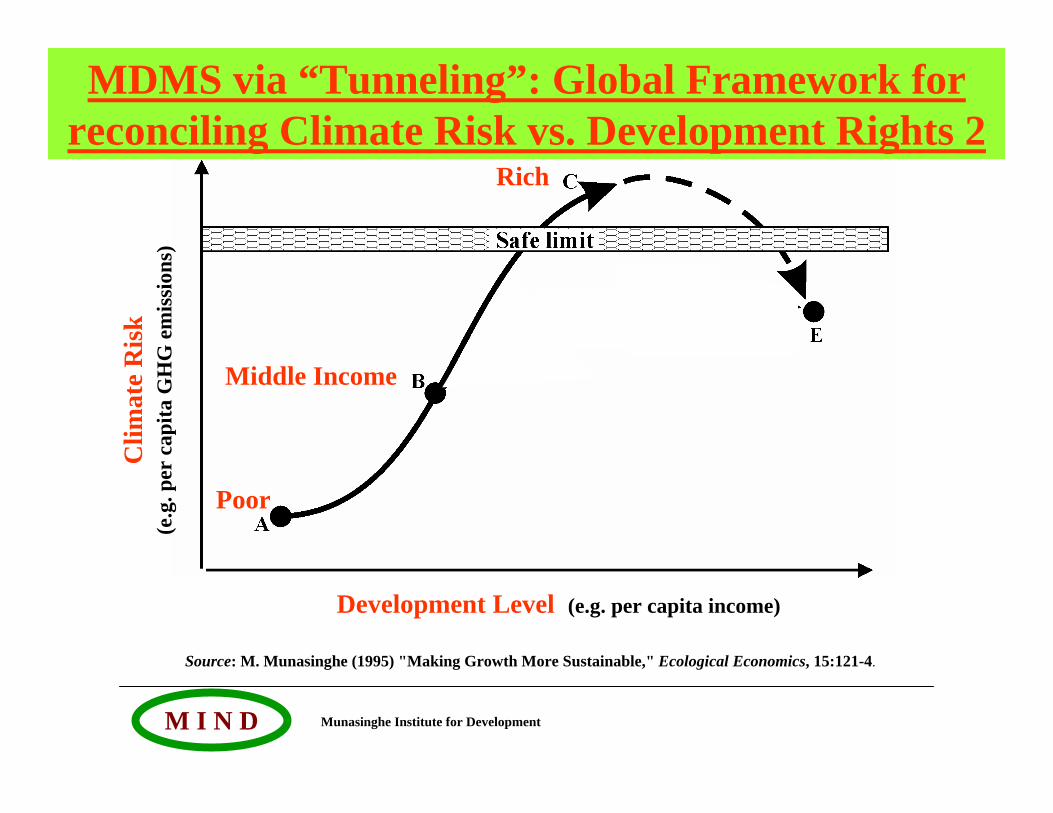
Development Level (e.g. per capita income)
MDMS via “Tunneling”: Global Framework for reconciling Climate Risk vs. Development Rights 2
Source: M. Munasinghe (1995) "Making Growth More Sustainable," Ecological Economics, 15:121-4.
Poor
Middle Income
Rich
Munasinghe Institute for DevelopmentM I N D
Clim
ate
Ris
k(e
.g. p
er c
apita
GH
G e
mis
sion
s)
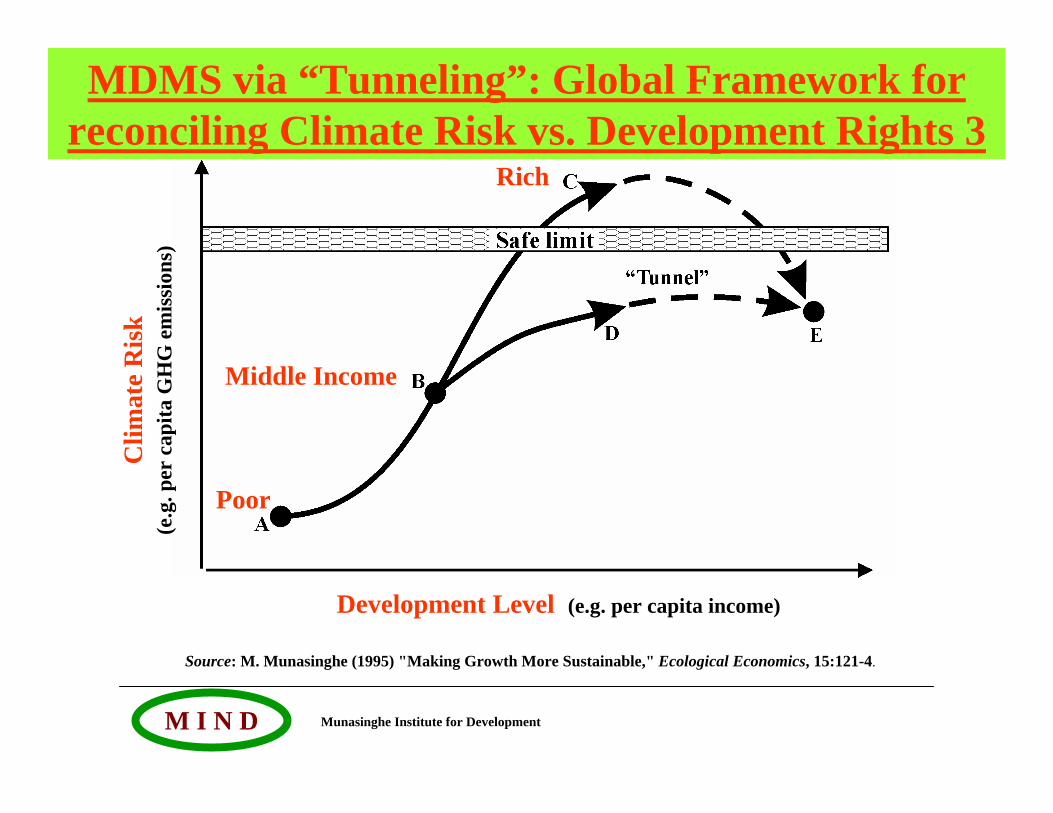
Development Level (e.g. per capita income)
MDMS via “Tunneling”: Global Framework for reconciling Climate Risk vs. Development Rights 3
Source: M. Munasinghe (1995) "Making Growth More Sustainable," Ecological Economics, 15:121-4.
Poor
Middle Income
Rich
Munasinghe Institute for DevelopmentM I N D
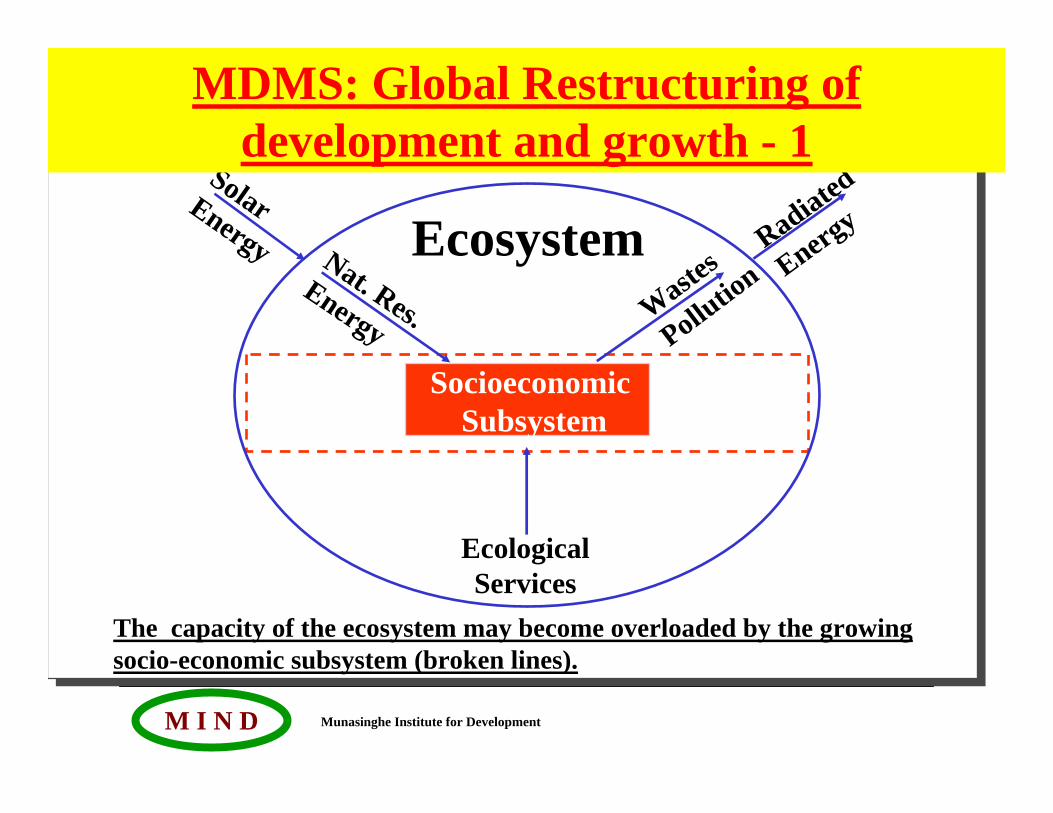
Ecosystem
EcologicalServices
SolarEnergy Radiated
Energy
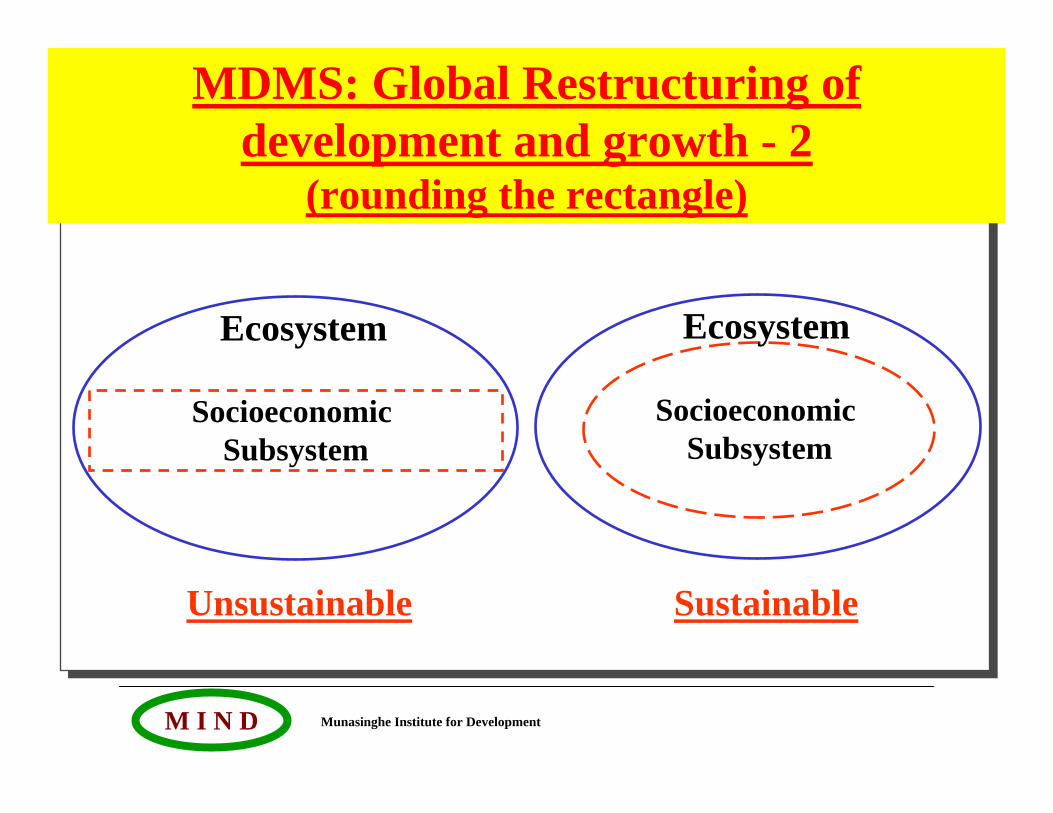
The capacity of the ecosystem may become overloaded by the growing socio-economic subsystem (broken lines).
Nat. Res.Energy Waste
s
Pollutio
n
SocioeconomicSubsystem
MDMS: Global Restructuring of development and growth - 1
Munasinghe Institute for DevelopmentM I N D
MDMS: Global Restructuring of development and growth - 2
(rounding the rectangle)
SocioeconomicSubsystem
SocioeconomicSubsystem
Unsustainable Sustainable
Ecosystem Ecosystem
Munasinghe Institute for DevelopmentM I N D
Integrating CC Policies into SD Strategy using Sustainomics
Core concepts and elements 1. Making development more sustainable (MDMS) 2. Sustainable development triangle3. Transcending boundaries4. Full cycle application of integrative tools – from data
gathering to practical policy implementation
Munasinghe Institute for DevelopmentM I N D
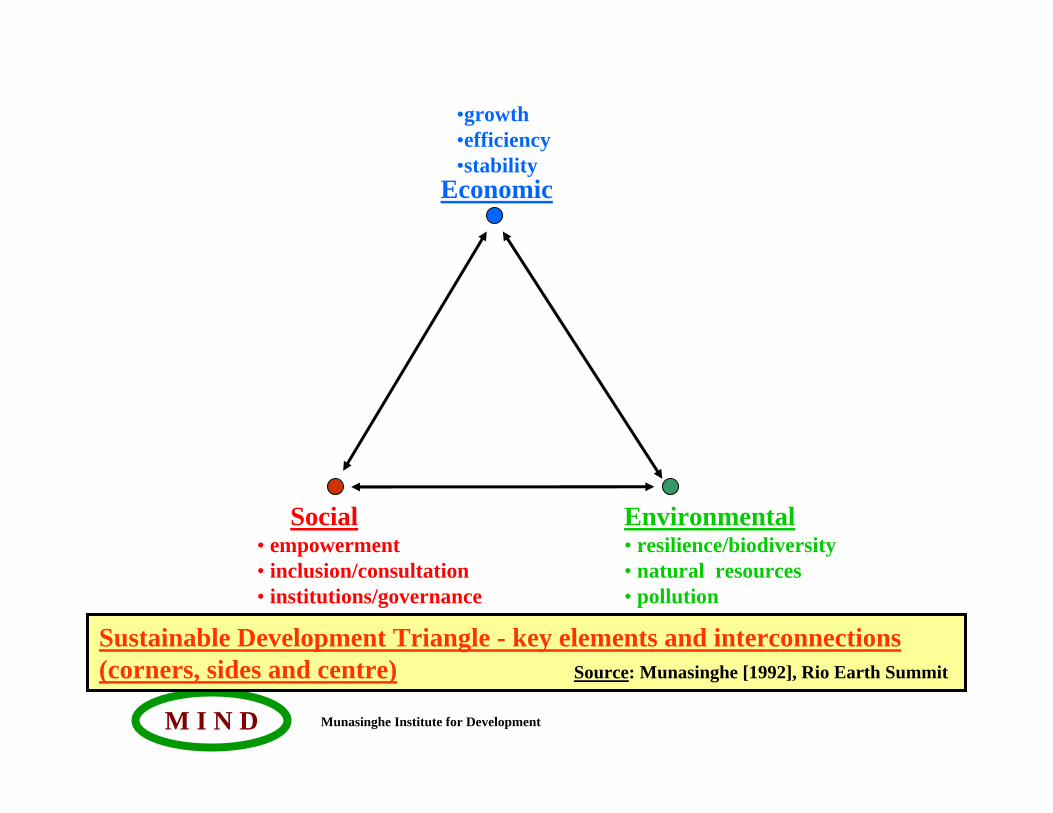
Economic
Social• empowerment• inclusion/consultation• institutions/governance
Environmental• resilience/biodiversity• natural resources• pollution
Sustainable Development Triangle - key elements and interconnections (corners, sides and centre) Source: Munasinghe [1992], Rio Earth Summit
•growth•efficiency•stability
Munasinghe Institute for DevelopmentM I N D
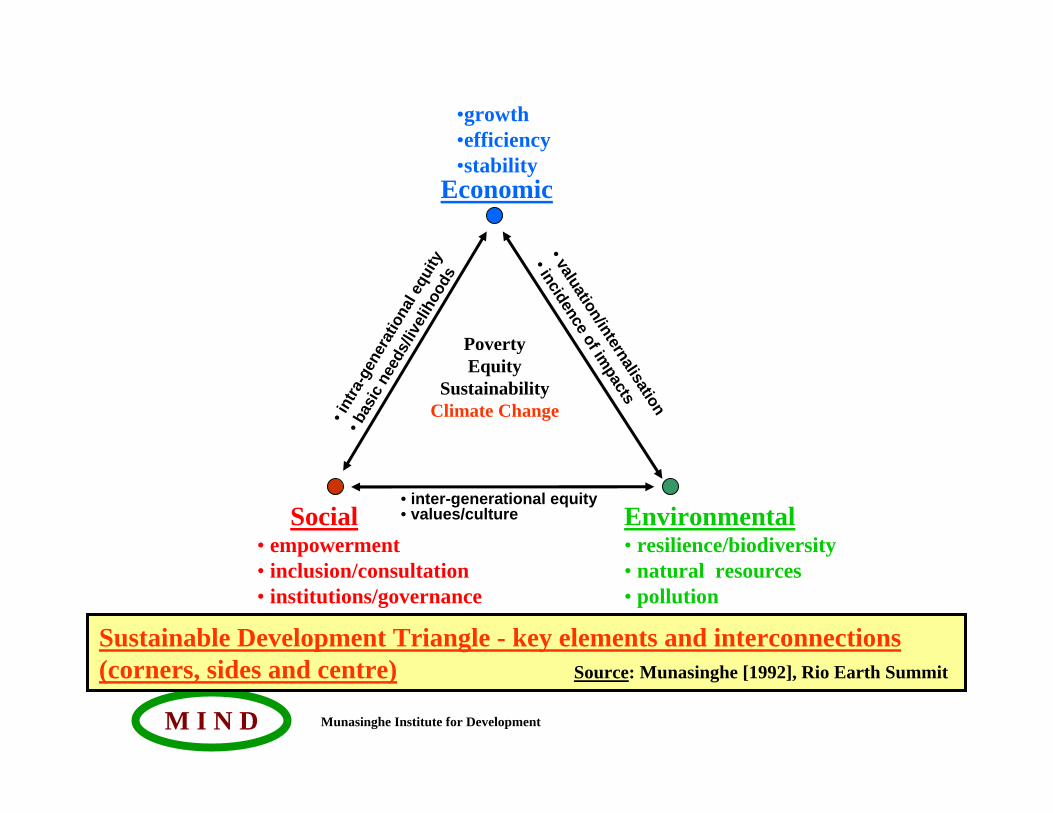
Economic
Social• empowerment• inclusion/consultation• institutions/governance
Environmental• resilience/biodiversity• natural resources• pollution
• int
ra-g
ener
atio
nal e
quity
• bas
ic n
eeds
/live
lihoo
ds
• inter-generational equity• values/culture
• valuation/internalisation
• incidence of impacts
PovertyEquity
Sustainability Climate Change
Sustainable Development Triangle - key elements and interconnections (corners, sides and centre) Source: Munasinghe [1992], Rio Earth Summit
•growth•efficiency•stability
Munasinghe Institute for DevelopmentM I N D
Integrating CC Policies into SD Strategy using Sustainomics
Core concepts and elements 1. Making development more sustainable (MDMS) 2. Sustainable development triangle3. Transcending boundaries4. Full cycle application of integrative tools – from data
gathering to practical policy implementation
Munasinghe Institute for DevelopmentM I N D
Transcending Boundaries for Sustainable Development
• Disciplinary • Space• Time • Stakeholder• Operational
Munasinghe Institute for DevelopmentM I N D
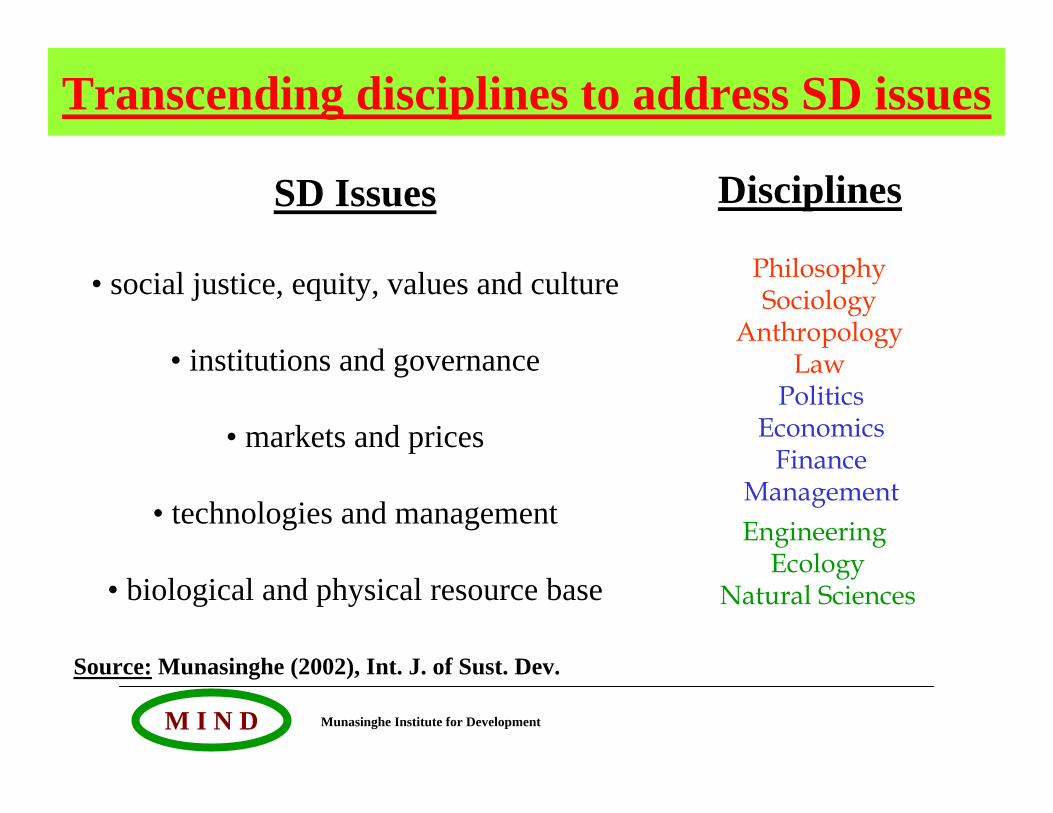
Transcending disciplines to address SD issues
SD Issues
• social justice, equity, values and culture
• institutions and governance
• markets and prices
• technologies and management
• biological and physical resource base
Engineering Ecology
Natural Sciences
PhilosophySociology
AnthropologyLaw
PoliticsEconomics
FinanceManagement
Disciplines
Source: Munasinghe (2002), Int. J. of Sust. Dev.
Munasinghe Institute for DevelopmentM I N D
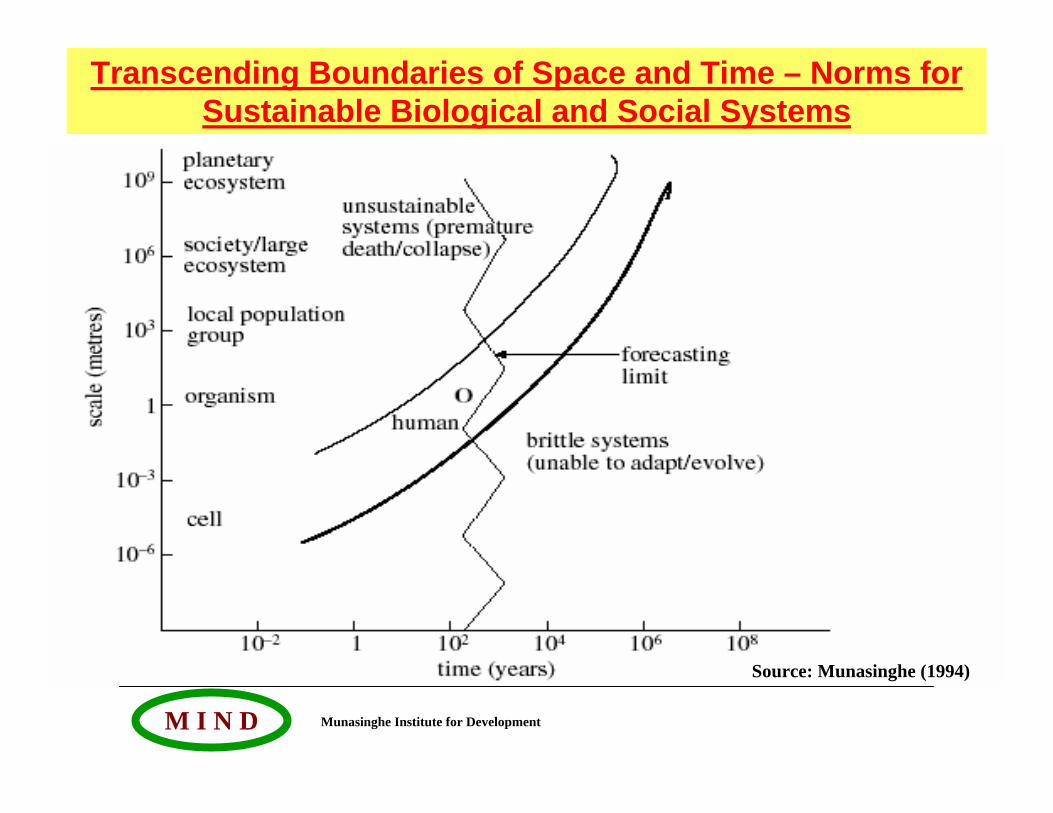
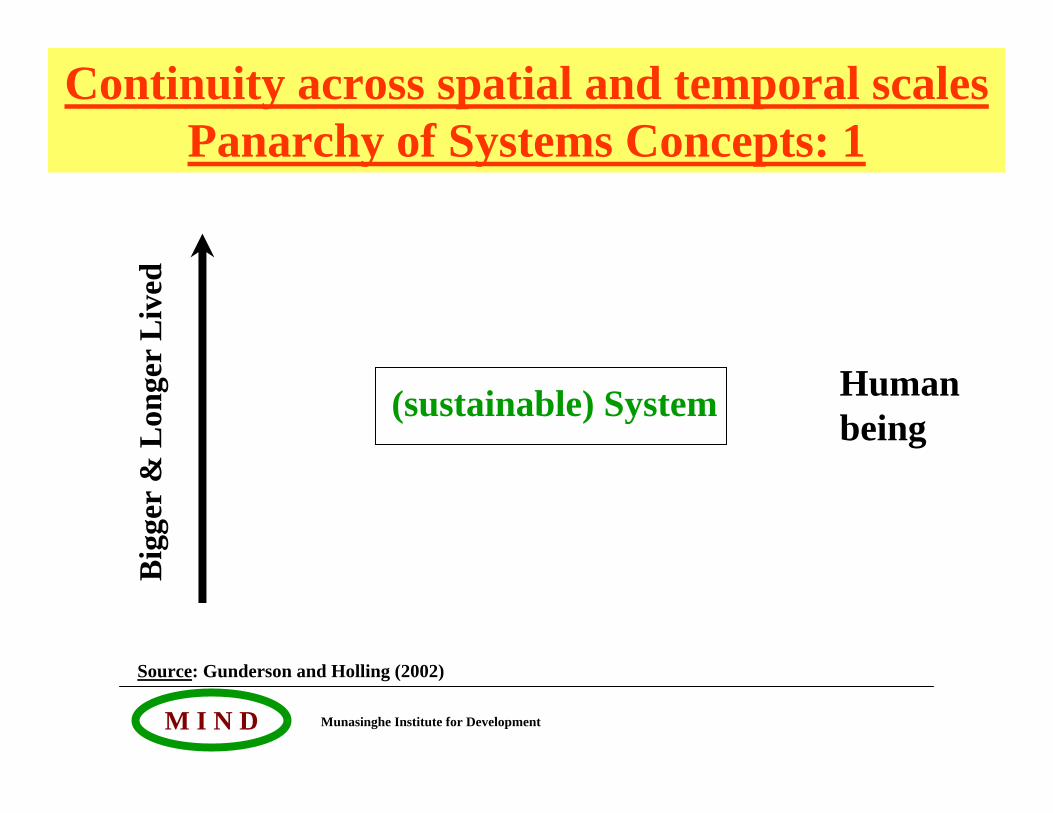
Transcending Boundaries of Space and Time – Norms for Sustainable Biological and Social Systems
Source: Munasinghe (1994)
Munasinghe Institute for DevelopmentM I N D
(sustainable) System
Continuity across spatial and temporal scales Panarchy of Systems Concepts: 1
Big
ger
& L
onge
r L
ived
Source: Gunderson and Holling (2002)
Human being
Munasinghe Institute for DevelopmentM I N D
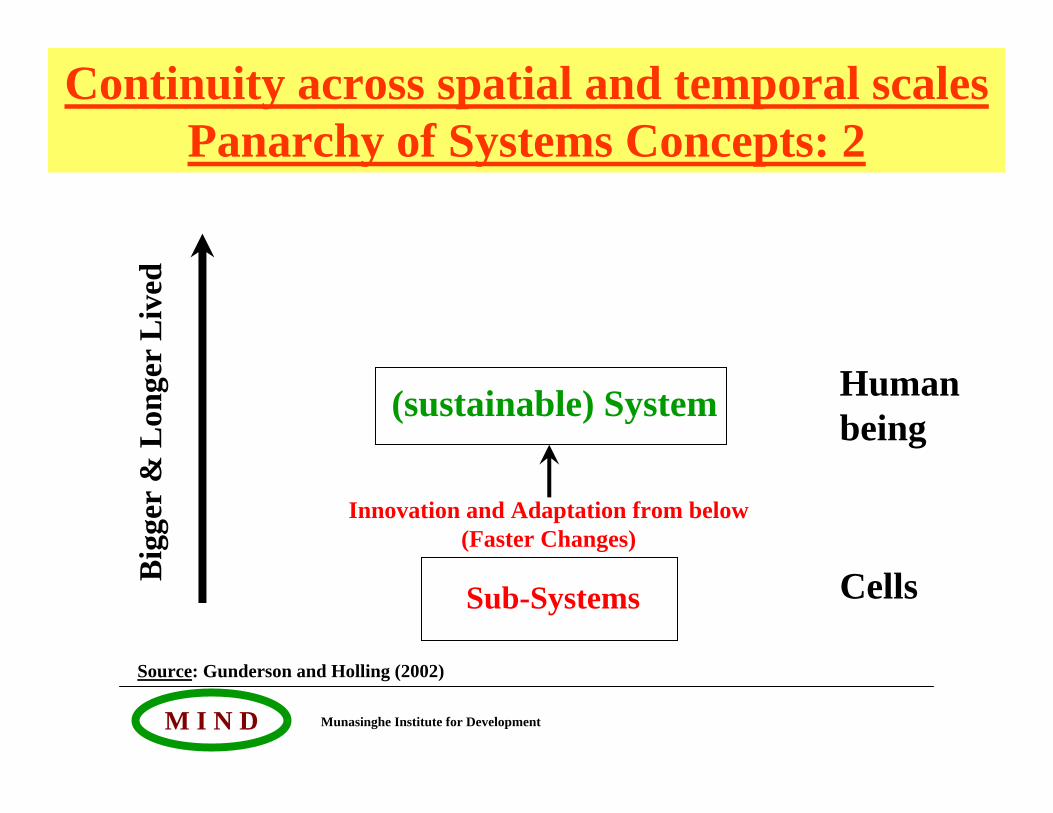
(sustainable) System
Sub-Systems
Innovation and Adaptation from below(Faster Changes)
Continuity across spatial and temporal scales Panarchy of Systems Concepts: 2
Big
ger
& L
onge
r L
ived
Source: Gunderson and Holling (2002)
Human being
Cells
Munasinghe Institute for DevelopmentM I N D
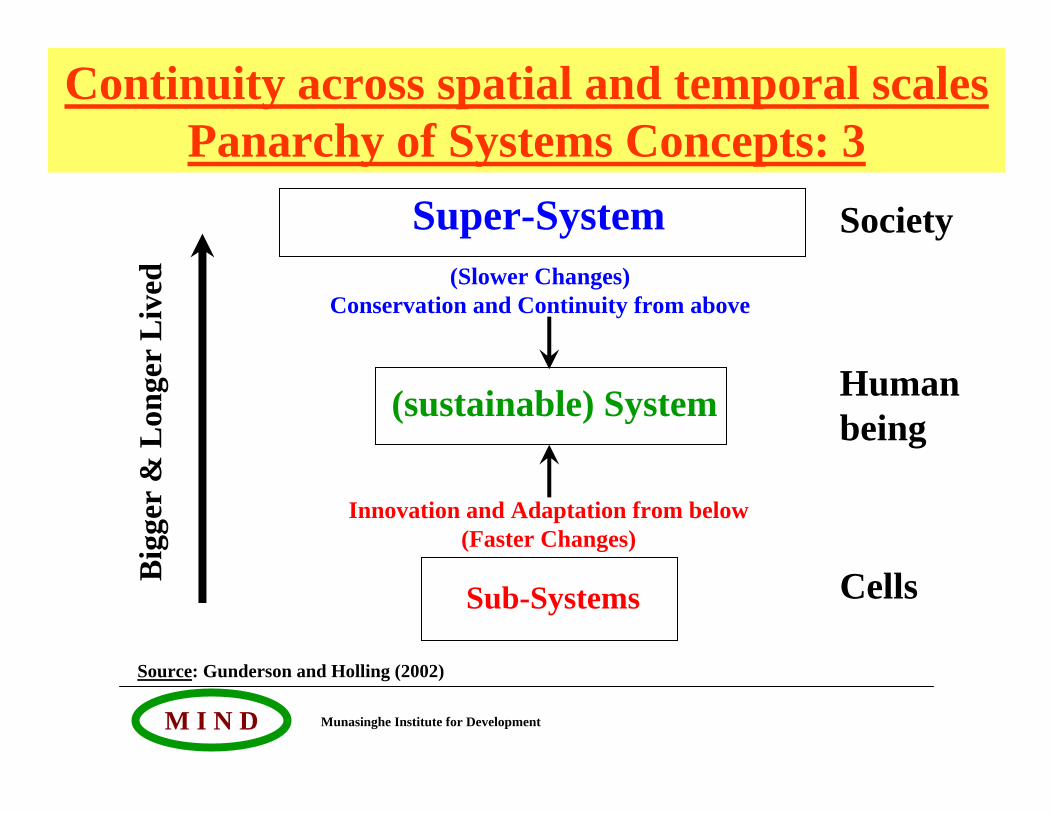
(sustainable) System
Super-System
Sub-Systems
Innovation and Adaptation from below(Faster Changes)
(Slower Changes)Conservation and Continuity from above
Continuity across spatial and temporal scales Panarchy of Systems Concepts: 3
Big
ger
& L
onge
r L
ived
Source: Gunderson and Holling (2002)
Society
Human being
Cells
Munasinghe Institute for DevelopmentM I N D
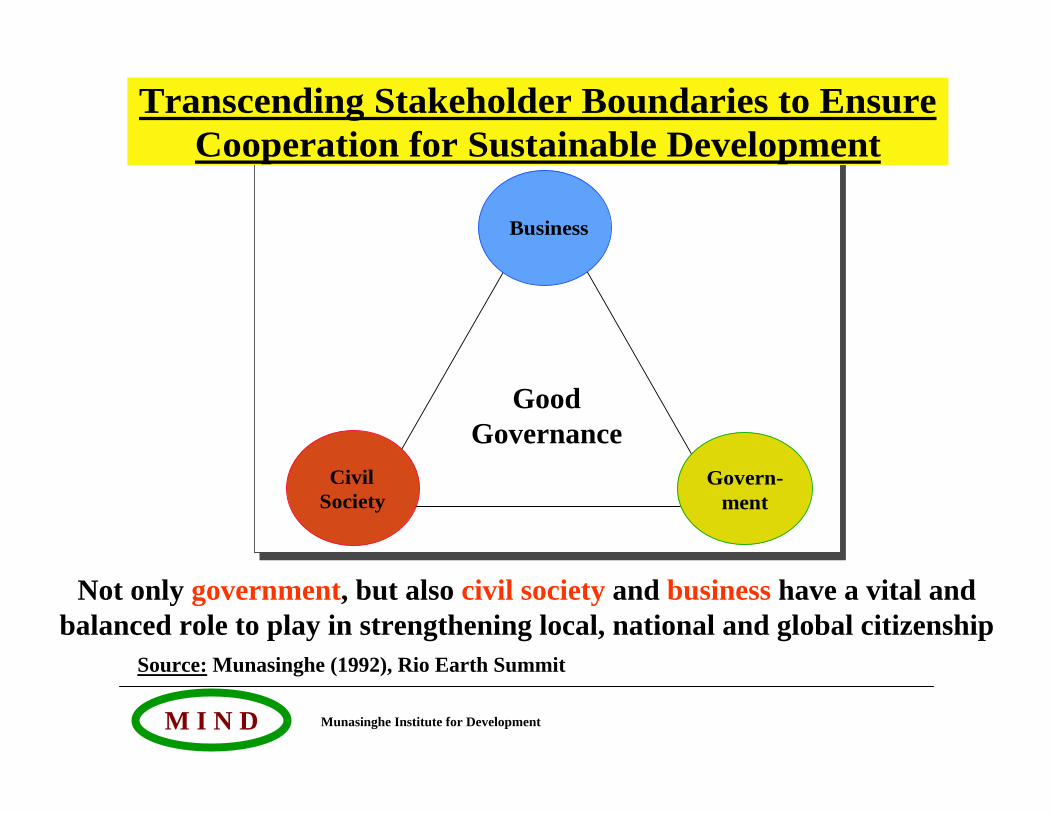
Transcending Stakeholder Boundaries to Ensure Cooperation for Sustainable Development
SocialCapital
Business
Govern-ment
CivilSociety
Good Governance
Not only government, but also civil society and business have a vital and balanced role to play in strengthening local, national and global citizenship
Source: Munasinghe (1992), Rio Earth Summit
Munasinghe Institute for DevelopmentM I N D
Social Capital: Ignored, Undervalued, Invisible
• At individual level: is built on personal networks that help us enormously in our private and professional lives.
• At community and national levels: is the invisible glue that binds society together, and protected the essence of Sri society through many great difficulties – almost 500 years of forcible colonisation and most recently the 2004 Tsunami. It will play an essential role in resolving the ethnic problem.
Munasinghe Institute for DevelopmentM I N D
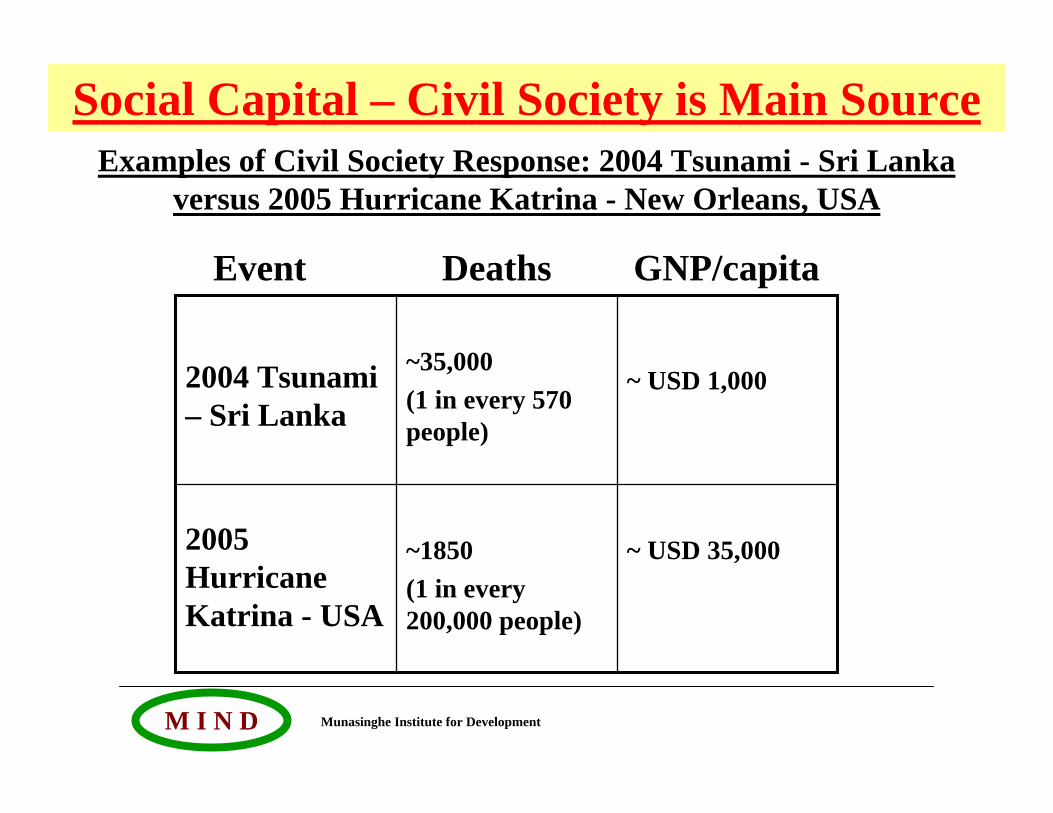
Social Capital – Civil Society is Main SourceExamples of Civil Society Response: 2004 Tsunami - Sri Lanka
versus 2005 Hurricane Katrina - New Orleans, USA
~ USD 35,000~1850(1 in every 200,000 people)
2005 Hurricane Katrina - USA
~ USD 1,000~35,000(1 in every 570 people)
2004 Tsunami – Sri Lanka
Event Deaths GNP/capita
Munasinghe Institute for DevelopmentM I N D
Integrating CC Policies into SD Strategy using Sustainomics
Core concepts and elements 1. Making development more sustainable (MDMS) 2. Sustainable development triangle3. Transcending boundaries4. Full cycle application of integrative tools – from data
gathering to practical policy implementation
Munasinghe Institute for DevelopmentM I N D Munasinghe Institute for DevelopmentM I N D
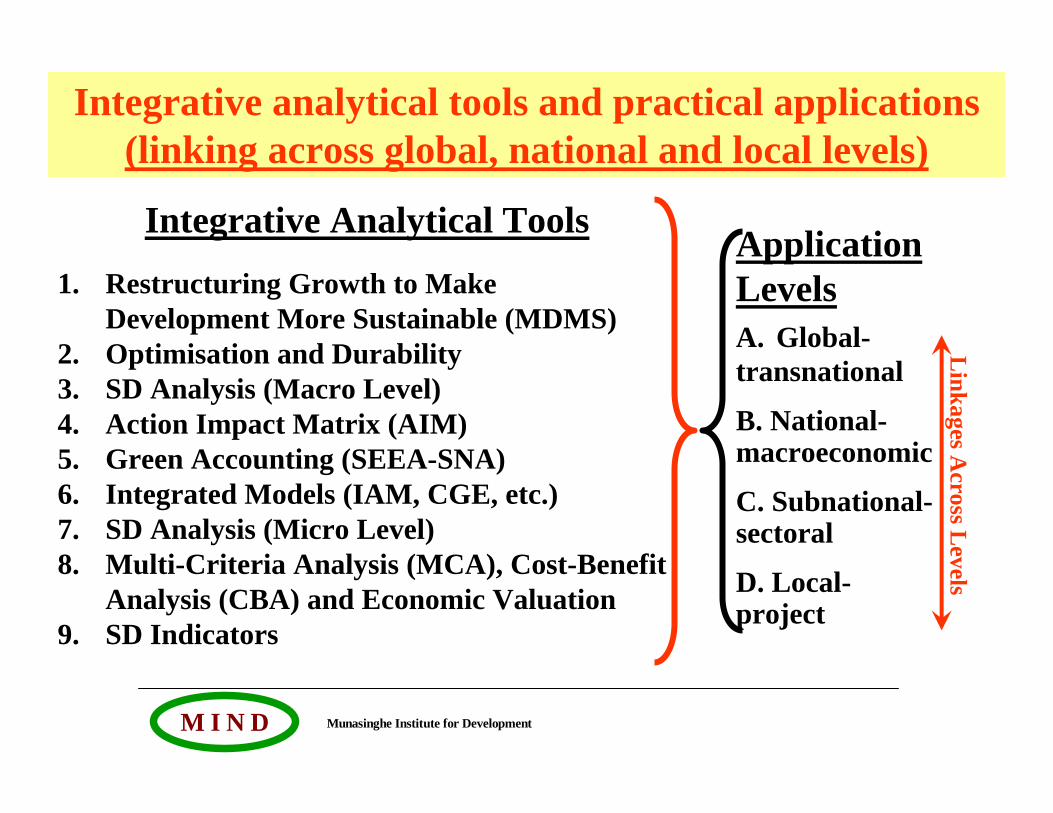
Integrative Analytical Tools1. Restructuring Growth to Make
Development More Sustainable (MDMS)2. Optimisation and Durability3. SD Analysis (Macro Level)4. Action Impact Matrix (AIM)5. Green Accounting (SEEA-SNA)6. Integrated Models (IAM, CGE, etc.)7. SD Analysis (Micro Level) 8. Multi-Criteria Analysis (MCA), Cost-Benefit
Analysis (CBA) and Economic Valuation9. SD Indicators
Application LevelsA. Global-transnational
B. National-macroeconomic
C. Subnational-sectoral
D. Local-project
Integrative analytical tools and practical applications(linking across global, national and local levels)
Linkages A
cross Levels
Munasinghe Institute for DevelopmentM I N D
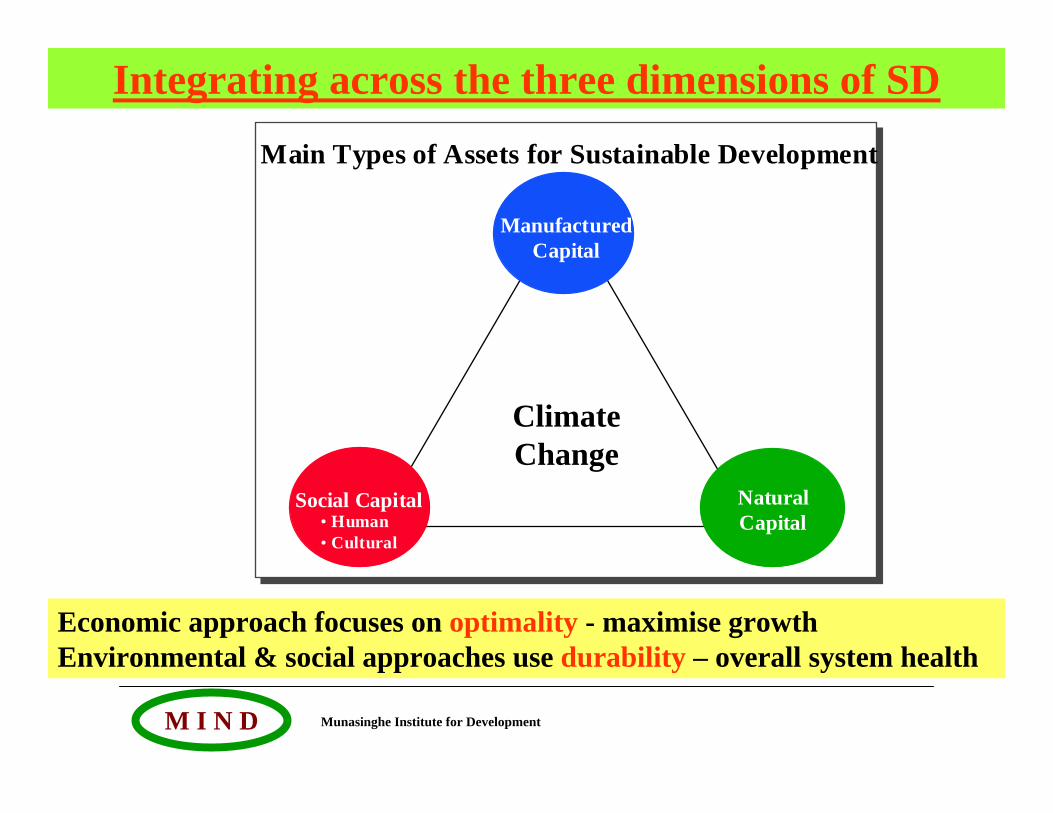
Main Types of Assets for Sustainable Development
SocialCapital
ManufacturedCapital
NaturalCapital
Social Capital• Human• Cultural
Climate Change
Integrating across the three dimensions of SD
Economic approach focuses on optimality - maximise growthEnvironmental & social approaches use durability – overall system health
Munasinghe Institute for DevelopmentM I N D
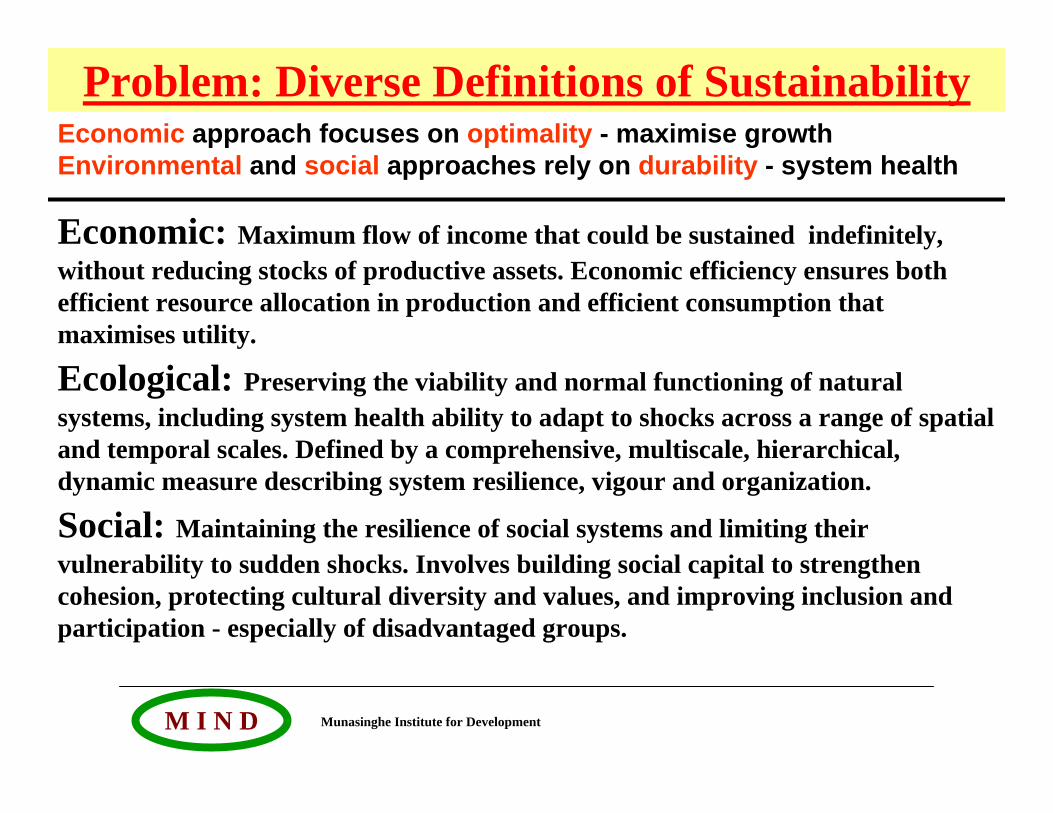
Problem: Diverse Definitions of SustainabilityEconomic approach focuses on optimality - maximise growthEnvironmental and social approaches rely on durability - system health
Economic: Maximum flow of income that could be sustained indefinitely, without reducing stocks of productive assets. Economic efficiency ensures both efficient resource allocation in production and efficient consumption that maximises utility.
Ecological: Preserving the viability and normal functioning of natural systems, including system health ability to adapt to shocks across a range of spatial and temporal scales. Defined by a comprehensive, multiscale, hierarchical, dynamic measure describing system resilience, vigour and organization.
Social: Maintaining the resilience of social systems and limiting their vulnerability to sudden shocks. Involves building social capital to strengthen cohesion, protecting cultural diversity and values, and improving inclusion and participation - especially of disadvantaged groups.
Munasinghe Institute for DevelopmentM I N D
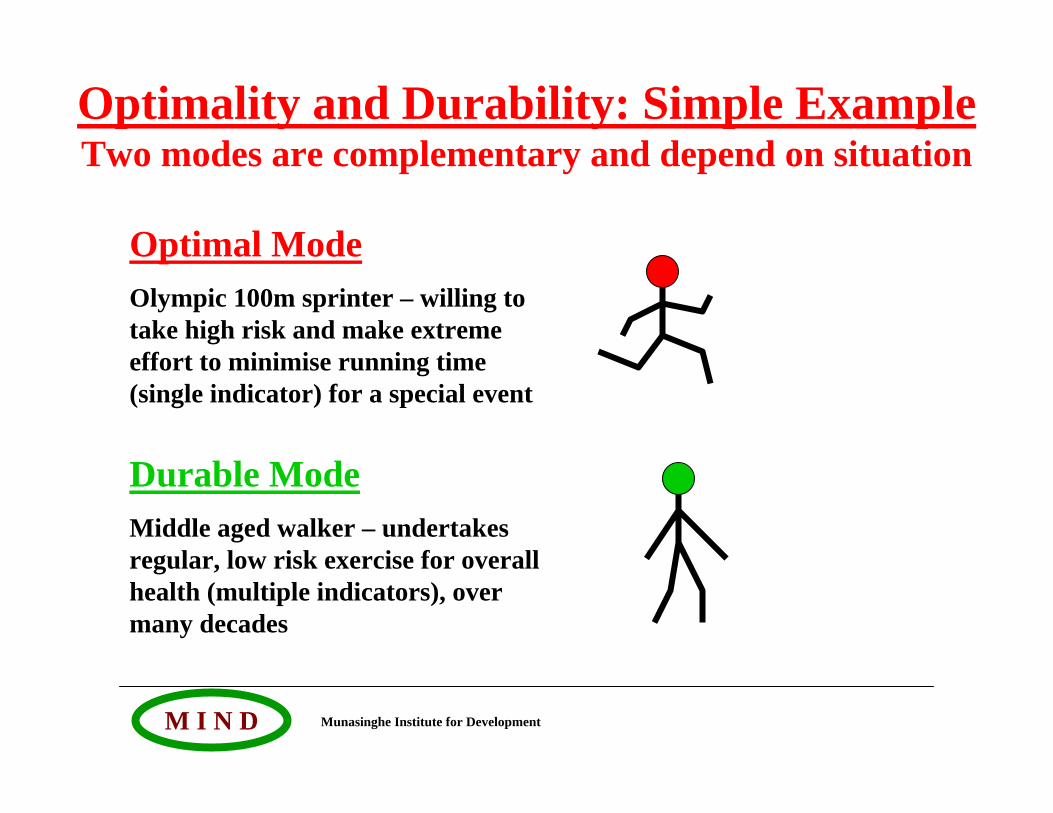
Optimality and Durability: Simple ExampleTwo modes are complementary and depend on situation
Optimal ModeOlympic 100m sprinter – willing to take high risk and make extreme effort to minimise running time (single indicator) for a special event
Durable ModeMiddle aged walker – undertakes regular, low risk exercise for overall health (multiple indicators), over many decades
Munasinghe Institute for DevelopmentM I N D
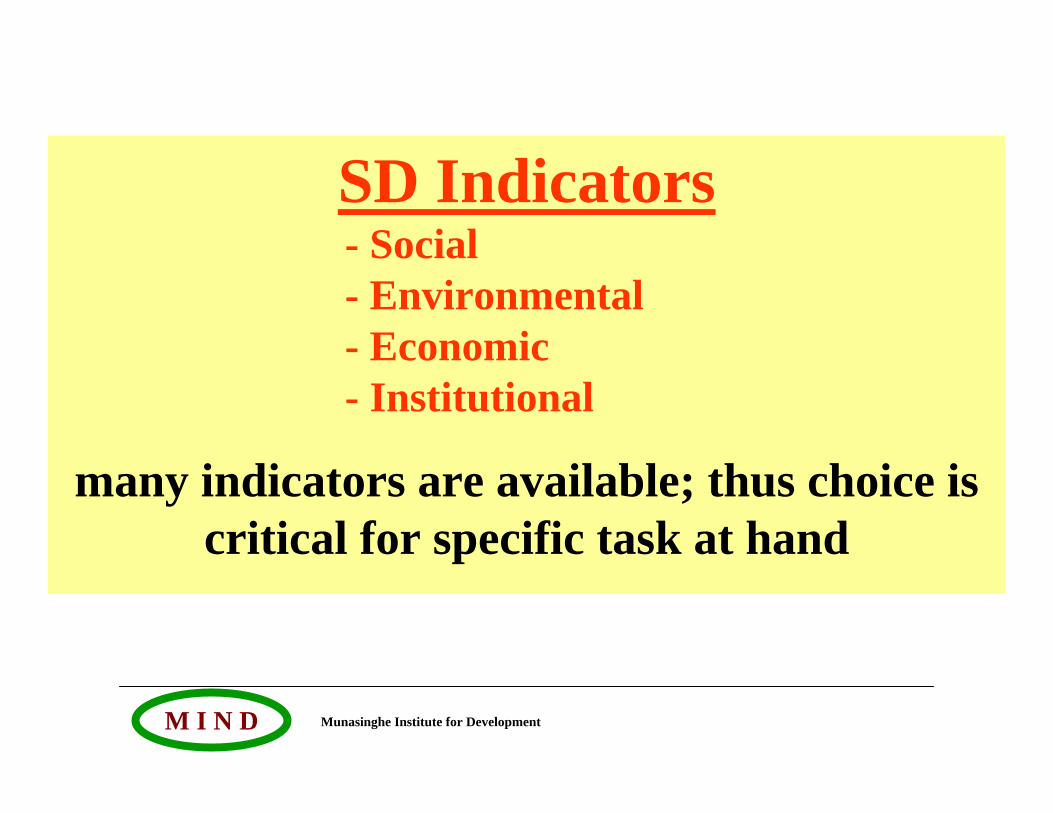
SD Indicators - Social - Environmental - Economic- Institutional
many indicators are available; thus choice is critical for specific task at hand
Munasinghe Institute for DevelopmentM I N D
Global Responses to the Climate Change Challenge
• Mitigation
•Adaptation

Munasinghe Institute for DevelopmentM I N D
MOST DESIRABLE:
CC Policies that Combine Both Adaptation and Mitigation (Win-Win) and also Make Development More Sustainable (MDMS)
Munasinghe Institute for DevelopmentM I N D
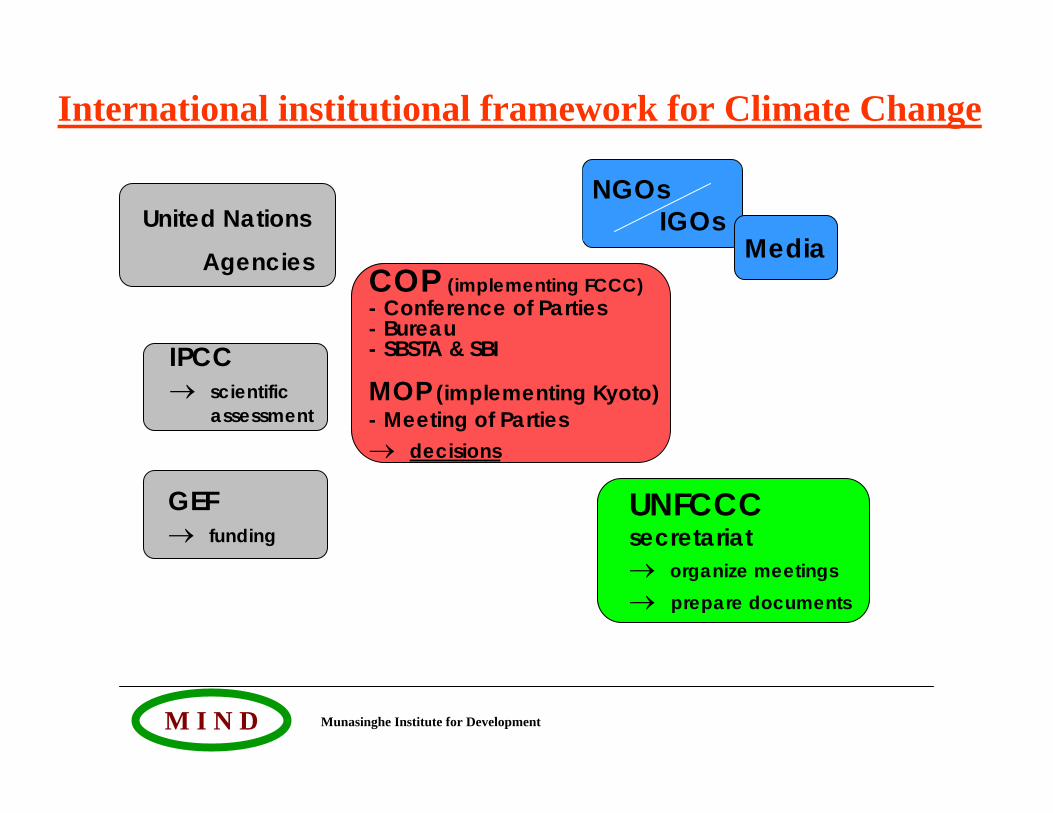
United Nations
Agencies COP (implementing FCCC) - Conference of Parties- Bureau- SBSTA & SBI
MOP (implementing Kyoto)- Meeting of Parties→ decisions
GEF→ funding
IPCC→ scientific
assessment
UNFCCCsecretariat→ organize meetings→ prepare documents
NGOs IGOs
Media
International institutional framework for Climate Change
Munasinghe Institute for DevelopmentM I N D
Global Mitigation
Response Options
Munasinghe Institute for DevelopmentM I N D
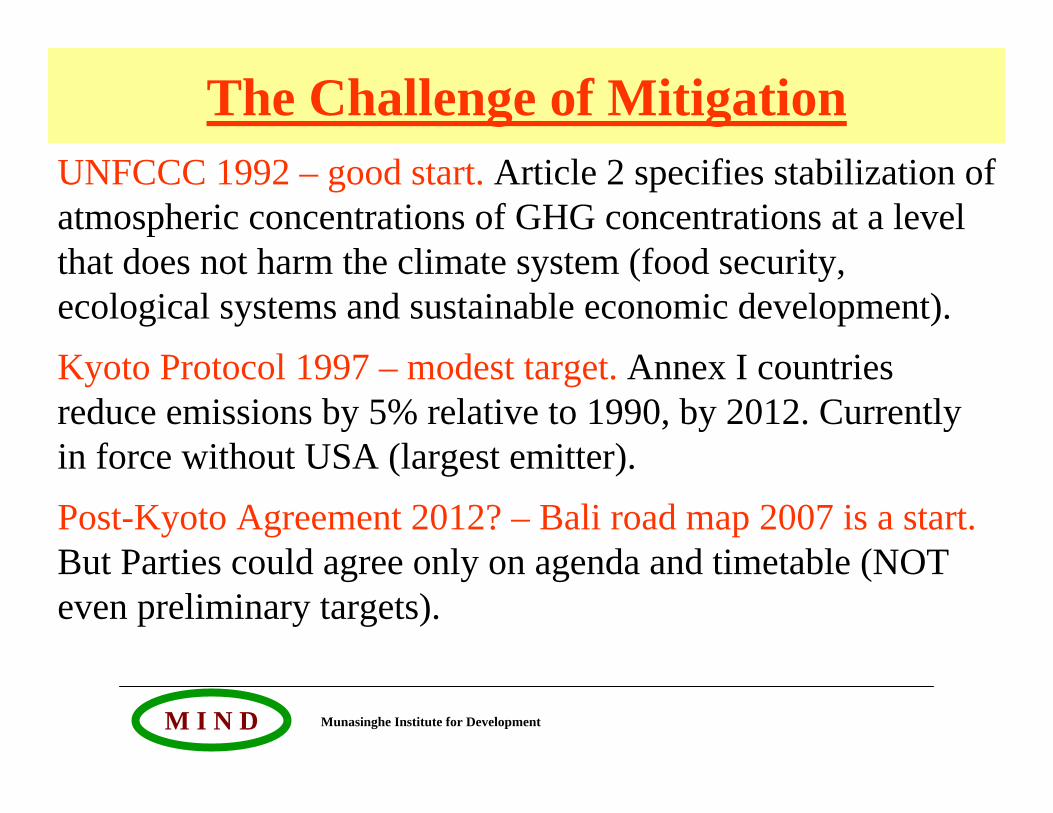
The Challenge of MitigationUNFCCC 1992 – good start. Article 2 specifies stabilization of atmospheric concentrations of GHG concentrations at a level that does not harm the climate system (food security, ecological systems and sustainable economic development).Kyoto Protocol 1997 – modest target. Annex I countries reduce emissions by 5% relative to 1990, by 2012. Currently in force without USA (largest emitter).Post-Kyoto Agreement 2012? – Bali road map 2007 is a start.But Parties could agree only on agenda and timetable (NOT even preliminary targets).
Munasinghe Institute for DevelopmentM I N D
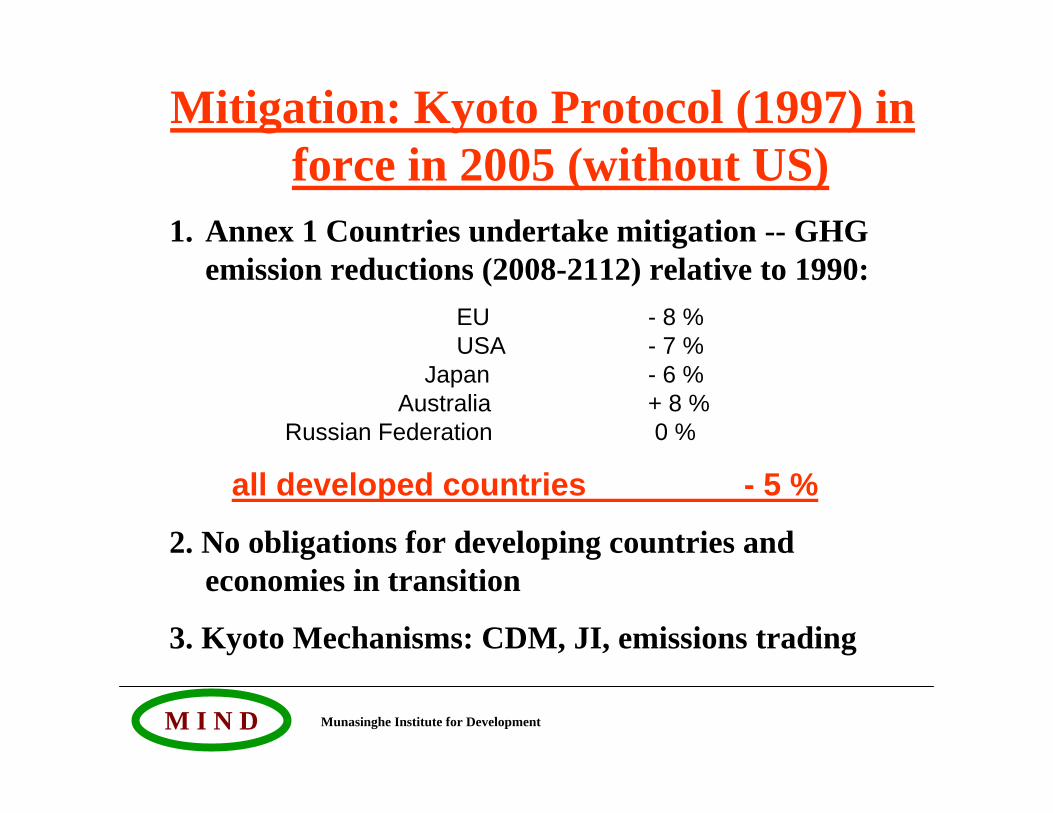
Mitigation: Kyoto Protocol (1997) in force in 2005 (without US)
1. Annex 1 Countries undertake mitigation -- GHG emission reductions (2008-2112) relative to 1990:
EU - 8 %USA - 7 %
Japan - 6 %Australia + 8 %
Russian Federation 0 %
all developed countries - 5 %
2. No obligations for developing countries and economies in transition
3. Kyoto Mechanisms: CDM, JI, emissions trading
Munasinghe Institute for DevelopmentM I N D
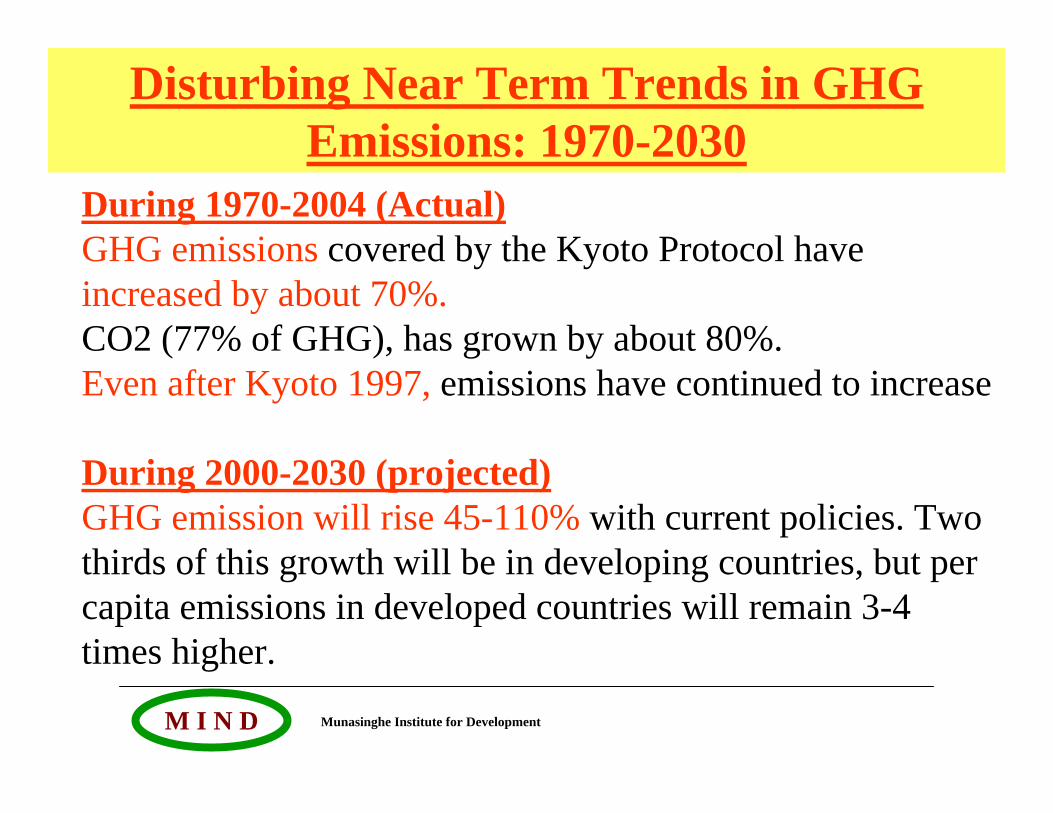
During 1970-2004 (Actual)GHG emissions covered by the Kyoto Protocol have increased by about 70%.CO2 (77% of GHG), has grown by about 80%.Even after Kyoto 1997, emissions have continued to increase
During 2000-2030 (projected)GHG emission will rise 45-110% with current policies. Two thirds of this growth will be in developing countries, but per capita emissions in developed countries will remain 3-4 times higher.
Disturbing Near Term Trends in GHG Emissions: 1970-2030
Munasinghe Institute for DevelopmentM I N D
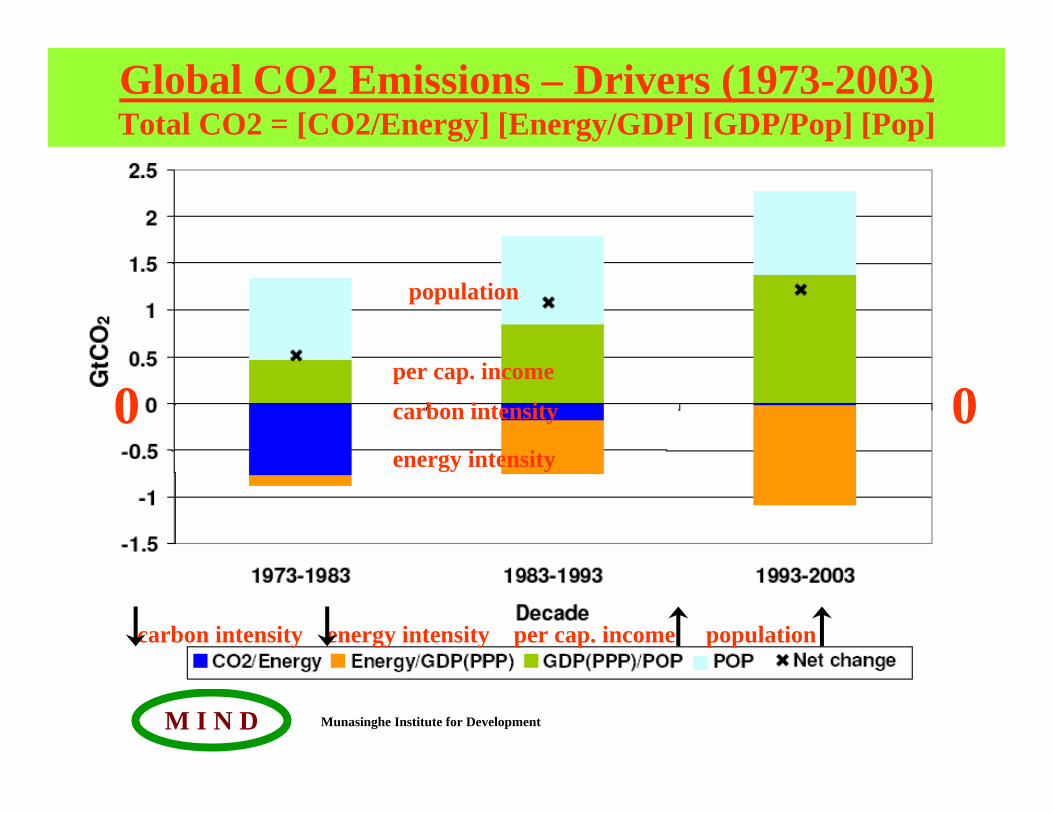
Global CO2 Emissions – Drivers (1973-2003)Total CO2 = [CO2/Energy] [Energy/GDP] [GDP/Pop] [Pop]
0 0
carbon intensity energy intensity per cap. income population
per cap. income
population
carbon intensity
energy intensity
Munasinghe Institute for DevelopmentM I N D
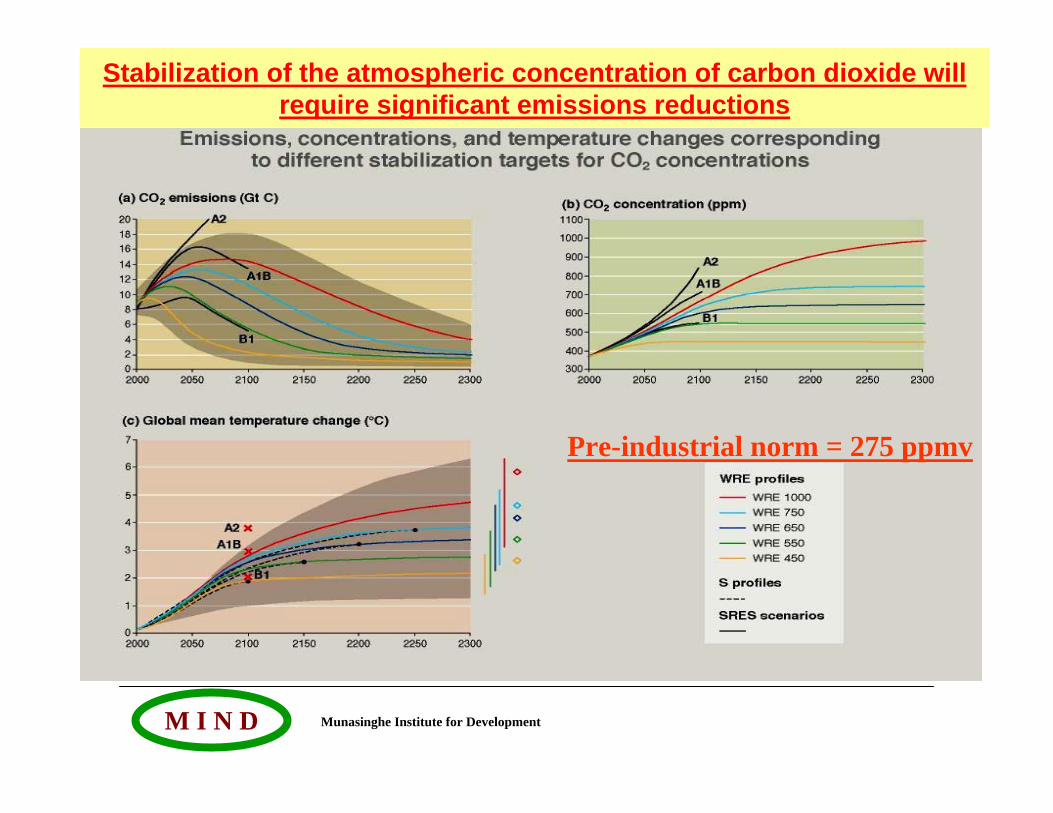
Stabilization of the atmospheric concentration of carbon dioxide will require significant emissions reductions
Pre-industrial norm = 275 ppmv
Munasinghe Institute for DevelopmentM I N D
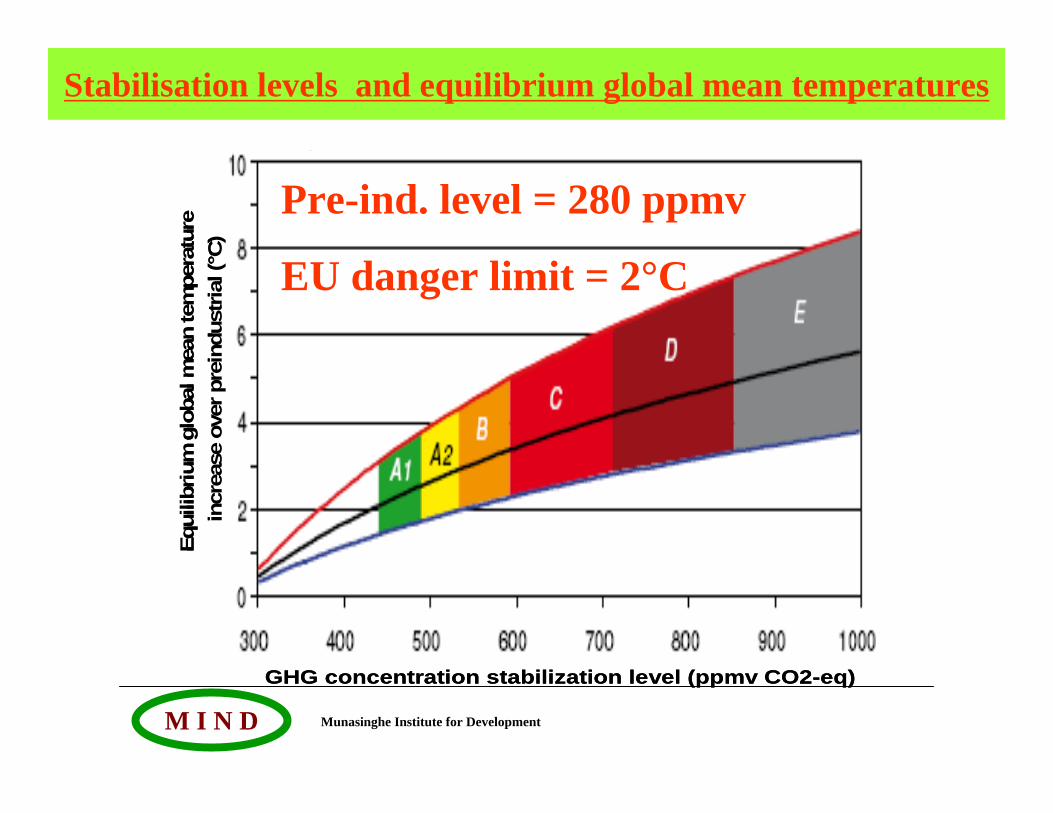
Stabilisation levels and equilibrium global mean temperatures
Equi
libriu
m g
loba
l mea
n te
mpe
ratu
rein
crea
se o
ver p
rein
dust
rial(
°C)
GHG concentration stabilization level (ppmv CO2-eq)
Equi
libriu
m g
loba
l mea
n te
mpe
ratu
rein
crea
se o
ver p
rein
dust
rial(
°C)
GHG concentration stabilization level (ppmv CO2-eq)
Pre-ind. level = 280 ppmv
EU danger limit = 2°C
Munasinghe Institute for DevelopmentM I N D
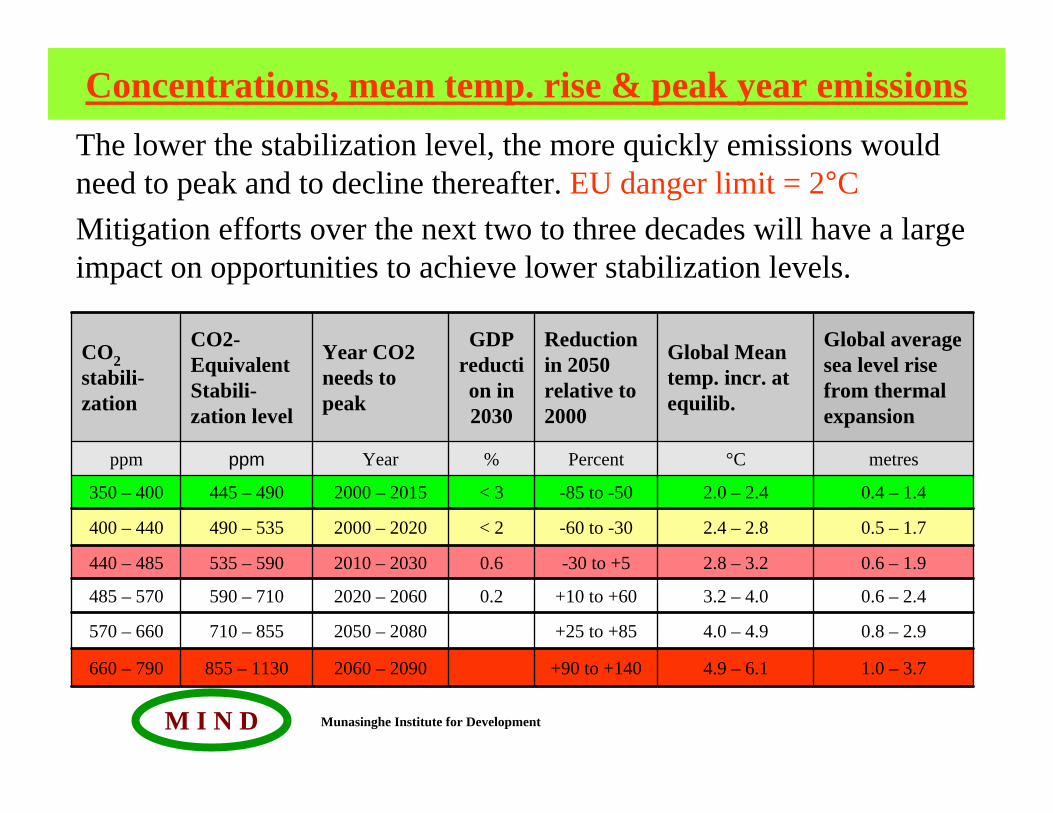
Concentrations, mean temp. rise & peak year emissionsThe lower the stabilization level, the more quickly emissions would need to peak and to decline thereafter. EU danger limit = 2°CMitigation efforts over the next two to three decades will have a large impact on opportunities to achieve lower stabilization levels.
0.2
0.6
< 2
< 3
%
GDP reduction in 2030
1.0 – 3.74.9 – 6.1+90 to +1402060 – 2090855 – 1130660 – 790
0.8 – 2.94.0 – 4.9+25 to +852050 – 2080710 – 855570 – 660
0.6 – 2.43.2 – 4.0+10 to +602020 – 2060590 – 710485 – 570
0.6 – 1.92.8 – 3.2-30 to +52010 – 2030535 – 590440 – 485
0.5 – 1.72.4 – 2.8-60 to -302000 – 2020490 – 535400 – 440
0.4 – 1.42.0 – 2.4-85 to -502000 – 2015445 – 490350 – 400
metres°CPercentYearppmppm
Global average sea level rise from thermal expansion
Global Mean temp. incr. at equilib.
Reduction in 2050 relative to 2000
Year CO2 needs to peak
CO2-Equivalent Stabili-zation level
CO2stabili-zation
Munasinghe Institute for DevelopmentM I N D
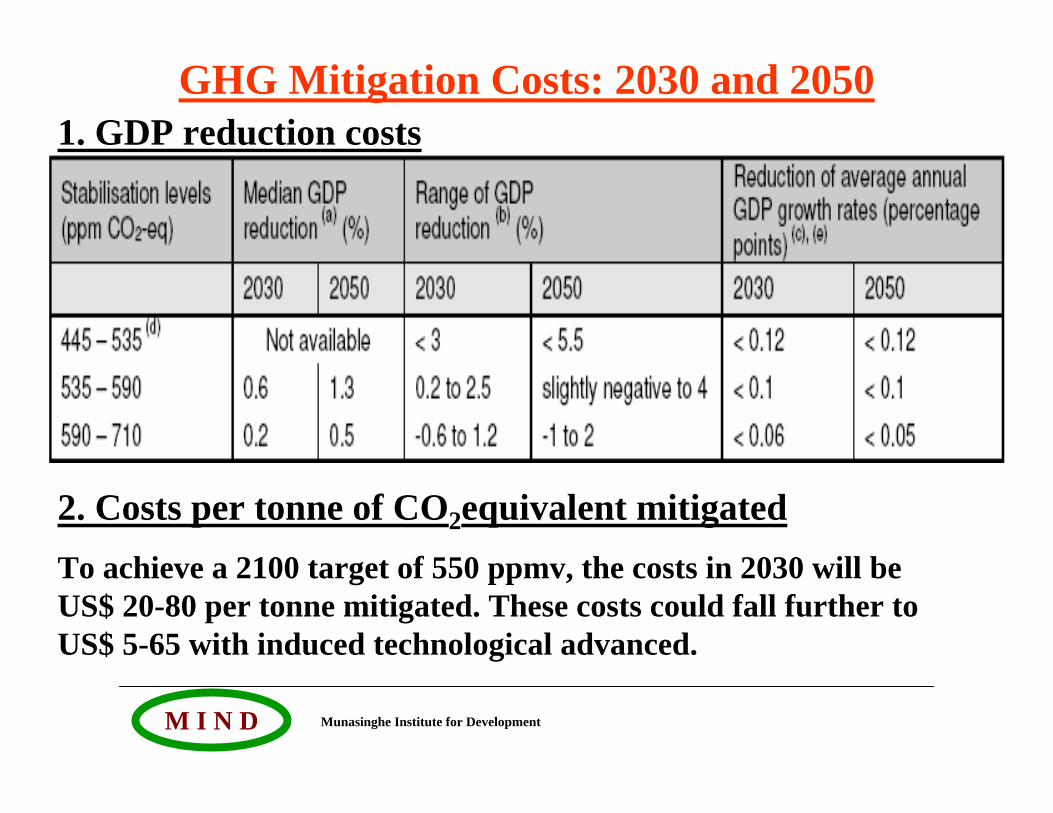
GHG Mitigation Costs: 2030 and 20501. GDP reduction costs
2. Costs per tonne of CO2equivalent mitigatedTo achieve a 2100 target of 550 ppmv, the costs in 2030 will be US$ 20-80 per tonne mitigated. These costs could fall further to US$ 5-65 with induced technological advanced.
Munasinghe Institute for DevelopmentM I N D
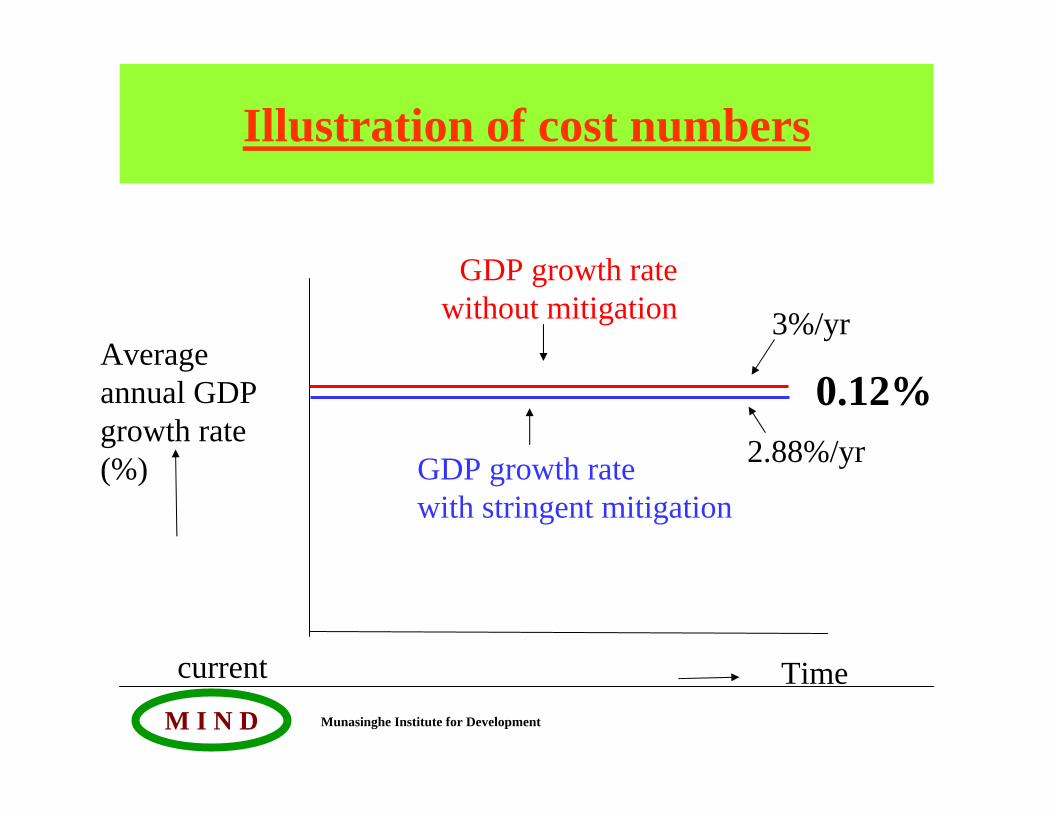
Illustration of cost numbers
Average annual GDP growth rate(%)
Timecurrent
3%/yr
2.88%/yr
GDP growth ratewithout mitigation
GDP growth ratewith stringent mitigation
0.12%
Munasinghe Institute for DevelopmentM I N D
There are also co-benefits of mitigation
• Near–term health benefits from reduced air pollutionmay offset a substantial fraction of mitigation costs
• Mitigation can also be positive for: energy security, balance of trade improvement, provision of modern energy services to rural areas and employment
BUT• Mitigation in one country or group of countries could
lead to higher emissions elsewhere (“carbon leakage”) or effects on the economy (“spill-over effects”).
Munasinghe Institute for DevelopmentM I N D
Long-term stabilization (2100 and beyond) of GHGs concentrations is possible with SD
• Known technological options could achieve stabilization of carbon dioxide at levels of 450-550 ppm over the next 100 years
• Technology development and diffusion are important components of cost-effective stabilization
• The SD pathway to stabilization and the stabilization level itself are key determinants of mitigation costs
Munasinghe Institute for DevelopmentM I N D
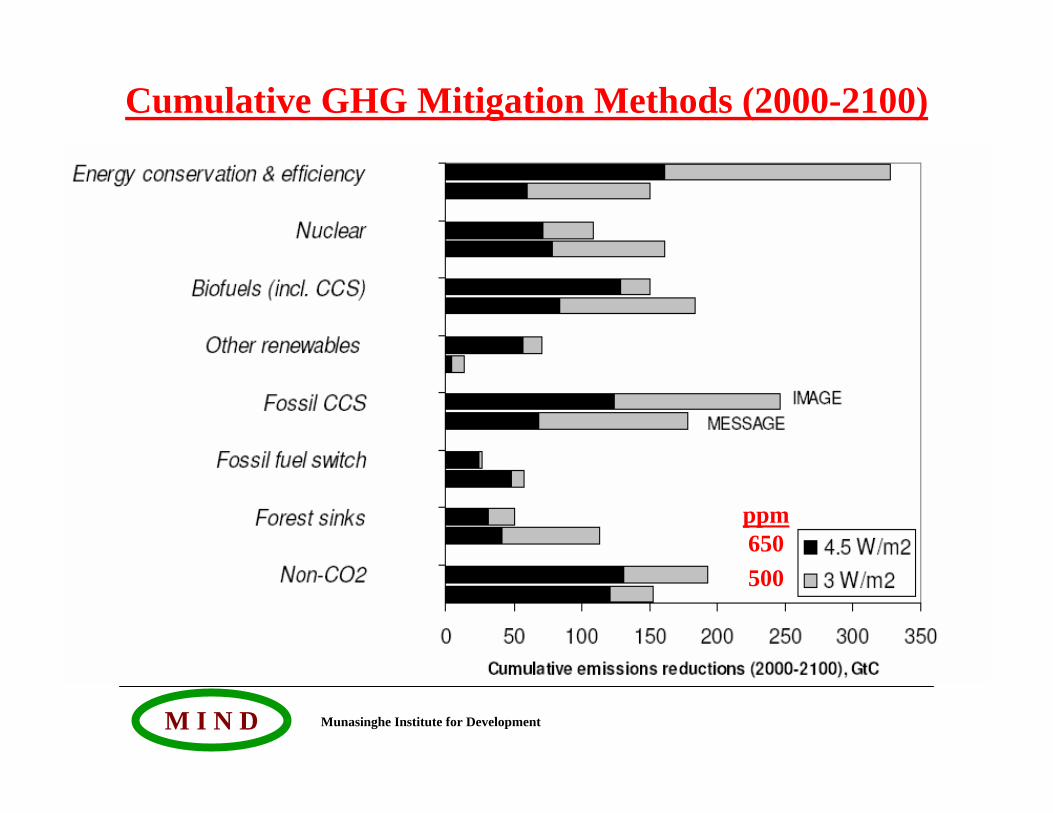
ppm650500
Cumulative GHG Mitigation Methods (2000-2100)
Munasinghe Institute for DevelopmentM I N D
Sustainable development paths will facilitate climate change mitigation
• Making development more sustainable by changing development paths can make a major contribution to climate change mitigation
• Macroeconomic policy, agricultural policy, multilateral development bank lending, insurance practices, electricity market reform, energy security policy and forest conservation can significantly reduce emissions.
• Implementation may require resources to overcome multiple barriers.
• Possibilities to choose and implement mitigation options to realise synergies and avoid conflicts with other dimensions of sustainable development.
Munasinghe Institute for DevelopmentM I N D
Technologies and policies exist to reduce near term (2010-2020) GHG emissions:
Energy and Land Use offer best potential• Energy: significant technical progress has been made in
the last 5 years and at a faster rate than expected (wind turbines, elimination of industrial by-products, hybrid engine cars, fuel cell technology, underground carbon dioxide storage)
• Land Use: good potential for carbon sinks and reduced GHG emissions from both better management of existing land cover, and transformation of land use
Munasinghe Institute for DevelopmentM I N D
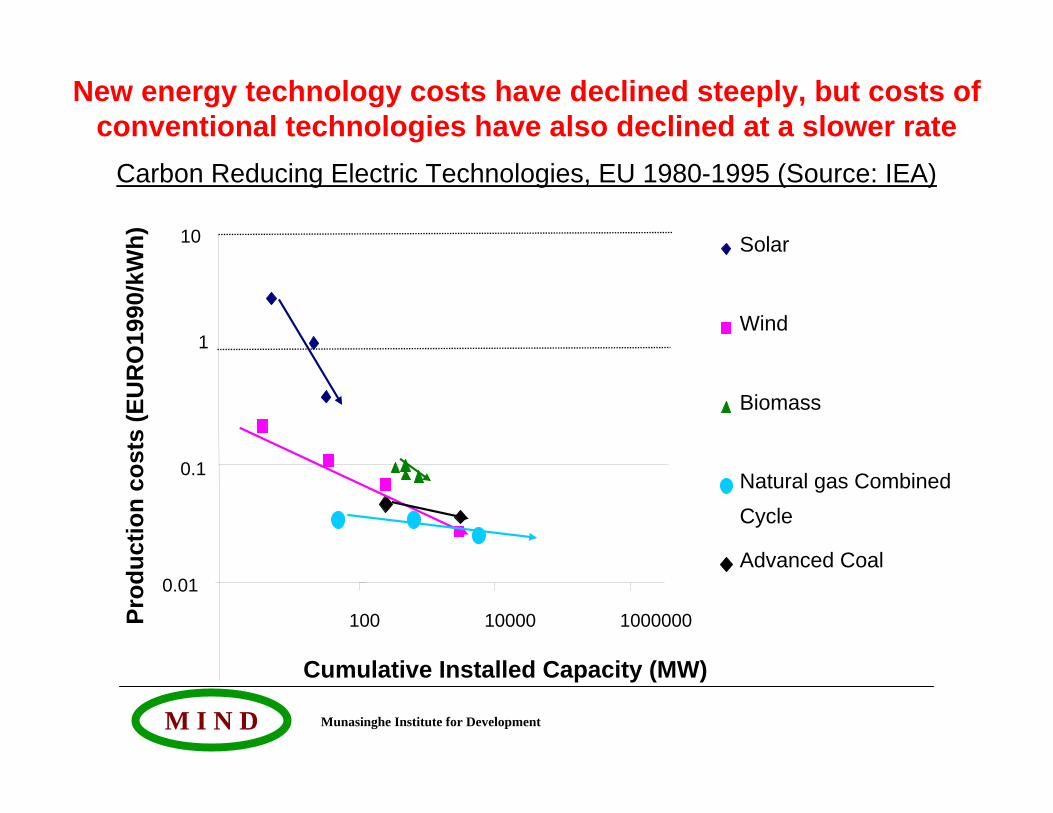
New energy technology costs have declined steeply, but costs of conventional technologies have also declined at a slower rate
Solar
Wind
Biomass
Natural gas CombinedCycle
Advanced Coal
Prod
uctio
n co
sts
(EU
RO
1990
/kW
h)
0.01
0.1
1
10
Cumulative Installed Capacity (MW)
100 10000 1000000
Carbon Reducing Electric Technologies, EU 1980-1995 (Source: IEA)
Munasinghe Institute for DevelopmentM I N D
• Policies for “carbon price”- can create incentives for producers and consumers to significantly invest in low-GHG products, technologies and processes. Higher carbon prices could impose significant burdens on the poor, unless targetted relief policies are implemented to ensure basic energy needs are met.
• Technology Policies - Deployment of low-GHG emission technologies and RD&D would be required for achieving stabilization targets and cost reduction
• International Agreements - achieving the UNFCCC/Kyoto Protocol targets may stimulate a global response to the climate problem, an array of national policies, the creation of an international carbon market and new institutional mechanisms. Future agreements will help reduce global costs of mitigation( eg: emission trading, Joint Implementation and CDM) and improve environmental effectiveness
Key Policy Elements
Munasinghe Institute for DevelopmentM I N D
Policies are available to governments to realisemitigation of climate change
• Effectiveness of policies depends on national circumstances, their design, interaction, stringency and implementation
– Integrating climate policies in broader development policies – Regulations and standards – Taxes and charges – Tradable permits – Financial incentives– Voluntary agreements – Information instruments – Research and development
Munasinghe Institute for DevelopmentM I N D
Changes in lifestyle and behaviour patterns can contribute to climate change mitigation
• Changes in occupant behaviour, cultural patterns and consumer choice in buildings.
• Reduction of car usage and efficient driving style, in relation to urban planning and availability of public transport
• Staff training, reward systems, regular feedback and documentation of existing practices in industrial organizations
Munasinghe Institute for DevelopmentM I N D
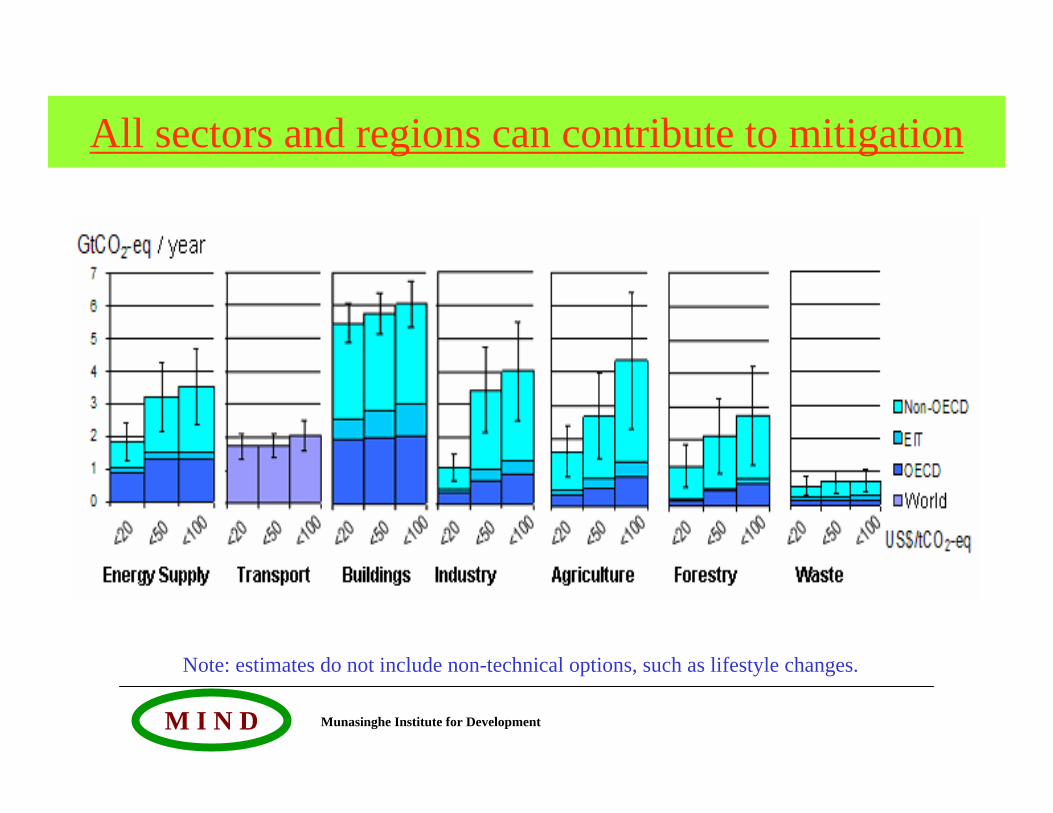
All sectors and regions can contribute to mitigation
Note: estimates do not include non-technical options, such as lifestyle changes.
Munasinghe Institute for DevelopmentM I N D
Global Adaptation
Response Options
Munasinghe Institute for DevelopmentM I N D
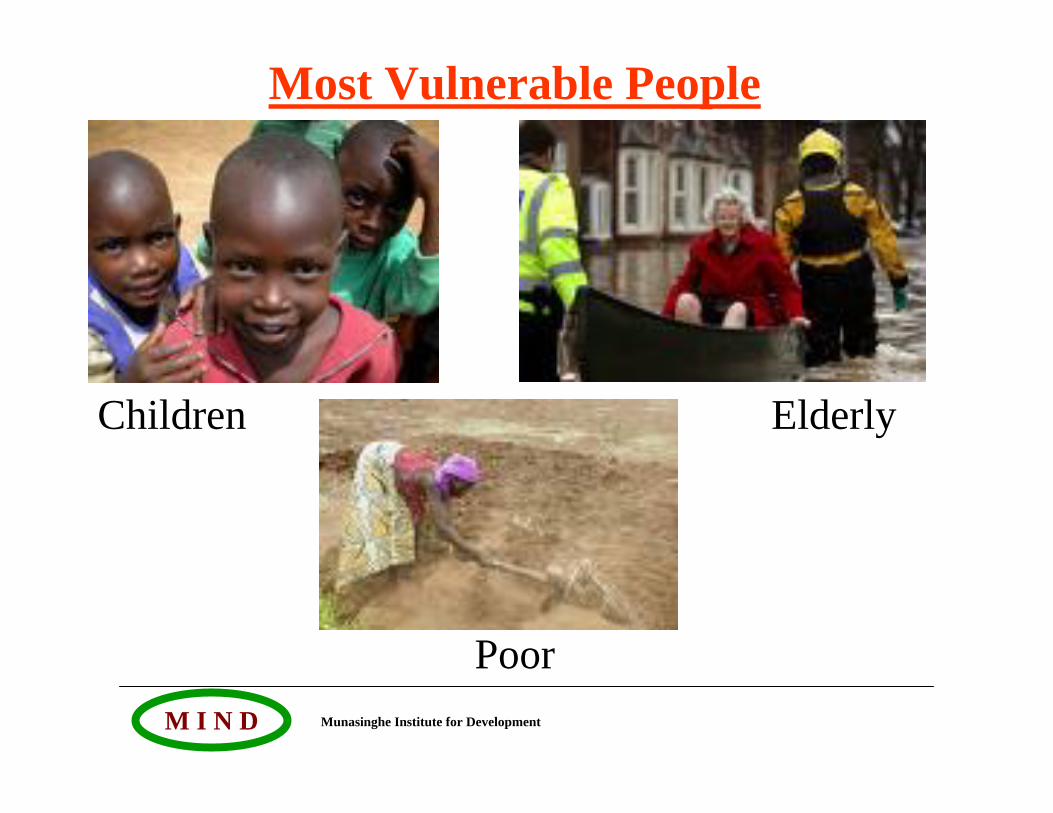
Most Vulnerable People
ElderlyChildren
Poor
Munasinghe Institute for DevelopmentM I N D
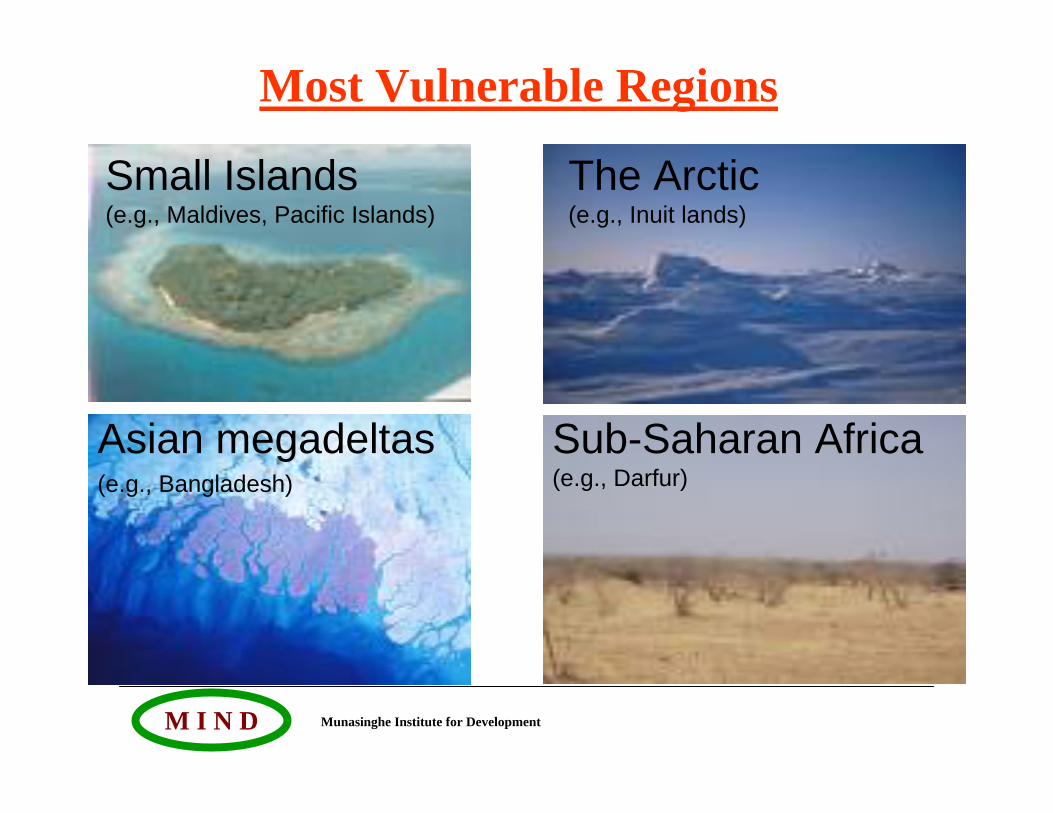
Most Vulnerable Regions
The Arctic(e.g., Inuit lands)
Sub-Saharan Africa(e.g., Darfur)
Small Islands(e.g., Maldives, Pacific Islands)
Asian megadeltas(e.g., Bangladesh)
Munasinghe Institute for DevelopmentM I N D
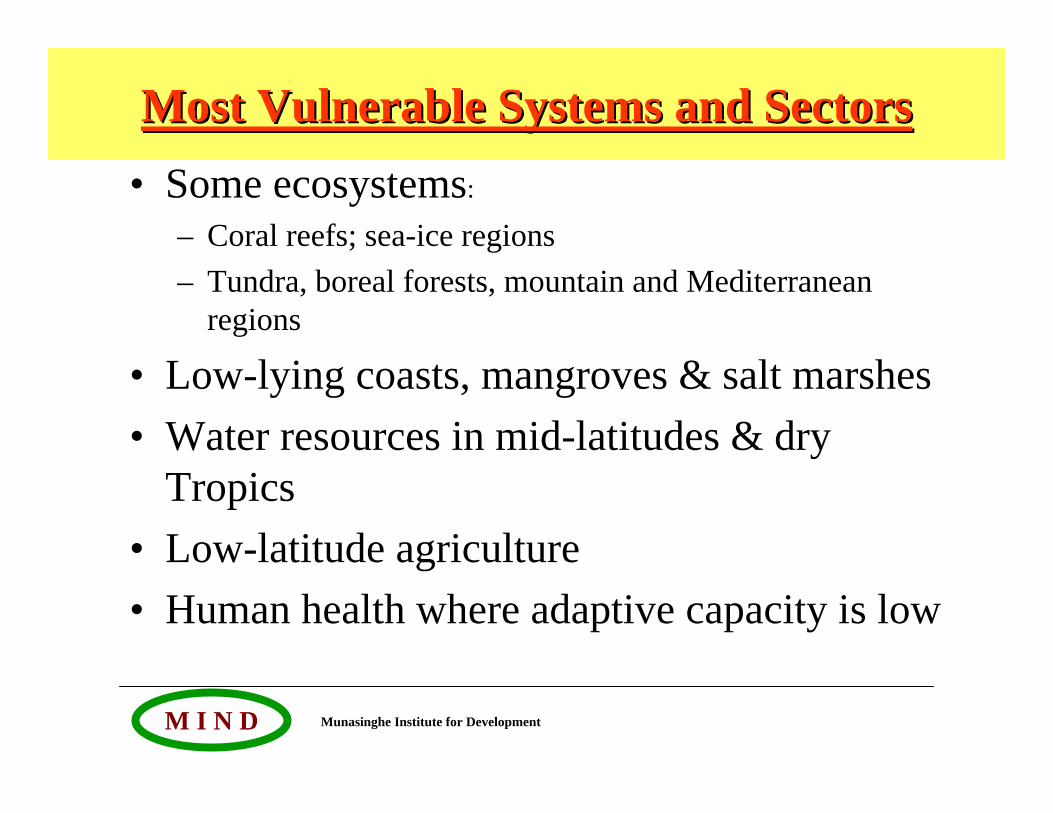
Most Vulnerable Systems and SectorsMost Vulnerable Systems and Sectors• Some ecosystems:
– Coral reefs; sea-ice regions– Tundra, boreal forests, mountain and Mediterranean
regions
• Low-lying coasts, mangroves & salt marshes• Water resources in mid-latitudes & dry
Tropics• Low-latitude agriculture• Human health where adaptive capacity is low
Munasinghe Institute for DevelopmentM I N D
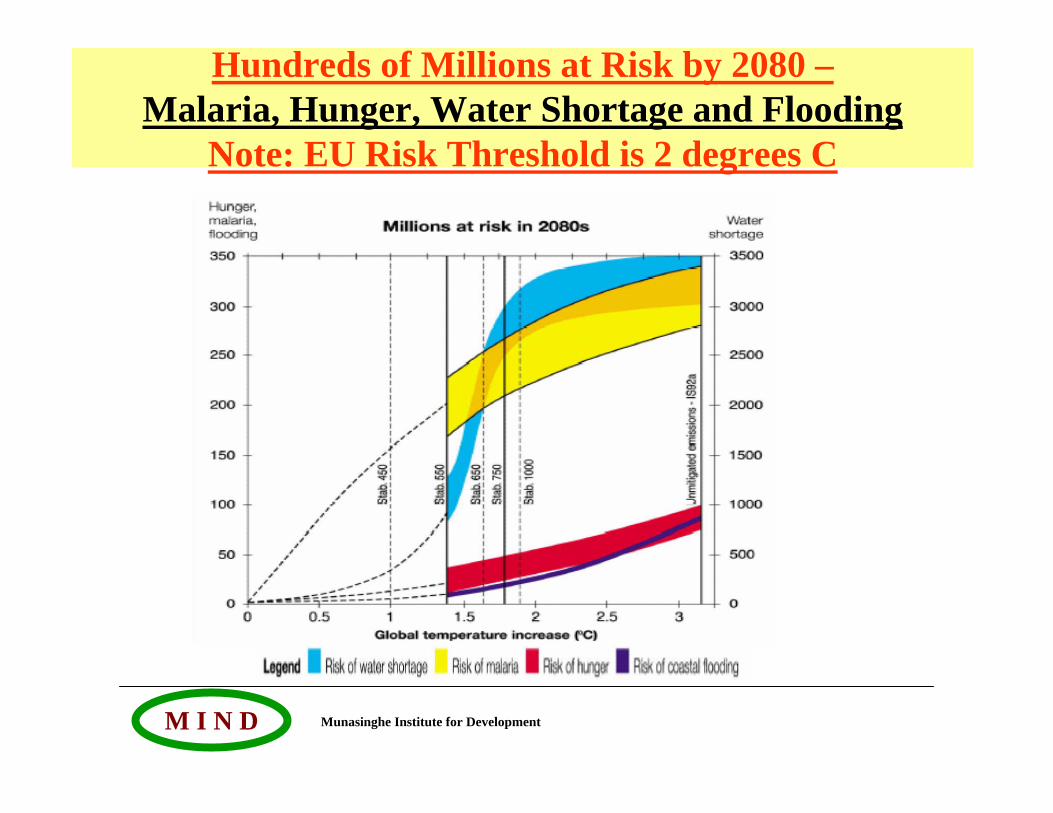
Hundreds of Millions at Risk by 2080 –Malaria, Hunger, Water Shortage and Flooding
Note: EU Risk Threshold is 2 degrees C
Munasinghe Institute for DevelopmentM I N D
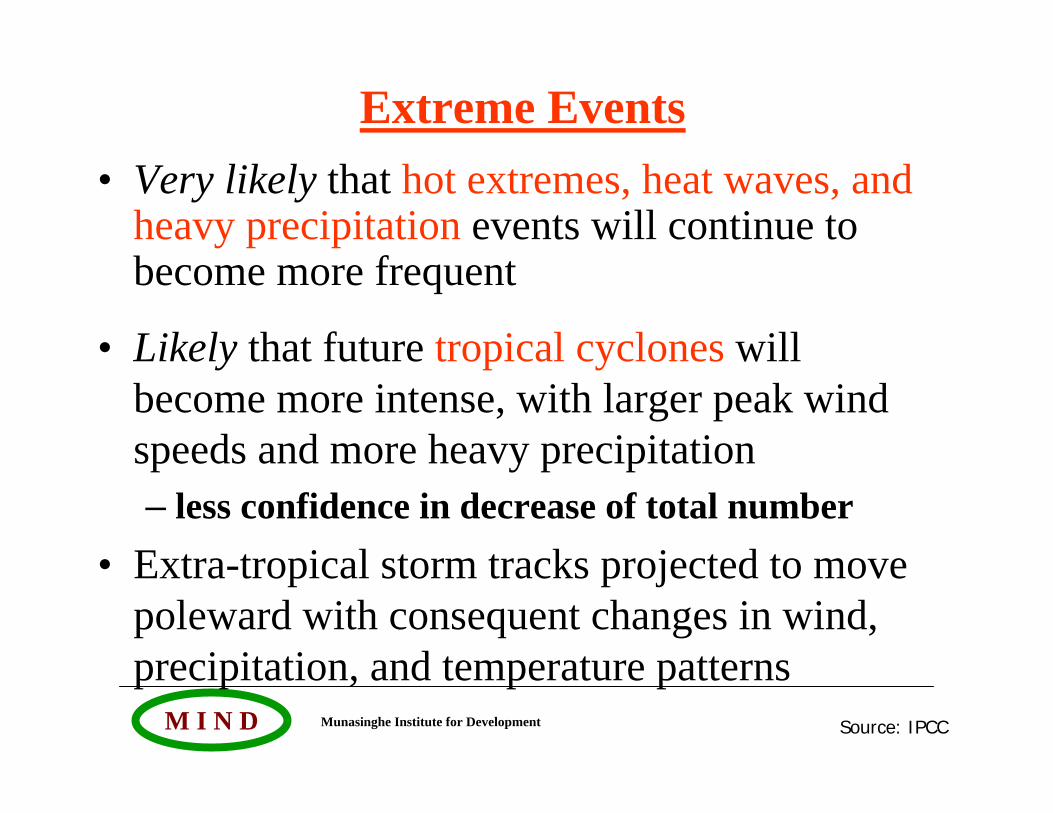
• Very likely that hot extremes, heat waves, and heavy precipitation events will continue to become more frequent
• Likely that future tropical cyclones will become more intense, with larger peak wind speeds and more heavy precipitation – less confidence in decrease of total number
• Extra-tropical storm tracks projected to move poleward with consequent changes in wind, precipitation, and temperature patterns
Source: IPCC
Extreme Events
Munasinghe Institute for DevelopmentM I N D
A temperature increase of 1.5°C - 2.5°Cover present, would put 20% - 30% of higher plants and animals at high risk of extinction
Ecosystems Vulnerability
Munasinghe Institute for DevelopmentM I N D
Range = US$ 3 to 95 per tonne CO2 for 100 estimatesLarge variation is due to uncertainties and deliberate choices regarding climate sensitivity, response lags, discount rates, valuing non-market impacts (including ecosystem impacts), and the treatment of inter-regional equity and catastrophic losses.
Mean value = US$ 12 per tonne CO2 (US$ 43 per tonne C) -(present discounted net costs)
Potential Benefits (damage avoided) of Adaptation and Vulnerability Reduction are large –
Long term global aggregate economic damages need to be better defined
Munasinghe Institute for DevelopmentM I N D
Potential Adaptive Responses Available to Human Societies
• Technological - (e.g. sea defenses, new crops)• Behavioral – (e.g. new food and recreational
choices)• Managerial – (e.g. altered farm practices)• Policy – (e.g. planning and regulations)
Munasinghe Institute for DevelopmentM I N D
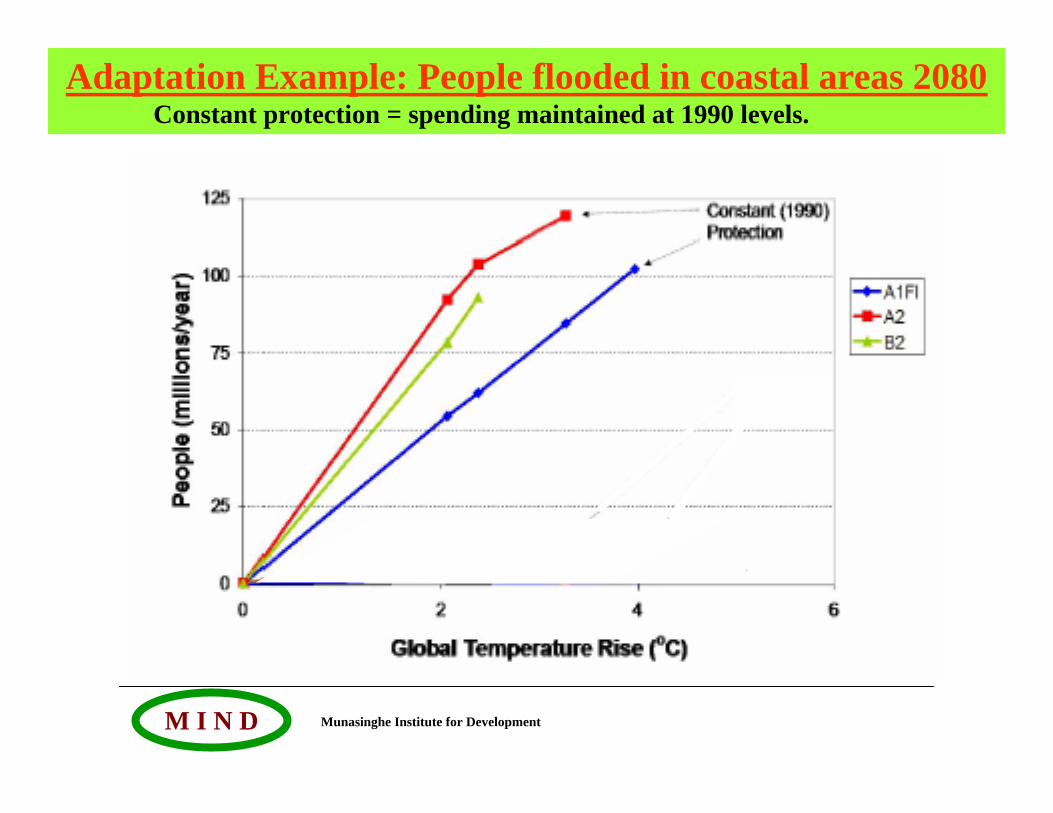
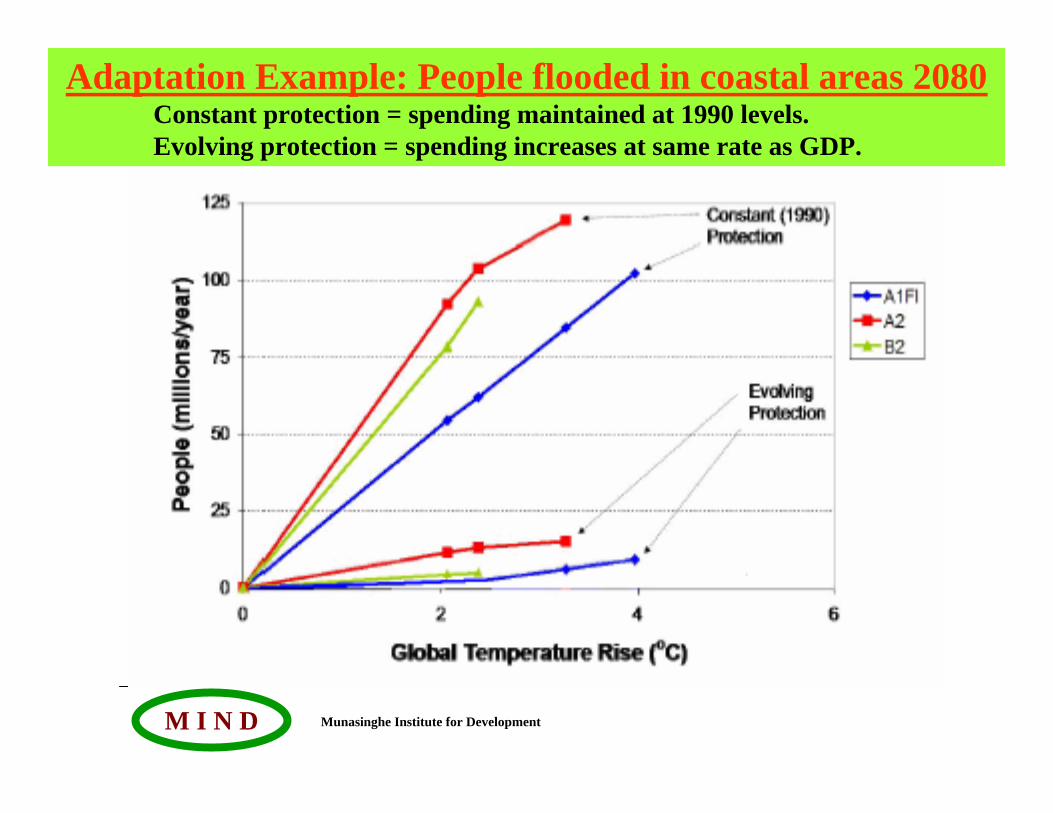
Adaptation Example: People flooded in coastal areas 2080Constant protection = spending maintained at 1990 levels.
Munasinghe Institute for DevelopmentM I N D
Adaptation Example: People flooded in coastal areas 2080Constant protection = spending maintained at 1990 levels.Evolving protection = spending increases at same rate as GDP.

Munasinghe Institute for DevelopmentM I N D
• Adaptation is a high priority to address impacts resulting from the warming which is already unavoidable due to past emissions
• Numerous adaptation options have been identified that can reduce adverse impacts of climate change and enhance beneficial ones , but will not prevent all damages
• Greater and more rapid climate change would increase adaptation costs and pose greater challenges
• Inertia is a widespread characteristic of the interacting climate, ecological and socio-economic systems which means that large scale impacts may not be observed for decades to centuries and mal-adaptations may occur
Key IPCC Findings – Adaptation
Munasinghe Institute for DevelopmentM I N D
Sustainable Development strategies can positively affect
Mitigation and Adaptation
Munasinghe Institute for DevelopmentM I N D
MOST DESIRABLE:
CC Policies that Combine Both Adaptation and Mitigation (Win-Win) and also Make Development More Sustainable (MDMS)
Munasinghe Institute for DevelopmentM I N D
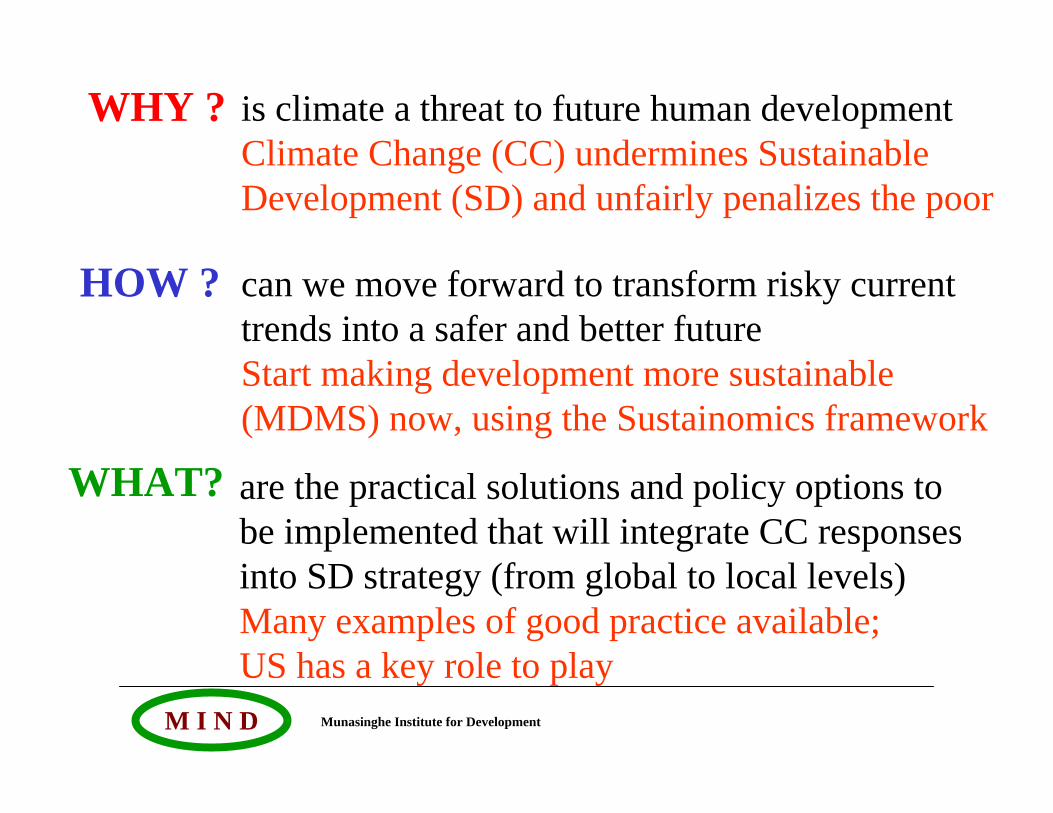
WHY ?
HOW ?
WHAT? are the practical solutions and policy options to be implemented that will integrate CC responses into SD strategy (from global to local levels)Many examples of good practice available; US has a key role to play
is climate a threat to future human development Climate Change (CC) undermines Sustainable Development (SD) and unfairly penalizes the poor
can we move forward to transform risky current trends into a safer and better futureStart making development more sustainable (MDMS) now, using the Sustainomics framework
Munasinghe Institute for DevelopmentM I N D
A Long Term Vision of Sustainable DevelopmentLevelsMain (Surface) Issues
ImmediateDrivers
UnderlyingPressures
IndicatorsPoverty, Inequity, Exclusion,
Resource Conflicts, Harm to
Environment (including CC)
Consumption Patterns
Population
Technology
Governance
Basic Needs
Social Power Structure
Values, Perceptions, Choices
Knowledge Base
Human InterventionsHigh risk of unrestrained market forces at work (“Washington consensus”, globalisation etc.) –Reactive-piecemeal: govt.
Making development more sustainable (MDMS) with systematic policy reform to manage market forces (Sustainomics) –Proactive: partnerships - govt., business, civil soc.
Fundamental global sustainable dev. transition catalysed through grass roots citizens movements, driven by social justice and equity concerns, innovative leadership, policies, tech. (new SD paradigm) –Proactive: civil soc., govt., business
Source: Munasinghe (2007), IPCC, MA, GTI
Now
Transition
Long Term
Time
Munasinghe Institute for DevelopmentM I N D
Practical Application of Sustainomics to Complex
CC-SD InteractionsGlobal, National and Project
Level Examples
Munasinghe Institute for DevelopmentM I N D
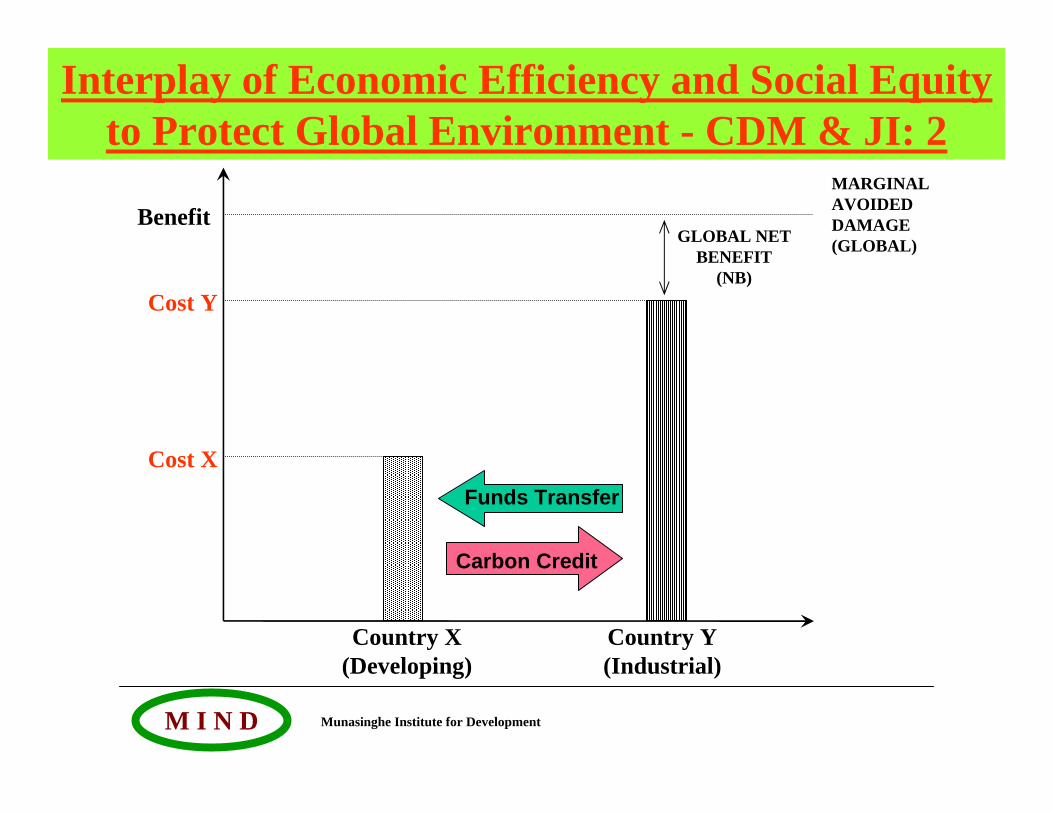
Specific Mitigation MechanismsInterplay of Economic Efficiency and
Social Equity to Protect the Global Environment - Flexibility Mechanisms:
Clean Development Mechanism (CDM), JI & Emissions Trading
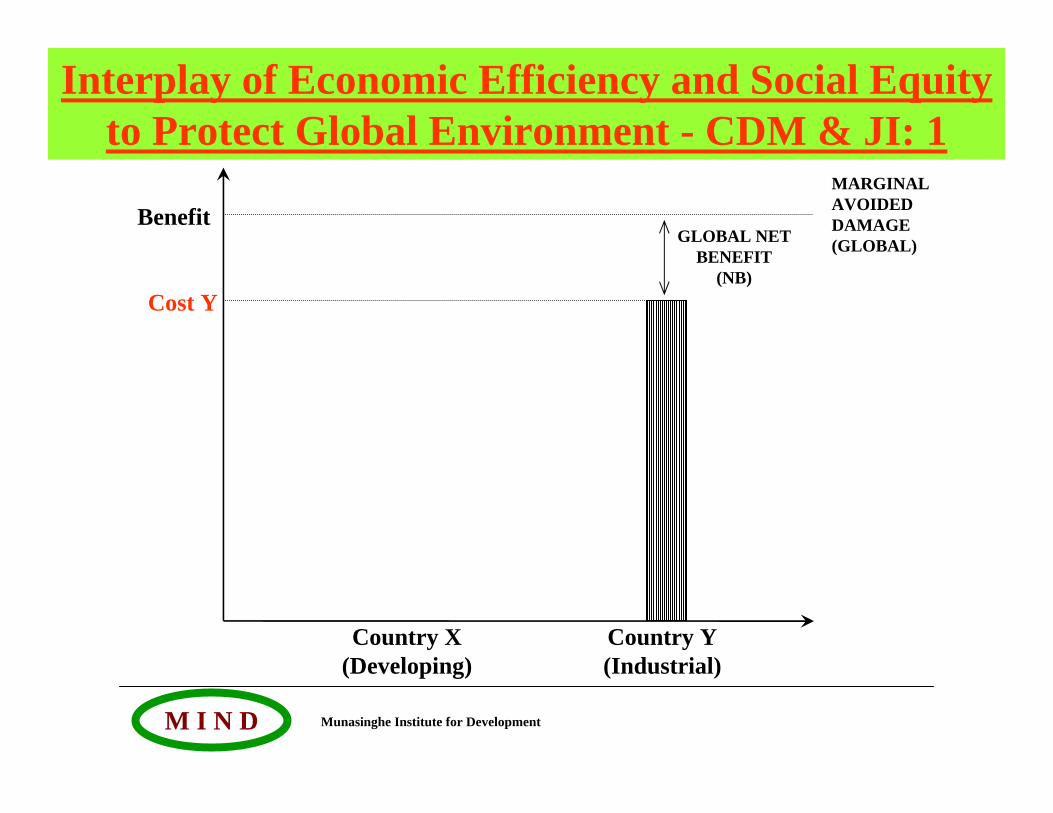
Munasinghe Institute for DevelopmentM I N D
Benefit
Cost Y
Country X(Developing)
Country Y(Industrial)
GLOBAL NET BENEFIT
(NB)
MARGINAL AVOIDED DAMAGE (GLOBAL)
Interplay of Economic Efficiency and Social Equity to Protect Global Environment - CDM & JI: 1
Munasinghe Institute for DevelopmentM I N D
Benefit
Cost Y
Cost X
Country X(Developing)
Country Y(Industrial)
GLOBAL NET BENEFIT
(NB)
MARGINAL AVOIDED DAMAGE (GLOBAL)
Interplay of Economic Efficiency and Social Equity to Protect Global Environment - CDM & JI: 2
Funds Transfer
Carbon Credit
Munasinghe Institute for DevelopmentM I N D
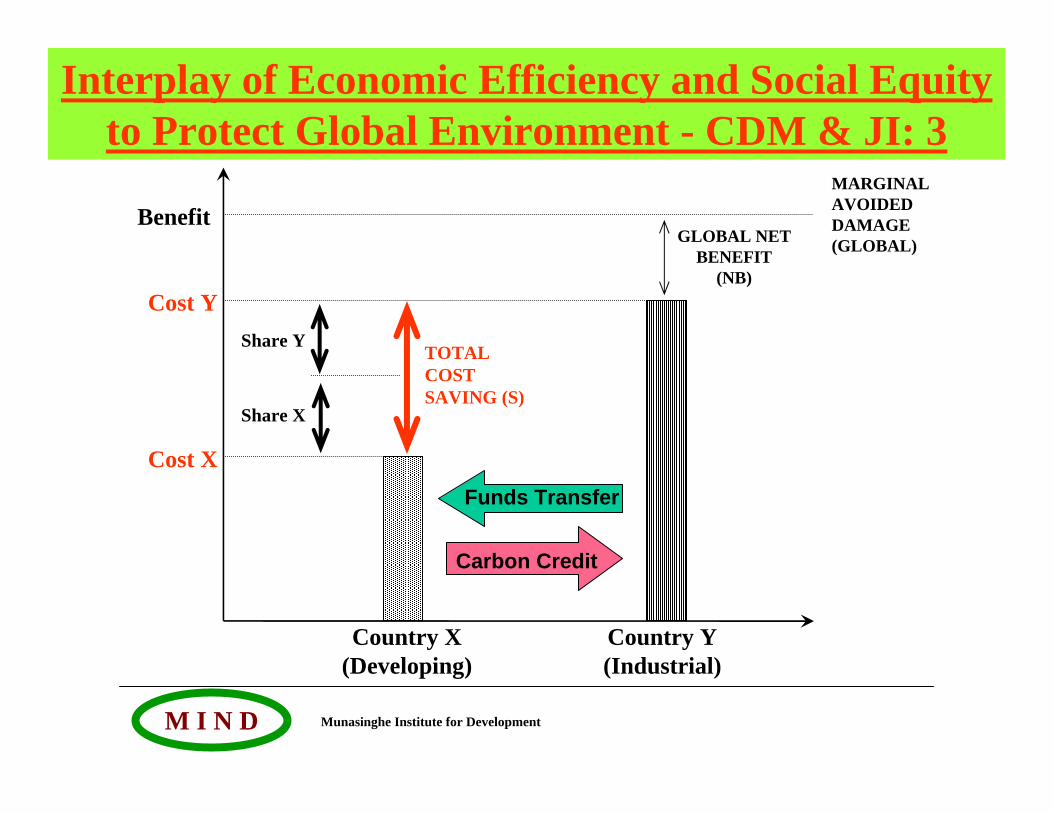
Benefit
Cost Y
Cost X
Country X(Developing)
Country Y(Industrial)
GLOBAL NET BENEFIT
(NB)
MARGINAL AVOIDED DAMAGE (GLOBAL)
TOTAL COST SAVING (S)
Share Y
Share X
Interplay of Economic Efficiency and Social Equity to Protect Global Environment - CDM & JI: 3
Funds Transfer
Carbon Credit
Munasinghe Institute for DevelopmentM I N D
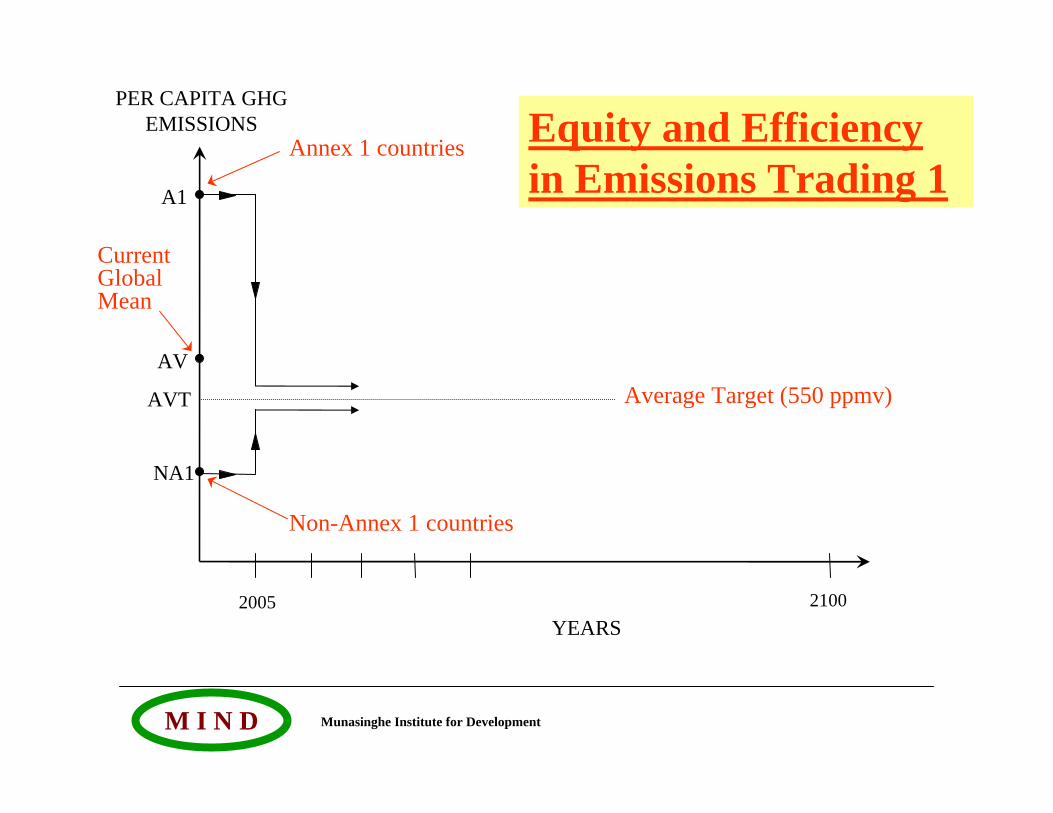
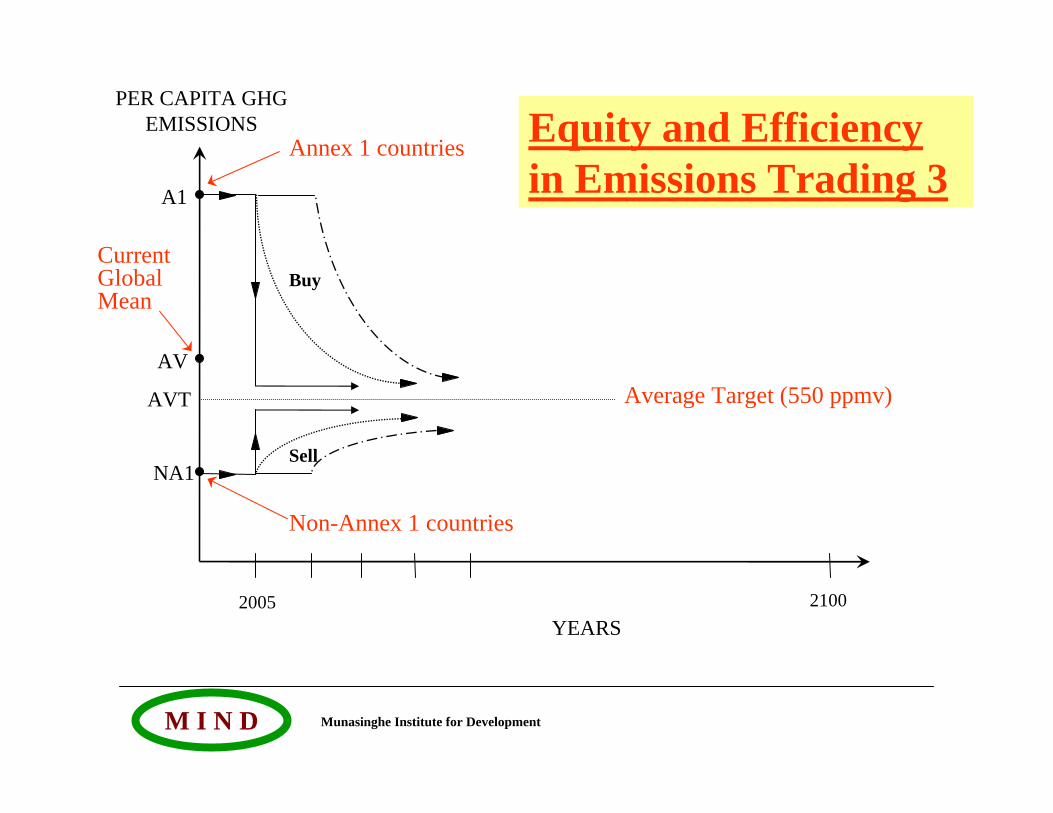
2005 2100YEARS
PER CAPITA GHG EMISSIONS
A1
NA1
AV
Annex 1 countries
Non-Annex 1 countries
Current Global Mean
AVT Average Target (550 ppmv)
Equity and Efficiency in Emissions Trading 1
Munasinghe Institute for DevelopmentM I N D
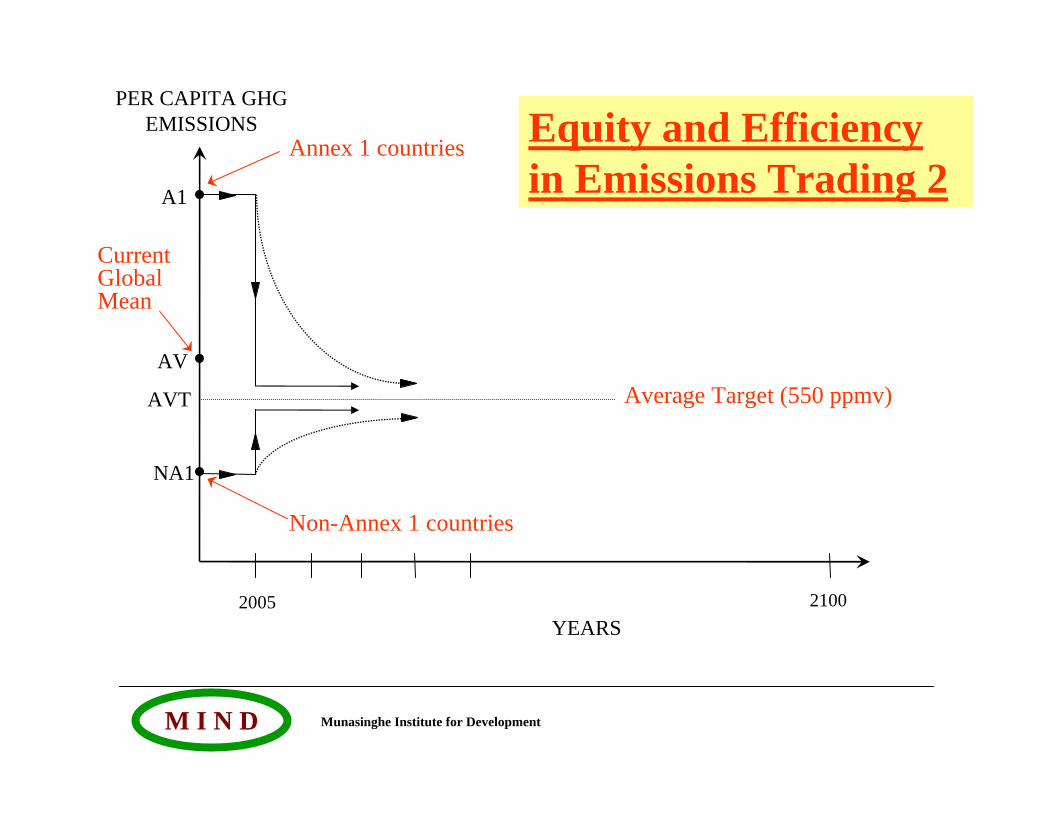
2005 2100YEARS
PER CAPITA GHG EMISSIONS
A1
NA1
AV
Annex 1 countries
Non-Annex 1 countries
Current Global Mean
AVT Average Target (550 ppmv)
Equity and Efficiency in Emissions Trading 2
Munasinghe Institute for DevelopmentM I N D
2005 2100YEARS
PER CAPITA GHG EMISSIONS
A1
NA1
AV
Annex 1 countries
Non-Annex 1 countries
Current Global Mean
AVT Average Target (550 ppmv)
Buy
Sell
Equity and Efficiency in Emissions Trading 3
Munasinghe Institute for DevelopmentM I N D
Country Level Actions
Integrating Climate Change Policies into National Sustainable
Development Strategy
Munasinghe Institute for DevelopmentM I N D
Typical Response Options for a National Climate Change Strategy
1. Grow Fast (reduce vulnerability to CC)
2. Improve adaptive capacity (reduce impacts)
3. Mitigate (FX incentives needed to offset costs)
4. Integrate CC-SD strategy by combining 1,2 & 3
Munasinghe Institute for DevelopmentM I N D
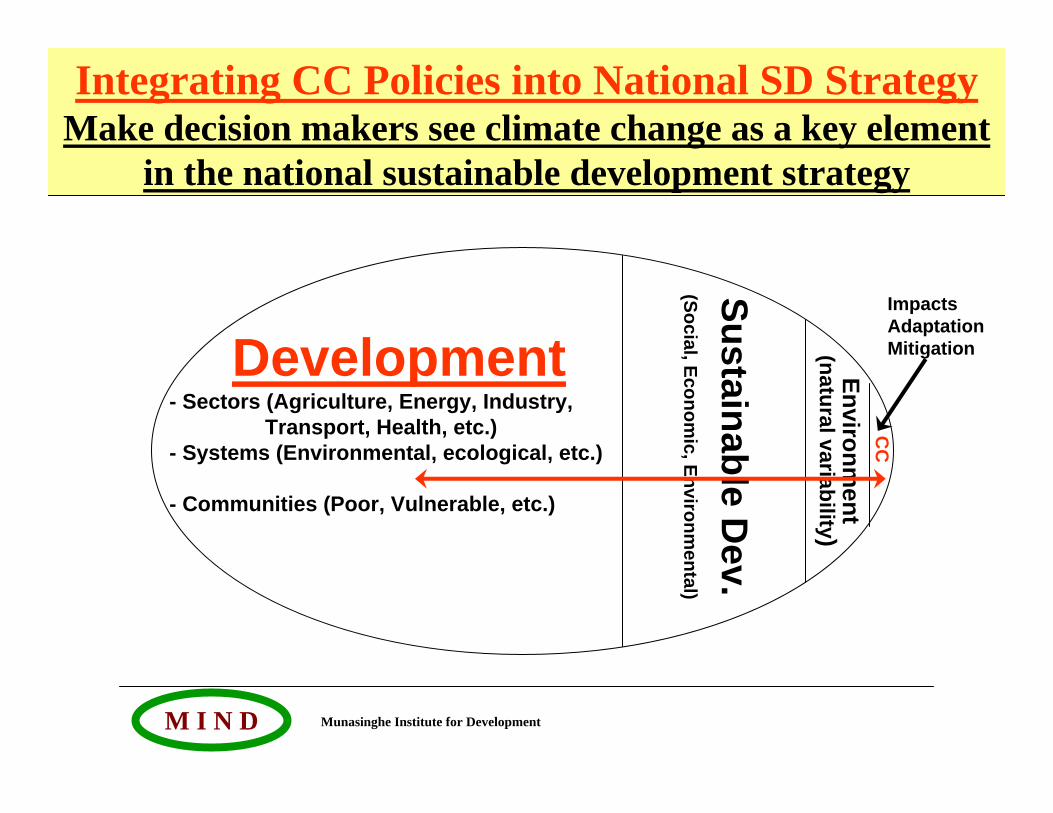
Development- Sectors (Agriculture, Energy, Industry,
Transport, Health, etc.)- Systems (Environmental, ecological, etc.)
- Communities (Poor, Vulnerable, etc.)
Sustainable Dev.
(Social, Economic, Environm
ental)
Environment
(natural variability)
CC
ImpactsAdaptationMitigation
Integrating CC Policies into National SD Strategy Make decision makers see climate change as a key element
in the national sustainable development strategy
Munasinghe Institute for DevelopmentM I N D
Action Impact Matrix Applications
Adaptation
Munasinghe Institute for DevelopmentM I N D
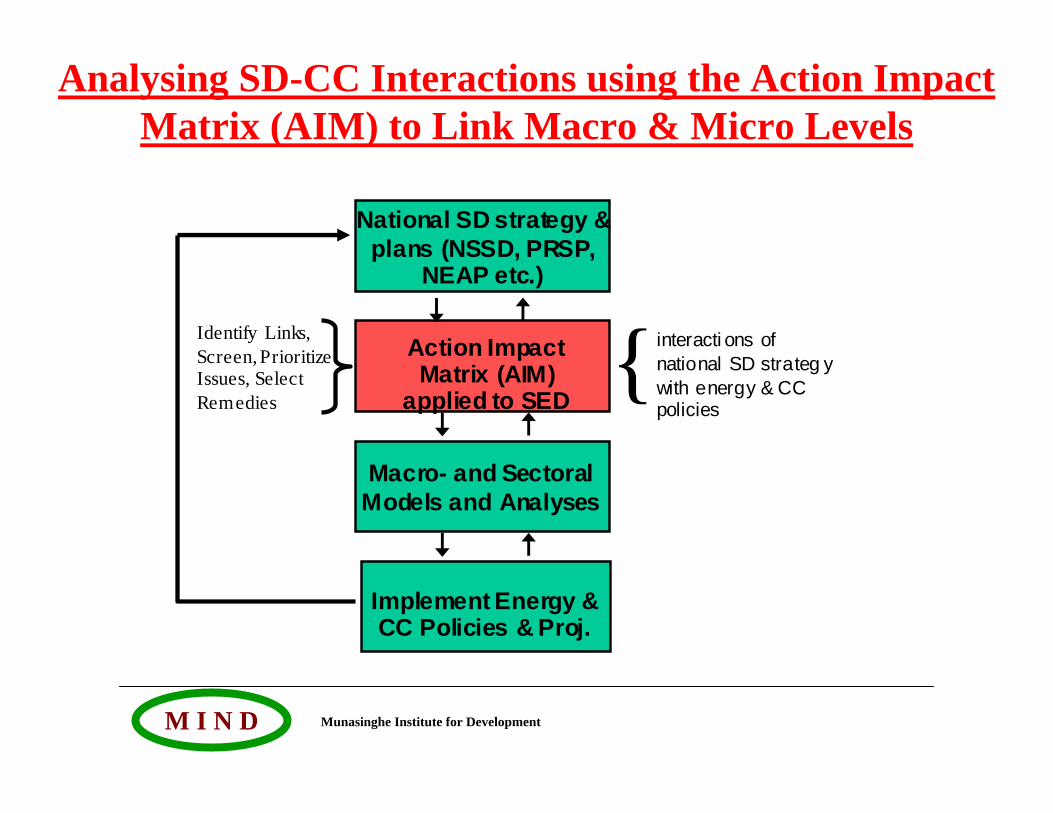
National SD strategy & plans (NSSD, PRSP,
NEAP etc.)
Action Impact Matrix (AIM)
applied to SED
Macro- and SectoralModels and Analyses
Implement Energy & CC Policies & Proj.
interacti ons of national SD strateg y with energy & CC policies
{Identify Links, Screen, Prioritize Issues, Select Remedies
Analysing SD-CC Interactions using the Action Impact Matrix (AIM) to Link Macro & Micro Levels
Munasinghe Institute for DevelopmentM I N D
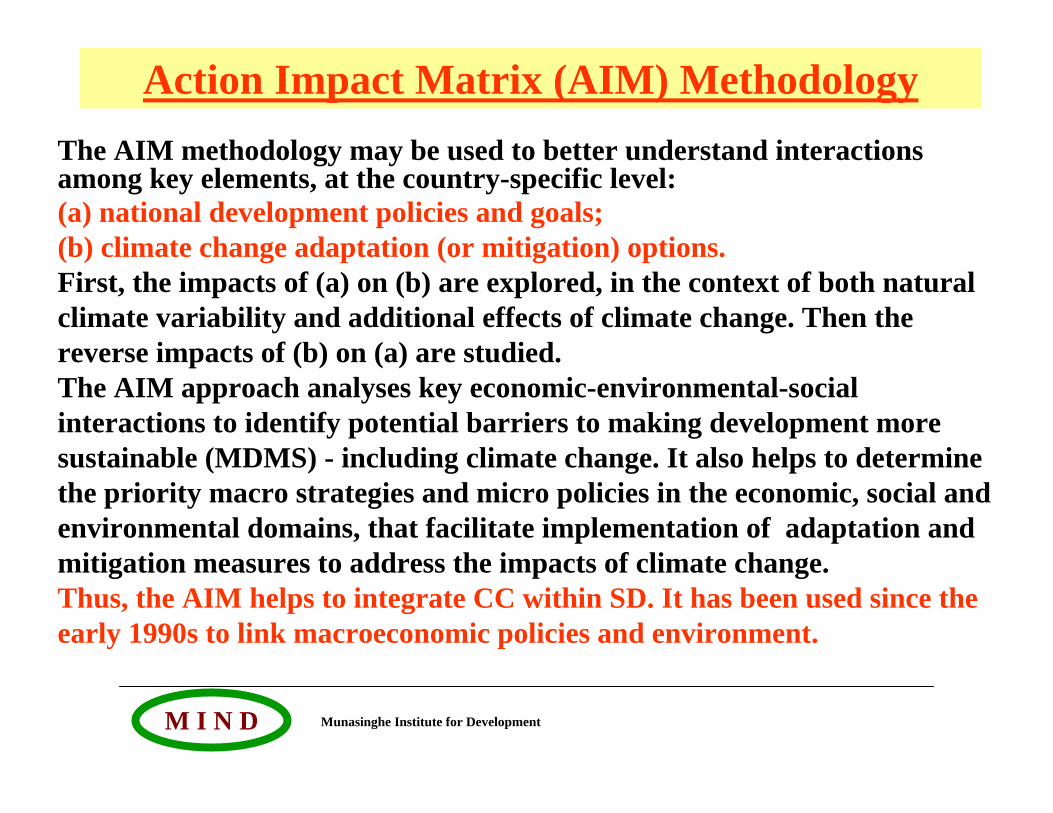
The AIM methodology may be used to better understand interactions among key elements, at the country-specific level:(a) national development policies and goals; (b) climate change adaptation (or mitigation) options.First, the impacts of (a) on (b) are explored, in the context of both natural climate variability and additional effects of climate change. Then the reverse impacts of (b) on (a) are studied.The AIM approach analyses key economic-environmental-social interactions to identify potential barriers to making development more sustainable (MDMS) - including climate change. It also helps to determine the priority macro strategies and micro policies in the economic, social and environmental domains, that facilitate implementation of adaptation and mitigation measures to address the impacts of climate change. Thus, the AIM helps to integrate CC within SD. It has been used since the early 1990s to link macroeconomic policies and environment.
Action Impact Matrix (AIM) Methodology
Munasinghe Institute for DevelopmentM I N D
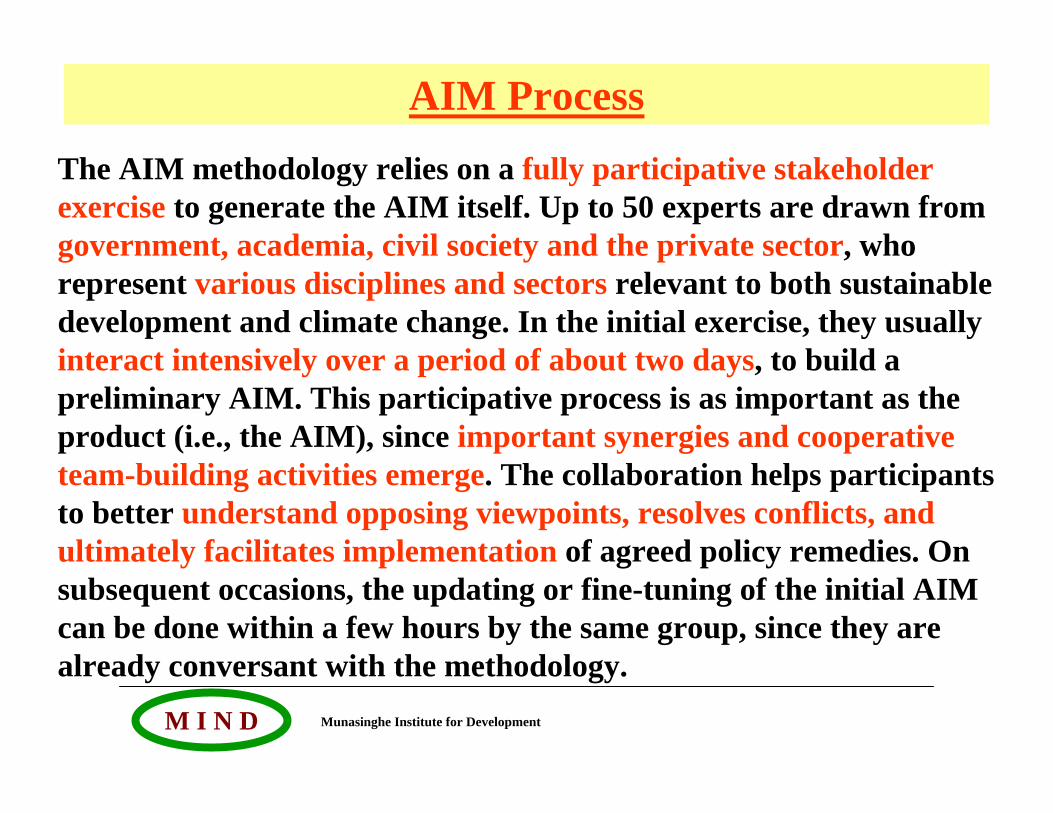
The AIM methodology relies on a fully participative stakeholder exercise to generate the AIM itself. Up to 50 experts are drawn from government, academia, civil society and the private sector, who represent various disciplines and sectors relevant to both sustainable development and climate change. In the initial exercise, they usually interact intensively over a period of about two days, to build a preliminary AIM. This participative process is as important as the product (i.e., the AIM), since important synergies and cooperative team-building activities emerge. The collaboration helps participants to better understand opposing viewpoints, resolves conflicts, and ultimately facilitates implementation of agreed policy remedies. On subsequent occasions, the updating or fine-tuning of the initial AIM can be done within a few hours by the same group, since they arealready conversant with the methodology.
AIM Process
Munasinghe Institute for DevelopmentM I N D
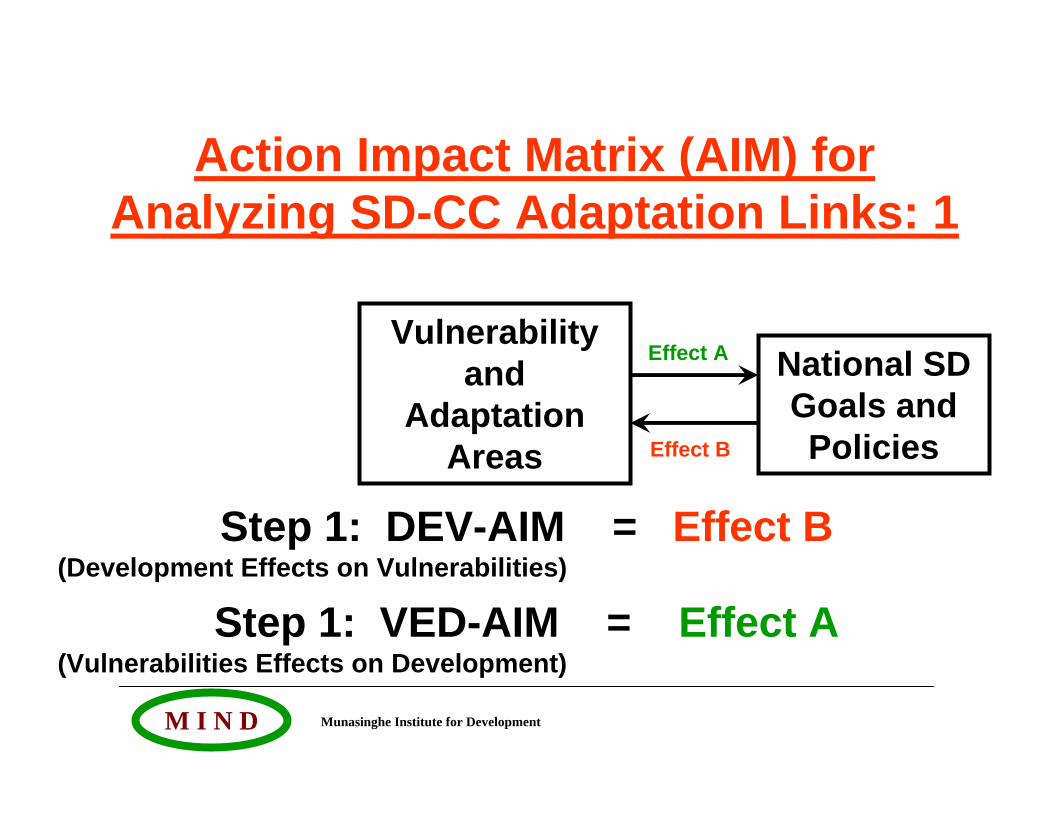
Vulnerability and
Adaptation Areas
National SD Goals and PoliciesEffect B
Step 1: DEV-AIM = Effect B(Development Effects on Vulnerabilities)
Step 1: VED-AIM = Effect A(Vulnerabilities Effects on Development)
Action Impact Matrix (AIM) for Analyzing SD-CC Adaptation Links: 1
Effect A
Munasinghe Institute for DevelopmentM I N D
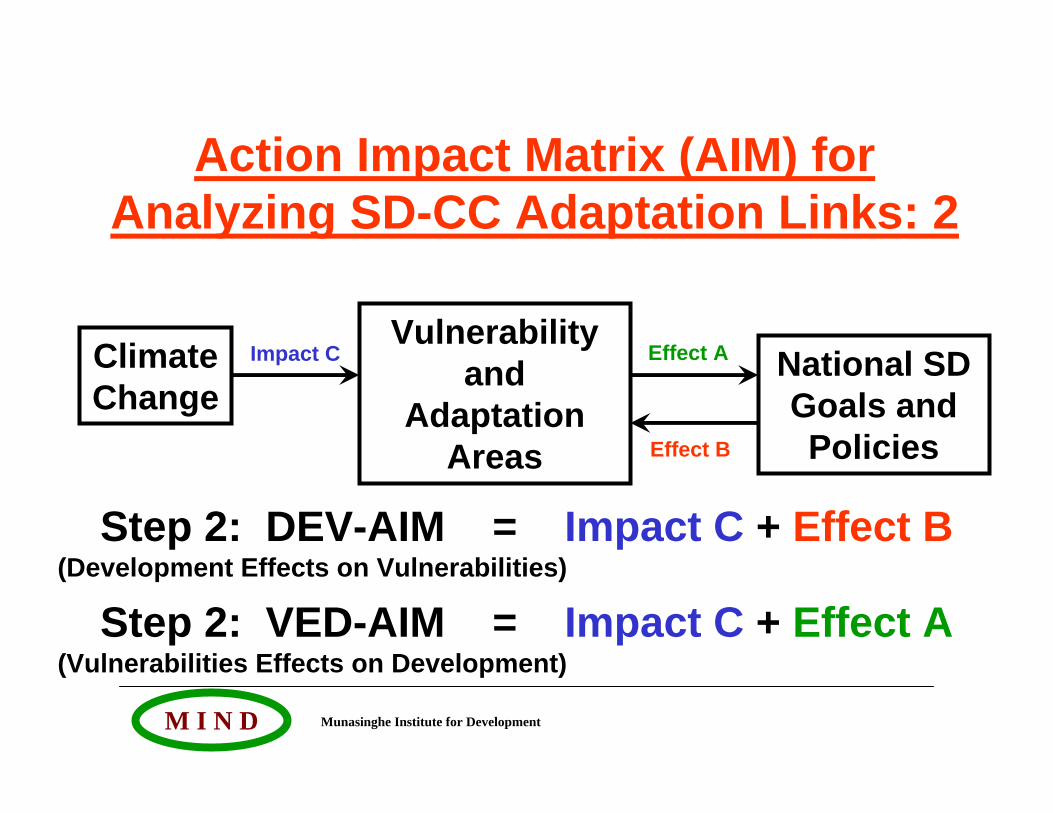
Climate Change
Vulnerability and
Adaptation Areas
National SD Goals and PoliciesEffect B
Impact C
Step 2: DEV-AIM = Impact C + Effect B(Development Effects on Vulnerabilities)
Step 2: VED-AIM = Impact C + Effect A(Vulnerabilities Effects on Development)
Action Impact Matrix (AIM) for Analyzing SD-CC Adaptation Links: 2
Effect A
Munasinghe Institute for DevelopmentM I N D
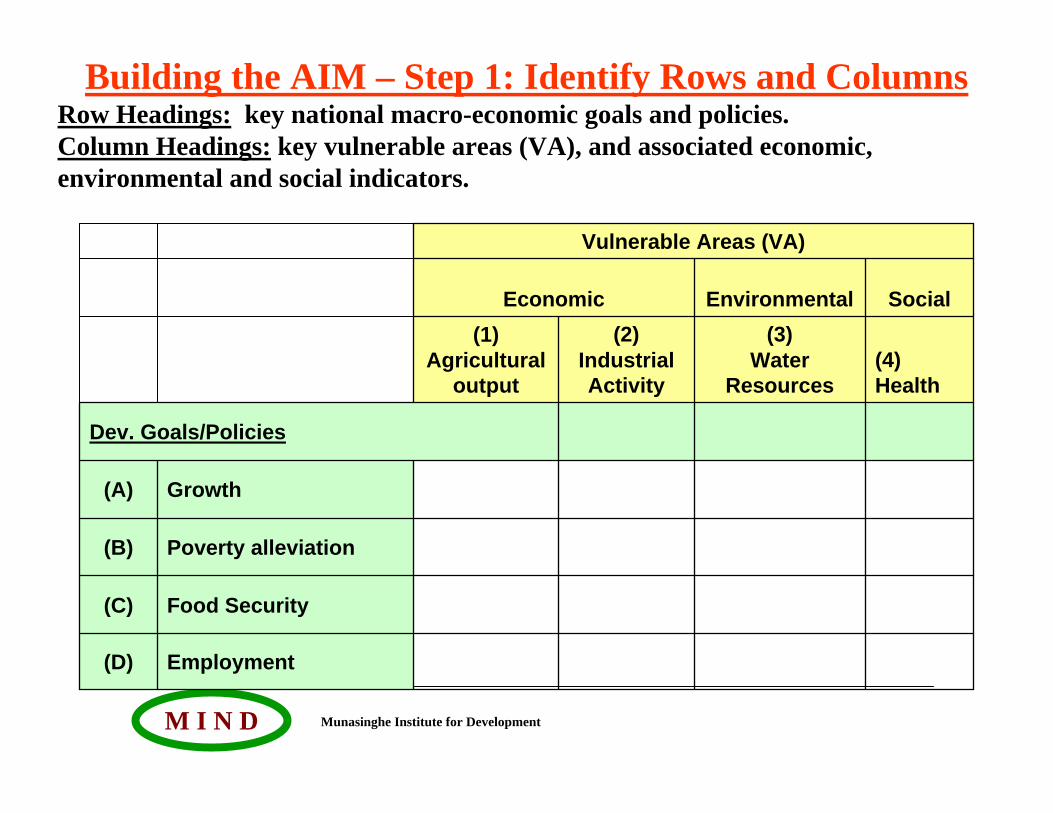
Employment(D)
Food Security(C)
Poverty alleviation(B)
Growth(A)
Dev. Goals/Policies
(4)Health
(3)Water
Resources
(2)Industrial Activity
(1) Agricultural
output
SocialEnvironmentalEconomic
Vulnerable Areas (VA)
Building the AIM – Step 1: Identify Rows and ColumnsRow Headings: key national macro-economic goals and policies.Column Headings: key vulnerable areas (VA), and associated economic, environmental and social indicators.
Munasinghe Institute for DevelopmentM I N D
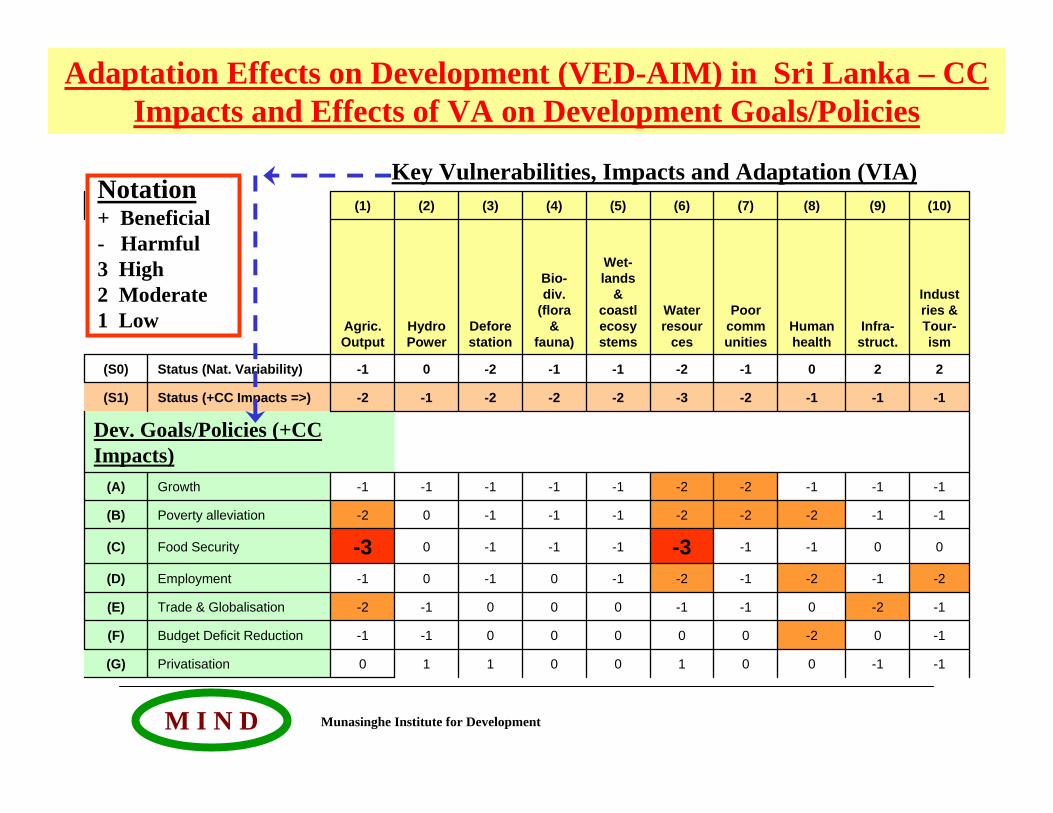
-1-100100110Privatisation(G)
-10-200000-1-1Budget Deficit Reduction(F)
-1-20-1-1000-1-2Trade & Globalisation(E)
-2-1-2-1-2-10-10-1Employment(D)
00-1-1-3-1-1-10-3Food Security(C)
-1-1-2-2-2-1-1-10-2Poverty alleviation(B)
-1-1-1-2-2-1-1-1-1-1Growth(A)
Dev. Goals/Policies (+CC Impacts)
-1-1-1-2-3-2-2-2-1-2Status (+CC Impacts =>) (S1)
220-1-2-1-1-20-1Status (Nat. Variability)(S0)
Industries & Tour-ism
Infra-struct.
Human health
Poor communities
Water resour
ces
Wet-lands
& coastlecosystems
Bio-div.
(flora &
fauna)Deforestation
Hydro Power
Agric. Output
(10)(9)(8)(7)(6)(5)(4)(3)(2)(1)
Adaptation Effects on Development (VED-AIM) in Sri Lanka – CC Impacts and Effects of VA on Development Goals/Policies
Key Vulnerabilities, Impacts and Adaptation (VIA)Notation+ Beneficial- Harmful3 High2 Moderate1 Low
Munasinghe Institute for DevelopmentM I N D
AIM Follow-up: Analyzing Macro- and
Micro- LinkagesExamples:1. CC-Macroeconomic analysis2. Adaptation assessment
Munasinghe Institute for DevelopmentM I N D
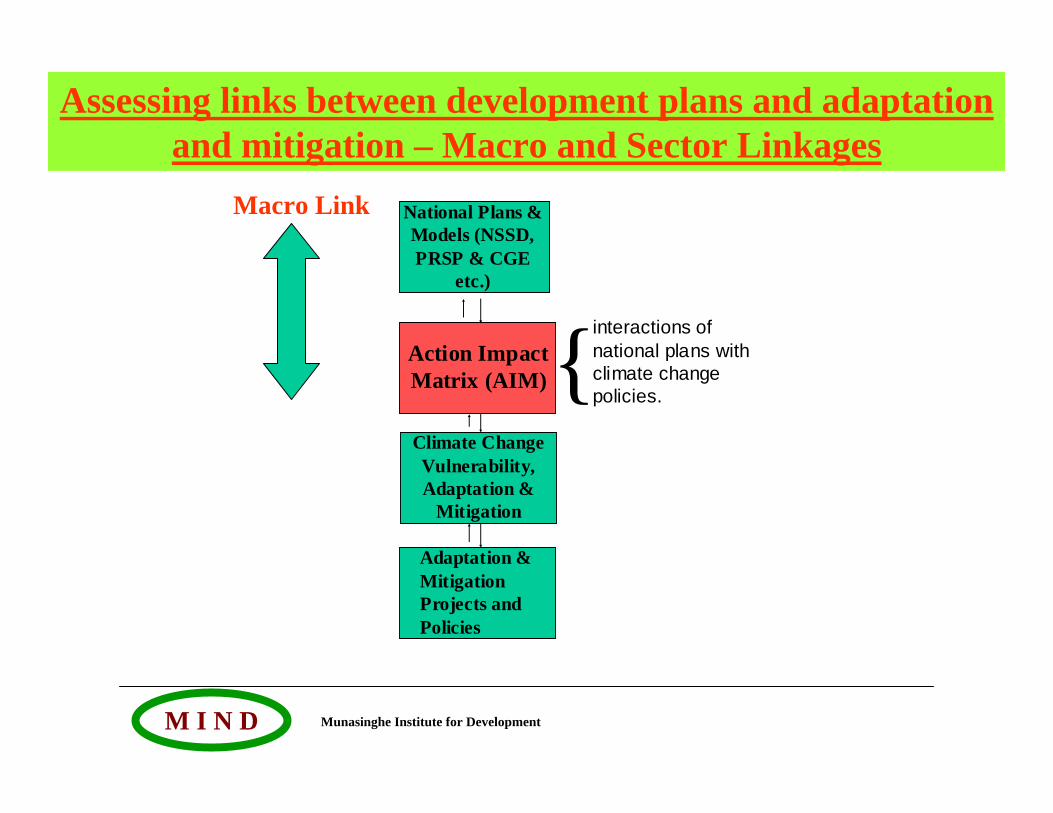
National Plans & Models (NSSD, PRSP & CGE
etc.)
Action Impact Matrix (AIM)
Climate Change Vulnerability, Adaptation &
Mitigation
Adaptation & Mitigation Projects and Policies
interactions of national plans with climate change policies.{
Assessing links between development plans and adaptation and mitigation – Macro and Sector Linkages
Macro Link
Munasinghe Institute for DevelopmentM I N D
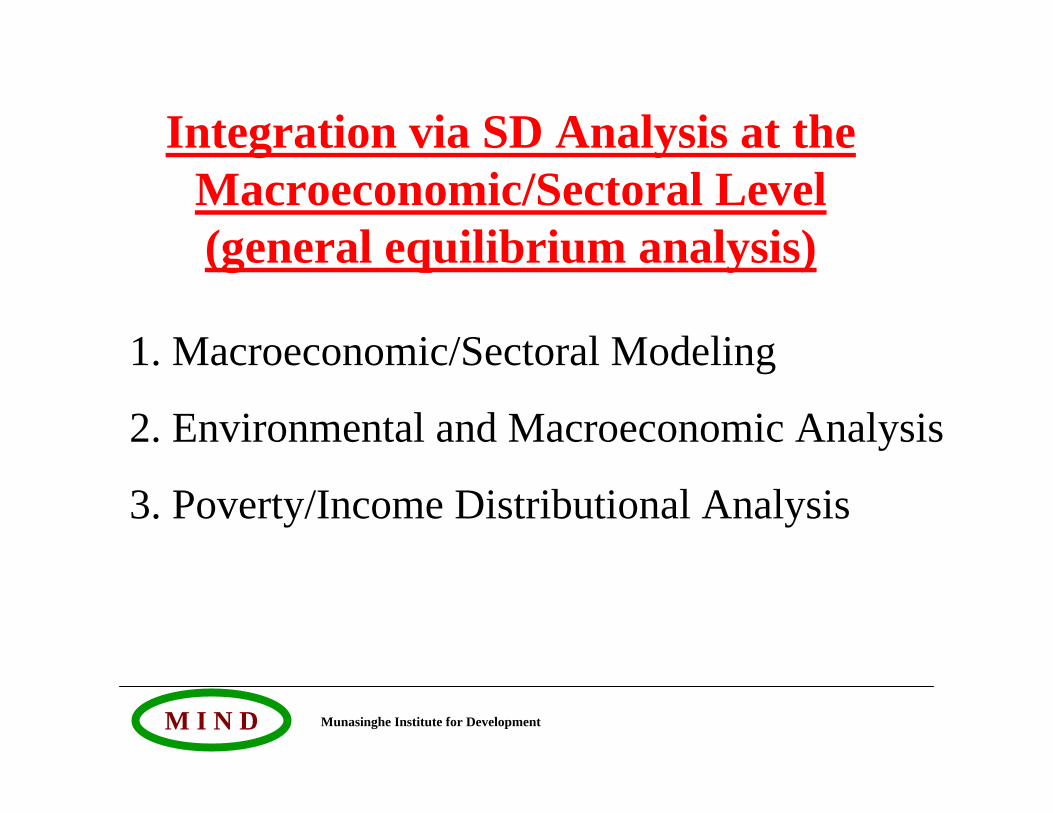
Integration via SD Analysis at the Macroeconomic/Sectoral Level (general equilibrium analysis)
1. Macroeconomic/Sectoral Modeling
2. Environmental and Macroeconomic Analysis
3. Poverty/Income Distributional Analysis
Munasinghe Institute for DevelopmentM I N D
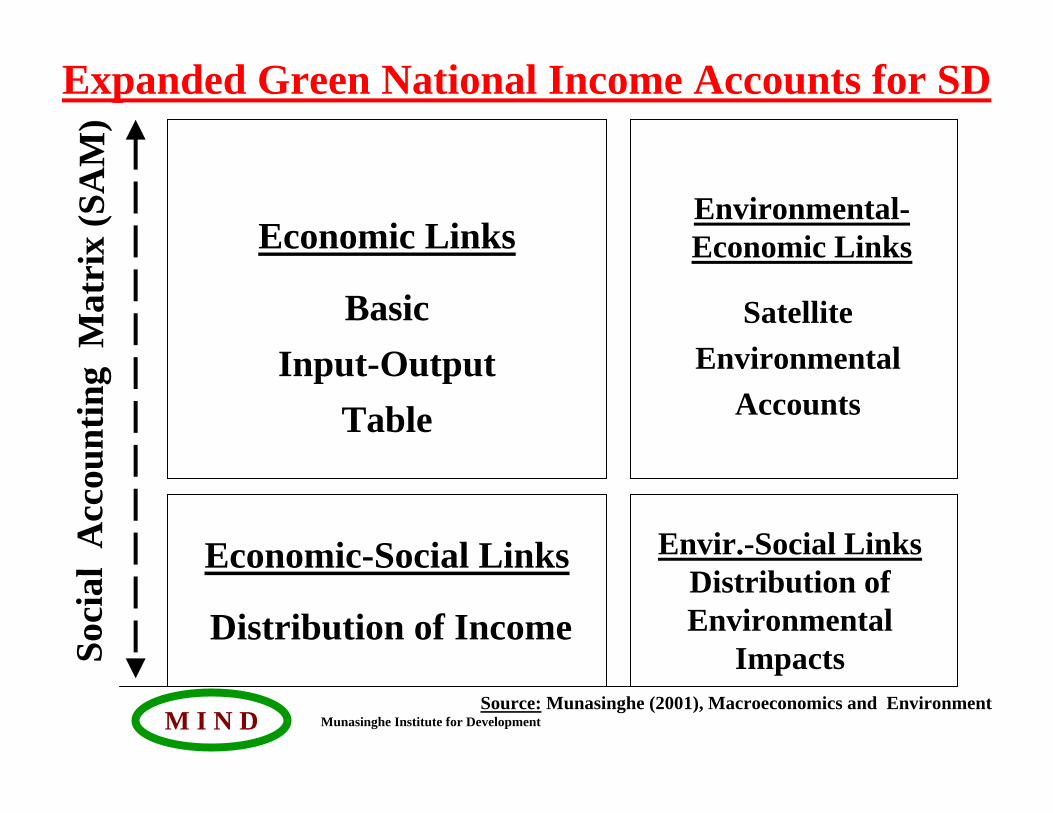
BasicInput-Output
Table
Distribution of Income
SatelliteEnvironmental
Accounts
Envir.-Social LinksDistribution of Environmental
Impacts
Economic LinksEnvironmental-Economic Links
Economic-Social Links
Expanded Green National Income Accounts for SDSo
cial
Acc
o unt
ing
Mat
rix
(SA
M)
Source: Munasinghe (2001), Macroeconomics and Environment
Munasinghe Institute for DevelopmentM I N D
Sectoral Level Example:
Analysing Climate Change Impacts on Agriculture in Sri
Lanka Using a Ricardian Model
Source: Munasinghe, Perera and Seo (1996)
Munasinghe Institute for DevelopmentM I N D
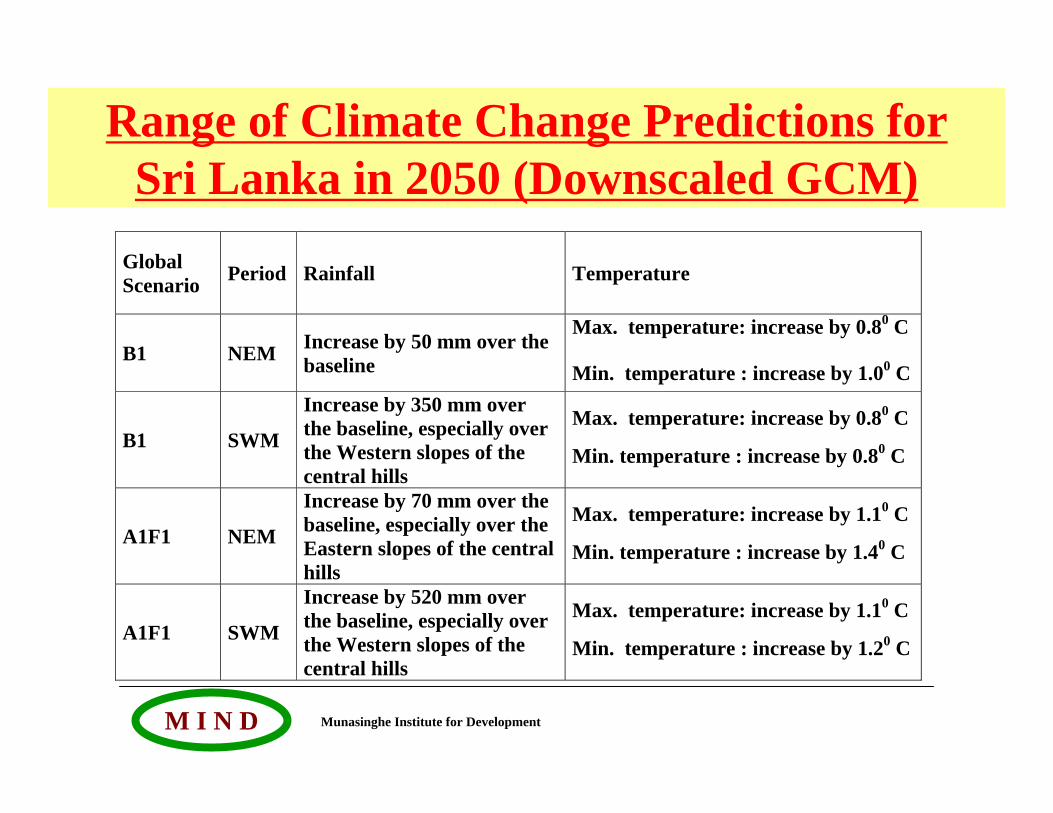
Range of Climate Change Predictions for Sri Lanka in 2050 (Downscaled GCM)
Global Scenario Period Rainfall Temperature
B1 NEM Increase by 50 mm over the baseline
Max. temperature: increase by 0.80 C Min. temperature : increase by 1.00 C
B1 SWM
Increase by 350 mm over the baseline, especially over the Western slopes of the central hills
Max. temperature: increase by 0.80 C Min. temperature : increase by 0.80 C
A1F1 NEM
Increase by 70 mm over the baseline, especially over the Eastern slopes of the central hills
Max. temperature: increase by 1.10 C Min. temperature : increase by 1.40 C
A1F1 SWM
Increase by 520 mm over the baseline, especially over the Western slopes of the central hills
Max. temperature: increase by 1.10 C Min. temperature : increase by 1.20 C
Munasinghe Institute for DevelopmentM I N D
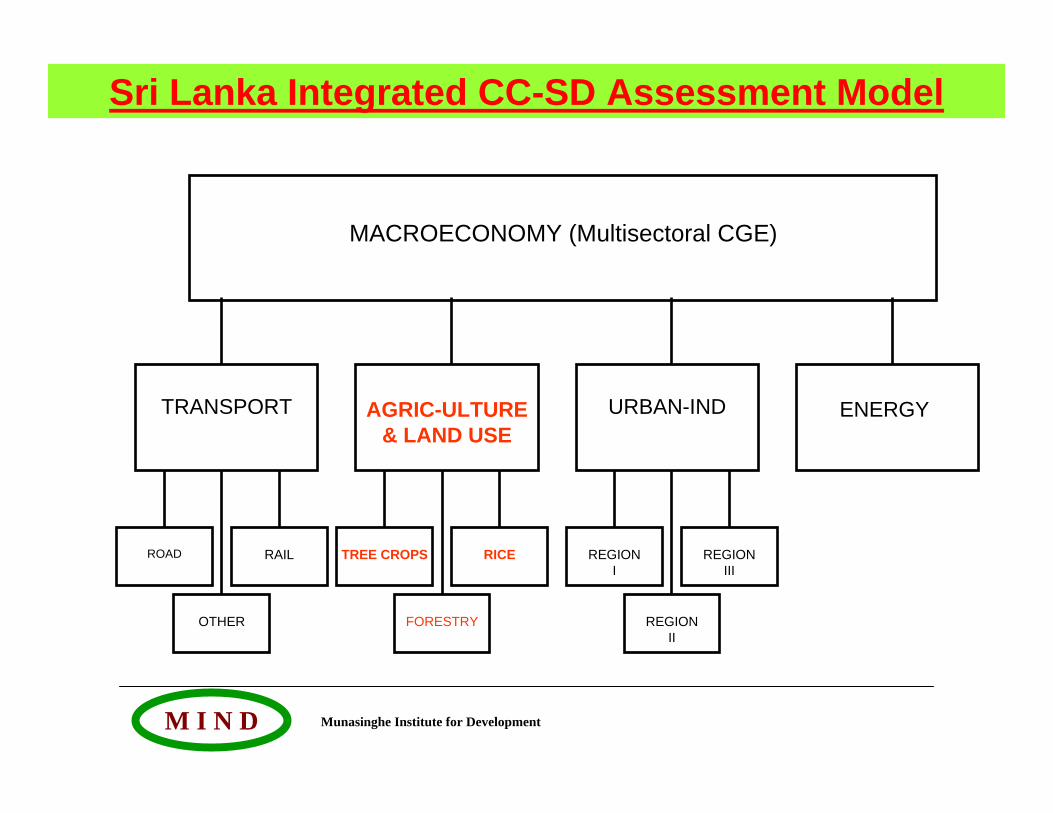
MACROECONOMY (Multisectoral CGE)
TRANSPORT AGRIC-ULTURE & LAND USE
URBAN-IND
ROAD RAIL
OTHER
TREE CROPS RICE
FORESTRY
REGIONI
REGIONIII
REGIONII
Sri Lanka Integrated CC-SD Assessment Model
ENERGY
Munasinghe Institute for DevelopmentM I N D
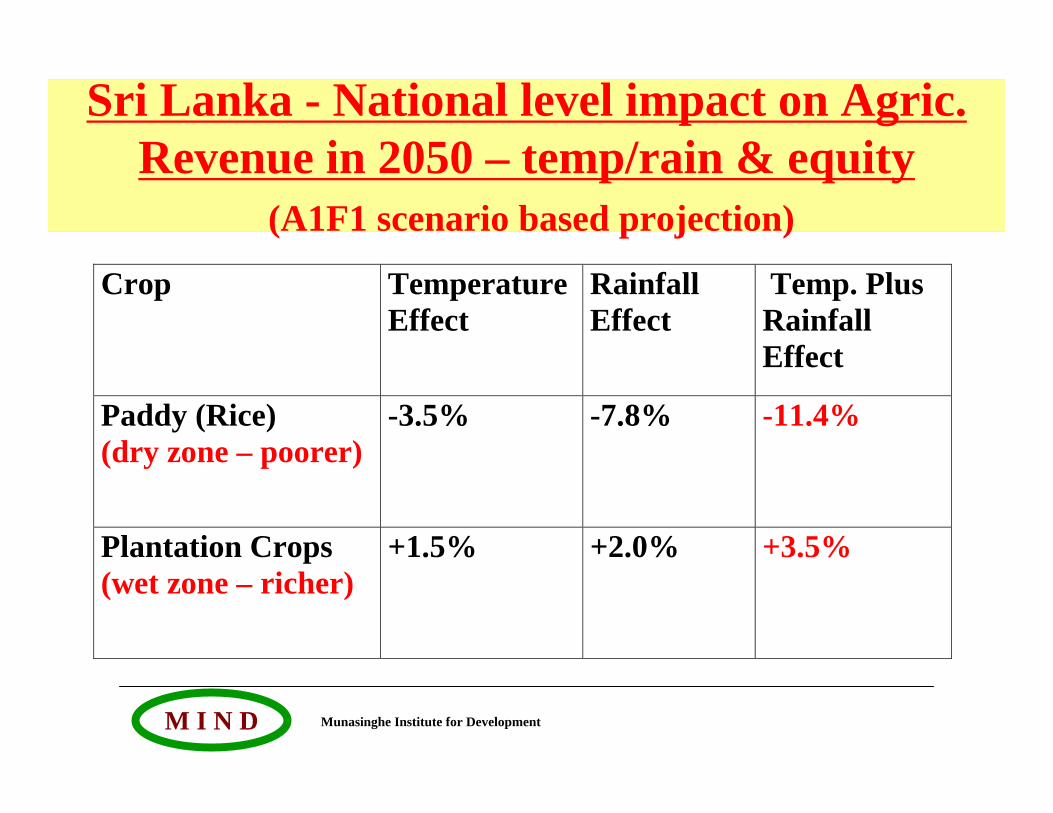
Sri Lanka - National level impact on Agric. Revenue in 2050 – temp/rain & equity
(A1F1 scenario based projection)
Crop Temperature Effect
Rainfall Effect
Temp. Plus Rainfall Effect
Paddy (Rice) (dry zone – poorer)
-3.5% -7.8% -11.4%
Plantation Crops (wet zone – richer)
+1.5% +2.0% +3.5%
Munasinghe Institute for DevelopmentM I N D
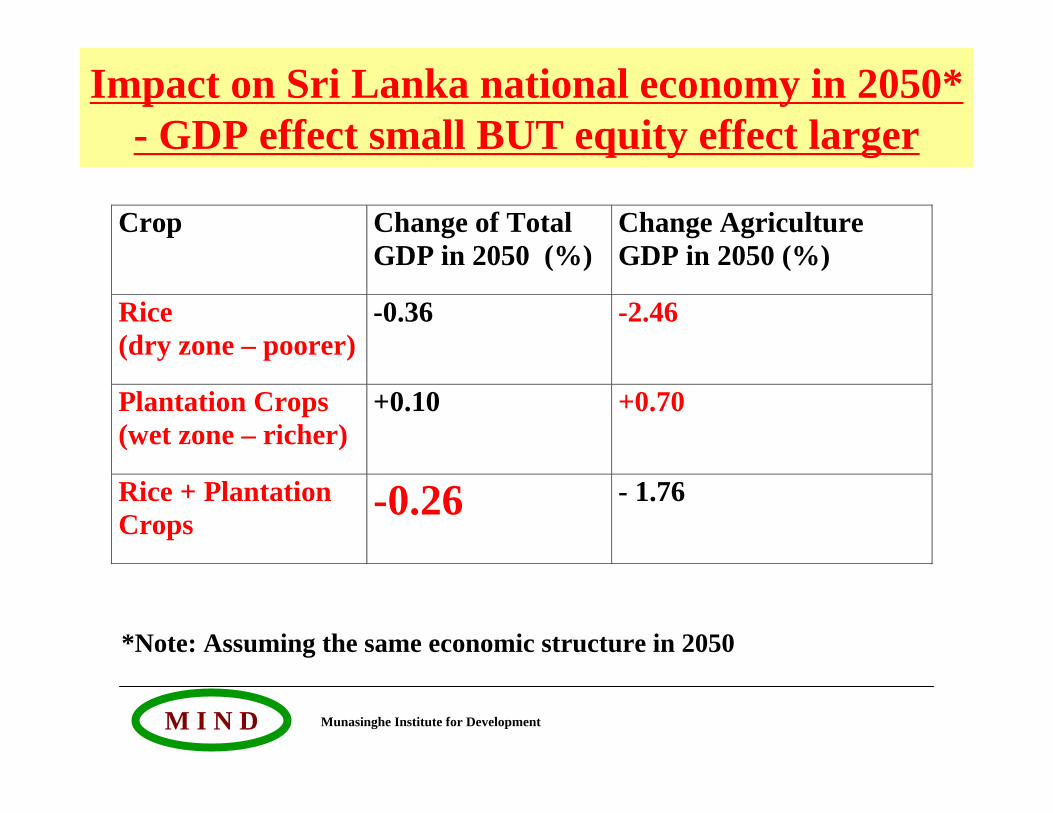
Impact on Sri Lanka national economy in 2050* - GDP effect small BUT equity effect larger
Crop Change of Total GDP in 2050 (%)
Change Agriculture GDP in 2050 (%)
Rice (dry zone – poorer)
-0.36 -2.46
Plantation Crops (wet zone – richer)
+0.10 +0.70
Rice + Plantation Crops
-0.26 - 1.76
*Note: Assuming the same economic structure in 2050
Munasinghe Institute for DevelopmentM I N D
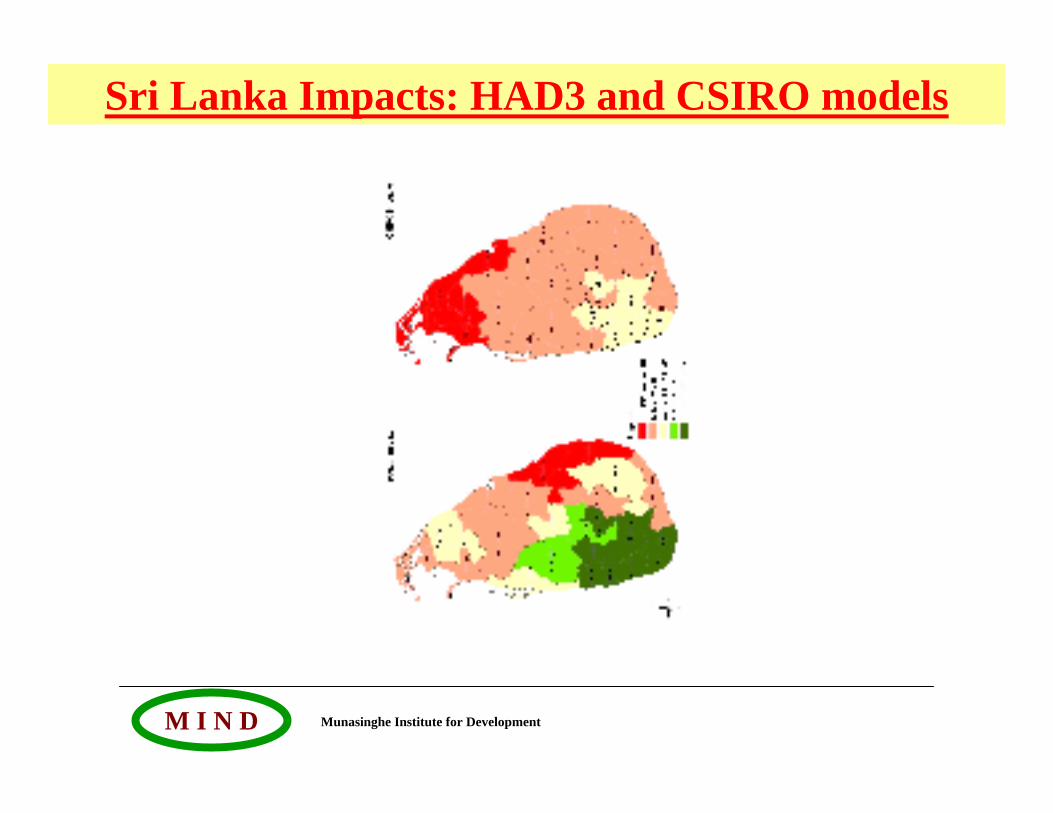
Sri Lanka Impacts: HAD3 and CSIRO models
Munasinghe Institute for DevelopmentM I N D
National Level Example
Energy Sector Policy and Pricing
Munasinghe Institute for DevelopmentM I N D
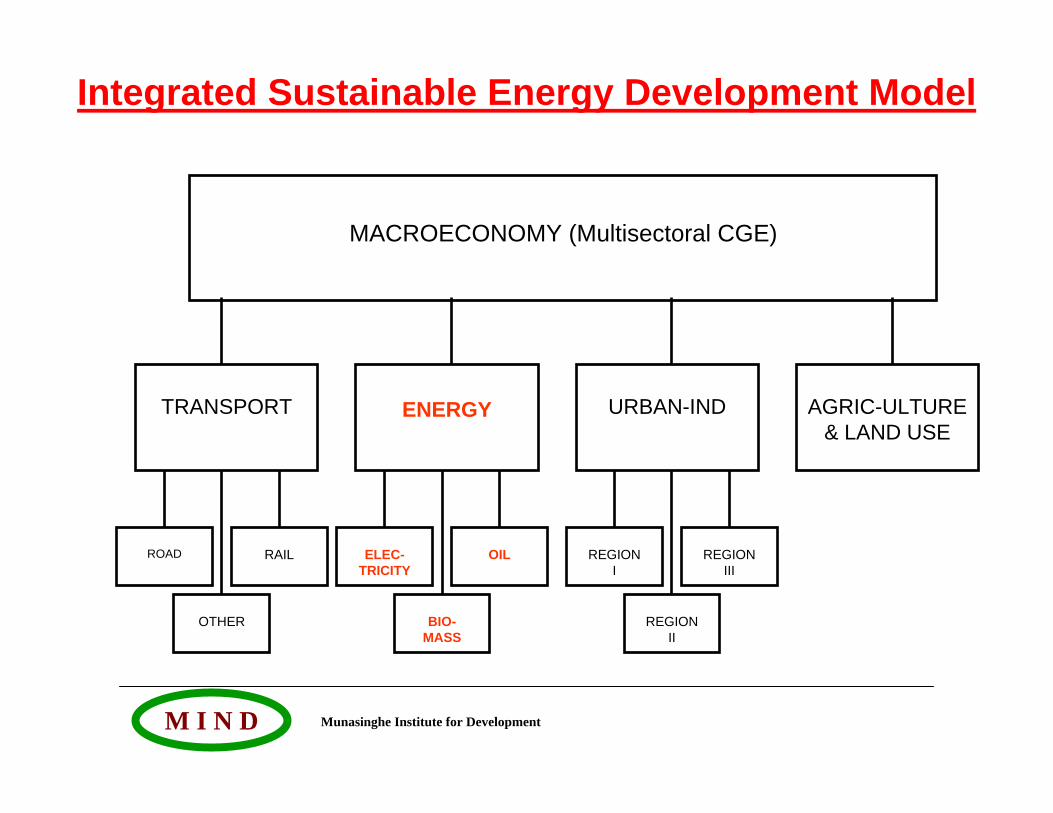
MACROECONOMY (Multisectoral CGE)
TRANSPORT AGRIC-ULTURE & LAND USE
ENERGY URBAN-IND
ROAD RAIL
OTHER
ELEC-TRICITY
OIL
BIO-MASS
REGIONI
REGIONIII
REGIONII
Integrated Sustainable Energy Development Model
Munasinghe Institute for DevelopmentM I N D
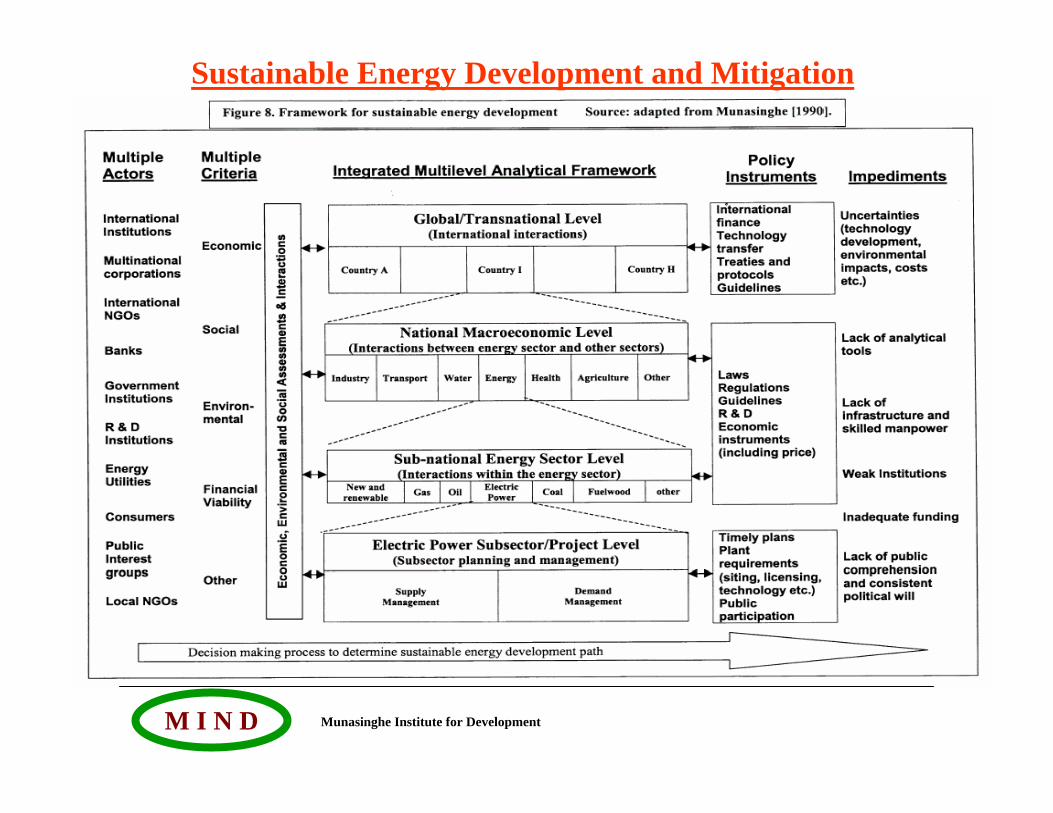
Sustainable Energy Development and Mitigation
Munasinghe Institute for DevelopmentM I N D
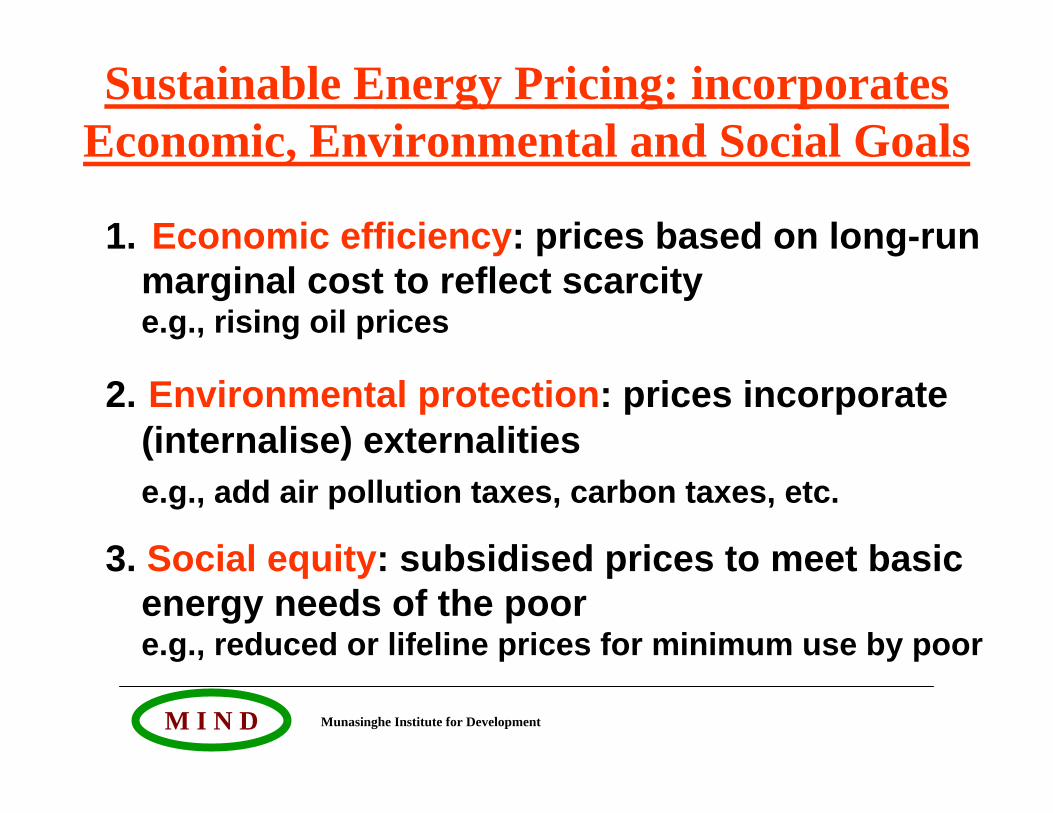
Sustainable Energy Pricing: incorporates Economic, Environmental and Social Goals
1. Economic efficiency: prices based on long-run marginal cost to reflect scarcitye.g., rising oil prices
2. Environmental protection: prices incorporate (internalise) externalitiese.g., add air pollution taxes, carbon taxes, etc.
3. Social equity: subsidised prices to meet basic energy needs of the poore.g., reduced or lifeline prices for minimum use by poor
Munasinghe Institute for DevelopmentM I N D
Project Level Example
Assessing economic, social and ecological indicators for small hydro in Sri Lanka
Primary Source: Morimoto R., and Munasinghe M. (2005) “Small hydropower projects and sustainable energy development in Sri Lanka”, Int. Journal of Global Environmental Issues, Vol.4.Summary: Munasinghe, M. (2002) “The sustainomics trans-disciplinary meta-framework for making development more sustainable: applications to energy issues”, Int. J. of Sustainable Dev.,Vol.4, No.2, pp.6-54.
Munasinghe Institute for DevelopmentM I N D
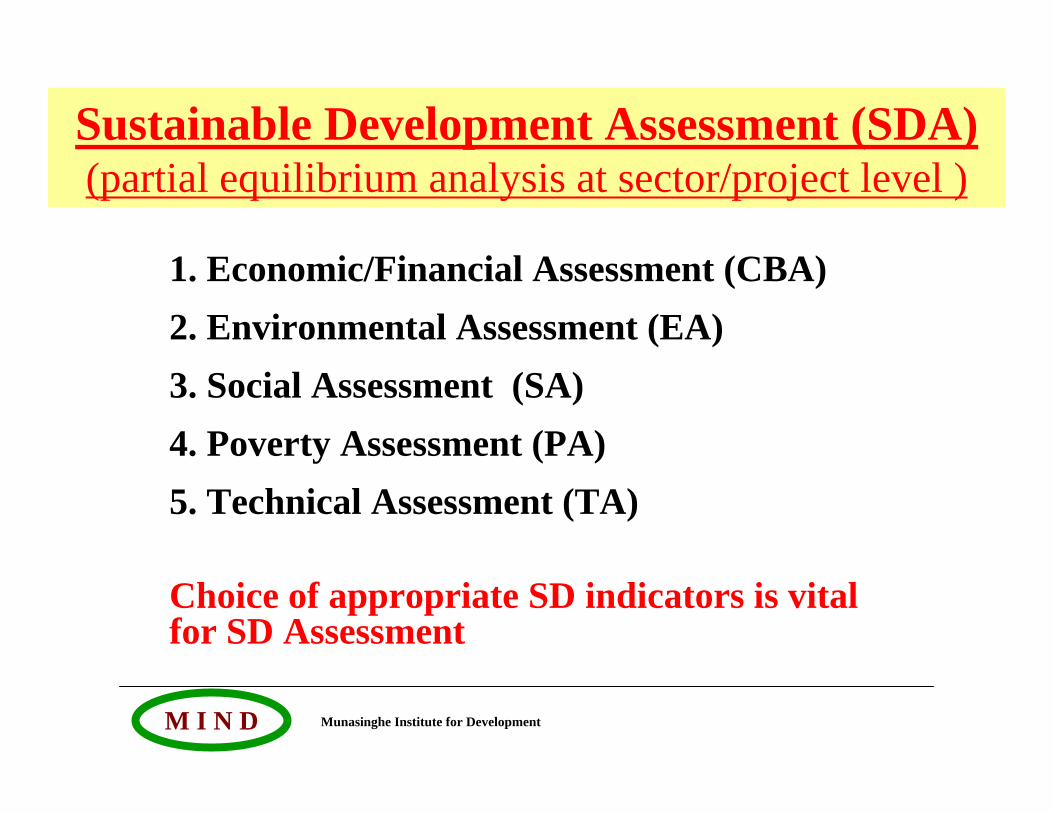
Sustainable Development Assessment (SDA)(partial equilibrium analysis at sector/project level )
1. Economic/Financial Assessment (CBA)2. Environmental Assessment (EA)3. Social Assessment (SA)4. Poverty Assessment (PA)5. Technical Assessment (TA)
Choice of appropriate SD indicators is vital for SD Assessment
Munasinghe Institute for DevelopmentM I N D
Overview of study• Energy affects all three dimensions of sustainable development.• Reviews linkages between potential impacts of energy
production and consumption on sustainable development,. • Multi-criteria analysis used to assess the role of small
hydroelectric power projects in sustainable energy development.
• 3 key variables: Economic - electricity supply costs, Social - numbers of people resettled, Environmental - biodiversity loss
• Analysis helps policy-makers compare and rank project alternatives more easily and effectively.
• The multi-criteria analysis, which includes environmental and social variables, supplements cost benefit analysis which is based on economic values alone.
Munasinghe Institute for DevelopmentM I N D
Economic indicator usedAverage generation costs per unit generated per year [Ci/Qi] whereCi = total economic cost of project i Qi = quantity of electricity generated from project i This measure is equivalent to using net benefits per unit of generation: NBi/QiwhereNBi = (Bi – Ci) = net benefit from project i ;Bi = total benefit from project i ;and we assume that the total benefit per unit generated is the same for all projects compared: Bi/Qi
Another related measure would be the average generation costs per unit of GHG emissions reduced, assuming that each unit of hydro-electricity produced would reduce a unit of thermal generation and associated GHG emissions.
Munasinghe Institute for DevelopmentM I N D
Environmental Indicator usedAverage biodiversity index value per unit of energy produced per year: Gi = Ei / [Hydroelectricity generated per year at site i]where Ei is the biodiversity index
Ei = ∑ wj. Aijj
where Aij is the area (hectares) of ecosystem of type j at site i, wj is relative biodiversity value of ecosystem type j
Another useful indicator is average biodiversity index value perhectare of affected landFi = Ei / [∑Aij] = Ei /[Total land area affected at site i]
j
Munasinghe Institute for DevelopmentM I N D
Social Indicator used
Resettlement = Number of people resettled per unitof electricity generated per year
Minimising the number of people resettled due todam construction is an important social objective.
Munasinghe Institute for DevelopmentM I N D
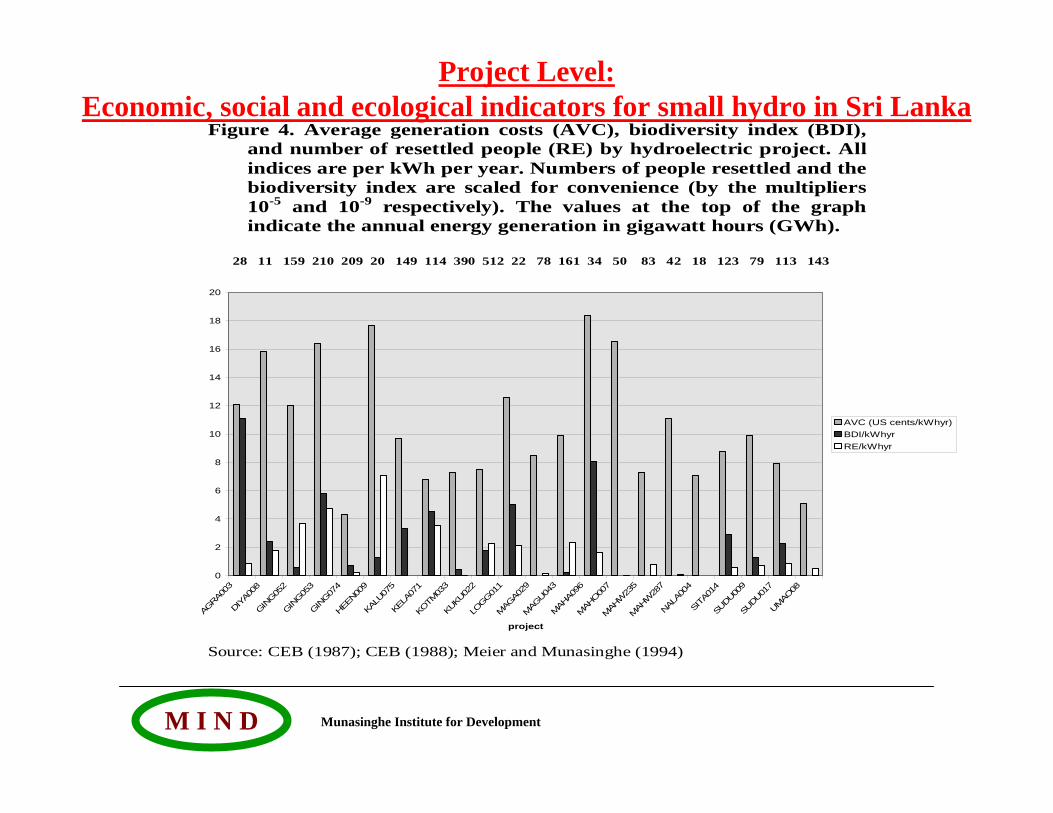
Figure 4. Average generation costs (AVC), biodiversity index (BDI), and number of resettled people (RE) by hydroelectric project. All indices are per kWh per year. Numbers of people resettled and the biodiversity index are scaled for convenience (by the multipliers 10-5 and 10-9 respectively). The values at the top of the graph indicate the annual energy generation in gigawatt hours (GWh).
28 11 159 210 209 20 149 114 390 512 22 78 161 34 50 83 42 18 123 79 113 143
Source: CEB (1987); CEB (1988); Meier and Munasinghe (1994)
0
2
4
6
8
10
12
14
16
18
20
AGRA0
03DIY
A008
GING05
2GIN
G053
GING07
4HEE
N009
KALU
075
KELA
071
KOTM
033
KUKU
022
LOGG01
1M
AGA0
29M
AGU04
3MAH
A096
MAH
O007
MAH
W23
5M
AHW
287
NALA0
04SI
TA01
4SU
DU009
SUDU01
7UM
AO08
project
AVC (US cents/kWhyr)BDI/kWhyrRE/kWhyr
Project Level: Economic, social and ecological indicators for small hydro in Sri Lanka
Munasinghe Institute for DevelopmentM I N D
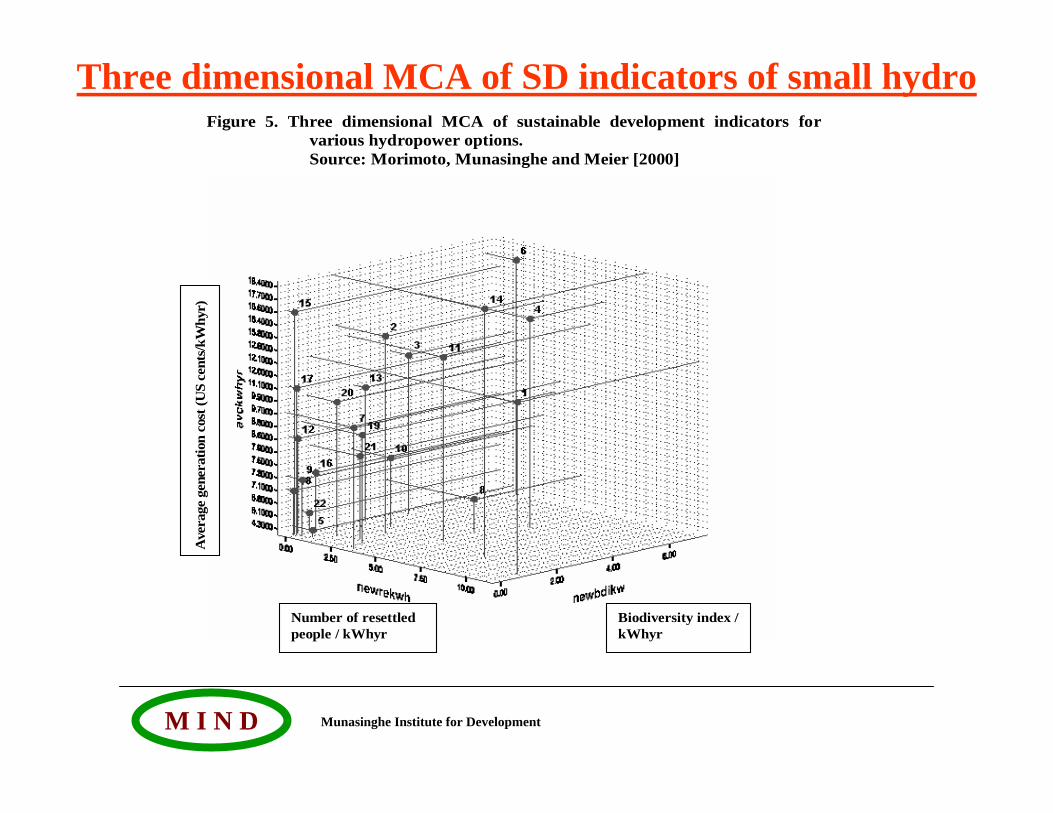
Figure 5. Three dimensional MCA of sustainable development indicators forvarious hydropower options. Source: Morimoto, Munasinghe and Meier [2000]
Ave
rage
gen
erat
ion
cost
(US
cent
s/kW
hyr)
Number of resettled people / kWhyr
Biodiversity index / kWhyr
Three dimensional MCA of SD indicators of small hydro
Munasinghe Institute for DevelopmentM I N D
Conclusions of Small Hydro Study
• MCA helps policy-makers compare project alternatives more easily and effectively
• Looks at all aspects of project (social, environmental and economic) unlike CBA which emphasises economic aspects.
Munasinghe Institute for DevelopmentM I N D
Linking and Coordinating the Millennium Development
Goals (MDG) with Multilateral Environmental Agreements (MEA) & Issues
Munasinghe Institute for DevelopmentM I N D
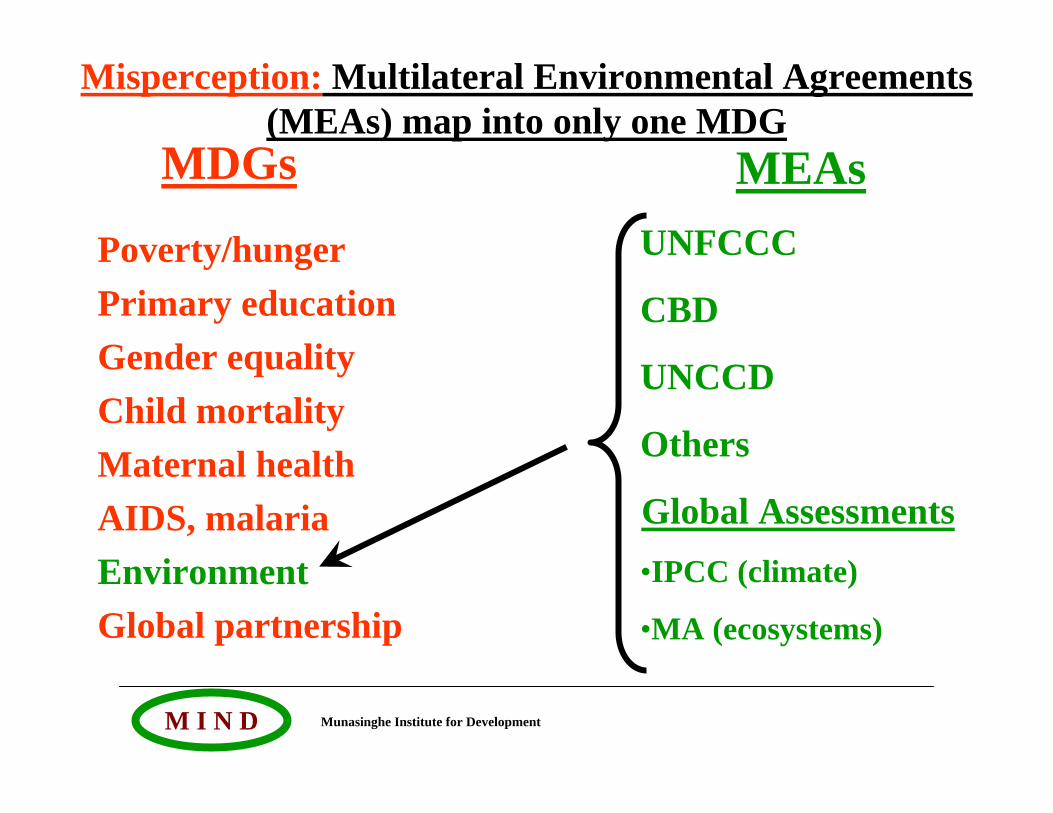
MDGs
Poverty/hungerPrimary educationGender equalityChild mortalityMaternal healthAIDS, malariaEnvironmentGlobal partnership
MEAsUNFCCC
CBD
UNCCD
Others
Global Assessments•IPCC (climate)
•MA (ecosystems)
Misperception: Multilateral Environmental Agreements (MEAs) map into only one MDG
Munasinghe Institute for DevelopmentM I N D
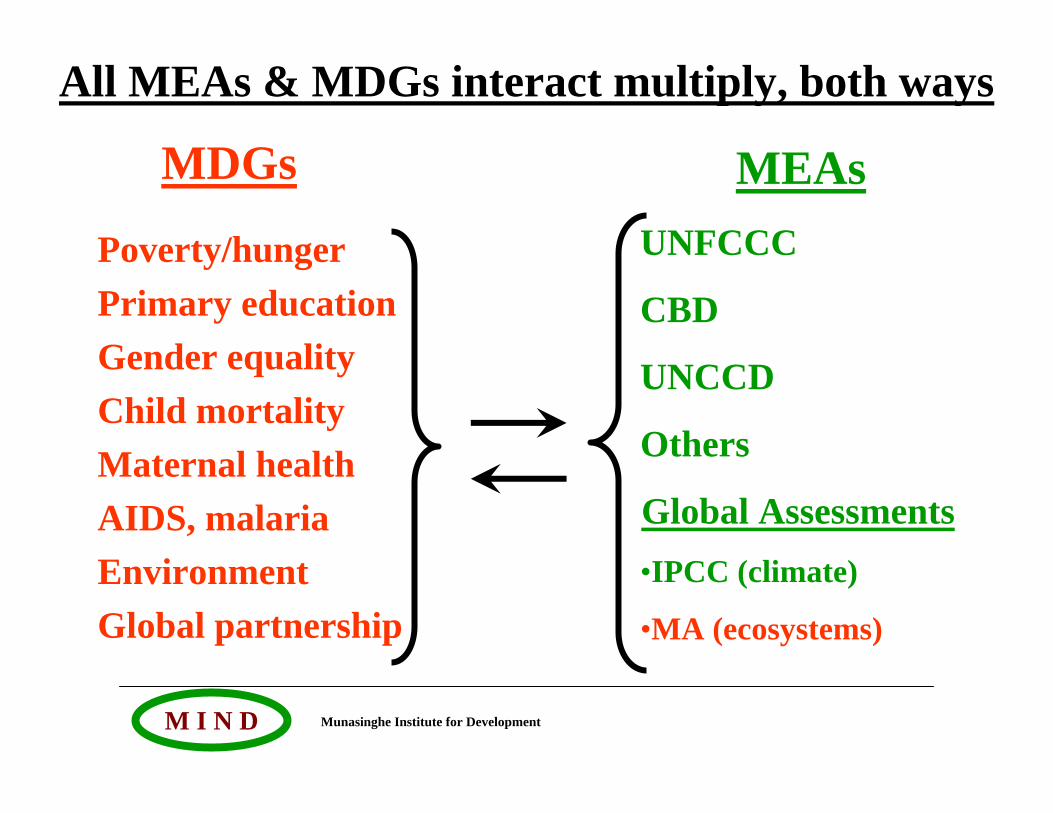
MDGs
Poverty/hungerPrimary educationGender equalityChild mortalityMaternal healthAIDS, malariaEnvironmentGlobal partnership
MEAsUNFCCC
CBD
UNCCD
Others
Global Assessments•IPCC (climate)
•MA (ecosystems)
All MEAs & MDGs interact multiply, both ways
Munasinghe Institute for DevelopmentM I N D
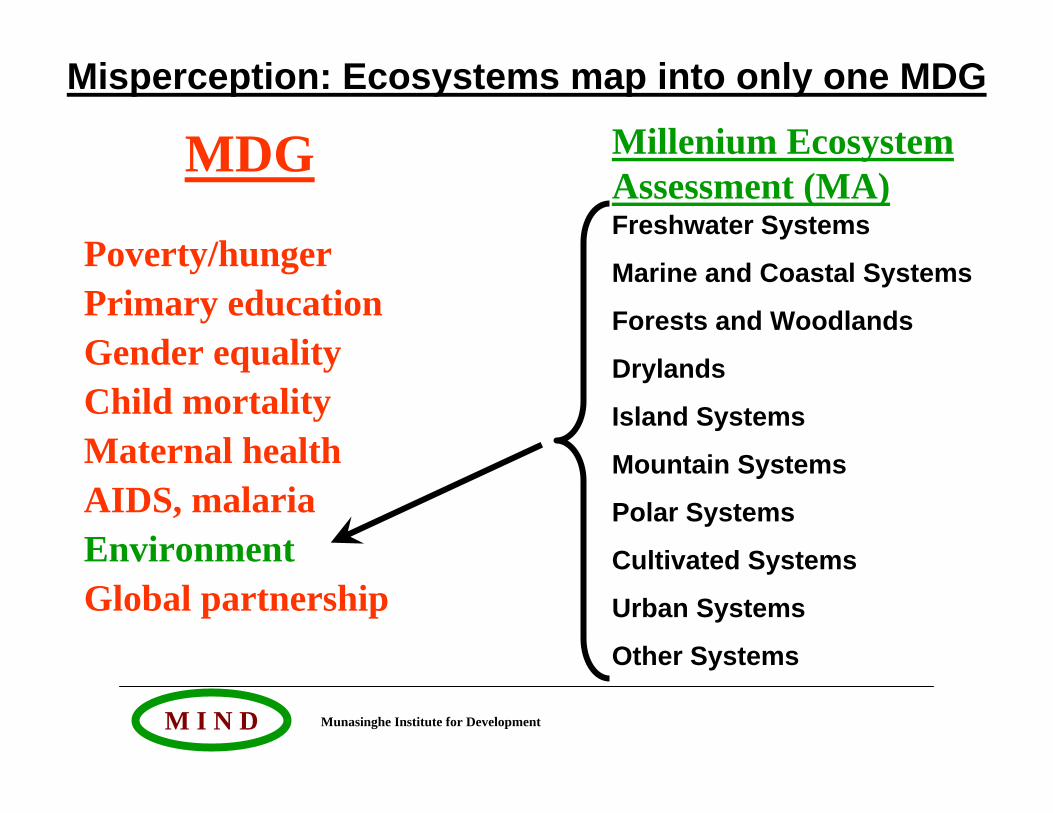
MDG
Poverty/hungerPrimary educationGender equalityChild mortalityMaternal healthAIDS, malariaEnvironmentGlobal partnership
Millenium Ecosystem Assessment (MA)
Misperception: Ecosystems map into only one MDG
Freshwater Systems
Marine and Coastal Systems
Forests and Woodlands
Drylands
Island Systems
Mountain Systems
Polar Systems
Cultivated Systems
Urban Systems
Other Systems
Munasinghe Institute for DevelopmentM I N D
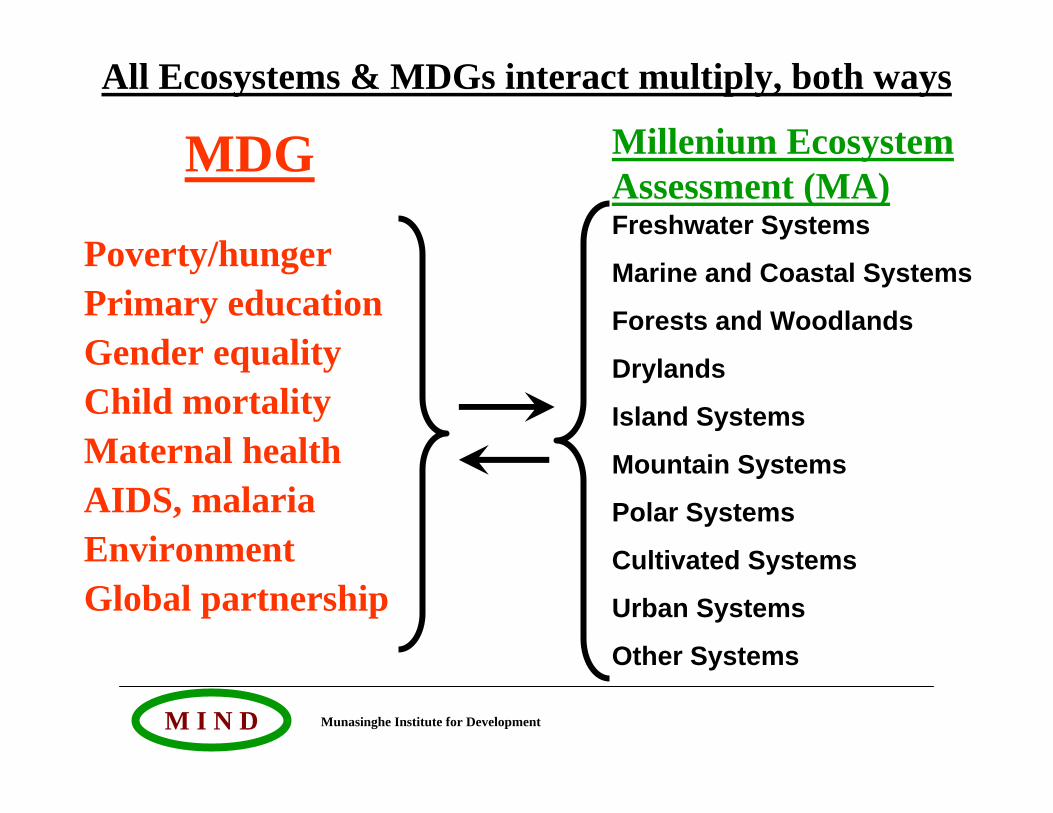
MDG
Poverty/hungerPrimary educationGender equalityChild mortalityMaternal healthAIDS, malariaEnvironmentGlobal partnership
Millenium Ecosystem Assessment (MA)
All Ecosystems & MDGs interact multiply, both ways
Freshwater Systems
Marine and Coastal Systems
Forests and Woodlands
Drylands
Island Systems
Mountain Systems
Polar Systems
Cultivated Systems
Urban Systems
Other Systems
Munasinghe Institute for DevelopmentM I N D
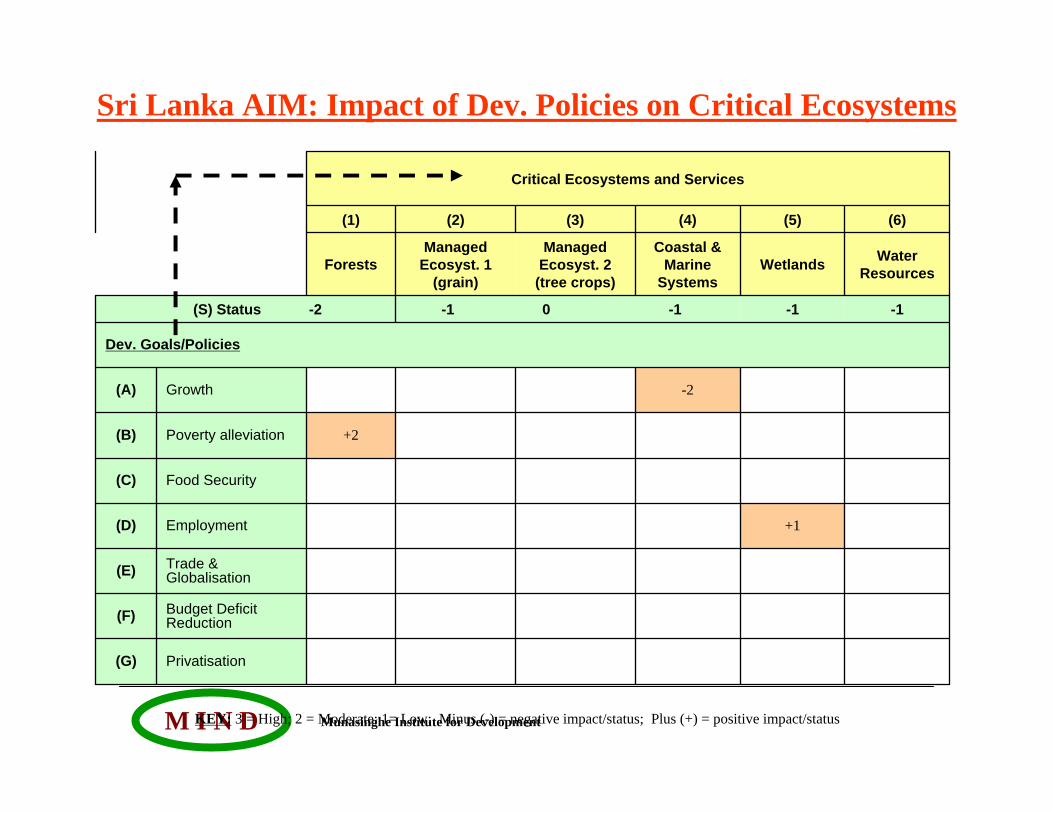
Privatisation(G)
Budget Deficit Reduction(F)
Trade & Globalisation(E)
+1Employment(D)
Food Security(C)
+2Poverty alleviation(B)
-2Growth(A)
Dev. Goals/Policies
-1-1-1 -1 0(S) Status -2
Water Resources Wetlands
Coastal & Marine
Systems
Managed Ecosyst. 2 (tree crops)
Managed Ecosyst. 1
(grain)Forests
(6)(5)(4)(3)(2)(1)
Critical Ecosystems and Services
KEY: 3 = High; 2 = Moderate; 1= Low; Minus (-) = negative impact/status; Plus (+) = positive impact/status
Sri Lanka AIM: Impact of Dev. Policies on Critical Ecosystems
Munasinghe Institute for DevelopmentM I N D
WHY ?
HOW ?
WHAT? are the practical solutions and policy options to be implemented that will integrate CC responses into SD strategy (from global to local levels)Many examples of good practice available; US has a key role to play
is climate a threat to future human development Climate Change (CC) undermines Sustainable Development (SD) and unfairly penalizes the poor
can we move forward to transform risky current trends into a safer and better futureStart making development more sustainable (MDMS) now, using the Sustainomics framework
Munasinghe Institute for DevelopmentM I N D
A Key Role for the US: Leadership in Making Development More Sustainable
The US has taken a back seat for too long! It must collaborate better with other nations in meeting the challenges of the 21st century !
Economic: technology, resources and skills
Social: commitment to social progress and peace
Environmental: respect for nature
Munasinghe Institute for DevelopmentM I N D
Optimistic Take Home MessageClimate change and sustainable development are interlinked problems posing a serious challenge to us all. Although the issues are complex and serious, both problems could be solved together, provided we begin now. We know enough already to take the first steps towards making development more sustainable, that will transform the risky “business-as-usual” scenario into a safer and more secure future.Governance and political systems worldwide must also ADAPT to CC ! We need to re-energise and re-organise to play a key role in the CC-SD transition - mobilising resources, framing the issues, identifying solutions, and implementing them.
Munasinghe Institute for DevelopmentM I N D
Ancient Pali Blessing - MDMS“DEVO VASSATU KALENASASSA SAMPATTI HETU CAPHITO BHAVATU LOKO CA
RAJA BHAVATU DHAMMIKO”
“May the rains come in time (environment)May the harvests be bountiful (economy)May the people be happy and contended
May the king be righteous (society)”
Even in ancient times, a favourable environment, economic prosperity, social stability, and good governance, were well recognised as key factors for making development more sustainable.
Munasinghe Institute for DevelopmentM I N D
Suggestions for Further Information1. Munasinghe, M. (2007) Making Development More
Sustainable: Sustainomics Framework and Practical Applications, MIND Press, Munasinghe Institute for Development, Colombo.
2. Munasinghe, M., and Swart, R. (2005) Primer on Climate Change and Sustainable Development, Cambridge University Press, UK. –translated into Chinese
3. MIND (2005) Action Impact Matrix (AIM) Application to Climate Change - Users Guide, Munasinghe Institute for Development, Colombo.
4. Website URL: <www.mindlanka.org>
Munasinghe Institute for DevelopmentM I N D
M I N D
Environment
Society Economy
Munasinghe Institute for Development"making development more sustainable - MDMS“
10/1 De Fonseka Place, Colombo 5, Sri LankaPhone: +9411-255-1208; Fax: +9411-255-1608
E-mail: <[email protected]> ; Web: <www.mindlanka.org>
An Introduction
Munasinghe Institute for DevelopmentM I N D
PROGRAMMES• Awards
Research fellowships, Scholarships, Sustainable Support Service (MS3), Book donations
• Research & TrainingTraining workshops/expert meetingsApplied research studies and evaluationsUN “Centre of Excellence” for Asia in the Climate Change Capacity Development (C3D) network of the United Nations Institute for Training and Research (UNITAR).
Munasinghe Institute for DevelopmentM I N D
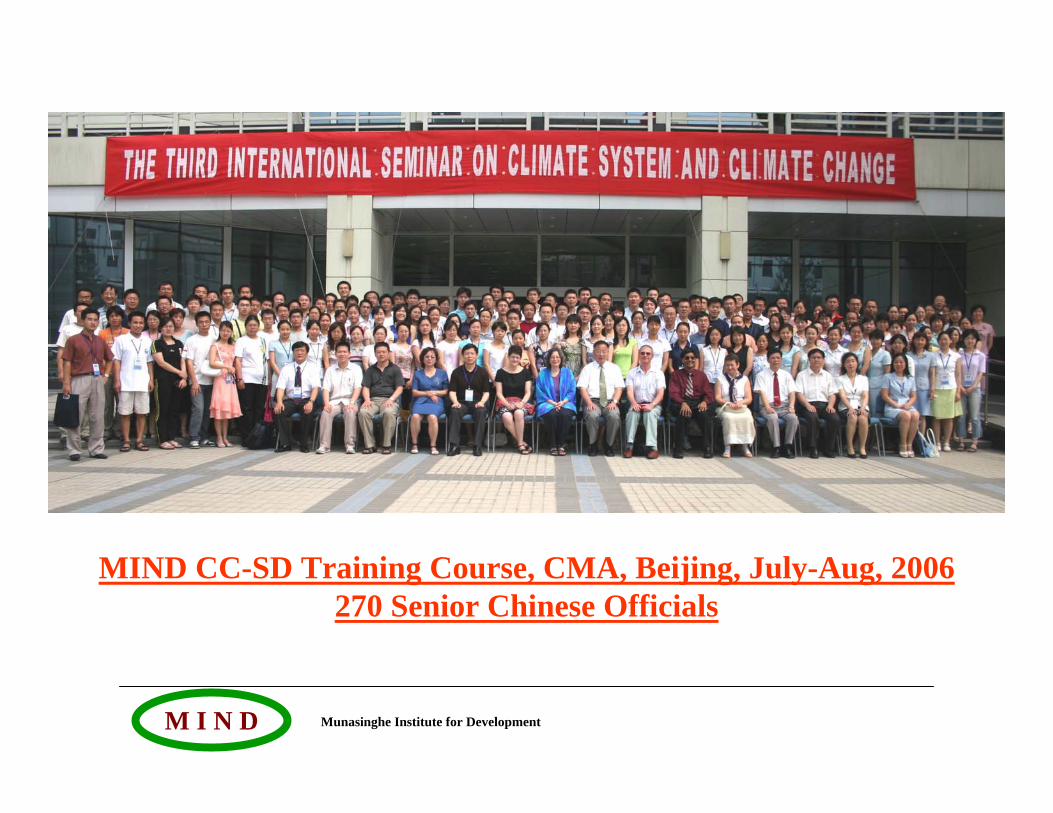
MIND CC-SD Training Course, CMA, Beijing, July-Aug, 2006 270 Senior Chinese Officials
Munasinghe Institute for DevelopmentM I N D
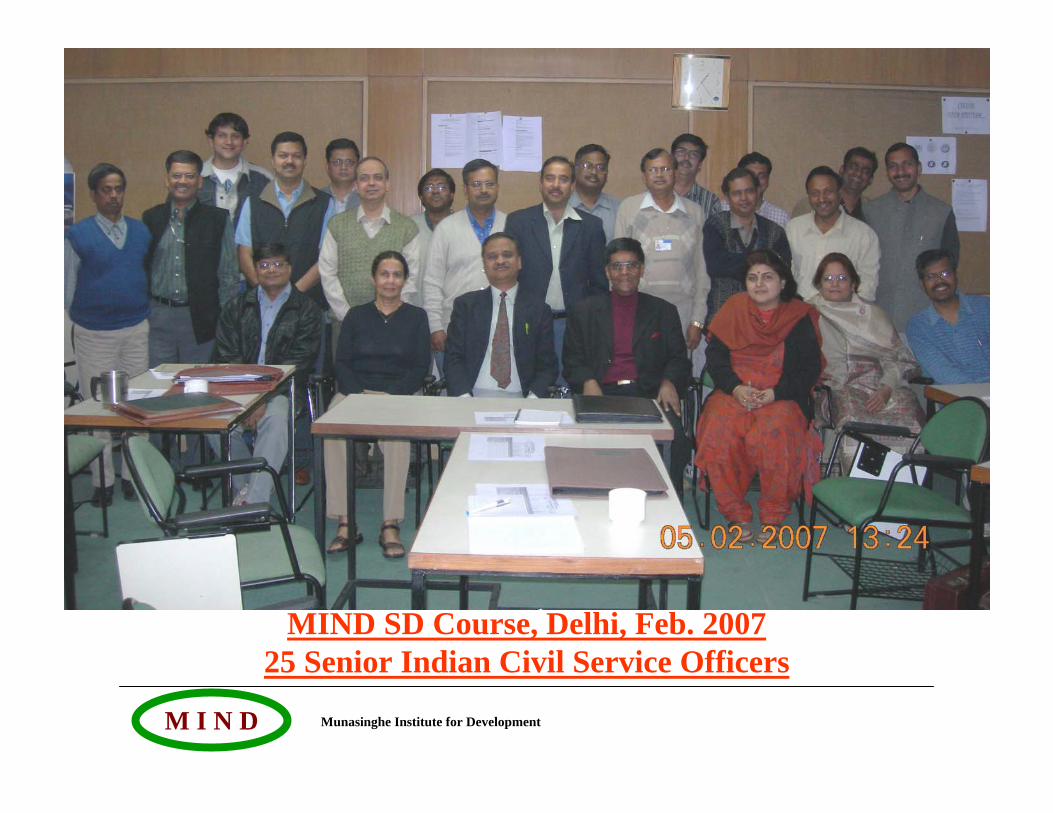
MIND SD Course, Delhi, Feb. 200725 Senior Indian Civil Service Officers
Munasinghe Institute for DevelopmentM I N D
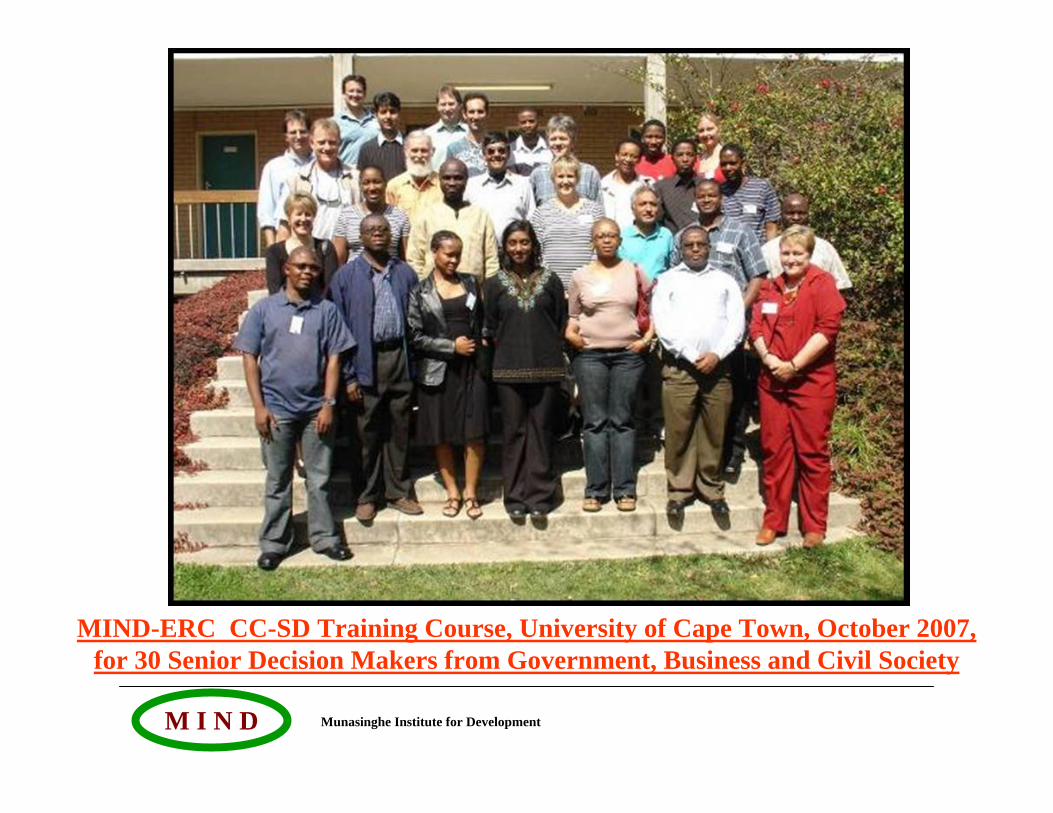
MIND-ERC CC-SD Training Course, University of Cape Town, October 2007, for 30 Senior Decision Makers from Government, Business and Civil Society
Munasinghe Institute for DevelopmentM I N D
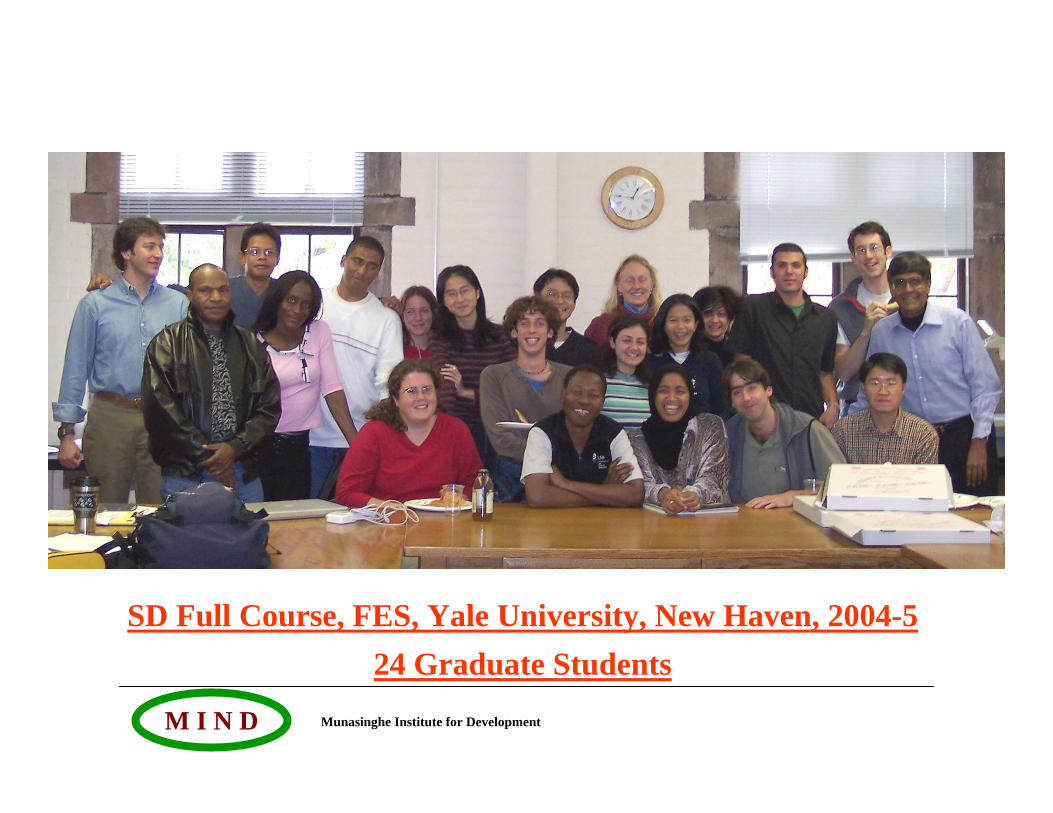
SD Full Course, FES, Yale University, New Haven, 2004-524 Graduate Students
Munasinghe Institute for DevelopmentM I N D
Thank You
Very Much