Embed Size (px)
Citation preview

Addressing disadvantage:What have we learned from the evaluation of
the DEIS Programme?
Presentation to the Clare Family Learning Project
May 28th 2014, Old Ground Hotel, Ennis
Educational Research CentreForas Taighde ar Oideachas
Susan WeirEducational Research Centre, Drumcondra
Overview• Brief history of attempts to deal with disadvantage• Defining disadvantage• What is DEIS?• Outline of the DEIS evaluation• Recent evaluation findings at primary level
Achievement outcomesPupil attitudesParental factorsFeedback from principals (Jan – March 2014)Urban/rural differences – achievements, attitudes, parent factors
• Recent evaluation findings at post-primary levelAchievement outcomes and retention levelsImplementation
• Future evaluation plans
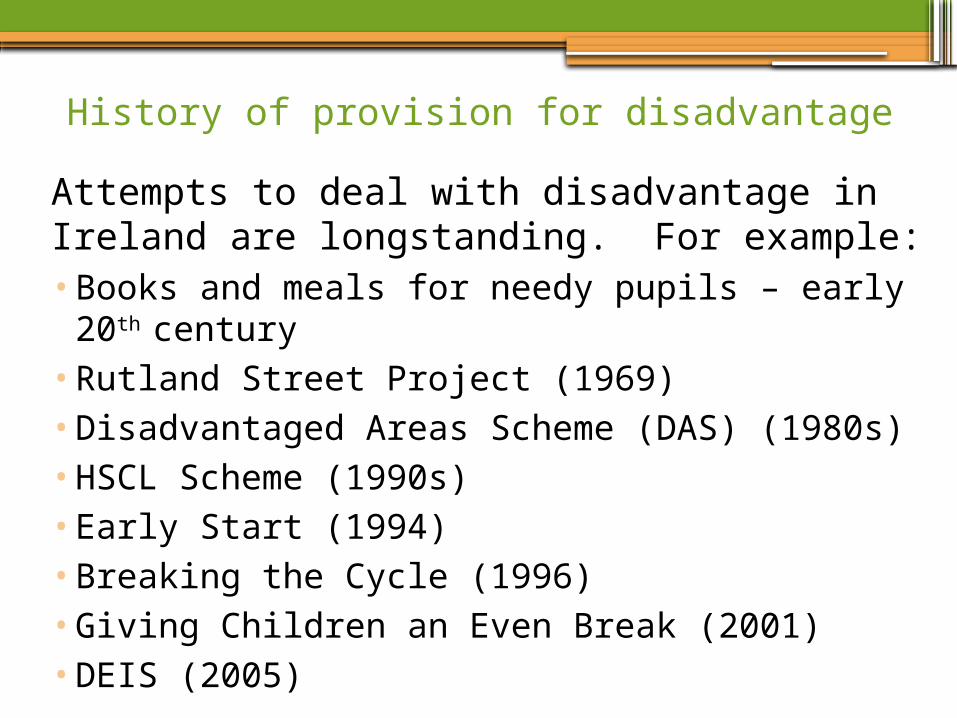
History of provision for disadvantage
Attempts to deal with disadvantage in Ireland are longstanding. For example:• Books and meals for needy pupils – early 20th century• Rutland Street Project (1969)• Disadvantaged Areas Scheme (DAS) (1980s)• HSCL Scheme (1990s)• Early Start (1994)• Breaking the Cycle (1996)• Giving Children an Even Break (2001)• DEIS (2005)
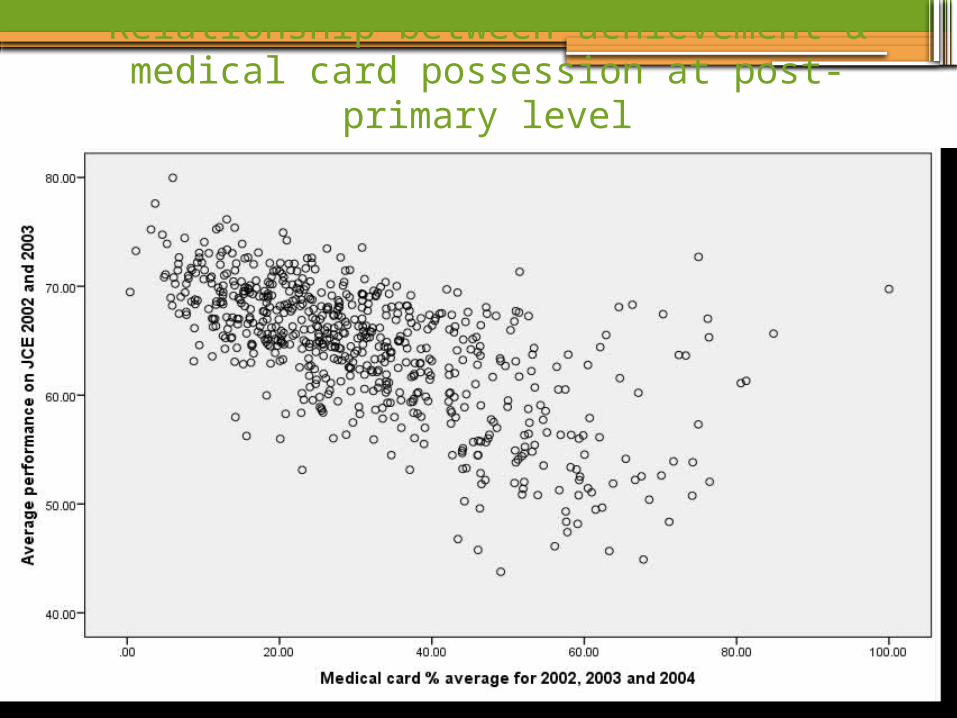
Relationship between achievement & medical card possession at post-primary level
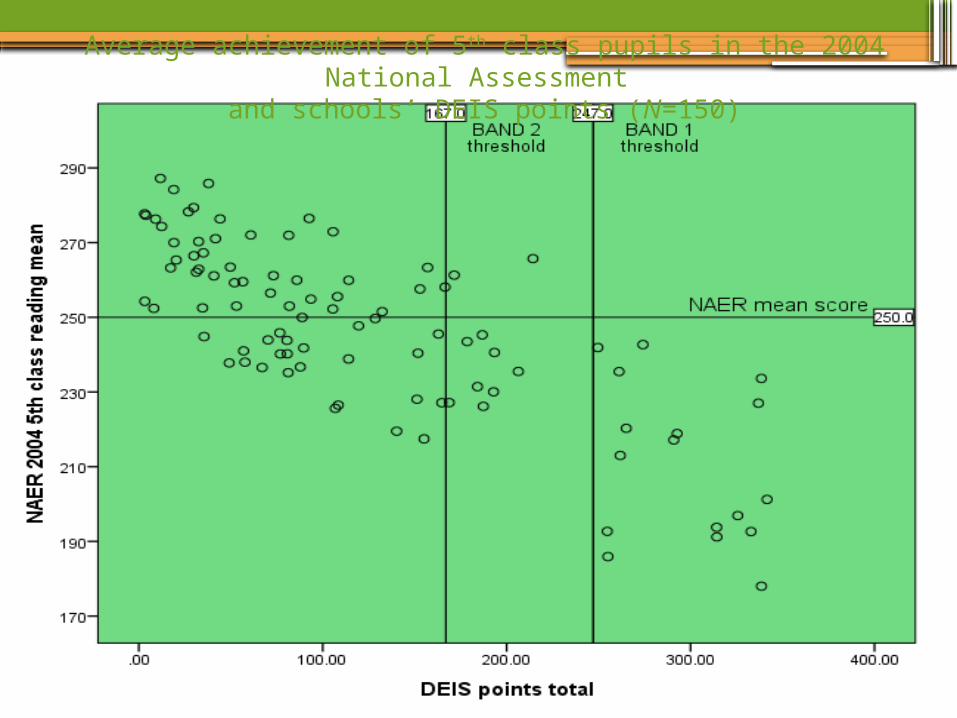
Average achievement of 5th class pupils in the 2004 National Assessment and schools’ DEIS points (N=150)
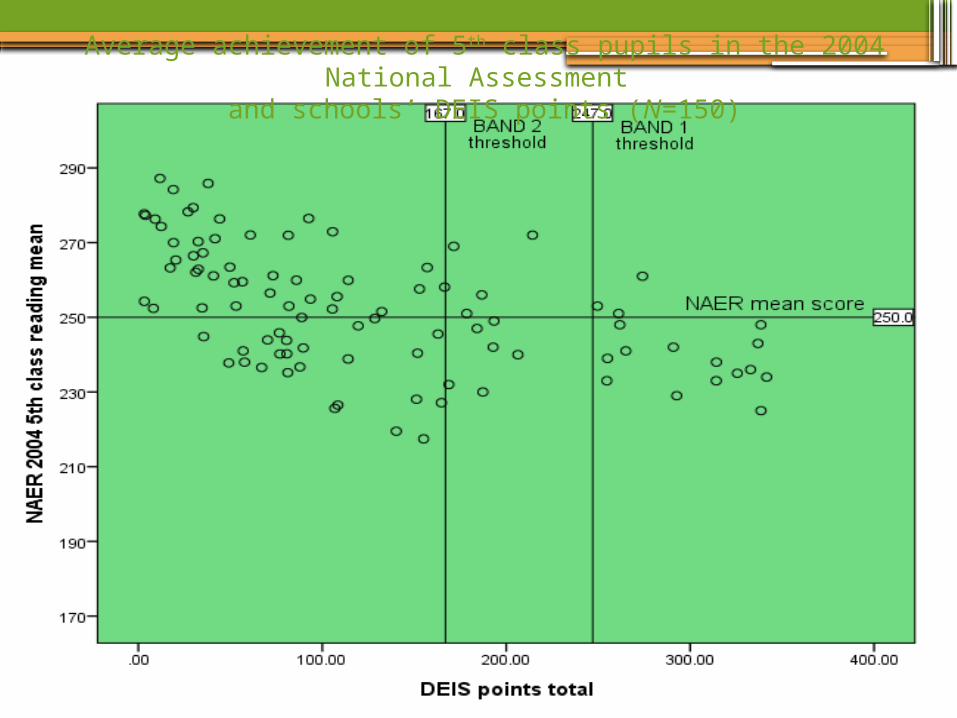
Average achievement of 5th class pupils in the 2004 National Assessment and schools’ DEIS points (N=150)
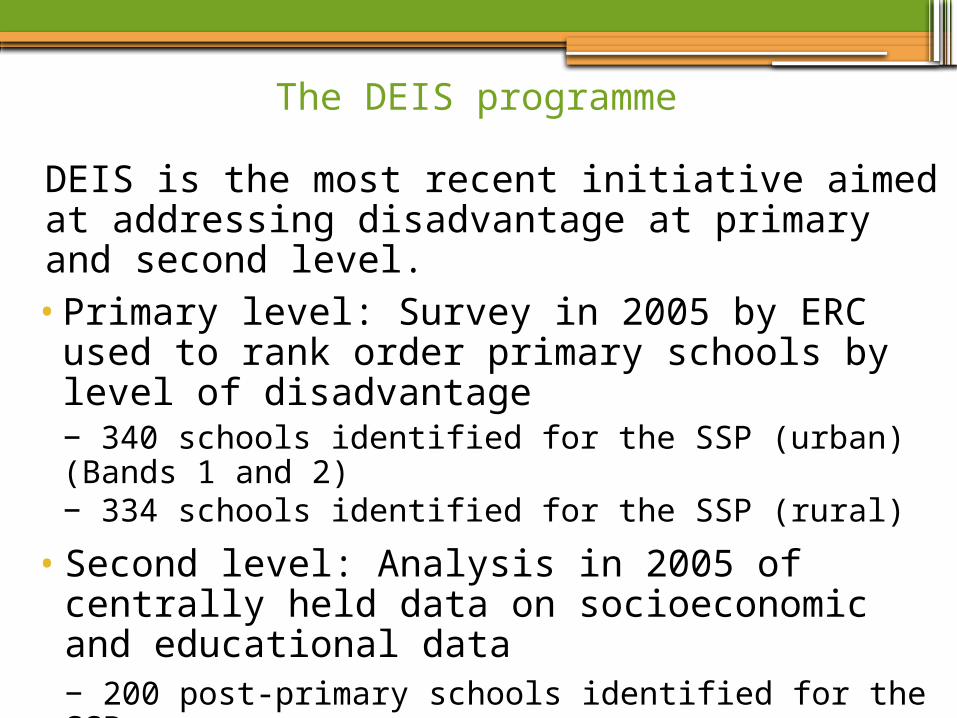
The DEIS programme
DEIS is the most recent initiative aimed at addressing disadvantage at primary and second level. •Primary level: Survey in 2005 by ERC used to rank
order primary schools by level of disadvantage− 340 schools identified for the SSP (urban) (Bands 1 and 2)− 334 schools identified for the SSP (rural)
•Second level: Analysis in 2005 of centrally held data on socioeconomic and educational data− 200 post-primary schools identified for the SSP
The issue of identification
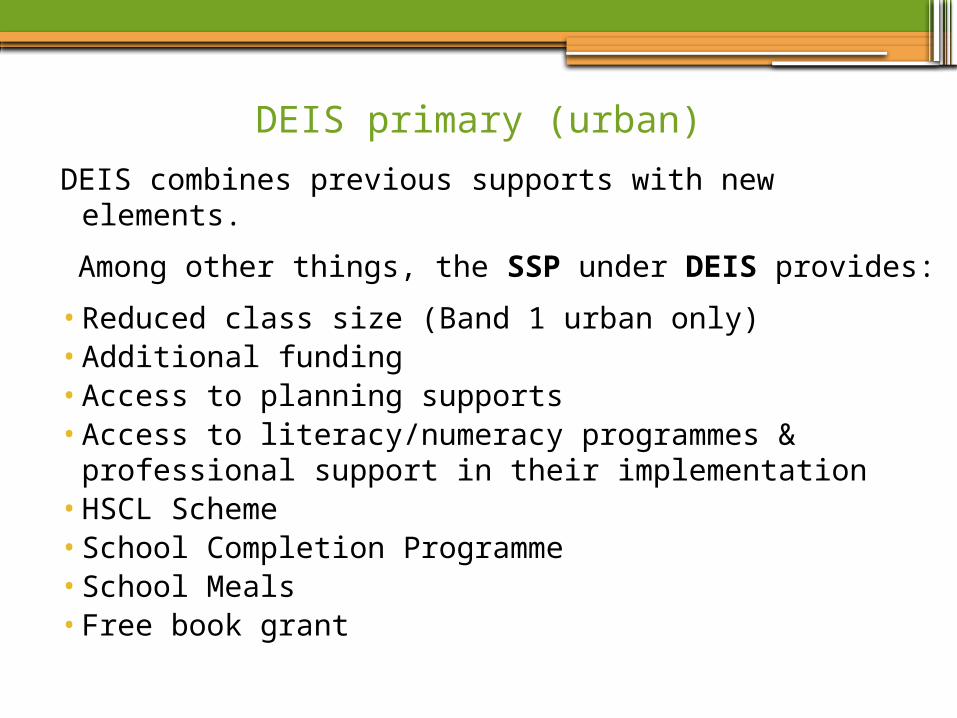
DEIS primary (urban)
DEIS combines previous supports with new elements.
Among other things, the SSP under DEIS provides:
•Reduced class size (Band 1 urban only)•Additional funding•Access to planning supports•Access to literacy/numeracy programmes & professional
support in their implementation•HSCL Scheme•School Completion Programme•School Meals • Free book grant
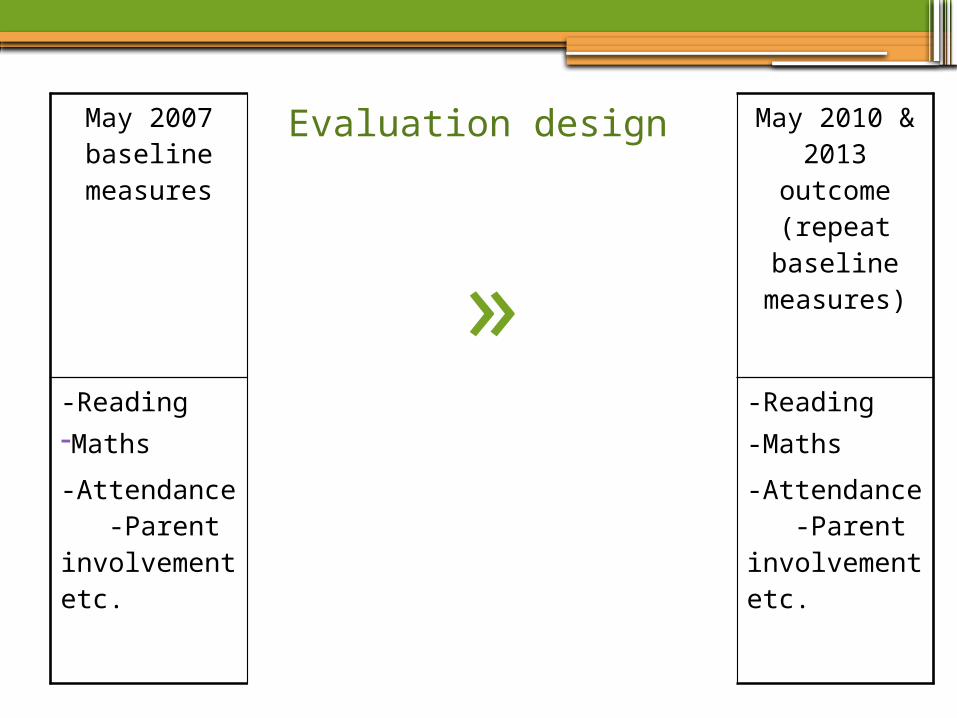
May 2007 baseline
measures
»
May 2010 & 2013
outcome (repeat baseline
measures)
-Reading-Maths
-Reading-Maths
-Attendance -Parent involvement etc.
-Attendance -Parent involvement etc.
Evaluation design
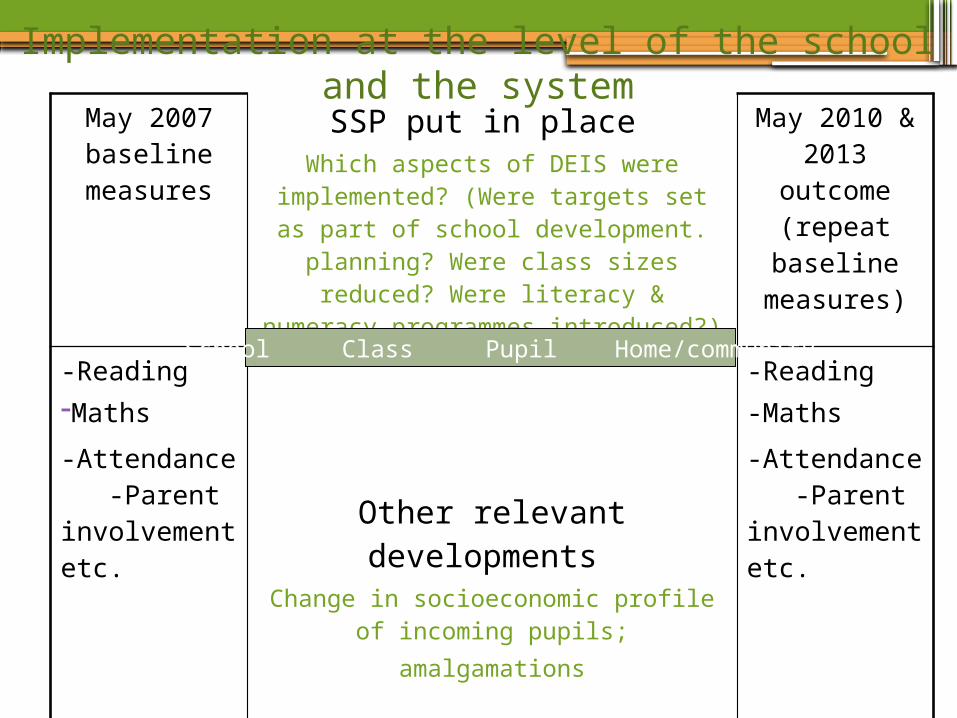
May 2007 baseline
measures
SSP put in place Which aspects of DEIS were
implemented? (Were targets set as part of school development. planning?
Were class sizes reduced? Were literacy & numeracy programmes
introduced?)
May 2010 & 2013
outcome (repeat baseline
measures)
-Reading-Maths
-Reading-Maths
-Attendance -Parent involvement etc.
Other relevant developments Change in socioeconomic profile of
incoming pupils;amalgamations
-Attendance -Parent involvement etc.
Implementation at the level of the school and the system
School Class Pupil Home/community
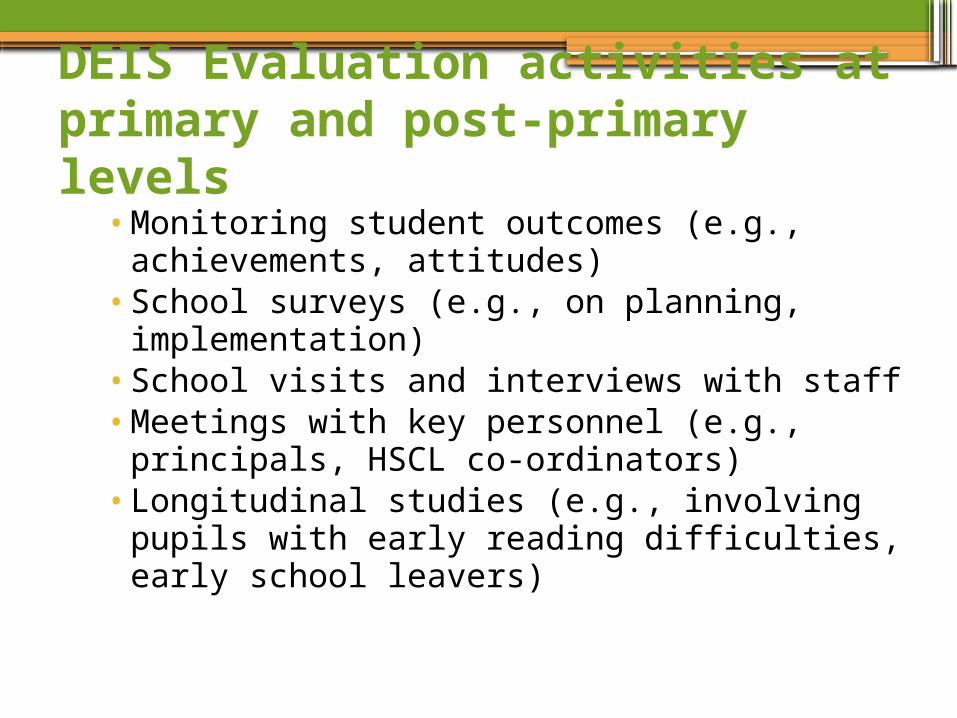
•Monitoring student outcomes (e.g., achievements, attitudes)
•School surveys (e.g., on planning, implementation)
•School visits and interviews with staff •Meetings with key personnel (e.g., principals,
HSCL co-ordinators)•Longitudinal studies (e.g., involving pupils with
early reading difficulties, early school leavers)
DEIS Evaluation activities at primary and post-primary levels
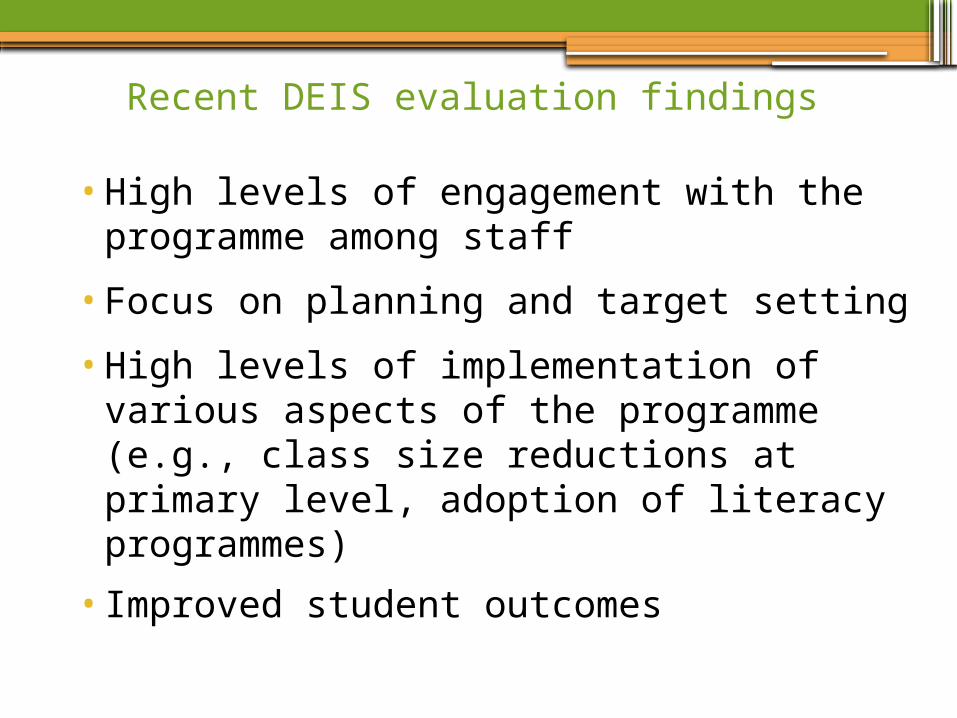
Recent DEIS evaluation findings
•High levels of engagement with the programme among staff
•Focus on planning and target setting
•High levels of implementation of various aspects of the programme (e.g., class size reductions at primary level, adoption of literacy programmes)
• Improved student outcomes

Primary level: Reading Standard Scores
2007 2010 201385.0
90.0
95.0
100.0
105.0
Reading Standard Score
2nd class
3rd class
6th class
norm
Baseline Follow-up 1 Follow-up 2
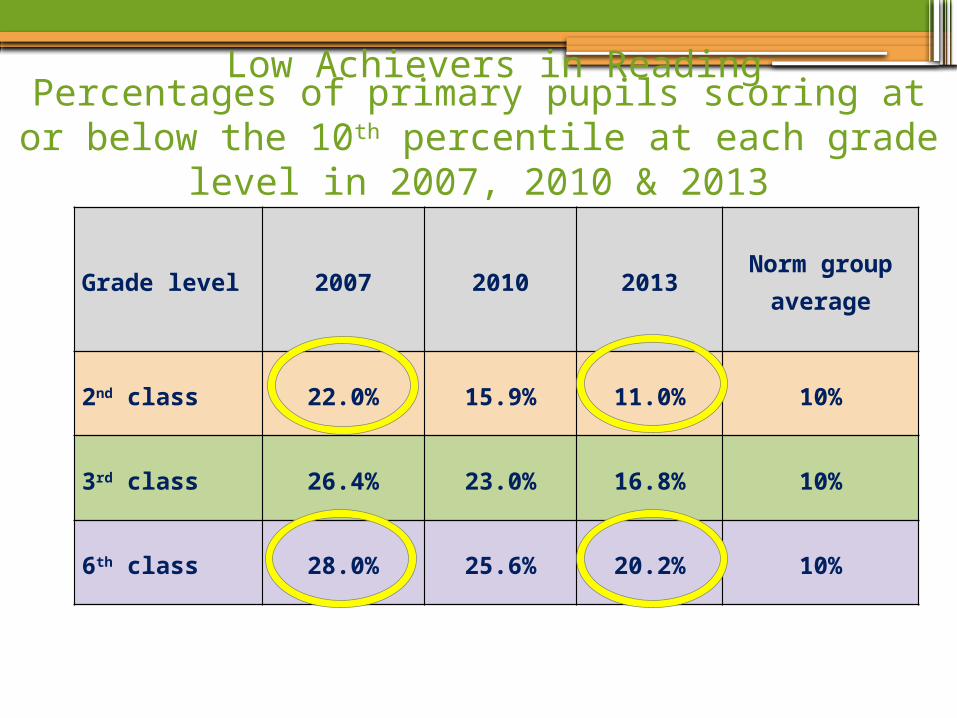
Low Achievers in ReadingPercentages of primary pupils scoring at or below the
10th percentile at each grade level in 2007, 2010 & 2013
Grade level 2007 2010 2013Norm group
average
2nd class 22.0% 15.9% 11.0% 10%
3rd class 26.4% 23.0% 16.8% 10%
6th class 28.0% 25.6% 20.2% 10%
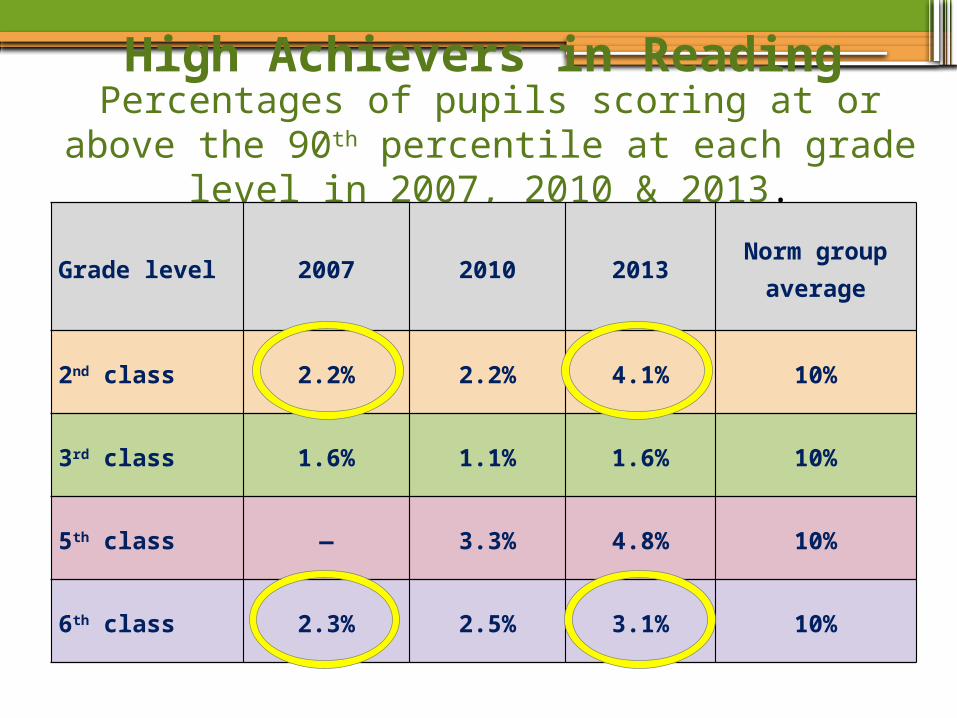
High Achievers in ReadingPercentages of pupils scoring at or above the 90th
percentile at each grade level in 2007, 2010 & 2013.
Grade level 2007 2010 2013Norm group
average
2nd class 2.2% 2.2% 4.1% 10%
3rd class 1.6% 1.1% 1.6% 10%
5th class — 3.3% 4.8% 10%
6th class 2.3% 2.5% 3.1% 10%
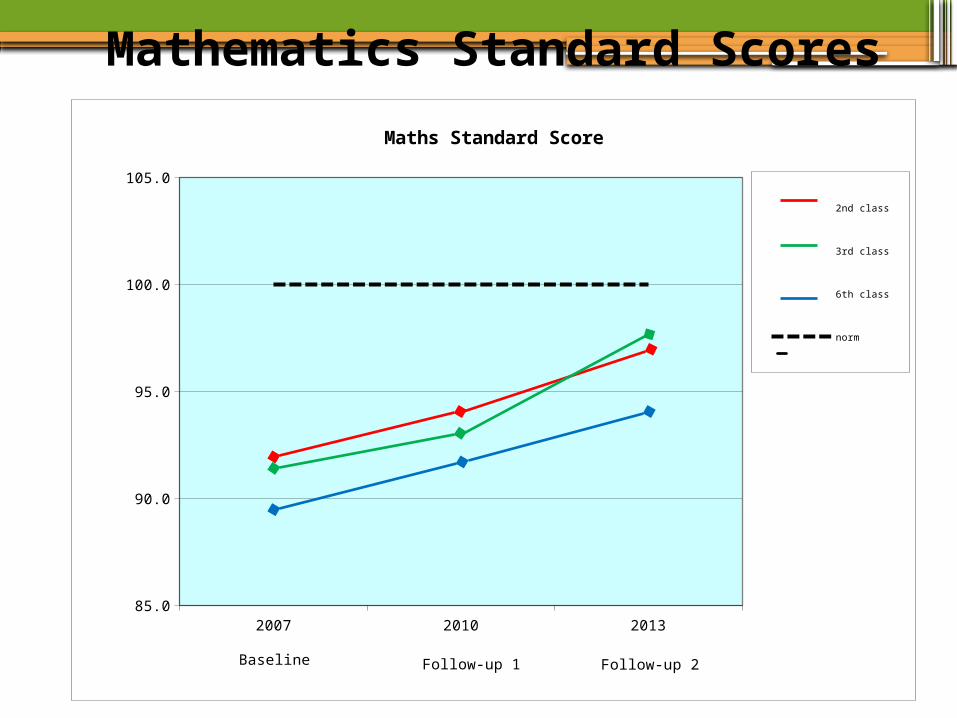
Mathematics Standard Scores
2007 2010 201385.0
90.0
95.0
100.0
105.0
Maths Standard Score
2nd class
3rd class
6th class
norm
Baseline Follow-up 1 Follow-up 2
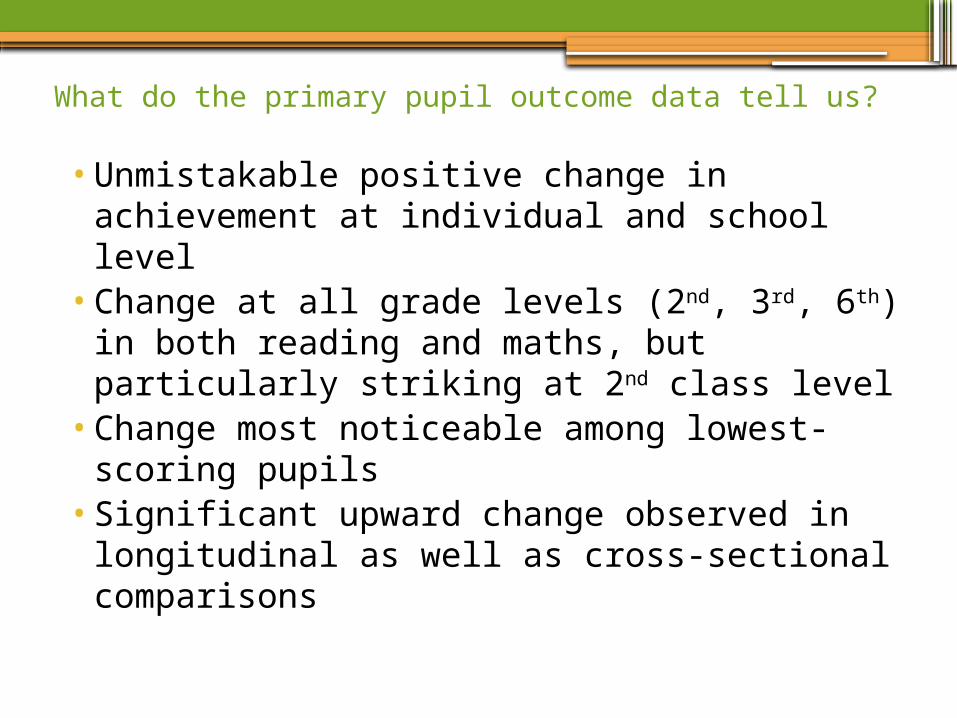
What do the primary pupil outcome data tell us?
• Unmistakable positive change in achievement at individual and school level
• Change at all grade levels (2nd, 3rd, 6th) in both reading and maths, but particularly striking at 2nd class level
• Change most noticeable among lowest-scoring pupils
• Significant upward change observed in longitudinal as well as cross-sectional comparisons
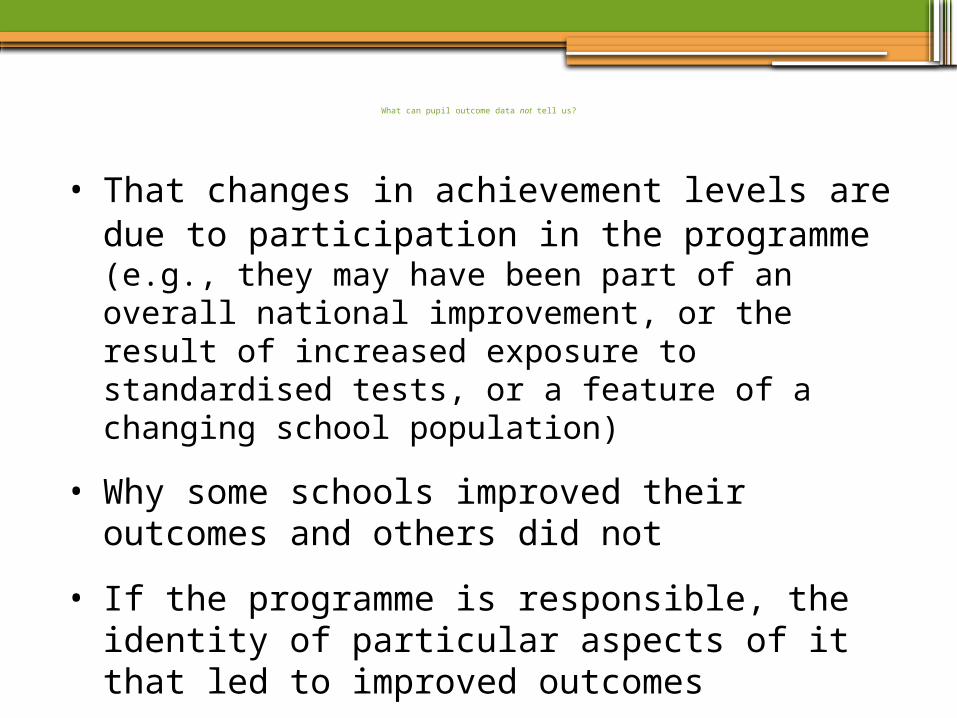
What can pupil outcome data not tell us?
• That changes in achievement levels are due to participation in the programme (e.g., they may have been part of an overall national improvement, or the result of increased exposure to standardised tests, or a feature of a changing school population)
• Why some schools improved their outcomes and others did not
• If the programme is responsible, the identity of particular aspects of it that led to improved outcomes

However….
•No evidence of overall improvements nationally
• Improvements in DEIS have occurred in a context of high implementation levels (e.g., class size targets have mostly
been met, literacy and numeracy programmes have been introduced)
• Evidence that schools have embraced various aspects of the programme (especially planning)
• Other changes consistent with effects of programme (e.g., significantly improved pupil attendance)
• Measures under DEIS exceed what was available under previous schemes and better reflect what has been identified as important in addressing disadvantage

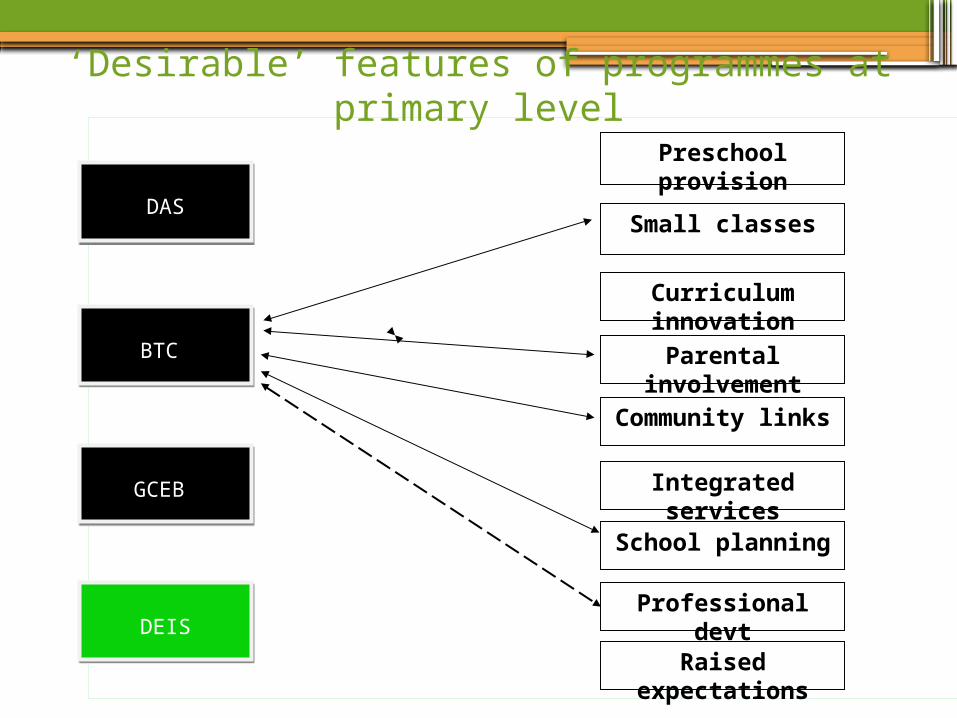
Preschool provision
DASDAS
BTC BTC
GCEB GCEB
DEISDEIS
Small classes
Curriculum innovation
Parental involvement
Community links
Integrated services
School planning
Professional devt
Raised expectations
‘Desirable’ features of programmes at primary level
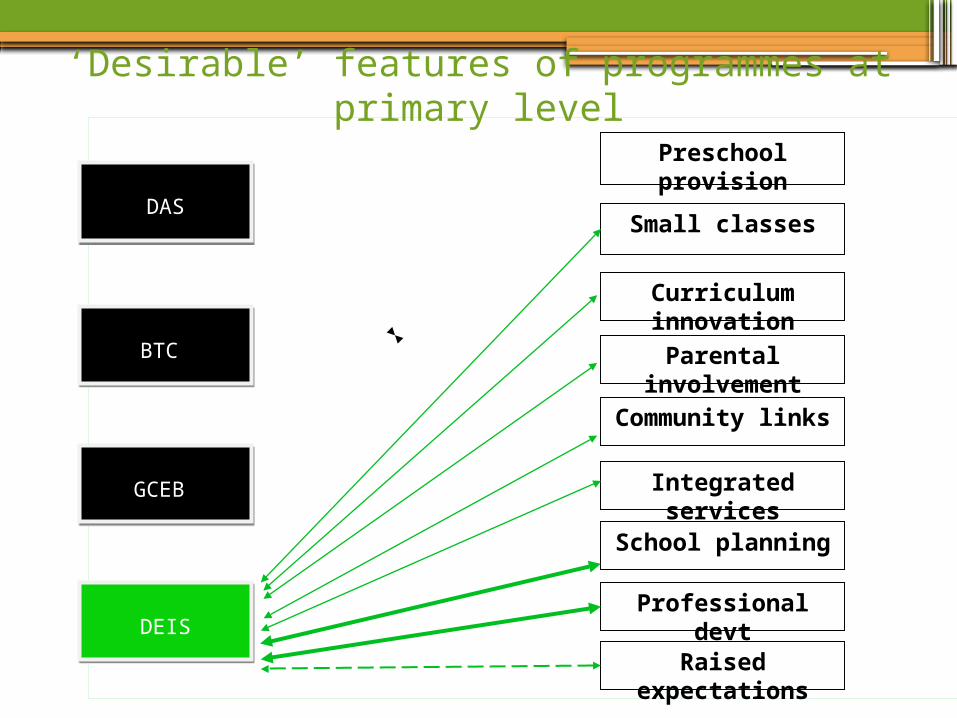
Preschool provision
DASDAS
BTC BTC
GCEB GCEB
DEISDEIS
Small classes
Curriculum innovation
Parental involvement
Community links
Integrated services
School planning
Professional devt
Raised expectations
‘Desirable’ features of programmes at primary level

Preschool provision
DASDAS
BTC BTC
GCEB GCEB
DEISDEIS
Small classes
Curriculum innovation
Parental involvement
Community links
Integrated services
School planning
Professional devt
Raised expectations
‘Desirable’ features of programmes at primary level
Preschool provision
DASDAS
BTC BTC
GCEB GCEB
DEISDEIS
Small classes
Curriculum innovation
Parental involvement
Community links
Integrated services
School planning
Professional devt
Raised expectations
‘Desirable’ features of programmes at primary level
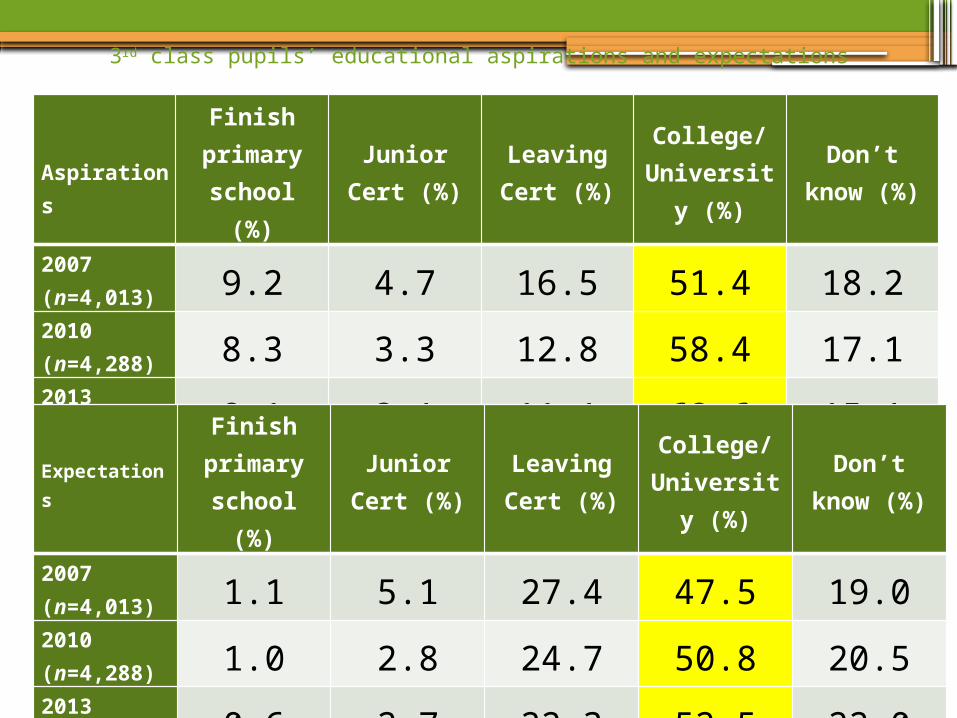
3rd class pupils’ educational aspirations and expectations
Aspirations
Finish primary
school (%)
Junior Cert (%)
Leaving Cert (%)
College/University
(%)
Don’t know (%)
2007 (n=4,013) 9.2 4.7 16.5 51.4 18.22010 (n=4,288) 8.3 3.3 12.8 58.4 17.12013 (n=4,283) 8.1 3.1 11.1 62.6 15.1
Expectations
Finish primary
school (%)
Junior Cert (%)
Leaving Cert (%)
College/University
(%)
Don’t know (%)
2007 (n=4,013) 1.1 5.1 27.4 47.5 19.02010 (n=4,288) 1.0 2.8 24.7 50.8 20.52013 (n=4,283) 0.6 2.7 22.3 52.5 22.0

Pupils in 3rd & 6th class indicating how much they like school
6th Like a lot (%)
Like (%) Dislike (%)Dislike a lot
(%)
2007 (n=3,905) 9.5 53.7 21.7 15.1
2010 (n=4,132) 10.6 55.2 20.7 13.6
2013 (n=4,171) 11.6 58.2 19.7 10.5
3rd Like a lot (%)
Like (%) Dislike (%)Dislike a lot
(%)
2007 (n=4,032) 29.1 40.4 10.5 20.0
2010 (n=4,300) 27.8 41.1 11.6 19.5
2013 (n=4,305) 33.2 42.0 11.0 13.8
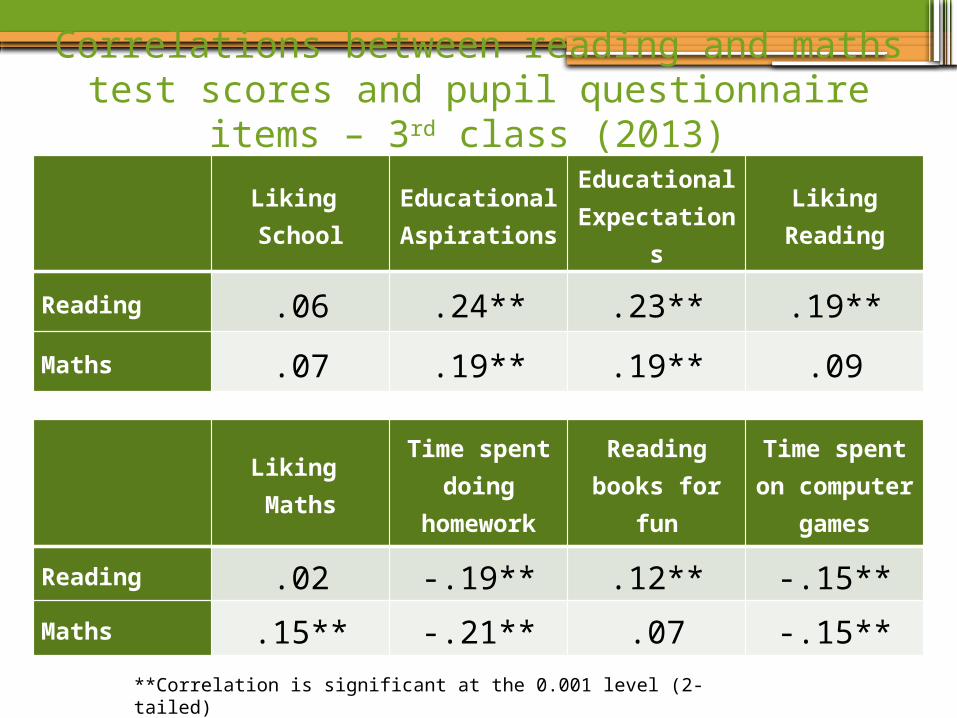
Correlations between reading and maths test scores and pupil questionnaire items – 3rd class (2013)
Liking School
Educational Aspirations
Educational Expectations
Liking Reading
Reading .06 .24** .23** .19**
Maths .07 .19** .19** .09
Liking Maths
Time spent doing
homework
Reading books for fun
Time spent on computer
games
Reading .02 -.19** .12** -.15**
Maths .15** -.21** .07 -.15**
**Correlation is significant at the 0.001 level (2-tailed)

Attitudes to school and schoolwork by gender - 3rd class (2013)
Item Girls BoysLiking school +
Educational aspirations +
Educational expectations +
Proud of school work +
Liking reading +
Liking maths +
Maths (self-evaluation) +
English reading (self-evaluation) No difference
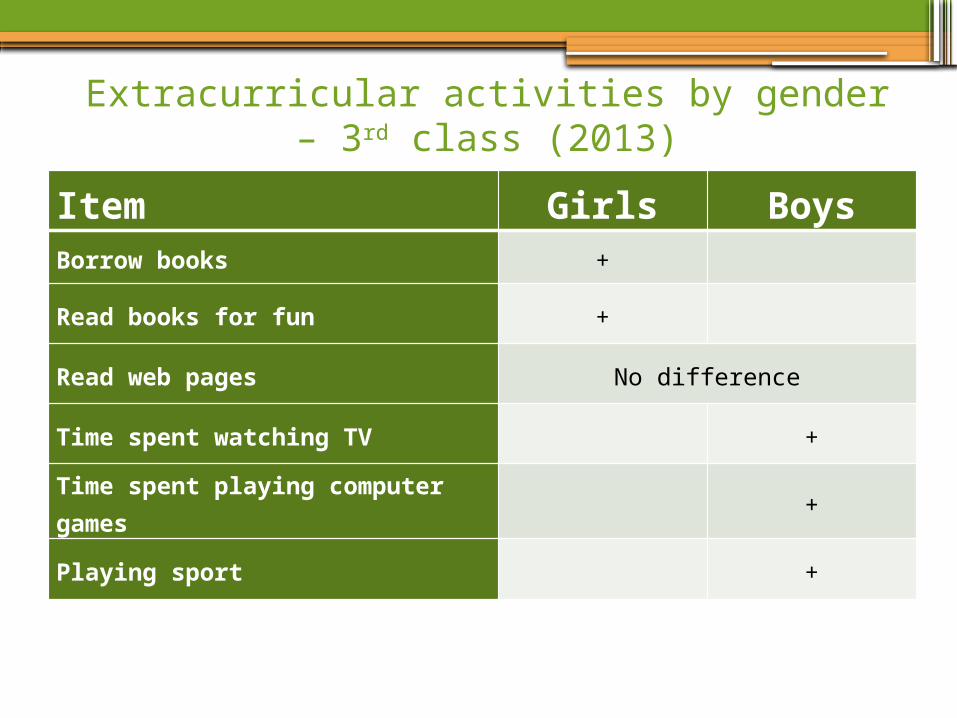
Extracurricular activities by gender – 3rd class (2013)
Item Girls BoysBorrow books +
Read books for fun +
Read web pages No difference
Time spent watching TV +
Time spent playing computer games +
Playing sport +

3rd class parents’ reading of books, and number of books in the home
Reading books
Most days or every day
(%)
A few times a week
(%)
A few times a month
(%)
Hardly ever or never
(%)
2007 (n=2676) 30.5 22.2 28.7 18.6
2013 (n=3034) 30.7 23.9 29.3 16.1
Number of
books
None
(%)
Between 1 & 10
(%)
Between 11 & 50
(%)
Between 51 & 100
(%)
Between 101 & 250
(%)
More than 250
(%)
2007 (n=3016) 2.5 20.4 35.9 19.8 12.3 9.2
2013 (n=3208) 1.4 18.6 35.2 22.7 14.3 7.9

Feedback from School PrincipalsJanuary-March 2014
Recent Bulletin Report• focused heavily on achievement outcomes• included only a sample (n=120) of schools• did not discuss factors behind changes
Mar 2014: Series of 9 nationwide seminars held• Athlone, Cork, Dublin (x4), Limerick, Sligo, & Wexford • 49% (n=163) of all primary urban DEIS principals
attended
Jan-Feb 2014: Questionnaire circulated to principals of all urban schools in the SSP
• 65% (n=220) returned
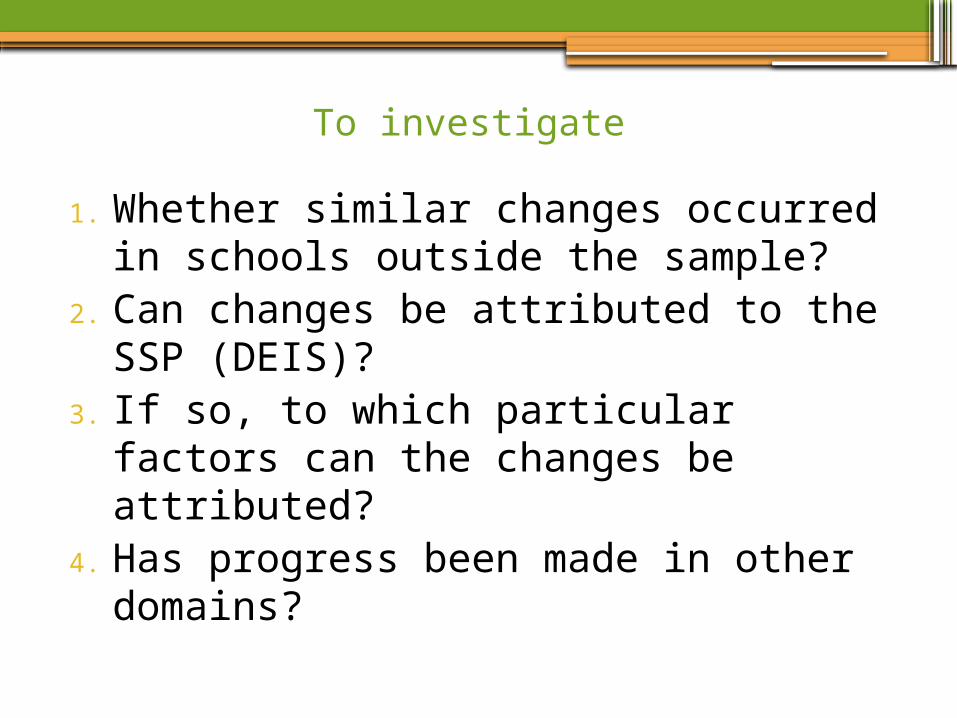
To investigate
1. Whether similar changes occurred in schools outside the sample?
2. Can changes be attributed to the SSP (DEIS)?
3. If so, to which particular factors can the changes be attributed?
4. Has progress been made in other domains?
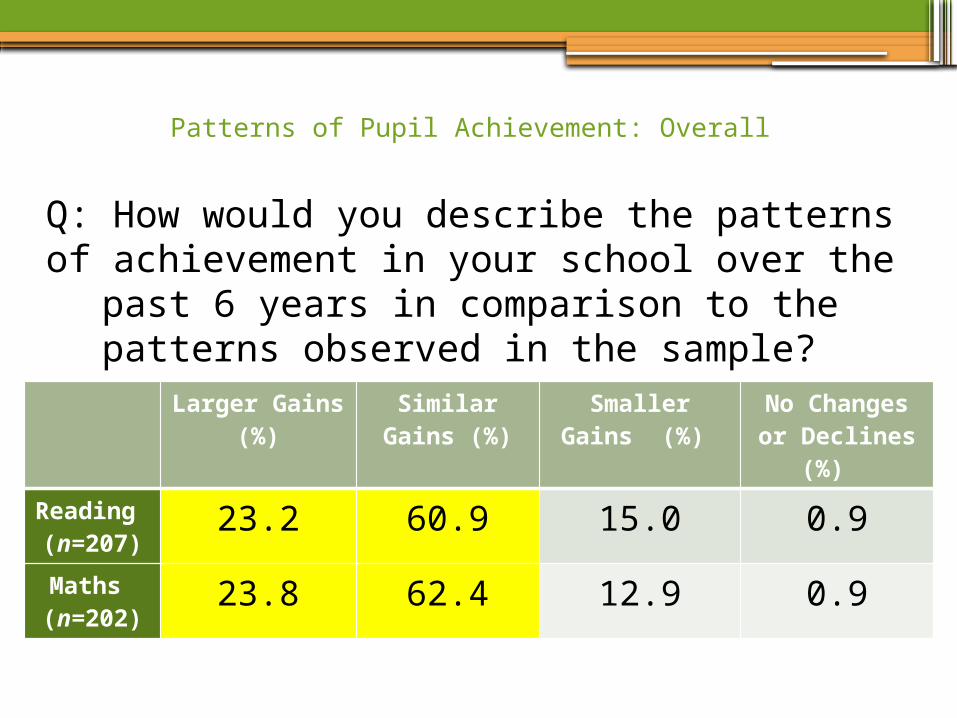
Patterns of Pupil Achievement: Overall
Larger Gains (%)
Similar Gains (%)
Smaller Gains (%)
No Changes or Declines (%)
Reading (n=207)
23.2 60.9 15.0 0.9
Maths (n=202)
23.8 62.4 12.9 0.9
Q: How would you describe the patterns of achievement in your school over the past 6 years in comparison to the patterns observed in the sample?
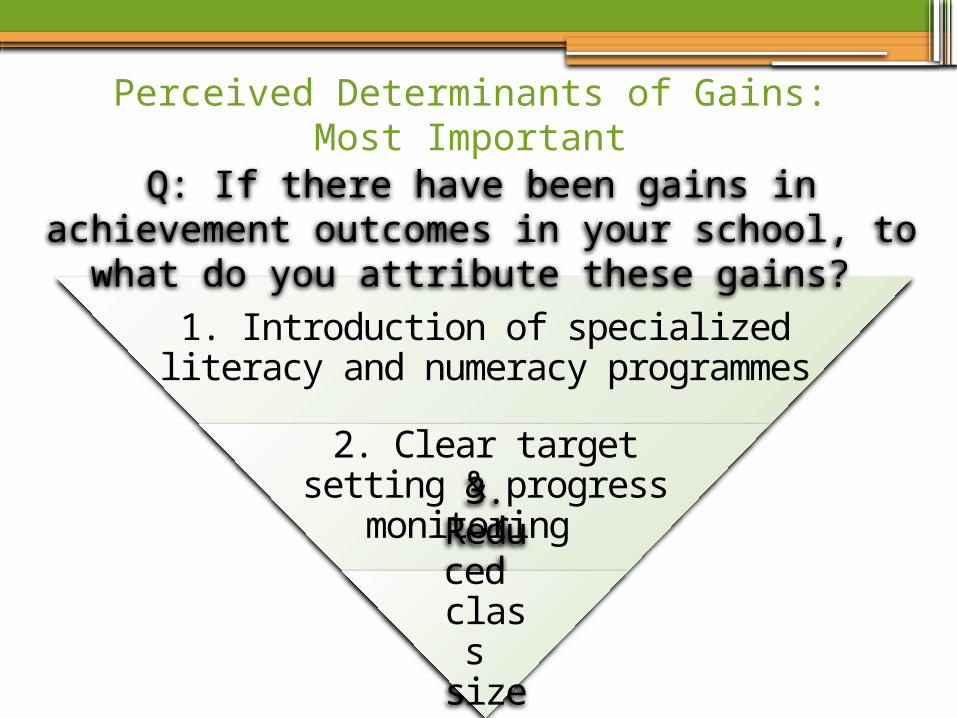
Perceived Determinants of Gains: Most Important
1. Introduction of specialized literacy and numeracy
programmes
2. Clear target setting & progress monitoring
3. Reduced class sizes
Q: If there have been gains in achievement outcomes in your school, to what do you attribute these gains?

Any changes in home support ?
▫Pleasant school environment provided by SSP can combat negative attitudes of some parents towards the education system
But…
▫Resources provide an excuse for some to ‘abdicate responsibility’
▫Greater focus on improving parenting skills & tackling mental health issues needed
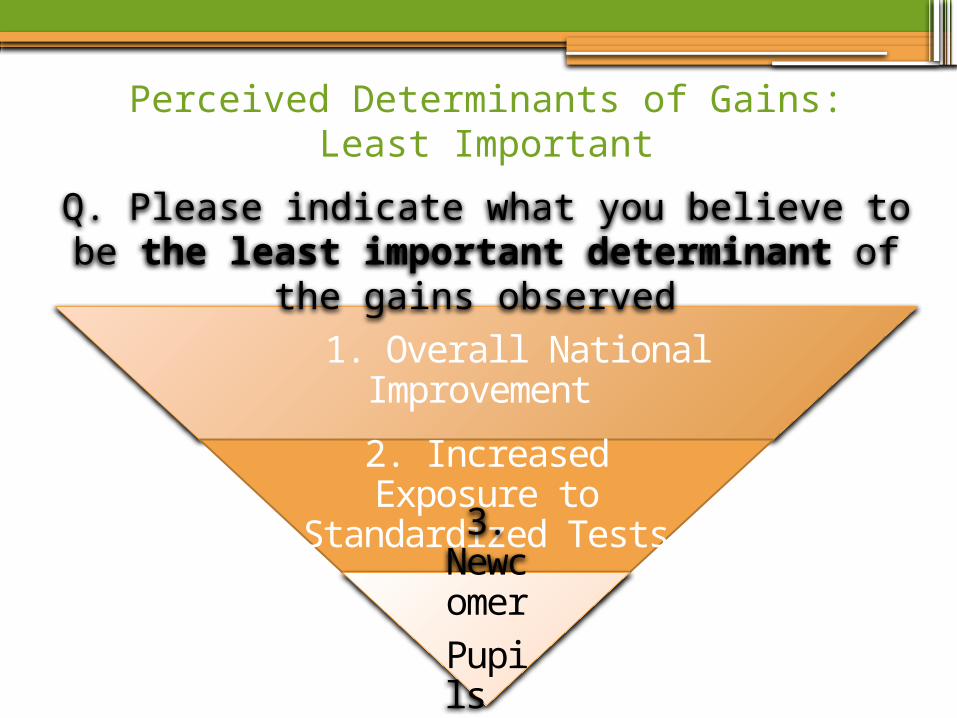
Perceived Determinants of Gains: Least Important
1. Overall National Improvement
2. Increased Exposure to Standardized Tests
3. Newcomer
Pupils
Q. Please indicate what you believe to be the least important determinant of the gains observed

Beyond Achievement Gains
Improved(%)
No Change(%)
Disimproved(%)
Attendance (n = 212) 89.6 8.5 1.9Attitudes (n = 214) 91.1 8.4 0.5Behaviour (n = 214) 78.0 18.2 3.7Aspirations (n = 211) 74.9 23.7 1.4Engagement (n = 212) 90.6 8.5 0.9
Q: How would you describe patterns in relation to attendance, attitudes towards school,
behaviour during class, educational aspirations & engagement with school over the last 6 years?
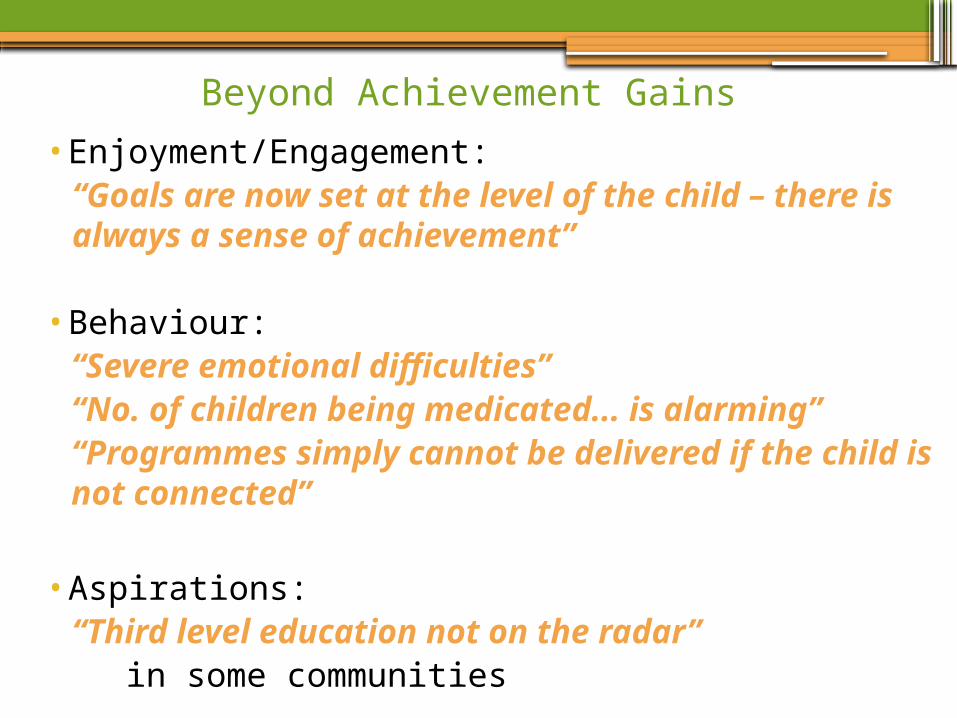
Beyond Achievement Gains
•Enjoyment/Engagement:“Goals are now set at the level of the child – there is always a sense of achievement”
•Behaviour: “Severe emotional difficulties”“No. of children being medicated... is alarming”“Programmes simply cannot be delivered if the child is not connected”
•Aspirations: “Third level education not on the radar” in some communities
Summary
•Similar results in schools outside sample
•Perceived determinants of change: ▫are related to the SSP ▫seem to be interdependent
• Improvements seen in diverse areas
•Progress to date highly valued
•Optimism for the future, but considerable concern about diminishing resources evident
Rural disadvantage
•Almost 2,000 of the 3,145 (65%) of schools nationwide are in rural areas
• Following a review of the DAS, rural schools began to be catered for by programmes (only 2.5% of rural schools had been in the DAS)
•Breaking the Cycle rural was the first scheme to address rural disadvantage, followed by GCEB, and most recently DEIS
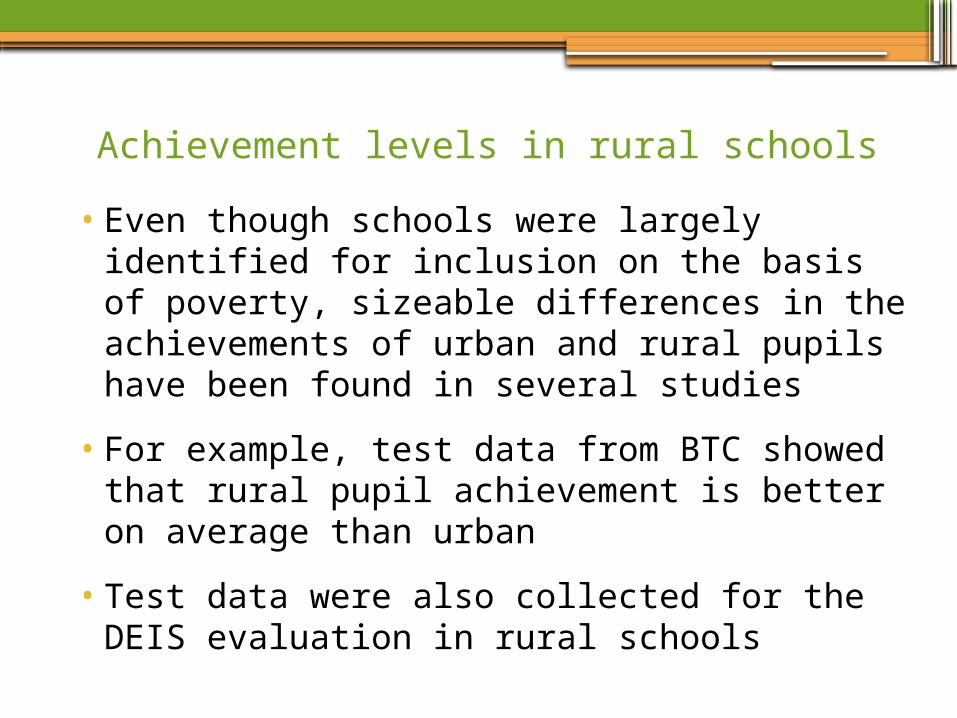
Achievement levels in rural schools
•Even though schools were largely identified for inclusion on the basis of poverty, sizeable differences in the achievements of urban and rural pupils have been found in several studies
• For example, test data from BTC showed that rural pupil achievement is better on average than urban
• Test data were also collected for the DEIS evaluation in rural schools
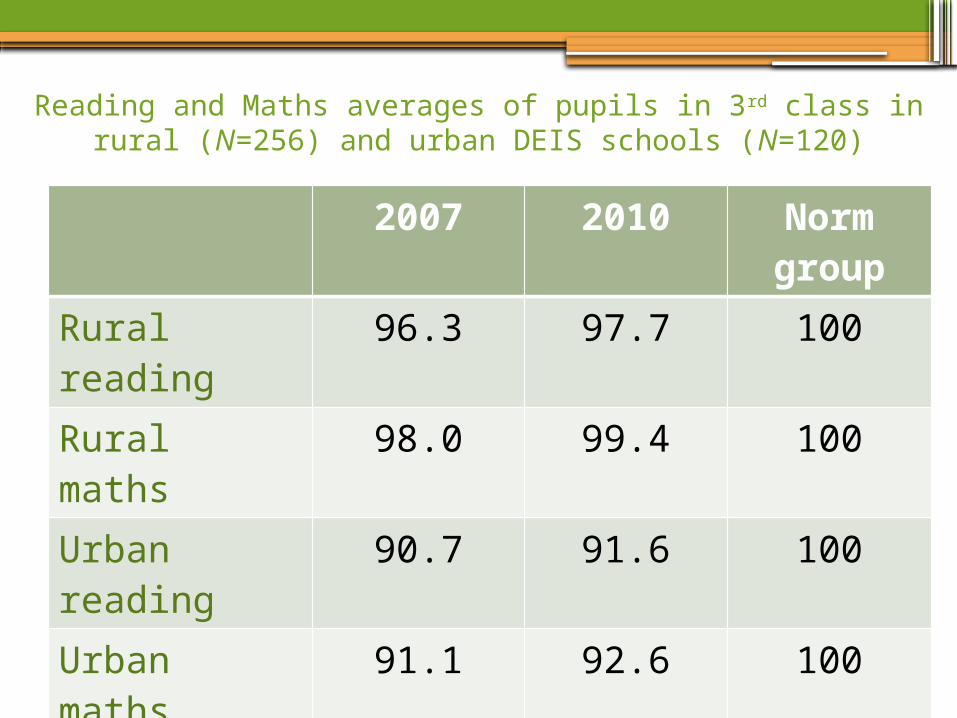
Reading and Maths averages of pupils in 3rd class in rural (N=256) and urban DEIS schools (N=120)
2007 2010 Norm group
Rural reading 96.3 97.7 100
Rural maths 98.0 99.4 100
Urban reading 90.7 91.6 100
Urban maths 91.1 92.6 100
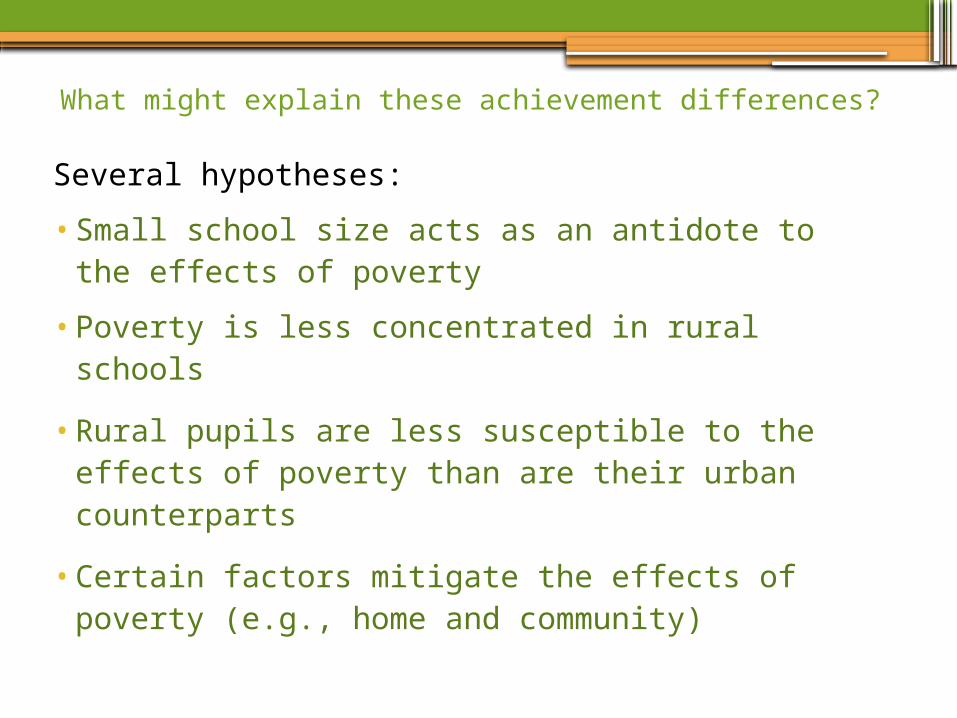
What might explain these achievement differences?
Several hypotheses:
•Small school size acts as an antidote to the effects of poverty
•Poverty is less concentrated in rural schools
•Rural pupils are less susceptible to the effects of poverty than are their urban counterparts
•Certain factors mitigate the effects of poverty (e.g., home and community)
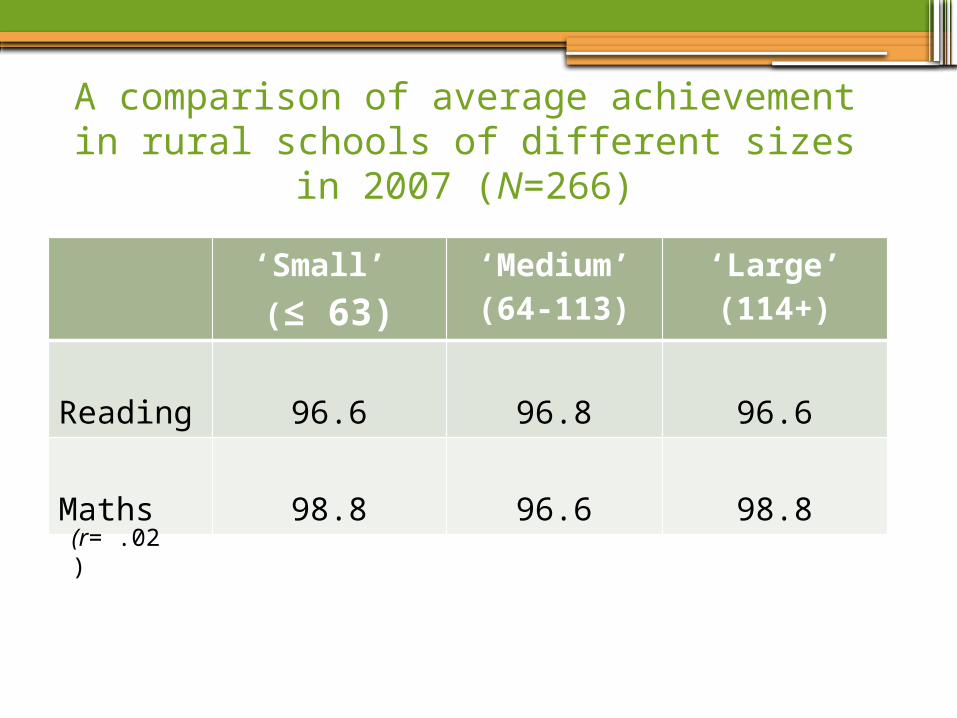
A comparison of average achievement in rural schools of different sizes in 2007 (N=266)
‘Small’ (≤ 63)
‘Medium’(64-113)
‘Large’(114+)
Reading 96.6 96.8 96.6
Maths 98.8 96.6 98.8
(r= .02)
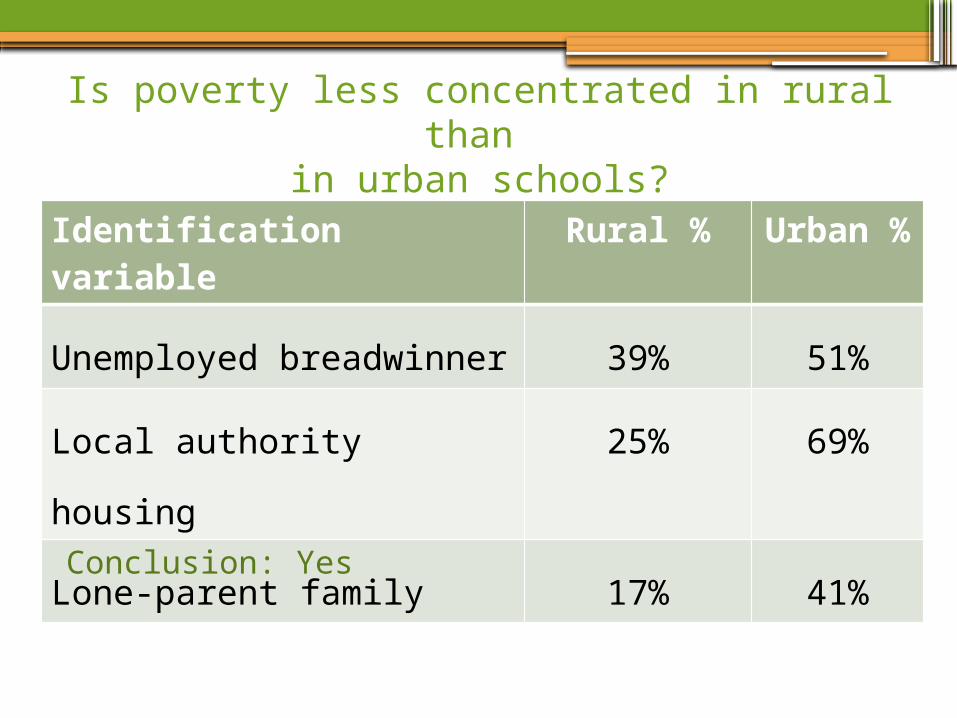
Is poverty less concentrated in rural than in urban schools?
Identification variable Rural % Urban %
Unemployed breadwinner 39% 51%
Local authority housing 25% 69%
Lone-parent family 17% 41%
Conclusion: Yes

Reading and maths achievement in 222 schools (111 urban & 111 rural) matched by level of
poverty
Rural Urban
Reading 97.7 90.8
Maths 99.2 91.1
Differential achievement of pupils in urban and rural settings is not simply a reflection of lower levels of poverty
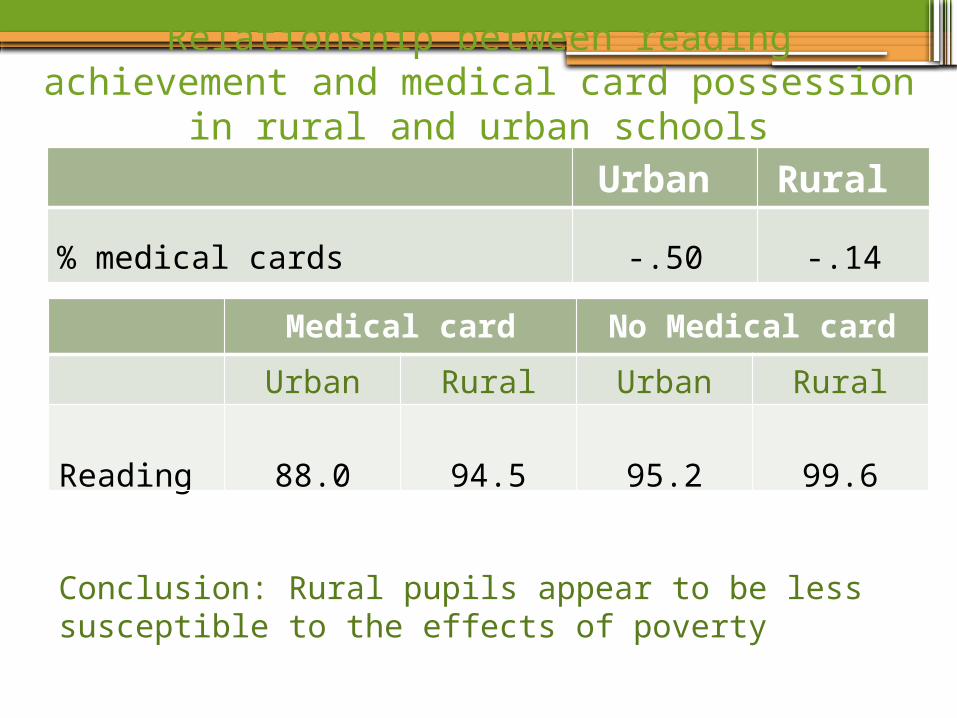
Relationship between reading achievement and medical card possession in rural and urban schools
Urban Rural
% medical cards -.50 -.14
Conclusion: Rural pupils appear to be less susceptible to the effects of poverty
Medical card No Medical card
Urban Rural Urban Rural
Reading 88.0 94.5 95.2 99.6
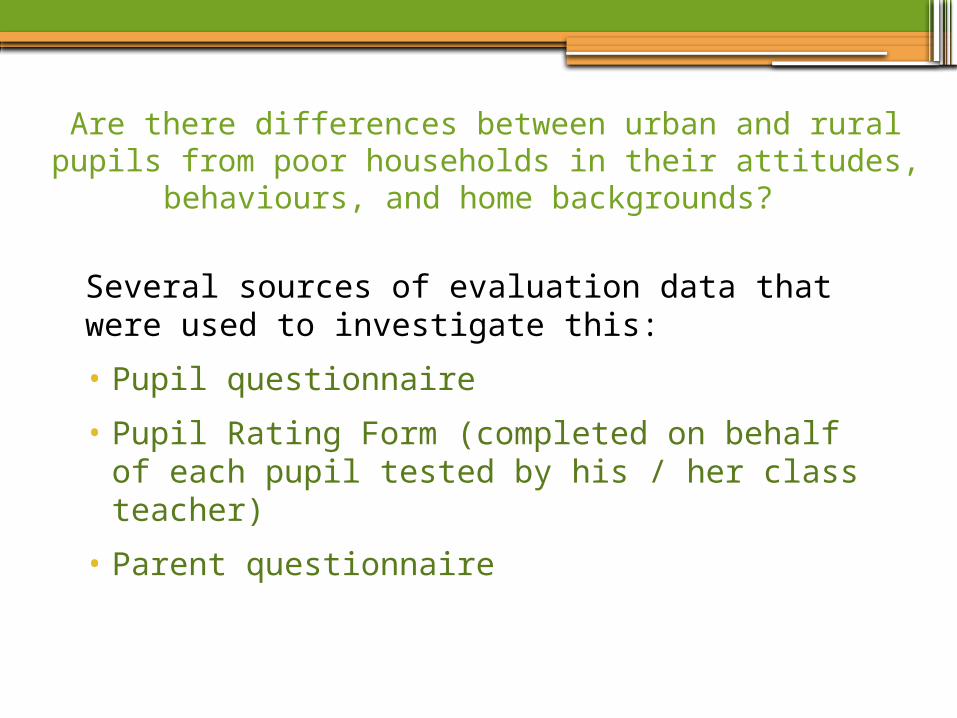
Are there differences between urban and rural pupils from poor households in their attitudes,
behaviours, and home backgrounds?
Several sources of evaluation data that were used to investigate this:
• Pupil questionnaire
• Pupil Rating Form (completed on behalf of each pupil tested by his / her class teacher)
• Parent questionnaire
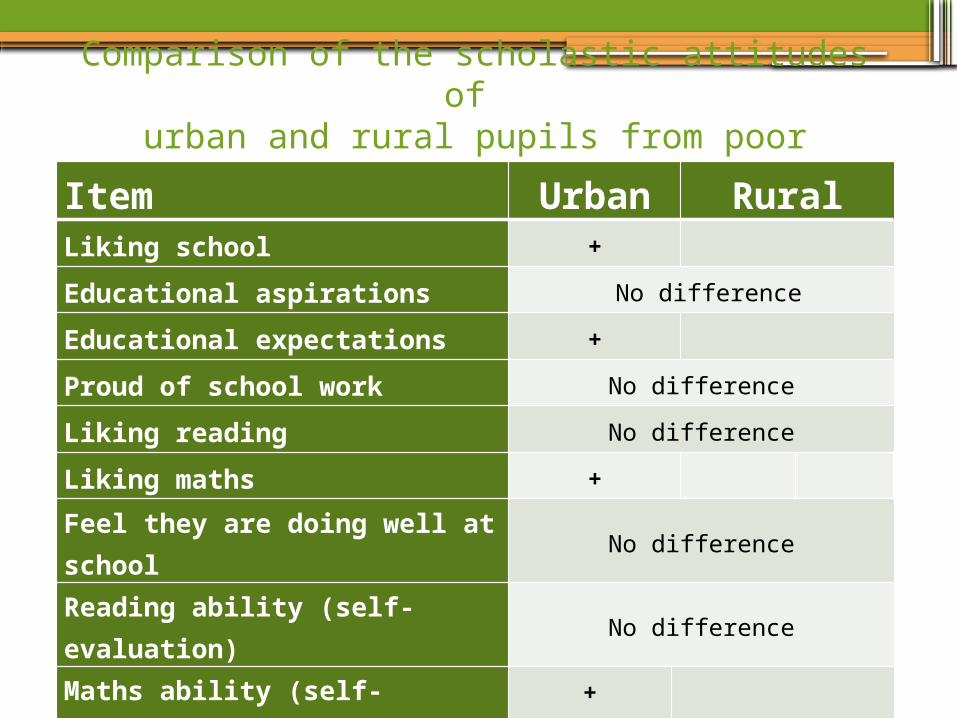
Comparison of the scholastic attitudes of urban and rural pupils from poor households
Item Urban RuralLiking school +
Educational aspirations No difference
Educational expectations +
Proud of school work No difference
Liking reading No difference
Liking maths +
Feel they are doing well at school No difference
Reading ability (self-evaluation) No difference
Maths ability (self-evaluation)+
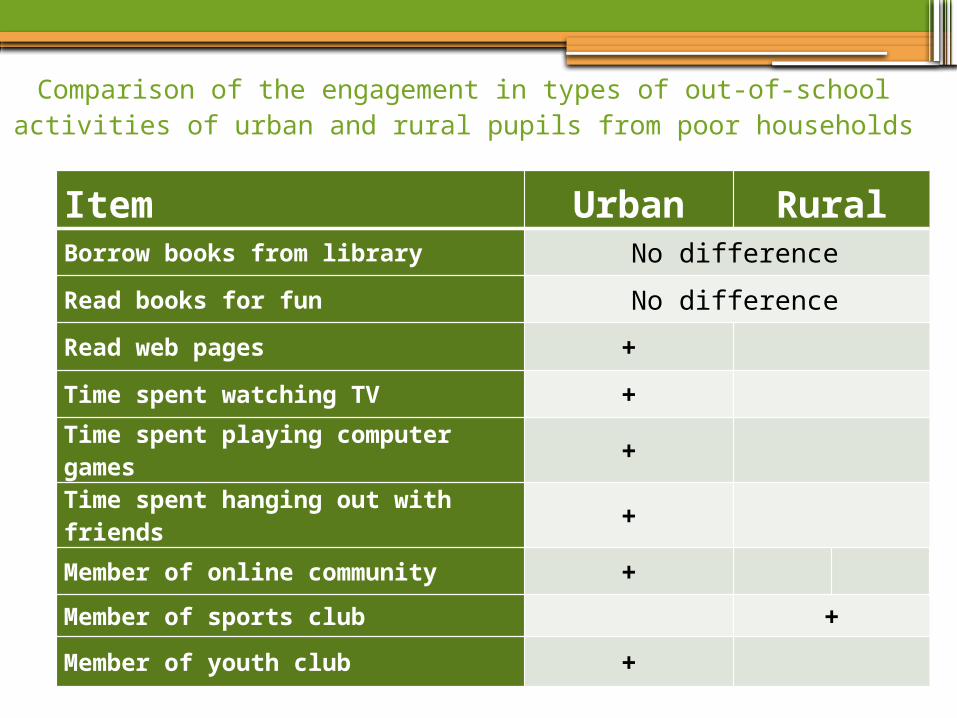
Comparison of the engagement in types of out-of-school activities of urban and rural pupils from poor households
Item Urban RuralBorrow books from library No difference
Read books for fun No difference
Read web pages +
Time spent watching TV +
Time spent playing computer games +
Time spent hanging out with friends +
Member of online community +
Member of sports club +
Member of youth club +
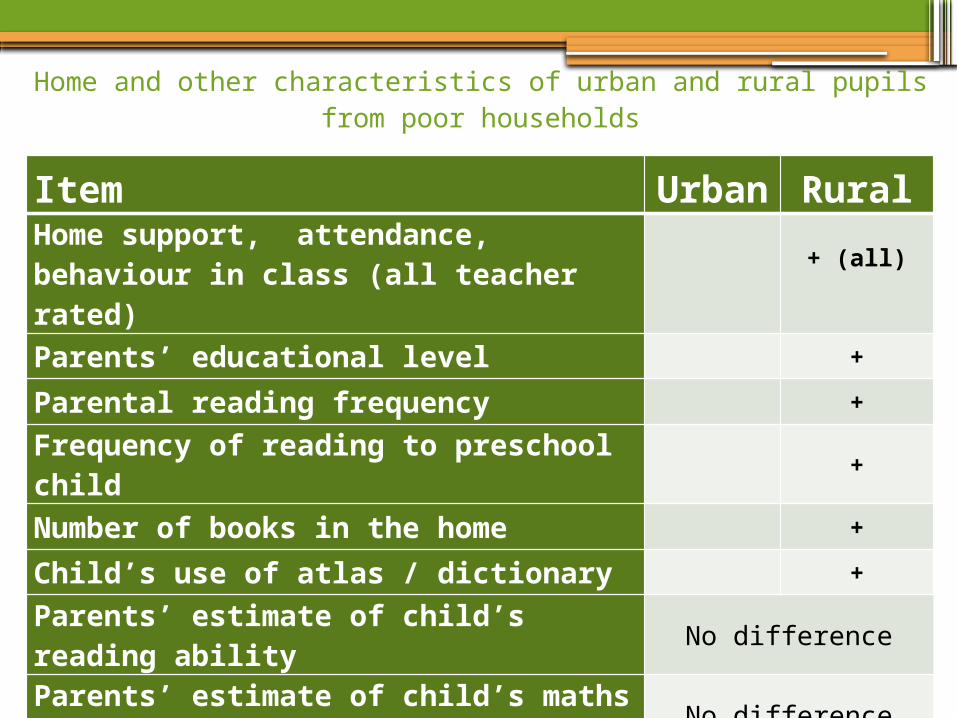
Home and other characteristics of urban and rural pupils from poor households
Item Urban RuralHome support, attendance, behaviour in class (all teacher rated)
+ (all)
Parents’ educational level +
Parental reading frequency +
Frequency of reading to preschool child +
Number of books in the home +
Child’s use of atlas / dictionary +
Parents’ estimate of child’s reading ability No difference
Parents’ estimate of child’s maths ability No difference
Family use of public library No difference
% parents unemployed No difference
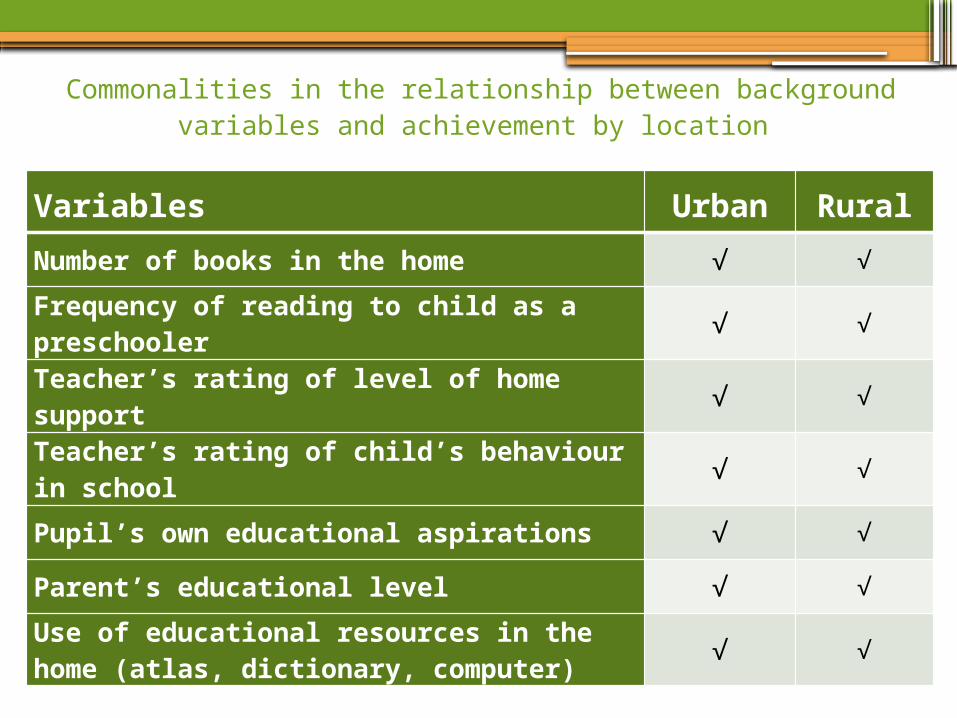
Commonalities in the relationship between background variables and achievement by location
Variables Urban Rural
Number of books in the home √ √
Frequency of reading to child as a preschooler √ √
Teacher’s rating of level of home support √ √
Teacher’s rating of child’s behaviour in school √ √
Pupil’s own educational aspirations √ √
Parent’s educational level √ √
Use of educational resources in the home (atlas, dictionary, computer) √ √
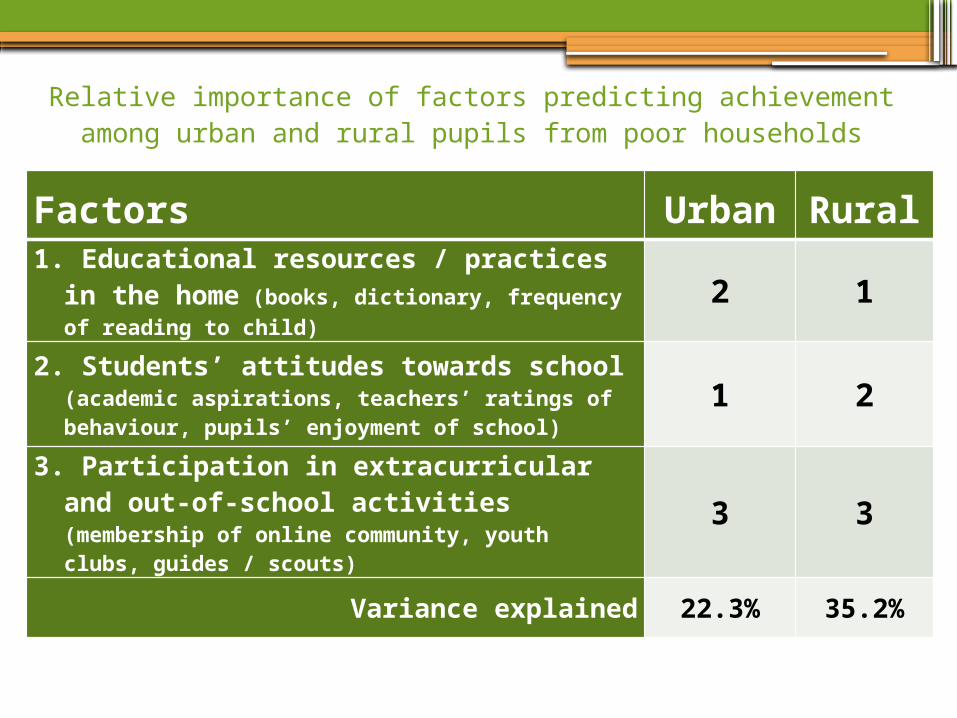
Relative importance of factors predicting achievement among urban and rural pupils from poor households
Factors Urban Rural
1. Educational resources / practices in the home (books, dictionary, frequency of reading to child)
2 1
2. Students’ attitudes towards school (academic aspirations, teachers’ ratings of behaviour, pupils’ enjoyment of school)
1 2
3. Participation in extracurricular and out-of-school activities (membership of online community, youth clubs, guides / scouts)
3 3
Variance explained 22.3% 35.2%
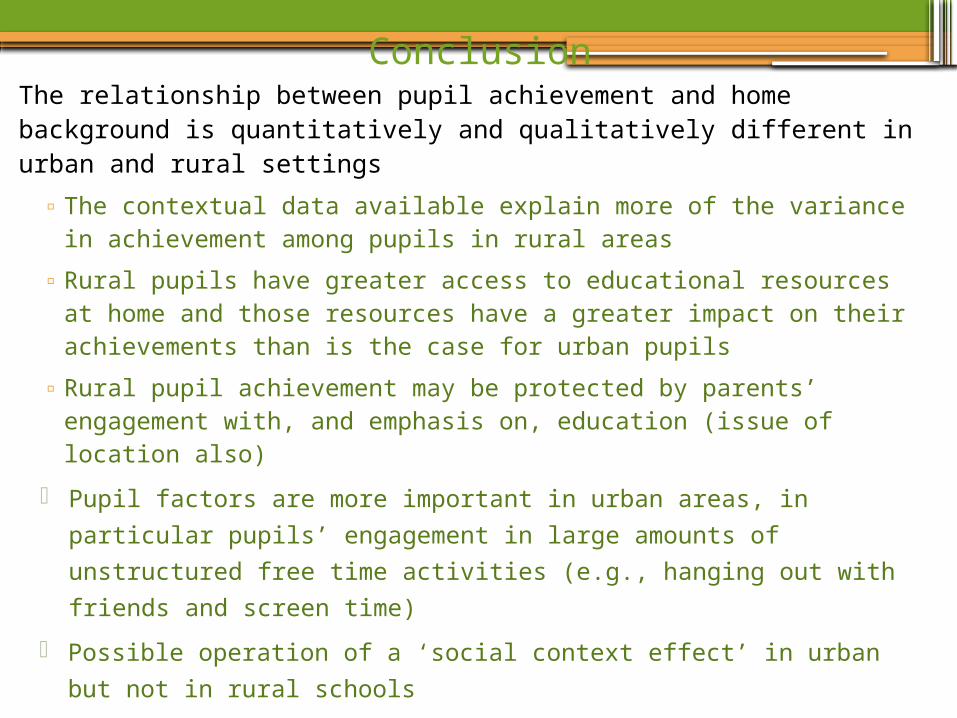
ConclusionThe relationship between pupil achievement and home background is quantitatively and qualitatively different in urban and rural settings
▫The contextual data available explain more of the variance in achievement among pupils in rural areas
▫Rural pupils have greater access to educational resources at home and those resources have a greater impact on their achievements than is the case for urban pupils
▫Rural pupil achievement may be protected by parents’ engagement with, and emphasis on, education (issue of location also)
Pupil factors are more important in urban areas, in particular pupils’ engagement in large amounts of unstructured free time activities (e.g., hanging out with friends and screen time)
Possible operation of a ‘social context effect’ in urban but not in rural schools
Further work•Data here represent very preliminary findings in the
special study of rural disadvantage and further work in the area of home background and home processes is indicated
• The potential impact of wider community influences on educational outcomes in rural areas remains to be investigated
•Challenge: Can we use any of these data to inform ways of boosting engagement and achievement among urban pupils?
55
Elements of DEIS Post-Primary
• Improved staffing schedule
•Additional financial support
•Access to Home School Community Liaison services
•Access to Schools Meals Programme
•Access to a range of supports under School Completion Programme
•Access to Junior Certificate Schools Programme(JCSP)
56
Elements of DEIS Post-Primary (Contd)
•Some JCSP schools have a library
•Access to Leaving Certificate Applied Programme (LCA)
•Access to planning supports
•Access to a range of professional development supports
•Additional funding under School Books Grant Scheme
(Source: DES Website, 2013)
57
Evaluation
Focus: Examining implementation and outcomes
Activities•What Students Think (Survey of 1st and 3rd Years)•School visits•School Questionnaires•Analysis of centrally held data (e.g., exams,
retention rates)
58
Uptake of Programmes
•Shortly after the introduction of DEIS, the number of schools with JSCP libraries went from 10 to 30
•Our data indicate that the policy of opening JCSP libraries in schools with highest concentrations of disadvantage has been reasonably successfully implemented.
• LCA participation has also been affected by the introduction of DEIS but to a much smaller extent than JCSP
59
Uptake of Programmes (Contd.)
•Before DEIS, the number of schools with students taking JCSP hovered around 130 for about 4 years
•Since 2006/07, the number has risen steadily to between 200 and 210
•All but one of the 70 (approx.) extra JSCP schools are in DEIS

60
Planning
• By school year 2012/13, almost 90% of participating schools
had completed a DEIS plan (a majority doing so between 2008
and 2010).
• All plans contained specific targets across a range of areas
with a focus on literacy, numeracy, retention and attendance.
• All but 2 or 3 school principals reported progress in relation to
stated targets.
• Principals are overwhelmingly positive about the planning
process while acknowledging drawbacks and obstacles.
• Inclusive (whole-school) approach to planning is favoured.

61
What Principals Think about DEIS
•Universal positivity about all elements of DEIS
•Despite deteriorating socioeconomic context, principals
report improved
• Retention
• Exam performance
• Literacy and numeracy
• Attendance
• Transfer to 3rd level
• Negative feedback mainly reflects concerns about
resourcing
62
Impressions of those of us who visited schools
•We felt that we got ‘a feel’ for the overall atmosphere in about two-thirds of schools
• In most of the other third, contact was almost entirely with Principal
•Positives seen in almost all schools including
• Enthusiastic engagement with planning
• Team work
• Flexibility in use of resources
• Strong pastoral care
63
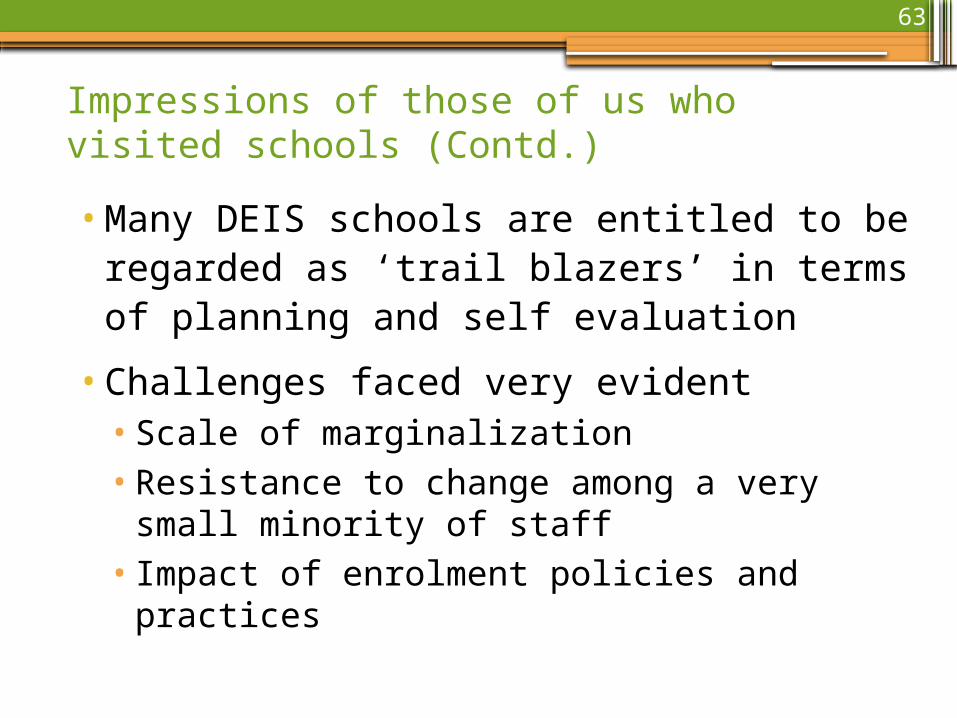
Impressions of those of us who visited schools (Contd.)
•Many DEIS schools are entitled to be regarded as ‘trail blazers’ in terms of planning and self evaluation
•Challenges faced very evident• Scale of marginalization• Resistance to change among a very small
minority of staff• Impact of enrolment policies and practices

64
Trends over Time
Academic Achievement• Junior Certificate Overall
Performance Score
Retention Levels• Retention to Junior Certificate• Retention to Leaving Certificate
65
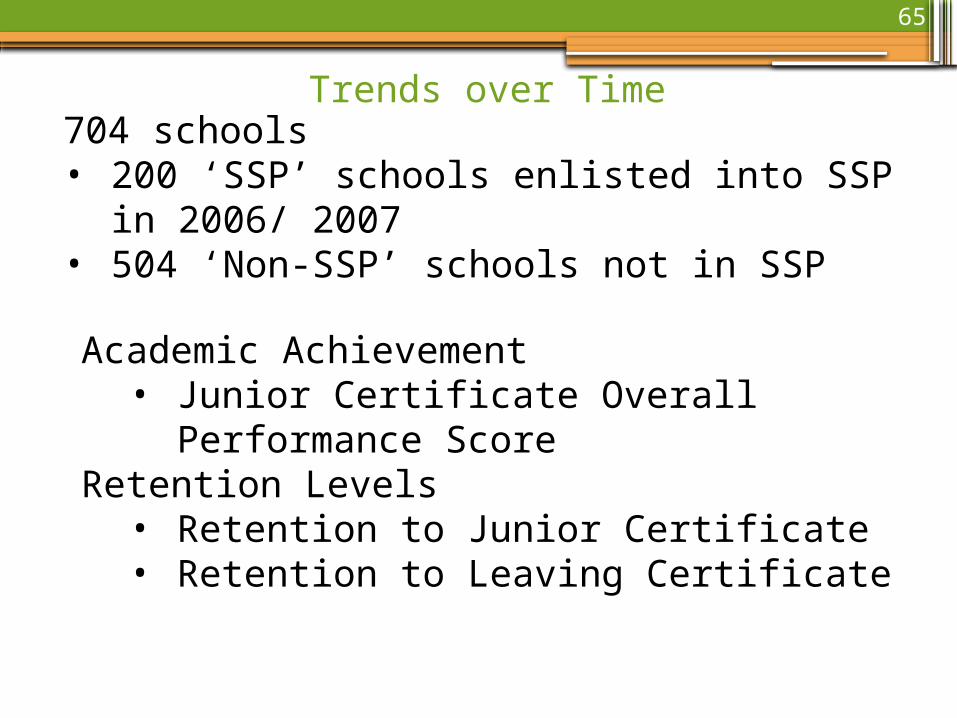
Trends over Time704 schools• 200 ‘SSP’ schools enlisted into SSP in 2006/
2007• 504 ‘Non-SSP’ schools not in SSP
Academic Achievement• Junior Certificate Overall Performance
ScoreRetention Levels
• Retention to Junior Certificate• Retention to Leaving Certificate

66
Trends over Time: Exam performance and retention
For each variable…
• Evidence of a significant trend over time?
• Evidence of differing trends for SSP & Non-SSP schools?
• Evidence that the introduction of DEIS in 2006 / 2007 had an impact on trends over time?
67
Linear Mixed Model
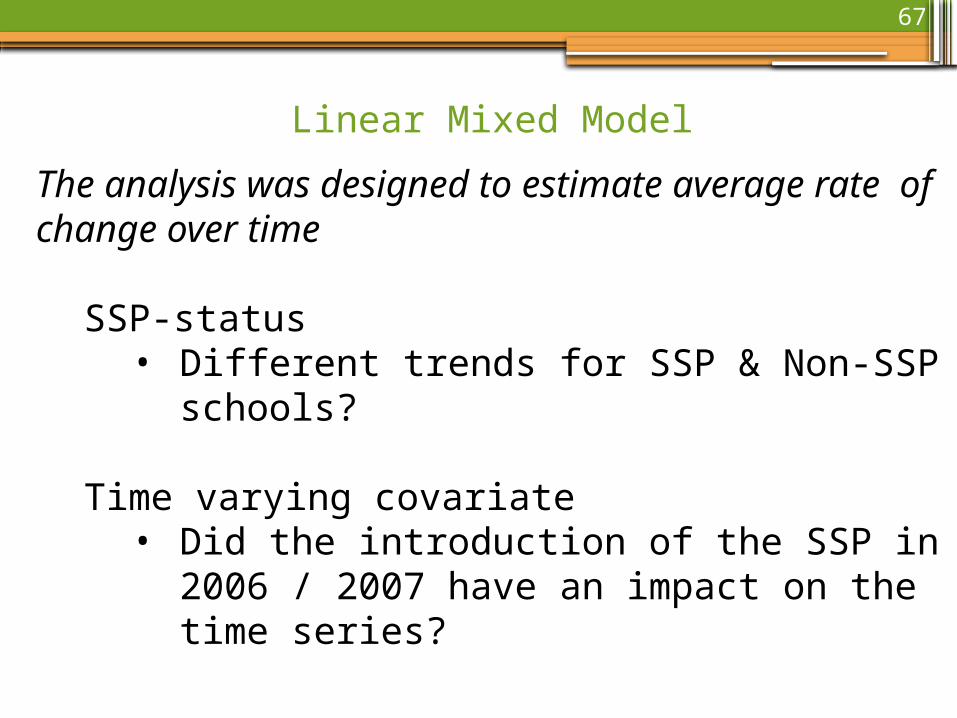
The analysis was designed to estimate average rate of change over time
SSP-status• Different trends for SSP & Non-SSP schools?
Time varying covariate• Did the introduction of the SSP in 2006 / 2007
have an impact on the time series?
68
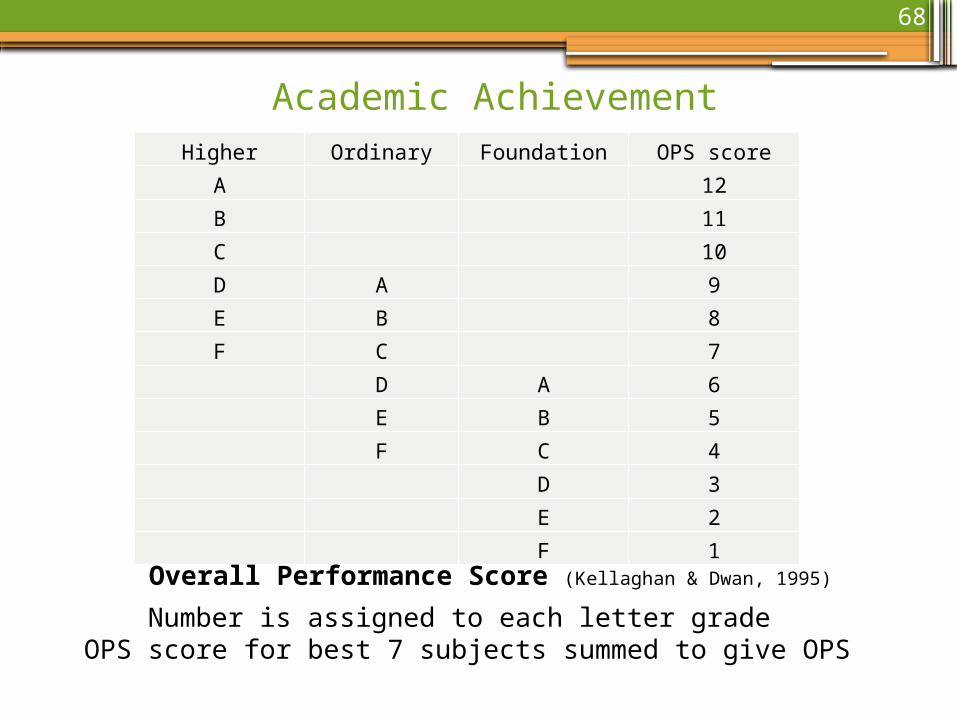
Academic AchievementHigher Ordinary Foundation OPS score
A 12
B 11
C 10
D A 9
E B 8
F C 7
D A 6
E B 5
F C 4
D 3
E 2
F 1
Overall Performance Score (Kellaghan & Dwan, 1995)
Number is assigned to each letter grade OPS score for best 7 subjects summed to give OPS
69
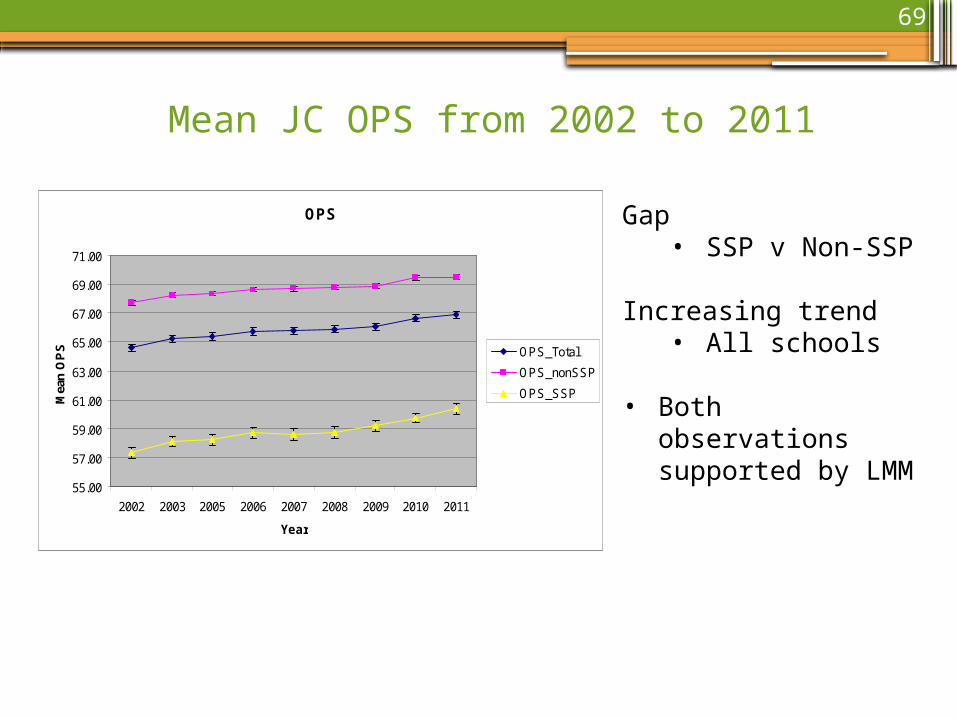
Mean JC OPS from 2002 to 2011
OPS
55.00
57.00
59.00
61.00
63.00
65.00
67.00
69.00
71.00
2002 2003 2005 2006 2007 2008 2009 2010 2011
Year
Mea
n O
PS OPS_Total
OPS_nonSSP
OPS_SSP
Gap• SSP v Non-SSP
Increasing trend• All schools
• Both observations supported by LMM
70
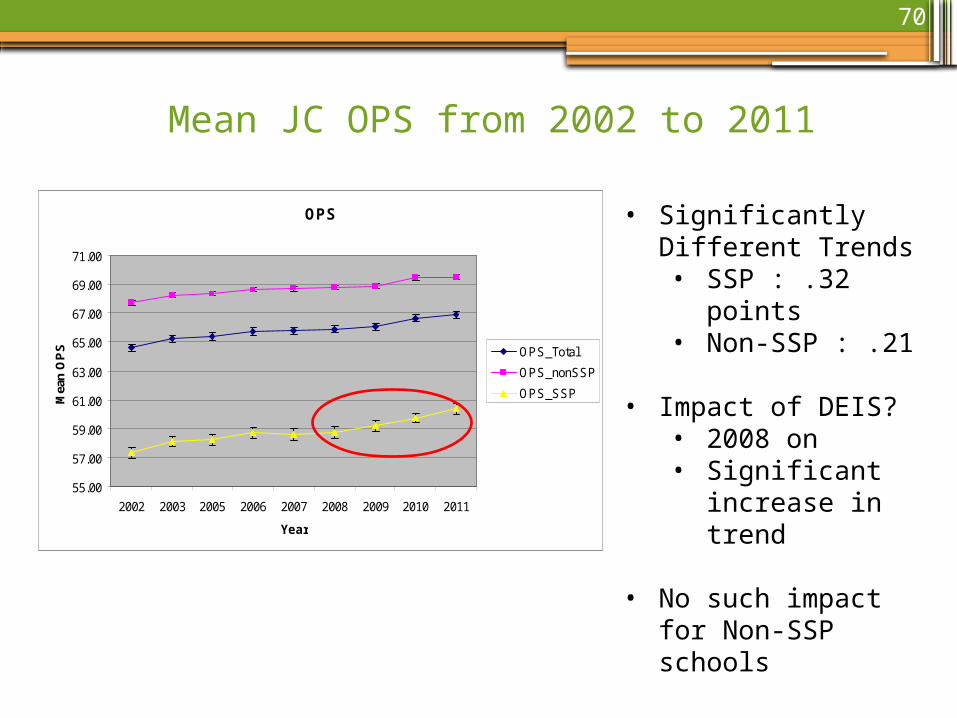
Mean JC OPS from 2002 to 2011
OPS
55.00
57.00
59.00
61.00
63.00
65.00
67.00
69.00
71.00
2002 2003 2005 2006 2007 2008 2009 2010 2011
Year
Mea
n O
PS OPS_Total
OPS_nonSSP
OPS_SSP
• Significantly Different Trends• SSP : .32 points• Non-SSP : .21
• Impact of DEIS?• 2008 on• Significant
increase in trend
• No such impact for Non-SSP schools
71
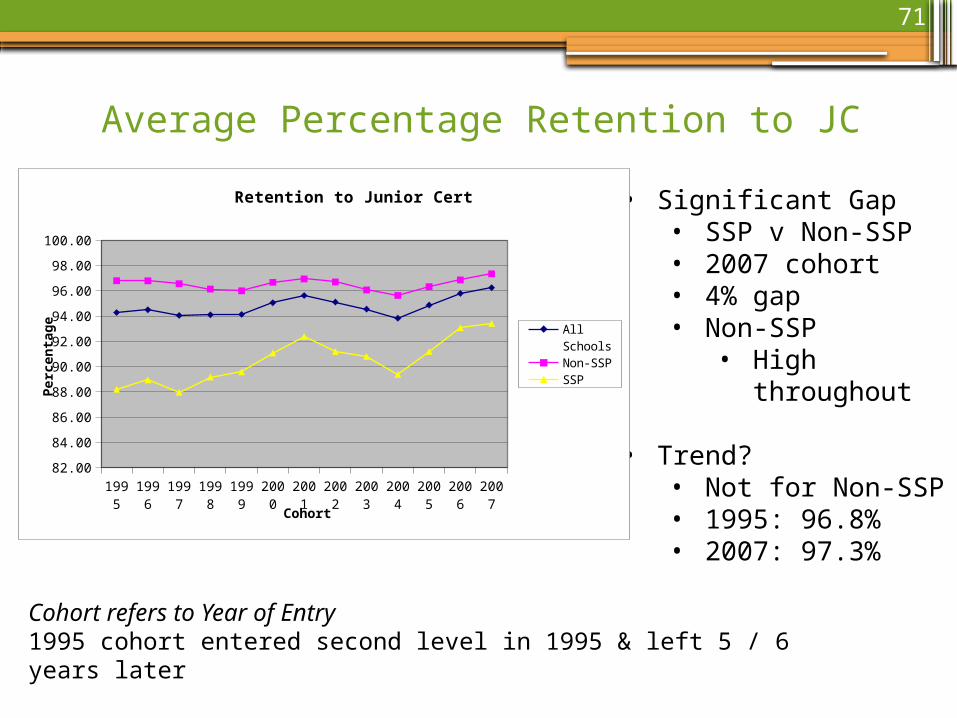
Average Percentage Retention to JC
• Significant Gap• SSP v Non-SSP• 2007 cohort• 4% gap• Non-SSP
• High throughout
• Trend?• Not for Non-SSP• 1995: 96.8%• 2007: 97.3%
1995 1996 1997 1998 1999 2000 2001 2002 2003 2004 2005 2006 200782.00
84.00
86.00
88.00
90.00
92.00
94.00
96.00
98.00
100.00
Retention to Junior Cert
All Schools
Non-SSP
SSP
Cohort
Per
cen
tag
e
Cohort refers to Year of Entry1995 cohort entered second level in 1995 & left 5 / 6 years later
72
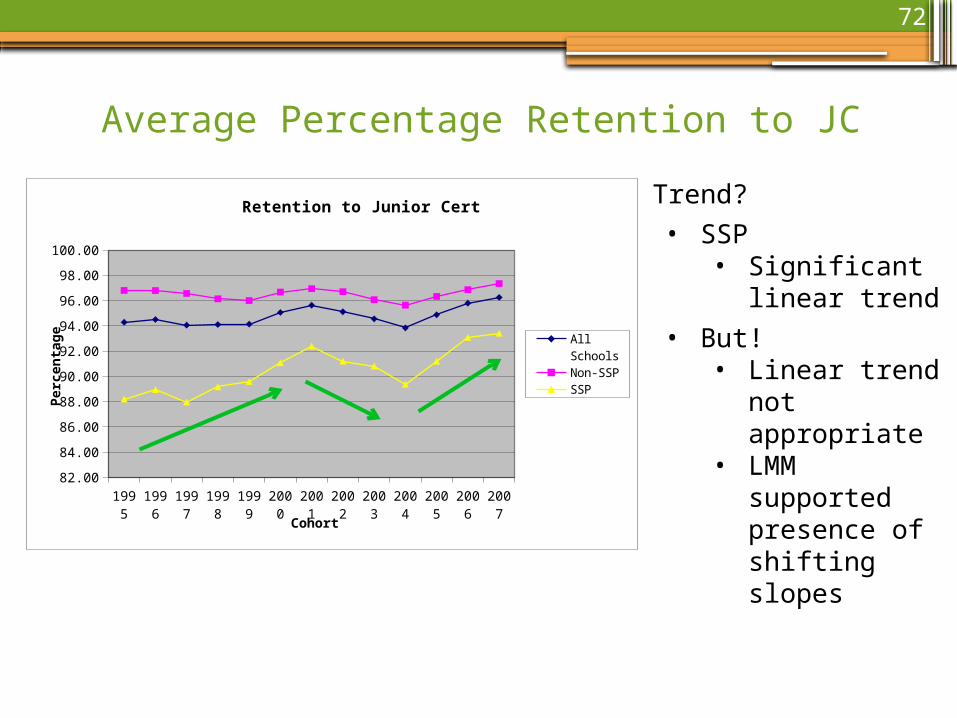
Average Percentage Retention to JC
• Trend?
• SSP• Significant
linear trend
• But!• Linear trend not
appropriate• LMM supported
presence of shifting slopes1995 1996 1997 1998 1999 2000 2001 2002 2003 2004 2005 2006 2007
82.00
84.00
86.00
88.00
90.00
92.00
94.00
96.00
98.00
100.00
Retention to Junior Cert
All Schools
Non-SSP
SSP
Cohort
Per
cen
tag
e
73
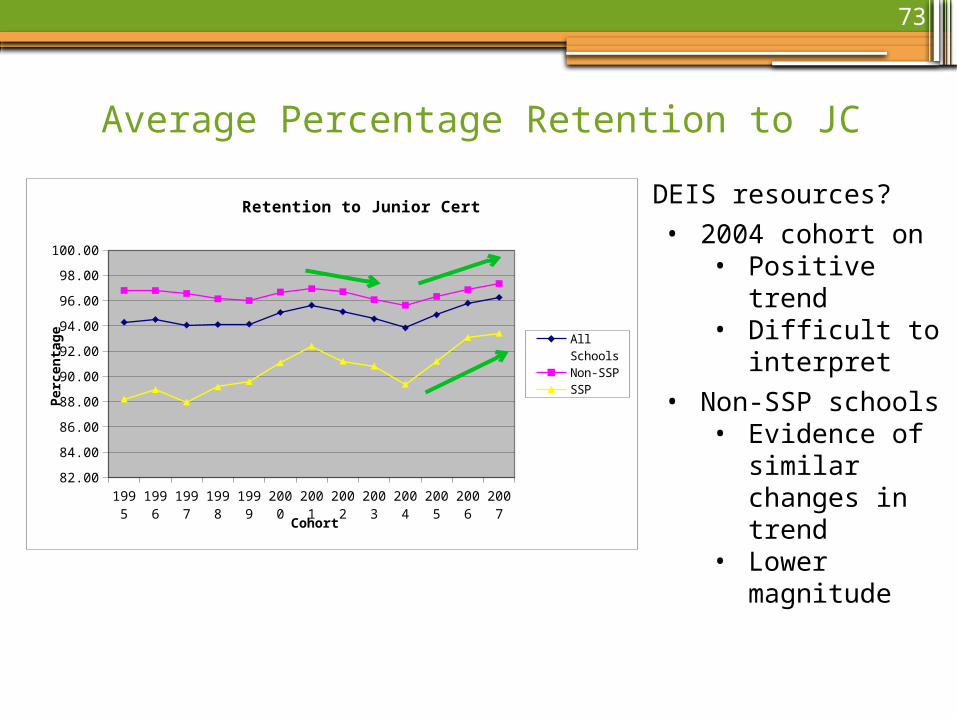
Average Percentage Retention to JC
• DEIS resources?
• 2004 cohort on• Positive trend• Difficult to
interpret
• Non-SSP schools• Evidence of
similar changes in trend
• Lower magnitude
1995 1996 1997 1998 1999 2000 2001 2002 2003 2004 2005 2006 200782.00
84.00
86.00
88.00
90.00
92.00
94.00
96.00
98.00
100.00
Retention to Junior Cert
All Schools
Non-SSP
SSP
Cohort
Per
cen
tag
e
74
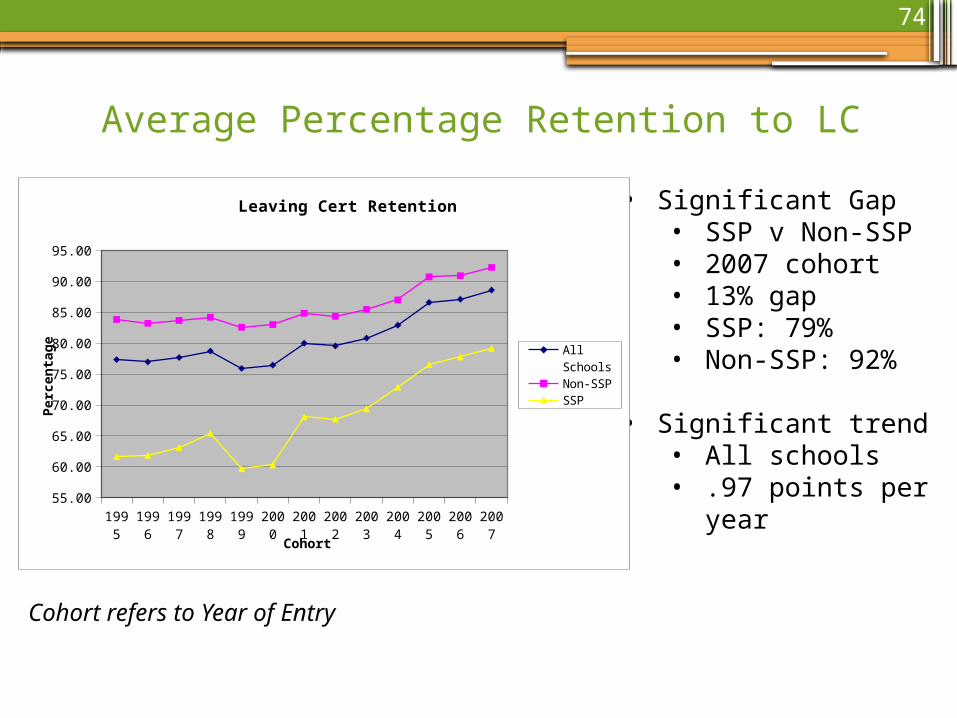
Average Percentage Retention to LC
• Significant Gap• SSP v Non-SSP• 2007 cohort• 13% gap• SSP: 79%• Non-SSP: 92%
• Significant trend• All schools• .97 points per year
Cohort refers to Year of Entry
1995 1996 1997 1998 1999 2000 2001 2002 2003 2004 2005 2006 200755.00
60.00
65.00
70.00
75.00
80.00
85.00
90.00
95.00
Leaving Cert Retention
All Schools
Non-SSP
SSP
Cohort
Per
cen
tag
e
75
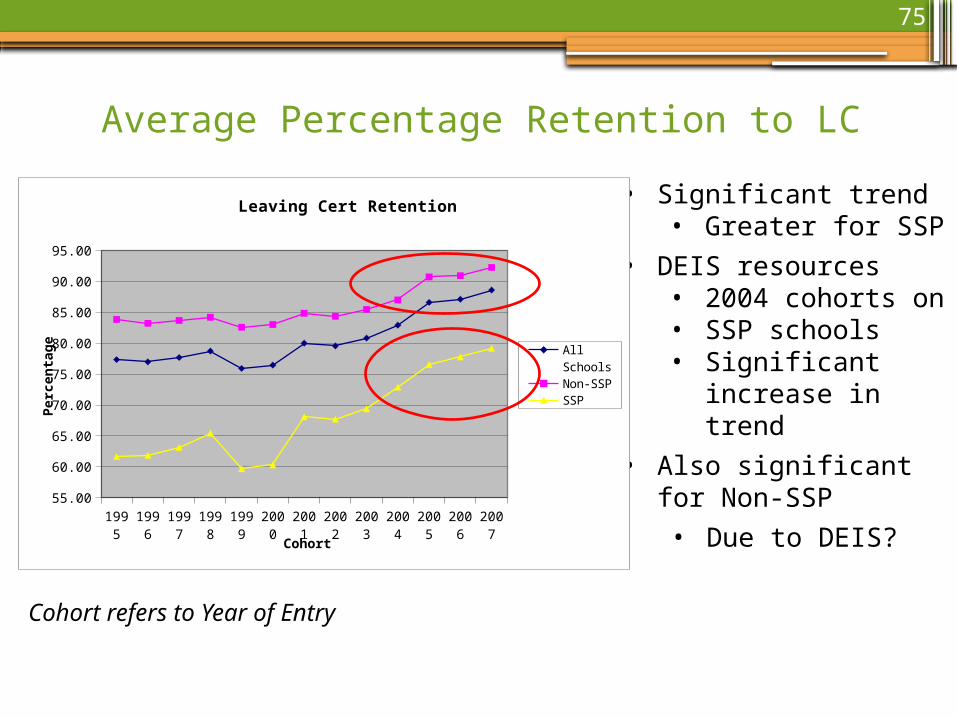
Average Percentage Retention to LC
• Significant trend• Greater for SSP
• DEIS resources• 2004 cohorts on• SSP schools• Significant increase
in trend
• Also significant for Non-SSP
• Due to DEIS?
Cohort refers to Year of Entry
1995 1996 1997 1998 1999 2000 2001 2002 2003 2004 2005 2006 200755.00
60.00
65.00
70.00
75.00
80.00
85.00
90.00
95.00
Leaving Cert Retention
All Schools
Non-SSP
SSP
Cohort
Per
cen
tag
e
76
Summary
• Evidence of a significant trend over time?• Yes • SSP & Non-SSP on all variables
• Exception of JC Retention for Non-SSP
• Evidence of differing trends for SSP & Non-SSP schools?• Yes • SSP schools trends of greater magnitude
• Junior Certificate OPS• Retention to JC & LC
77
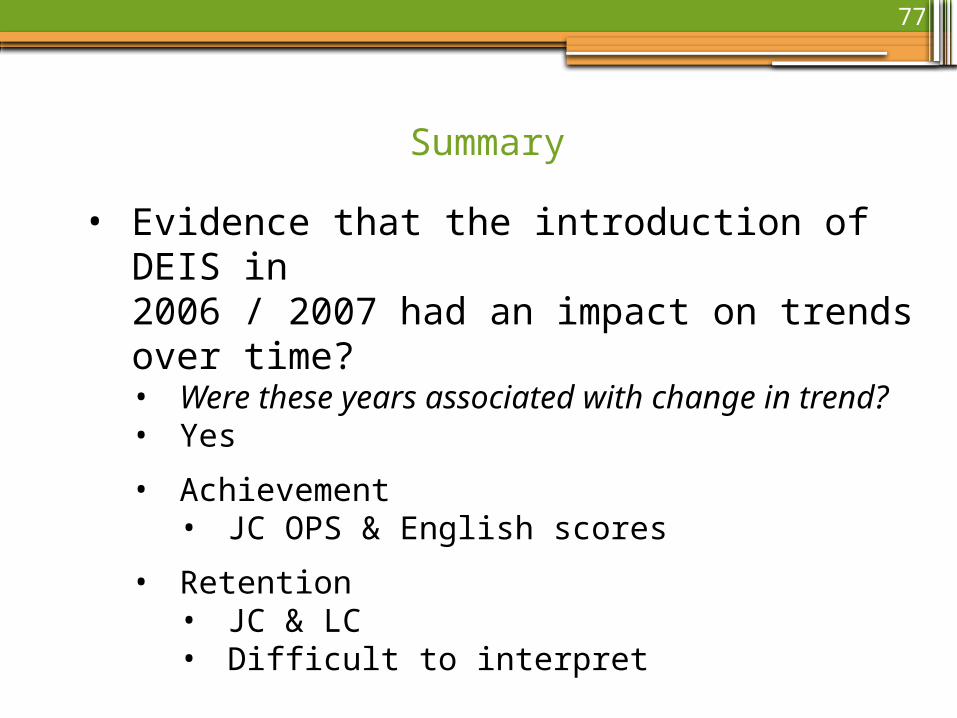
Summary
• Evidence that the introduction of DEIS in 2006 / 2007 had an impact on trends over time?• Were these years associated with change in trend?• Yes
• Achievement• JC OPS & English scores
• Retention• JC & LC• Difficult to interpret
Future evaluation plans
• The evaluation is continuing to monitor programme implementation and attempting to identify factors impacting on student outcomes
• Potential for observational work
• Publication of further reports (e.g., report on the organisation of Learning support and classroom traffic in DEIS schools, post-primary evaluation report)
• It is intended to continue to collect data on outcomes
• Return on DEIS investment more likely in the long term