Embed Size (px)
Citation preview

ADDRESSING QUESTIONS ON THE SOCIAL AND ECONOMIC OUTCOMES OF AN
INDIVIDUAL TRANSFERABLE QUOTA FISHERY
by
Danielle Noella Edwards
BSc, The University of Victoria, 1999
MRM (Planning), Simon Fraser University, 2009
A THESIS SUBMITTED IN PARTIAL FULFILLMENT OF
THE REQUIREMENTS FOR THE DEGREE OF
DOCTOR OF PHILOSOPHY
in
THE FACULTY OF GRADUATE AND POSTDOCTORAL STUDIES
(Resource Management and Environmental Studies)
THE UNIVERSITY OF BRITISH COLUMBIA
(Vancouver)
November 2019
© Danielle Edwards, 2019

ii
The following individuals certify that they have read, and recommend to the Faculty of Graduate
and Postdoctoral Studies for acceptance, the dissertation entitled:
Addressing Questions on the Social and Economic Outcomes of an Individual Transferable
Quota Fishery
submitted by Danielle Noella Edwards in partial fulfillment of the requirements for
the degree of Doctor of Philosophy
in The Faculty of Graduate and Postdoctoral Studies (Resource Management and
Environmental Studies)
Examining Committee:
Dr. Villy Christensen
Co-supervisor
Dr. Evelyn Pinkerton
Co-supervisor
Dr. Ussif Rashid Sumaila
Supervisory Committee Member
Dr. Dianne Newell
University Examiner
Dr. Wei Cui
University Examiner

iii
Abstract
In Canada, fisheries are expected to contribute to prosperous coastal communities and the
maintenance of stable and viable fishing fleets, alongside other objectives that include
conservation and complying with legal obligations to Indigenous Peoples. Individual transferable
quotas (ITQs) have been promoted as a management approach to improve the conservation and
economic outcomes of fisheries. The use of ITQs in British Columbia (BC) groundfish fisheries
is widespread, following successive introductions of ITQs into the fisheries since 1990. There
has been no comprehensive evaluation of the social and economic outcomes of ITQ management
in the BC fisheries during this time, despite more than a decade of fishery participants and
Indigenous and coastal community representatives raising concerns about the negative impacts
of quota ownership and leasing. With a focus on the BC Pacific halibut fishery, I construct a
database for licences and quota, including ownership and leasing. I examine changes in the
ownership profile of the fishery over a 25-year period and consider the extent to which
processors exercise control over the quota market through leasing. I construct a financial
enterprise model based on accounting principles to assess the impact of quota ownership and
leasing prices on the financial performance of owner-operator halibut vessels. I compare the
results of this research against objectives for fisheries in Canada, determined through an
extensive search of the literature, including current and historical policy and legal documents,
conference proceedings, testimony to Senate and House of Commons committees, speeches and
briefing material dating from the 1970s.
Owner-operators have been increasingly marginalized in the halibut fishery. Owner-operators
that have entered the fishery since 2001 catch 15% but own less than 1% of the halibut quota.

iv
Lease fees for halibut have regularly exceeded 80% of the landed price, reducing lessee fishing
enterprises to minimal earnings that do not support reinvestment or renewal of the fleet. The BC
halibut fishery is not meeting objectives for fisheries in Canada with respect to fleet viability and
the equitable distribution of benefits. I provide an overview of measures that can be used for a
just and fair transformation of fisheries to achieve socio-economic objectives.

v
Lay Summary
The British Columbia Pacific halibut fishery has long been held up as an example of successful
fisheries management. Through an in-depth investigation of this fishery, I have identified
significant failings of the management system. The ownership profile of the fishery has changed
dramatically since the introduction of individual transferable quotas (ITQs), which allow the
holder of the ITQ to catch or transfer the privilege to catch halibut. The fishery has transitioned
from predominantly owner-operated to absentee investor owners and lessee fishermen. An
analysis of fishing enterprise financial performance demonstrates the overwhelming negative
impact of leasing on fishing enterprises. New owner-operator entrants cannot earn enough from
the fishery to re-invest, including vessel maintenance and replacement. The fishery, under
current conditions, is not self-sustaining as an owner-operator fishery. Socio-economic
objectives are not being met, raising important questions about the design and implementation of
ITQ management systems and their use in Canada’s fisheries.

vi
Preface
The work undertaken in this thesis developed from research questions posed by the Canadian
Fisheries Research Network (CFRN), with a goal of researching questions that are relevant to
Canadian fisheries while simultaneously fostering collaboration between members of industry,
government and academia. The questions examined in this thesis were developed in partnership
with representatives from small boat / inshore fisheries in BC as part of the research co-
construction process.
I completed this dissertation while employed with the federal public service of Canada.
However, this work is in no way a reflection of the Government of Canada or any of its
departments, agencies, or personnel. The analysis conducted and views expressed are entirely my
own. Furthermore, none of this work used resources provided for official government business.
All government data used in the dissertation are publicly available, either being available online,
in published reports, or through Access to Information Act requests.
I wrote this entire thesis with my supervisors, Dr. Villy Christensen and Dr. Evelyn Pinkerton,
providing guidance. All chapters aside from Chapters 1 and 6 were prepared as individual
manuscripts. Chapters 2 through 4 were submitted to peer-reviewed journals and accepted for
publication. Further, Appendix B is based on a published peer-reviewed paper. I am the senior
author on all chapters (and Appendix B) and was responsible for the data compilation and the
design and implementation of the analyses.

vii
A version of Chapter 2 has been published as: Edwards, D.N. and E. Pinkerton. 2019. Rise of the
Investor Class in the British Columbia Pacific Halibut Fishery. Marine Policy 109. I gathered
necessary data, undertook the data analysis and wrote the manuscript. E. Pinkerton and V.
Christensen provided guidance at the conceptualization and initial draft stages. The co-author, E.
Pinkerton, provided comments for improvement of the final manuscript.
A version of Chapter 3 has been published as: Edwards, D.N. and E. Pinkerton. 2019. The
Hidden Role of Processors in an Individual Transferable Quota Fishery. Ecology and Society
24(3): 36. I gathered necessary data, undertook the data analysis and wrote the manuscript. E.
Pinkerton and V. Christensen provided guidance at the conceptualization and initial draft stages.
The co-author, E. Pinkerton, provided comments for improvement of the final manuscript.
A version of Chapter 4 has been accepted for publication in Marine Policy as: Edwards, D.N.
and E. Pinkerton. 2019. Priced Out of Ownership: Quota leasing impacts on the financial
performance of owner-operators. I gathered necessary data, undertook the data analysis and
wrote the manuscript. E. Pinkerton and V. Christensen provided guidance at the
conceptualization and initial draft stages. The co-author, E. Pinkerton, provided comments for
improvement of the final manuscript.
For Chapter 5, I undertook the analysis and wrote the manuscript. E. Pinkerton and V.
Christensen provided guidance at the conceptualization and initial draft stages, and comments for
improvement of the final manuscript.

viii
A version of Appendix B, provided as supplementary material, has been published as: Edwards,
D.N. and D.G. Edwards. (2017). Licence Banks as a tool to mitigate corporate control of
fisheries: A British Columbia groundfish example. Marine Policy 80: 141-146. While published
during the period of this dissertation research, this paper was not prepared under the auspices of
this research project. The paper provides a summary of, and observations on, a project
undertaken prior to the start of this dissertation. The paper is included here to provide additional
background and context as well as an example of licence banks, which is a concept discussed in
chapter 5. I wrote the manuscript and gathered reference materials. Dan Edwards contributed to
the identification of lessons learned as well as comments for improvement of the manuscript in
all stages, including conceptualization, drafting and finalizing the manuscript.

ix
Table of Contents
Abstract .......................................................................................................................................... iii
Lay Summary ...................................................................................................................................v
Preface............................................................................................................................................ vi
Table of Contents ........................................................................................................................... ix
List of Tables ............................................................................................................................... xiv
List of Figures ................................................................................................................................xv
List of Abbreviations ................................................................................................................. xviii
Glossary ....................................................................................................................................... xix
Acknowledgements .................................................................................................................... xxiii
Dedication ....................................................................................................................................xxv
Chapter 1: Introduction ....................................................................................................................1
1.1 Canadian Fisheries Research Network ........................................................................... 2
1.2 Objective and research questions .................................................................................... 4
1.3 Objectives for fisheries in Canada .................................................................................. 4
1.4 Defining the BC small boat / small-scale / inshore fleet .............................................. 11
1.5 Overview of the BC Groundfish Fishery ...................................................................... 14
1.6 Thesis overview and scope of the study ....................................................................... 16
Chapter 2: Rise of the Investor Class in the British Columbia Pacific Halibut Fishery ................19
2.1 Introduction ................................................................................................................... 20
2.1.1 Background on the British Columbia halibut fishery ............................................... 22
2.2 Methods......................................................................................................................... 27

x
2.2.1 Assigning Beneficial Ownership .............................................................................. 28
2.2.2 Categorizing Halibut Licence and Quota Ownership ............................................... 30
2.2.3 Original Quota Grantees and New Entrants.............................................................. 34
2.2.4 Valuing Quota ........................................................................................................... 34
2.3 Quota ownership and the emergence of an investor class ............................................ 35
2.4 Long-term wealth effects of initial allocation ............................................................... 41
2.5 Conclusion .................................................................................................................... 45
Chapter 3: The Hidden Role of Processors in an Individual Transferable Quota Fishery ............48
3.1 Introduction ................................................................................................................... 49
3.1.1 Overview of the British Columbia halibut fishery .................................................... 51
3.2 Methods......................................................................................................................... 54
3.2.1 Data ........................................................................................................................... 55
3.2.2 Analysis..................................................................................................................... 58
3.3 The halibut quota leasing system .................................................................................. 60
3.3.1 Extent of leasing ....................................................................................................... 62
3.4 Processor ownership and control .................................................................................. 62
3.5 Power dynamics in the quota leasing relationship ........................................................ 68
3.6 The role of government in managing markets .............................................................. 71
3.7 Conclusion .................................................................................................................... 73
Chapter 4: Priced Out of Ownership: Quota leasing impacts on the financial performance of
owner-operators .............................................................................................................................76
4.1 Introduction ................................................................................................................... 77
4.2 Background on the British Columbia Pacific halibut fishery ....................................... 83

xi
4.3 Methods......................................................................................................................... 86
4.4 Fishing enterprise cost and earnings categories ............................................................ 88
4.5 Data inputs for the financial performance model ......................................................... 89
4.5.1 Halibut catch revenue ............................................................................................... 90
4.5.2 Non-directed catch revenue ...................................................................................... 90
4.5.3 Operational and fixed costs ....................................................................................... 92
4.5.4 Crew share ................................................................................................................ 93
4.5.5 Captain share ............................................................................................................. 94
4.5.6 Quota leasing ............................................................................................................ 96
4.5.7 Interest, taxes, depreciation and amortization........................................................... 96
4.5.8 Net profit ................................................................................................................... 97
4.5.9 Summary of Data Inputs ........................................................................................... 98
4.6 Results: financial performance ..................................................................................... 98
4.7 Discussion ................................................................................................................... 102
4.7.1 Landed Price Gains and the Distribution of Earnings ............................................ 103
4.7.2 Original Grantees and New Entrants ...................................................................... 105
4.7.3 Fishery Reinvestment and Fleet Renewal ............................................................... 106
4.7.4 Data Availability and Analysis ............................................................................... 107
4.8 Conclusion .................................................................................................................. 108
Chapter 5: Unscrambling the Omelet: Introducing socio-economic measures to an established
Individual Transferable Quota fishery .........................................................................................109
5.1 Introduction ................................................................................................................. 109
5.2 Measures to achieve socio-economic objectives ........................................................ 114

xii
5.2.1 Ownership measures – policy, regulations and licence banks ................................ 114
5.2.2 Fair-Share ................................................................................................................ 118
5.3 Equitable distribution and a just and fair approach to transformation ........................ 120
5.4 Considerations on a process to implement transformation ......................................... 127
5.5 Conclusion .................................................................................................................. 128
Chapter 6: Conclusion..................................................................................................................130
6.1 Research summary ...................................................................................................... 131
6.2 On data and future research ........................................................................................ 133
6.3 Recommendations to policy makers ........................................................................... 135
6.3.1 Objectives ............................................................................................................... 135
6.3.2 Process .................................................................................................................... 136
6.3.3 Evaluation ............................................................................................................... 136
6.4 In Summary ................................................................................................................. 137
References ....................................................................................................................................138
Appendices ...................................................................................................................................173
Appendix A Data for the Consideration of Social and Economic Outcomes in the British
Columbia Halibut Fishery ....................................................................................................... 173
A.1 Data Sources ........................................................................................................... 173
A.2 Units of measurement ............................................................................................. 175
A.3 Consumer price index ............................................................................................. 175
A.4 Halibut total allowable catch, landed value and landed price ................................. 175
A.5 Quota lease and purchase prices ............................................................................. 176
A.6 Halibut fleet characteristics ..................................................................................... 179

xiii
Appendix B Licence Banks as a Tool to Mitigate Corporate Control of Fisheries: A British
Columbia groundfish example ................................................................................................ 185
B.1 Introduction ............................................................................................................. 185
B.2 Licence banks.......................................................................................................... 187
B.3 Methods................................................................................................................... 189
B.4 ITQs in the BC groundfish fishery.......................................................................... 189
B.5 The challenges ........................................................................................................ 192
B.6 The PCFCC ............................................................................................................. 194
B.7 Lessons learned ....................................................................................................... 198
B.8 Conclusions ............................................................................................................. 201

xiv
List of Tables
Table 1.1 Characteristics of the BC commercial groundfish fishery sectors, including the year
licences were limited, the total number of limited licences, the year that the dockside monitoring
program (DMP) was introduced, and the year that ITQs were introduced (DFO 2008a; 1991;
1999c; 1998a; 1999b; 1993). .........................................................................................................15
Table 4.1 Scenario inputs for a hypothetical owner-operator halibut fishing enterprise, catching a
full block of quota (61,000 lb [27,669 kg] or 1% of the TAC in 2016), including low cost and
high cost scenarios. ........................................................................................................................98
Table 4.2 Earnings before interest, taxes, depreciation, amortization, captain share and fixed
costs, per pound of halibut quota, for the years 1988, 1991 (from two sources), 1994 and 2016, in
current dollars and constant 2016 dollars. For 2016, the value represents the range of expected
earnings for a lessee owner-operator with minimum quota holdings. .........................................102
Table A.1 The number of active halibut licences and the number of owners of ‘active’ halibut
licences, by ownership category. .................................................................................................182
Table A.2 Quota ownership by ownership category. ...................................................................182
Table A.3 The licences held by halibut owner-operators in 1996 and 2016, in number of owners
and % of owners holding that licence type (233 owner-operators in 1996 and 65 in 2016). ......183
Table A.4 The number of licences associated with halibut owner-operators. .............................183
Table A.5 The vessel characteristics of ‘active’ halibut vessels in 2016, by ownership type. ....184

xv
List of Figures
Figure 2.1 Degree of halibut fishery participation, from high (operates vessel) to no participation
(quota lessor) by licence holders in the different ownership categories. .......................................31
Figure 2.2 The percent of halibut quota caught and owned by each of the five categories in each
of the four years considered. ..........................................................................................................36
Figure 2.3 Mapping the changes in ownership category for each licence in the halibut fishery. ..37
Figure 2.4 Mapping changes in ownership category for owners in the halibut fishery. The ‘new
entrant’ category are those owners who entered the fishery in the years following the year
specified, the ‘exit’ category are those that exited the fishery in the time period preceding the
year specified. ................................................................................................................................38
Figure 2.5 The percent of halibut quota caught and owned by the original grantees – licence
holders that were granted quota in 1991 – in each of the five categories of ownership. ...............42
Figure 2.6 The percent of quota owned in 1991 and in 2016 by the individual owner-operator
original grantees, by the owner type category in 2016. Those along the blue line have identical
quota holdings in both years. Those below the blue line have reduced their holdings and those
above have increased their holdings. .............................................................................................43
Figure 2.7 The number of original grantees by the 2016 lease value of the quota that they own, in
thousands of dollars. ......................................................................................................................44
Figure 3.1 The percent of halibut licences involved in temporary quota transactions each year. .62
Figure 3.2 Processor quota ownership expressed as a percent of TAC, for both direct ownership
and ownership where the processor is listed as a secondary owner, and processor control over
leasing as measured as quota transfers through processor owned and affiliated licences as a
percent of total quota temporarily transferred in the year, for 1996, 2006 and 2016. ...................63

xvi
Figure 3.3 The quota trading network in the BC halibut fishery in 1996, 2006, and 2016, as
characterized by temporary quota transactions between quota traders. .........................................67
Figure 4.1 Enterprise level financial cost and earnings categories, consisting of the gross revenue
to the enterprise, the after-lease revenue to the enterprise (gross revenue less lease fees),
operational costs, annual fixed costs, labour costs (crew share and captain share), and EBITDA
(earnings before interest, taxes, depreciation and amortization – long-run costs plus net profit). 89
Figure 4.2 The halibut landed price ($/lb) and average after-lease price ($/lb), in 2016 constant
dollars, for 1991 to 2016 (Edwards 2019). ....................................................................................94
Figure 4.3 The financial performance of a halibut fishing enterprise under different leasing and
ownership scenarios, where the after-lease price is one of $1.15/lb, $2.00/lb, or $4.75/lb, and
where the quota owned by the fishing enterprise is 710 lb (322 kg), 10,000 lb (4536 kg), or
40,000 lb (18,144 kg). ....................................................................................................................99
Figure 4.4 The earnings of a halibut fishing enterprise before interest, taxes, depreciation and
amortization (EBITDA) and after (net profit), for three after-lease price ($1.15/lb, $2.00/lb and
$4.75/lb) and three quota ownership (710 lb [322 kg], 10,000 lb [4536 kg] and 40,000 lb [18,144
kg]) scenarios. The vertical bars indicate the range of earnings under high and low cost
scenarios. Dashed horizontal lines at $20,000 and $45,000 indicate the range of expected net
profit. ..............................................................................................................................................99
Figure A.1 Halibut total allowable catch in millions of pounds. .................................................176
Figure A.2 Average halibut landed price and lease price, in constant 2016 dollars. ...................178
Figure A.3 Average halibut after-lease price, with upper and lower range for lease prices, in
dollars per pound, in constant 2016 dollars. ................................................................................178
Figure A.4 Average halibut lease price as a percentage of landed price. ....................................179

xvii
Figure A.5 The hook and line sector catch in 2016 of the non-directed species caught in the
halibut fishery, as a percent of hook and line TAC for each of species / management area unit.
......................................................................................................................................................181
Figure A.6 The percent of active halibut fishing vessels in each vessel age category for each of 4
fishing years (1991, 1996, 2006, and 2016).................................................................................184

xviii
List of Abbreviations
BC British Columbia
CCFRN Canadian Capture Fisheries Research Network (original name, renamed to CFRN)
CFRN Canadian Fisheries Research Network
CGIPP Commercial Groundfish Integration Pilot Project
DFO Fisheries and Oceans Canada (Department of Fisheries and Oceans)
DMP Dockside Monitoring Program
FAO Food and Agriculture Organization of the United Nations
GoC Government of Canada
IFMP Integrated Fisheries Management Plan
IPCC Intergovernmental Panel on Climate Change
IPHC International Pacific Halibut Commission
ITQ Individual transferable quota
OECD Organization for Economic Co-operation and Development
PCFCC Pacific Coast Fisherman’s Conservation Company
SDGs UN Sustainable Development Goals
TAC Total allowable catch
UN United Nations
UNEP United Nations Environment Programme
UNU-IHDP United Nations University International Human Dimensions Programme on
Global Environmental Change
VRN Vessel Registration Number

xix
Glossary
After-lease price – The price received by the lessee fishing enterprise, as the difference between
the landed price and the lease price.
Beneficial owner – The individual who receives the benefits from ownership, such as the
financial benefits from lease fees and the power and influence that comes with
owning a valuable asset.
Captain – The person in command of a fishing vessel. For owner-operator enterprises, also the
owner of the enterprise.
Constant Dollars – Dollar value that has been adjusted / corrected for changes in purchasing
power over time to express the value in a single year, called the base year.
Calculated by multiplying current dollars by an index of price movements (e.g.,
consumer price index). Is used to accurately compare dollar values over time by
eliminating the impact of price changes on the observed trend. Also referred to as
real-value.
Current Dollars – Dollar value that has not been adjusted for changes in purchasing power /
inflation over time.
First Nation – The Canadian Constitution recognizes three groups of Indigenous peoples of
which ‘Indians’ is one. The term ‘Indian’ is no longer considered acceptable
outside of its use as a legal term and has been replaced with the term ‘First
Nations’. The term ‘First Nation’ does not have a legal definition. ‘First Nations’
in the plural refers to the ethnicity of First Nations peoples. The singular ‘First
Nation’ can refer to a band, a reserve-based community, or a larger tribal
grouping.

xx
Fish sales slip – A record of the landing, required by DFO, which must list the buyer, seller,
weight and price for each species and grade of fish sold.
Fleet – The aggregation of units (e.g., vessels) of any discrete type of fishing activity (e.g.,
fishery, gear type, fishing pattern) utilising a specific resource (e.g., species such
as halibut, or species aggregate, such as groundfish or salmon).
Indigenous Peoples – A collective name for the original peoples of North America and their
descendants. Often, ‘Aboriginal peoples' is also used. The Canadian Constitution
recognizes three groups of Aboriginal peoples: ‘Indians’ (which is no longer an
accepted term for use although it remains the legal term; more commonly referred
to as First Nations), Inuit and Métis.
Inshore fleet (BC) – Fisheries in which the dominant licence length is less than 65’; historical
fishery ownership was independent and owner-operated; home ports are
distributed widely throughout coastal BC; and, the enterprises are at a scale that
can be operated by a single owner or small family group.
Inshore groundfish fleet (BC) – The fishing vessels that operate in the BC integrated inshore
groundfish fisheries (all groundfish fisheries excepting trawl), with: common
vessel characteristics such as length and capacity; the ability of the different
vessels to use the range of different gears used in the fisheries (i.e., longline, gang
troll, jig); and, that target groundfish (e.g., halibut, lingcod, dogfish, sablefish,
rockfish).
Individual transferable quota (ITQ) - Permits allowing the holder of the ITQ to catch or transfer a
share of a total allowable catch.

xxi
Landed price – Price, in dollars per pound, for a product at the landing point, not taking account
of any transportation, handling or quota lease costs. Equivalent to the ‘farm gate’
price for aquaculture. Also referred to as ex-vessel price.
Landed value – Value, in dollars, of the total catch for the fishery / species.
Licence – Also known as permits. A license or permit is a document giving the producer the
right to operate in a fishery according to the terms established by the regulating
authority. In British Columbia ITQ fisheries, vessels must have a licence to
legally participate in the fishery, and quota to cover the catch.
Non-directed catch – The catch that is taken incidentally or secondarily to the primary target
species towards which fishing effort is directed. Also referred to as bycatch.
Overall Length (OAL) – The length of a vessel, based on an official measurement survey
according to established DFO guidelines, which includes a measurement of the
extreme ends of the outside of the hull.
Owner-operator – The owner of a vessel and licence personally fishes it. An owner-operator may
own multiple vessels and/or licences, but only to an extent which can be
reasonably fished by a single owner.
Party based Licence – A licence eligibility held by an individual – a person, a company or a First
Nation. Party based licence eligibilities include Herring, Rockfish, Clam, Sea
Cucumber and Sea Urchin.
Skipper – The person in command of a fishing vessel. Can be the owner of the fishing enterprise
or hired by the owner to operate the vessel.
Total allowable catch - Total catch allowed to be taken from a resource in a specified period
(usually a year), as defined in the management plan. Portions of the TAC may be

xxii
allocated to the stakeholders in the form of quotas as specific quantities or
proportions.
Vessel-based Licence – A licence is issued ‘in respect of a vessel’ as the licence eligibility must
be attached to a vessel and not to an individual. The reported vessel owner(s) is
recognized as the owner of vessel-based licences attached to the vessel. Includes
Salmon, Schedule II Species, Geoduck and Horseclam, Halibut, Sablefish, Shrimp
by trawl, Groundfish Trawl, and Prawn and Shrimp by trap.
Vessel Registration Number (VRN) – A vessel registration number assigned to all vessels
registered with DFO that are engaging in commercial fishing or transporting
activities.

xxiii
Acknowledgements
I would like to thank my supervisors, Dr. Villy Christensen and Dr. Evelyn Pinkerton, whose
support was critical to the completion of this work, and who were an absolute pleasure and
inspiration to work with. I would also like to thank my committee member Dr. Rashid Sumaila.
This dissertation did not take a direct route to completion and my committee originally included
Dr. Sean Cox and Dr. Robyn Forrest, whom I would like to acknowledge for their early
comments and advice.
This project was completed through the Canadian Fisheries Research Network (CFRN), which
was funded by the Natural Sciences and Engineering Research Council of Canada. The CFRN
brought together industry, government and academic participants from across Canada. I would
like to thank my many colleagues within the CFRN, most notably my fellow students Sarah
Hawkshaw, Eric Angel, Catarina Wor, Courtenay Parlee, Andrea Haas, and Mike Hawkshaw. I
would also like to acknowledge Susan Thompson, the network manager, and Marc Allain, the
industry liaison, for all that they did to make things happen and bring together an amazing group
of people to foster collaboration and interdisciplinarity in fisheries research in Canada. I also
want to remember Christian Brun, who brought so much to the CFRN, and fisheries in Canada,
and whom the world lost far too soon.
I would like to acknowledge my friends who have supported me through this (long) process. I
want to acknowledge Cody, in particular, whose support, most notably over this past year, meant
so much to me. I would also like to thank Katarina who provided much appreciated support and
encouragement through some challenging times over the course of this research.

xxiv
I would also like to acknowledge the support I received from my employer and colleagues. I
completed this dissertation while employed with the federal public service of Canada. I received
two education leaves for which I am very grateful. I also received many words of encouragement
and advice from my co-workers and managers that were invaluable. In particular, I would like to
recognize Dr. Joy Senack, who helped me believe that it was possible to do a PhD while working
full time and who helped make this dissertation possible.
I would like to give my sincerest appreciation to the many industry and community collaborators
with whom I have worked over the years, both directly on this project and in the years preceding.
They helped me understand the intricacies of the BC fisheries and fishing enterprises, the
consequences of policy and management decisions, and the importance of considering how to
mitigate negative impacts. I also want to thank Dr. Chris Newton, from whom I learned so much
about the history of fisheries objectives and the historical role and future potential for the
application of fisheries economics to British Columbia’s fisheries.
I was not only a student and researcher undertaking this project, but also the daughter, sister,
cousin, granddaughter and niece of fishermen. I want to acknowledge my family – those that fish
and those that stay on shore – most notably Bonnie, Ryan, Emily and Paul. Last, but most
certainly not least, I want to thank my father, Dan Edwards. I cannot express the depth of my
gratitude for all that he has done, both for myself as an individual and his work on behalf of the
fishing communities of BC. I have learned so much from him over the years and his advice and
guidance in this research was critical. His unwavering dedication to supporting vibrant,
sustainable and equitable fisheries is inspiring.

xxv
Dedication
To my parents, Bonnie and Dan, who have been a constant
source of support and inspiration.
To my grandmother, Jorunn, who always encouraged me to believe in myself.
And to British Columbia’s vibrant fishing communities –
a past worth remembering and a future worth fighting for.

1
Chapter 1: Introduction
The world is in a time of unprecedented change and upheaval. The gap between the rich and the
poor is growing (Keeley 2015). Human activity is depleting many resources previously
considered inexhaustible, at rates that undermine resource renewal (UNU-IHDP and UNEP
2012). Climate change impacts are becoming increasingly apparent, with the potential for
climate devastation becoming ever more possible, including ocean acidification and the
irreversible loss of many marine and coastal ecosystems (IPCC 2018). At the same time, the
world has enormous potential to address these issues and successfully navigate this time of crisis.
Knowledge is increasing at an unprecedented pace (Weinberger 2014). The rapid growth in data,
the development of new technologies and the wide-scale dissemination of knowledge has the
potential to lead to the innovations needed to address global challenges (OECD 2018).
Governments around the world have committed to achieving progress through concerted efforts,
including initiatives such as the United Nations Sustainable Development Goals (SDGs), an
urgent call for action by all countries adopted by all United Nations member states in 2015
(United Nations 2015). The SDG agenda recognizes that ending poverty and other deprivations
must go hand-in-hand with strategies that improve health and education, reduce inequality, and
spur economic growth – all while tackling climate change and working to preserve oceans and
forests. Identifying the ocean as the world’s greatest common resource, the UN Global Compact
has highlighted the role of the ocean in accelerating work across all 17 of the SDGs. The
challenge will be to translate that potential into informed action that is appropriate and effective.
Canada, among the wealthiest countries in the world with extensive capacity to address
challenges both domestically and globally, has a particular responsibility to act. Canada has

2
made firm commitments to address some of the world’s most pressing problems, as exemplified
in adoption of the SDGs and other international commitments, including through Canada’s
presidency of the G7 in 2018 during which the oceans figured prominently (G7 2018).
Successive governments in Canada have also committed to strengthening the middle-class in
Canada, reducing inequality and eradicating poverty, addressing reconciliation with Indigenous
Peoples, and ensuring a prosperous future for all Canadians. It is within this context that I am
considering issues related to the socio-economic objectives for fisheries management in British
Columbia (BC), Canada.
1.1 Canadian Fisheries Research Network
This PhD project was undertaken as part of the Canadian Fisheries Research Network (CFRN),
supported by the Natural Sciences and Engineering Research Council of Canada (NSERC). The
CFRN was a six-year research partnership with the goal of addressing questions relevant to
Canadian fisheries while simultaneously fostering collaboration between members of industry,
government and academia (Thompson et al. 2019). The organizing theme for the research
network was the use of co-construction to develop research objectives and carry out research
activities. Co-constructed research is “research that facilitates equal partnership in research
between at least one academic party and one non-academic party” (Horner 2016, 8). The CFRN
promoted an approach to science that was “founded in collaborative, interdisciplinary, multi-
stakeholder participation in research of relevance to management decision making” (Thompson
2016, 677). As part of issue identification in the early stages of the network, fisheries
representatives from the BC small boat / inshore fleet identified a primary area of concern as the
diminished viability of their fleet arising from the licencing and quota leasing framework under

3
which a number of fisheries in BC operate. Citing lease costs in the individual transferable quota
(ITQ) managed groundfish fisheries that at that time, in 2010, exceeded 70 to 80% of the landed
value of the more valuable fish species that they fished, fisheries representatives were concerned
about the long-term outlook for the BC inshore fleet. ITQs are permits allowing the holder of the
ITQ to catch or transfer a share of a total allowable catch (TAC). ITQs have been promoted as a
solution to numerous long-standing issues in fisheries and credited with a number of
improvements where fisheries have become ITQ-managed (Branch, Rutherford, and Hilborn
2006; Casey et al. 1995; Grafton 1996; Grafton et al. 2006; Grimm et al. 2012; McRae and
Pearse 2004). Fisheries representatives identified concerns about ITQs for both existing ITQ
fisheries as well as other fisheries such as salmon and crab that had been proposed for
transitioning to ITQs (McRae and Pearse 2004). While ITQs are generally acknowledged to have
negative consequences for the equitable distribution of benefits, employment, fisheries-related
services and infrastructure, and intergenerational access (Copes 1986; Copes and Charles 2004;
Ussif Rashid Sumaila 2010; McCay 2004; Pálsson and Helgason 1995; Pinkerton and Edwards
2009), these negative consequences in the BC context have been regularly downplayed or
dismissed outright as unfounded or exaggerated (BC Seafood Alliance 2019b; 2019c; 2019a;
Boyes 2019; Gislason 2008; Morley 2019; Nelson 2011; B. R. Turris 2010). Representatives
from the inshore fleet in BC asked that the ITQ managed fisheries be evaluated to address
questions about ownership, the distribution of benefits, and the long-term viability of the fleet.

4
1.2 Objective and research questions
The overall research objective of this study is to assess the social and economic outcomes for the
BC small boat / inshore groundfish fleet of being managed under an individual transferable quota
system. More specific research objectives include:
1. Understand the ownership structure of the BC groundfish fisheries;
2. Identify the primary factors impacting financial viability of the small boat / inshore BC
groundfish fleet;
3. Explore the role of processors in the BC groundfish fisheries;
4. Evaluate whether objectives for fisheries in Canada related to the distribution of benefits
and the stability and viability of the small boat fleet are being met within the groundfish
fisheries; and,
5. Consider options to achieve socio-economic objectives.
1.3 Objectives for fisheries in Canada
Fisheries in Canada occupy a unique role, being a common pool resource belonging to the people
of Canada for the benefit of Canadians, particularly those in coastal communities (Fisheries Act
(R.S.C., 1985, c. F-14) 1985; Oceans Act (S.C., 1996, c. 31) 1996). The predominant focus for
fisheries management in Canada over the previous two decades has been on meeting ecological
objectives (Stephenson et al. 2017). A review of policy documents and management plans for
BC fisheries since 1990 demonstrates a low emphasis placed on socio-economic objectives.
There are also significant gaps and deficiencies in the collection of the socio-economic data
needed to evaluate fisheries against these objectives (Cisneros-Montemayor et al. 2017). Despite
this, socio-economic objectives are central to societal expectations about the benefits derived
5
from fisheries, and have been recognized in policy and legislation and by fisheries ministers and
senior government officials over a period spanning decades.
The importance of understanding and clearly articulating management objectives has long been
recognized by the federal fisheries management agency, Fisheries and Oceans Canada (DFO). In
1974, Maury Houghton, Manager of Special Programs, Fisheries and Marine Services,
Department of the Environment (the predecessor to DFO), spoke at a workshop on limiting entry
into commercial fisheries and provided the following advice (Mundt 1974):
Suggest for each program you take a strong look at your objectives and try to
tailor your implementation program to meet those objectives.
This workshop included reflections on the licence limitation program introduced into the BC
fisheries in 1968, in what was known as the Davis Plan. Chris Newton, manager of the Species
Economics Program and Intelligence Branch, Fisheries and Marine Services, Department of the
Environment, identified the objectives of the Davis Plan:
The initial objective of the program was to raise average incomes of fishermen
to the regional average.
In 1998, the then Fisheries Minister, the Honourable David Anderson, in testimony to the House
of Commons Standing Committee on Fisheries and Oceans, reaffirmed that fisheries in Canada
are meant to provide a good living for the people in the industry (D. Anderson 1998):
Now, the overriding objective in this province, as elsewhere, is conservation
and protecting the marine resources for future generations. But there is a

6
substantial fishery as a secondary but very important objective as well, and by
that I mean a fishery that both conserves the fish stocks and provides a good
living for the people in the industry itself. I do not see as an objective simply a
subsistence fishery for British Columbia. I see an industry that pays the people
in it adequate amounts of money so they can care for their families at the
decent level they deserve.
In a 2017 speech to the Canadian Independent Fish Harvesters Federation, then fisheries Minister
Dominic LeBlanc reaffirmed the intent of his government that:
The benefits of the fishery go to those who work hard to prosecute it, and the
communities that support them.
In 2019, in testimony to the House of Commons Standing Committee on Fisheries and Oceans,
Rebecca Reid, regional director general for Fisheries and Oceans in the Pacific region, stated the
following (DFO 2019b):
The conservation, protection and sustainable management of the resource is
still the department's core mandate. However, the department recognizes the
importance of social, economic and cultural considerations in fisheries
management decision-making. …
The department's fisheries management regime is designed to achieve five
objectives: conservation outcomes; compliance with legal obligations, such as
First Nations rights; promoting the stability and economic viability of fishing

7
operations; encouraging equitable distribution of benefits; and facilitating the
necessary data collection for administration, enforcement and planning
purposes.
Despite clear socio-economic objectives associated with fisheries in Canada, within a national
and international context prioritizing inclusive and sustainable economic growth and the
reduction of inequalities, there has been a lack of explicit consideration of socio-economic
objectives in developing policy and management approaches in BC fisheries and only limited
evaluations of the social and economic outcomes of past decisions.
While Canada’s Pacific fisheries share a common vision and set of objectives with Canada’s
Atlantic fisheries, the Pacific fisheries have not had the same level of policy development as the
Atlantic fisheries, particularly with respect to socio-economic objectives. Despite a shared
history and more similarities than differences in the development of their fisheries and coastal
communities, informal approaches to fisheries management common to both coasts were
formalized in the Atlantic region and abandoned in BC (Gough 2008). The abandonment of these
approaches in BC was not a deliberate or intentional action, but one of timing and inattention,
and poor implementation (DFO 2019b; Gough 2008).
With a strong inshore fleet in BC in the 1970s, independent and owner-operated, the view was
that there was no need to formalize fleet separation and owner-operator policies (Government of
Canada 1976; Tansley 1979). By the time corporate and absentee ownership became an issue, a
new narrative had taken hold that pitched the objectives for BC fisheries as somehow different

8
from those in the rest of Canada, and the attempt has been made to rewrite BC fisheries history
to be one of longstanding corporate ownership and control (BC Seafood Alliance 2019b; Morley
2019; Gislason et al. 2017). This does not accurately reflect the history of fisheries in BC or the
Atlantic region, the national interest in responsibly managing oceans and fisheries to meet a
national vision, nor the common shared objectives for fisheries in Canada.
In 1979, in a speech delivered by Donald Tansley, Associate Deputy Minister, on behalf of the
Honourable Romeo Leblanc, Minister of Fisheries, told the Fisheries Association of British
Columbia that:
In the east, we hold up the B.C. fishing industry as a good model. That should
permit me to hold up the Atlantic industry to you, as a model of certain
difficulties. …
In the Atlantic fishing fleet, we have seen buyer domination through ownership
or credit. This lowers prices, prevents united bargaining, and restricts the
freedom of the fisherman to sell fish where he wants. In the east, I’ve promoted
separating the fleet from processors, to create equal bargaining and the free
work supply and demand, such as you have here in the B.C. Fleet.
What followed from this statement was the formalization of a fleet separation policy in Atlantic
Canada in 1979 and an owner-operator policy in 1989 (Gough 2008). Forty years later, the story
is a very different one. In testimony to the House of Commons Standing Committee on Fisheries

9
and Oceans in 2019, fish harvester Carl Allen told members of Parliament (FOPO 2019a, 30–
31):
Right now, on the East Coast we're in a boatbuilding boom, with many
boatbuilders having at least a two-year wait if you want a new boat, while
shipwrights struggle to keep up with the demand for repairs and refits on
existing vessels.
Compare that to the West Coast. There, as a result of the lack of sound policies
to keep the net benefit of the resource in the hands of the people who actually
harvest it, the boatbuilding industry has diminished to the point where, I've
been told, fishermen are sourcing new boats from the U.S. and elsewhere.
Again, this is the complete opposite of the East Coast, where we are selling
vessels into the U.S. at a constant rate….
I recently had a member of my community approach me. He shook my hand
and congratulated me on a good season. This is what he had to say to me:
“When fishermen are doing well, the community does well. We all benefit from
the riches of the oceans.”
When I compare that to what a young fisherman told me on a recent trip to
British Columbia I was saddened and disgusted at the results of the DFO's
B.C. region policies over the last 25 plus years. He said this to me: “We lost
the ability to take care of our communities like we used to, and therefore our
communities don't see the need to take care of us.”

10
There is much to be learned for the BC fisheries from Atlantic Canada’s fisheries, where efforts
have been taken to defend and promote the inshore fleet. Just as at one time there was much for
the Atlantic fisheries to learn from BC. Unfortunately, the lessons Canada’s East Coast
fishermen take from the Pacific fisheries in 2019 is what not to do.
The importance of addressing socio-economic objectives for fisheries in Canada is further
heightened by the role of fisheries in reconciliation efforts with Indigenous Peoples, alongside
improving opportunities for economic participation of Indigenous Peoples in Canada, which
have been identified by the Government of Canada as top priorities. A number of court cases
have affirmed, to varying degrees, the rights of Indigenous People with respect to fisheries and
the legal obligations that the Government of Canada has with respect to fisheries and Indigenous
Peoples. Court cases have been brought forth related to the constitutionally protected rights of
Indigenous People to access fish for food, social, and ceremonial purposes (R. v. Sparrow 1990),
to earn a living from fisheries as identified in historical treaties (R. v. Marshall 1999), and to
address the question of unextinguished rights and title where treaties were never signed, as is the
case for the majority of First Nations in coastal British Columbia (Ahousaht Indian Band and
Nation v. Canada (Attorney General) 2009; Lax Kw’alaams Indian Band v. Canada (Attorney
General) 2011; Ahousaht Indian Band and Nation v. Canada (Attorney General) 2018). There are
myriad expectations that the government has committed to achieving, and legal requirements that
the government is obliged to meet, that are centred on the social and economic outcomes of
fisheries in Canada.

11
1.4 Defining the BC small boat / small-scale / inshore fleet
There is a terminology gap when describing the BC fishing fleets. Terms such as ‘small boat
fleet’, ‘owner-operator fleet’, ‘small-scale fisheries’, and ‘inshore fleet’ are all used
interchangeably to refer to fisheries that are small boat, historically owner-operator and
independent, fishing relatively low impact gear in the coastal regions of BC. This fleet stands in
contrast to the other fleet segment referred to as the ‘corporate fleet’, ‘big boat fleet’, and
‘industrial fleet’. However, there are no official designations for the different fleet segments in
BC.
The use of the term ‘small-scale fisheries’, while widely used internationally, by the EU, the
FAO and others, to distinguish smaller-scale fisheries and fishing enterprises from larger,
corporate and more industrial fisheries, has met with limited uptake in Canada. There is no one
definition for small-scale fisheries, which are instead defined on a country-by-country or region-
by-region basis (FAO 2005). Within the EU, small-scale fishing is defined as “vessels under 12
m in length not using towed gear” (Macfadyen, Salz, and Cappell 2011, 12). This definition is
problematic for many of the EU fisheries that are viewed separate from the larger, more
corporate and industrial fisheries, either because of the strict length limitation or the use of towed
gear (Urquhart, Acott, and Sanghera 2014). This same issue applies in Canada, particularly given
ocean conditions that often dictate the use of larger vessels for safety reasons (e.g., the mean
vessel size of the small salmon boats in BC (gillnetters and trollers) is 12.7 m). DFO has further
contributed to confusion over the use of the term ‘small-scale fisheries’ in Canada by deviating
from the international norms for defining this term. The widely accepted approach for defining
small-scale fisheries, while context specific, focuses on the characteristics of the participants and

12
fishing activity (Chuenpagdee 2016; FAO 2005). In the context of providing science advice,
DFO in 2018 defined small-scale fisheries based on the value and/or volume of fishery landings
(DFO-CSAS 2018). In fact, many small-scale fisheries are quite large, in terms of number of
participants and catch (Béné, Macfadyen, and Allison 2007). A further obstacles to the uptake of
‘small-scale fisheries’ term in Canada is that it is often treated as synonymous with artisanal
fisheries (Chuenpagdee et al. 2006), and few fisheries in Canada could be considered artisanal.
This does not mean that small-scale fisheries are not widespread in Canada, particularly given
that the defining characteristics fundamentally are not about the size of the vessel or the size of
the fishery, but rather about the social and cultural linkages that exist between these fisheries and
coastal communities (Urquhart, Acott, and Sanghera 2014; van Ginkel 2001; Acott and Urquhart
2014; Brookfield, Gray, and Hatchard 2005).
The term that is more generally used in Canada to refer to small boat, independent, owner-
operator dominated fisheries is ‘inshore fleet’, which is also widely used in Europe and is
roughly analogous to the broader conceptualizations of ‘small-scale fisheries’. In Atlantic
Canada, the fleet division was formalized with the 1979 fleet separation policy, which separated
the harvesting and processing sectors in the inshore fisheries. The use of ‘inshore’ to delineate
the different fleets in Canada was entrenched in legislation with amendments to Canada’s
Fisheries Act completed in 2019. The amendments included the addition of a provision to the
section on ‘considerations for decision making’ that the Minister may consider “the preservation
or promotion of the independence of licence holders in commercial inshore fisheries”. ‘Inshore’
has not been defined within the Act and the accompanying regulations apply only to Quebec and
Atlantic Canada, leaving open the question of how to define ‘inshore fleet’ for BC fisheries.
13
The Geography of Inshore Fishing and Sustainability project addressed the issue of defining
‘inshore’ in the European context, considering usage of the term in different European countries,
and identified a range of factors used, including vessel length, distance from shore, engine power
and gross tonnage (Urquhart, Acott, and Sanghera 2014). In the policy for Preserving the
Independence of the Inshore Fleet in Canada’s Atlantic Fisheries (PIIFCAF), ‘inshore’ is defined
as “the fishing sector where fish harvesters are restricted to using vessels less than 19.8m (65')
Length Over All (LOA), and in the Newfoundland and Labrador Region, where fish harvesters
may be permitted to use a vessel less than 27.4m (90') LOA when specific conditions are met”
(DFO 2007b). The Atlantic Canada inshore fleet definition can be reasonably applied in BC,
with only a few adjustments needed to account for differences in the licencing systems. Licence
length limitations in the BC fisheries are not by fishery but by individual licence, being based on
(1) length of vessels that received licences at the time of licence limitation, and (2) increases to
licence length through the stacking and marrying of licences, which could allow for licence
lengths to increase by up to 30% (DFO 2019a). If you consider the fisheries based on the
dominant licence lengths within the fisheries, most fisheries in BC based on a 65' (19.8m) cut-off
would qualify as inshore fisheries, with the exceptions being the groundfish trawl fishery and the
salmon seine fishery. While the herring seine fishery licences do not have individual vessel
length restrictions, the herring seine fishery has similar historical corporate ownership and gear
that would qualify it in the same category as the trawl and salmon seine fisheries. The sablefish
fishery average length is below the cut-off, but has both large and small vessels, consistent with
the historical development of this fishery that encouraged both large corporate and small
independent ownership. In all other fisheries, the fishery can be reasonably considered to be
inshore, consistent with the characterization of inshore in other parts of the world, including

14
ownership (independent, owner-operator), home ports (distributed widely throughout coastal
areas), and scale of enterprises (owner-operator, at a scale that can be operated by a single owner
or small family group).
1.5 Overview of the BC Groundfish Fishery
The BC groundfish fisheries are highly diversified with six licence types, seven distinct fisheries
(Table 1.1), a complex management history, and vessels ranging in length from less than 5 m to
greater than 55 m. The vessels in the fleet range from very small rod and reel vessels, through
mid-size hook and line vessels, to large scale factory processor trawlers. The fisheries
substantially contribute to BC’s economy and employment base with over 200 vessels
participating in the groundfish fisheries annually.
The BC groundfish fisheries were integrated in 2006 through the Commercial Groundfish
Integration Pilot Project (CGIPP) (CIC 2005; DFO 2006). CGIPP was a response to concerns
about discard of non-directed (bycatch) catch, particularly of inshore rockfish. Under CGIPP:
ITQs were introduced to the hook and line rockfish, dogfish and lingcod fisheries; all groundfish
vessels were required to have either an electronic monitoring camera or an observer on board
every trip; all rockfish catch had to be landed (discarding of rockfish – which has a near 100%
discard mortality – was not permitted); all catch had to be recorded and mortality of
‘marketable’1 ITQ species covered by quota acquired by the fisherman; and, quota transferability
between the commercial groundfish sectors was instituted on a limited basis. The individual
1 The meaning of marketable is identified in the Integrated Fisheries Management Plans for the groundfish fisheries
and is not analogous to legal size or market acceptability.

15
fisheries maintained their autonomy through this process, with the capacity to set limits on the
amount of quota that left the sector (for example, the halibut fishery could set limits on how
much halibut quota could be leased out of the halibut fishery to other fisheries to cover its non-
directed catch of halibut). As well, each fishery established its own internal limits for its fishery,
such as trip limits and annual non-directed quota caps to manage individual access to non-
directed quota. The actual acquisition of quota, for both directed and non-directed catch,
continued to be on the unregulated quota market, with individual fishermen or processors
responsible for finding and leasing quota to cover catch.
Table 1.1 Characteristics of the BC commercial groundfish fishery sectors, including the year licences were
limited, the total number of limited licences, the year that the dockside monitoring program (DMP) was
introduced, and the year that ITQs were introduced (DFO 2008a; 1991; 1999c; 1998a; 1999b; 1993).
Fishery Gear Licence Limited
Licence
# of
Licences
DMP ITQ
Groundfish
Trawl
bottom or mid-water
trawl
T & FT 1976 142 1994 1997
Sablefish longline trap or hook K & FK 1980 48 1990 1990i
Halibut hook and line L & FL 1979 435 1991 1993ii
Rockfish –
Outsideiii
hook and line ZN(O) &
FZN(O)
1992 183 1995 2006
Rockfish –
Insideiii
hook and line (jig) ZN(I) &
FZN(I)
1991 74 1995 2006
Dogfish hook and line Schedule II iv - >2000 1996 2006
Lingcod hook and line (gang
troll or jig)
Schedule II iv - >2000 1996 2006
i full by the pound transferability introduced in 1995, permanent transferability in 2000 ii individual quotas introduced in halibut in 1991, limited transferability in 1993, and full transferability, unlimited
by the pound temporary and permanent, in 1999 iii Inside refers to the inside waters, where the fishery is located, between Vancouver Island and mainland British
Columbia. Outside refers to the outer waters of British Columbia.
iv the dogfish and lingcod fisheries do not have fishery-specific limited licences. They can be fished on any vessel
with ‘schedule II’ privileges, which all commercially licenced fishing vessels in BC have.

16
1.6 Thesis overview and scope of the study
This thesis contains four main research chapters, chapters 2-5. The overall objective for the
research was to address social and economic outcomes for the small boat / inshore groundfish
fisheries. Due to data limitations and to scope the research appropriately, I focused my research
on the halibut fishery. The halibut fishery is the largest and most valuable of the small boat
groundfish fisheries, and has fishery and data characteristics that lent themselves well to the
investigation, including full utilization of the total allowable catch in each year, a low carryover
amount (10%) – whereby a percent of the uncaught quota could be carried over into the
following years – and a high quota value incentivizing full usage of quota. Furthermore, due to
the integration of the small boat groundfish fisheries in 2006, the small boat groundfish fleet is
largely a single fleet, with common vessel characteristics across five of the seven fisheries
(excepting the trawl and inside rockfish fisheries), albeit with a number of different fishing
patterns employed across the fleet.
In Chapter 2, I construct an ownership database for the Pacific halibut fishery in BC through
aggregation of datasets received from DFO, supplemented with additional data sources, to
examine changes in the ownership profile of the BC Pacific halibut fishery over a 25-year period.
I consider who owns the quota, including to what extent the owners of quota fish or lease out
quota, and if there is an enduring impact of being an initial grantee of quota.
In Chapter 3, I use the same ownership database constructed for Chapter 2 and extend it to
consider the extent to which processors exercise control over the halibut quota market through

17
leasing. I develop a network analysis to visualize the role of processors in the quota lease market
and consider issues of power dynamics and the role of government in managing markets.
In Chapter 4, I construct a financial enterprise model based on accounting principles for
evaluating revenue, costs and income to assess the impact of quota ownership and leasing prices
on the financial performance of owner-operator halibut vessels. In the absence of detailed costs
and earnings data for the fleet, I use available data to determine relative and generalized financial
performance metrics under different leasing arrangements for a hypothetical fishing enterprise.
In Chapter 5, I provide an overview of measures that can be used to transform an established
fishery licencing system to achieve socio-economic objectives. I consider issues related to
equitable distribution and process for ensuring a just and fair approach to fisheries
transformation.
In scoping this study, I recognized the importance of Indigenous access and rights issues to
questions related to social and economic outcomes of fisheries in BC. This is an important aspect
of the fisheries and one deserving of study and consideration. However, this was not a central
focus of my research, which was concerned with the functioning of the ITQ groundfish fisheries
and implications for fisheries participants, as identified through a research co-construction
process with fisheries representatives. The database compiled for this research can be used to
consider, in part, issues related to First Nation ownership, access and participation, although
additional research approaches would also be warranted to fully address this issue, including
interviews and research co-construction with First Nation representatives. I determined that the
18
focused and dedicated consideration that the important issue of First Nation access and rights
deserves was beyond the scope of this research project, particularly as it would require the use of
very different methodological approaches than was planned for this project and the development
of a number of research partnerships to ensure that the research met best practices with respect to
representation and participation (Assembly of First Nations 2009; University of Victoria 2003).

19
Chapter 2: Rise of the Investor Class in the British Columbia Pacific Halibut
Fishery
Individual transferable quotas (ITQs) have been promoted as a management approach to address
many of the economic and conservation challenges encountered in fisheries. ITQs are expected
to improve fishery outcomes based on assumptions about who owns the quota, how ownership is
transferred, and how ownership incentivizes environmental stewardship. Changes in the
ownership profile of the British Columbia Pacific halibut fishery were examined over a 25-year
period. This analysis revealed that, despite the halibut fishery traditionally being an owner-
operator fishery, with owner-operators owning and catching 90% of the halibut in 1991, owner-
operators have been increasingly marginalized in the fishery, catching 45% of the halibut in 2016
while owning 15% of the quota. The original grantees of quota from 1991 continue to own over
half of the quota, and original grantees comprised half of the owner-operators active in the
fishery in 2016. However, these original grantees have been steadily becoming a new investor
class, non-existent in 1991, alongside new investors who have bought into the fishery as a source
of income from leasing. A new dynamic has emerged in the fishery, with the separation of quota
ownership from fishing operations. This raises questions about the assumptions underpinning the
rationale for ITQs as an efficient market-based mechanism for fishery management and as a
means to improve stewardship incentives. Also questionable are the equity, the long-term
viability, and the objectives this fishery is serving with this new ownership structure.

20
2.1 Introduction
Individual transferable quotas (ITQs) are permits allowing the holder of the ITQ to catch or
transfer a share of a total allowable catch (TAC). ITQs have been promoted as a solution to
numerous long-standing issues in fisheries and credited with a number of improvements where
fisheries have become ITQ-managed (Branch, Rutherford, and Hilborn 2006; Casey et al. 1995;
Grafton 1996; Grafton et al. 2006; Grimm et al. 2012; McRae and Pearse 2004). The rationale
for ITQs rests on a number of assumptions. ITQs are assumed to promote the equitable transfer
of access rights to the most efficient operators, through a market-based mechanism that
compensates existing access holders while providing incentives for the most efficient operators
to purchase access rights (Arnason 2012; Newell, Sanchirico, and Kerr 2005). ITQs are assumed
to align economic and conservation objectives by creating a clear and direct link between long-
term stock productivity and resource rents, which is then expected to motivate fishermen to act
as stewards (Lubchenco et al. 2016; Grafton, Nelson, and Turris 2006; Berkes et al. 2006;
Hanna, Folke, and Mäler 1995; Grafton et al. 2006). ITQs are assumed to maximize economic
rent, reduce over-capitalization, and generally lead to safer and more sustainable fisheries
(Moloney and Pearse 1979; Pfeiffer and Gratz 2016). As per Coase (1960), for markets to be
effective and efficient in the trading of property rights, they must meet the following conditions:
(1) no wealth or income effects from the initial allocations of rights, (2) perfect information
among all parties, (3) low transaction costs, and (4) a well-functioning capital market. ITQs are
generally acknowledged to have enforcement issues related to discards and quota busting and
have negative consequences for the equitable distribution of benefits, employment, fisheries-
related services and infrastructure, and intergenerational access (Copes 1986; Copes and Charles
2004; Ussif Rashid Sumaila 2010; McCay 2004; Pálsson and Helgason 1995; Pinkerton and

21
Edwards 2009), although these negative consequences are frequently ignored or downplayed (see
Brandt 2005; Symes and Crean 1995 as examples).
There is growing evidence that challenges the efficacy of free-markets to achieve optimal
outcomes (Hahnel and Sheeran 2009). Bromley (2009) critiqued the economic theory
underpinning individual fishing quotas (IFQs), identifying “manifold contrivances” with
reference to the supposed “magic of IFQs” (p. 289). Parslow (2010) demonstrated that the
possession of an ITQ does not in fact provide an incentive for stewardship at the individual level.
McCormack (2017) demonstrated that the sustainability being achieved through ITQs in New
Zealand is concerned with sustaining the income stream of quota holders. Emery et al. (2014)
identified how quota leasing can result in safety compromises. Szymkowiak and Himes-Cornell
(2017) noted that even where active participation measures are in place, strong incentives for
quota shareholders to retain their fishing privileges in high earning fisheries can lead to
participants actively seeking to exploit loopholes. Szymkowiak and Felthoven (2016) explored
the distributional consequences of leasing and initial quota allocations. Van Putten and Gardner
(2010), in considering the Tasmanian Rock Lobster fishery, noted that the industry was
characterised by a growing number of investors. Van Putten et al. (2014) concluded that there
was insufficient evidence to attribute improved environmental outcomes to changes in
stewardship ethics arising from ITQs. Many of the assumptions underpinning ITQs have already
been shown not to hold for the BC halibut fishery (Pinkerton and Edwards 2009). Despite this,
ITQs and market-based approaches more generally continue to enjoy the support and
endorsement of the management agency in Canada directly and through commissioned reports
(McRae and Pearse 2004; Munro et al. 2009; Nelson 2011; DFO 2012c) and there is significant

22
resistance to the introduction of measures to ameliorate the negative outcomes of the ITQ system
(DFO 2019b).
This chapter is part of a larger project to assess the state of the groundfish fisheries in British
Columbia, with a focus on the small-boat fleet and impacts of the ITQ management system. In
this chapter, changes in ownership in the British Columbia Pacific halibut fishery over a 25-year
period, from 1991 when individual vessel quotas were initially allocated to 2016, were assessed
to answer the questions:
1. Who owns the quota – to what extent are the owners of quota the fishing enterprise
operators?
2. Is there an enduring impact of being an initial grantee of quota?
2.1.1 Background on the British Columbia halibut fishery
This assessment of the changes in the ownership structure of the halibut fishery under ITQs is
grounded in the stated objectives for fisheries in Canada and the BC halibut fishery specifically.
The Government of Canada is mandated to safeguard the interests of Canadians in managing
fisheries as a common pool resource (Fisheries Act (R.S.C., 1985, c. F-14) 1985). Fisheries are
expected to be managed to meet a full spectrum of socio-economic objectives, including benefits
to adjacent communities, maintenance of small boat independent fleets, and distribution of
benefits amongst participants (Stephenson et al. 2018). The document that established national
fisheries policy in Canada for the modern era is the 1976 ‘Policy for Canada’s Commercial
Fisheries’ (Government of Canada 1976), which stated that “the guiding principle in fishery
management no longer would be maximization of the crop sustainable over time but the best use

23
of society’s resources. ‘Best use’ is defined by the sum of net social benefits (personal income,
occupational opportunity, consumer satisfaction and so on) derived from the fisheries and the
industries linked to them” (p. 53). These objectives have been affirmed in legislation (Oceans
Act (S.C., 1996, c. 31) 1996) and policy (DFO 1999a; 2018a). Past Fisheries Ministers have
affirmed that fisheries in Canada are meant to provide a good living for the people in the industry
(D. Anderson 1998), where the benefits of the fishery go to those who work hard to prosecute it,
and the communities that support them (LeBlanc 2017). A common management objective that
has also been explicitly identified for the halibut fishery is the stability and viability of the fleet
(DFO 1999a; 1990). It is against these objectives that the state of ownership in the halibut fishery
is considered.
Canada’s Pacific halibut fishery is one of the highest valued fisheries in BC, with $58.3 million
in landed value and $93 million in wholesale value in 2016 (Province of BC 2017). Since 1933,
the BC halibut fishery has been managed by the International Pacific Halibut Commission
through which the US and Canada jointly conduct stock assessment, regulate gear, set fishing
seasons, and set the total allowable catch (TAC) for the management areas, of which British
Columbia is one area. Since 1991, the halibut TAC has ranged from a high of 13 million pounds
(5897 t) in 1998 to a low of 5.3 million lb (2404 t) in 2018. The stock is determined to be not
overfished and not subject to overfishing (IPHC 2018). While the TAC is at a more than 25-year
low, market demand has been strong and landed prices almost doubled between 2004 and 2018.
The halibut fishery was one of the first individual transferable quota (ITQ) fisheries in Canada
and has been frequently cited as an example of successful ITQ fisheries management (McRae

24
and Pearse 2004; Grafton, Nelson, and Turris 2006; Munro et al. 2009). Limited licences were
introduced in British Columbia in fall 1968 for the 1969 fishing year, with the creation of three
types of licences – two types of salmon limited licences (‘A’ and ‘B’ licences) that also included
all other fisheries and a non-salmon (non-limited) licence (‘C’) that permitted fishing of all other
species but not salmon (Gough 2008). The ‘C’ licence was subsequently limited in 1977. Halibut
could be fished by holders of any of these licences. The separate halibut limited ‘L’ licence was
established in 1979, based on catch history in 1977 and 1978, with 435 ‘L’ licences created. By
1989, with increasingly short seasons and rising concerns about overcapacity in the fleet, the
management agency had conceded that entry limitation had not achieved the desired results
(DFO 1990). Although there were other options that could have been explored (Pinkerton 2013),
the management agency had a very positive view of the potential of ITQs and focused their
efforts on securing industry support for individual quotas (DFO 1990).
The halibut fishery was transitioned to an individual quota fishery in 1991 and an individual
transferable quota fishery in 1993. Quota were allocated to halibut licences in 1991 based on
licence length and catch history. Full and unlimited transferability, including permanent
transfers, was established in 1999. Each ‘L’ licence is required to hold a minimum of 0.01149%
of the TAC. A maximum of between 1% and 1.25% of the TAC can be held on a licence,
depending on its fishing history. These restrictions apply to the individual licence only.
In contrast to the Alaska Pacific halibut fishery and many Canadian East Coast fisheries, the BC
halibut fishery has no fleet separation, owner-operator, or ownership concentration restrictions.
The absence of restrictions should not be interpreted as an indication that the role of owner-

25
operators in Canada’s Pacific fisheries was somehow less prominent or valued than in Canada’s
Atlantic fisheries. As noted in the 1976 national fisheries policy (Government of Canada 1976),
the Canadian fishing fleet historically was a small-craft fleet, and most were owner-operated. A
robust, independent small boat owner-operator fleet was valued for providing employment and
the wide distribution of socio-economic benefits to fishing communities all along the coast
(Canadian Council of Professional Fish Harvesters 2002). Whereas fleet separation (no
ownership by processors of the small boat licences or vessels) and owner-operator policies were
implemented in Atlantic Canada in 1979 and 1989 respectively, in BC the prevailing view within
the management agency at that time was that these policies were not needed as the small boat
fleet in BC was owner-operator dominated and independent of overt corporate ownership
(Government of Canada 1976; Gough 2008). In 1974, Maury Houghton, Manager of Special
Programs, Fisheries and Marine Services, Department of the Environment, observed that “as far
as capitalization or ownership goes, in British Columbia we have never had the ownership in the
hands of the fishermen to a greater degree than it is right now” (Mundt 1974, 46). The extent of
corporate control was regularly evaluated through the 1970s and remained under the 12% cut-off
that would have triggered government action (Mundt 1974). By the time corporate ownership,
vertical integration and leasing was becoming more widely acknowledged in BC fisheries,
particularly in the herring and salmon fisheries, the management agency was fully supporting the
adoption of market based mechanisms such as ITQs as a ‘no cost/low cost’ solution to address
overcapacity (DFO 1990; Canadian Council of Professional Fish Harvesters 2002; Cruickshank
1991). In recent years, there have been efforts to re-cast the history of BC fisheries as corporate
dominated to diminish the historical role of owner-operators and negate calls to maintain the
viability and independence of the small boat fleet in this region of Canada (BC Seafood Alliance

26
2019b; 2019c). When the entrenchment of owner-operator and fleet separation policies in
regulation was proposed in 2019 following adoption of enabling amendments in the national
Fisheries Act (Fisheries Act (R.S.C., 1985, c. F-14) 1985), the approach taken by the government
was to make these provisions apply only to the Canadian Atlantic fisheries, despite their origin in
national policy (Government of Canada 1976) and calls to legislate a coherent national approach
to owner-operator and fleet separation applicable across Canada (Canadian Council of
Professional Fish Harvesters 2019).
As part of government efforts to repatriate fisheries access to First Nations people, the First
Nation communal licence ‘F’ designation was created and the Government of Canada has been
purchasing ‘L’ licences and quota and transferring them to the ‘FL’ designation since the 1990’s,
with the first ‘FL’ licences created in 1997. There were 76 ‘FL’ licences identified in 2018 with
combined quota totalling about 16% of the TAC. The Government of Canada retains ownership
of these licences and issues the licences and quota annually to First Nation organizations for their
use within the commercial halibut fishery. It is at the discretion of the First Nation organizations
how those licences and quota are then used. Disposition of licences and quota each year can
range from being fished by First Nation members, leased to non-members that employ members
as crew while also generating lease revenue for the organization, and leased to the highest bidder
to generate lease revenue.
Initial outcomes of the transition to ITQs in halibut were viewed as largely positive, with a
longer fishing season than had existed after the layup system (see Pinkerton 2013) was
abandoned in the mid-1970s, higher landed price, and lower fishing costs (EB Economics 1992).

27
In more recent years, however, fisheries participants, observers and other stakeholder interests
have raised concerns, citing excessively high lease prices, diminishing financial returns for
fishing enterprises, an aging fleet and workforce, failure to attract new entrants, inequitable
distribution of benefits and questionable societal benefits from the resource (Nuu-chah-nulth
Tribal Council 2005; United Fishermen and Allied Workers’ Union 2005; Ecotrust Canada 2009;
Pinkerton and Edwards 2009; Davidson 2010; Canadian Council of Professional Fish Harvesters
2018). It was these concerns, in light of the stated objectives for the fishery, that prompted an in-
depth investigation of the halibut fishery in BC.
2.2 Methods
An ownership database for the Pacific halibut fishery in BC was constructed through analysis of
three datasets from the management agency, Fisheries and Oceans Canada (DFO), supplemented
by the Statistics Canada Inter-Corporate Ownership historical databases, BC Provincial
Corporate Registry Services records, BC provincial processor licence lists, the Transport Canada
ships registry and online searches including court proceedings, address directories, fisheries
advisory process documents and meeting attendance lists. Input was also received from BC
fishermen active in the halibut fishery, facilitated through the Canadian Fisheries Research
Network – a six-year research network funded by the Natural Sciences and Engineering
Research Council of Canada (NSERC) that brought together academia, industry and government
to undertake collaborative research on fisheries in Canada.
28
All halibut weights are expressed as ‘dressed head off’ weight, in pounds, as per the management
and industry standard. The conversion factor for round to ‘dressed head off’ is 0.75. For weight
conversion, one tonne is equal to 2204.6 pounds.
Edwards and Pinkerton (2019c) provide a detailed overview of the three datasets that were used
for the analysis: (1) licence/vessel ownership, (2) quota transactions administrative records, and
(3) quota allocations. These datasets include licencing data by vessel, where vessel ownership is
a proxy for licence ownership, all temporary and permanent quota transfers, and the quota
allocated to each licence.
2.2.1 Assigning Beneficial Ownership
Beneficial owners are those who receive the benefits from ownership, such as the financial
benefits from lease fees and the power and influence that comes with owning a valuable asset.
There are no requirements in BC for the beneficial ownership of licences or of companies to be
declared. To determine beneficial ownership, a detailed analysis was conducted of DFO licence
ownership lists and of the BC corporate registry to identify parent companies and the individuals
associated with those companies. This analysis built on work assessing corporate concentration
in the BC salmon and herring fisheries (Haas, Edwards, and Sumaila 2016), extending this
approach to identify individuals associated with companies. Halibut ‘L’ licences are ‘vessel-
based licences’, meaning that the licence is associated with a vessel and not an individual. The
management agency does not track ownership of the licence, only ownership of the vessel with
which the licence is associated. Vessel ownership was used as a proxy for licence ownership and
by extension quota ownership, as vessel ownership is the only source of quota ownership
29
information available and consistent with the practice of the management agency. Vessels can
have multiple owners, of which one is listed as the contact owner for the licence. The contact
owner is treated as the ‘primary’ owner and the remaining owners are considered ‘secondary’
owners. Beneficial ownership was assigned based on the primary/contact owner.
As a consequence of how ownership is tracked based on vessel ownership, licence ownership
can be obscured by licence leasing, whereby a licence is transferred to the lessee’s vessel. The
BC halibut fishery, as with all the BC groundfish fisheries, is managed to facilitate temporary
leasing of quota, but not of licences. Quota can be transferred between licences on a temporary
basis through requests submitted to the management agency, with no impact on recognized
ownership or permanent allocation. In contrast, there is no temporary transfer mechanism for
licences – all transfers between vessels are considered permanent by the management agency.
Licence leasing is a regular occurrence, though the incidence of licence leasing is low. More than
200 halibut licences are not fished, with the quota on those licences leased to others to fish each
year. The purchase price of a halibut licence is a small fraction of the cost to purchase a
significant amount of quota (Edwards 2019). The lease value of the halibut licence itself is low.
Coupled with complications associated with moving licences onto already licenced vessels and
licence length restrictions, few fishing enterprises rely on leased licences.
To enable consideration of ownership over time, names were standardized across the years,
addressing differences in punctuation and name abbreviations. Beneficial ownership was
determined for halibut licences in four years across a 25-year span: 1991, 1996, 2006 and 2016.
These years include the first year of individual (non-transferable) vessel quotas (1991), the last

30
year for which a full dataset was available (2016), and interim years at 10-year intervals.
Beneficial ownership was identified through a combination of: purchasing access to individual
company annual reports and corporation summaries from the Province of BC through the online
BC corporate registry, from which directors and officers of companies and addresses of
individuals were identified; comparing addresses for individuals and companies as listed in the
public vessel registry and public listings online; and conducting a search for declarations of
affiliation in public documents such as DFO integrated fisheries management plans and
International Pacific Halibut Commission meeting minutes. Intra-family transfers were treated as
a continuation of ownership. When an individual was a partner in multiple companies, ownership
was assigned to the dominant individual, based on declared contact information, role in the
company (e.g., president), history with the licence, disposition of the licence, and assets
contributed to the company. When individuals had multiple overlapping and individually held
assets, ownership was assigned to a single jointly owned entity. When a company was purchased
by a new owner, which is uncommon except among processing companies, this was treated as
discontinuous ownership. From an initial list of just under 950 owners, name standardization
yielded a list of just under 800 unique owners, from which 625 unique primary beneficial owners
across the four years considered were identified.
2.2.2 Categorizing Halibut Licence and Quota Ownership
A halibut licence holder is the designated contact (primary) owner of a halibut licence. All
halibut licences have quota associated with the licence, ranging from 0.01149% of the halibut
TAC (706 lb [320 kg] in 2016) to just under 1.25% of the TAC (75,800 lb [34,383 kg] in 2016).
The owner of the licence is also the owner of the quota on the licence. There are five categories

31
of ownership identified in this analysis: owner-operated fishing enterprises, corporate fishing
enterprises, First Nation communal, processors and investors. Owner-operators fish their vessel
and quota, and frequently lease quota from other categories to fish (Figure 2.1). Corporate
fishing enterprises own vessels that are fished by hired skippers, that fish the company owned
quota as well as quota leased from others. The degree of participation in the fishery by First
Nation communal licence holders and processors varies. First Nation communal licences and
quota can be fished by First Nation members on their own vessels, fished by hired skippers, or
leased outside the First Nation. Some processors maintain their own fleet operated by hired
skippers while others do not participate in the fishery. Investors, by definition, do not participate
in the fishery, leasing their quota to others to fish.
Figure 2.1 Degree of halibut fishery participation, from high (operates vessel) to no participation (quota
lessor) by licence holders in the different ownership categories.
Halibut quota and licence ownership were categorized according to the following criteria:
1. Owner-operated fishing enterprises – the individuals and companies that own a vessel
and licence that the beneficial owner of the licence, or a close family member of the
beneficial owner, personally fishes (DFO 2019c)2. They may have multiple vessels
2 BC does not have an owner-operator policy nor an official definition for owner-operator. The definition of owner-
operator used here is generally consistent with the owner-operator definition entrenched in Atlantic Canada owner-

32
and/or licences, but only to an extent which can be reasonably operated by a single
owner. This category does not include ‘FL’ licences.
2. Corporate fishing enterprises – fishing companies that own halibut licences that are
fished, but are not owner-operated. This category includes former owner-operators that
have retained their vessel but no longer fish it themselves, which can be an intermediate
state from shifting from being an owner-operator to being an investor. This category also
includes owners that have never been participants in the fishery themselves but have
invested in boats, licences and quota for others to fish. To be included in this category, a
licence owner had to have a halibut licence that was fished in the year, and to meet at
least one of three criteria. The first criterion is that the owner must have a high degree of
vessel and/or licence ownership, which a single owner could not reasonably fish
personally. This was determined, based on observation and discussion with fishery
participants, to be more than 2 halibut ‘L’ licences, or more than 1.25% of the halibut
quota, or more than 4 licenced fishing vessels, or more than 9 fishing licences from the
following licence types: halibut (L), sablefish (K), rockfish (ZN), trawl (T), shrimp (S),
crab (R), prawn (W), herring seine (HS), salmon (A, AT, AG, AS, AR, AC) and herring
gillnet (HG), where HG licences were treated as equivalent to one-third of a licence. The
second criterion is that the licence is leased to another fishing enterprise in the year, as
determined by a review of ownership patterns for individual licences as well as
operator policies, adapted to the BC context. For the Atlantic Canada inshore fleets (comprised of the small boat,
independent, owner-operator vessels), licences are issued in the name of an individual fish harvester, the licence
holder is required to actively fish their licence personally (with a few exceptions), and unless “grandfathered” by
DFO, fish harvesters are only permitted to hold one licence for a given species. In BC, many licences, including
halibut, are issued to a vessel rather than an individual and many fishermen have incorporated companies for tax
purposes.

33
information provided by fishery participants. The third criterion is that the owner hires a
skipper to fish the licence and vessel, as determined by information provided by fishery
participants.
3. First Nation communal – licences that are held communally by a First Nation government
or organization (e.g., economic development organization, not-for-profit). Most of the
licences within this category are ‘FL’ licences, which are dedicated First Nation
communal licences that are permanently held by DFO for use by First Nation
governments and organizations. This category also includes regular ‘L’ licences owned
by First Nation governments or organizations. Licences and quota held by First Nation
organizations can be fished by First Nation members or leased to non-member processor,
corporate or owner-operated fishing enterprises.
4. Processors – companies that purchase halibut from fishing enterprises to process and sell
in the wholesale or retail market. They own quota that is either fished by hired skippers
on a processor owned vessel or leased to another processor, corporate or owner-operated
fishing enterprise. Licences for which processors have a leasing arrangement or other
affiliation are not included in this category – only those licences that are directly owned
by processors are classified as processor-owned licences.
5. Investors – companies and individuals that own halibut licences that are not fished and
quota that is leased to processor, corporate or owner-operated enterprises to be fished.
This includes former fishing enterprises that no longer fish halibut but have retained their
halibut quota to lease to others. The focus for this analysis is on the halibut fishery.
Whether or not investors participate in fisheries other than halibut was not evaluated.

34
The dynamics of ownership changes are illustrated through alluvial diagrams below (Figure 2.3
and Figure 2.4), which were drawn with ‘ggAlluvial’ (Brunson 2018) in R version 3.5.2 (R
Development Core Team 2019).
2.2.3 Original Quota Grantees and New Entrants
To assess the extent to which the initial allocation of quota continues to be reflected in quota
ownership in 2016, the time period during which owners first owned a halibut licence in the
1991 to 2016 period was identified. Owners who owned licences and were the recipients of quota
grants during the quota allocation in 1991 were termed ‘original grantees’. Owners that were not
‘original grantees’ and purchased licences and quota after 1991 were termed ‘new entrants’, and
their entry period determined to be one of: 1992 to 1996, 1997 to 2006, or 2007 to 2016,
corresponding to the years for which beneficial ownership data was available (1991, 1996, 2006
and 2016).
2.2.4 Valuing Quota
The value of quota held by the different categories of owners was calculated, in terms of both
annual lease value and purchase price. Lease and purchase prices for 1998 to 2000, 2002, and
2004 to 2016 were taken from values reported in annual valuation reports commissioned by DFO
(Castlemain 2018; Nelson 2000; 2007; 2005). Prices for 1991 to 1997, 2001 and 2003 and
supplementations to valuation report prices were compiled from industry trade publications (e.g.,
Westcoast Fisherman magazine) and input from industry informants. Prices, including those
from valuation reports, are based on a limited sample and are an estimated average price and not
a true average, as there is no comprehensive tracking or reporting of quota lease and purchase

35
prices. All values are in constant dollars, having been corrected for inflation to the 2016
equivalent.
2.3 Quota ownership and the emergence of an investor class
The halibut fishery was traditionally an owner-operator fishery. Even after limited licencing was
introduced in 1979, processors and larger fishing companies had only a minor presence in the
fishery, accounting for less than 10% of licences and catch. The investor class was non-existent
prior to ITQs. With 435 licences participating in a competitive time-limited fishery, there was
only a very limited market for leasing a licence, with costs being low. This limited the incentive
for the purchase of licences to lease to others. The fishery transitioned from a limited licence
fishery to an individual quota fishery in 1991. For the first two years, the quota was not
transferable. In 1991, owner-operated fishing enterprises owned and caught just over 90% of the
halibut quota (Figure 2.2). With transferability in 1993, a new category emerged – that of the
investor who owns a licence and quota, but does not fish the licence and leases out the quota to
others to fish. ITQs provided a means to monetize the access privilege for each pound of fish
caught. Investors owned 43% of the halibut quota in both 2006 and 2016, up from 0% in 1991
and 23% in 1996. The processor, First Nation communal, investor, and corporate fishing
enterprise all increased their ownership of quota from 1991 to 2016. For owner-operators, the
pattern over time has been a continuous diminishment. Owner-operators still contributed nearly
half of the catch in 2016 (45%), but their ownership of quota fell from 90% in 1991 to 15% in
2016. Owner-operators increasingly lease the majority of the quota that they catch. Corporate
fishing enterprises accounted for just over one quarter of the catch in 2016, up from 4% in 1991,

36
indicative of the concentration of ownership and corporatization of the fleet since the
introduction of ITQs.
Figure 2.2 The percent of halibut quota caught and owned by each of the five categories in each of the four
years considered.
An examination of the flow of licences between the ownership categories provides insights into
how the ownership profile of the fishery has been changing over time (Figure 2.3). There were a
set number of licences (435) established at the time of licence limitation in 1979. The owner-
operator licences, which comprised the vast majority of licences in 1991, have been the primary
source for licences in the categories that grew – notably the corporate fishing enterprises,
investor and processor categories. During the period of highest growth for the First Nation
communal licences, between 2006 and 2016, the majority of licences came from the investor
category. The flow of licences has been dynamic, with movement of licences between all
categories, but ownership overall has been stable with the majority of licences remaining within

37
their ownership category from one time period to the next. Changes between categories arise for
one of two reasons: (1) owners continuing to own the licence but changing categories, such as
owner-operators becoming investors; and, (2) owners selling their licences to new owners in
different categories, such as the sale of owner-operated or investor licences into the First Nation
communal category.
Figure 2.3 Mapping the changes in ownership category for each licence in the halibut fishery.
An examination of the flow between the ownership categories provides further insights into the
drivers of ownership change within the fishery (Figure 2.4). The proportion of new entrants that
have been entering directly into the investor category has been increasing over time. The large
majority of new entrants after 1996 entered the investor and First Nation communal categories.
The proportion of new entrants entering into the owner-operator category has been decreasing,
accounting for 64% of the 78 new entrants in the period between 1991 and 1996 and 11% of the
62 new entrants between 2006 and 2016. The new entrant owner-operators own almost no quota,
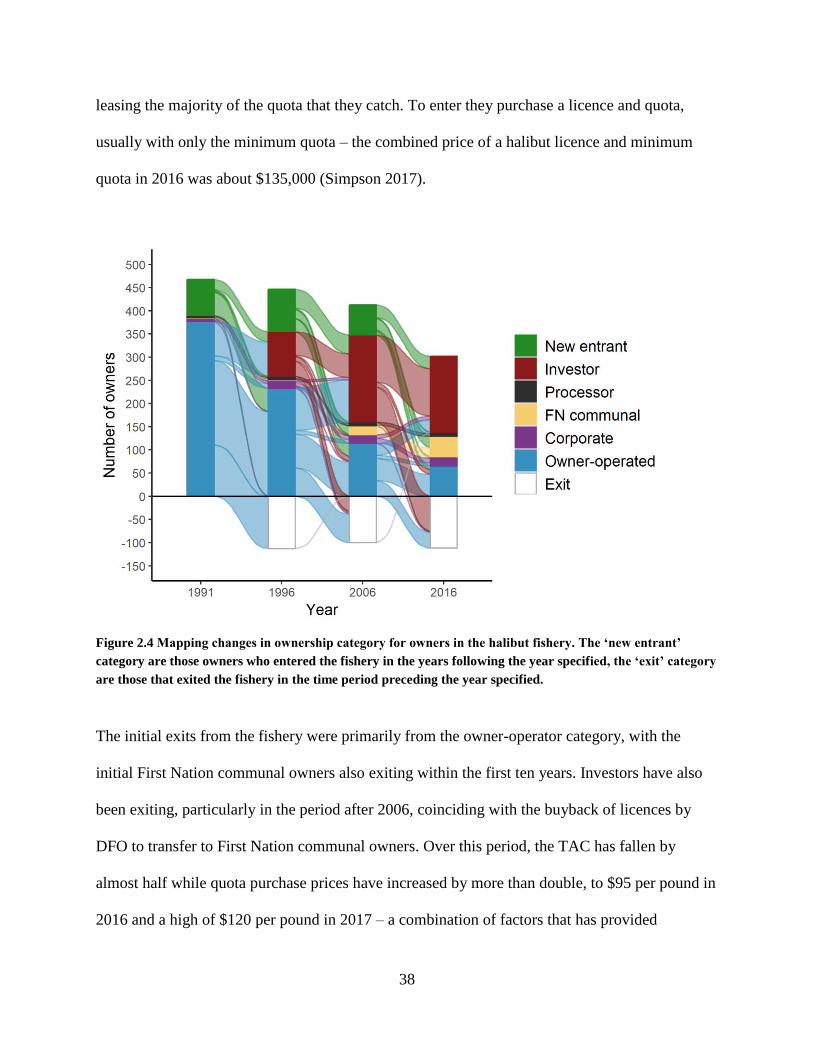
38
leasing the majority of the quota that they catch. To enter they purchase a licence and quota,
usually with only the minimum quota – the combined price of a halibut licence and minimum
quota in 2016 was about $135,000 (Simpson 2017).
Figure 2.4 Mapping changes in ownership category for owners in the halibut fishery. The ‘new entrant’
category are those owners who entered the fishery in the years following the year specified, the ‘exit’ category
are those that exited the fishery in the time period preceding the year specified.
The initial exits from the fishery were primarily from the owner-operator category, with the
initial First Nation communal owners also exiting within the first ten years. Investors have also
been exiting, particularly in the period after 2006, coinciding with the buyback of licences by
DFO to transfer to First Nation communal owners. Over this period, the TAC has fallen by
almost half while quota purchase prices have increased by more than double, to $95 per pound in
2016 and a high of $120 per pound in 2017 – a combination of factors that has provided

39
sufficient incentive for some investors to forego an annual revenue stream for a one-time buyout.
The investor category has remained stable between 2006 and 2016 as a proportion of total
owners (54%), as the total number of owners has decreased by 14% over that time and as the
investor category has been replenished with both new investor entrants and owner-operators
shifting to the investor category.
The ownership flows reveal consolidation in the number of owners and the progressive
diminishment of the owner-operator category. Owner-operators have been leaving the fishery in
greater numbers than new owner-operators have been entering. Owner-operators primarily exit
by first becoming investors for a period of time before selling their quota, although many have
chosen not to sell at all, staying in the investor category. Ownership is not associated with
efficient operators, as quota ownership and fishing operations have diverged, with the majority
of quota leased out to be fished either by owner-operators supplementing their own holdings, by
vessel owners leasing a licence and quota, or by skippers hired to fish a vessel and quota.
Similar patterns of ownership change have been observed in other ITQ fisheries. Emerging
investor classes were noted in the Tasmanian rock lobster fishery (van Putten and Gardner 2010)
and the mid-Atlantic clam fishery (Brandt 2005). In the Tasmanian fishery, a quota ownership
cap was posited to limit concentration and maintain diverse ownership. The emergence of the
investor class in the mid-Atlantic clam fishery was interpreted as a positive outcome in that it
provided a mechanism for those ‘forced out’ of the fishery to continue to generate income
(Brandt 2005). The BC Pacific halibut fishery, as with other fisheries in BC, has no ownership
caps. There is a limit on the amount of halibut quota that can be on a single licence (between 1%
and 1.25% of the TAC), but there are no limits on the number of licences an individual or

40
company can own. Furthermore, objectives for the BC halibut fishery include the accruing of
benefits to fishery participants and communities. The negative impacts for the fishery and fishing
dependent communities of an emerging investor class should not be overlooked.
The investor class, which owns quota that they lease to others to fish, and earns lease revenue
from the fishery:
1. Does not add value to the fishery. They do not reinvest in the fishery except in licences
and quota. They do not support infrastructure, vessels, or innovation and advancement of
technology and processes in the fishery, thus negatively impacting the long-term
development of the fishery. They do not invest in depreciable assets such as vessels,
which is considered a positive when a fleet is over-capitalized and when considering
efficiency to extract rent. However, this lack of investment is not a sustainable state over
the long-term when re-investment is needed to replace depreciated assets.
2. Negatively impacts the viability of the fleet by capturing upwards of 80% of the landed
value of the quota that investors lease to fishing enterprises. The current financial
situation for new entrants in the halibut fishery indicates that lease prices are not
sustainable and the level of income generation for new entrants does not offer a path to
ownership (Edwards and Pinkerton 2019a). The stagnation in ownership, particularly
among owner-operators and original grantees, are warning signs that the rates of return
from the fishery are not sustainable and cannot support investments in the fishery from
regular financing channels without significant risk of default.
3. Negatively impacts the equitable distribution of benefits. Equity is about more than the
quotas allocated to the original grantees, who benefit when they join the investor class

41
and lease their quota to others, and when they sell their quota to investors. Fisheries in
Canada are intended to provide a wide range of socio-economic benefits, including
employment opportunities and good incomes, and to deliver benefits to those who work
in the fishery and the communities that support them (Stephenson et al. 2018;
Government of Canada 1976; LeBlanc 2017). Investors own nearly half of the halibut
quota. The majority of the landed value from that leased quota, about 80%, is paid
through lease fees to investors that do not work in the fishery. This transfer of wealth to
investors comes at a cost to fishery participants – those benefits are no longer available
for crew, hired skippers and lessee owner-operators, nor the businesses in coastal
communities that those fishery participants rely upon. When assessed against the stated
objectives for the fishery, the rise of the investor class represents a fundamental failure of
the halibut fishery to meet objectives for the distribution of benefits.
2.4 Long-term wealth effects of initial allocation
To evaluate the impact of the initial quota grants, the quota ownership and catch of the original
grantees was considered by their ownership category (Figure 2.5). Initial grantees from the 1991
licencing year continued to have a prominent role in halibut licence and quota ownership in
2016. Of the 302 unique owners of halibut licences and quota in 2016, 154 were original
grantees of quota from 1991. These original grantees collectively owned 53% of the halibut
quota in 2016. This quota had a lease value of about $27 million in 2016 and an estimated
purchase price at 2016 prices of $310 million.

42
Figure 2.5 The percent of halibut quota caught and owned by the original grantees – licence holders that were
granted quota in 1991 – in each of the five categories of ownership.
The prominence of original grantees in the current fishery would not be evident from a cursory
review of the data. An assessment of original grantee ownership based only on declared
ownership listed in the original DFO licence list found that original grantees owned 35% of the
halibut quota in 2016. Once beneficial ownership was accounted for, original grantees were
found to own 53% of the halibut quota in 2016. Similarly, of the 154 owners identified as
original grantees still in the fishery in 2016, 64 had different names, having either incorporated
(38), dissolved their company (15), transferred ownership between companies (5), or transferred
ownership between family members (6).
Aside from a large exodus in the 1992 to 1995 period, in which about a third of owner-operators
exited the fishery outright, the majority of original grantee owner-operators have transitioned to

43
an investor role in the fishery after they stop fishing halibut. These former owner-operators
comprise the majority of investors. Of the 164 investors in the halibut fishery in 2016, 107 were
original grantees, and these original grantees owned 30% of the total halibut quota. Original
grantees that continue to fish hold an additional 11% of quota and corporate fishing enterprises
hold 11%. These quota holdings are both from originally granted quota as well as purchases of
additional quota. The 148 owner-operated fishing enterprises granted quota in 1991 that
remained in the fishery in 2016 were collectively granted 41% of the halibut quota in 1991 and
in 2016 owned 49% of the halibut quota. At the individual level, 47 of the 148 original owner-
operator grantees remaining in the fishery had less quota in 2016 than in 1991, 61 original
grantees had increased their quota holdings, and the remaining 40 had quota holdings that were
unchanged (Figure 2.6).
Figure 2.6 The percent of quota owned in 1991 and in 2016 by the individual owner-operator original
grantees, by the owner type category in 2016. Those along the blue line have identical quota holdings in both
years. Those below the blue line have reduced their holdings and those above have increased their holdings.

44
Most investors that have remained in the fishery have significant quota holdings. Over 80% of
investors held quota with a lease value of at least $50,000 in 2016 (Figure 2.7), as calculated
using the reported average lease price.
Figure 2.7 The number of original grantees by the 2016 lease value of the quota that they own, in thousands
of dollars.
Nowhere is the significance of being an original grantee more evident than in the owner-operator
category. Of the 65 owner-operators active in the halibut fishery in 2016, half (33) were original
entrants. Of the 15% of quota owned by owner-operators, three quarters, 11% of the total halibut
TAC, was owned by original grantees. These owners caught 23% of the halibut catch. In
contrast, the owner-operators that entered after 1991 caught 24% of the halibut catch and owned
just over 3% of the halibut quota. Of particular note is that the 18 owner-operators that entered
the fishery since 2001 collectively caught 16% of the halibut and owned less than 1% of the
halibut quota.
The impact of the initial grantees extends into the representation of the fishery with the
management agency. DFO consults on a regular basis with advisory committees, including the

45
Halibut Advisory Committee (HAB). These advisory committees include both elected and
appointed members and are intended to represent the full cross section of stakeholders and advise
the department on changes to the annual management plan for the fishery as well as long term
policy directions (DFO 2009b). Commercial fishery representatives are elected to HAB, with
each halibut licence equalling one vote and 20 votes needed to become a licence holder
representative. In 2016 there were 12 licence holder representatives elected by halibut licence
owners. Of these 12 members, all were licence holders; 2 entered the fishery after 1991, and the
remaining 10 were original grantees; 5 were owner-operators and the remaining 7 were investors.
Thus, the majority of representatives providing policy advice do not fish halibut.
2.5 Conclusion
The examination of the change in ownership from 1991 to 2016 in the BC Pacific halibut fishery
has revealed that:
1. While the halibut fishery is traditionally a small boat, owner-operator dominated fishery,
whose objectives state that benefits should accrue to fishery participants and
communities, owner-operators are increasingly marginalized. The diminished role of
owner-operators is evident in both catch and ownership, although it is ownership that has
seen the greatest change, falling from 90% in 1991 to 15% in 2016. While other
categories of licence ownership have seen increased ownership, the greatest impact on
owner-operator ownership, by far, has been the rise of the investor class, which was non-
existent in 1991 and owned 43% of the halibut quota in 2016. The diminished role is also
evident within the advisory committee process, with owner-operators comprising just 5 of
12 licence holder representatives, and investors holding the remaining seats.

46
2. Permanent access rights are not migrating to more efficient operators, but are instead
being kept by investors to generate income without having to participate in the fishery.
Furthermore, there is clear evidence of a wealth effect that benefits the original grantees,
limiting opportunities for new entrants to gain a foothold in the fishery regardless of their
relative efficiency.
3. Ownership is increasingly disconnected from fishing operators, calling into question
assertions that ITQs improve stewardship by linking resource ownership and participation
in the fishery. The majority of operators in the fishery in 2016 have minimal ownership in
the fishery and are under significant pressures to maximize catch at lowest cost due to
high lease prices, with implications for safety and harvesting practices. Those operators
that do have significant quota holdings, primarily original grantees that continue to fish,
are insulated by the value of their quota holdings, limiting incentives for efficiency and
innovation in the fishery.
Based on this analysis, it is clear that for the BC Pacific halibut fishery, ITQs have not been an
effective mechanism for efficient operators to enter the fishery and take on an ownership stake,
given that ownership is not migrating to operators at all, but rather primarily to investors and
corporate and processing interests. While there is evidence that conservation and stewardship
gains are correlated with the introduction of ITQs in the halibut fishery (Munro et al. 2009;
Melnychuk et al. 2016), a causal relationship should not be assumed. With the majority of
fishing enterprise operators disconnected from meaningful quota ownership, conservation gains
cannot be reasonably attributed to the introduction of private property rights. Rather, the
introduction of an extensive monitoring and enforcement system that accompanied the

47
introduction of ITQs is a more likely explanation. The initial quota allocation process was a boon
to the original grantees at the expense of new owner-operators entering the fishery. In the
absence of quota market, ownership and participation regulations (such as owner-operator
requirements), the ownership structure of the halibut fishery has become one in which investors
receive more of the value from the fishery than owner-operators. As original grantees, that
comprised half of the owner-operators active in the fishery in 2016, continue to exit, ownership
by owner-operators can be expected to further decline. At the same time, investors do not
contribute to the development of the fishery – they do not invest in boats or equipment for the
fishery, they do not add to coastal infrastructure, and they do not support innovation of new
technologies and techniques. Investors represent the flight of wealth out of the fishery and out of
fishery-dependent coastal communities, which raises questions about whether ITQs, particularly
those without ownership restrictions or mechanisms to support new entrants, are appropriate for
a fishery that is intended to support a strong fishing fleet and adjacent coastal communities.

48
Chapter 3: The Hidden Role of Processors in an Individual Transferable
Quota Fishery
The economically and culturally important Pacific halibut fishery in British Columbia, Canada,
managed as an individual transferable quota fishery since 1993, has frequently been held up as
an example of management best practices. This narrative of success has continued despite
repeated warnings that there are serious problems with the fishery, including processors exerting
ever greater control over the fishery, contrary to stated fisheries objectives. Administrative data
from federal and provincial data sets were used to consider ownership and control in the halibut
fishery, with a focus on processor quota ownership, leasing, and brokerage of leases. The
analysis indicated that direct processor ownership of halibut quota, while more than doubling
between 1996 and 2016, remains relatively low at less than 10% of the available quota.
Processor control through the leasing of halibut, however, is much higher, accounting for more
than half of all halibut quota transfers in 2016. Through strategies such as ‘holding licences,’
processors increasingly act as hubs for leasing activity, which has shifted the balance of power in
the fishery. This analysis (a) reveals that there is much more processor control than is obvious
from a cursory review of ownership, (b) highlights approaches for assessing the level of
processor control, and (c) recommends alternative government procedures for improving
transparency and evaluating full spectrum outcomes of fisheries management such as equitable
distribution of benefits.

49
3.1 Introduction
Fisheries management systems can have many unexpected and often unwelcome impacts,
influencing power dynamics, resilience, and overall fisheries success (Hentati-Sundberg et al.
2015; Foley, Mather, and Neis 2015; Stoll, Beitl, and Wilson 2016). Individual transferable
quotas (ITQs) are permits that allow the holder of the ITQ to catch or transfer a share of a total
allowable catch (TAC). ITQs as a fisheries management system have been widely promoted as a
means of achieving positive economic and conservation outcomes (Branch, Rutherford, and
Hilborn 2006; Casey et al. 1995; Grafton 1996; Grafton et al. 2006, 20; Grimm et al. 2012). ITQs
have had a mixed record, however, when the full spectrum of fisheries objectives are considered,
particularly related to equitable distribution of benefits, social and economic outcomes for
fisheries-dependent communities, resilience, employment, and safety (Carothers 2015;
Carothers, Lew, and Sepez 2010; Copes and Charles 2004; Emery et al. 2014; GSGislason &
Associates Ltd 2013; McCay 1995; Pinkerton 2014; Pálsson and Helgason 1995; Ussif Rashid
Sumaila 2010). Concerns over the competitiveness of markets (i.e., monopoly and monopsony
issues) and related price manipulation, are responsible, in part, for the restrictions on the
concentration of quota share ownership that are present in nearly all ITQ fisheries (L. G.
Anderson 2008).
Analysis of quota lease markets in ITQ fisheries has focused primarily on ownership and related
issues of market function (Newell, Sanchirico, and Kerr 2005; van Putten and Gardner 2010;
van Putten, Hamon, and Gardner 2011; Ropicki and Larkin 2014; León et al. 2015). Mechanisms
for non-ownership control in quota markets have been noted (Pinkerton and Edwards 2009) but
have not been subject to the same level of scrutiny as ownership mechanisms. At the same time,

50
there is a growing interest in how hidden activities and relationships can exert control over
fisheries and lead to unexpected and often negative impacts (Adger, Eakin, and Winkels 2009;
Liu et al. 2013; Galaz et al. 2018).
It is within this context that consideration of the processor control of an ITQ fishery was
undertaken. Processor control of fisheries can take the form of (1) limiting opportunities for
fishing enterprises to sell product (oligopsony, where there are few buyers and many sellers) and
(2) control over fisheries production and access to fishing opportunities (oligopoly, where there
are few sellers). The potential for processors to exert control over fisheries through purchase of
licences has long been recognized as a potential issue that can lead to market inefficiencies and
inequitable distribution of benefits (Clark and Munro 1980; L. G. Anderson 1991; National
Research Council 1999). In addition to direct ownership of fisheries access rights, processors
have other avenues through which they can exert control, including financing, conditional sales
agreements and joint or indirect ownership through which they can dictate the conditions of sale
for fishing enterprise catch (Shaffer 1979; Cruickshank 1991; Windle et al. 2008). Concern over
processor control in Canada arose historically due to both oligopsony and oligopoly issues
(Government of Canada 1976; Pinkerton 1987a; Gough 2008). The potential for a small number
of processors to exert control that distorts fish prices and disadvantages independent fishing
enterprises was the impetus for both the fleet separation and owner-operator policies in Atlantic
Canada (Gough 2008). While some processor control mechanisms have been well studied, the
potential for processors to exert control over a fishery through a secondary quota leasing market,
in which the processor is acting as an intermediary with limited ownership but extensive control
of fisheries access rights, has not received the same attention and it is the focus of this chapter.

51
3.1.1 Overview of the British Columbia halibut fishery
Canada’s Pacific halibut fishery is an iconic fishery that is economically and culturally important
throughout coastal British Columbia (BC). It is one of the highest value fisheries in BC, with
$58.3 million in landed value and $93 million in wholesale value in 2016 (Province of BC 2017).
Individual vessel quotas were implemented in the halibut ‘L’ licenced fishery in 1991, followed
by limited temporary transferability in 1993 and full temporary and permanent transferability in
1999. Temporary transferability refers to leasing of quota annually and permanent transferability
refers to the sale of quota off the licence to another licence. During the period of limited
transferability, quota could be transferred only in blocks, with the quota on each licence split into
two blocks. A licence with 10,000 lb (4536 kg) of quota would have two blocks of 5000 lb (2268
kg) each, whereas a licence with 40,000 lb (18,144 kg) of quota would have two blocks of
20,000 lb (9072 kg) each, and these blocks were the minimum unit of transfer. With the
introduction of full (‘by the pound’) transferability, the minimum unit of transfer for quota
became one pound. Unlimited transfers of halibut were permitted, subject to rules on minimum
and maximum holdings on the licence (DFO 2019a). There are no restrictions on the number of
licences that an individual or company can own.
As part of government efforts to repatriate fisheries access to First Nation people, the First
Nation communal licence designation was created in the 1990s. First Nation communal halibut
licences are designated as ‘FL’. The Government of Canada has been purchasing ‘L’ licences
and quota and transferring them to the ‘FL’ designation since 1997. There were 76 ‘FL’ licences
identified in 2018 with combined quota totalling about 16% of the TAC.

52
The BC halibut fishery is one of the earliest major ITQ fisheries in Canada and has often been
referenced as an example of success in fisheries management (McRae and Pearse 2004; Grafton,
Nelson, and Turris 2006; Munro et al. 2009; Casey et al. 1995). Fisheries participants and
observers have raised concerns, however, about the state of the fishery, citing excessively high
lease prices, diminishing financial returns for fishing enterprises, an aging fleet and workforce
with little opportunity to attract and retain new entrants, inequitable distribution of benefits and
questionable societal benefits from the resource (Nuu-chah-nulth Tribal Council 2005; United
Fishermen and Allied Workers’ Union 2005; Ecotrust Canada 2009; Pinkerton and Edwards
2009; Davidson 2010; Canadian Council of Professional Fish Harvesters 2018). The quota
leasing system is central to these concerns.
The Government of Canada is mandated to safeguard the interests of Canadians in managing this
common pool resource (Fisheries Act, R.S.C. 1985, c. F-14) and fisheries are expected to be
managed to meet a full spectrum of socio-economic objectives, including benefits to adjacent
communities, maintenance of small boat independent fleets, and distributed benefits amongst
participants (Stephenson et al. 2018), as affirmed in legislation (Oceans Act, S.C. 1996, c.31)
and policy (DFO 1999a; 2018a). Processor ownership of fisheries access privileges has long
been recognized as running counter to a number of fisheries management objectives in Canada.
In 1977, then Fisheries Minister Romeo LeBlanc, in a speech in Nova Scotia in which he
proposed the separation of fishing fleets from processing companies in Atlantic Canada, stated
that “Fishermen should own their own boats, and be able to sell fish where they want. …
Creating a truly independent fleet should improve the efficiency of vessel operations, improve
the match of fishing and processing capacity, raise fish prices and fishermen’s incomes, increase

53
the fishermen’s bargaining power, create a healthier balance of forces in the industry, and
invigorate fleet development by the fishermen” (Gough 2008, 325). Concerns about the negative
impact of processor ownership of fisheries access led to the establishment of limits on corporate
concentration in the BC fisheries (Shaffer 1979; Pinkerton 1987a; Gough 2008) and owner-
operator and fleet separation provisions in other regions of Canada (Gardner 1995; DFO 2007b;
Gough 2008; Foley, Mather, and Neis 2015; Barnett, Messenger, and Wiber 2017). Despite the
early recognition of the importance of placing limits on processor ownership, BC’s fisheries are
some of the only ITQ fisheries in the world without any kind of ownership restrictions. The
restrictions on processor control of BC fisheries that were in place were never formalized in
legislation or regulation and monitoring and enforcement of these restrictions was abandoned by
Fisheries and Oceans Canada (DFO) in the late 1970’s, long before the introduction of ITQs to
the BC groundfish fisheries. The prevailing view in the 1970’s was that processor ownership in
the BC fisheries was minimal (Government of Canada 1976). This stood in contrast to Canada’s
East Coast fisheries where processor ownership was acknowledged to be significant, and was
theorized to be the cause for artificially low prices due to pricing practices of vertically
integrated processing companies (Gough 2008). The resulting establishment of fleet separation
and owner-operator policies subsequently led to further formalization of ownership and control
restrictions in some of Canada’s East Coast fisheries (Gough 2008; Barnett, Messenger, and
Wiber 2017).
A further rationale for the absence of processor limitations in the BC ITQ fisheries was the
perception that ITQs would favour fishing enterprises over processors. ITQs were credited with
shifting the balance of power between the licence/vessel owner and the processor-buyer, with the

54
licence/vessel owner appropriating a greater share of the increase in value than the processor
(Gislason 2008). What the evaluation by Gislason (2008) failed to account for was the fact that
the quota owner and the fishing enterprise are increasingly distinct entities, thereby providing an
opening for other actors, namely processors, to exert control through the quota leasing system.
Furthermore, oligopsony concerns in BC have historically focused on herring and salmon
(Pinkerton 1987a). Halibut was not considered a concern, given a competitive, non-collusive
market while a layup system was in place to spread effort in time and create transparent auction-
like conditions in the delivery to processors (Pinkerton 2013). This chapter considers the extent
of processor control in an era of quota leasing by processors.
3.2 Methods
Methods consisted primarily of a detailed analysis of datasets obtained from the management
agency, DFO, supplemented by the Statistics Canada Inter-Corporate Ownership historical
databases, BC Provincial Corporate Registry Services records, BC provincial processor licence
lists, and the Transport Canada vessel registry on-line query system and historical vessel lists.
Methods also included input from BC fishermen active in the halibut fishery, facilitated through
the Canadian Fisheries Research Network – a six-year research network that brought together
academia, industry and government to undertake collaborative research on fisheries in Canada
(Thompson et al. 2019). This research was also informed by testimony from BC fishermen to the
Parliament of Canada House of Commons Standing Committee on Fisheries and Oceans for their
study on the regulation of West Coast fisheries.

55
3.2.1 Data
All DFO data used for this research were obtained through access to information requests, which
are governed by legislation that requires government departments to release most publicly-held
data upon request (Access to Information Act (R.S.C., 1985, c. A-1) 1985). Only a small portion
of the data that is collected for the management and oversight of the BC fisheries is made
publicly and freely available, namely the licence lists. However, licence list data were unusable
for the purposes of this research due to an error in the dataset. It consists of current and historical
licence holdings and includes the licence type, number, and year; associated vessel; vessel
length; and, the name of the contact owner. At some point between 2008 and 2013, DFO began
incorrectly linking licences and vessel ownership for vessel-based licences in this dataset by
assuming that the most recent owner of the vessel on record was the owner throughout the
lifetime of the vessel. This meant that when a vessel was sold to a new owner, that new owner
would be recognized as the owner of the vessel and all associated vessel-based licences in the
dataset for the entire period of the dataset, which extended from 1981 to the date the dataset was
published.
Over a 15-year period, multiple access to information data requests for catch, management and
ownership data for BC licences and ITQs were made to DFO. DFO has been inconsistent in its
release of data, redacting individual identifiers at times and releasing the requested information
in its entirety at other times. DFO has cited the exemption for confidential information supplied
by a third party (exemption 20(1)(b)) to justify redactions. As the governing legislation had not
changed over the period of requests, and the type of information being requested had not
changed, this inconsistency can only be attributed to variable interpretation by the department of

56
their legislative requirements to release this information. The main issue seems to be whether the
quota allocations and reallocations that DFO regulates and manages, issuing quota each year and
processing quota reallocations upon request, constitute government records or third party
supplied information, and that the exemption cited is only available for third party supplied
information. Catch data by vessel are indisputably third party supplied information and are
consistently redacted and thus not available for the analysis. The three datasets that were
available and used for the analysis were: (1) licence/vessel ownership, (2) quota transactions
administrative records, and (3) quota allocations.
Licencing data by vessel is readily available from DFO, but with limitations. Whereas the ‘FL’
licence is a ‘party-based licence’, meaning that the licence is attached to an individual (person or
organization), the ‘L’ licence is a ‘vessel-based licence’, meaning that the licence is attached to a
vessel and not an individual (DFO 2019a). In most cases, the owner of the vessel and the owner
of the licence are the same, but when vessel-based licences are leased, the owner on record is a
lessee and not the actual licence owner. It is important to note the distinction between licence
leasing and quota leasing. Quota leasing is common, and there is an administrative procedure for
the management agency to recognize quota leases that does not impact recorded ownership. In
contrast, there is no mechanism to ‘lease’ a licence; the licence must be transferred to the lessee
vessel in the same way as if the licence were sold, and is regarded as a permanent transfer by the
management agency, which then impacts recorded ownership. This process is typically governed
by a trust agreement – a legal contract between the lessor and lessee – that affirms that while the
licence transfer is regarded by the management agency as a permanent transfer, ownership
remains with the lessor and the licence will be transferred back to the lessor’s vessel at the end of

57
the lease period. While quota leasing is common, licence leasing in the halibut fishery is not
widespread, although it does occur. Vessel ownership is used in this analysis as a proxy for
licence ownership, as this is the only available source of ownership data and is consistent with
the approach taken by DFO in assigning ownership. The other limitation in assigning ownership
relates to multiple owners. The vessel can have multiple owners associated with it, either due to
joint ownership of the vessel or licences, to recognize ownership of licences or quota by different
owners, or due to financing arrangements. In this analysis, ownership was assigned to the contact
owner on record. Secondary ownership by processors based on the full list of owners was also
assessed.
The second dataset is the quota transfers administrative data. Quota transactions consist of both
temporary and permanent transactions. A temporary transfer is a time-limited (in-season) transfer
of quota between licences. These transfers can be between licences owned by a single owner or,
more commonly, between different owners. In the latter case, the transfer is referred to as a lease.
A temporary transfer applies only to the current fishing year, with the quota reverting to its
primary licence the following year. Once fished, quota cannot be moved from the licence on
which it was fished until the next year. Before it has been fished, quota can be transferred an
unlimited number of times, and it is common for quota to be transferred two or three times
before it is fished. Temporary transfers are expressed in pounds and permanent transfers can be
expressed in either percentage or pounds, although ultimately the purchaser of quota is
purchasing a percent of the TAC in each year, not a guaranteed poundage. A complete time
series for quota transfers was compiled for 1993 (the beginning of quota transferability) to 2016.
The analysis of quota transfers considered only halibut quota from halibut licences.

58
Administrative quota transfers not associated with leasing – e.g., the transfer of quota between
DFO-held licences and the 2006 transfers of 10% of the halibut quota to and from the Pacific
Halibut Management Association as per an agreement with the department (DFO 2006) – were
excluded from the analysis. Quota transfers between licences owned by a common owner were
also excluded from the analysis of leasing.
The third dataset is the initial quota allocation data by licence, which is expressed as a
percentage of the commercial halibut TAC. These data have been treated as confidential at
different times by DFO, but have been released at other times. A complete time series for quota
allocation was compiled for 1991 through 2016 using available allocation data and the quota
transaction dataset, with the exception of 1997 when a different allocation formula was used due
to a court case that was later overturned on appeal.
3.2.2 Analysis
Determination of which vessels fished, in the absence of individual catch records, was based on
the presence on the licence of greater than 3500 lb (1588 kg) of halibut quota at the end of the
year. This was determined by the difference between the initial allocation and quota transferred
on and off the licence during the year. For the years 2001 through 2006, end of year quota on the
licence was also available, which was used to validate this approach. A cut-off of 3500 lb
(1588 kg) was chosen based on the lowest amount allocated to a licence in the initial allocation
in 1991, verified with industry input that indicated that this corresponded to a reasonable
minimum catch level of quota that a vessel would need to justify gearing up for a halibut season.

59
Additional data analysis was undertaken to identify parent company ownership and company
affiliations. Processors were identified through a review of the Province of BC list of processor
licences, supplemented by a review of trade publications (e.g., Westcoast Fisherman magazine).
Building on work to assess corporate concentration in the BC salmon and herring fisheries
(Haas, Edwards, and Sumaila 2016), the Statistics Canada Inter-Corporate Ownership records
were accessed to identify ‘parent-child’ company relationships for large companies. To examine
ownership of the smaller companies, searches of the BC Provincial Corporate Registry Services
records and the Transport Canada vessel registry were also undertaken. ‘Parent-child’
relationships and affiliations were identified based on co-occurring directors, records of sales,
and home addresses on record. For licences with a high degree of quota transfer activity, where
affiliations were not obvious from direct or parent ownership, an analysis of the patterns of quota
transactions and discussion with active halibut fishermen were undertaken to identify affiliations
in three years: 1996, 2006 and 2016.
The quota trading system in 1996, 2006 and 2016 was mapped as social networks to visualize the
relationships between the different quota trading entities. Network analysis is a well established
field of research that can provide insights into the characteristics of a system of connected actors
(Jackson 2008). Network analysis has been used to consider relationships between participants in
fisheries (Crona and Bodin 2006; Ramirez-Sanchez and Pinkerton 2009; van Putten and Gardner
2010). In this analysis, connections in the network denote temporary transfers of halibut quota
between different actors within the halibut fishery, to examine leasing relationships. Quota
trading relationships were visualized using the network analysis package ‘igraph’ (Csardi and
Nepusz 2006) in R (R Development Core Team 2019).

60
3.3 The halibut quota leasing system
The halibut fishery consists of four primary types of actors: fishing enterprise, processor,
investor, and First Nation communal lessor. Within the DFO licence list, there is no
classification of licence holders according to these categories. Furthermore, for the BC fisheries,
DFO does not track affiliations/control due to leasing or other arrangements such as controlling
agreements, does not track which companies are processors and does not distinguish between
licence holders that fish (e.g., ‘fishing enterprises’) from licence holders that do not fish (e.g.,
‘investors’).
For this analysis, licences were assigned to categories according to the following criteria:
1) Fishing enterprise: includes individuals and companies that can have multiple vessels and
licences. The main distinguishing feature of this category is that the enterprise must have
at least one vessel that catches halibut in the directed halibut fishery in a given year. The
second distinguishing feature is that the enterprise is not classified as a processing
company. This includes fishing enterprises that fish communal First Nation (‘FL’)
licences as well as those that fish regular (‘L’) halibut licences, as either owner-operator
or corporate fishing enterprises.
2) Processor: companies that purchase halibut from fishing enterprises to process and sell in
the wholesale or retail market. They may own licences, quota and/or fishing vessels that
are fished by a hired skipper. For the purposes of the analysis of quota leasing, licences
that are owned by the processor, either wholly or jointly with a fishing enterprise, as well
as licences that are ‘affiliated’ with but not owned by processors, either being leased or in
some other controlling arrangement, are classified here as processor licences. When
considering ownership, only those licences that are directly owned by processors are
classified as processor licences.

61
3) Investor: companies and individuals that own halibut licences and quota that they do not
fish themselves and which they lease to others. This includes former fishing enterprises
that no longer fish halibut but have retained their halibut quota to lease to others.
4) First Nation communal lessor: licences held communally by First Nation organizations
(e.g., by a First Nation government entity, economic development organization, or not-
for-profit) that are not fished by them, but the quota is leased to fishing enterprises. Most
of the licences within this category are ‘FL’ licences. First Nation individuals holding
regular ‘L’ licences are not included in this category, being included in either the ‘fishing
enterprise’ or ‘investor’ categories, depending on whether they fish halibut or lease the
quota to others. First Nation companies that both hold ‘FL’ licences and process fish are
classified in the First Nation communal lessor category, not the processor category.
Anyone across any of the categories can act as a broker. Independent quota brokerage firms have
existed in the BC groundfish fishery, primarily servicing the groundfish trawl fishery. A separate
broker category was not identified for the halibut fishery as the evidence suggests there is only
minimal leasing activity within the halibut fishery that could qualify as being carried out by a
broker separate from investors, fishing enterprises, First Nation communal lessors and
processors. The low penetration of independent brokerages in halibut can be attributed to: (1)
relatively high transaction costs for using a brokerage company, (2) established relationships,
particularly between processors and investors, and processors and fishermen, and (3) the widely
held view that processors are willing to pay higher lease prices than are fishermen, and thus are a
more attractive target for investors (Pinkerton and Edwards 2009).

62
3.3.1 Extent of leasing
By the mid-2000’s, nearly every licence in the halibut fishery engaged in leasing to some extent
(Figure 3.1). This can be attributed to (1) the minimum permanent quota holdings requirement
for halibut licences (at least 0.01149% of the TAC on each licence, equivalent to 706 lb [320 kg]
in 2016) (DFO 2019a), (2) high quota lease value ($8.40/lb in 2016) (Simpson 2017), (3) a
strong leasing market, and (4) low levels of quota ownership by many fishing enterprises. In
2016, investors owned 43% of the halibut quota, up from 0% in 1991 and 23% in 1996 (Edwards
and Pinkerton 2019b). In contrast, owner-operators went from owning 90% of quota in 1991 to
15% in 2016.
Figure 3.1 The percent of halibut licences involved in temporary quota transactions each year.
3.4 Processor ownership and control
If one looks only at licence and quota ownership based on the DFO licencing database, there is
little evidence of processor control or changes in processor ownership over the last twenty years.
Based on reported ownership, the maximum percent of halibut quota owned by a single entity in
2016 was 1.95% of the TAC, which increased to 3.35% when parent ownership was considered.

63
While not an insignificant amount of quota, having a lease value of $1.7 million in 2016 and a
current market value of more than $20 million, this level of ownership is not on its own
indicative of high corporate concentration. When ownership by processors as a whole was
considered, ownership steadily increased but was still less than 10% in 2016 (Figure 3.2).
Processors as declared secondary owners of licences was also considered. When secondary
ownership was included, processor ownership nearly doubled in 1996, but was of diminishing
importance in later years. In 2006, processors had ownership interests in vessels associated with
30 halibut licences, for which they were the primary contact owner of 18 and secondary owners
of 12. In 2016, the number of these licences increased to 31, but processors were secondary
owners of only 6. Secondary ownership should be interpreted with caution, however, as the
nature of the secondary ownership by the processor is not known and could be anything from a
loan against the vessel, or ownership of another licence on the vessel, to full ownership of the
halibut licence and quota. Where processor control becomes more evident is in an examination
of quota leasing, particularly the use of holding licences.
Figure 3.2 Processor quota ownership expressed as a percent of TAC, for both direct ownership and
ownership where the processor is listed as a secondary owner, and processor control over leasing as measured
as quota transfers through processor owned and affiliated licences as a percent of total quota temporarily
transferred in the year, for 1996, 2006 and 2016.

64
An approach that has gained prominence in the halibut fishery is the use of holding licences by
processors, used to hold quota in-season. For example, a processor may own or lease (for a
nominal price) one of the more than 200 halibut licences that are not being fished, and use it to
hold quota temporarily when acting as a broker between lessors and lessees of halibut quota.
These holding licences have a high poundage of quota transferred on and off, and the licences
are typically not fished themselves. These licences serve to consolidate control by processors,
enabling them to lease in quota early in the season, take possession of it on a licence they
control, and then lease it back out to fishermen through the season when fish is delivered to
them. The previously dominant practice was for fishing enterprises to lease directly from lessors
or for processors to arrange the quota lease and transfer the quota directly from the lessor to the
fishing enterprise. Even when the processor was arranging the lease, this approach afforded
information to the fishing enterprise on the source of the quota and to some extent the amount of
quota leased. The use of holding licences impedes transparency in the quota leasing system,
reducing information available to fishing enterprises about the original source of the quota that
they are leasing. They know only that it has been transferred from the processor’s holding
licence and are not provided any indication of how much quota the processor has leased or from
whom or at what price.
The use of holding licences by processors has evolved over time. There was one processor-
controlled holding licence identified in 2006, which had more than 2 million pounds (907 t) of
quota transfers on and off the licence that year. The quota transfers through this one holding
licence represented control over about 1 million pounds (454 t) of quota, equivalent to about 9%
of the TAC in 2006. The difference between the quota transfers (2 million pounds [907 t]) and
65
the quota involved (a maximum of 1 million pounds [454 t]) is due to the fact that for a holding
licence, quota leasing includes both inward and outward transfers, with quota leased from quota
owners and transferred onto the holding licence and then leased out again to fishing enterprises
and transferred off the holding licence to the licence used to fish the quota. As evident from
analysis of the quota transfers dataset, the practice of using holding licences became more
widespread and sophisticated in the years following as other processors adopted the practice. By
2016, there were nine licences with transfers of more than 200,000 lb (91 t) of quota each while
not being fished in the year, with processors managing multiple holding licences to provide more
flexibility, given individual licence cap limitations of 1% of the TAC. The same processor with
the more than 2 million pounds (907 t) holding licence from 2006 had holding licence leases
representing up to about 9% of the TAC in 2016 as well, only over multiple licences. This same
processor had declared ownership of less than 2% of the halibut quota. The second most active
processor in 2016, with quota leases corresponding to about 7.5% of the halibut TAC, did not
own any halibut licences or quota. While the practice of leasing through holding licences has
become more widespread, processor leasing continues to be concentrated: the top four processors
in 2016 were responsible for more than 80% of the quota holding licence leasing by processors.
These processors were all well-established, having operated in the BC fisheries for decades.
Processor penetration into the overall halibut quota leasing system, as measured based on quota
transactions that involved a processor owned or affiliated licence, is significant, reaching 59% of
temporary quota transfers by weight in 2016. Quota was predominantly leased from investors,
although First Nation communal quota lessors, other processors and fishing enterprises also
leased quota to processors (Figure 3.3). In Figure 3.3, the nodes (circles) represent individual

66
quota traders, and the size of the nodes is indicative of the total poundage of quota transferred by
the entity in that year, inclusive of both inward and outward trades. Nodes that do not connect to
others are cases where no quota was traded or where quota was traded only within a fishing
enterprise or to licences outside the directed halibut fishery. The total poundage transferred
decreased from 2006 to 2016 because of an almost 50% drop in the TAC. Total temporary quota
transfer activity of halibut, inclusive of all licences, increased over this period, both in terms of
percent of TAC (79% of TAC in 2006 to 108% in 2016) and in the total number of temporary
quota transfers (779 in 2006 and 911 in 2016). Consideration of direct ownership and leasing
through holding licences was possible only through the amalgamation of a number of different
data sources from DFO and the BC provincial government, combined with information from
fishery participants. This information is not currently tracked by DFO and is not readily
available. The extent of processor control presented here represents only a minimum estimate,
given limitations of both the quota transfer data that are released and the data that are collected in
the administration of quota transfers by the management agency. Processors continue to lease
quota that they transfer directly from the original lessee to the fishing enterprise licence, in which
cases processor involvement is not evident from the information provided within the quota
transfers administrative data received from DFO.

67
Figure 3.3 The quota trading network in the BC halibut fishery in 1996, 2006, and 2016, as characterized by
temporary quota transactions between quota traders.

68
3.5 Power dynamics in the quota leasing relationship
Processors are able to readily fill a brokerage role in the quota leasing system in large part
because of their access to capital. For fishing enterprises that do not own appreciable amounts of
halibut quota, which is now the majority of the vessels that are fishing, it is often a financial
struggle to operate (Edwards and Pinkerton 2019a). About 70% of fishing enterprises in 2016
fished at least 20,000 lb (9072 kg) of halibut quota. The lease cost for 20,000 lb of halibut quota
is estimated to have been as high as $168,000 in 2016 (Simpson 2017). Most halibut fishing
enterprises do not have access to this amount of capital to lease quota at the beginning of the
season. Financial institutions in BC will not loan against quota, particularly for an in-season
lease, unless other more tangible assets are used as collateral and, even then, at a high cost. This
puts leasing of any larger amount of quota at the beginning of the season beyond the reach of
most fishing enterprises, and indeed, even smaller processors looking to enter the business. The
requirement to access significant capital strongly favours incumbents that are already in a good
financial position and have a business that accommodates large fluctuations in cash flow through
the year, which characterizes successful, established processors, but not most fishing enterprises.
At the same time, quota owners have expressed a preference to lease to processors, with the
prevailing view in the industry that processors are willing to pay higher lease prices for quota
than are fishermen, and that there is less social pressure on owners to lower their lease price
when dealing with processors (Pinkerton and Edwards 2009).
Access to capital is but one aspect of the power imbalance between fishing enterprises and
processors. In part because of their greater access to capital, processors are in a preferred
position to lease quota from investors, who have emerged as a major ownership class under ITQs

69
in the halibut fishery (Edwards and Pinkerton 2019b). This then allows the processors to
establish relationships with the investors that further entrenches their access to quota over time,
and control of the quota market. These processor-investor relationships have been identified by
fishery participants as an obstacle to more independent fishing enterprises (FOPO 2019b). These
relationships also afford processors access to information about who holds quota, in what
amounts, and at what price they will lease it out – which, unlike regulated trading markets, is
information that is not readily available to most other participants in the quota market.
As processors gain greater control over leasing, industry norms related to information sharing
about landed value and lease fees have also shifted. When processors provide access to most of
the quota that a vessel fishes, the fish slip that records the sale of fish to the processor no longer
reflects the actual landed price or the lease price for the quota; instead, it provides only the after-
lease price. The fish slip is a record of the landing, required by DFO, which must list the buyer,
seller, weight and price for each species and grade of fish sold. The after-lease price is the price
received by the lessee fishing enterprise – the difference between the landed price and the lease
price, as well as any fees or adjustments added in by the processor. For fishing enterprises, the
listing of only the after-lease price on the fish slip means that they do not know what lease price
they are paying per pound, or what their catch is worth at the dock. They only know what they
are receiving as the difference of the two. Because fishing enterprises must sell to the processor
that is providing access to the quota that is needed to cover the catch, and basic information such
as landed price is often not provided, fishing enterprises are at a distinct disadvantage in any
attempt to better their position and seek higher prices.

70
Processors have a strong incentive to lease quota pre-season as a means to secure supply of
halibut deliveries during the season, with most of the risk borne by fishing enterprises. The
processor is able, in most instances, to pass on the full costs of the lease to the fishing enterprise
while also guaranteeing that the lessee will deliver their catch to the processor. While indications
are that competition between processors for quota remains very high, evidence suggests that
competition to attract and retain fishing enterprises as suppliers of the actual catch is low.
Despite steep increases in landed price of halibut since 2010 (Province of BC 2014a; 2017), the
average after-lease price has been stable to trending downwards (Edwards 2019). Quota leasing
is not without some risk for processors, particularly when leasing large amounts of quota pre-
season at prices that assume that the wholesale market in the coming year will support the lease
price. The risk to processors is ameliorated, however, by the ability of processors to adjust the
after-lease price to make up for lower than expected wholesale prices. Often, fishermen do not
know the price they will receive for the fish they deliver to the processor until delivery.
Furthermore, given the limited information available to lessee fishing enterprises, they do not
know the components of the after-lease price they are receiving – if it is the landed price less the
lease price paid, or if lease losses or management or financing charges are included. Adjustments
to the after-lease price are bounded to some extent. Even though fishing enterprises are highly
competitive for access to quota to fish, few fishing enterprises, when given the choice, will fish if
short-term costs, such as bait, fuel and monitoring costs, are not being covered (Edwards and
Pinkerton 2019a). Not all fishing enterprises have the choice, however, as fishing enterprises
may fish at a loss if the enterprise risks losing future access to quota if they do not fish (FOPO
2019b).

71
3.6 The role of government in managing markets
The management agency has taken on a strictly administrative role in the quota market,
processing quota transfer requests. With no public quota registry or management of the quota
leasing system, quota leasing operates in a black box that is opaque to most fishing enterprises
and the management agency and without official oversight or influence. DFO has characterized
the quota leasing system as “willing buyer/willing seller” (Mawani 2009, 44) and has absented
itself entirely from a role in overseeing those relationships or in mitigating the potential of the
system to violate management objectives.
Governments in a market economy are, at a minimum, expected to intervene in cases of market
failure arising from externalities, imperfect information, or market control (Smith 1776; Stiglitz
1993; Nayak 1996; Tanzi 2011). A minimalist approach to government intervention often
focuses on research, education, and developing market mechanisms to improve information
availability, counter monopolies or oligopolies, and correct externalities such as ecosystem
degradation (e.g., pollution, habitat destruction). A minimalist approach to government
intervention has been criticized for not adequately accounting and adjusting for disruptions in
society and the economy (Tanzi 2011). An alternative view has been posited that identifies an
important role for government in leading on transformational change (Mazzucato 2015). Under
either scenario, there is a clear role for government to intervene in the BC halibut quota lease
market. At the very least, there is a strong rationale for government to undertake research and
investigations into the state of the quota market and address the asymmetric information and
capital availability issues that are leading to uninformed decision-making and price distortions
that challenge the viability, stability and independence of the fleet (Edwards and Pinkerton

72
2019a). Stabilizing the quota market, instituting rules and procedures to create transparency
including new reporting requirements for tracking ownership and leasing and preventing price
distortions are further actions that may be expected of government that is seeking to prevent or
correct market failure.
There is extensive literature on the importance of the availability of information to all parties
involved in negotiation for effective and efficient market function (Coase 1960; Stigler 1966;
Stiglitz 2000; Holland et al. 2015). The lack of transparency and limited data collection by the
management agency to track ownership and control of a public resource is an issue that has been
previously highlighted for the BC salmon and herring fisheries (Haas, Edwards, and Sumaila
2016) and groundfish fisheries (Pinkerton and Edwards 2009). This situation is exacerbated by
the corporate reporting requirements in Canada. There are no requirements for public reporting
of private company shareholders, there are no requirements to disclose beneficial ownership
when creating a corporation (Meunier 2018), and anonymous shell companies can be readily
established (Sharman 2011). Federal tracking and reporting of intercorporate ownership through
Statistics Canada only reaches the very largest fishing companies. The BC provincial
government only requires BC registered companies to list directors and not shareholders in
annual report filings, and does not make information on directors or other basic information such
as incorporation date freely available or readily searchable. Rather, the provincial government
requires payment of a fee to access the corporate history, such as it is, for each corporation. The
practice of DFO in not tracking licence ownership of vessel-based licences is a further obstacle
to understanding, monitoring and reporting conditions in the BC fishery.

73
3.7 Conclusion
There has been a marked change in the role of processors over time as the number of quota
transactions has increased and processors have exerted a more pronounced influence in the quota
leasing market. Despite their hidden role in the fishery, directly owning less than 10% of halibut
quota, processors have considerable influence through their role as quota lessees and lessors by
controlling more than 50% of temporary quota transfers by poundage. This influence
consolidated in the period between 2006 and 2016, with processors becoming the primary hubs
for quota leasing. The central role of processors in controlling the leasing market has shifted the
balance of power in the fishery to disadvantage fishing enterprises, particularly those that are in
the position of having to lease the majority of their quota, which is a steadily increasing
proportion of fishing enterprises. This has implications for the ability of fishing enterprises to
negotiate for higher prices, and thus for the distribution of benefits in the fishery. Established
processors have been controlling access to enough of the quota market through leasing to limit
the pool of buyers, thus gaining the ability to control the market, and by extension, the after-lease
price received by fishing enterprises. This raises concerns about oligopsony and the
competitiveness of the raw halibut market.
Despite data limitations, analysis and determination of the minimum level of processor
ownership and control is possible, as was demonstrated with this analysis. Indeed, the
management agency’s preferential access to data would enable a more complete consideration of
the processor control issue. For example, a more direct evaluation of oligopsony in the halibut
fishery would be possible with access to data that are treated as confidential by the management
agency, notably through examination of fish slips to identify more completely the relationships

74
between fishing enterprises and processors and to determine what proportion of halibut deliveries
and the associated benefits the dominant processors receive. There is also an opportunity for
collaboration across the provincial and federal governments to combine their respective datasets
to better understand ownership and control within the BC fisheries.
An improved understanding of how processors can exert control over an individual transferable
quota fishery offers lessons for implementation and management of ITQ fisheries globally. As
interest in full spectrum evaluation of fisheries increases, the need to address a broad range of
issues (e.g., distribution of benefits, power dynamics and resilience) and to consider the levers of
control and influence within fisheries systems have become increasingly important. Better
understanding of how the fishery operates and the power relationships across the fishery could
also directly inform the development of fisheries and rural economic development policy in
Canada. Fisheries, as a common pool resource and economic driver for coastal communities in
Canada, are meant to contribute to objectives for economic prosperity and social inclusion.
Improved access to fisheries by coastal and First Nation communities has been identified as a
policy imperative for BC (Bennett et al. 2018). Despite a widely held view that, once
implemented, ITQs are nearly impossible to change, there are mechanisms available to the
management agency and others to retroactively address processor and corporate control in ITQ
fisheries (Edwards and Edwards 2017), which would be aided by a full understanding of
conditions in the fishery. The BC halibut fishery is an example of asymmetric information
between parties and poorly functioning markets that act as impediments to informed
management and business decision-making. Further analysis is needed, warranting both new
approaches to data collection by the management agency and consideration of existing data,

75
either conducted and reported by the management agency or by making heretofore restricted data
available to external researchers and stakeholders.

76
Chapter 4: Priced Out of Ownership: Quota leasing impacts on the financial
performance of owner-operators
Individual transferable quotas (ITQs) have been widely promoted as a means to improve the
conservation and economic outcomes of fisheries by enabling the transfer of quota access
privileges to the most efficient operators who in turn have a strong financial incentive to
safeguard the long-term sustainability of the fishery. The British Columbia Pacific halibut
fishery has long been held up as an example of successful ITQ management. An in-depth
investigation of this fishery, however, has identified significant failings of the ITQ system. The
ownership profile of the fishery has changed dramatically under ITQs, transitioning from
predominantly owner-operated to absentee owners and lessee fishermen. An analysis of fishing
enterprise financial performance demonstrates the overwhelming impact of leasing on the
viability of fishing enterprises. A representative owner-operator fishing enterprise leasing more
than 80% of the quota that it fishes, which characterizes all of the owner-operators that have
entered the fishery since 2001, cannot earn enough from the fishery to re-invest, including
replacement of the vessel or purchasing of quota. The fishery, under current leasing and purchase
price conditions, is not self-sustaining as an owner-operator fishery. Socio-economic objectives
for the fishery are not being met, raising important questions about the design and
implementation of ITQ management systems.

77
4.1 Introduction
Individual transferable quotas (ITQs) are permits allowing the holder of the ITQ to catch or
transfer a share of a total allowable catch (TAC). ITQs have been promoted as an effective
mechanism for efficient fishermen to buy out their less efficient counterparts and, in so doing,
increase the returns to the fishery (Scott 1989; Arnason 1990; Grimm et al. 2012; Grafton 1996;
Grafton et al. 2006). The implicit assumption is that fishing is undertaken by those who own the
majority of the quota that they fish (i.e., quota owners) (Eythórsson 1996; Emery et al. 2012).
ITQs are an example of a market-based approach to fisheries management that focuses on the
privileges of quota owners, in whose interest the fishery is managed (Copes and Charles 2004).
This is one of two dominant visions for fisheries management that has emerged since the
discrediting of top-down approaches in the 1990s following harvest declines and fishery
collapses, with the other being that of community-based fisheries management to achieve current
and future needs of fishermen and fishing dependent communities (Copes and Charles 2004).
The successive implementation of ITQs in British Columbia (BC) fisheries over the previous
three decades has demonstrated a clear preference of the management agency, Fisheries and
Oceans Canada (DFO), for market-based mechanisms. However, fisheries in Canada, as in many
countries, are held to objectives that extend beyond the needs and wants of current quota owners.
In Canada, “the oceans and their resources offer significant opportunities for economic
diversification and the generation of wealth for the benefit of all Canadians, and in particular for
coastal communities” (Oceans Act (S.C., 1996, c. 31) 1996). Historically, the vision for fisheries
in Canada was to “create a healthy, stable industry; one which can bring prosperity and security
to the people in it” (Government of Canada 1976).

78
The British Columbia Pacific halibut fishery is an ITQ-managed fishery that is a well-managed
and prosperous fishery by metrics of success typically used to assess fisheries (Grimm et al.
2012; Casey et al. 1995). The halibut fishery was an early example of ITQs in Canada, with
individual non-transferable quotas introduced in 1991 and temporary transferability of ‘blocks’
of quota introduced in 1993 (DFO 2019a). ITQs were fully implemented in the fishery in 1999,
with the introduction of permanent and temporary ‘by the pound’ transferability. With 100% on-
board monitoring and dockside validation, and requirements to own or lease quota to cover their
directed and non-directed (bycatch) catch, the small-boat groundfish fisheries in BC are closely
monitored and strictly managed, with respect to the fish stocks (DFO 2018a). The halibut stock
is managed jointly by Canada and the United States through the International Pacific Halibut
Commission, which is responsible for adjusting the total allowable catch (TAC) annually to
account for stock status and to ensure that the stock is not overfished in any part of its range from
northern Alaska to California. Since 1991, the halibut TAC has ranged from a high of 13 million
pounds (5897 t) in 1998 to a low of 5.3 million pounds (2404 t) in 2018. Market demand for
halibut is high and the landed price for halibut has almost doubled since 2004, offsetting the loss
of landed value from the drop in the TAC. Evaluations of halibut fishery performance
commissioned by DFO have been positive (Nelson 2009; 2011; Munro et al. 2009).
The ownership profile of the fishery has changed dramatically under ITQs, however,
transitioning from a traditionally owner-operated fishery to one with growing corporate and

79
processor control and ownership by ‘investors’3. A fishing enterprise is considered owner-
operator in BC when the owner of a vessel and licence personally fishes it, consistent with the
definition in Atlantic Canada owner-operator policies (DFO 2019c; Edwards and Pinkerton
2019b). An owner-operator may own multiple vessels and/or licences, but only to an extent
which can be reasonably fished by a single owner. In 1991, when individual quotas were first
introduced, owner-operators owned and caught about 90% of the halibut quota. In 2016, owner-
operators caught 45% of the halibut catch and owned just 15% of the halibut quota (Edwards and
Pinkerton 2019b). This major shift in the ownership profile in the fishery has implications for
both individual fishing enterprises and the performance of the fishery as a whole, particularly in
meeting objectives for stable and prosperous fisheries that provide benefits to fishery participants
and adjacent communities. Fishery participants and observers have asserted that ownership
trends and leasing practices in the fishery are undermining the viability of the small boat owner-
operator fleet in the BC halibut fishery (Davidson 2010; FOPO 2019a; 2019b; Pinkerton and
Edwards 2009). The majority of quota that is fished is leased, and only a small fraction of the
landed value of leased quota remains with the vessel to cover operating costs and crew and
captain wages after quota owners are paid (Pinkerton and Edwards 2009; FOPO 2019a).
Fishery participants have pointed to the lack of owner-operator provisions or other ownership
restrictions having allowed quota ownership to shift to non-fishing interests (FOPO 2019a). This
lack of restrictions has led to the emergence of a new ‘investor’ class of owners, who have no
3 Investors, by definition, do not participate in the fishery, leasing their quota to others to fish. The investor class in
the BC halibut fishery consists of companies and individuals that own halibut licences that are not fished and quota
that is leased to processor, corporate or owner-operated enterprises to be fished. This includes former fishing
enterprises that no longer fish halibut but have retained their halibut quota to lease to others.
80
participation in the halibut fishery beyond the owning and leasing out of quota (Edwards and
Pinkerton 2019b). However, there has been little government consideration of the impacts of
leasing in the fishery. Past evaluations have primarily considered economic performance,
concerned with metrics related to efficiency. In contrast, financial performance is concerned with
income and the distribution of revenues and costs (see Whitmarsh et al. 2000 for an overview of
the distinction between financial performance and economic performance). In a 1997 assessment
of BC fishing fleet financial returns commissioned by the department, it was noted that, while
leasing may be a relevant concern in a broader policy context, leasing was excluded from
consideration on the basis that “lease costs do not affect the investment return of a vessel-licence
owner” and “lease costs are only a transfer among the capital and labour interests of the fleet”
(Gislason 1997, 2–3). DFO completed an evaluation of the Commercial Groundfish Integration
Pilot Program (CGIPP) in 2009 that concluded “the diversity and complexity of leasing
arrangements under CGIPP makes it challenging to provide a snapshot analysis” and
acknowledged that quota leasing was the most contentious issue (DFO 2009a, 16), but with no
subsequent follow-up. Ownership and leasing are not regularly tracked and reported on by DFO,
and until recently (Edwards and Pinkerton 2019b), there has been little evidence available on
how the ownership profile of the fishery has changed, the extent of leasing, and the impact of
leasing on the halibut fishing fleet.
Contributing to the lack of analysis on ownership and leasing has been the dearth of financial
performance data for BC fisheries, despite acknowledgements of the importance of financial
performance information for the management and planning activities of the management agency
(DFO 1992; Nelson 2009). DFO regularly conducted a costs and earnings survey to update

81
information on the financial performance of Canada's Pacific commercial fisheries, but
discontinued the survey, citing low response rates. The last year for which halibut cost and
earnings data was made publicly available from this survey was 1994 (Gislason 1997). In 2008, a
new series was commissioned to address the gap in costs and earnings data for Pacific
commercial fisheries, and two reports were completed that included the halibut fishery, for 2007
and 2009 (Nelson 2009; 2011). The data presented in these reports, by the author’s own
admission, were not based on a census or a statistically representative sample and did not include
analysis of the actual ownership and transfer data to quantify the extent of quota leasing in the
halibut fishery. The financial performance of halibut fishing enterprises considered only
scenarios where 0%, 30% or 60% of the halibut quota was leased, with 30% being the base case.
However, more than a third of the halibut fishing fleet was leasing more than 60% of its catch in
2006, and a quarter of the fleet was leasing more than 80% (Pinkerton and Edwards 2009). By
2016, the majority of fishing enterprises leased more than 60% of the halibut quota they fished,
and all owner-operators that entered the fishery since 2001 leased more than 80% of the quota
that they fished, on average leasing 95% (Edwards 2019).
In Canada, fisheries are expected to meet a full spectrum of socio-economic objectives, including
benefits to adjacent communities, maintenance of small boat independent fleets, and distribution
of benefits amongst participants (Stephenson et al. 2018). The Canadian fishing fleet historically
was a small boat fleet, and most were owner-operated (Government of Canada 1976). A robust,
independent small boat owner-operator fleet is valued for providing employment and the wide
distribution of socio-economic benefits to fishing communities all along the coast (FOPO 2019a;
Canadian Council of Professional Fish Harvesters 2002; Tansley 1979). Amendments to the

82
Fisheries Act (R.S.C., 1985, c. F-14) passed in 2019 affirmed in legislation the importance of
preserving and promoting the independence of licence holders in commercial inshore fisheries.
While there is no official definition for inshore fisheries in BC, inshore fleets in Atlantic Canada
are, in part, defined as “the fishing sector where fish harvesters are restricted to using vessels less
than 19.8m (65') Length Over All (LOA)” (DFO 2007b). Most fisheries in BC, including the
halibut fishery, fit this definition – the overwhelming majority of vessels operating in the halibut
fishery are less than 65’ (Edwards 2019). The BC fleet historically was characterized by
relatively small vessels (under 65’), independent of processors and large corporate fishing
companies, owner-operated, primarily operating in coastal waters, and distributed along the BC
coast with close ties to coastal communities (FOPO 2019a; Canadian Council of Professional
Fish Harvesters 2002; Tansley 1979). The Government of Canada has committed to protecting
and promoting these characteristics and to achieving related socio-economic objectives, such as
prosperous coastal communities, the equitable distribution of benefits, and the stability and
viability of the fishing fleet. These objectives have been affirmed repeatedly in legislation
(Oceans Act (S.C., 1996, c. 31) 1996; Fisheries Act (R.S.C., 1985, c. F-14) 1985), policy (DFO
1999a; 2018a), by senior DFO officials (DFO 2019b), and by Fisheries Ministers over a period
spanning more than three decades (Tansley 1979; D. Anderson 1998; LeBlanc 2017). Despite
this, there has been little assessment by DFO of the impact of fishery management systems in BC
on social and economic outcomes. This includes overall economic performance of the fisheries,
enterprise-level financial performance, and the distribution of benefits along coastal regions and
between different stakeholder groups, among other considerations.

83
To reconcile the discrepancy between what superficially appears to be a healthy, successful
fishery and the experiences of fishery participants that are struggling to remain viable, this
chapter evaluates financial performance under different lease price and quota ownership
scenarios common in the fishery. Impacts of leasing on enterprise and fleet level viability and
stability and on new entrants and fishery reinvestment are considered.
4.2 Background on the British Columbia Pacific halibut fishery
The BC halibut fishery is a multi-species fishery, with catch of a number of rockfish species and
other groundfish including lingcod and sablefish caught alongside halibut, and the halibut fishery
has an allocation of rockfish quota in recognition of this. The allocation of rockfish is seldom
sufficient to cover non-directed catch, and there is no halibut fishery allocation for sablefish or
lingcod. The ‘non-directed’ catch accounted for about one-quarter of the catch by weight in the
halibut fishery in 2016 (DFO 2017). With the implementation of the Commercial Groundfish
Integration Pilot Program in 2006, lingcod, sablefish and higher volumes of rockfish were
permitted to be landed in the fishery, but all catch also had to be accounted for with quota,
enforced through an on-board camera monitoring system in addition to dockside validation (CIC
2005; Koolman et al. 2007). This has meant that halibut fishing enterprises must own or lease
quota for their non-directed catch. The majority of the owner-operator fleet must lease quota to
cover most of the rockfish that they catch. While there is considerable overlap between the
halibut and sablefish fisheries, joint ownership in the fisheries is concentrated with corporate and
processor owners. Only 3 of the 65 owner-operators in the halibut fishery in 2016 owned
sablefish licences and quota. For sablefish catch, most owner-operators must lease 100% of the
sablefish quota that they catch. Many owner-operators must also lease at least some lingcod

84
quota. Lingcod quota is split between four management areas, and was allocated to hundreds of
licences in the implementation of lingcod ITQs in 2006. The average lingcod catch on halibut
fishing trips was about 2400 lb (1089 kg) per vessel in 2016, with an average landed value of
$5700. Half of the owner-operators owned less than 2000 lb (907 kg) of lingcod and a quarter of
owner-operators owned less than 500 lb (227 kg), with those quota amounts split across the four
management areas.
In addition to revenue from the halibut fishery, most fishing enterprises that fish halibut in BC
also own licences for other fisheries, which has been a long-standing feature of the fishery (DFO
1992; Edwards 2019; Gislason 1997). In 1991 and 1994, the halibut fishery provided about one
third of the gross fishing income of the average halibut fishing enterprise, with fisheries such as
salmon and herring providing the remainder (DFO 1992; Gislason 1997). Information on the
contribution of the halibut fishery to fishing enterprise gross revenue, from the DFO cost and
earnings survey, is not available for the years after 1994, but most halibut fishing enterprises
continue to be multi-licenced with other fisheries. Only 7 of 65 owner-operators were licenced
solely for halibut fishing in 2016. Most halibut fishing enterprises are multi-licenced with
salmon, followed by herring, rockfish and tuna. These other fisheries can be an important source
of additional fishing income, helping cover fixed costs, the captain share, and the long-run costs,
and offsetting low returns in the halibut fishery. However, owning multiple licences is not a
guarantee that these other fisheries will make a positive contribution to the enterprise. Fishery
participants have noted an increased reliance on the halibut fishery, as returns from other
fisheries, notably salmon and herring, have declined. In 1994, the average gross income for
vessels in the salmon troll fleet was $91,000, of which $64,000 was from the salmon fishery,

85
with earnings before interest, taxes, depreciation and amortization (EBITDA) of $27,000 (1994
current dollars) (Gislason 1997). In the salmon gillnet fleet, average gross revenue was $37,000
and EBITDA was $9000. In 2009, the average salmon troll gross revenue was $30,000 with
EBITDA of $7500 (2009 current dollars) (Nelson 2011). For salmon gillnet, average gross
revenue in 2009 was $13,000 and EBITDA was -$2700 and the herring fishery also yielded
marginal returns (Nelson 2011).
There are a number of licence conditions and requirements that impact how a halibut fishing
enterprise operates, including minimum quota holdings, limits on how much quota can be fished
on one vessel and the transferability of licences. As a ‘vessel based licence’, halibut ‘L’ licences
are issued ‘in respect of a vessel’ and not to an individual person or company (DFO 2019a). The
vessel must be registered as a Canadian commercial fishing vessel and can have only one halibut
licence issued to it at a time. Once a licence has been fished in a year, it cannot be transferred off
that vessel until the following year. There are no restrictions on the number of vessels, or halibut
licences, that an individual person or company can own, and no restrictions on who can own a
vessel or licence. Ownership of multiple halibut licences is uncommon among owner-operators
and only one owner-operator owned and fished two halibut vessels in 2016.
Halibut licences must retain a minimum 0.01149% of the halibut TAC, which was 706 lb
(320 kg) in 20164. This quota can be leased off the licence each year but cannot be permanently
transferred off the licence. Halibut licences can hold a maximum quota amount, a ‘full block’, of
4 For this paper, all halibut weights are expressed as ‘dressed head off’ weight, in pounds, as per the management
and industry standard. The conversion factor for round to ‘dressed head off’ is 0.75. All other fish weights are
expressed as round weight, in pounds. For weight conversion, one tonne is equal to 2204.6 pounds.

86
1% of the halibut TAC, equivalent to about 61,000 lb (27,669 kg) of quota in 2016 (with some
exceptions up to 1.25% based on historical catch). The maximum quota cap applies to both
leased and permanently held quota. Of the 65 halibut owner-operators in 2016, 42% fished at
least 90% of a full block and the median for the amount fished was 80% of a full block.
Quota leasing by owner-operators in the Pacific halibut fishery is extensive. Nearly all owner-
operators lease in at least some quota and the majority lease more than half of the quota that they
fish. One-quarter of all owner-operators in 2016 owned the minimum quota, and about half of all
owner-operators owned less than 0.17% of halibut quota, equivalent to about 10,000 lb (4536 kg)
in 2016. For those that entered the fishery since 2001, two-thirds owned only the minimum quota
in 2016, and all owned less than 10,000 lb (4536 kg). For those that fished a full block (1%,
61,000 lb [27,669 kg]) of halibut quota, ownership less than 0.17% would have meant leasing
quota of between about 51,000 lb and 60,000 lb, at an estimated average lease cost of between
$428,000 and $504,000, out of a total landed value on 61,000 lb (27,669 kg) of halibut of about
$580,000.
4.3 Methods
An enterprise-level financial performance model was developed for a hypothetical owner-
operated halibut fishing enterprise to consider the financial impact of quota leasing. The model
provides relative and generalized financial performance metrics under different leasing
arrangements. The approach uses costs and earnings inputs based on a standard accounting
framework (Whitmarsh et al. 2000; Ovenden 1961; Hartmann et al. 2015). Given the lack of data
on regular or comprehensive costs and earnings in BC fisheries, the assessment relies on

87
modelling financial outcomes of a hypothetical owner-operator halibut fishing enterprise,
informed by analysis of fleet characteristics.
The financial performance model was informed by an ownership and quota leasing database that
was constructed as part of a broader research project into the BC groundfish fisheries (Edwards
and Pinkerton 2019c; Edwards 2019). The database was compiled from three datasets received
from DFO through access to information requests, supplemented by the Statistics Canada Inter-
Corporate Ownership historical databases, BC Provincial Corporate Registry Services records,
BC provincial processor licence lists, the Transport Canada ships registry and online searches
including court proceedings, address directories, and fisheries advisory process documents. The
database was used to determine the extent of leasing, participation in other fisheries, and licence
and quota ownership of both halibut and non-directed species quota caught in the halibut fishery
to develop financial performance scenarios that are reflective of the conditions under which
owner-operator fishing enterprises are operating in the fishery. As well, DFO’s conditions of
licence, vessel and licence registration requirements and annual management plans were
reviewed to ensure scenarios were consistent with the regulatory environment within which
fishing enterprises operate.
As detailed financial information, particularly at the enterprise level, is not readily available for
BC fisheries, cost inputs for a representative fishing enterprise were estimated from available
data, with corrections and updates informed by information provided by fishery participants.
Revenue and cost inputs were informed primarily by the DFO-commissioned reports on Pacific
fishery financial performance for 2007 and 2009 (Nelson 2009; 2011), with adjustments to better

88
reflect prices and costs in 2016 (Edwards 2019). Industry participation was facilitated through
the Canadian Fisheries Research Network – a six-year research network funded by the Natural
Sciences and Engineering Research Council of Canada (NSERC) that brought together
academia, industry and government to undertake collaborative research on fisheries in Canada.
4.4 Fishing enterprise cost and earnings categories
A fishing enterprise financial model consists of gross revenue and a series of cost and earnings
categories (Figure 4.1) (Whitmarsh et al. 2000). The gross revenue is the landed value of the
enterprise catch, which in the case of halibut enterprises includes halibut catch and non-directed
catch of other species in the halibut fishery, such as sablefish, lingcod and rockfish. The gross
revenue for a fishing enterprise must cover a number of short-run (e.g., operational and fixed
costs, labour) and long-run costs (e.g., vessel replacement, quota amortization). There is no
consistent approach for the treatment of the captain share, with some approaches including the
captain share with net profit (EB Economics 1992; Pascoe, Robinson, and Coglan 1996;
Whitmarsh et al. 2000), while others separate it out as a cost category (Gislason 1997; Hartmann
et al. 2015). The risk of including the captain share with the net profit is that it can inflate the
perceived profitability of the enterprise and can undervalue the importance of the owner-operator
earning a living wage. It was for these reasons, as well as the fact that from the perspective of the
enterprise, the captain share is a cost, that captain share was included as a labour cost category
for this analysis. What remains after short-run costs are deducted is the earnings before interest,
taxes, depreciation and amortization (EBITDA) (Duy, Flaaten, and Long 2015). The EBITDA
covers debt servicing of previous investments as well as new investments to upgrade or replace
the vessel or make purchases of quota or licences. The remainder of the earnings after interest,

89
taxes, depreciation and amortization have been deducted is the ‘net profit’. Net profit can also be
referred to as the financial profit, boat income or enterprise income. Net profit is important to
financial viability to mitigate losses in years when costs are greater than planned and to provide
the financial opportunity to innovate new technologies and approaches and re-invest in the
fishing enterprise to improve performance and safety.
Figure 4.1 Enterprise level financial cost and earnings categories, consisting of the gross revenue to the
enterprise, the after-lease revenue to the enterprise (gross revenue less lease fees), operational costs, annual
fixed costs, labour costs (crew share and captain share), and EBITDA (earnings before interest, taxes,
depreciation and amortization – long-run costs plus net profit).
4.5 Data inputs for the financial performance model
There is no regular, statistically valid data collection of enterprise-level costs and earnings in the
BC fisheries. The last year for which data from DFO cost and earnings survey data is available is
1994. To assess the performance of a typical owner-operator vessel participating in the halibut
fishery, revenue and cost inputs for a representative fishing enterprise were estimated from a

90
number of sources, primarily two reports commissioned by the management agency for the 2007
and 2009 fishing years (Nelson 2009; 2011). The sources, assumptions and rationale for each of
the cost and earnings inputs used are provided in the following subsections.
4.5.1 Halibut catch revenue
The halibut catch revenue input value used was based on 61,000 lb (27,669 kg), about the
amount of a full block (1% of the TAC) in 2016, at the 2016 average landed price of $9.50/lb
(Edwards 2019; Province of BC 2017). Due to the fixed costs in the fishery, the most profitable
amount to fish is a full block of quota (Nelson 2011), provided the operating and crew costs are
less than the after-lease price. A full block of quota can be readily caught within the fishing
season. The fishing season typically extends from March to November (DFO 2016b). For larger
vessels, 61,000 lb (27,669 kg) of halibut can usually be caught in 2 or 3 trips, of up to 8 days
each. For smaller vessels, this catch can be spread out over as many as 5 or more trips. To catch
a full block of quota is common in the fishery. In 2016, 21 of 65 owner-operators caught at least
95% of a full block. Of the 18 owner-operators that entered the fishery after 2001, 13 caught at
least 75% of a full block and 8 caught at least 95% of a full block.
4.5.2 Non-directed catch revenue
The non-directed catch can vary widely by vessel. Non-directed catch limits cap the amount of
non-directed catch that can be landed by an individual vessel as well as the quota that can be
transferred into the sector as a whole (DFO 2016b). Fishery participants have also reported
difficulty in accessing non-directed quota (FOPO 2019b), even though the majority of the quota
for nearly all of the species caught as non-directed catch in the halibut fishery are unfished at the

91
end of the year (DFO 2017). This difficulty in accessing quota can arise from a number of
factors, including the initial allocation of rockfish quota in 2006 that allocated small amounts of
more than a dozen species/area quotas onto nearly 200 licences, as well as the absence of any
quota registry or open trading mechanism to enable fishery participants to identify quota for
lease. Also, the generally low prices for most non-directed quota is not a strong incentive for
owners of the quota to lease it out. For most non-directed catch, with the notable exception of
sablefish, landed prices are typically between $0.30/lb and $3.00/lb and lease prices usually from
$0.01/lb to $2.00/lb, depending on the species and area. There is little demand for many of the
species/area quotas and the lease value for the typically small amounts of sought-after quota that
owners hold is often only in the tens to hundreds of dollars.
An input value of $25,000 in earnings for non-directed catch revenue was assumed, based on a
gross revenue of $45,000 less a lease price of $20,000, from typical non-directed catch reported
in Nelson (Nelson 2011), updated to 2016 landed and lease prices reported by government
statistics (Province of BC 2017) and information provided by fishery participants, and consistent
with the average non-directed catch for the halibut sector (DFO 2017). Enterprises were assumed
to lease 100% of the sablefish quota and 50% of the rockfish and lingcod quota. Consideration of
different fishing patterns of non-directed catch, and the functioning of the non-directed quota
leasing market, were beyond the scope of this research, but are logical extensions for further
analysis.

92
4.5.3 Operational and fixed costs
The operational costs and the fixed costs were based primarily on aggregate values reported in
Nelson (2009; 2011). Operational costs reported by Nelson, when converted to a per pound basis
and adjusted to a catch of 61,000 lb (27,669 kg) of halibut, ranged from $30,700 to $57,200, with
the vessels catching a full block of halibut having the lowest per pound cost. The average
operational costs for 2016 were estimated to be $40,000. Fixed costs for vessels catching a full
block were reported as $19,200 in 2007 and $22,500 in 2009. The average fixed costs for 2016
were estimated to be $25,000, of which 50% was assumed to be covered by the halibut fishery
under the base scenario, and the other 50% covered by other fisheries that the fishing enterprise
participates in, yielding a fixed cost of $12,500. This assumption is consistent with the historical
reliance on other fisheries (Gislason 1997) and the current multi-licenced nature of the fleet
(Edwards 2019). However, given the recent poor financial health of other fisheries that many
halibut fishermen participate in (Nelson 2011), assuming a 50% contribution from other fisheries
may not be warranted. This situation underlines the importance of assessing the sensitivity of
EBITDA and net profit to the estimated fixed expense cost category. As well, when income is
insufficient to cover fixed costs, maintenance and repairs of the vessel can also be deferred,
albeit at the risk of having an unsafe and deteriorating vessel.
The assessment of the sensitivity of the EBITDA to the cost inputs included low and high cost
operational and fixed expense scenarios, to consider how the results would vary if the fishing
enterprise were a lower cost versus a higher cost operation. This sensitivity analysis tested the
impact of the assumptions on input costs and also provided insights into how variable input costs
would impact the financial outcomes for different fishing enterprises. The operational costs were

93
reduced by 50% to $20,000 for the low cost scenario and increased by 50% to $60,000 for the
high cost scenario. The portion of the fixed costs covered by the halibut fishery was set at 25%
of the fixed costs ($6250) under the low cost scenario and 75% of the fixed costs ($18,750)
under the high cost scenario.
4.5.4 Crew share
Nelson (2011) reported crew costs to be 10% of gross revenue per crew member with 3 crew
members on vessels fishing about 66,600 lb (30,210 kg) of halibut quota, which was a full block
of quota (1% of the TAC) in 2009, totalling 30% of gross revenue equivalent to $120,000. The
common practice for crew share arrangements, since the introduction of ITQs in halibut, is for
crew to be paid a percentage of the after-lease revenue rather than the gross revenue. Even when
the quota is owned by the captain, a lease fee is usually applied that is paid directly to the captain
and the crew is paid on the after-lease revenue (Pinkerton and Edwards 2009). As confirmed by
fishery participants, the crew share typically ranges from 10% to 20% of the after-lease revenue
per crew member, depending on experience and performance. As well, other costs beyond lease
fees (e.g., monitoring fees, fuel, bait) can be subtracted from the gross revenue before applying a
percentage share, although, unlike the subtraction of lease fees, there is no common practice for
the treatment of other costs and the formulas used can vary widely, even between trips on a
single vessel.
Paying the crew a percentage of the after-lease revenue is a highly significant change from
paying the crew a percentage of the gross revenue. Not only does a share of the after-lease
revenue translate into much lower earnings than a share of the gross revenue (10% share of gross

94
revenue in 2016 would be about $62,000 whereas a 20% share of after-lease revenue would be
about $29,500), but while landed price has sharply increased in recent years, lease fees have
closely tracked this increase (Figure 4.2). As a result, the after-lease price has been stable to
decreasing even as landed price has almost doubled. This has meant that crew earnings, on a per
pound basis, have not increased as landed price increased. The entire crew share for a crew of
three was estimated to be 50% of the after-lease revenue (e.g., two crew receiving 15% each and
the senior crew member receiving 20%), to a maximum of $110,000, as even the highest paid
senior crew member would not expect to make more than $40,000 from the halibut fishery in
2016, and junior crew members even less (Pynn 2018).
Figure 4.2 The halibut landed price ($/lb) and average after-lease price ($/lb), in 2016 constant dollars, for
1991 to 2016 (Edwards 2019).
4.5.5 Captain share
For the captain share, information on average and living wages was sourced from government
and third-party sources (Statistics Canada 2019a; Canadian Centre for Policy Alternatives 2018).
The average wage for a supervisor in the natural resources industries before taxes was $60,000 in
2016 (Statistics Canada 2019a), which is at the low end of a living wage in coastal British
Columbia (Canadian Centre for Policy Alternatives 2018). This is considered a minimum for a

95
reasonable wage, particularly given the skills and experience needed to be a successful captain of
a fishing vessel. The captain share can also be supplemented by non-fishing income, family
income, and government benefits. Employment Insurance (EI) is used by both crews and
captains to supplement their income if their earnings are low. An individual could receive up to a
maximum of about $14,000 in taxable EI benefits in 2016 (Employment and Social Development
Canada 2018).
The assumption for the base input for the financial performance model assumed that 50% of the
captain share ($30,000) would be covered by the halibut fishery and 50% covered by other
fisheries/income sources. This assumption was informed by fishery participants’ historical
reliance on other fisheries (Gislason 1997) and multi-licence holdings (Edwards 2019). As
discussed previously in the section on operational and fixed costs, the recent poor financial
returns from a number of other fisheries important to halibut enterprises (Nelson 2011) calls into
question the validity of the assumption that there will be income from other sources to cover the
remainder of the captain share. To test the sensitivity of the EBITDA to this assumption, the
captain share covered by the halibut fishery was set at 25% of the captain share ($15,000) under
the low cost scenario and 75% of the captain share ($45,000) under the high cost scenario, the
results of which are discussed in the results section below. As well, when income is insufficient
to cover the captain’s share, the captain can take a reduced share, although this is not a strategy
that can be sustained over the long-term.

96
4.5.6 Quota leasing
Short-term financial performance was assessed for three ownership scenarios: (1) the minimum
quota holdings on a licence (710 lb [322 kg]), (2) 10,000 lb (4536 kg), and (3) 40,000 lb (18,144
kg). Ownership is actually a percentage of the TAC, not a poundage, with percentage translated
into quota pounds each year. As such, quota pounds owned, including the minimum holdings,
will change from year to year as the TAC changes. The minimum scenario of 710 lb (322 kg) is a
rounded value of the minimum in 2016 (706 lb [320 kg]). Financial performance was also
assessed for three price scenarios: (1) $1.15/lb, which was the average after-lease price in 2016
based on the reported lease fee (Simpson 2017) and average landed price (Province of BC 2017)
– the lowest after-lease price since 1998 (Edwards 2019), (2) $2.00/lb, the ten-year average
after-lease price from 2007 to 2016, and (3) $4.75/lb, a lease price of 50% of landed value
available on a preferential basis to some fishing enterprises (Boyes 2019) – typically those with
significant quota ownership (i.e., more than 10,000 lb [4536 kg]) that are able to negotiate a
better lease price from processors in exchange for delivering the entirety of their catch to the
processor.
4.5.7 Interest, taxes, depreciation and amortization
For the assessment of earnings after interest, taxes, depreciation and amortization, base inputs
were identified for enterprise taxes, depreciation of an existing owned vessel, interest for debt
servicing the purchase of a halibut licence and quota, and amortization of the licence and quota.
The tax rate in Canada for small businesses with less than $500,000 in income in 2016 was
10.5%. Vessel depreciation was set at 5%, on a replacement cost of $200,000, which is a low-
end vessel cost (Castlemain 2018). The purchase price for minimum quota (770 lb [349 kg] in

97
2010, 706 lb [320 kg] in 2016) and a halibut licence was $100,000 in 2010 and $135,000 in 2016
(Edwards 2019). The purchase price of 10,000 lb (4536 kg) of quota and a licence was about
$475,000 in 2010 and about $1.02 million in 2016, and for 40,000 lb (18,144 kg) of quota and a
licence was about $1.82 million in 2010 and $3.87 million in 2016.
In BC, banks will typically not lend more than 50% of the value of the licence and quota, at a
maximum, at commercial interest rates (averaging about 5% in recent years, plus or minus 1%),
and only for a short amortization period (i.e., 3 to 5 years). If the borrower has other assets such
as a house that can be used for collateral, the terms of the loan can be more favourable, including
a longer amortization period and a lower interest rate. Both low and high end cost scenarios for
the debt servicing of the purchase of a halibut licence and quota were considered, for the low end
at the 2010 purchase price at 3% interest and a ten-year amortization and for the high end at the
2016 purchase price at 5% interest, also with a ten-year amortization.
4.5.8 Net profit
The net profit is the earnings after interest, taxes, depreciation and amortization. Net profit
margin is the net profit divided by the total revenue. The average net profit margin was 7.0% for
small enterprises in Canada in 2012 and 3.7% for medium-sized businesses (Government of
Canada 2015). Based on the average net profit margin for small and medium enterprises (SMEs)
in Canada and a gross revenue of $624,500, which was the average gross revenue for a halibut
fishing enterprise fishing a full block of quota in 2016, the net profit for a halibut fishing
enterprise was expected to be between $20,000 to $45,000.

98
4.5.9 Summary of Data Inputs
The data inputs used to assess the financial performance of a hypothetical owner-operator vessel
participating in the halibut fishery, as described in the previous sub-sections, are summarized
below (Table 4.1).
Table 4.1 Scenario inputs for a hypothetical owner-operator halibut fishing enterprise, catching a full block
of quota (61,000 lb [27,669 kg] or 1% of the TAC in 2016), including low cost and high cost scenarios.
Category Value
Halibut catch gross revenue $579,500
Non-directed catch net revenue $25,000 (net after lease)
Operational costs $40,000; Low Cost: $20,000; High Cost: $60,000
Fixed costs $12,500; Low Cost: $6250; High Cost: $18,750
Crew share (for 3 crew) lower of 50% of after-lease landed value or $110,000
Captain share $30,000; Low Cost: $15,000; High Cost: $45,000
4.6 Results: financial performance
Financial performance was evaluated through a (1) basic profit model to calculate earnings
before interest, taxes, depreciation, and amortization (EBITDA) under different quota ownership
and after-lease price scenarios (Figure 4.3) and (2) through an extension of the basic profit model
to also consider high and low cost scenarios for both EBITDA and net profit (earnings after
interest, taxes, depreciation, and amortization) (Figure 4.4).

99
Figure 4.3 The financial performance of a halibut fishing enterprise under different leasing and ownership
scenarios, where the after-lease price is one of $1.15/lb, $2.00/lb, or $4.75/lb, and where the quota owned by
the fishing enterprise is 710 lb (322 kg), 10,000 lb (4536 kg), or 40,000 lb (18,144 kg).
Figure 4.4 The earnings of a halibut fishing enterprise before interest, taxes, depreciation and amortization
(EBITDA) and after (net profit), for three after-lease price ($1.15/lb, $2.00/lb and $4.75/lb) and three quota
ownership (710 lb [322 kg], 10,000 lb [4536 kg] and 40,000 lb [18,144 kg]) scenarios. The vertical bars indicate
the range of earnings under high and low cost scenarios. Dashed horizontal lines at $20,000 and $45,000
indicate the range of expected net profit.
For fishing enterprises leasing most of the quota that they catch, lease fees are the largest cost
category by far. At $1.15/lb, for an enterprise that owns only the minimum quota holdings,

100
operational costs could be covered, crews receive a reduced share, the halibut fishery makes a
partial contribution to fixed costs for the year and the captain receives no income from the
fishery. At $2.00/lb, the crew share is still reduced, but double what is paid under the $1.15
scenario, the halibut fishery portion of the fixed costs are covered, and the captain receives some
income from the fishery. If a 50% lease rate were available to fishing enterprises with low
ownership ratios (enterprises leasing more than 80% of the quota that they fish), enterprises
would be profitable. However, preferential lease prices have typically only been available to
owners of large blocks of quota that are able to negotiate prices with processors by guaranteeing
delivery of their own quota to the processor. Owner-operators that own 10,000 lb (4536 kg) or
less of quota cannot expect to be recipients of a preferential quota price. For those that own
40,000 lb (18,144 kg) of quota, the fishery is highly profitable, regardless of the lease price being
paid for the remaining 21,000 lb (9526 kg) that they lease. Owners of 40,000 lb (18,144 kg) of
quota, compared to those that own the minimum or moderate amounts of quota, earn at least
$200,000 more that would otherwise be paid in lease fees. Even if these owners receive only
$1.15/lb on the 21,000 lb (9526 kg) of halibut that they lease, their fishing operations are
profitable on the basis of the quota on which they receive the full landed value. Yet it is these
owners, with substantial quota ownings that they can leverage in accessing additional quota from
processors, that are most likely to receive a higher after-lease price through preferential lease
arrangements (Boyes 2019).
While enterprises that owned 10,000 lb (4536 kg) and 40,000 lb (18,144 kg) of quota would be
profitable under EBITDA scenarios, when debt servicing and repayment costs for the purchase
of the halibut quota and vessel depreciation are included, these scenarios are only profitable

101
under the lowest cost scenarios. Even for the 40,000 lb (18,144 kg) quota ownership scenario
that is highly profitable under EBITDA, the cost of repaying the quota purchase at 2016 quota
purchase prices overwhelms earnings and leads to high annual losses, close to $300,000 per year,
over the repayment period. The main difference between the lower and upper cost scenarios for
the 10,000 lb (4536 kg) and 40,000 lb (18,144 kg) scenarios is the cost of purchasing the quota,
with the purchase price per pound of quota more than doubling between 2010 (the low cost year)
and 2016 (the high cost year). Given current price conditions in the fishery, in which lessee
owner-operators are not profitable over the long-term and income from the fishery does not
support repayment of quota purchase costs, there is no scenario in which the fishery is
self-sustaining for owner-operators over the long-term.
The results of the historical costs and earnings surveys for 1988, 1991 and 1994 are compared to
2016 values to consider how financial performance has changed over time (Table 4.2). The
historical results are sourced from two reports: an evaluation of the halibut fishery conducted in
1992 (EB Economics 1992); and a 1997 report on the BC fishing fleet financial returns in 1991
and 1994 (Gislason 1997). Both reports were commissioned by DFO, and cited the DFO costs
and earnings survey as their data source for costs. There are discrepancies in the 1991 values
between the two reports that can be attributed to minor methodological differences. Values for
1991 from both reports are included here. There are a number of data availability issues with the
historical surveys that had to be accounted for in the comparison. Fixed costs, interest and
depreciation were not broken down by fishery in the historical surveys. As well, taxes and
amortization data were not collected. Furthermore, the practice at the time of the 1992 report was
to not separate out the captain share. For these reasons, the earnings before interest, taxes,

102
depreciation, amortization, captain share and fixed costs (EBITDACF) values per pound are
compared between years. For 2016, a range of values is identified for a lessee owner-operator
with minimum quota holdings (710 lb [322 kg]) fishing a full block of quota (61,000 lb [27,669
kg]). The low end of the range represents the high end of operating costs and an after-lease price
of $1.15/lb and the high end of the range is for the low end of operating costs and an after-lease
price of $2.00/lb.
Table 4.2 Earnings before interest, taxes, depreciation, amortization, captain share and fixed costs, per pound
of halibut quota, for the years 1988, 1991 (from two sources), 1994 and 2016, in current dollars and constant
2016 dollars. For 2016, the value represents the range of expected earnings for a lessee owner-operator with
minimum quota holdings.
Year current $/lb constant 2016 $/lb
1988a 0.87 1.57
1991a 1.76 2.73
1991b 1.90 2.94
1994b 2.42 3.63
2016
–0.16 to 0.92 a (EB Economics 1992) b (Gislason 1997)
4.7 Discussion
There is no scenario in which the ITQ halibut fishery in BC is self-sustaining for owner-
operators. It is not possible for new owner-operator entrants, or existing entrants with minimal
quota ownership, to earn sufficient income from the halibut fishery to purchase quota and
improve their ownership position. The only possible avenue for new entrants to become owners
is through the infusion of external capital not tied to commercial repayment terms. Crews on
majority lessee vessels cannot earn a living wage, contributing to difficulties attracting and
retaining crew, consistent with well-documented negative impacts of ITQs on employment

103
(Casey et al. 1995; Gislason 2008; Guyader and Thébaud 2001; Carothers 2015). This raises
serious questions about the success of the ITQ management system, given longstanding
objectives for fisheries in Canada to support viable, independent inshore fleets.
4.7.1 Landed Price Gains and the Distribution of Earnings
ITQs have been lauded as delivering improved financial performance to halibut fishery
participants, driven by higher landed values associated with spreading catch over a longer time
period to reduce market gluts and enable access to higher value markets and more efficient
fishery operations (Casey et al. 1995; EB Economics 1992; Gislason 2008). A 1992 evaluation of
the halibut IQ fishery (EB Economics 1992) attributed 40% of the near doubling in the landed
price between 1988 and 1991 to individual quota (IQ)5 implementation. A 1995 paper on the
fishery attributed a 55% increase in landed price to IQs (Casey et al. 1995). This early narrative
has been persistent, with these reports consistently referenced in justifying and promoting the
ITQ management system (Grafton et al. 2006; Gislason 2008; B. R. Turris 2010). However,
these claims should be considered with caution, as a re-examination of the price trends do not
support these conclusions (Edwards 2019); the evaluations did not follow best practices; and, the
distribution of the benefits from landed value gains was not considered.
Based on annual DFO price data from the required submission of fish sales slips, rather than on a
costs and earnings survey conducted every 3 years, and once corrected for inflation, the halibut
landed price was increasing in BC prior to IQ implementation. The landed price in 1990, one
5 The halibut fishery was a non-transferable individual quota fishery for its first two years of implementation (1991
and 1992). Transferability was introduced on a limited basis in 1993 and transferability restrictions gradually
loosened over time until quota became fully transferability in 1999.

104
year prior to IQs, increased 33% over the 1989 price. The price in 1991 (the first year of IQs)
increased 14% over the 1990 price, and the price in 1994 was a 37% increase over the 1990
price. To attribute these increases to IQs, given the existing trend prior to IQs, is not supportable.
Furthermore, these studies considered only IQs versus business-as-usual scenarios, on the
assumption that in the absence of IQs, no management changes would have been made to the
fishery. Evaluations should not only consider the chosen management approach versus business-
as-usual, but also alternative approaches that could have been used (Day and Gunton 2003).
There were a number of alternative management approaches that also could have resulted in
catch spread over a longer time period (Pinkerton 2013; Pinkerton et al. 2018); however, these
alternative approaches were not evaluated at the time that ITQs were being considered for
implementation nor in the subsequent evaluation of the ITQ fishery commissioned by DFO. And
finally, and perhaps most importantly, despite landed price increases, lessee owner-operators are
realizing earnings per pound substantially less than earnings per pound available to fishery
participants in 1988, let alone in 1991. Financial improvements in the fishery attributed to IQs,
whether appropriately attributed or not, are not available to fishery participants that entered the
fishery following IQ implementation. In contrast, the Atlantic halibut fishery has been
successfully managed to spread effort throughout the year and receives some of the highest
halibut prices in Canada, with no investor class and the fishermen as the recipients of the
majority of the landed value from the fishery (Pinkerton et al. 2018; Fish, Food and Allied
Workers 2018).

105
4.7.2 Original Grantees and New Entrants
Quota lease prices are expected to reflect the resource rent generation in the fishery (Eythórsson
1996), and sustained high prices are claimed as proof that a fishery is successful and healthy
(Newell, Sanchirico, and Kerr 2005). The implicit assumption is that lease prices will adjust to
be profitable for the lowest cost operators. In the case of the BC halibut fishery, profitability is
much more a function of quota holdings than operating costs. Operating costs are estimated to
equal between 3% and 10% of gross revenue. For a lessee owner-operator, owning minimum
quota, lease fees are estimated to equal between 72% and 81% of gross revenue. Half of the
owner-operators active in the fishery are original grantees, many of whom have significant quota
holdings. About half of owner-operators in 2016 owned more than 10,000 lb (4536 kg) of quota,
of which 80% were original grantees and the remaining 20% were early entrants having entered
the fishery by 2001. An enterprise with significant quota holdings will have substantially better
financial performance than an enterprise with minimum holdings, regardless of their relative
operating costs.
New entrants are continuing to participate in the halibut fishery because they have few other
employment opportunities and can leverage existing assets such as vessels and gear. For these
lessees, financial performance is very sensitive to lease price and fishing costs. If owner-
operators receive an average or better than average after-lease price and are able to keep fishing
costs low, then the captain and crew can earn a marginal living, in most years. Over the short-
term, this is rational, if highly optimistic, behaviour. However, at current lease rates and costs of
fishing, long-term requirements, such as major vessel repairs and vessel replacement, are not
being met.

106
As original grantees and early entrants exit the fishery and sell their quota or transition to the
investor class, owner-operators who own a significant portion of the quota that they fish are not
being replaced. Yet it is the quota-owning owner-operators that past evaluations of leasing in the
halibut fishery have focused on (Nelson 2009; 2011), which has provided a much more positive
impression of financial performance than is the reality for new entrants. New entrant owner-
operators own virtually no quota and are not buying halibut quota in any appreciable amount.
The lack of investment can be attributed to a combination of factors: (1) poor returns to lessees
in the halibut fishery, (2) high quota purchase costs, and (3) limited access to capital.
4.7.3 Fishery Reinvestment and Fleet Renewal
While fishing enterprises are an important source of jobs and economic activity for coastal
communities, this is not true of investors that lease their quota out. The practice of leasing quota,
and high lease prices, are undermining fishing enterprises and eroding the ability of fishing
enterprises to reinvest in their business and remain viable. For lessor quota owners who do not
own a fishing enterprise, there is no financial incentive to make investments in a fishing
enterprise. The profit generated from leasing their quota to others to fish is higher than what
could be earned from fishing it, given costs to purchase and maintain a vessel. For lessee fishing
enterprises, revenues after-lease do not support re-investment in the fishery. For original grantee
owner-operators, with existing investments in vessels and who are also participating in other
fisheries, the revenue generated from fishing their own quota can be enough of an incentive to
continue fishing, particularly if they receive a preferential lease rate to supplement their own
quota holdings. As these original grantees age, however, they are leaving the fishery and the new

107
entrants replacing them do not have the benefit of existing quota holdings that they can leverage
for better lease prices or to supplement their revenue from leased quota. This has implications
not just for the fishery and owner-operator fleet, but also for the BC shipbuilding, ship repair,
and marine service industries, and associated coastal communities.
4.7.4 Data Availability and Analysis
Assessing the financial performance of fishing enterprises can provide insights into the viability
of individual enterprises that comprise the fishing fleet, the distribution of the costs and benefits
of the fishery, the potential for new entrants to replenish and maintain the fleet, and the ability of
enterprises within the fleet to reinvest. There are significant data gaps in Canada’s fisheries
management system, including sparse socio-economic data (Cisneros-Montemayor et al. 2017).
A lack of disaggregated socio-economic data can negatively impact the design and assessment of
management measures (OECD 2019). A Canadian Parliamentary House of Commons Standing
Committee on Fisheries and Oceans report, released in May 2019, provided twenty
recommendations for transforming the West Coast fisheries licencing system, including three
recommendations specific to data, analysis and reporting. One of these recommendations was
that DFO “prioritize the collection of socio-economic data for past and future regulatory changes
and make this information publicly available” (FOPO 2019a, 33). The collection of costs and
earnings data, and the subsequent analysis of that data to understand the impact of ITQ
management and quota leasing on the halibut fleet, would address a critical gap in the evidence-
base and inform decision-making in BC fisheries. This analysis would also provide insights into
the impact of leasing in ITQ fisheries of relevance to other jurisdictions with ITQs or considering
their implementation.

108
4.8 Conclusion
Owner-operators are being priced out of ownership in the halibut fishery. There is no reasonable
avenue for new owner-operators to enter the fishery. The financial performance of original
grantee owner-operators has led to the mistaken impression that the situation for owner-operators
within the halibut fishery is sustainable over the long-term. The financial performance of new
entrants into the fishery tells a different story, and points to a lack of renewal and re-investment
and unsustainable lease prices that are inhibiting the renewal of the fleet and fishery. This
jeopardizes the safety of the fishing fleet and suggests that the long-term outlook for the fishery
is a continued decline of the owner-operator fleet. This has implications not just for the fishery
and owner-operator fleet, but also for the businesses that provide services to the fishing sector
and the communities that rely on the fishery.
The halibut fishery is an important source of employment and business opportunities in BC, but
leasing is critically undermining the ability of the fishery to provide prosperity to anyone beyond
a few investors and original grantees. Fisheries policy should consider the overall objectives for
the fishery, which in Canada includes supporting prosperous communities, the equitable
distribution of benefits, and maintaining a viable and stable fleet. With new entrants priced out of
ownership, the owner-operator fleet struggling to remain viable, and the wealth from the fishery
increasingly captured by investors that do not contribute to the fishery or the coastal
communities that have traditionally depended on the fishery, questions should be raised about
whether the management approach that has been taken is appropriate. New costs and earnings
data collection processes and regular analysis and reporting would provide much needed insights
into the state of the fleet and the extent to which objectives for the fishery are being met.

109
Chapter 5: Unscrambling the Omelet: Introducing socio-economic measures
to an established Individual Transferable Quota fishery
In Canada, fisheries are expected to contribute to prosperous coastal communities and the
maintenance of stable and viable fishing fleets. Mounting evidence has definitively demonstrated
that these objectives are not being met in Canada’s Pacific fisheries, with the wealth from the
fisheries increasingly captured by investors and corporate interests. Representatives of the
government management agency have asserted that the Pacific fisheries licencing system is like
an omelet – an egg that has been scrambled and partially or even “fully baked” (Minister of
Fisheries and Oceans 2019), implying an irrevocability to past licencing decisions. However, the
Government of Canada has considerable scope to make changes to address failings in the current
management system. This chapter considers options for introducing measures to established
fisheries to achieve socio-economic objectives.
5.1 Introduction
The Pacific fisheries licencing system in British Columbia (BC), Canada has been likened to an
omelet (Minister of Fisheries and Oceans 2019), implying that past licencing decisions in BC
have granted de facto property rights which are essentially irreversible. That seemingly rights
based licencing systems are viewed as unalterable once implemented is a common refrain in
fisheries around the world, particularly so for those fisheries managed under individual
transferable quotas (ITQs) (Arnason 2007; Scott 1996; 2000; Eythórsson 1996), that provide “the
illusion of certainty” (Charles 1997, 108). ITQs are permits allowing the holder of the ITQ to
catch or transfer a share of a total allowable catch (TAC). ITQs are discussed by many as if they
110
were private property rights and licencing systems based on them have been widely promoted as
a means to achieve positive economic and conservation outcomes (Casey et al. 1995; Grafton
1996; Grafton et al. 2006; Branch, Rutherford, and Hilborn 2006; Grimm et al. 2012). Although
ITQs do not legally qualify as property in most jurisdictions, including Canada, ITQs are
generally treated as private property in practice (Grafton et al. 2006), and property rights are
regarded as a critical component of ITQs (Arnason 2005). The seeming security of access that
ITQs offer through the establishment of pseudo-property rights has been cited by proponents as
an argument for their implementation (Grafton et al. 2006; Arnason 2005; Hannesson 2004;
Scott 1989). The introduction of property rights (de jure or de facto) in fisheries has been shown
to contribute to inflexible fisheries management that can be incompatible with the precautionary
approach to fisheries management (Appleby, Cardwell, and Pettipher 2018; Bromley 2009;
Phillips, Kriwoken, and Hay 2002; Acheson, Apollonio, and Wilson 2015; Copes 1998). The
precautionary approach is a cornerstone of fisheries management in Canada (Oceans Act (S.C.,
1996, c. 31) 1996; Government of Canada 2002). Furthermore, ITQs have been widely criticized
for their inequitable distribution of benefits, the social and economic outcomes for fisheries-
dependent communities, and poor outcomes in resilience, employment, and safety (McCay 1995;
2004; Pálsson and Helgason 1995; Copes and Charles 2004; Ussif Rashid Sumaila 2010;
Carothers, Lew, and Sepez 2010; Pinkerton 2014; Emery et al. 2014; Carothers 2015). This has
not prevented their continued adoption, however, with ITQ management in widespread use,
including in Canada, Australia, Iceland, Chile, New Zealand, and the United States (Arnason
2012; OECD 2019; 1997).

111
Fisheries are expected to achieve a myriad of social, economic and ecological objectives. In
Canada, fisheries management is expected to meet a full spectrum of socio-economic objectives,
including benefits to adjacent communities, maintenance of small boat independent fleets, and
distribution of benefits amongst participants (Stephenson et al. 2018). The Government of
Canada is mandated to safeguard the interests of Canadians in managing fisheries as a common
pool resource (Fisheries Act (R.S.C., 1985, c. F-14) 1985). The 1976 ‘Policy for Canada’s
Commercial Fisheries’ (Government of Canada 1976) established the national fisheries policy in
Canada for the modern era and stated that “the guiding principle in fishery management no
longer would be maximization of the crop sustainable over time but the best use of society’s
resources. ‘Best use’ is defined by the sum of net social benefits (personal income, occupational
opportunity, consumer satisfaction and so on) derived from the fisheries and the industries linked
to them” (p. 53). These objectives have since been affirmed in legislation (Oceans Act (S.C.,
1996, c. 31) 1996) and policy (DFO 1999a; 2018a). Past Fisheries Ministers have reaffirmed that
fisheries in Canada are meant to provide a good living for the people in the industry (D.
Anderson 1998), where the benefits of the fishery go to those who work hard to prosecute it, and
the communities that support them (LeBlanc 2017) and DFO has repeatedly affirmed the
objective of stable and viable fleets among other objectives (DFO 1999a; 1990). In testimony to
a parliamentary standing committee in 2019, the senior DFO official for the Pacific region
summarized the objectives that the management regime is intended to achieve as: (1)
conservation outcomes; (2) compliance with legal obligations, such as First Nations rights; (3)
promoting the stability and economic viability of fishing operations; (4) encouraging equitable
distribution of benefits; and, (5) facilitating the necessary data collection for administration,
enforcement and planning purposes (DFO 2019b).

112
Fishermen, academics, Indigenous Peoples and representatives from health authorities and not-
for-profit organizations have identified the licencing system in BC as responsible for
undermining the resilience of the BC inshore fishing fleet6 and the communities that rely on
them (FOPO 2019b; 2019a). Inattention to the social and economic consequences of fisheries
management has allowed absentee owners and corporate interests to take control and concentrate
the wealth from the fisheries into very few hands, to the detriment of working fishermen and
coastal communities, including First Nation fishermen and communities (FOPO 2019b; Nuu-
chah-nulth Tribal Council 2005; United Fishermen and Allied Workers’ Union 2005; Ahousaht
Indian Band and Nation v. Canada (Attorney General) 2009). The management agency, Fisheries
and Oceans Canada (DFO), does not collect data or publicly report on beneficial ownership,
quota leasing, corporate ownership, absentee ownership or the distribution of benefits in the BC
fisheries to directly address the concerns that have been raised. Corporate fishing representatives
have dismissed the concerns raised as largely unfounded (BC Seafood Alliance 2019a; Morley
2019). However, independent analysis of ownership and leasing trends in the BC fisheries have
demonstrated increasing corporate concentration and control (Haas, Edwards, and Sumaila 2016;
Edwards and Pinkerton 2019c), high levels of corporate and absentee ownership (Edwards and
Pinkerton 2019b), the loss of fisheries access from coastal communities (Edwards et al. 2006),
and the financial barriers that quota leasing poses to new entrants (Edwards and Pinkerton
2019a). Calls for further examination of the impacts of licencing policy in the Pacific fisheries
6 The inshore fishing fleet in BC is the fleet operating in fisheries that are primarily fished by vessels under 65’ in
length, characterized as historically independent, owner-operator, primarily operating in coastal waters, and
distributed along the BC coast with close ties to coastal communities.

113
prompted a review by the Parliament of Canada House of Commons Standing Committee on
Fisheries and Oceans (the ‘Committee’) into the issue (FOPO 2019a).
In May 2019, the Committee issued a unanimous report “West Coast Fisheries: Sharing risks and
benefits” following public hearings during which the Committee heard testimony from 40
witnesses (FOPO 2019a). The Committee made 20 recommendations for consideration by the
Government of Canada. The Committee’s 20 recommendations generally fall within one of four
categories: policy, planning and process; data, analysis and reporting; support programs and
structures; and, management. A heavy emphasis was placed on policy, planning and processes,
including the importance of stakeholder engagement and representation. The lack of data and
analysis was also highlighted, with three recommendations focused on improving data collection,
analysis and data availability. Support programs and structures were also recommended,
including loan boards, licence banks, and loan and mentorship programs. A number of discrete
management actions were identified, with two recommendations focused on transparency and
market access. The issue of quota leasing costs was addressed in three recommendations: (a) as a
topic for consideration by an independent commission, (b) within a support program
recommendation related to financial incentives, and (c) as a management action, directing DFO
to take immediate steps to regulate quota leasing costs.
This chapter provides an overview of measures that can be taken to transform an established
fisheries licencing system to achieve socio-economic objectives, and considerations for ensuring
a just and fair approach for fisheries transformation.

114
5.2 Measures to achieve socio-economic objectives
5.2.1 Ownership measures – policy, regulations and licence banks
Measures to restrict, control, or direct ownership are common in fisheries around the world.
These can take the form of policy direction providing guidance, regulations to restrict ownership
and ensure active participation in fisheries by owners, and collective ownership approaches to
support and encourage certain types of participants or participation, such as licence banks. Most
individual quota (IQ) managed fisheries around the world have ownership restrictions, that often
extends to transferability restrictions to ensure active participation of owners. BC’s ITQ fisheries
are unusual among global IQ fisheries in the complete absence of ownership restrictions. Some
BC fisheries have a cap on how much quota can be held on a licence (e.g., halibut, hake), but this
is only at the licence level; there is no restriction on how many licences can be owned by an
individual or company, and thereby no cap on ownership. Most licences in BC are vessel-based
licences; the licence is attached to the vessel, and the registered owner of the vessel is the
acknowledged owner of the licence. For an individual to be the registered owner of a fishing
vessel, they must be a Canadian citizen or permanent resident. However, there is no requirement
that vessels be registered to an individual; they can be registered to a company, and there is no
requirement that the owner of the company be a Canadian or permanent resident, or even a
requirement to declare ownership of the company. Furthermore, there is no requirement that the
company be registered in Canada, with foreign registered companies able to register vessel
ownership. There are also no requirements for owner-operator, owner-on-board, or any other
active participation measure for licence ownership in BC.
115
The Tasmania rock lobster fishery has a maximum ownership of 200 quota units (van Putten and
Gardner 2010). Alaska fisheries have a number of active participation measures, including
leasing prohibitions and owner-on-board requirements in the halibut, sablefish and Bering Sea
and Aleutian Islands crab fisheries (Szymkowiak and Himes-Cornell 2017). IQ fisheries in
Denmark, Norway, Sweden and the United Kingdom have transferability limits (Asche et al.
2008). Sweden has ownership concentration limits (Stage, Christiernsson, and Söderholm 2016).
New Zealand ITQ fisheries prohibit foreign ownership and have ownership concentration limits
(Macgillivray 1990). Iceland has ownership caps (Oostdijk et al. 2019) and Icelandic fishing
companies are required by law to be controlled by Icelandic entities and not to exceed 25%
ownership by foreign entities (Government of Iceland 1996). Atlantic Canada fisheries have a
fleet separation policy prohibiting corporate ownership in the inshore fisheries, owner-operator
requirements for the inshore fleet, and foreign ownership restrictions (Nguyen 2014; DFO
2007b).
In addition to policy and regulations to achieve ownership objectives, licence banks are a tool
that has been used in fisheries for decades (Copes 2000). Some early examples include the
Community Development Quota (CDQ) program in Alaska and the Northern Native Fishing
Corporation in British Columbia (Pinkerton 1987b; Ginter 1995; Pinkerton 2019). A licence
bank refers to the collective ownership of licences and/or quota by a government (federal,
Indigenous, provincial or municipal) or non-governmental organization. While many licence
banks have similarities in their design and objectives related to social and economic outcomes,
the licence bank concept does not dictate the purpose or objectives, and it is the objectives that
will dictate the appropriate design. These objectives can vary widely, from the repatriation of

116
licences to marginalized interests, maintaining access to adjacent coastal resources, providing a
pathway for new entrants, reducing gear impacts, or securing access rights for members
(Carothers 2011; Ecotrust Canada 2008; GAP2 2014; Pinkerton 2019; WCVI Aquatic
Management Board 2009; Native Brotherhood of British Columbia 1989). Licence banks can
also serve as, or support, community hubs: intermediary organizations that provide a number of
benefits to community members, including facilitating collaboration and providing support
services (Wiber et al. 2004; Tolley and Hall-Arber 2015). Licence banks are a tool that holds
promise, but that also has challenges and limitations that should be carefully considered
(Edwards and Edwards 2017; Sutcliffe, Edwards, and Edwards 2008).
To be established, licence banks require an initial allocation of licences and/or quota, or the
allocation of financial resources to purchase licences and quota from the market. If the licence
bank is to be self-sustaining, this allocation must be sufficient to support the licence bank’s
operations. To be successful, the allocation must be sufficient to achieve the licence bank’s
objectives, either immediately through the initial allocation or over the long term, with the initial
allocation and licence bank design supporting generation of the income necessary to reinvest.
The initial capitalization of the licence bank is the major impediment to the wider adoption of
licence banks. Options for capitalizing the bank include investment by fishermen, by
government, and/or by a foundation or through the allocation of the resource directly. The
allocation of the resource directly is only a viable option at the implementation of an ITQ
system. For existing ITQ managed fisheries, a financial allocation is required to compensate
existing rights holders while establishing the licence bank to address intergenerational transfer
and equity issues. Investment by fishermen or communities is rarely an option in such cases as

117
the identified need for a licence bank is typically for those that have been disenfranchised from
the fishery with no means of entry. The cost of purchasing any meaningful amount of quota
would be beyond their financial means. Both government and foundations have the financial
wherewithal to capitalize a licence bank and support from one or both is critical.
Despite the common use of ownership regulations and licence banks to achieve socio-economic
objectives in fisheries, there are a number of criticisms of these measures as ineffective or
insufficient to meet socio-economic objectives (Carothers, Lew, and Sepez 2010; Szymkowiak
and Himes-Cornell 2017; Edwards and Edwards 2017; Devlin 2009). At the same time, any
restrictions on IQs, particularly related to transferability, have been criticized by ITQ proponents
as undermining the potential of ITQs to monetize fisheries and increase rent generation (Arnason
2005; Asche et al. 2008). This tension highlights the importance of having clear objectives to
guide decision-making and the evaluation of outcomes, and also the importance of considering
best practices and lessons learned from other jurisdictions. This tension also points to the
importance of data and analysis to be able to track ownership and evaluate the performance of
the fishery system against objectives. There is no one measure that can be expected to address all
the concerns raised with the fishery. Just as ITQs are not a panacea (Young et al. 2018), neither
are approaches such as owner-operator or licence banks. Their success or failure will depend on
the specific design and implementation, and how the measures operate in concert given the
particulars of the given context.

118
5.2.2 Fair-Share
The failure of the fisheries licencing system in BC to achieve socio-economic objectives related
to the distribution of risks and benefits, concentration of ownership, community impacts and
accessibility for new entrants led to the development of a ‘shared risks and benefits’ plan
supported by a number of BC commercial fishermen (B. Turris and Mose 2018). Given the
urgent call for action to maintain what remains of the inshore fleet in BC, and the expected
multi-year timeline for implementing transformation of the licencing system in BC, the House of
Commons Standing Committee, in their report on the West Coast licencing system,
recommended that a shared risks and benefits plan be implemented immediately.
The shared risks and benefits plan was developed by a diverse group of fishing interests in BC.
This plan would provide immediate relief to lessee fishermen by imposing a cap on lease fees as
a proportion of landed value. This could be done through the collection of additional data by
DFO through the fish sales slip, to explicitly require recording both landed price and lease price,
and requirements added to the integrated fisheries management plan (IFMP) and conditions of
licence, capping the percentage of landed value that can be charged for lease fees. This would
also require enforcement, to ensure that landed prices are not undervalued on the fish slips, with
the available sanction being the risk that owners found to be violating the licence conditions
would not have their licences reissued in subsequent years. The authority of the Minister to
mandate these types of requirements and enforce them through the licence issuance system has
been affirmed in court through the Elson case (Elson v. Canada (Attorney General) 2017). This
approach could be implemented in the short term and is dependent upon DFO to enact changes in
data collection, the IFMP, and monitoring and enforcement.

119
An alternative approach to achieve ‘fair-sharing’ would be to use collective bargaining. There is
a long history of collective bargaining in fisheries, including within British Columbia. There
have also been repeated attempts to limit the ability of fishermen to bargain collectively
(Crutchfield 1955; United Fishermen and Allied Workers’ Union et al. v. British Columbia
Provincial Council 1977). Legal arguments disqualified fishermen and their trade unions from
collective bargaining on the basis that fishermen did not meet legal definitions of employees.
The legal framework to support participation of fishermen as designated ‘employees’ in
collective bargaining was adopted in British Columbia in 1996 through the Fishing Collective
Bargaining Act [RSBC 1996]. However, this legislation went unused for more than two decades.
It wasn’t until June 2019 that the first bargaining unit for workers on commercial fishing boats in
BC was certified, to enable this group of workers to engage in collective bargaining with the
protections afforded by the labour code. The bargaining unit encompasses all salmon seine boat
crew members employed by Canadian Fishing Company, including captains, engineers,
deckhands and cooks. Other fisheries and other employers are not part of this bargaining unit.
There are challenges to applying the existing collective bargaining legislation to a multi-buyer
fishery, however. An approach that would depend on the provincial government and would
likely take 1-2 years to enact would be for the provincial government to make changes to the BC
collective bargaining legislation to mirror the legislation in Newfoundland and Labrador (NL).
NL has a Standing Fish Price Setting Panel that facilitates collective bargaining, establishes
parameters for negotiation, and acts as an arbitration panel for the parties in setting fish prices.
The Panel may also set fish prices if the parties to negotiation are unable to agree on price.
Amendments to the NL Fishing Industry Collective Bargaining Act were passed in 2006 and
provided the legislative framework for the Panel.

120
A further option, although longer-term still, would be for the Government of Canada to enact
legislation similar to the Canadian Dairy Commission Act. The Dairy Commission is intended to
provide “efficient producers of milk and cream with the opportunity of obtaining a fair return for
their labour and investment and to provide consumers of dairy products with a continuous and
adequate supply of dairy products of high quality”. Among the powers of the Commission is
establishing prices. Canada did at one time have legislation directly related to fisheries prices.
The Fisheries Prices Support Act, passed in 1944, provided the legislative authority to establish
the Fisheries Prices Support Board. The Board had the authority to buy and sell fishery products
and influence prices paid to producers in that way, but had no direct authority to set prices. The
Fisheries Prices Support Act was repealed in 2002 and was not replaced.
5.3 Equitable distribution and a just and fair approach to transformation
The issue of equitable distribution, inextricably linked to fairness (Doering et al. 2016), is a
longstanding objective for fisheries in Canada. It was cited as an objective by a DFO official in
testimony to a parliamentary committee in 2019 (DFO 2019b). The 1976 national fisheries
policy identified ten policy objectives for fishery management and development, one of which
was “[a]llocation of access to fishery resources in accordance with optimal (best) use, an
assurance of equity of access and security of tenure for resource users” (Government of Canada
1976, AI-1). Despite the longstanding objective for equitable distribution of benefits from the
resource, spanning more than four decades of DFO policy and management, this issue is
frequently overlooked and seldom evaluated. DFO has not defined ‘equitable distribution’ or

121
‘equity of access’, equity issues are not subject to regular assessment and reporting, and a
number of important policy documents do not acknowledge this objective.
A review of more than thirty DFO policies and frameworks found few references to equity or
equitable distribution. Most of the reviewed documents do not reference ‘equity’ or ‘equitable
distribution’ at all, including the Sustainable Fisheries Framework. The “Atlantic fisheries policy
review - A policy framework for the management of fisheries on Canada's Atlantic Coast”
references the equity objective in the introduction and acknowledges the “New Access
Framework” which includes as one of three overarching principles that “the Minister will ensure
that decisions are equitable — that they are fair both in procedure and substance” (DFO 2004).
The “Integrated Aboriginal Policy Framework” has one reference to equity, stating that “DFO’s
Integrated Aboriginal Policy Framework addresses interests and objectives of all users in a
positive, responsive and equitable fashion” (DFO 2007a). The “Pacific Wild Salmon Policy”
references equity only in the appendix on the legal and policy background, in the section on
agreements. The first reference is to the Pacific Salmon Treaty between Canada and the United
States, that requires “the conduct of fisheries so as to provide for optimum production and
equitable exploitation of salmon stocks”. The second reference is to acknowledge that Canada
ratified the UN Convention on Biological Diversity, which had three main goals: “(1) the
conservation of biodiversity; (2) sustainable use of the components of biodiversity; and (3) fair
and equitable sharing of the benefits arising from the commercial and other use of genetic
resources” (DFO 2005). The “Wild Salmon Policy: 2018-2022 implementation plan” has only
one reference to equity, in the glossary for the definition of the ‘ecosystem-based approach’: “a
strategy for the integrated management of land, water and living resources that promotes

122
conservation and sustainable use in an equitable way; conservation of ecosystem structures,
processes and interactions through sustainable use” (DFO 2018b). The one document reviewed
that addressed equity in a substantive way was the “New Access Framework”, released in 2002
to “guide all decisions on new or additional access to Atlantic commercial fisheries which have
undergone substantial increases in resource abundance or landed value” (DFO 2002). The
framework identifies two components of equity – procedural and substantive – and defines them:
1. Procedural Component: Access criteria must be applied in a fair and consistent manner
through a decision-making process that is open, transparent and accountable and that
ensures fair treatment for all.
2. Substantive Component: The fishery is a common, public resource that should be
managed in a way that does not create or exacerbate excessive interpersonal or inter-
regional disparities.
The framework also identifies four criteria against which access would be considered. The first
of these, conservation, is primary and considered first and independently of the other criteria.
The remaining three criteria consist of: adjacency (priority of access to those closest to the
resource), historic dependence (priority of access to those who historically participated in and
relied on the fishery), and economic viability (promote rather than compromise economic
viability of existing and potential new entrants, to contribute to economic resilience and stability
of individuals and the fishing industry as a whole). This framework, while specific to new access
to fisheries in the Atlantic region, provides valuable insight into what is meant by equitable
distribution and can be used as guidance for considering the equity issue more generally for
fisheries in Canada, particularly as it relates to the initial allocation of resources.

123
For an established fishery, the initial allocation decisions have been made and the challenge is
one of balancing the rights and interests of existing benefit recipients with those that have a
claim based on equity considerations. This challenge is apparent among those in the BC inshore
fleet who consider the current distribution of benefits as inequitable but who also own licences
and quota, often purchased at significant cost. With corporate and absentee owners receiving
lease fees of more than 80% of landed price in some fisheries, many in the BC inshore fleet are
struggling financially, particularly given the cost of buying licences. Fishermen have expressed
the concern that the inshore fleet could be further negatively impacted through arbitrary and
uncompensated losses, and this has been a source of resistance to change in the fisheries. This
concern is not without merit. Despite the longstanding commitment to equity, there are a number
of recent examples of reallocation of fishing access without compensation. In 2012, the then-
Minister of Fisheries and Oceans, acting against the advice of his department, made the decision
to permanently reallocate 3% of the halibut total allowable catch (TAC) from the commercial
fishery to the recreational fishery without compensation (Malcolm v. Canada (Fisheries and
Oceans) 2013). The salmon fishery has also been subject to reallocation of access, from the
commercial to recreational fishery, between different sectors within the commercial fishery
(Kimoto v. Canada (Attorney General) 2011), and to Indigenous fisheries (DFO 2019d). The loss
of access to meet conservation targets, including the establishment of marine protected areas, has
also proceeded without compensation to those whose livelihoods are affected, despite the need to
consider social justice when transitioning to sustainability (Bennett et al. 2019). There are also
examples in which equity issues have been taken into account, however. The program documents
for the Pacific Integrated Commercial Fisheries Initiative (PICFI), a program to repatriate
fisheries access to Indigenous Peoples through the purchase of licences and quota (DFO 2008b)

124
has a principle of “Equitable, Fair and Transparent - First Nations commercial access is acquired
through the voluntary relinquishment of existing commercial fishing licence eligibilities and
quota”.
There are legal, social, political and moral considerations that argue against reallocation without
compensation. A court case brought against the Government of Canada related to the loss of
income arising from a Pacific salmon allocation decision affirmed the Minister’s legal authority
(Kimoto v. Canada (Attorney General) 2011). The justice in that case, in rendering judgement,
concluded that “there is no legal obligation on the part of the Government to help make good the
Applicants’ loss, although politically and morally that may well be the right thing to do”. The
law has been clear in Canada: the minister has wide discretion, and that discretion has been
exercised in ways that have at times been characterized as unjust and engendered fear among
those that stand to lose what little they do own. Any fisheries transformation that impacts
existing access rights, even in the pursuit of achieving a more equitable distribution of benefits,
should consider the arguments against arbitrary and uncompensated reallocation:
1. Many international trade agreements, including the North American Free Trade
Agreement and its replacement the Canada-United States-Mexico Agreement (CUSMA),
have provisions addressing expropriation and compensation. Fishing licences fall into a
grey area, in terms of whether they qualify as a “property right or property interest in an
investment” that would then require compensation, which is one of a number of
outstanding questions as to the extent to which trade agreements would apply to fisheries
in Canada (Nguyen 2014).

125
2. Expropriation without compensation is bad for business, increasing uncertainty,
undermining business confidence and discouraging investment (Tisdell and Harrison
1999).
3. Government actions viewed as arbitrary and unfair are bad for democracy, undermining
trust in government (Andrain and Smith 2006).
4. The arbitrary deprivation of property and livelihoods violates the tenets of human rights,
particularly when it is small scale fishermen that are affected (Moser et al. 2001; Conway
et al. 2002; Ratner, Åsgård, and Allison 2014). Canada is signatory to both the UN
Universal Declaration of Human Rights and the FAO Voluntary Guidelines for Securing
Sustainable Small-Scale Fisheries, which address this issue (FAO 2015; United Nations
1949).
While there have been attempts to characterize the options for fishery transformation as one of
(a) costly expropriation with compensation, (b) unfair and damaging expropriation without
compensation, or (c) do nothing (Boyes 2019), there are other options. Phased approaches can be
enacted that enable industry-funded buyouts of existing owners that do not meet incoming
ownership requirements. Phased approaches provide time for the market for licences and quota
to adjust, to avoid large swings in purchase prices, and for the orderly exit of those that do not
meet the required conditions for ownership or use. A phased approach was taken with
implementation of the policy for Preserving the Independence of the Inshore Fleet in Canada’s
Atlantic Fisheries (PIIFCAF), where owners that violated the policy have been provided seven
years to exit (DFO 2007b). The use of phased approaches through policy and regulation to
address failures to meet conservation objectives is common practice in Canada’s fisheries, such

126
as with the BC Commercial Groundfish Integration Plan. This plan was developed and
implemented through a phased, multi-step process, over a period of years. A policy paper was
released in 1999, a conservation strategy in 2002, and a set of principles for the groundfish
fisheries in 2003, followed by a two-year consensus-based planning process, release of the plan
in 2005, implementation in 2006 as a three-year pilot and permanent adoption in 2009 (CIC
2005; DFO 2009a; PFMI 2003). In both cases, extensive consultation and time for planning and
implementation were afforded to the process.
Governments have to balance many issues when making decisions, including legal obligations,
international commitments, and issues of fairness and moral responsibility. The issue of human
rights within a pseudo-property rights regime highlights the challenge that governments face.
While the arbitrary removal of property and livelihoods can be a violation of human rights, the
use of property rights regimes over a common pool resource itself can be a violation of human
rights. The United Nations Human Rights Committee declared that the Icelandic ITQ fishery
system violated basic human rights, turning local fishing rights into a transferable financial
commodity with the potential to cause irreversible damage to people and communities
(Einarsson 2015). There are no easy answers or simple solutions, but there are objectives and
principles, and best practices, to guide actions. There is an indisputable objective for the
equitable distribution of benefits from Canada’s fisheries. Achieving that objective should in turn
embrace equity as a principle guiding planning and implementation of a process to transform the
Pacific fisheries.

127
5.4 Considerations on a process to implement transformation
The use of collaborative processes to address complex multi-stakeholder issues is a well
developed field (Innes and Booher 2018; Ury 1993; Frame, Gunton, and Day 2004). Day and
Gunton (2003) summarize the three phases of collaborative planning from an extensive review of
the collaborative planning literature. They outline the three phases consisting of multiple steps,
from pre-negotiation which includes preparing draft terms of reference that include objectives,
rules of procedure, roles and responsibilities, timelines, and logistics, through negotiation to
come to and bind parties to an agreement, through to post-negotiation, commencing
implementation and creating a monitoring process to evaluate. They also identify ten key design
and management principles, including preconditions for the process, inclusive representation,
clear ground rules, addressing inequities, ensuring process accountability and sound process
management, and the use of multiple-objective evaluation to evaluate success.
The House of Commons Standing Committee, in their recommendations on the West Coast
fishery, called for a new policy framework developed through a process of extensive multi-
stakeholder engagement and an independent commission to develop the elements of the new
licencing regime. Stakeholders identified by the Committee include active fish harvesters, First
Nations commercial fish harvesters, processing companies representatives, First Nation licence
and quota holder representatives, provincial government representatives, municipal government
representatives, coastal community socio-economic development, health and cultural agency
representatives, and academic and non-governmental experts. The commission, established
according to the best practices outlined by Day and Gunton (2003), would be well positioned to
identify and design measures that can be introduced to the BC fisheries to address the current

128
failings related to socio-economic objectives. Management actions and support programs should
be designed in a concerted and deliberate way, well informed by data and analysis and
consideration of best practices and lessons learned from around the world.
5.5 Conclusion
“While constitutional law may place some restrictions on the power of the
federal government to legislate over tidal fisheries, there is nevertheless broad
authority to manage and control those fisheries for biological, economic,
social, cultural or other purposes. This broad authority to regulate tidal
fisheries clearly gives a flexibility to fisheries managers to alter management
schemes where, for example, biological, social or economic considerations
dictate a change.” (Government of Canada 1995)
Governments have many tools in their toolbox when fisheries are not meeting objectives and
expectations. Governments are able to act through policy, legislation, regulation, programs,
procurement and information/communication (Salamon and Elliott 2002). A fair and just
approach to transforming a fishery can include publicly funded buy-back of fisheries access,
introduction of provisions to meet fisheries objectives that are phased-in over time, and/or
implementation of government programs to support the fishery and communities in the
transition. There are many examples of how to undertake the complex process of unscrambling
the BC licencing system. To move forward requires a commitment to process and
implementation which has:
1. clear and agreed upon objectives
129
2. an inclusive and appropriate decision-making process, which is
a) principled (fair and just)
b) multi-stakeholder and collaborative
c) evidence-based (robust data collection and analysis)
d) transparent (in data, in analysis, in decision-making)
3. implementation of a management system that is deliberate in achieving declared
objectives, with regular and ongoing evaluation against the full suite of objectives
Addressing the failings of the current licencing system is a choice. Steps to address this issue
have been identified. The best practices for managing what will undoubtedly be a complex
process are known. The decision to take action to transform the BC fisheries to meet stated
socio-economic objectives is not a matter of whether it can be done, but whether it will be done,
and if it will be done according to best practices and informed by the lessons learned in Canada
and around the world.

130
Chapter 6: Conclusion
The overarching objective of this dissertation work was to explore the social and economic
outcomes of ITQ management in the BC small boat / inshore groundfish fishery. I focused on the
BC Pacific halibut fishery as the largest and most valuable of the inshore groundfish fisheries,
and with characteristics that made it the most suitable for consideration, including full TAC
utilization, low carryover percentage, and high-value quota, which enabled the use of quota
holdings as a proxy for catch. I did an extensive review of the literature, including grey literature,
through the online federal science library as well as offline material from Library and Archives
Canada, to understand the objectives that underpin the fisheries in BC and the evolution of
fisheries management in the region. I constructed an ownership database for the Pacific halibut
fishery in BC through aggregation of datasets received from DFO, supplemented with multiple
additional data sources, that served as the basis for the analysis of ownership and leasing. In
Chapter 2, to examine changes in the ownership profile of the BC Pacific halibut fishery over a
25-year period, I considered who owns the quota, including to what extent the owners of quota
fish or lease out quota, and if there is an enduring impact of being an initial grantee of quota. In
Chapter 3, I considered the extent to which processors exercise control over the halibut quota
market through leasing. I developed a network analysis to visualize the role of processors in the
quota lease market and considered power dynamics and the role of government in managing
markets. In Chapter 4, I constructed a financial enterprise model based on accounting principles
for evaluating revenue, costs and income to assess the impact of quota ownership and leasing
prices on the financial performance of owner-operator halibut vessels. In Chapter 5, I provided
an overview of measures that could be used to transform an established fishery licencing system

131
to achieve socio-economic objectives and considered issues related to equitable distribution and
process to ensure a just and fair approach for fisheries transformation.
6.1 Research summary
The dominant narrative over the previous three decades from both the federal fisheries
management agency, Fisheries and Oceans Canada, and corporate fishing representatives has
characterized the fisheries on the West Coast of Canada as wholly distinct from the fisheries on
the East Coast of Canada – in their origins, their evolution and their objectives. In a rewriting of
the history of fisheries policy, BC fisheries have been characterized as traditionally corporate
controlled and driven by the objective of maximizing economic returns to licence owners. This
has been used to justify the introduction and continuation of pseudo-property rights regimes in
fisheries management in BC with no corresponding owner-operator or fleet separation rules, in
stark contrast to fisheries management on the East Coast of Canada. Through an analysis of
historical documents, and the testimony of senior DFO officials and successive Ministers of
Fisheries, it is convincingly clear that this narrative is without factual basis. Fisheries in BC have
traditionally been owner-operated, with a predominantly independent and small-boat fleet
operating in most fisheries. Fisheries in BC, as with those in eastern Canada, were and are
intended to support a viable inshore fishing fleet, providing employment and economic
opportunities for coastal communities.
The BC halibut fishery is failing to meet stated objectives for fisheries in Canada. An increasing
portion of benefits are accruing to investors and corporate interests, and not to fishery
participants and communities. The diminished role of owner-operators is most evident in quota

132
ownership, as owner-operator quota ownership is replaced by an investor class that has emerged
following the introduction of individual transferable quotas. As ownership becomes disconnected
from fishing operations, the already questionable assertion that ITQs improve stewardship by
linking resource ownership and participation in the fishery becomes untenable.
High lease and purchase prices have meant that there is no reasonable avenue for new owner-
operators to enter the fishery. The initial quota allocation process was a boon to the original
grantees at the expense of new entrants and crew. As original grantees continue to exit,
ownership by owner-operators can be expected to further decline.
The halibut ITQ market in BC, with no government oversight, no transparency, and unequal
access to information among parties, is in a state of market failure, not meeting the conditions
necessary for a market to function effectively and efficiently. Processors have stepped into the
gap that has been created by this market failure, acting as quota leasing hubs with increasing
control over the quota market, further shifting the balance of power in the fishery to disadvantage
lessee fishing enterprises, with implications for the competitiveness of the market and the ability
of fishermen to access the best prices for their product.
The emergent investor class captures the wealth from the fishery without contributing back: they
do not invest in boats or equipment; they do not add to coastal infrastructure; and, they do not
support innovation of new technologies and techniques. This jeopardizes the safety of the fishing
fleet and the viability not just of the fleet but also the businesses that provide services to the
fishing sector and the communities that rely on the fishery.

133
The results of this research should lead to serious questioning of the supposed benefits of ITQs
while confirming a number of negative impacts of ITQ management. ITQ management systems,
particularly those without ownership restrictions or mechanisms to support new entrants, are not
appropriate for a fishery that is intended to support a strong inshore fishing fleet and adjacent
coastal communities.
6.2 On data and future research
Despite data limitations, ownership and leasing in the halibut fishery was evaluated, based on an
extensive undertaking that included combining multiple, disparate datasets and addressing data
gaps through a large number of supplementary sources. This is the first time in the BC halibut
fishery that beneficial ownership was comprehensively evaluated, and is the most extensive
accounting to date of leasing and quota ownership in the BC groundfish fisheries. What was a
difficult, time-consuming effort could be pursued in a much more straightforward way by the
management agency. DFO’s access to data that is not made available, notably catch data by
vessel, would enable extension of the enterprise financial model to consider financial
performance for a range of fishing patterns. This would also enable a more complete evaluation
of leasing for those species that have low TAC utilization, including rockfish and lingcod. DFO
is also well positioned, given existing data sources, to further explore the relationship between
processors and fishermen, and the extent to which processor control is concentrating, through the
fish sales slips submitted to the department.

134
In addition to data that is already collected, DFO could also institute new data collection that
would support a much more robust, ongoing assessment of the social and economic outcomes of
the fisheries management system. Minor changes to the regulations related to fish sales slips and
vessel registration would support the collection of lease price data, landed price data, declared
beneficial ownership and quota leasing. There is also the potential to collaborate with the
provincial government to further assess corporate ownership, through the use of the provincial
corporate registry. The re-establishment of costs and earnings surveys would also support
assessment of financial outcomes and the distribution of benefits.
An important consideration that was not addressed directly in this research was that of
Indigenous ownership, access and participation in BC fisheries. While unquestionably an
important and timely issue, Indigenous access and rights issues related to fisheries in BC was
outside the scope of this dissertation. There is an opportunity to build upon the database
compiled for this research to address issues such as the loss of fisheries access in First Nation
communities in BC and to consider the effectiveness of past and present government programs to
repatriate access to and improve opportunities for economic participation in BC’s fisheries.
Research focused on Indigenous issues should follow research best practices (University of
Victoria 2003; Assembly of First Nations 2009), including a research co-construction process to
develop, implement and report on the research in a full partnership with First Nation
representatives.

135
6.3 Recommendations to policy makers
For fisheries that are being considered for ITQ implementation, an honest and comprehensive
assessment, considering risks and benefits, the full suite of fisheries objectives, and exploring
underlying assumptions, would be appropriate before making any move to entrenching an ITQ
system in a new fishery.
For established ITQ fisheries, while making changes is not a simple matter, it can be done. There
are multiple tools available to governments to retroactively address socio-economic objectives in
established ITQ fisheries. In moving forward with adjusting an existing fishery, considerations
should include objectives, process and evaluation.
6.3.1 Objectives
Fisheries policy should consider the overall objectives for the fishery, which in Canada includes
supporting prosperous communities, the equitable distribution of benefits, and maintaining a
viable and stable fleet. As a first step in any evaluation or policy development process, objectives
should be identified. The full suite of objectives should be identified, not only those that are
easily measured or fit into a pre-determined evaluation approach. Careful consideration should
be given to what objectives underpin the fishery, including the historical and current context.
How these objectives would be evaluated (i.e., indicators for assessing the objectives) needs to
be identified.

136
6.3.2 Process
In complex management scenarios, such as adjusting an established ITQ fishery, a collaborative
multi-stakeholder approach to consultation and decision-making has been shown to be highly
effective, provided necessary conditions are met (Day and Gunton 2003; Innes and Booher
2018). The full range of stakeholders should be included. To limit the perspectives that are
considered can introduce bias in the process (Slooten et al. 2017). This can undermine the value
of the process and over the long-term have a corrosive influence on the stakeholder/management
agency relationship. Other necessary conditions include the support and agreement of the
management agency, robust data collection and analysis to inform discussions, transparency in
the data, analysis and decision-making process, and a principled approach that builds trust in the
process and the management agency.
6.3.3 Evaluation
Following implementation of a management regime, outcomes should be regularly assessed and
publicly reported on against the full suite of objectives for the fishery. The data needed to do this
should be collected and made available. It is not enough to do an evaluation one, two or three
years after a program has been implemented, and then never again. Some outcomes take time to
emerge. Observed trends can also be conflated with other events that prevent a true accounting of
the impacts of a program. Evaluation should be fully integrated into the fisheries management
process, and the data needed to evaluate collected and made available publicly to be transparent
and to enable third party evaluation.

137
6.4 In Summary
Only when there is considerate and thoughtful policy that specifically and explicitly addresses
entrenched inequality will equitable distribution of benefits be achieved.

138
References
Access to Information Act (R.S.C., 1985, c. A-1). 1985.
Acheson, James, Spencer Apollonio, and James Wilson. 2015. “Individual Transferable Quotas
and Conservation: A Critical Assessment.” Ecology and Society 20 (4).
https://doi.org/10.5751/ES-07912-200407.
Acott, Tim G, and Julie Urquhart. 2014. “Sense of Place and Socio-Cultural Values in Fishing
Communities Along the English Channel.” In Social Issues in Sustainable Fisheries
Management, edited by Julie Urquhart, Tim G Acott, David Symes, and M Zhao.
Dordrecht, Netherlands: Springer.
Adger, W. Neil, Hallie Eakin, and Alexandra Winkels. 2009. “Nested and Teleconnected
Vulnerabilities to Environmental Change.” Frontiers in Ecology and the Environment 7
(3): 150–57. http://www.jstor.org/stable/25595090.
Ahousaht Indian Band and Nation v. Canada (Attorney General). 2009 BCSC 1494. Supreme
Court of British Columbia.
Ahousaht Indian Band and Nation v. Canada (Attorney General). ———. 2018 BCCA 445.
Court of Appeal for British Columbia.
Anderson, David. 1998. Testimony to the Parliament of Canada House of Commons
Parliamentary Standing Committee on Fisheries and Oceans by the Minister of Fisheries.
Ottawa, Canada.
Anderson, Lee G. 1991. “A Note on Market Power in ITQ Fisheries.” Journal of Environmental
Economics and Management 21 (3): 291–96. https://doi.org/10.1016/0095-
0696(91)90032-E.

139
———. 2008. “The Control of Market Power in ITQ Fisheries.” Marine Resource Economics 23
(1): 25–35. https://doi.org/10.1086/mre.23.1.42629600.
Andrain, Charles F., and James Thomas Smith. 2006. Political Democracy, Trust, and Social
Justice: A Comparative Overview. Boston: University Press of New England.
Appleby, Thomas, Emma Cardwell, and Jim Pettipher. 2018. “Fishing Rights, Property Rights,
Human Rights: The Problem of Legal Lock-in in UK Fisheries.” Elem Sci Anth 6 (1): 40.
https://doi.org/10.1525/elementa.295.
Arnason, Ragnar. 1990. “Minimum Information Management in Fisheries.” The Canadian
Journal of Economics 23 (3): 630–53.
———. 2005. “Property Rights in Fisheries: Iceland’s Experience with ITQs.” Reviews in Fish
Biology and Fisheries 15 (August): 243–64. https://doi.org/10.1007/s11160-005-5139-6.
———. 2007. “Property Rights Quality and the Economic Efficiency of Fisheries Management
Regimes: Some Basic Results.” In Advances in Fisheries Economics, 32–58. Blackwell
Publishing Ltd.
———. 2012. “Property Rights in Fisheries: How Much Can Individual Transferable Quotas
Accomplish?” Review of Environmental Economics and Policy 6 (2): 217–36.
https://doi.org/10.1093/reep/res011.
Asche, Frank, Håkan Eggert, Eyjolfur Gudmundsson, Ayoe Hoff, and Sean Pascoe. 2008.
“Fisher’s Behaviour with Individual Vessel Quotas-Over-Capacity and Potential Rent.
Five Case Studies.” Marine Policy 32: 920–27.
https://doi.org/10.1016/j.marpol.2008.01.007.
140
Assembly of First Nations. 2009. “Ethics in First Nations Research.” Ottawa, ON:
Environmental Stewardship Unit, Assembly of First Nations.
http://www.afn.ca/uploads/files/rp-research_ethics_final.pdf.
Barnett, Allain J., Robin A. Messenger, and Melanie G. Wiber. 2017. “Enacting and Contesting
Neoliberalism in Fisheries: The Tragedy of Commodifying Lobster Access Rights in
Southwest Nova Scotia.” Marine Policy, Neoliberalism and global small-scale fisheries,
80 (June): 60–68. https://doi.org/10.1016/j.marpol.2016.03.002.
BC Seafood Alliance. 2019a. Submission on Regulation of the West Coast Fisheries. Ottawa,
Canada.
https://www.ourcommons.ca/Committees/en/FOPO/StudyActivity?studyActivityId=1038
0159.
———. 2019b. Testimony to the Parliament of Canada House of Commons Parliamentary
Standing Committee on Fisheries and Oceans on Regulation of the West Coast Fisheries.
Ottawa, Canada.
https://www.ourcommons.ca/Committees/en/FOPO/StudyActivity?studyActivityId=1038
0159.
———. 2019c. Testimony to the Parliament of Canada Standing Senate Committee on Fisheries
and Oceans on Bill C-68, An Act to Amend the Fisheries Act and Other Acts in
Consequence. Ottawa, Canada.
https://www.ourcommons.ca/Committees/en/FOPO/StudyActivity?studyActivityId=1038
0159.

141
Béné, C, G Macfadyen, and EH Allison. 2007. “Increasing the Contribution of Small-Scale
Fisheries to Poverty Alleviation and Food Security.” 481. FAO Fisheries Technical
Paper. Rome: Food and Agriculture Organization of the United Nations.
Bennett, Nathan J., Jessica Blythe, Andrés M. Cisneros-Montemayor, Gerald G. Singh, and U.
Rashid Sumaila. 2019. “Just Transformations to Sustainability.” Sustainability 11 (14):
3881. https://doi.org/10.3390/su11143881.
Bennett, Nathan J., Maery Kaplan-Hallam, Gerry Augustine, Natalie Ban, Dyhia Belhabib, Irene
Brueckner-Irwin, Anthony Charles, et al. 2018. “Coastal and Indigenous Community
Access to Marine Resources and the Ocean: A Policy Imperative for Canada.” Marine
Policy 87 (January): 186–93. https://doi.org/10.1016/j.marpol.2017.10.023.
Berkes, F., T. P. Hughes, R. S. Steneck, J. A. Wilson, D. R. Bellwood, B. Crona, C. Folke, et al.
2006. “Globalization, Roving Bandits, and Marine Resources.” Science 311 (5767):
1557–58. https://doi.org/10.1126/science.1122804.
Boyes, David. 2019. Submission on Regulation of the West Coast Fisheries. Ottawa, Canada.
https://www.ourcommons.ca/Committees/en/FOPO/StudyActivity?studyActivityId=1038
0159.
Branch, Trevor A, Kate Rutherford, and Ray Hilborn. 2006. “Replacing Trip Limits with
Individual Transferable Quotas: Implications for Discarding.” Marine Policy 30 (3): 281–
92. https://doi.org/10.1016/j.marpol.2004.12.003.
Brandt, Sylvia. 2005. “The Equity Debate: Distributional Impacts of Individual Transferable
Quotas.” Ocean & Coastal Management 48 (1): 15–30.
https://doi.org/10.1016/j.ocecoaman.2004.12.012.

142
Bromley, Daniel W. 2009. “Abdicating Responsibility: The Deceits of Fisheries Policy.”
Fisheries 34 (6): 280–90. https://doi.org/10.1577/1548-8446-34.6.280.
Brookfield, Katherine, Tim Gray, and Jenny Hatchard. 2005. “The Concept of Fisheries-
Dependent Communities: A Comparative Analysis of Four UK Case Studies: Shetland,
Peterhead, North Shields and Lowestoft.” Fisheries Research 72 (1): 55–69.
https://doi.org/10.1016/j.fishres.2004.10.010.
Brunson, J.C. 2018. Ggalluvial: Alluvial Diagrams in ‘Ggplot2.’ https://CRAN.R-
project.org/package=ggalluvial. Accessed June 19, 2018.
Burnell v. Canada (Fisheries and Oceans). 2013 1354. BCSC.
Canadian Centre for Policy Alternatives. 2018. “Working for a Living Wage 2018.”
Canadian Council of Professional Fish Harvesters. 2002. “Some Issues Concerning the Future of
Canada’s Owner-Operator Fleets: Presentation to the Standing Committee on Fisheries
and Oceans.” Ottawa, Canada.
———. 2018. “Fisheries Seasonality and the Allocation of Labour and Skills: Labour Market
Information Study.” Report Prepared for Employment and Social Development Canada.
Gatineau, QC. http://www.fishharvesterspecheurs.ca/product/fisheries-seasonality-and-
allocation-labour-and-skills.
———. 2019. Testimony to the Parliament of Canada Standing Senate Committee on Fisheries
and Oceans on Bill C-68, An Act to Amend the Fisheries Act and Other Acts in
Consequence. Ottawa, Canada.
https://www.ourcommons.ca/Committees/en/FOPO/StudyActivity?studyActivityId=1038
0159.

143
Carothers, Courtney. 2011. “Equity and Access to Fishing Rights : Exploring the Community
Quota Program in the Gulf of Alaska.” Human Organization 70 (3): 213–23.
———. 2015. “Fisheries Privatization, Social Transitions, and Well-Being in Kodiak, Alaska.”
Marine Policy 61 (February): 313–22. https://doi.org/10.1016/j.marpol.2014.11.019.
Carothers, Courtney, Daniel K. Lew, and Jennifer Sepez. 2010. “Fishing Rights and Small
Communities: Alaska Halibut IFQ Transfer Patterns.” Ocean & Coastal Management 53
(9): 518–23. https://doi.org/10.1016/j.ocecoaman.2010.04.014.
Casey, Keith E., Christopher M. Dewees, Bruce R. Turris, and James E. Wilen. 1995. “The
Effects of Individual Vessel Quotas in the British Columbia Halibut Fishery.” Marine
Resource Economics 10 (3): 211–30.
Castlemain. 2018. “Analysis of Commercial Fishing Licence, Quota, and Vessel Values (as at
December 31, 2017).” Report prepared for Fisheries and Oceans Canada, Pacific Region.
Charles, Anthony T. 1997. “Fisheries Management in Atlantic Canada.” Ocean & Coastal
Management, Fisheries Management in the North Atlantic: National and Regional
Perspectives, 35 (2): 101–19. https://doi.org/10.1016/S0964-5691(97)00028-8.
Chuenpagdee, Ratana. 2016. “Promoting and Revitalizing Small-Scale Fisheries.” presented at
the Oceana Canada’s Science Symposium, Ottawa, Canada, October 26.
http://www.oceana.ca/sites/default/files/dr_ratana_chuenpagdee.pdf.
Chuenpagdee, Ratana, Lisa Liguori, Maria L. D. Palomares, and Daniel Pauly. 2006. “Bottom-
up, Global Estimates of Small-Scale Marine Fisheries Catches.” 14(8). Fisheries Centre
Research Reports. Vancouver, Canada: Fisheries Centre, University of British Columbia.
https://open.library.ubc.ca/cIRcle/collections/facultyresearchandpublications/52383/items
/1.0074761.

144
CIC. 2005. “Commercial Industry Caucus Pilot Integration Proposal.” Victoria, Canada:
Commercial Industry Caucus.
Cisneros-Montemayor, Andrés Miguel, William Wai Lung Cheung, Karin Bodtker, Louise Teh,
Nadja Steiner, Megan Bailey, Carie Hoover, and Ussif Rashid Sumaila. 2017. “Towards
an Integrated Database on Canadian Ocean Resources: Benefits, Current States, and
Research Gaps.” Canadian Journal of Fisheries and Aquatic Sciences 74 (1): 65–74.
https://doi.org/10.1139/cjfas-2015-0573.
Clark, Colin W., and Gordon R. Munro. 1980. “Fisheries and the Processing Sector: Some
Implications for Management Policy.” The Bell Journal of Economics 11 (2): 603–16.
https://doi.org/10.2307/3003382.
Coase, R. H. 1960. “The Problem of Social Cost.” The Journal of Law & Economics 3: 1–44.
Conway, Tim, Caroline Moser, Andy Norton, and J Farrington. 2002. “Rights and Livelihoods
Approaches: Exploring Policy Dimensions.” 78. Natural Resource Perspectives. London:
Overseas Development Institute.
Copes, Parzival. 1986. “A Critical Review of the Individual Quota as a Device in Fisheries
Management.” Land Economics 62 (3): 278–91.
———. 1998. “Adverse Impacts of Individual Quota Systems in Small-Scale Fisheries: What
Are the Positive Alternatives?” In Managing Our Fisheries, Managing Ourselves, edited
by Laura Loucks, Anthony Charles, and M Butler, 23–30. Halifax, Nova Scotia:
Gorsebrook Research Institute for Atlantic Canada Studies, Saint Mary’s University.
———. 2000. “The Need for Balance in Canada’s Fisheries Policy.” Simon Fraser University
Department of Economics Discussion Paper #00-9.
145
Copes, Parzival, and Anthony Charles. 2004. “Socioeconomics of Individual Transferable
Quotas and Community-Based Fishery Management.” Agricultural and Resource
Economics Review 33 (2): 171–81.
Costello, Christopher, Steven D Gaines, and John Lynham. 2008. “Can Catch Shares Prevent
Fisheries Collapse?” Science (New York, N.Y.) 321 (5896): 1678–81.
https://doi.org/10.1126/science.1159478.
Crona, Beatrice, and Örjan Bodin. 2006. “What You Know Is Who You Know? Communication
Patterns Among Resource Users as a Prerequisite for Co-Management.” Ecology and
Society 11 (2). https://doi.org/10.5751/ES-01793-110207.
Cruickshank, D. 1991. “A Commission of Inquiry into Licensing and Related Policies of the
Department of Fisheries and Oceans.” Victoria: Fleming Printing Ltd.
Crutchfield, James A. 1955. “Collective Bargaining in the Pacific Coast Fisheries: The
Economic Issues.” Industrial and Labor Relations Review 8 (4): 541–56.
https://doi.org/10.2307/2520098.
Csardi, G, and T Nepusz. 2006. “The Igraph Software Package for Complex Network Research,”
1695.
Davidson, Arthur. 2010. “The Cost-Benefit Ledger of Quota Leasing.” Marine Policy 34 (5):
1115–16. https://doi.org/10.1016/j.marpol.2010.01.013.
Day, J. C., and Thomas I. Gunton. 2003. “The Theory and Practice of Collaborative Planning in
Resource and Environmental Management.” Environments 31 (2): 5–19.
Devlin, Jennifer. 2009. “Modern Day Slavery: Employment Conditions for Foreign Fishing
Crews in New Zealand Waters Case Notes and Articles.” Australian and New Zealand
Maritime Law Journal, no. 1: 82–98.

146
DFO. 1990. “Pacific Coast Commercial Fishing Licensing Policy: Discussion Paper.” Fisheries
and Oceans Canada.
———. 1991. “Pacific Region 1991 Halibut Integrated Fisheries Management Plan.” Fisheries
and Oceans Canada.
———. 1992. “Fisheries and Oceans Pacific Region 1992 Fact Sheet.” Fisheries and Oceans
Canada. http://www.dfo-mpo.gc.ca/Library/316289.pdf.
———. 1993. “Pacific Region 1993 Halibut Management Plan.” Fisheries and Oceans Canada.
———. 1998a. “Pacific Region 1998 Groundfish Trawl Management Plan.” Fisheries and
Oceans Canada.
———. 1998b. “Pacific Region 1998 Halibut Management Plan.” Fisheries and Oceans Canada.
———. 1999a. “Pacific Region 1999 Halibut Integrated Fisheries Management Plan.” Fisheries
and Oceans Canada.
———. 1999b. “Pacific Region 1999/2000 Rockfish by Hook and Line Outside Management
Plan.” Fisheries and Oceans Canada.
———. 1999c. “Pacific Region Sablefish Management Plan January 1, 1999 - July 31, 2000.”
Fisheries and Oceans Canada.
———. 2001. “Pacific Region Integrated Fisheries Management Plan Halibut 2001.” Fisheries
and Oceans Canada.
———. 2002. “New Access Framework.” Fisheries and Oceans Canada. https://www.dfo-
mpo.gc.ca/reports-rapports/regs/access-acces-eng.htm.
———. 2004. “Atlantic Fisheries Policy Review - A Policy Framework for the Management of
Fisheries on Canada’s Atlantic Coast.” Ottawa, Canada: Fisheries and Oceans Canada.
https://www.dfo-mpo.gc.ca/reports-rapports/regs/afpr-rppa/framework-cadre-eng.htm.

147
———. 2005. “Canada’s Policy for Conservation of Wild Pacific Salmon.” Vancouver, Canada:
Fisheries and Oceans Canada.
———. 2006. “Pacific Region 2006/2007 Integrated Fisheries Groundfish Management Plan.”
Fisheries and Oceans Canada.
———. 2007a. “An Integrated Aboriginal Policy Framework.” Ottawa: Fisheries and Oceans
Canada. https://www.dfo-mpo.gc.ca/fisheries-peches/aboriginal-autochtones/IAPF-
CIPA-eng.pdf.
———. 2007b. “Policy for Preserving the Independence of the Inshore Fleet in Canada’s
Atlantic Fisheries.” Fisheries and Oceans Canada. http://www.dfo-mpo.gc.ca/reports-
rapports/regs/piifcaf-policy-politique-pifpcca-eng.htm.
———. 2008a. “Pacific Region Groundfish Integrated Fisheries Management Plan, March 8,
2008 to February 20, 2009.” Fisheries and Oceans Canada.
———. 2008b. “Pacific Integrated Commercial Fisheries Initiative.” December 2, 2008.
https://www.pac.dfo-mpo.gc.ca/fm-gp/picfi-ipcip/index-eng.html.
———. 2009a. “Evaluation of the Commercial Groundfish Integration Pilot Program.” Fisheries
and Oceans Canada.
———. 2009b. “Halibut Advisory Panel (HAB) Terms of Reference.” Fisheries and Oceans
Canada. https://www.pac.dfo-mpo.gc.ca/consultation/ground-fond/hab-ccf/tor-man-
eng.html.
———. 2012a. “Commercial Catch Statistics, 2011.” Fisheries and Oceans Canada.
———. 2012b. “Pacific Region Groundfish Integrated Fisheries Management Plan, 2011 to
2013, Version 2.1 Updated March 28, 2012.” Fisheries and Oceans Canada.

148
———. 2012c. “The Future of Canada’s Commercial Fisheries: Discussion Document.” Ottawa,
Canada: Fisheries and Oceans Canada.
———. 2014. “Groundfish Hook and Line Sector Catch Summary, 2013/2014.” Fisheries and
Oceans Canada.
———. 2016a. “Conditions of 2016/2017 Halibut Licence.” Fisheries and Oceans Canada.
———. 2016b. “Pacific Region Groundfish Integrated Fisheries Management Plan, February 21,
2016.” Fisheries and Oceans Canada.
———. 2017. “Groundfish Hook and Line Sector Catch Summary, 2016/17.” Fisheries and
Oceans Canada. https://www.pac.dfo-mpo.gc.ca/fm-gp/commercial/ground-
fond/docs/hl/2016-17_Sector_Catch_Summary.pdf.
———. 2018a. “Pacific Region Groundfish Integrated Fisheries Management Plan 2018.”
Fisheries and Oceans Canada.
———. 2018b. “Wild Salmon Policy: 2018-2022 Implementation Plan.” Vancouver, Canada:
Fisheries and Oceans Canada.
———. 2019a. “Commercial Fisheries Licensing Rules and Policies Reference Document:
Pacific Region.” Fisheries and Oceans Canada. http://www.pac.dfo-mpo.gc.ca/fm-
gp/licence-permis/docs/commercial-licence-permis-ref/commercial-licence-permis-ref-
eng.pdf.
———. 2019b. Testimony to the Parliament of Canada House of Commons Parliamentary
Standing Committee on Fisheries and Oceans on Regulation of the West Coast Fisheries.
Ottawa, Canada.
https://www.ourcommons.ca/Committees/en/FOPO/StudyActivity?studyActivityId=1038
0159.

149
———. 2019c. “Fisheries Licensing Policy Newfoundland and Labrador Region.” Fisheries and
Oceans Canada. https://www.dfo-mpo.gc.ca/reports-rapports/regs/licences-permis/nfld-
Labrador-tn-labrador-eng.htm.
———. 2019d. “2019 Fraser River Chinook Conservation Measures.” Fisheries and Oceans
Canada - Pacific Region.
DFO-CSAS. 2018. “Terms of Reference: Guidelines on Priorities, Monitoring, and Provision of
Science Advice for Small-Scale Fisheries in the Maritimes Region.” Fisheries and
Oceans Canada - Canadian Science Advisory Secretariat. http://www.dfo-
mpo.gc.ca/csas-sccs/Schedule-Horraire/2018/08_21-22-eng.html.
Doering, Ralf, Leyre Goti, Lorena Fricke, and Katharina Jantzen. 2016. “Equity and ITQs:
About Fair Distribution in Quota Management Systems in Fisheries.” Text. December
2016. https://doi.org/info:doi/10.3197/096327116X14736981715742.
Duy, Nguyen Ngoc, Ola Flaaten, and Le Kim Long. 2015. “Government Support and
Profitability Effects – Vietnamese Offshore Fisheries.” Marine Policy 61 (November):
77–86. https://doi.org/10.1016/j.marpol.2015.07.013.
EB Economics. 1992. “Evaluation Study of Individual Quota Management in the Halibut
Fishery.” Prepared for Fisheries and Oceans Canada.
Ecotrust Canada. 2008. “Nuu-Chah-Nulth License Bank Business Plan.” Vancouver, Canada.
———. 2009. “A Cautionary Tale about ITQ Fisheries.” Vancouver, Canada.
http://ecotrust.ca/wp-content/uploads/2015/02/ITQ_Cautionary_Tale_FINAL.pdf.
Edwards, Danielle N. 2019. “Price, Investment and Leasing Data for the British Columbia ITQ
Halibut Fishery.” Mendeley Data V1. https://doi.org/10.17632/n77bhwyp3y.1.

150
Edwards, Danielle N, and Dan G Edwards. 2017. “Licence Banks as a Tool to Mitigate
Corporate Control of Fisheries: A British Columbia Groundfish Example.” Marine Policy
80: 141–46. https://doi.org/10.1016/j.marpol.2016.11.006.
Edwards, Danielle N, and Evelyn Pinkerton. 2019a. “Priced out of Ownership: Quota Leasing
Impacts on the Financial Performance of Owner-Operators.” Marine Policy In Press.
———. 2019b. “Rise of the Investor Class in the British Columbia Pacific Halibut Fishery.”
Marine Policy 109.
———. 2019c. “The Hidden Role of Processors in an Individual Transferable Quota Fishery.”
Ecology and Society 24 (3): 36. https://doi.org/10.5751/ES-11148-240336.
Edwards, Danielle N, Astrid Scholz, Eric E Tamm, and Charles Steinback. 2006. “The Catch-22
of Licensing Policy: Socio-Economic Impacts in British Columbia’s Commercial Ocean
Fisheries.” In North American Association of Fisheries Economists Forum Proceedings,
edited by U Rashid Sumaila and A Dale Marsden. Vol. 14. Fisheries Centre Research
Reports. Vancouver, Canada: University of British Columbia.
Einarsson, Níels. 2015. “When Fishing Rights Go Up against Human Rights.” In Gambling
Debt, edited by E Paul Durrenberger and Gisli Palsson, 151–60. Iceland’s Rise and Fall
in the Global Economy. University Press of Colorado.
http://www.jstor.org/stable/j.ctt169wdcd.17.
Elson v. Canada (Attorney General). 2017 FC 459. Federal Court of Canada.
Emery, Timothy J, Bridget S Green, Caleb Gardner, and John Tisdell. 2012. “Are Input Controls
Required in Individual Transferable Quota Fisheries to Address Ecosystem Based
Fisheries Management Objectives?” Marine Policy 36 (1): 122–31.
https://doi.org/10.1016/j.marpol.2011.04.005.

151
Emery, Timothy J., Klaas Hartmann, Bridget S. Green, Caleb Gardner, and John Tisdell. 2014.
“Fishing for Revenue: How Leasing Quota Can Be Hazardous to Your Health.” ICES
Journal of Marine Science 71 (7): 1854–65. https://doi.org/10.1093/icesjms/fsu019.
Employment and Social Development Canada. 2018. “Employment Insurance Monitoring and
Assessment Report for the Fiscal Year Beginning April 1, 2016 and Ending March 31,
2017.” Chapter II - 4. Employment Insurance Fishing Benefits. April 27, 2018.
https://www.canada.ca/en/employment-social-development/programs/ei/ei-
list/reports/monitoring2017/chapter2/fishing.html.
Eythórsson, Einar. 1996. “Theory and Practice of ITQs in Iceland. Privatization of Common
Fishing Rights.” Marine Policy 20 (3): 269–81. https://doi.org/10.1016/0308-
597X(96)00009-7.
———. 2000. “A Decade of ITQ-Management in Icelandic Fisheries: Consolidation without
Consensus.” Marine Policy 24 (6): 483–92. https://doi.org/10.1016/S0308-
597X(00)00021-X.
FAO, ed. 2005. Increasing the Contribution of Small-Scale Fisheries to Poverty Alleviation and
Food Security. FAO Technical Guidelines for Responsible Fisheries 10. Rome: Food and
Agriculture Organization of the United Nations.
———. 2015. “Voluntary Guidelines for Securing Sustainable Small-Scale Fisheries.” Food and
Agriculture Organization of the United Nations.
Fish, Food and Allied Workers. 2018. “Halibut Prices 2018.” Text. April 18, 2018.
http://ffaw.nf.ca/en/halibut-prices-2018.
Fisheries Act (R.S.C., 1985, c. F-14). 1985.

152
Foley, Paul, Charles Mather, and Barbara Neis. 2015. “Governing Enclosure for Coastal
Communities: Social Embeddedness in a Canadian Shrimp Fishery.” Marine Policy 61
(November): 390–400. https://doi.org/10.1016/j.marpol.2014.11.009.
FOPO. 2019a. “West Coast Fisheries: Sharing Risks and Benefits.” Ottawa, Canada: Parliament
of Canada House of Commons Standing Committee on Fisheries and Oceans, 42nd
Parliament, 1st Session.
———. 2019b. Minutes of Proceedings for the Parliament of Canada House of Commons
Parliamentary Standing Committee on Fisheries and Oceans on the Regulation of the
West Coast Fisheries. Ottawa, Canada.
https://www.ourcommons.ca/Committees/en/FOPO/StudyActivity?studyActivityId=1038
0159.
Frame, Tanis M., Thomas Gunton, and J. C. Day. 2004. “The Role of Collaboration in
Environmental Management: An Evaluation of Land and Resource Planning in British
Columbia.” Journal of Environmental Planning and Management 47 (1): 59–82.
https://doi.org/10.1080/0964056042000189808.
Fujita, Rod, and Kate Bonzon. 2005. “Rights-Based Fisheries Management: An Environmentalist
Perspective.” Reviews in Fish Biology and Fisheries 15: 309–12.
G7. 2018. Charlevoix Blueprint for Healthy Oceans, Seas and Resilient Coastal Communities.
https://g7.gc.ca/en/official-documents/charlevoix-blueprint-healthy-oceans-seas-resilient-
coastal-communites/.
Galaz, Victor, Beatrice Crona, Alice Dauriach, Jean-Baptiste Jouffray, Henrik Österblom, and
Jan Fichtner. 2018. “Tax Havens and Global Environmental Degradation.” Nature
Ecology & Evolution 2 (9): 1352–57. https://doi.org/10.1038/s41559-018-0497-3.

153
GAP2. 2014. “California Collaboration: The Central Coast Ground Fish Project.” 2014.
http://gap2.eu/gap2general/californian-collaboration-the-central-coast-ground-fish-
project/.
Gardner, Michael. 1995. “Input Controls vs. Rights-Based Management: The Political Economy
of Fisheries Management in Atlantic Canada.” Aquatic Living Resources 8 (3): 267–77.
https://doi.org/10.1051/alr:1995026.
Ginkel, R van. 2001. “Inshore Fishermen: Cultural Dimensions of a Maritime Occupation.” In
Inshore Fisheries Management, edited by David Symes and J Phillipson. Dordrecht,
Netherlands: Kluwer.
Ginter, Jay J.C. 1995. “The Alaska Community Development Quota Fisheries Management
Program.” Ocean & Coastal Management 28 (1–3): 147–63.
https://doi.org/10.1016/0964-5691(95)00069-0.
Gislason, GS. 1997. “The BC Fishing Fleet : Financial Returns 1991 and 1994.” Fisheries and
Oceans Canada.
———. 2008. Employment Impacts of ITQ Fisheries in Pacific Canada. Ottawa : Dept. of
Fisheries and Oceans.
Gislason, GS, Neil Philcox, Chelsea Doyle, James Spencer, and Ian Simpson. 2017. “Leasing
Practices in BC Commercial Fisheries in the Context of the PICFI Program.” Vancouver,
Canada: Fisheries and Oceans Canada.
Gough, Joseph. 2008. Managing Canada’s Fisheries: From Early Days to the Year 2000.
Sillery, Quebec: Les Éditions du Septentrion.
154
Government of Canada. 1976. “Policy for Canada’s Commercial Fisheries.” Ottawa: Department
of the Environment, Fisheries and Marine Service. http://www.dfo-
mpo.gc.ca/Library/293.pdf.
———. 1995. “A Practical Guide to the Fisheries Act and to the Coastal Fisheries Protection
Act.” Department of Justice Canada.
———. 2002. “Canada’s Oceans Strategy: Our Oceans, Our Future.” Ottawa, Canada.
———. 2015. “SME Operating Performance.”
https://www.ic.gc.ca/eic/site/061.nsf/eng/h_02941.html.
Government of Iceland. 1996. Restrictions on Investments by Non-Residents in Iceland.
https://www.government.is/topics/business-and-industry/restrictions-on-investments-by-
non-residents-in-iceland/.
Grafton, R Quentin. 1996. “Individual Transferable Quotas: Theory and Practice.” Reviews in
Fish Biology and Fisheries 6 (1): 5–20.
Grafton, R Quentin, Ragnar Arnason, Trond Bjørndal, David Campbell, Harry F Campbell,
Colin W Clark, Robin Connor, et al. 2006. “Incentive-Based Approaches to Sustainable
Fisheries.” Canadian Journal of Fisheries and Aquatic Sciences 63 (3): 699–710.
https://doi.org/10.1139/f05-247.
Grafton, R Quentin, Harry W Nelson, and Bruce R Turris. 2006. “How to Resolve the Class II
Common Property Problem? The Case of British Columbia’s Multi-Species Groundfish
Trawl Fishery.” In Advances in the Economics of the Fishery: Festschrift in Honour of
Professor G.R. Munro, edited by Trond Bjørndal, DD Gordon, Ragnar Arnason, and
Ussif Rashid Sumaila. Oxford, UK: Australian National University Economics and
Environment Network Working Paper EEN0506.
155
Grimm, Dietmar, Ivan Barkhorn, David Festa, Kate Bonzon, Judd Boomhower, Valerie Hovland,
and Jason Blau. 2012. “Assessing Catch Shares’ Effects Evidence from Federal United
States and Associated British Columbian Fisheries.” Marine Policy 36 (3): 644–57.
https://doi.org/10.1016/j.marpol.2011.10.014.
GSGislason & Associates Ltd. 2013. “The BC Fishing Industry - Labour Market Information.”
Vancouver, Canada: BC Seafood Alliance.
Guyader, Olivier, and Olivier Thébaud. 2001. “Distributional Issues in the Operation of Rights-
Based Fisheries Management Systems.” Marine Policy 25 (2): 103–12.
https://doi.org/10.1016/S0308-597X(00)00041-5.
Haas, Andrea R., Danielle N Edwards, and U. Rashid Sumaila. 2016. “Corporate Concentration
and Processor Control: Insights from the Salmon and Herring Fisheries in British
Columbia.” Marine Policy 68: 83–90.
Hahnel, Robin, and Kristen A. Sheeran. 2009. “Misinterpreting the Coase Theorem.” Journal of
Economic Issues 43 (1): 215–38. https://doi.org/10.2753/JEI0021-3624430110.
Hanna, S, C Folke, and K G Mäler. 1995. “Property Rights and Environmental Resources.” In
Property Rights and the Environment: Social and Ecological Issues, edited by S Hanna
and Mohan Munasinghe, 15–29. Washington, DC: The Beijer International Institute of
Ecological Economics and The World Bank.
Hannesson, Rögnvaldur. 2004. The Privatization of the Oceans. Cambridge, Mass.: MIT Press.
Hartmann, Klaas, Eriko Hoshino, Caleb Gardner, Sarah Jennings, Stacey Patterson, Lisa Rippin,
Julian Morison, and Duncan Worthington. 2015. “Economic Management Guidance for
Australian Abalone Fisheries.” Project No. 2009/714.30. Hobart, Tasmania: Australian
Seafood Cooperative Research Centre.

156
Hentati-Sundberg, J., J. Hjelm, W. J. Boonstra, and H. Österblom. 2015. “Management Forcing
Increased Specialization in a Fishery System.” Ecosystems; New York 18 (1): 45–61.
http://dx.doi.org.ezproxy.library.ubc.ca/10.1007/s10021-014-9811-3.
Holland, Daniel S., Eric Thunberg, Juan Agar, Scott Crosson, Chad Demarest, Stephen
Kasperski, Larry Perruso, et al. 2015. “US Catch Share Markets: A Review of Data
Availability and Impediments to Transparent Markets.” Marine Policy 57 (July): 103–10.
https://doi.org/10.1016/j.marpol.2015.03.027.
Holland, Daniel S., and Joshua Wiersma. 2010. “Free Form Property Rights for Fisheries: The
Decentralized Design of Rights-Based Management through Groundfish ‘Sectors’ in
New England.” Marine Policy 34 (5): 1076–81.
https://doi.org/10.1016/j.marpol.2010.03.007.
Horner, Lindsey K. 2016. “Co-Constructing Research: A Critical Literature Review.” AHRC.
https://connected-communities.org/index.php/project_resources/co-constructing-research-
a-critical-literature-review/.
Innes, Judith Eleanor, and David E. Booher. 2018. Planning with Complexity. Routledge, Taylor
& Francis Group.
IPCC. 2018. Global Warming of 1.5°C: An IPCC Special Report on the Impacts of Global
Warming of 1.5°C above Pre-Industrial Levels and Related Global Greenhouse Gas
Emission Pathways, in the Context of Strengthening the Global Response to the Threat of
Climate Change, Sustainable Development, and Efforts to Eradicate Poverty. Edited by
V Masson-Delmotte, P Zhai, H-O Pörtner, D Roberts, J Skea, PR Shukla, A Pirani, et al.
Intergovernmental Panel on Climate Change.

157
IPHC. 2018. “IPHC Fishery Status Report 2018.” Seattle, USA: International Pacific Halibut
Commission. https://www.iphc.int/uploads/pdf/am/2019am/iphc-2019-am095-10.pdf.
Jackson, Matthew O. 2008. Social and Economic Networks. Princeton, N.J: Princeton University
Press.
Keeley, Brian. 2015. Income Inequality: The Gap between Rich and Poor. OECD Insights. Paris:
OECD Publishing. http://dx.doi.org/10.1787/9789264246010-en.
Kimoto v. Canada (Attorney General). 2011 FC 89. Federal Court of Canada.
Koolman, John, Brian Mose, Richard D Stanley, and Diana Trager. 2007. “Developing an
Integrated Commercial Groundfish Strategy for British Columbia: Insights Gained about
Participatory Management.” In Biology, Assessment, and Management of North Pacific
Rockfishes, edited by J Heifetz, J DiCosimo, A J Gharrett, M S Love, V M O’Connell,
and Richard D Stanley, 287–300. Alaska Sea Grant.
Lax Kw’alaams Indian Band v. Canada (Attorney General). 2011 SCC 56. Supreme Court of
Canada.
LeBlanc, Dominic. 2017. “Speech by Fisheries Minister Dominic LeBlanc to the Canadian
Independent Fish Harvesters Federation.”
León, Rafael, Caleb Gardner, Ingrid van Putten, and Klaas Hartmann. 2015. “Changes in the
Lease and Permanent Sale Quota Markets of a Rock Lobster Fishery in Response to
Stock Abundance.” ICES Journal of Marine Science 72 (5): 1555–64.
https://doi.org/10.1093/icesjms/fsu246.
Liu, Jianguo, Vanessa Hull, Mateus Batistella, Ruth DeFries, Thomas Dietz, Feng Fu, Thomas
W. Hertel, et al. 2013. “Framing Sustainability in a Telecoupled World.” Ecology and
Society 18 (2): 26. https://doaj.org.

158
Lubchenco, Jane, Elizabeth B. Cerny-Chipman, Jessica N. Reimer, and Simon A. Levin. 2016.
“The Right Incentives Enable Ocean Sustainability Successes and Provide Hope for the
Future.” Proceedings of the National Academy of Sciences 113 (51): 14507–14.
https://doi.org/10.1073/pnas.1604982113.
Macfadyen, G., P. Salz, and R. Cappell. 2011. “Characteristics of Small-Scale Coastal Fisheries
in Europe.” Directorate-General for Internal Policies.
Macgillivray, Paul B. 1990. “Assessment of New Zealand’s Individual Transferable Quota
Fisheries Management.” 75. Econ. Comm. Anal. Rep. Department of Fisheries and
Oceans.
Malcolm v. Canada (Fisheries and Oceans). 2013 FC 363. Federal Court of Canada.
Mawani, T. 2009. “Evaluation of the Commercial Groundfish Integration Pilot Program in
British Columbia.” Master of Arts Thesis, Victoria, Canada: Royal Roads University.
Mazzucato, Mariana. 2015. “From Market Fixing to Market-Creating: A New Framework for
Economic Policy.” SSRN Scholarly Paper ID 2744593. Rochester, NY: Social Science
Research Network. https://papers.ssrn.com/abstract=2744593.
McCay, Bonnie J. 1995. “Social and Ecological Implications of ITQs: An Overview.” Ocean &
Coastal Management 28 (1–3): 3–22. https://doi.org/10.1016/0964-5691(96)00002-6.
———. 2004. “ITQs and Community.” Agricultural and Resource Economics Review 33 (2):
162–70.
McCormack, Fiona. 2017. “Sustainability in New Zealand’s Quota Management System: A
Convenient Story.” Marine Policy, Neoliberalism and global small-scale fisheries, 80
(June): 35–46. https://doi.org/10.1016/j.marpol.2016.06.022.
159
McRae, D M, and Peter H Pearse. 2004. “Treatise in Transition: Towards a Sustainable Fishery
on Canada’s Pacific Coast.” Vancouver and Victoria. http://science-
catalogue.canada.ca/record=3986437&searchscope=06.
Melnychuk, Michael C, Timothy E Essington, Trevor A Branch, Selina S Heppell, Olaf P
Jensen, Jason S Link, Steven J D Martell, Ana M Parma, and Anthony D M Smith. 2016.
“Which Design Elements of Individual Quota Fisheries Help to Achieve Management
Objectives?” Fish and Fisheries 17 (1): 126–42. https://doi.org/10.1111/faf.12094.
Meunier, Denis. 2018. “Hidden Beneficial Ownership and Control: Canada as a Pawn in the
Global Game of Money Laundering.” SSRN Scholarly Paper ID 3246098. Rochester,
NY: Social Science Research Network. https://papers.ssrn.com/abstract=3246098.
Minister of Fisheries and Oceans. 2019. Testimony to the Parliament of Canada Standing Senate
Committee on Fisheries and Oceans on Bill C-68, An Act to Amend the Fisheries Act and
Other Acts in Consequence. Ottawa, Canada.
https://www.ourcommons.ca/Committees/en/FOPO/StudyActivity?studyActivityId=1038
0159.
Moloney, David G., and Peter H. Pearse. 1979. “Quantitative Rights as an Instrument for
Regulating Commercial Fisheries.” Journal of the Fisheries Research Board of Canada
36 (7): 859–66. https://doi.org/10.1139/f79-124.
Morley, Robert. 2019. Submission on Regulation of the West Coast Fisheries. Ottawa, Canada.
https://www.ourcommons.ca/Committees/en/FOPO/StudyActivity?studyActivityId=1038
0159.
Moser, Caroline, Andy Norton, Tim Conway, Clare Ferguson, and Polly Vizard. 2001. “To
Claim Our Rights: Livelihood Security, Human Rights and Sustainable Development.”

160
Overseas Development Institute. https://www.odi.org/publications/1192-claim-our-rights-
livelihood-security-human-rights-and-sustainable-development.
Mundt, John Carl, ed. 1974. Limited Entry into the Commercial Fisheries : Proceedings of the
Conference Convened at the Request of Donald L. McKernan Held at the University of
Washington Lake Wilderness Continuing Education Center near Seattle, Washington, on
September 12 and 13, 1974.
Munro, Gordon R, Bruce Turris, Colin W Clark, Ussif Rashid Sumaila, and Megan Bailey. 2009.
“Impacts of Harvesting Rights in Canadian Pacific Fisheries.” Statistical and Economic
Analysis Series. Fisheries and Oceans Canada. http://science-
catalogue.canada.ca/record=4016293&searchscope=06.
National Research Council. 1999. Sharing the Fish: Toward a National Policy on Individual
Fishing Quotas. Washington, DC: Natl. Acad. https://doi.org/10.17226/6335.
Native Brotherhood of British Columbia. 1989. “A Comprehensive Plan to Increase Native
Participation in the British Columbia Fishing Industry.” Vancouver, BC: Native Fishing
Association.
Nayak, Pulin B. 1996. “The State and the Market.” Economic and Political Weekly 31 (4):
PE18–22. http://www.jstor.org/stable/4403714.
Nelson, Stuart. 2000. “An Analysis of Commercial Fishing Licence, Quota, and Vessel Values
(as at December 31, 1999), West Coast Fishing Fleet.” Report prepared for Fisheries and
Oceans Canada, Pacific Region.
———. 2003. “An Analysis of Commercial Fishing Licence, Quota, and Vessel Values (as at
December 31, 2002), West Coast Fishing Fleet.” Report prepared for Fisheries and
Oceans Canada, Pacific Region.

161
———. 2005. “An Analysis of Commercial Fishing Licence, Quota, and Vessel Values (as at
March 31, 2005), West Coast Fishing Fleet.” Report prepared for Fisheries and Oceans
Canada, Pacific Region.
———. 2007. “An Analysis of Commercial Fishing Licence, Quota, and Vessel Values (as at
March 31, 2007), West Coast Fishing Fleet.” Report prepared for Fisheries and Oceans
Canada, Pacific Region.
———. 2009. “Pacific Commercial Fishing Fleet: Financial Profiles for 2007.” Pacific
Commercial Fishing Fleets Financial Profiles Series. Fisheries and Oceans Canada,
Pacific Region.
———. 2011. “Pacific Commercial Fishing Fleet: Financial Profiles for 2009.” Pacific
Commercial Fishing Fleets Financial Profiles Series.
Newell, Richard G., James N. Sanchirico, and Suzi Kerr. 2005. “Fishing Quota Markets.”
Journal of Environmental Economics and Management 49 (3): 437–62.
https://doi.org/10.1016/j.jeem.2004.06.005.
Nguyen, Thai. 2014. “Trade Agreements and Eastern Canada’s Fisheries.” 2014-05-E. In Brief.
Library of Parliament.
https://lop.parl.ca/sites/PublicWebsite/default/en_CA/ResearchPublications/201405E.
Nuu-chah-nulth Tribal Council. 2005. “Pilot Integration Proposal Phase I Response to the
CGIAC.”
Oceans Act (S.C., 1996, c. 31). 1996.
OECD. 1997. “Toward Sustainable Fisheries: Economic Aspects of the Management of Living
Marine Resources.” Paris: Organization for Economic Cooperation and Development.

162
———. 2018. OECD Science, Technology and Innovation Outlook 2018: Adapting to
Technological and Societal Disruption. Paris: OECD Publishing. https://www.oecd-
ilibrary.org/science-and-technology/oecd-science-technology-and-innovation-outlook-
2018_sti_in_outlook-2018-en.
———. 2019. “Encouraging Policy Change for Sustainable and Resilient Fisheries.” Paris:
Organisation for Economic Co-operation and Development - Trade and Agriculture
Directorate Fisheries Committee.
Oostdijk, Maartje, Maria J. Santos, Sveinn Agnarsson, and Pamela J. Woods. 2019. “Structure
and Evolution of Cod Quota Market Networks in Iceland over Times of Financial
Volatility.” Ecological Economics 159 (May): 279–90.
https://doi.org/10.1016/j.ecolecon.2019.01.035.
Ovenden, AE. 1961. “Cost and Earnings Investigations of Primary Fishing Enterprises.” 10.
FAO Fisheries Study. Rome: FAO.
Pálsson, Gísli, and Agnar Helgason. 1995. “Figuring Fish and Measuring Men: The Individual
Transferable Quota System in the Icelandic Cod Fishery.” Ocean & Coastal Management
28 (1–3): 117–46. https://doi.org/10.1016/0964-5691(95)00041-0.
Parslow, John. 2010. “Individual Transferable Quotas and the ‘Tragedy of the Commons.’”
Canadian Journal of Fisheries and Aquatic Sciences 67 (11): 1889–96.
https://doi.org/10.1139/F10-104.
Pascoe, Sean, Catherine Robinson, and Louisa Coglan. 1996. “Economic and Financial
Performance of the UK English Channel Fleet.” CEMARE Research Report No. 44.
Portsmouth, UK: CEMARE - University of Portsmouth.

163
Pfeiffer, Lisa, and Trevor Gratz. 2016. “The Effect of Rights-Based Fisheries Management on
Risk Taking and Fishing Safety.” Proceedings of the National Academy of Sciences 113
(10): 2615–20. https://doi.org/10.1073/pnas.1509456113.
PFMI. 2003. “Future Direction of the Commercial Groundfish Fisheries in British Columbia.”
Pacific Fisheries Management Inc.
Phillips, Gregory, Lorne Kriwoken, and Peter Hay. 2002. “Private Property and Public Interest in
Fisheries Management: The Tasmanian Rock Lobster Fishery.” Marine Policy 26 (6):
459–69. https://doi.org/10.1016/S0308-597X(02)00026-X.
Pinkerton, Evelyn. 1987a. “Competition among BC Fish Processing Firms.” In Uncommon
Property: The Fishing and Fish Processing Industries in British Columbia, edited by P
Marchak, N Guppy, and J McMullan, 66–91. Toronto: Methuen.
———. 1987b. “Indians in the Fishing Industry.” In Uncommon Property. The Fishing and
Fish-Processing Industry in British Columbia, edited by Marchak, Guppy, and
McMullan, 249–69. Vancouver: University of British Columbia Press.
———. 2013. “Alternatives to ITQs in Equity–Efficiency–Effectiveness Trade-Offs: How the
Lay-up System Spread Effort in the BC Halibut Fishery.” Marine Policy 42 (November):
5–13. https://doi.org/10.1016/j.marpol.2013.01.010.
———. 2014. “Groundtruthing Individual Transferable Quotas.” In Gambling Debt: Iceland’s
Struggle with the New World Order, edited by Paul Durrenburger and Gisli Palsson, 109–
20. Boulder: University Press of Colorado.
———. 2019. “Strategies and Policies Supporting Small-Scale Fishers’ Access and
Conservation Rights in a Neoliberal World.” In Transdisciplinarity for Small-Scale
Fisheries Governance: Analysis and Practice, edited by Ratana Chuenpagdee and Svein
164
Jentoft, 241–61. MARE Publication Series. Cham: Springer International Publishing.
https://doi.org/10.1007/978-3-319-94938-3_13.
Pinkerton, Evelyn, Marc Allain, David Decker, and Ken Carew. 2018. “Atlantic and Pacific
Halibut Co-Management Initiatives by Canadian Fishermen’s Organizations.” Fish and
Fisheries 19 (6): 984–95. https://doi.org/10.1111/faf.12306.
Pinkerton, Evelyn, and Danielle N Edwards. 2009. “The Elephant in the Room: The Hidden
Costs of Leasing Individual Transferable Fishing Quotas.” Marine Policy 33 (4): 707–13.
https://doi.org/10.1016/j.marpol.2009.02.004.
Province of BC. 1999. “1998 British Columbia Seafood Industry Year in Review.”
———. 2002. “2001 British Columbia Seafood Industry Year in Review.” BC Ministry of
Agriculture, Food and Fisheries.
———. 2005. “2004 British Columbia Seafood Industry Year in Review.” BC Ministry of
Agriculture, Food and Fisheries.
———. 2006. “2005 British Columbia Seafood Industry Year in Review.” Ministry of
Environment.
———. 2008. “2007 British Columbia Seafood Industry Year in Review.” Ministry of
Environment.
———. 2011. “2009 British Columbia Seafood Industry Year in Review.” Ministry of
Agriculture.
———. 2014a. “2012 British Columbia Seafood Industry Year in Review.” Ministry of
Agriculture.
———. 2014b. “2013 British Columbia Seafood Industry Year in Review.” Ministry of
Agriculture.

165
———. 2017. “2016 British Columbia Seafood Industry Year in Review.” Ministry of
Agriculture. https://www2.gov.bc.ca/assets/gov/farming-natural-resources-and-
industry/agriculture-and-seafood/statistics/industry-and-sector-profiles/year-in-
review/bcseafood_yearinreview_2016.pdf.
Pynn, Larry. 2018. “Halibut Seem Too Pricy? Try Fishing It Yourself.” Hakai Magazine, 2018.
https://thetyee.ca/News/2018/12/14/Halibut-Too-Pricy-Try-Fishing-Yourself/.
R Development Core Team. 2019. “R: A Language and Environment for Statistical Computing.
R Foundation for Statistical Computing.” https://www.R-project.org.
R. v. Marshall. 1999, 3 SCR 456. Supreme Court of Canada.
R. v. Sparrow. 1990, 1 SCR 1075. Supreme Court of Canada.
Ramirez-Sanchez, Saudiel, and Evelyn Pinkerton. 2009. “The Impact of Resource Scarcity on
Bonding and Bridging Social Capital: The Case of Fishers’ Information-Sharing
Networks in Loreto, BCS, Mexico.” Ecology and Society 14 (1).
https://doi.org/10.5751/ES-02841-140122.
Ratner, Blake D., Björn Åsgård, and Edward H. Allison. 2014. “Fishing for Justice: Human
Rights, Development, and Fisheries Sector Reform.” Global Environmental Change 27
(July): 120–30. https://doi.org/10.1016/j.gloenvcha.2014.05.006.
Ropicki, Andrew J., and Sherry L. Larkin. 2014. “Social Network Analysis of Price Dispersion
in Fishing Quota Lease Markets.” Marine Resource Economics 29 (2): 157–76.
https://doi.org/10.1086/676852.
Salamon, Lester M., and Odus V. Elliott. 2002. The Tools of Government. Oxford University
Press.

166
Scott, Anthony Dalton. 1989. “Conceptual Origins of Rights Based Fishing.” In Rights Based
Fishing, edited by P Neher and N Mollett, 11–38. Dordrecht: Kluwer Academic Press.
———. 1996. “The ITQ as a Property Right: Where It Came from, How It Works and Where It
Is Going.” In Taking Ownership: Property Rights and Fisheries Management on the
Atlantic Coast, edited by B L Crowley. Halifax: Atlantic Institute for Market Studies.
———. 2000. “Introducing Property in Fisheries Management.” In Use of Property Rights in
Fisheries Management, edited by R Shotton. FA0 Fisheries Technical Paper 404/2.
Rome: Food and Agriculture Organization of the United Nations.
Shaffer, Marvin. 1979. “An Economic Study of the Structure of the British Columbia Salmon
Industry.” Report prepared for Fisheries and Oceans Canada and the British Columbia
Ministry of the Environment. Ottawa, ON and Victoria, BC. http://science-
catalogue.canada.ca/record=3879985&searchscope=06.
Sharman, J. C. 2011. “Testing the Global Financial Transparency Regime.” International Studies
Quarterly 55 (4): 981–1001. http://www.jstor.org/stable/41409808.
Simpson, Ian. 2017. “Analysis of Commercial Fishing Licence, Quota, and Vessel Values (as at
December 31, 2016).” Report prepared for Fisheries and Oceans Canada, Pacific Region.
http://salishseas.ca/wp-content/uploads/2017/12/2016_Valuation_Study_CMG_-
REVISED.compressed.pdf.
Slooten, Elisabeth, Glenn Simmons, Stephen Dawson, Graeme Bremner, Simon Thrush, Hugh
Whittaker, Fiona Mccormack, et al. 2017. “Evidence of Bias in Assessment of Fisheries
Management Impacts.” Proceedings of the National Academy of Sciences 114 (June):
201706544. https://doi.org/10.1073/pnas.1706544114.

167
Smith, Adam. 1776. An Inquiry into the Nature and Causes of the Wealth of Nations. Dublin:
Printed for Messrs. Whitestone, Chamberlaine, W. Watson, [etc.].
Sporer, Chris. 2001. “Initial Allocation of Transferable Fishing Quotas in Canada’s Pacific
Marine Fisheries.” In Case Studies on the Allocation of Transferable Quota Rights in
Fisheries, edited by R Shotton, 266–303. Rome: FAO.
Stage, Jesper, Anna Christiernsson, and Patrik Söderholm. 2016. “The Economics of the
Swedish Individual Transferable Quota System: Experiences and Policy Implications.”
Marine Policy 66 (April): 15–20. https://doi.org/10.1016/j.marpol.2016.01.001.
Statistics Canada. 2019a. “Table 14-10-0001-01 Average Full-Time Hourly Wage Paid and
Payroll Employment by Type of Work, Economic Region and Occupation.” Government
of Canada. https://doi.org/10.25318/1410010301-eng.
———. 2019b. “Table 18-10-0005-01, Consumer Price Index, Annual Average, Not Seasonally
Adjusted, ‘All-Items’.” Government of Canada.
https://www150.statcan.gc.ca/t1/tbl1/en/tv.action?pid=1810000501.
Stephenson, Robert L., Ashleen J. Benson, Kate Brooks, Anthony Charles, Poul Degnbol,
Catherine M. Dichmont, Marloes Kraan, et al. 2017. “Practical Steps toward Integrating
Economic, Social and Institutional Elements in Fisheries Policy and Management.” ICES
Journal of Marine Science 74 (7): 1981–89. https://doi.org/10.1093/icesjms/fsx057.
Stephenson, Robert L., Melanie Wiber, Stacey Paul, Eric Angel, Ashleen Benson, Anthony
Charles, Omer Chouinard, et al. 2018. “Integrating Diverse Objectives for Sustainable
Fisheries in Canada.” Canadian Journal of Fisheries and Aquatic Sciences 76 (3): 480–
96. https://doi.org/10.1139/cjfas-2017-0345.
Stigler, George J. 1966. The Theory of Price. 3rd ed. New York: Macmillan.

168
Stiglitz, Joseph E. 1993. “The Role of the State in Financial Markets.” The World Bank
Economic Review 7 (suppl_1): 19–52. https://doi.org/10.1093/wber/7.suppl_1.19.
———. 2000. “The Contributions of the Economics of Information to Twentieth Century
Economics.” The Quarterly Journal of Economics 115 (4): 1441–78.
http://www.jstor.org/stable/2586930.
Stoll, Joshua S., Christine M. Beitl, and James A. Wilson. 2016. “How Access to Maine’s
Fisheries Has Changed over a Quarter Century: The Cumulative Effects of Licensing on
Resilience.” Global Environmental Change 37 (March): 79–91.
https://doi.org/10.1016/j.gloenvcha.2016.01.005.
Sumaila, Ussif Rashid. 2010. “A Cautionary Note on Individual Transferable Quotas.” Ecology
and Society 15 (3): 36. https://doi.org/10.1371/journal.pbio.1000131.
Sutcliffe, Tasha, Danielle N Edwards, and Dan G Edwards. 2008. “Fisheries Licence Banks: A
Start-Up Guide to Planning, Governance, Finance & Operations.” Ecotrust Canada.
Symes, David, and Kevin Crean. 1995. “Privatisation of the Commons: The Introduction of
Individual Transferable Quotas in Developed Fisheries.” Geoforum 26 (2): 175–85.
https://doi.org/10.1016/0016-7185(95)00024-F.
Szymkowiak, Marysia, and Ron Felthoven. 2016. “Understanding the Determinants of Hired
Skipper Use in the Alaska Halibut Individual Fishing Quota Fishery.” North American
Journal of Fisheries Management 36 (5): 1139–48.
https://doi.org/10.1080/02755947.2016.1184201.
Szymkowiak, Marysia, and Amber Himes-Cornell. 2017. “Do Active Participation Measures
Help Fishermen Retain Fishing Privileges?” Coastal Management 45 (1): 56–72.
https://doi.org/10.1080/08920753.2017.1237243.

169
Szymkowiak, Marysia, and Amber H. Himes-Cornell. 2015. “Towards Individual-Owned and
Owner-Operated Fleets in the Alaska Halibut and Sablefish IFQ Program.” Maritime
Studies 14 (1): 19. https://doi.org/10.1186/s40152-015-0037-6.
Tansley, Donald. 1979. “Speech to the Fisheries Association of British Columbia on Behalf of
the Honourable Romeo Leblanc, Minister of Fisheries.” Vancouver, Canada, February
27.
Tanzi, Vito. 2011. Government versus Markets: The Changing Economic Role of the State.
Cambridge University Press.
Thompson, Susan A. 2016. “CFRN Final Report.” Canadian Fisheries Research Network.
http://www.cfrn-rcrp.ca/article201.
Thompson, Susan A., Robert L. Stephenson, George A. Rose, and Stacey D. Paul. 2019.
“Collaborative Fisheries Research: The Canadian Fisheries Research Network
Experience.” Canadian Journal of Fisheries and Aquatic Sciences 76 (5): 671–81.
https://doi.org/10.1139/cjfas-2018-0450.
Tisdell, C, and S Harrison. 1999. “Compensation for Taking of Natural Resource Interests:
Principles and Practices in Recent Queensland Cases.” Australian Journal of
Environmental Management 6 (2): 99.
Tolley, B., and M. Hall-Arber. 2015. “Tipping the Scale Away from Privatization and toward
Community-Based Fisheries: Policy and Market Alternatives in New England.” Marine
Policy 61 (November): 401–9. https://doi.org/10.1016/j.marpol.2014.11.010.
Turris, Bruce, and Brian Mose. 2018. “Shared Risks and Benefits Proposal.” presented at the
Pacific Halibut Management Association Members Meeting, September.

170
Turris, Bruce R. 2010. “A Rejoinder to E. Pinkerton et al., the Elephant in the Room: The
Hidden Costs of Leasing Individual Transferable Fishing Quotas.” Marine Policy 34 (3):
431–36.
https://econpapers.repec.org/article/eeemarpol/v_3a34_3ay_3a2010_3ai_3a3_3ap_3a431-
436.htm.
United Fishermen and Allied Workers’ Union. 2005. “Pilot Integration Proposal Phase I
Response to the CGIAC.”
United Fishermen and Allied Workers’ Union et al. v. British Columbia Provincial Council.
1977, 2 SCR 97. Supreme Court of Canada.
United Nations. 1949. “United Nations Universal Declaration of Human Rights 1948.” Office of
the Hight Comissioner for Human Rights, 11.
———. 2015. Sustainable Development Goals. New York: United Nations.
https://sustainabledevelopment.un.org/?menu=1300.
University of Victoria. 2003. “Protocols & Principles for Conducting Research in an Indigenous
Context.” University of Victoria. http://icwrn.uvic.ca/wp-
content/uploads/2013/08/igovprotocol.pdf.
UNU-IHDP, and UNEP. 2012. Inclusive Wealth Report 2012: Measuring Progress toward
Sustainability. Cambridge: Cambridge University Press.
Urquhart, Julie, Tim G Acott, and Amdeep Sanghera. 2014. “Sense of Place and Cultural Values
in Inshore Fishing Communities.” Final Report. GIFS Activity 2.1.
Ury, William. 1993. Getting Past No: Negotiating in Difficult Situations. Rev. ed. New York:
Bantam Books.
171
van Putten, Ingrid, Fabio Boschetti, Elizabeth A. Fulton, Anthony D. M. Smith, and Olivier
Thebaud. 2014. “Individual Transferable Quota Contribution to Environmental
Stewardship: A Theory in Need of Validation.” Ecology and Society 19 (2): 35.
https://doaj.org.
van Putten, Ingrid, and Caleb Gardner. 2010. “Lease Quota Fishing in a Changing Rock Lobster
Industry.” Marine Policy 34 (5): 859–67. https://doi.org/10.1016/j.marpol.2010.01.008.
van Putten, Ingrid, Katell G. Hamon, and Caleb Gardner. 2011. “Network Analysis of a Rock
Lobster Quota Lease Market.” Fisheries Research 107 (1–3): 122–30.
https://doi.org/10.1016/j.fishres.2010.10.015.
WCVI Aquatic Management Board. 2009. “Recommendations on a Mitigation Strategy Related
to Chapter 3 (Chinook) of the Pacific Salmon Treaty.” Report of the Sub-Committee of
the WCVI Aquatic Management Board.
Weinberger, David. 2014. Too Big to Know: Rethinking Knowledge Now That the Facts Aren’t
the Facts, Experts Are Everywhere, and the Smartest Person in the Room Is the Room.
Reprint edition. Basic Books.
Whitmarsh, David, Carl James, Helen Pickering, and Arthur Neiland. 2000. “The Profitability of
Marine Commercial Fisheries: A Review of Economic Information Needs with Particular
Reference to the UK.” Marine Policy 24 (3): 257–63. https://doi.org/10.1016/S0308-
597X(00)00002-6.
Wiber, Melanie, Fikret Berkes, Anthony Charles, and John Kearney. 2004. “Participatory
Research Supporting Community-Based Fishery Management.” Marine Policy 28 (6):
459–68. https://doi.org/10.1016/j.marpol.2003.10.020.

172
Windle, M. J. S., B. Neis, S. Bornstein, M. Binkley, and P. Navarro. 2008. “Fishing
Occupational Health and Safety: A Comparison of Regulatory Regimes and Safety
Outcomes in Six Countries.” Marine Policy 32 (4): 701–10.
https://doi.org/10.1016/j.marpol.2007.12.003.
Young, Oran R., D. G. Webster, Michael E. Cox, Jesper Raakjær, Lau Øfjord Blaxekjær, Níels
Einarsson, Ross A. Virginia, et al. 2018. “Moving beyond Panaceas in Fisheries
Governance.” Proceedings of the National Academy of Sciences 115 (37): 9065–73.
https://doi.org/10.1073/pnas.1716545115.

173
Appendices
Appendix A Data for the Consideration of Social and Economic Outcomes in the British
Columbia Halibut Fishery
The data that I present in this appendix was aggregated and consolidated to inform the research
presented in the research chapters but was not itself presented and discussed. This appendix
describes the sources and methodology used for these data inputs and summarises the data. The
data presented here are all publicly available, compiled from multiple sources including
published reports, online datasets, a government pay for access dataset (BC Online corporate
registry), and government data requests (through the federal Access to Information process). I
have made the raw data available online through a data repository (Edwards 2019).
A.1 Data Sources
The ownership and transactions database for the Pacific halibut fishery in BC, through which the
majority of the analysis was conducted, was constructed through analysis of a number of
governmental and non-governmental data sources:
• Access to Information requests to Fisheries and Oceans Canada (DFO), focused on three
datasets which comprised the backbone of the database:
1. Licencing data by vessel, including all BC commercial fishing licences,
associated vessel name and owner name, and vessel length
2. Quota transfers administrative data, providing each temporary and permanent
transfer of quota, including source licence, destination licence, species/area and
amount of quota transferred, type of transfer (temporary or permanent), transfer
date and transfer status (i.e., completed, pending, cancelled)

174
3. Initial annual quota allocation data by licence, providing the quota permanently
allocated to the licence in each year
• Statistics Canada Inter-Corporate Ownership historical databases, providing information
on the ownership of subsidiary companies by the largest fishing company in BC
• BC Provincial Corporate Registry Services records, providing information on
provincially incorporated organizations, including company history such as incorporation
date and name changes, and current and historical directorship information, such as
names, addresses and role in company (e.g., president, secretary)
• BC provincial processor licence lists, to identify processors
• Transport Canada Vessel Query Registration system, for information on vessel
characteristics (e.g., length, build date, gross tonnage), and vessel ownership including
owner addresses
• Investment Canada Act filings, to identify purchases of Canadian fishing companies by
foreign owners
• Corporations Canada online registry, to identify names and addresses of directors of
federally incorporated organizations
• Court proceedings and rulings from the BC Provincial Court, BC Court of Appeal, BC
Supreme Court, Federal Court of Appeal, and the Supreme Court of Canada
• Fishing company websites
• International Pacific Halibut Commission and DFO websites, including fisheries advisory
process documents and meeting attendance lists

175
A.2 Units of measurement
The management and industry standard for Pacific halibut is to report weight as ‘dressed head
off’. This is true for both the International Pacific Halibut Commission (IPHC) and DFO when
reporting TAC, catch and quota. In British Columbia, the standard for all other groundfish is to
report based on round weight, even where the catch is typically delivered as a dressed product.
All halibut weights throughout are reported as ‘dressed head off’ weight. The conversion factor
for round to ‘dressed head off’ is 0.75. The industry standard in the British Columbia halibut
fishery is to express weights in pounds. For weight conversion, one tonne is equal to 2204.6
pounds.
A.3 Consumer price index
Consumer Price Index data for Canada was retrieved from Statistics Canada, Table 18-10-0005-
01, Consumer Price Index, annual average, not seasonally adjusted, ‘all-items’ (Statistics Canada
2019b). The original base year was 2002 and I adjusted it for a 2016 base year. All price and
value multi-year trend data was adjusted for inflation using the consumer price index multiplier
to present data in 2016 constant Canadian dollars.
A.4 Halibut total allowable catch, landed value and landed price
Halibut total allowable catch (TAC) was retrieved from IPHC annual reports (1981 through
1990) and DFO integrated fisheries management plans (1991 through 2017) (Figure A.1 ).

176
Figure A.1 Halibut total allowable catch in millions of pounds.
Landed weight and landed value for 1981 to 1995 were retrieved from DFO commercial catch
statistics online summary ‘commercial halibut landings in BC, landed weight by species and
value 1951-1995’ (DFO 2012a). Landed weight and landed value for 1996 through 2017 were
retrieved from the British Columbia Seafood Year in Review reports published annually by the
Province of British Columbia (Province of BC 1999; 2002; 2005; 2006; 2008; 2011; 2014a;
2014b; 2017). Landed weight in the Seafood Year in Review is reported as round tonnes.
Weights were converted to dressed head-off based on the official DFO conversion factor (0.75)
(DFO 2016a) and to pounds based on the standard metric to imperial conversion factor (2204.6).
The average landed price was calculated as the total value divided by the total weight.
A.5 Quota lease and purchase prices
There is no comprehensive tracking of quota purchase and lease prices in BC by government at
either the federal or provincial level. Halibut quota purchase and lease prices were compiled for
1998 to 2000, 2002, and 2004 to 2016 from the values reported in annual valuation reports
commissioned by DFO (Castlemain 2018; Nelson 2000; 2007; 2005), which were estimates
based on a limited number of interviews. Purchase and lease prices for 1991 to 1997, 2001 and

177
2003, and supplementations for the years reported in the valuation reports (e.g., high and low
values) were compiled from industry trade publications (e.g., Westcoast Fisherman magazine).
Additional supplementary sources included advertised prices from licence brokerages and from
fish landings slips that fishery participants have made available, to verify average prices and
address gaps in the data for high-end lease prices. Values are provided in both current and
constant dollars, having been corrected for inflation to the 2016 equivalent.
The halibut after-lease price is the price received by the fishermen, as the difference between the
landed price and the lease price. This price was calculated where landed and lease price data
were available. When there was no lease price (i.e., before individual transferable quotas), after-
lease price was equivalent to landed price.
Licence fees are paid to the management agency by the quota owner and collected from the
lessee with the lease fee. Licence fees averaged $0.11/lb in 1991, $0.07/lb in 1993 to 1995, and
then between $0.15/lb and $0.19/lb in 1996 to 2006, when cost recovery of validation costs were
included in the fee on a rate per tonne allocated to the licence (DFO 2001; 2016b; EB Economics
1992; Nelson 2003). The validation costs were collected directly by DFO for the period to 2000,
and then collected by the Pacific Halibut Management Association (PHMA), an industry
association, from 2001 to 2006 through a joint project agreement with DFO, on a per pound basis
enforced by DFO through a 10% quota set-aside (Burnell v. Canada (Fisheries and Oceans)
2013). Since 2001, licence fees collected directly by DFO have been between $0.08 and $0.12
per pound, based on the formula that has remained unchanged over the period up to and
including 2018: $310 per tonne less 40% up to a maximum reduction of $1000 (DFO 1998b;

178
2001; 2018a). DFO did not play a role in validation fee collection after 2006 and the PHMA
subsequently discontinued their own role in the collection of validation fees. Validation costs are
now paid directly by the fishing enterprise delivering fish. Quota lease prices as reported here do
not include management fees nor validation fees. The primary source for the price data (annual
valuation reports) stated that they subtracted this fee from the lease fees reported. The practice of
subtracting this fee, where it was included with the lease fee, was followed for lease data from
supplementary sources.
Figure A.2 Average halibut landed price and lease price, in constant 2016 dollars.
Figure A.3 Average halibut after-lease price, with upper and lower range for lease prices, in dollars per
pound, in constant 2016 dollars.

179
Figure A.4 Average halibut lease price as a percentage of landed price.
A.6 Halibut fleet characteristics
Catch data is compiled by DFO but is not available at the individual level. To assess licence
catch concentration in the absence of individual catch data from DFO for the halibut fishery, I
used a proxy for catch – temporary and permanent quota holdings on the vessel at the end of the
year. There are a number of conditions necessary in order to consider year end quota holdings a
reasonable approximation of vessel catch:
1. caught quota cannot be transferable to other licences;
2. catch must closely match the TAC, to within the percentage difference that is considered
acceptable;
3. the quota lease value must be high enough to discourage loss of uncaught quota;
4. the carryover allowance of uncaught quota must be low enough to be considered
acceptable; and
5. regulations limit the amount by which an individual vessel’s catch can exceed its quota
holdings.
The halibut fishery meets these conditions. Quota in BC cannot be transferred to another licence
once caught. The halibut catch is consistently within 10% of the TAC each year (DFO 2014;

180
2017). Halibut quota lease prices have exceeded $2/lb since 2000, creating a strong incentive to
catch or lease the quota. Halibut has a carryover allowance of 10%. For most other groundfish
species, the carryover allowance is 30%. The sablefish fishery also meets most of these
conditions. Sablefish had a 15% carryover allowance that was increased to 30% in 2012 (DFO
2012b). At 30% carryover, quota holdings can be up to 30% greater than catch without the loss
of any quota. However, this only applies for licences that catch quota, so the carryover allowance
does not impact the ability to use this method to determine active licences in the fleet.
Fisheries where year end quota holdings are not a reasonable proxy for catch because of TAC
utilizations less than 70% and low value quota include the trawl, dogfish, rockfish and lingcod
fisheries.
The halibut fishery is a multi-species fishery that catches rockfish, lingcod, dogfish, and
sablefish alongside halibut. Aggregated catch in the halibut fishery for non-directed species is
available (DFO 2017). The catch of non-directed species by vessel is not available, and can only
be considered from the available data to a limited extent, given that non-directed catch is retained
by fishermen to safeguard against unexpected catch, and is often of low lease value. This has
meant, along with issues accessing quota in the unregulated quota market, that many of the
species caught as non-directed catch in the halibut fishery have underutilized TACs (Figure A.5).
The implication for the analysis is that quota for non-directed species quota on a licence will
often be uncaught (with the exception of sablefish), and so it would not be appropriate to
consider quota holdings for any species, except sablefish and halibut, as a proxy for catch.

181
Figure A.5 The hook and line sector catch in 2016 of the non-directed species caught in the halibut fishery, as
a percent of hook and line TAC for each of species / management area unit.
Once beneficial ownership, active fishing licences (based on halibut quota holdings as a proxy
for catch) and ownership categories (owner-operator, First Nation communal, corporate fishing
enterprise, processors, investors) were identified within the ownership database, a number of
summary statistics were generated, including the number of active owners by ownership
category (Table A.1), quota ownership by ownership category (Table A.2), multi-licence
ownership within the halibut fleet (Table A.3 and Table A.4) and fleet vessel characteristics
(Table A.5 and Figure A.6).

182
Table A.1 The number of active halibut licences and the number of owners of ‘active’ halibut licences, by
ownership category.
1991 1996 2016
Number of ‘Active’ Licences 435i 100% 274 63% 152 35%
Processor 13 3% 4 1% 14 9%
FN communal 18 4% 4 1% 42 28%
Corporate 16 4% 30 11% 30 20%
Owner-operator 388 89% 236 86% 66 43%
Number of Owners 390 255 115
Processor 5 1% 3 1% 5 4%
FN communal 1 <1% 1 <1% 25 22%
Corporate 7 2% 18 7% 20 17%
Owner-operator 377 97% 233 91% 65 57% i In 1991, there were between 431 (Gislason 1997) and 435 ‘active’ licences, with the exact number unknown.
Table A.2 Quota ownership by ownership category.
Owner Category 1991 1996 2006 2016
Investor 0% 23.7% 42.8% 41.6%
Processor 3.7% 3.2% 5.4% 8.1%
FN communal 2.0% 0.5% 5.8% 16.0%
Corporate 4.7% 13.5% 14.7% 16.9%
Owner-operated 89.5% 58.1% 30.4% 15.0%
Original grantee 89.5% 48.4% 25.8% 11.5%
New entrant, 1992-1996 - 9.6% 2.7% 1.6%
New entrant, 1997-2001 - - 1.1% 1.3%
New entrant, 2001-2006 - - 0.9% 0.4%
New entrant, 2007-2016 - - - 0.2%

183
Table A.3 The licences held by halibut owner-operators in 1996 and 2016, in number of owners and % of
owners holding that licence type (233 owner-operators in 1996 and 65 in 2016).
1996 2016
Licence Type # of
Owners
% of
Owners
# of
Owners
% of
Owners
Salmon (AG, AS,
AT)
206 88% 40 62%
Herring (HG, HS, J) 80 34% 17 26%
Rockfish (ZN) 43 18% 24 37%
Tuna (CT) i n/a n/a 22 34%
Prawn (W) 12 5% 7 11%
Sablefish (K) 11 5% 4 6%
Crab (R) 8 3% 4 6%
Other 52 22% 9 14% i The tuna limited licence (CT) was first introduced in 2013.
Table A.4 The number of licences associated with halibut owner-operators.
1996 2016
Number of
Licences
# of
Owners
% of
Owners
# of
Owners
% of
Owners
1 11 5% 7 11%
2 69 30% 12 18%
3 59 25% 12 18%
4 42 18% 8 12%
5 21 9% 13 20%
6 16 7% 5 8%
>6 15 6% 8 12%
Total 233 65

184
Table A.5 The vessel characteristics of ‘active’ halibut vessels in 2016, by ownership type.
Owner Type Build
Year
Avg Vessel
Length (ft)
Gross
Tonnage
Propulsion
Power (bhp)
Processor 1977 58 67 318
Corporate 1980 50 46 244
Owner-operator 1978 43 30 217
FN communal 1978 36 19 201
Figure A.6 The percent of active halibut fishing vessels in each vessel age category for each of 4 fishing years
(1991, 1996, 2006, and 2016).

185
Appendix B Licence Banks as a Tool to Mitigate Corporate Control of Fisheries: A British
Columbia groundfish example
This appendix provides as supplementary material a paper that was completed concurrent to but
separate from this dissertation research. It outlines an example of how one group of fishermen,
operating in an ITQ fishery in British Columbia, Canada, used a licence bank to attempt to
mitigate the negative consequences of ITQs. After ten years in operation, the licence bank was
self-sustaining and had realized modest and limited success. A number of lessons were learned
from the experience, and opportunities were identified for licence banks to serve as an alternative
mechanism to redress the negative consequences of ITQs, which is described in the following.
B.1 Introduction
Individual transferable quotas (ITQs) have been held up as a near cure-all for fisheries (Costello,
Gaines, and Lynham 2008; Grafton 1996; Grafton et al. 2006). Expected to address problems
ranging from stock collapse to habitat destruction to fleet overcapacity, early warnings about the
impact of ITQs on non-directed stocks and on fleet composition, among other concerns (Copes
1986) went largely unheeded. Governments in several jurisdictions enthusiastically embraced
ITQs with relatively little regard for negative consequences related to the redistribution and
consolidation of benefits and associated social and economic impacts (Eythórsson 2000;
Pinkerton and Edwards 2009; Pálsson and Helgason 1995). Some jurisdictions, such as Alaska,
while adopting ITQs also took steps to mitigate negative consequences such as owner-operator
provisions and limits on transferability, with variable success (Szymkowiak and Himes-Cornell
2015).

186
Enthusiasm for ITQs in Canada has been driven in large part by those seeking to reduce capacity
in the fishery with a mechanism that operates without public funds. It can also be a windfall to a
segment of existing fishermen leading to some degree of support from industry. In contrast to
other rationalization programs which can require hundreds of millions of dollars sourced from
the government, ITQs can lead to similar outcomes in terms of reduced capacity, while being
entirely industry funded. While this is viewed as a benefit for those seeking to limit the use of
public funds, there are consequences to having allocation determined by access to capital. The
other sought after outcome is concentration of benefits where there is concern about rent
dissipation and reliance on public income support mechanisms (e.g., employment insurance), but
again, there are often consequences as concentration of benefits dictates the loss of benefits from
some traditional beneficiaries.
For fishermen operating in jurisdictions with ITQs, the consequences of ITQs are well-known.
Fishermen in BC have observed the patterns of quota concentration, control and price inflation
since fully transferable quotas were introduced in BC in the mid-1990s. In an unfettered ITQ
system such as BC has, the distribution of access rights and resulting benefits is a function of
initial allocation and access to capital.
In response to the proposed extension of ITQ management in the British Columbia groundfish
fishery, a group of small boat independent fishermen sought solutions to mitigate the anticipated
negative consequences. These fishermen partnered with Ecotrust Canada, a not-for-profit
organization dedicated to building the conservation economy, to form a small licence bank. The

187
Pacific Coast Fisherman’s Conservation Company (PCFCC) was formed in 2006 as a limited
corporation. The licence bank provides a means for the collective ownership of quota by a group
of independent owner-operators, with an overarching goal to support sustainable groundfish
fishing enterprises by meeting ecological, social and economic objectives.
B.2 Licence banks
The concept of the licence bank is well-founded in fisheries and has been a tool used for decades
(Copes 2000). Some early examples include the Community Development Quota (CDQ)
program in Alaska (Ginter 1995) and the Northern Native Fishing Co-op in British Columbia
(Pinkerton 1987b). A licence bank provides a means for the collective ownership of licences
and/or quota to meet the objectives of the founding organization, be that government (federal,
Indigenous, provincial or municipal), a non-profit or a stakeholder group7. These objectives can
vary widely, from the repatriation of licences to marginalized interests, to maintaining access to
adjacent coastal resources, to providing a pathway for new entrants, to reducing gear impacts
(Carothers 2011; Ecotrust Canada 2008; GAP2 2014; WCVI Aquatic Management Board 2009;
Native Brotherhood of British Columbia 1989).
Interest in licence banks has been fueled in recent years by proponents of market-based
approaches to fisheries management (Fujita and Bonzon 2005; Grimm et al. 2012) as well as by
7 A licence bank refers to any allocation of fishing rights to a collective group in a limited access scenario.
There is no requirement for a licence bank to have objectives related to a full range of social, ecological or economic
outcomes, nor are there restrictions on the types of economic outcomes that may be sought after from a licence bank.
A licence bank can be anything from collective ownership by a group of fishermen to pool resources or a means for
a community to hold quota that it then leases strictly to gain income for other uses. The licence bank concept does
not dictate the purpose of the entity and only through consideration of the objectives for any specific licence bank
can the success and value of the licence bank be evaluated.

188
those seeking to meet social and economic objectives in ITQ fisheries where legislative or
regulatory mechanisms are absent or ineffective (Holland and Wiersma 2010; Sutcliffe,
Edwards, and Edwards 2008). Licence banks are a tool that holds promise, but they are not
without their challenges, pitfalls and limitations.
The initial capitalization of the licence bank is the major impediment to the wider adoption of
licence banks. Options for capitalizing the bank include investment by fishermen, by
government, and/or by a foundation or through the allocation of the resource directly. The
allocation of the resource directly is only a viable option at the implementation of an ITQ
system. Once the resource has been fully allocated and allowed to be traded on the market, to
reallocate what is often a highly valued property that is critical to fisheries participant’s
livelihoods8 without compensation would be a violation of human rights (United Nations 1949)
and would undermine the social objectives of fairness and commitments to the treatment of
small-scale fisheries (FAO 2015). For an ITQ that has been implemented, only through
investment can existing rights holders be fairly compensated while establishing a new
mechanism (i.e., a licence bank) to address intergenerational transfer and equity issues.
Investment by fishermen, or at least by fishermen alone, is rarely an option in such cases as the
cost of purchasing any meaningful amount of quota is often beyond the financial means of
fishermen. Both government and foundations have the financial wherewithal to capitalize a
licence bank and support from one or both is critical.
8 While there is considerable debate about whether or not fisheries quota can be consider property, particularly
where the fisheries resource is considered a common pool resource, in the case of Canada, the Government of
Canada has enabled, supported and participated in the market for access rights resulting in fisheries licences and
quota having de facto property rights. Furthermore, the value of fisheries licences and quota has been recognized in
Canadian law with respect to bankruptcies (Saulnier v. RBC (2008 SCC 58).

189
B.3 Methods
This paper is based primarily on the anthropological method of participant-observation. The
authors are a father and daughter with a combined >65 years working in the fishing industry in
British Columbia in different capacities. The second author has been a commercial fisherman for
more than 50 years, and an industry representative and community activist over the previous 25
years. He was closely involved in the development of a regional aquatic management board and
has held positions with regional and national fisheries organizations. He was a representative at
the Commercial Industry Caucus (CIC) negotiations for the BC Commercial Groundfish
Integration Pilot Project (CGIPP). The first author has worked in an advisory capacity to the
fishing industry, including as a technical advisor at the CIC negotiations and related tables. The
two authors were co-owners of a fisheries management consulting company which held contracts
with different organizations to deliver fisheries management related services.
The authors were among the founding members of the PCFCC licence bank and remain active in
the company. They have managed the licence bank since its inception. As well, the second
author is a fisherman-member of the licence bank. The paper was provided to all members of the
licence bank to review and verify the conclusions presented.
B.4 ITQs in the BC groundfish fishery
The British Columbia groundfish fishery is frequently lauded as an example of a successful ITQ
fishery (Grafton, Nelson, and Turris 2006; Munro et al. 2009; Sporer 2001). Comprised of 7
distinct yet interrelated fisheries, the BC groundfish fishery has a complex history of ITQ

190
implementation. Sablefish longline was the first to have individual quotas (IQ) introduced, in
1990, but not fully transferable until 2000 (DFO 1999c). Halibut hook and line had IQs
introduced in 1991, with full transferability in 1999 (DFO 1991; 1999a). Groundfish trawl was
transitioned to an ITQ fishery in 1997 (DFO 1998a). ITQ adoption in the BC groundfish fishery
culminated in the BC Commercial Groundfish Integration Pilot Project (CGIPP) in 2006 (CIC
2005; DFO 2006).
CGIPP was a response, under mounting pressure, to improve the management of groundfish
stocks of concern. This new system was intended to create a more manageable and cost-effective
approach to the complex multi-species, multi-gear groundfish fishery while achieving
conservation objectives. Under CGIPP: ITQs were implemented in the hook and line rockfish,
dogfish and lingcod fisheries; all groundfish vessels were required to have either an electronic
monitoring camera or an observer on board every trip; all rockfish catch had to be landed
(discarding of rockfish – which has a near 100% discard mortality – was not permitted); all catch
had to be recorded and mortality of “marketable”9 ITQ species covered by quota acquired by the
fisherman; and, quota transferability between the commercial groundfish sectors was instituted
on a limited basis.
Prior to integration, the small boat hook and line dogfish fishermen operated in a competitive
fishery in which they were legally required to discard their non-directed catch of halibut,
sablefish and rockfish species. While supportive of the groundfish integration process in general,
9 The meaning of marketable is identified in the Integrated Fisheries Management Plans for the groundfish
fisheries and is not analogous to legal size or market acceptability.

191
and the change in regulations that would allow fishermen to land their non-directed catch in
particular and eliminate the practice of discarding dead rockfish, dogfish fishermen expressed
concerns about the seemingly inevitable movement of quota to corporate interests, due to factors
such as market control and access to capital. At the time of CGIPP development, there was
already increased corporate ownership and control, loss of independence for small boat
fishermen beholden to processors to access quota, and increased costs for fishing enterprises due
to quota leasing fees that were threatening the financial viability of many formerly successful
fishing enterprises (Pinkerton and Edwards 2009). The costs of purchasing quota was considered
an insurmountable obstacle, putting the fishermen in the position of having to lease their non-
directed catch quota each year with no guarantees of access to quota year to year and subject to
fluctuating and frequently high quota prices.
It was increasingly seen that success in the fishery was not dictated by how well you were able to
fish, but by how much quota you were able to secure. This heavily favoured those that were
granted quota in the initial quota allocation, at the expense of new entrants, as well as those who
were able to access capital to buy quota – favouring vertically and horizontally integrated large
corporate interests as well as urban fishermen benefiting from the rapid increase in the value of
real estate in the BC lower mainland. There was also a new player in fisheries – the investor.
Increasingly, quota was owned by individuals with no other connection to the fishery, for the
sole purpose of leasing the quota to generate a return on investment. As holders and leasers of an
intangible asset, these investors did not add any value to the fishery while being the recipients of
the wealth being generated.

192
CGIPP was seen as further entrenchment within a management system in which access to capital
was the determinant of success, and where there was no path for the average, or even the
exceptional, independent fisherman to access capital. In advance of CGIPP implementation, a
group of small boat independent groundfish fishermen sought solutions to mitigate the
anticipated negative consequences.
B.5 The challenges
B.5.1 The quota system
The BC groundfish fishery is a highly complex fishery. There is competition among participants
for fishing spots, intensified by bycatch avoidance and gear conflicts (e.g., between hook and
line, long line trap and trawl), for markets, and increasingly and dominantly, for quota. The
complexity of the system substantially increased with the implementation of ITQs for more than
40 units of quota management, corresponding to species or species agglomerations and
management areas.
The federal fisheries department, in instituting the ITQ system, adopted a free market approach
of “willing buyer, willing seller” in which the department maintained responsibility for tracking
the individual allocations and transfers of quota, but did not institute any form of quota trading
system. The reasoning provided was that fishing enterprises would self-organize to manage their
quota trading on a strictly voluntary basis. At the same time, the department did not release quota
holdings information, citing business confidentiality restrictions. Several years after CGIPP was
implemented, the department did begin to release initial allocation information on their website,
although not in a machine readable format. However, the department continued to refuse the

193
release of information on current holdings, which would reflect temporary and permanent
transfers made within the year. This approach by the department stymied the development of an
external quota exchange and entrenched a quota market characterized by no transparency of
either current quota holdings or lease prices paid.
B.5.2 Access to capital
ITQs create a mechanism to more fully monetize access rights to fish, placing a value on each
pound of fish. In BC, with the absence of ownership restrictions, the quota asset for a number of
fisheries has become highly valued as an income generator. This asset can be bought up by
investors and large corporate interests who have access to capital. The path to quota ownership
does not exist for the most part beyond the relatively few granted sufficient quota at the
implementation of ITQs to both earn a living from fishing and reinvest in the fishery. The impact
is that there is a reduction in new entrants and a shift in the ownership profile of the fishery away
from small boat independent owner-operators. Over time, as the initial quota grantees retire or
otherwise exit the fishery, the majority of fishermen operating in the fishery do so as renters
more than owners. They may own their vessel and even their licences and a nominal amount of
quota, but they rent the majority of the quota that they fish. Without access to the capital to even
lease the quota on an annual basis, many fishermen have become reliant on business
relationships with processors who own and/or lease the quota, further removing fishermen from
control over the leasing situation. Fishermen have become price takers and are frequently
unaware of the lease price they are even paying. Processors typically issue sales receipts that
show only the price paid to the fishermen, not the landed value of the fish or the lease price
deducted from the landed value.

194
Over the previous 3 decades, financial institutions in Canada have typically refused to accept
licences or quota as collateral. Recently there have been limited instances in which exceptions
have been made, but only on highly restrictive lending terms. To purchase quota, fishermen must
compete with investors, processors, and governments10, all of whom have access to capital at
relatively low or even no cost. The competition for quota and lack of financing options leaves
most active fishermen operating in the fishery today – who were not part of the initial allocation
of the higher value quota more than two decades ago or having benefited from another windfall
(e.g., real estate) – in a perpetual renter’s cycle, unable to earn enough from the fishery, due to
the high lease fees they are paying, to enable them to purchase quota.
B.6 The PCFCC
Seven small boat fishermen partnered with a for-profit consulting company and a not-for-profit
community development organization (Ecotrust Canada) to form a limited company, the PCFCC,
in spring 2006. The purpose of the PCFCC was to purchase, hold and make available fishing
quota to members. A set of social, economic and ecological criteria were established to govern
the structure and operations of the PCFCC. The consulting company and Ecotrust Canada
participate as the management partner and in an advisory/policy support role respectively.
10 The Government of Canada, in order to repatriate fishing access rights to Indigenous Peoples in Canada, has
been a consistent purchaser of fishing licences and quota through programs such as the Pacific Integrated
Commercial Fisheries Initiative (PICFI), initially funded at $175 million over the period 2008 – 2012 and
subsequently extended.

195
An initial investment by member fishermen, later bolstered with financial support from the
Gordon and Betty Moore Foundation, was used to purchase halibut and rockfish licences/quota
to be held by the corporation and leased back to member fishermen at a “fair” lease rate,
determined through consultation with fishermen members, consideration of the PCFCC founding
principles and review of the financial dynamics of member fishing enterprises. The lease rate
was capped at a percentage of average landed value in a given year, with the percentage variable
by species and the directed species (e.g., halibut, lingcod) capped at a lower percentage of landed
value than non-directed species (i.e., rockfish).
The PCFCC completed its first fishing season in the summer of 2006, working with a third of a
rockfish licence which had associated with it approximately 5500 lb (2495 kg) of rockfish quota
split between 19 different species and management area groupings. This quota helped fishermen
cover their catch of rockfish without having to pay exorbitant lease fees for rockfish quota.
Additional licences and quota were purchased that fall and winter.
The PCFCC is structured so that, as the fishermen pay off any loans through the lease fees
charged to use the quota, revenue is reinvested to purchase additional quota and build the assets
of the licence bank. The quota that is owned is a percentage of the overall total allowable catch
(TAC), with that percentage translated each year into poundage based on the annual total
allowable catch allocation. The PCFCC halibut quota holdings represent 0.0222% of the BC
halibut commercial TAC. As the TAC is subject to change each year in response to stock
assessments and management (e.g., allocation) decisions, the poundage that this percentage
represents can fluctuate year to year. In 2016, the PCFCC quota holdings totaled approximately

196
2000 lb (907 kg) of halibut quota, 23,000 lb (10,433 kg) of mixed rockfish quota and 1500 lb
(680 kg) of lingcod quota. The halibut and rockfish quota was all purchased within the first year
of the incorporation of the company and the lingcod quota purchased in 2014 out of the lease
fees charged to its members.
B.6.1 Founding Principles
The PCFCC’s three main goals or founding principles are summarized below.
Ecological goal: to promote fisheries that are sustainable and conservation-based by meeting the
following criteria:
• minimize bycatch and discard mortality by promoting selective harvesting and multispecies
fisheries11
• minimize habitat degradation and maintain habitat integrity through the use of low-impact
fishing gear technology
• ensure monitoring and full reporting of catch and landings
• support scientific research and traditional ecological knowledge to inform fisheries
management
• encourage a value chain approach to promote the re-use of waste products12
Social goal: to promote equity and uphold local traditions and culture by meeting the following
criteria:
11 Many fisheries, while traditionally managed as single species fisheries, in reality intercept a wide variety of
species. By managing such a fishery as a multispecies fishery, the intent is that the full range of species intercepted
and not just the primary target species have appropriate stock assessment, regulations and management procedures
in place for effective management. 12 There is a long history in fisheries of the sub-optimal use of fish, such as the use of potentially high quality,
high value food for the production of fish meal and other low value products as well as the sale of only a small
portion of the fish harvested to specialty markets and the discard of the remainder. The intent of the value chain
approach is to promote the full, optimized use of resources extracted from the ocean environment, to minimize waste
and maximize value. This value chain approach was exemplified in the BC dogfish fishery in which virtually every
part of the fish was used, from the fillets to cartilage. Even the final waste product remaining after processing was
used to produce a high quality fertilizer.

197
• increase benefits of adjacent fisheries resources accruing to local communities and active
working fishermen
• promote effective participation of fishermen and the community at large in the decision-
making and management of fisheries
• support intergenerational equity and youth employment in the fisheries
• ensure fair distribution of benefits to active working fishermen
• promote reinvestment in infrastructure
Economic goal: to maximize socio-economic benefits of resource use by fostering the viability
of small boat independent fishing enterprises and local processing to meet the following criteria:
• ensure adequate financial returns to sustain and grow the assets of the quota bank, while
providing a good living to working fishermen
• promote the economic viability of the small-boat fleet in rural communities
• increase value-added and local processing
• increase economic diversification and year-round employment through the harvesting of a
wide range of marine species
B.6.2 Enabling conditions
The near total lack of restrictions on quota and licence ownership in BC meant that there were no
regulatory barriers for a for-profit company owned by multiple interests purchasing and holding
licences and quota. However, there is a notable lack of corporate structures available for social
innovation enterprises in Canada. At the time of incorporation, the co-operative legislation in BC
was deemed to be a difficult piece of legislation to operate within and legal advice was given to
incorporate as a for-profit corporation under the BC Business Corporations Act. To address the
limitations of this Act, given the objectives of the licence bank, a detailed shareholder agreement
was developed that identified mechanisms to ensure entry into the licence bank remained
affordable over time.
The support of a not-for-profit and a foundation were critical to the establishment of the licence
bank, in terms of advice as well as financing support. A licence bank pools the resources of its

198
members but that would have been insufficient to purchase any meaningful amount of quota,
reflecting the fact that the licence bank was implemented well into a period of quota
concentration and quota price inflation. Fishermen have a strong incentive to participate in the
licence bank because it represents one of very few options available to them to attempt to break
the renting cycle. The licence bank is also attractive to members because it is self-sustaining,
given a sufficient quota base for operation.
B.7 Lessons learned
B.7.1 Peer support
One of the most important outcomes of the licence bank, but also one of the most difficult to
measure, is how peer support among members of the licence bank helped its members in the
early, difficult days of adapting to the new integrated groundfish fishery system. Six of the seven
founding fishermen members are still active in the fishery 10 years later; the only fisherman no
longer active left the PCFCC and the fishery due to illness. During this period, the fishery as a
whole saw a reduction of about 30% in the number of vessels participating. Although the licence
bank cannot claim credit for why its fishermen members have continued in the groundfish
fishery, it was an organizing entity for its members. Through the PCFCC, members received
moral support as well as peer support in the form of shared advice, contacts for quota leasing,
help navigating the quota trading system, and modest quota access to participants, particularly
during the early stages of the CGIPP pilot. The founding fishermen were all dogfish fishermen
prior to CGIPP with no history in the trading of quota. Within three years of the start of CGIPP,
the market for dogfish collapsed due to a combination of external factors, including the sharply
increasing value of the Canadian dollar, the global recession, and increased supply driven by

199
higher dogfish catches in the US. Despite the loss of their primary fishery, the members were all
able to successfully transition within the newly integrated groundfish fishery.
B.7.2 Licence bank capitalization
In the initial work to develop the licence bank, a number of capitalization options were identified
and pursued. It became clear early on that traditional financing mechanisms (i.e., banks) and
venture capital would not be viable to capitalize the licence bank as the repayment terms could
not be met based on revenue from the purchased asset alone. Quota for halibut and sablefish in
BC typically sells at between 12-20 times the annual lease fee. Once interest fees are factored in
as well as a typical repayment period of 10 years, it is immediately clear that the quota purchase
cannot be paid back from lease revenue alone. This necessitated a commitment by fishermen to
independently finance the establishment of the bank and was greatly bolstered by the support of
a foundation, which was critical support. There has been no support from the Government of
Canada for a licence bank in BC to mitigate corporate control and establish a mechanism to
support adjacency, intergenerational transfer and more equitable distribution of benefits. In
another situation, the Pacific Salmon Treaty chinook mitigation which saw a $30 million transfer
of funds from the US to Canada to reduce fishing pressure in Canada for a period of 10 years, a
licence bank was proposed in 2009 as the mechanism to temporarily reduce fishing pressure
while supporting future fishing opportunities for the region(WCVI Aquatic Management Board
2009). In that case, the Government of Canada flatly refused to direct funds to a licence bank.
There was an important lesson in both the PCFCC experience and that of the salmon mitigation,
that a source of capital is needed, be it foundation or government, and that an early assessment
should be made as to whether support from either is possible and likely.

200
B.7.3 Size and scale
Due to the small size number of members and the limited assets of the licence bank, its impact
has been limited. The quota available to members represents a tiny fraction of the quota that they
fish each year. Despite having a financial impact of only a few thousand dollars per year for
members, for fishermen operating on very tight margins, that additional income from accessing
quota at a fair lease price can be important. As well, the licence bank is a reservoir of the types of
quota (i.e., certain rockfish species) that can be difficult to access at times throughout the year,
providing a limited safety net for fishermen. The licence bank has also been able to serve as a
purchaser for members having to sell their personal quota holdings for financial reasons. The
licence bank pays fishermen market value for their quota and is then able to continue providing
limited access to that quota by leasing back to members.
The greatest disappointment with the PCFCC has been the inability to scale it up, to have a more
meaningful impact for current members as well as offering the opportunity to bring in more
members. This limitation is entirely due to the size of the initial capital investment coupled with
the high cost of quota purchase in BC. The initial investment enabled only a small quota
purchase to be made, which in turn resulted in small financial returns each year to the PCFCC,
which in turn has meant few resources available to reinvest. Exacerbating this has been reduction
in the halibut total allowable catch, by about 50% since the initial purchase of the halibut quota
in 2007, both due to a reduction in the total TAC as well as a reallocation of TAC from the
commercial to the recreational sector in 2012. The asset value of the halibut quota has remained
virtually unchanged, since quota is sold as a percentage of the TAC and the price per pound has

201
adjusted upward as the TAC falls. However, the income to be earned from leasing the quota to
members is substantially less as a result, in part due to the commitment of the licence bank to
only charge a “fair” lease price. Market halibut lease prices have risen dramatically in recent
years, further eroding the financial viability of independent fishermen who must lease quota.
B.7.4 Cooperation
ITQs are often promoted as a means to eliminate the “race for the fish”. However, the race is not
eliminated, it is just shifted. Certain time pressures (e.g., overly short seasons) may be reduced
with ITQs, but fishermen instead find themselves competing for quota, for favoured fishing
spots, and for markets. This is exacerbated when fishermen find themselves leasing quota at very
high prices, where delivering by a certain time to take advantage of a market upswing can mean
the difference between losing money on a trip and breaking even. In this environment,
maintaining cooperative relationships between fishermen can be very challenging. These
challenges have been witnessed in the licence bank on a number of occasions. Although business
partners, they remain competitors for the most part. It is only because of the strong rationale for
continued benefits from participation in the bank that the bank has continued to exist despite this
very real constraint. The licence bank has helped to improve relationships among fishermen,
although on a limited basis.
B.8 Conclusions
Starting with a very small pilot project allowed testing of the concept of a licence bank, put the
legal and technical framework in place, and built credibility within the fishing community. While
small and limited in scope, this licence bank pre-dates many of the larger licence banks now in

202
place in the eastern United States, and has established a successful track record from which
lessons can be learned. The licence bank also differs from many other licence banks in its
emphasis on addressing the consequences of leasing in ITQ fisheries, and the importance placed
on establishing “fair” lease rates. The initial capitalization of the licence bank is the greatest
hurdle to overcome and how and to what extent it is accomplished will determine the success and
shape of the licence bank in the future. The PCFCC benefited from a strong core of member
fishermen committed to seeing the licence bank succeed and willing to invest their own limited
resources to make it happen. The modest investment that was made into the licence bank,
however, even with foundation support, has limited the impact of the licence bank and its ability
to scale up. While the licence bank has demonstrated a mechanism by which corporate control
within an ITQ fishery can be mitigated, the PCFCC has not had a notable impact on corporate
control in the BC fisheries due to its small scale. The licence bank has been a benefit for the
members, providing peer and moral support and limited but important access to quota, and
continues to uphold and further its objectives as identified through its founding principles.


![유형정복 모의고사 - ebook.academysoft.co.krebook.academysoft.co.kr/databox/ITQ/2019 ITQ 엑셀/ITQ 엑셀 모의... · 유형정복 모의고사 1 [제1작업] 표 서식](https://img.pdfslide.net/doc/110x75/5f51fde46eb52b045c4c11b6/oee-ee-ebook-itq-itq-e-oee.jpg)