Embed Size (px)
Citation preview
Addressing the challenges of genomic
characterization of hematologic
malignancies using microarrays
Sarah South, PhD, FACMG
Medical Director, ARUP Laboratories
Department of Pediatrics and Pathology
University of Utah
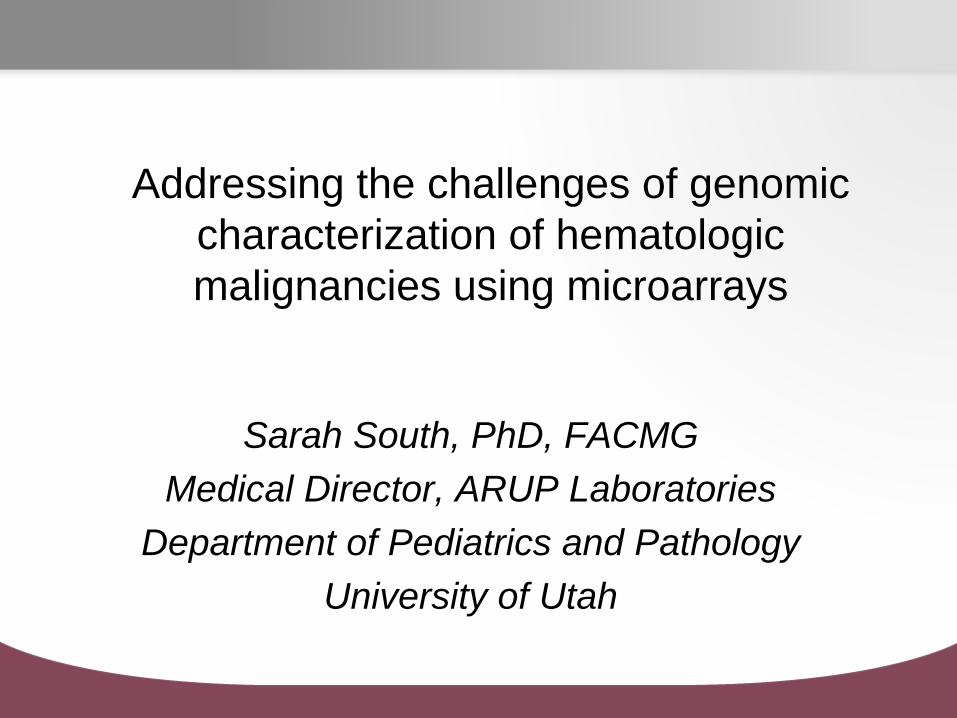
What is cytogenetics
• The original whole genome analysis
– Analysis of chromosomes from a tissue of interest to
identify large scale genomic alterations
• G-banded karyotype
– Molecular cytogenetics analyzes smaller regions for
imbalances and rearrangements
• FISH and genomic microarray
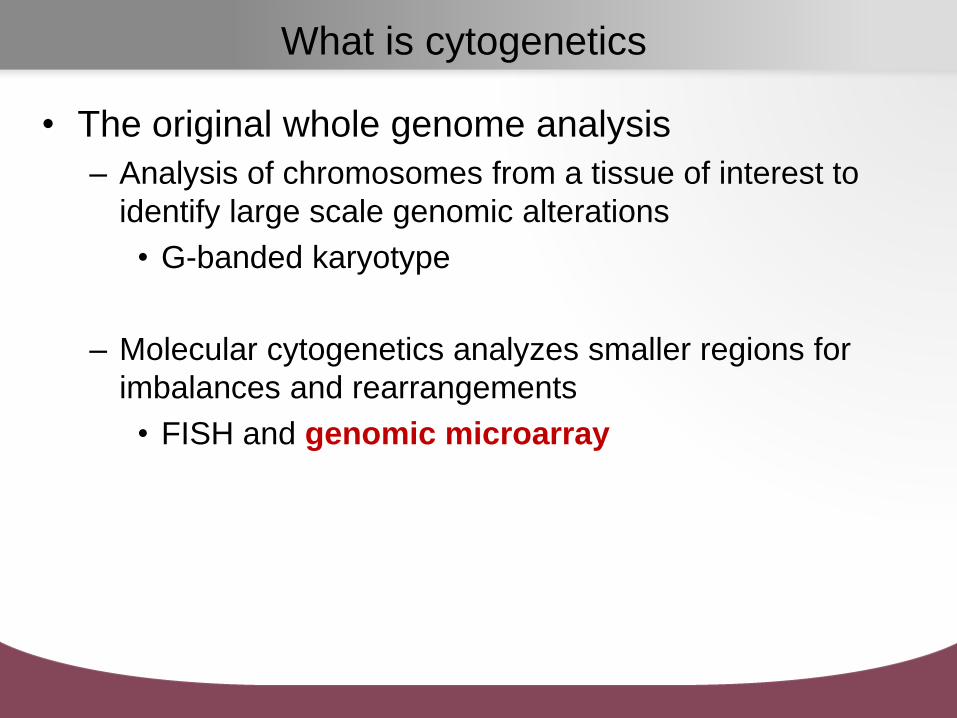
Indications for a oncology-related chromosome analysis
• Diagnostic chromosome rearrangements
– CML and t(9;22)
• Prognostic rearrangements
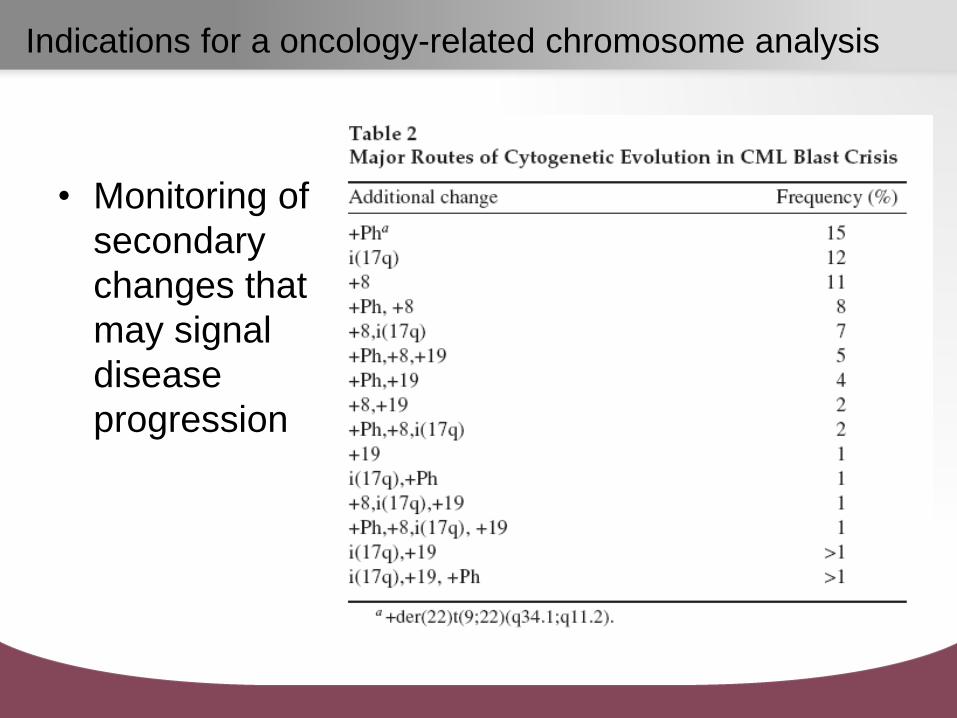
• Monitoring of
secondary
changes that
may signal
disease
progression
Indications for a oncology-related chromosome analysis
• Monitoring effectiveness of therapy
– Disappearance of previously detected
chromosome rearrangement - good
– Appearance of new chromosome
rearrangements – not good
• Secondary hematologic malignancies
Indications for a oncology-related chromosome analysis
Most common tissue studied: bone marrow/peripheral
blood for leukemias/lymphomas; tissue biopsy for solid
tumors
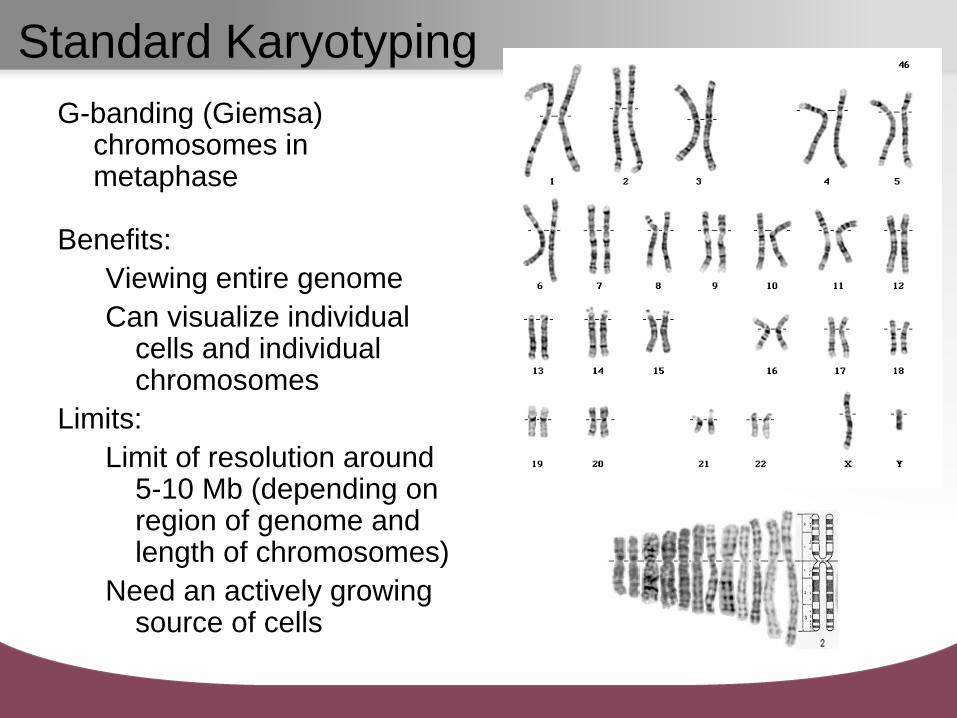
Standard Karyotyping
G-banding (Giemsa) chromosomes in metaphase
Benefits:
Viewing entire genome
Can visualize individual cells and individual chromosomes
Limits:
Limit of resolution around 5-10 Mb (depending on region of genome and length of chromosomes)
Need an actively growing source of cells
Microarray should not be considered “the test” in
all cancer samples
• Balanced translocations may need to be ruled out based
on indication
– CML and BCR/ABL1 fusion
– APL and PML/RARA fusion
• As mosaicism detection not reliable under 20-30%
(depending on size and direction), not recommended for
minimal residual disease detection
• Not currently designed to detect specific nucleotide
mutations
• Consider utility in cases in which CN and aLOH is
informative (CLL, MDS, ALL, AML, multiple myeloma,
renal cell carcinoma) and supplement as needed with
other tests
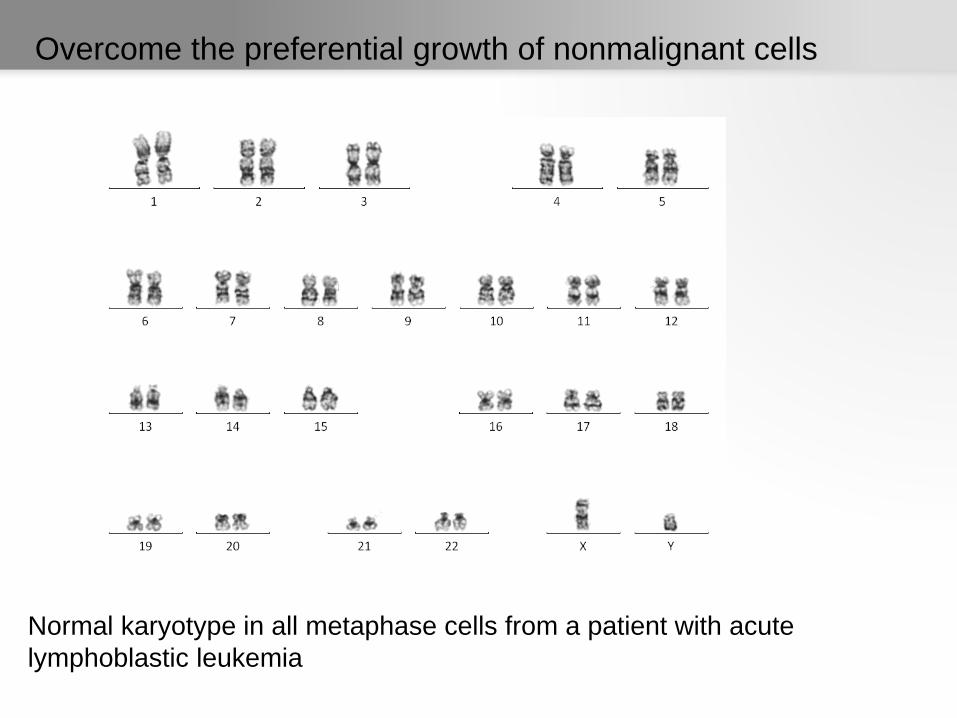
Overcome the preferential growth of nonmalignant cells
Normal karyotype in all metaphase cells from a patient with acute
lymphoblastic leukemia
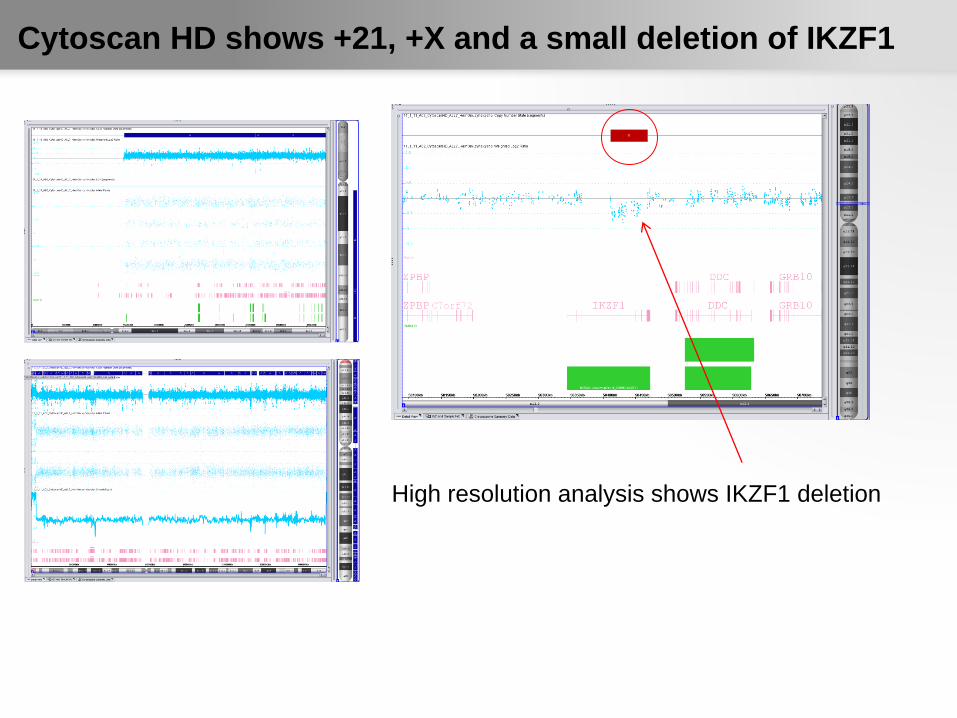
High resolution analysis shows IKZF1 deletion
Cytoscan HD shows +21, +X and a small deletion of IKZF1
Detection and characterization of recurrent translocations play
an important role in diagnosis and treatment of hematological
disorders.
Chromosomal microarray analysis (CMA) is a powerful tool to
detect copy number changes in hematological disorders. One of
the limitations of CMA platforms currently in use is that truly
balanced chromosome rearrangements cannot be detected.
However, some chromosomal rearrangements have cryptic
losses or gains at the breakpoints which may be detected by
microarray. In addition, recurrent balanced translocations
followed by gain or loss of one of the derivative chromosomes
can be detected by CMA, and recurrent interstitial deletions
resulting in gene fusions may also detected by microarray.
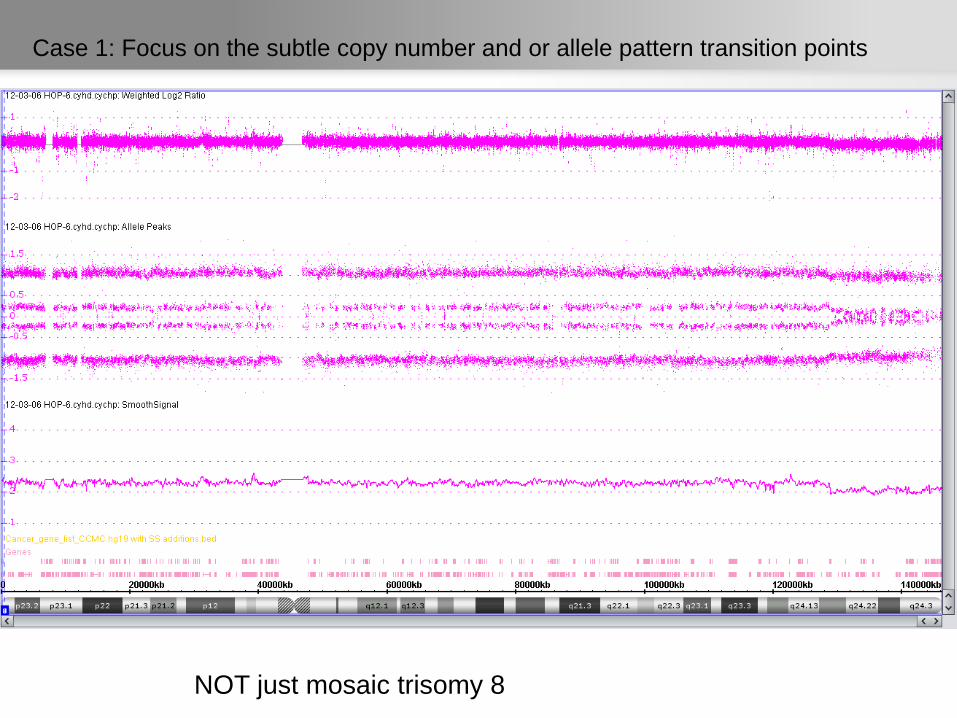
Case 1: Focus on the subtle copy number and or allele pattern transition points
NOT just mosaic trisomy 8
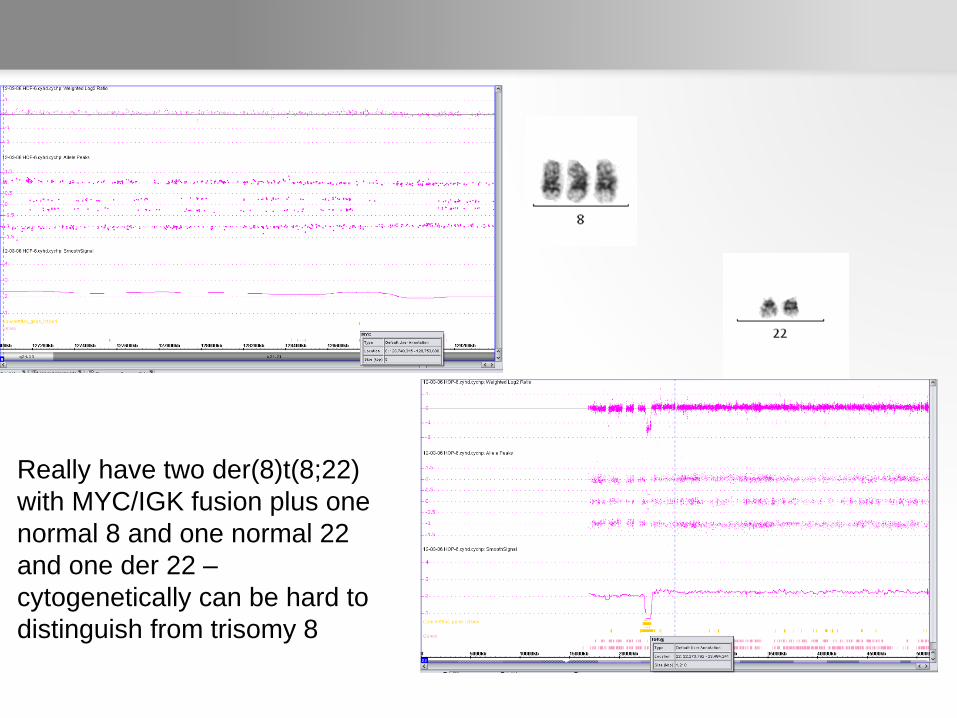
Really have two der(8)t(8;22)
with MYC/IGK fusion plus one
normal 8 and one normal 22
and one der 22 –
cytogenetically can be hard to
distinguish from trisomy 8
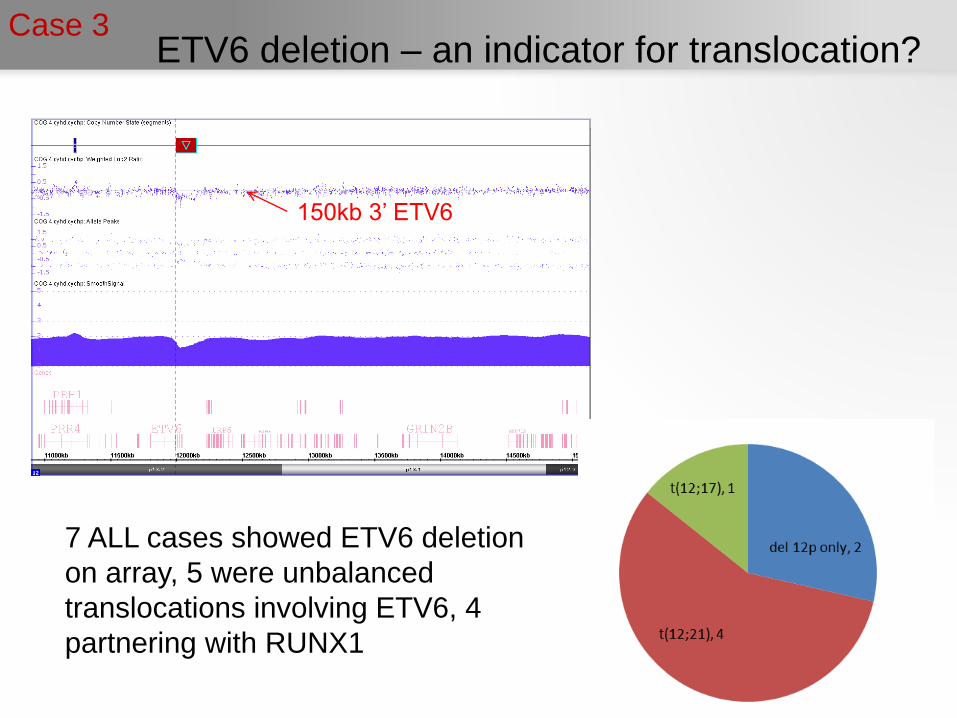
ETV6 deletion – an indicator for translocation?
7 ALL cases showed ETV6 deletion
on array, 5 were unbalanced
translocations involving ETV6, 4
partnering with RUNX1
Case 3
150kb 3’ ETV6
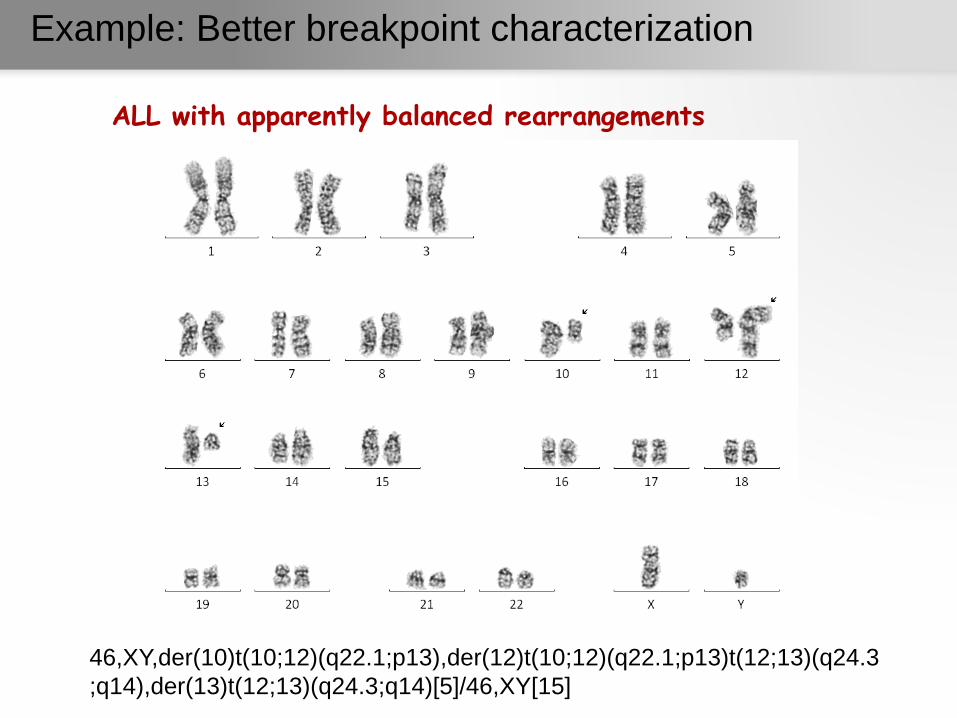
Example: Better breakpoint characterization
46,XY,der(10)t(10;12)(q22.1;p13),der(12)t(10;12)(q22.1;p13)t(12;13)(q24.3
;q14),der(13)t(12;13)(q24.3;q14)[5]/46,XY[15]
ALL with apparently balanced rearrangements
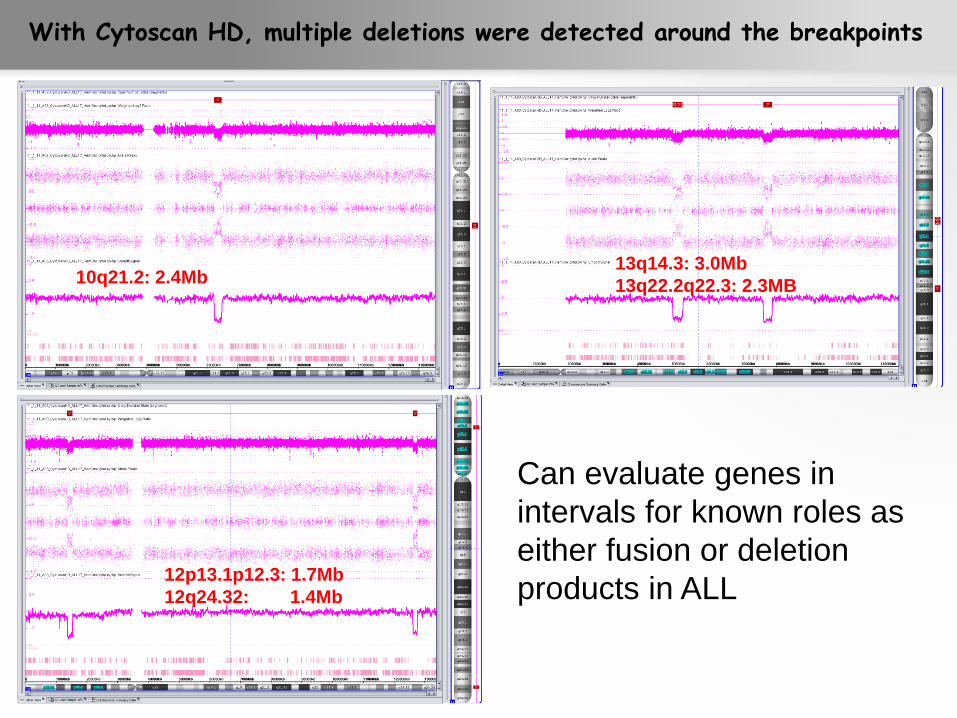
10q21.2: 2.4Mb
12p13.1p12.3: 1.7Mb
12q24.32: 1.4Mb
13q14.3: 3.0Mb
13q22.2q22.3: 2.3MB
With Cytoscan HD, multiple deletions were detected around the breakpoints
Can evaluate genes in
intervals for known roles as
either fusion or deletion
products in ALL
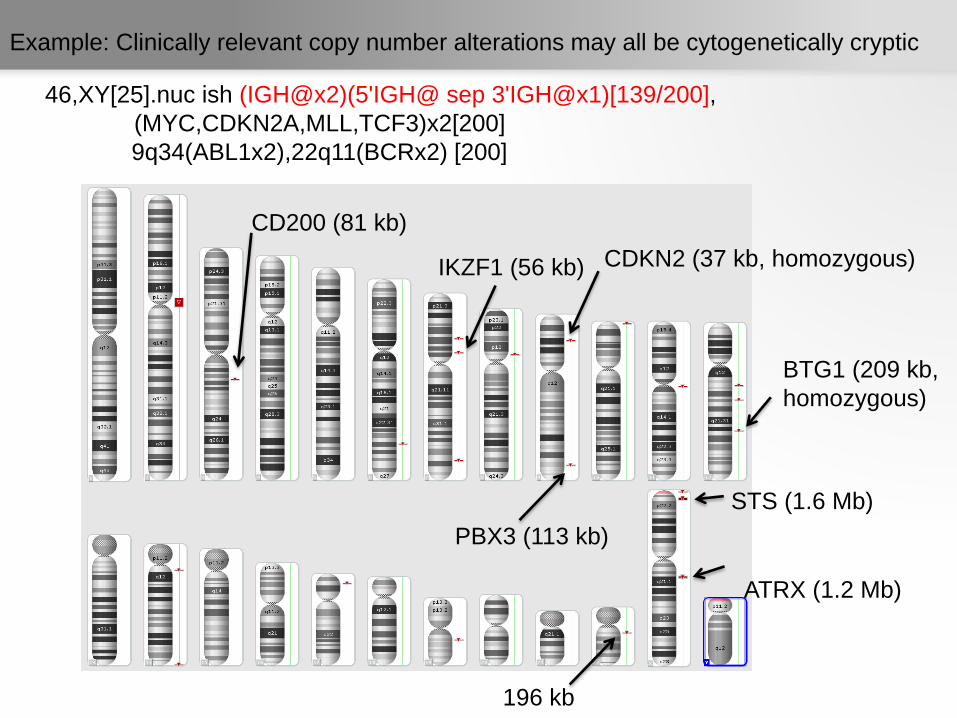
Example: Clinically relevant copy number alterations may all be cytogenetically cryptic
46,XY[25].nuc ish (IGH@x2)(5'IGH@ sep 3'IGH@x1)[139/200],
(MYC,CDKN2A,MLL,TCF3)x2[200]
9q34(ABL1x2),22q11(BCRx2) [200]
CD200 (81 kb)
IKZF1 (56 kb) CDKN2 (37 kb, homozygous)
PBX3 (113 kb)
BTG1 (209 kb,
homozygous)
STS (1.6 Mb)
ATRX (1.2 Mb)
196 kb
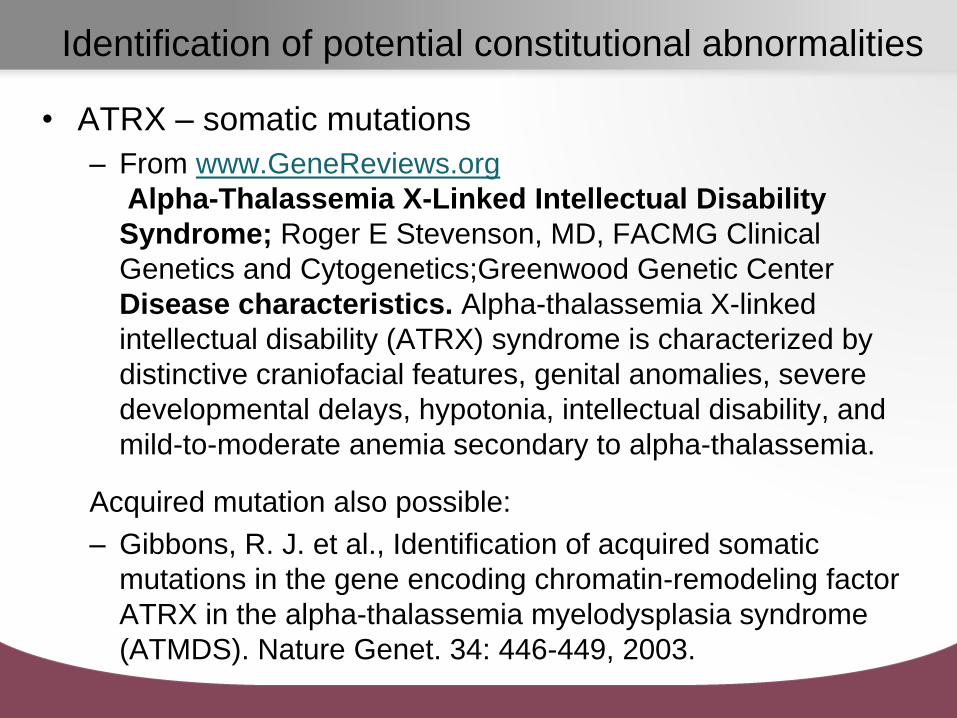
Identification of potential constitutional abnormalities
• ATRX – somatic mutations
– From www.GeneReviews.org
Alpha-Thalassemia X-Linked Intellectual Disability
Syndrome; Roger E Stevenson, MD, FACMG Clinical
Genetics and Cytogenetics;Greenwood Genetic Center
Disease characteristics. Alpha-thalassemia X-linked
intellectual disability (ATRX) syndrome is characterized by
distinctive craniofacial features, genital anomalies, severe
developmental delays, hypotonia, intellectual disability, and
mild-to-moderate anemia secondary to alpha-thalassemia.
Acquired mutation also possible:
– Gibbons, R. J. et al., Identification of acquired somatic
mutations in the gene encoding chromatin-remodeling factor
ATRX in the alpha-thalassemia myelodysplasia syndrome
(ATMDS). Nature Genet. 34: 446-449, 2003.
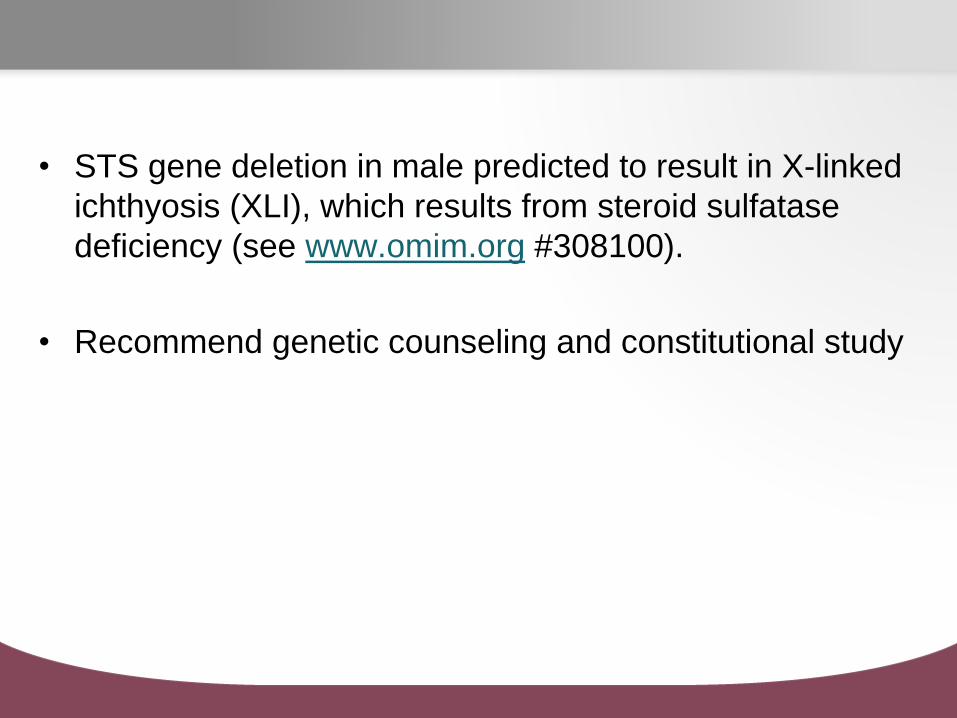
• STS gene deletion in male predicted to result in X-linked
ichthyosis (XLI), which results from steroid sulfatase
deficiency (see www.omim.org #308100).
• Recommend genetic counseling and constitutional study
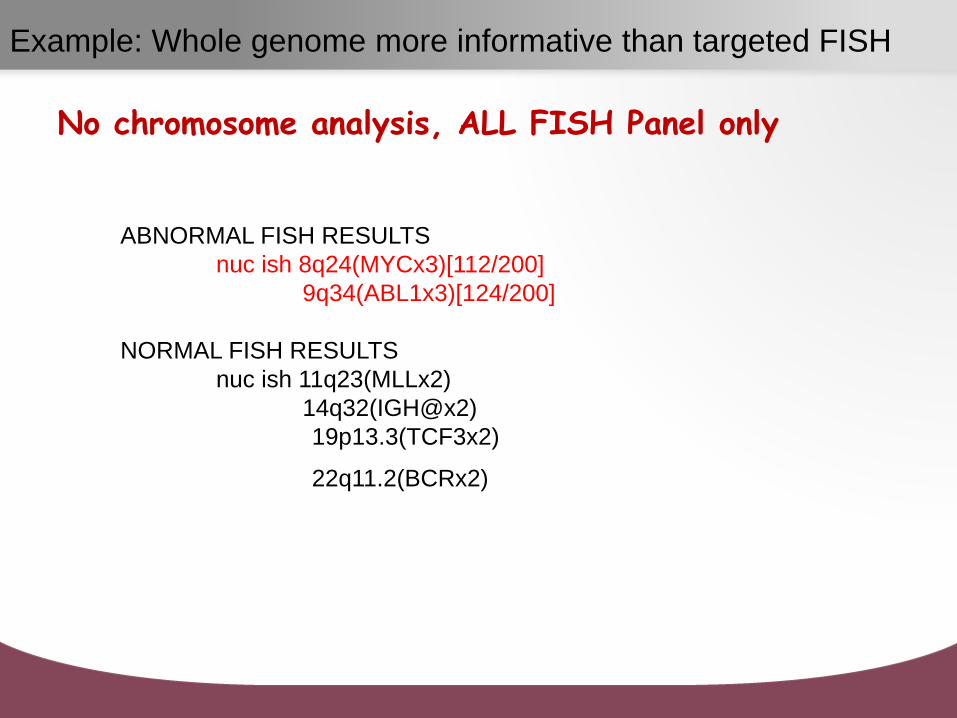
Example: Whole genome more informative than targeted FISH
No chromosome analysis, ALL FISH Panel only
ABNORMAL FISH RESULTS
nuc ish 8q24(MYCx3)[112/200]
9q34(ABL1x3)[124/200]
NORMAL FISH RESULTS
nuc ish 11q23(MLLx2)
14q32(IGH@x2)
19p13.3(TCF3x2)
22q11.2(BCRx2)
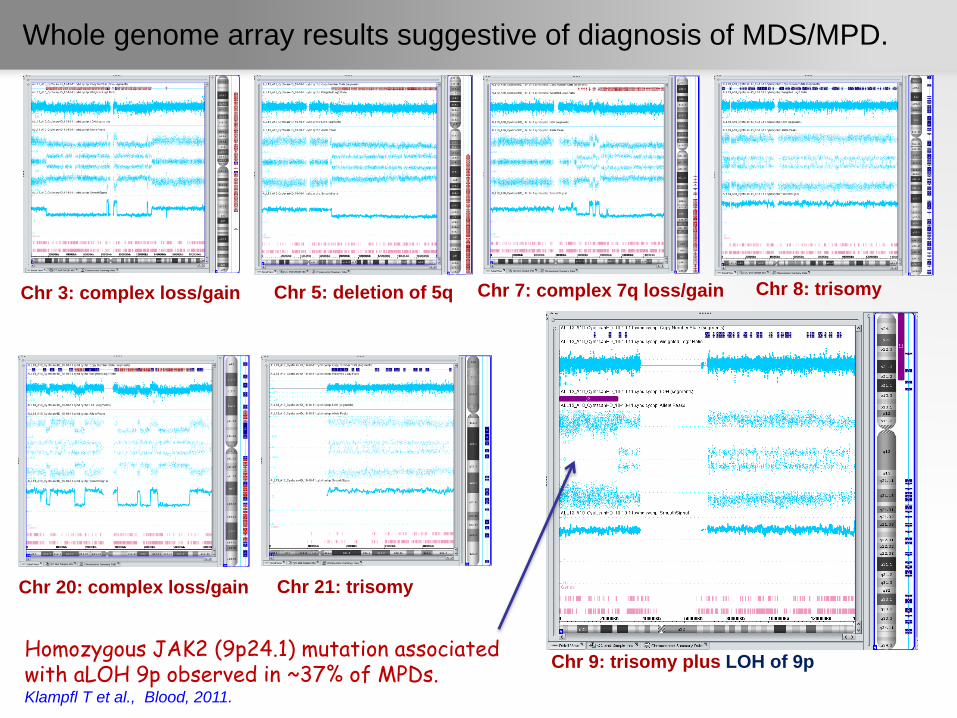
Whole genome array results suggestive of diagnosis of MDS/MPD.
Chr 3: complex loss/gain Chr 5: deletion of 5q Chr 7: complex 7q loss/gain
Homozygous JAK2 (9p24.1) mutation associated with aLOH 9p observed in ~37% of MPDs. Klampfl T et al., Blood, 2011.
Chr 21: trisomy Chr 20: complex loss/gain
Chr 8: trisomy
Chr 9: trisomy plus LOH of 9p
Klampfl T et al., Blood, 2011.
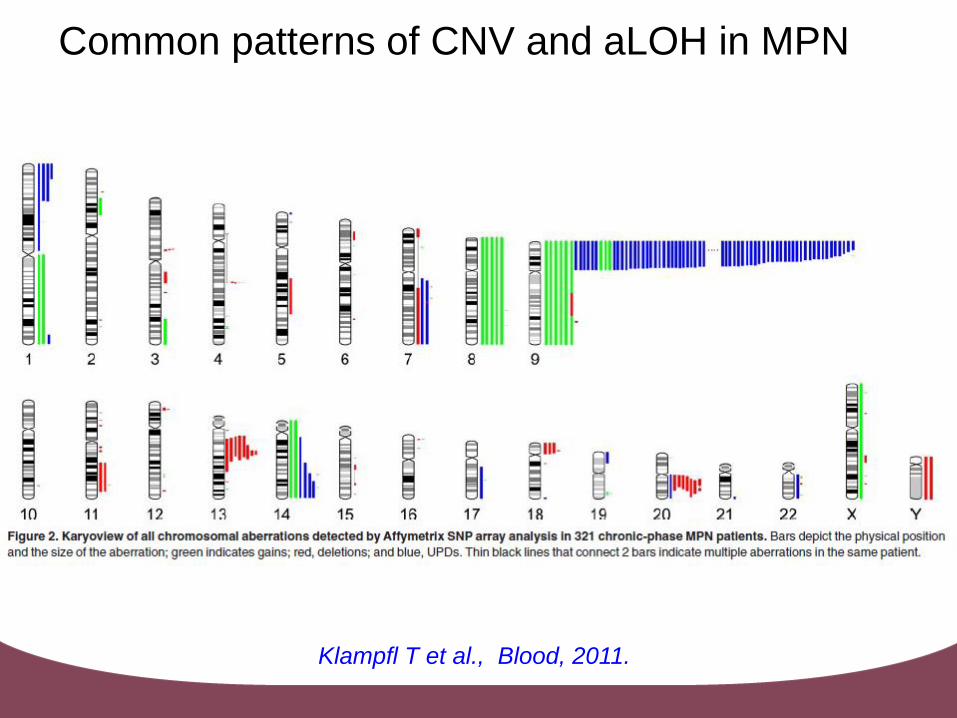
Common patterns of CNV and aLOH in MPN
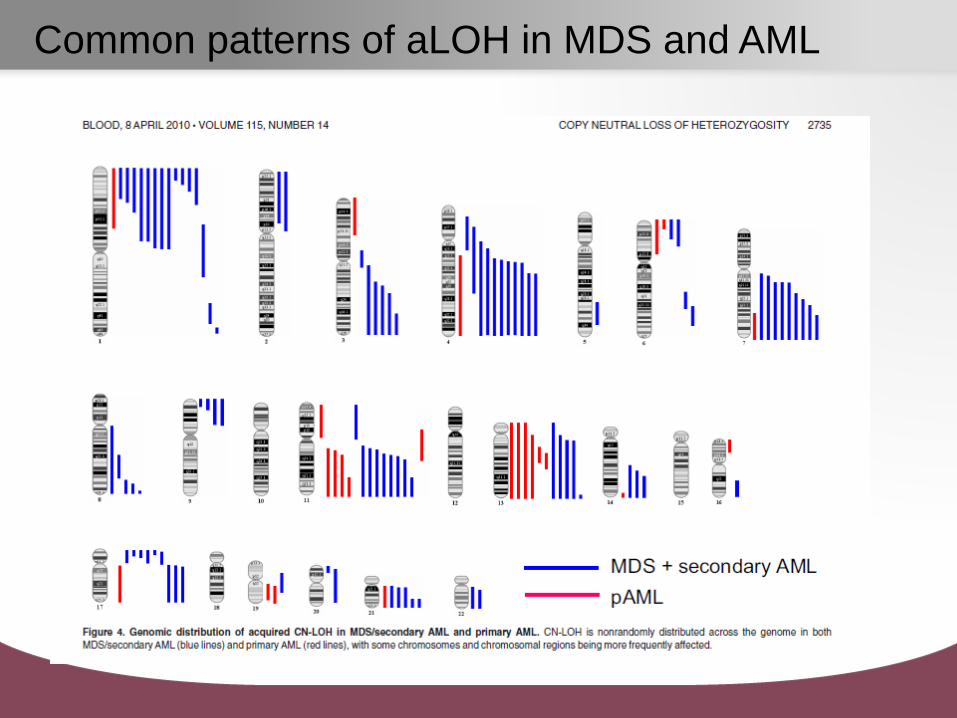
Common patterns of aLOH in MDS and AML
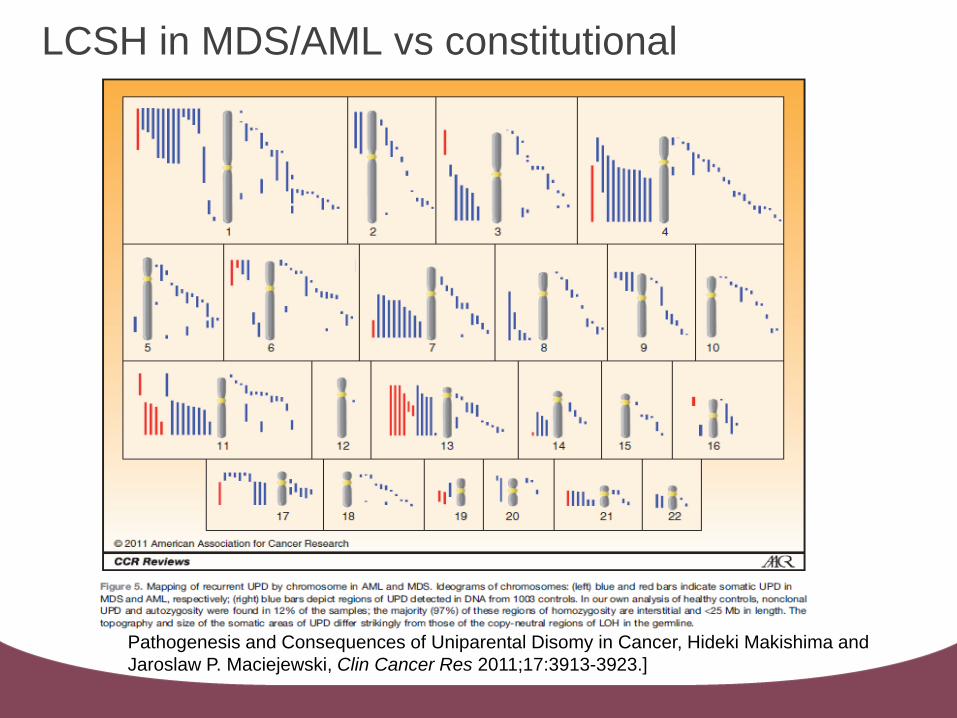
LCSH in MDS/AML vs constitutional
Pathogenesis and Consequences of Uniparental Disomy in Cancer, Hideki Makishima and
Jaroslaw P. Maciejewski, Clin Cancer Res 2011;17:3913-3923.]
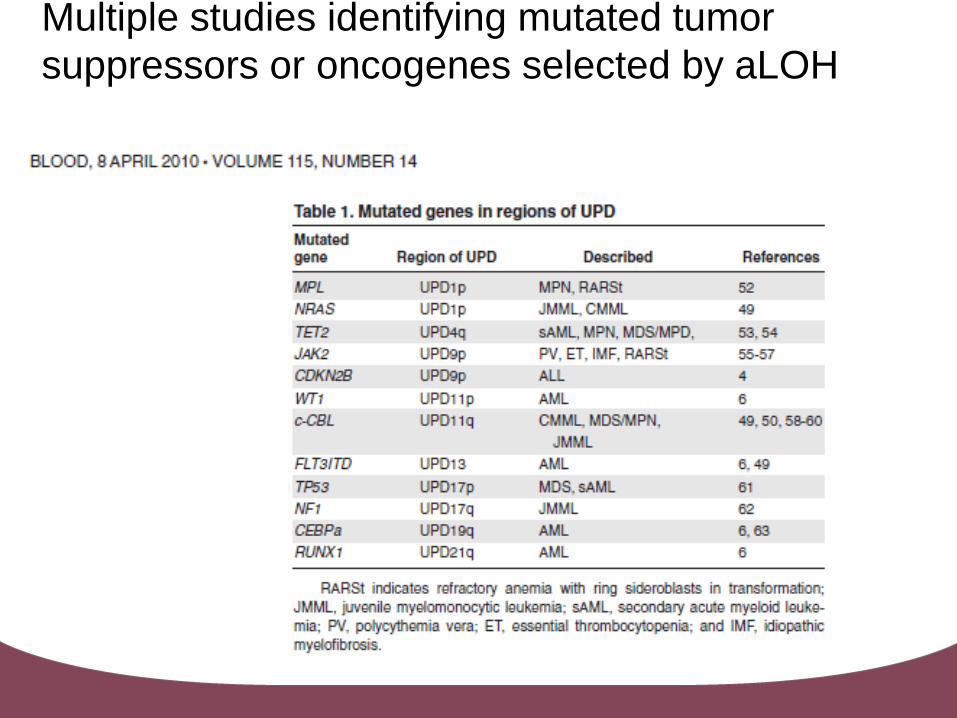
Multiple studies identifying mutated tumor
suppressors or oncogenes selected by aLOH
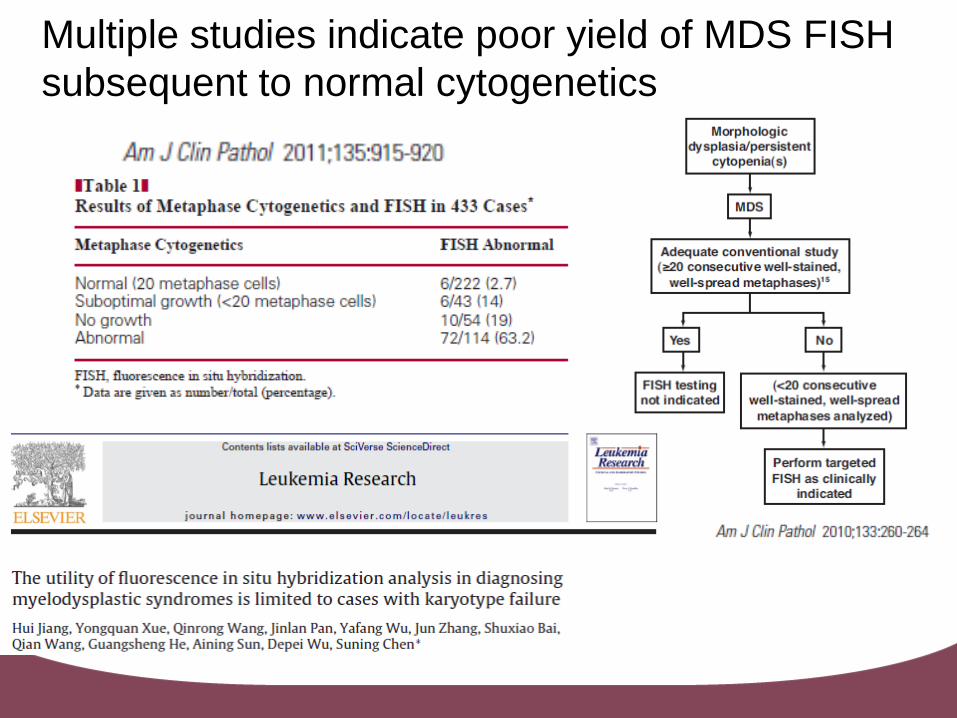
Multiple studies indicate poor yield of MDS FISH
subsequent to normal cytogenetics
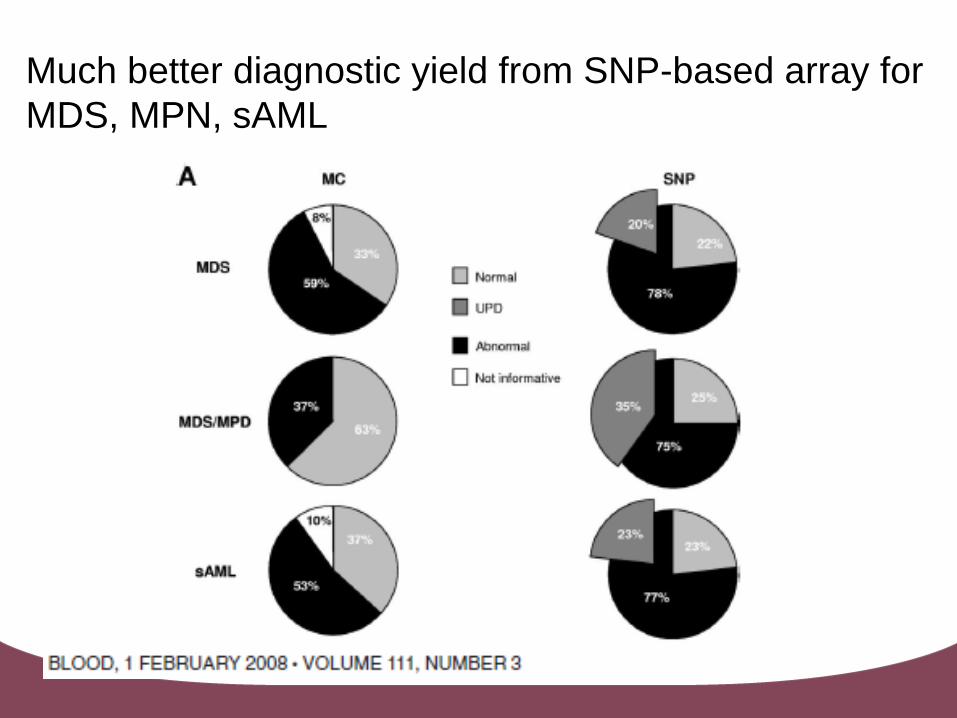
Much better diagnostic yield from SNP-based array for
MDS, MPN, sAML
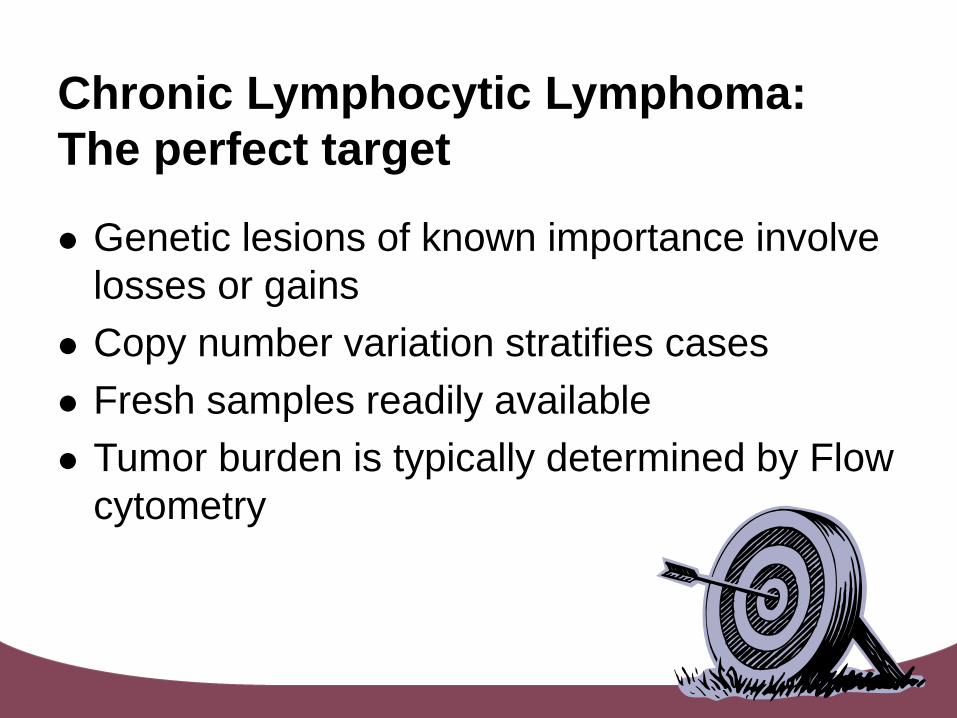
Chronic Lymphocytic Lymphoma:
The perfect target
Genetic lesions of known importance involve
losses or gains
Copy number variation stratifies cases
Fresh samples readily available
Tumor burden is typically determined by Flow
cytometry
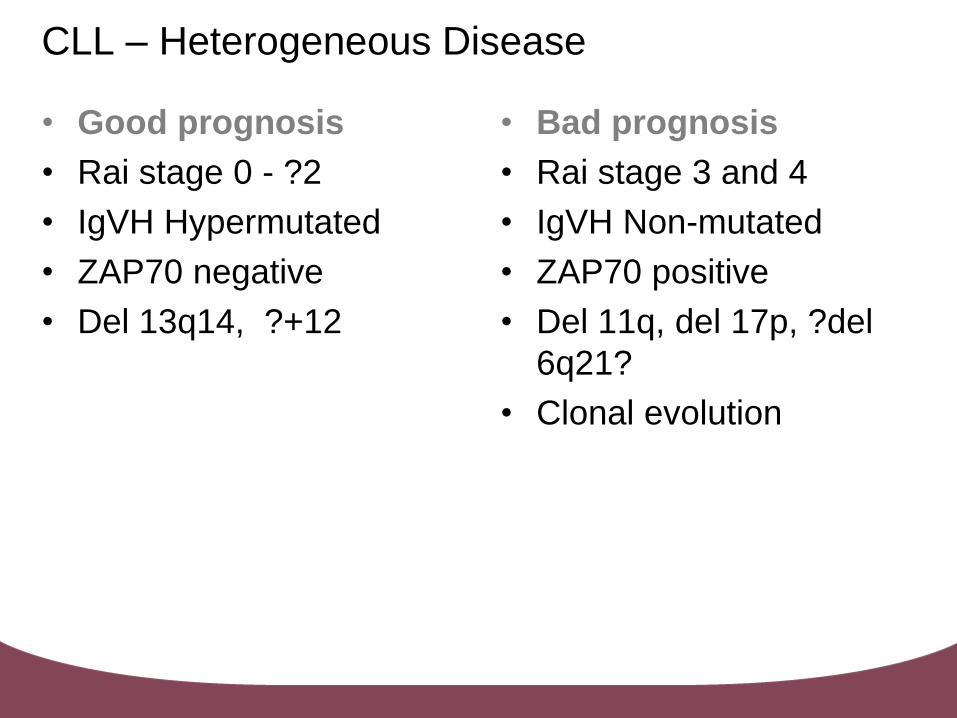
CLL – Heterogeneous Disease
• Good prognosis
• Rai stage 0 - ?2
• IgVH Hypermutated
• ZAP70 negative
• Del 13q14, ?+12
• Bad prognosis
• Rai stage 3 and 4
• IgVH Non-mutated
• ZAP70 positive
• Del 11q, del 17p, ?del
6q21?
• Clonal evolution
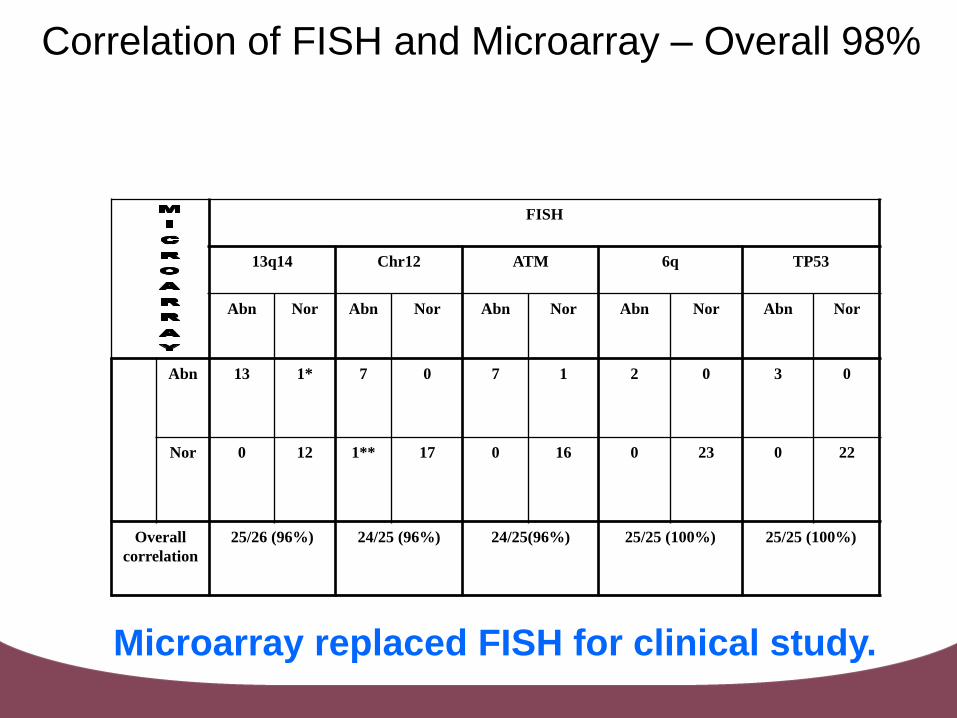
Correlation of FISH and Microarray – Overall 98%
FISH
13q14 Chr12 ATM 6q TP53
Abn Nor Abn Nor Abn Nor Abn Nor Abn Nor
Abn 13 1* 7 0 7 1 2 0 3 0
Nor 0 12 1** 17 0 16 0 23 0 22
Overall
correlation
25/26 (96%) 24/25 (96%) 24/25(96%) 25/25 (100%) 25/25 (100%)
Microarray replaced FISH for clinical study.