Embed Size (px)
Citation preview
SOCIAL PROTECTION POLICY PAPERS
Paper 13
Addressing the Global Health Crisis: Universal Health Protection Policies
Social Protection Department
International Labour Office
Copyright © International Labour Organization 2014
First published 2014
Publications of the International Labour Office enjoy copyright under Protocol 2 of the Universal Copyright
Convention. Nevertheless, short excerpts from them may be reproduced without authorization, on condition that
the source is indicated. For rights of reproduction or translation, application should be made to ILO Publications
(Rights and Permissions), International Labour Office, CH-1211 Geneva 22, Switzerland, or by email:
[email protected]. The International Labour Office welcomes such applications.
Libraries, institutions and other users registered with reproduction rights organizations may make copies in
accordance with the licences issued to them for this purpose. Visit www.ifrro.org to find the reproduction rights
organization in your country.
ILO Cataloguing in Publication Data
Addressing the global health crisis : universal health protection policies / International Labour Office, Social
Protection Department. - Geneva: ILO, 2014
(Social protection policy papers ; Paper 13)
ISBN: 9789221293156; 9789221293163 (web pdf)
International Labour Office Social Protection Dept.
health policy / health service / medical care / access to care / social protection / consumption of health care /
health expenditure / gaps in coverage / role of ILO / developed countries / developing countries
02.07.3
The designations employed in ILO publications, which are in conformity with United Nations practice, and the
presentation of material therein do not imply the expression of any opinion whatsoever on the part of the
International Labour Office concerning the legal status of any country, area or territory or of its authorities, or
concerning the delimitation of its frontiers.
The responsibility for opinions expressed in signed articles, studies and other contributions rests solely with
their authors, and publication does not constitute an endorsement by the International Labour Office of the
opinions expressed in them.
Reference to names of firms and commercial products and processes does not imply their endorsement by the
International Labour Office, and any failure to mention a particular firm, commercial product or process is not a
sign of disapproval.
ILO publications and electronic products can be obtained through major booksellers or ILO local offices in
many countries, or direct from ILO Publications, International Labour Office, CH-1211 Geneva 22,
Switzerland. Catalogues or lists of new publications are available free of charge from the above address, or by
email: [email protected]
Visit our web site: www.ilo.org/publns
The editor of the series is the Director of the Social Protection Department, ILO. For more information on the
series, please contact:
Isabel Ortiz, Director Social Protection Department
International Labour Organization
4 Route des Morillons
CH-1211 Geneva 22 Switzerland
Tel. +41.22.799.6226 • Fax:+41.22.799.79.62
Printed in Switzerland
Addressing the Global Health Crisis: Universal Health Protection Policies iii
Abstract
This policy paper: (i) examines the dimensions of the global health crisis based on
severe deficits in health protection and limited access to needed health care; (ii) presents
the extent of the health crisis at global, regional and national level as well as rural/urban
divergences within countries and their root causes; (iii) suggests policy options to
address the health protection crisis using the framework of national social protection
floors by focusing on inclusive legislation and adequate financing as well as making
quality services available and providing financial protection; (iv) concludes that
progressing towards universal health protection is possible by developing a three step
approach that yields highest rates of returns in terms of sustainability, economic growth
and equity. The Annexes present global data on total health expenditure, health coverage
and skilled health workers for 171 countries.
JEL Classification: I10, I130, I140, H5
Keywords: health, health insurance, development, inequality, policy
Addressing the Global Health Crisis: Universal Health Protection Policies v
Table of contents
Page
Abstract ............................................................................................................................................. iii
Preface ............................................................................................................................................... ix
Acknowledgements ........................................................................................................................... xi
1. Introduction ............................................................................................................................. 1
2. The dimensions of the global health crisis .............................................................................. 2
2.1. The missing right to health ........................................................................................... 2
2.2. The impoverishment due to high costs of health care ................................................... 4
2.3. The lack of quality health services in the absence of health workers ........................... 5
3. The magnitude of the global crisis .......................................................................................... 8
3.1. Gaps in affordability, availability and financial protection for quality health care ...... 8
3.2. Rural areas: Globally most neglected ........................................................................... 9
3.3. Effects of fiscal consolidation measures on the health crisis ........................................ 12
4. Addressing the health protection crisis: Universal health protection policies creating
sustainable development ......................................................................................................... 15
4.1. Guaranteeing the right to adequate health care for all .................................................. 16
4.2. Fair financing of health protection for sustainable development .................................. 17
4.3. Making services available through decent work for all ................................................ 20
4.4. Providing financial protection for equity in access ....................................................... 21
4.5. Embedding universal health protection in national floors of social protection ............ 23
5. Conclusions ............................................................................................................................. 25
Bibliography ...................................................................................................................................... 27
Annexes
I. Total (public and private) health-care expenditure not financed by private households'
out-of-pocket payments (percentage) ...................................................................................... 31
II. The multiple dimensions of health coverage .......................................................................... 36
vi Addressing the Global Health Crisis: Universal Health Protection Policies
List of figures
Figure 1: Proportion of population affiliated to national health services, social, private or micro-
insurance schemes, by region, latest available year (percentages) .................................... 2
Figure 2: Proportion of population affiliated to national health services, social, private or micro-
insurance schemes, globally, latest available year (percentages) ...................................... 3
Figure 3: Legal health coverage and poverty, latest available year (percentages) ............................ 3
Figure 4: Share of out-of-pocket payments in total health expenditure, by proportion of the
population living on less than $ 2 USD a day PPP, 2011 (percentages) ............................ 4
Figure 5: Legal health coverage and out-of-pocket payments in selected African countries, 2011
(percentages) ...................................................................................................................... 5
Figure 6: Number of skilled health workers required to close global and regional gaps in universal
health coverage, ILO estimate, 2014 ................................................................................. 6
Figure 7: Yearly change in health workers’ remuneration as proportion of total health expenditure
and GDP, by national income level, 2000–10 (percentages) ............................................. 7
Figure 8: The global access deficit to health care by level of country income 2012/2013 ............... 8
Figure 9: The global health access deficit of rural and urban populations, 2011/2012 ................... 10
Figure 10: Regional inequities between rural and urban populations in access to health services,
2011/2012 ........................................................................................................................ 11
Figure 11: Available and missing health workers in urban and rural areas, by region, 2011/2013 .. 12
Figure 12: Flow of funds for health coverage and access ................................................................. 18
Figure 13: Financing mechanisms used by number of countries with health coverage rates of the
population of 80 and more per cent, 2014 or latest available year .................................. 18
Figure 14: Sources of health-care financing, by region, 2011 (percentage of GDP) ........................ 19
List of tables
Table 1: Numbers of health workers per 10,000 population, selected countries, latest available
year .................................................................................................................................... 6
Table 2: Announced fiscal consolidation policies and associated fiscal savings, selected countries,
2007–14 ........................................................................................................................... 13
Table 3: Performance of selected financing mechanisms towards sustainable development ........ 20
Table 4: Average annual increase in OOP, selected countries, 2007–11 (percentages) ................ 22
Table 5: Embedding health protection coverage in social protection floor policies based on ILO
Recommendation No. 202 ............................................................................................... 24
Addressing the Global Health Crisis: Universal Health Protection Policies vii
List of Abbreviations
ADB Asian Development Bank
CBHI community-based health insurance
ECLAC Economic Commission for Latin America and the Caribbean
EHCP essential health care package
FAO Food and Agriculture Organization of the United Nations
G20 Group of 20
GDP gross domestic product
HDI Human Development Index
HIV/AIDS human immunodeficiency virus/acquired immunodeficiency syndrome
HPI Human Poverty Index
ICESCR International Covenant on Economic Social and Cultural Rights
ILO International Labour Office/Organization
IMF International Monetary Fund
ISSA International Social Security Association
ISSR International Social Security Review
LTC long-term care
MDGs Millennium Development Goals
MMR maternal mortality rate
MOH Ministry of Health
NGO non-governmental organization
NHA national health accounts
NHIP National Health Insurance Programme
NHS National Health Service
OECD Organisation for Economic Co-operation and Development
OOP out-of-pocket payments
PLHIV people living with HIV/AIDS
PPP purchasing power parity
SAD Staff Deficit Indicator
SHI social health insurance
SPF Social Protection Floor
THE total health expenditure
UHC universal health coverage
U5MR under-5 mortality rate
UN United Nations
UNAIDS Joint United Nations Programme on HIV/AIDS
UNDESA United Nations Department of Economic and Social Affairs
UNDP United Nations Development Programme
UNFPA United Nations Population Fund
UNICEF United Nations Children’s Fund
UNPOP United Nations Population Division
WHO World Health Organization
Addressing the Global Health Crisis: Universal Health Protection Policies ix
Preface
In 2014, the Ebola epidemic forced the world to recognize the urgent need to invest in
public health. But this latest crisis is by no means new.
For decades, since the era of structural adjustment in the 1980s, orthodox fiscal policies
have kept public health severely underfunded. As a result, many national health systems
could not properly develop in middle and low-income countries. Efforts to palliate the
situation with quick fixes like small vertical programmes (e.g. immunization) have been
insufficient to meet the health needs of populations. In many countries, health services
were commercialized, and high private health expenditures and out-of-pocket payments
became main causes of impoverishment and ultimately a lack of access to health care.
Countries need investments in universal public health systems.
This report is launched for the Universal Health Coverage Day, which takes place on
December 12th. This policy paper is based on the research conducted for the ILO’s World
Social Protection Report 2014/15. It focuses specifically on universal health protection.
The important role of other social protection areas, such as support for older persons,
persons with disabilities, maternity and child benefits, employment injury and so forth, are
addressed in other policy papers in this series. This and the related papers reflect the
principles of the ILO Social Protection Floors Recommendation, 2012 (No. 202) on the
extension of social security, agreed by 185 countries and further endorsed by G20 leaders
and the United Nations.
The case for social protection is compelling in our times. Social protection is both a human
right and sound economic policy. Social protection powerfully contributes to reducing
poverty, exclusion, and inequality while enhancing political stability and social cohesion.
Social protection also contributes to economic growth by supporting household income
and, thus, domestic consumption, which is particularly important during this time of slow
recovery and depressed global demand. Further, social protection enhances human capital
and productivity, so it has become a critical policy tool for transformative national
development. Social protection, and specifically social protection floors, are essential for
recovery, inclusive development and social justice, and therefore must be an integral part
of the post-2015 development agenda.
Isabel Ortiz
Director
ILO Social Protection Department
Addressing the Global Health Crisis: Universal Health Protection Policies xi
Acknowledgements
This document is based on the research and data development conducted for the
ILO’s World Social Protection Report 2014/15 (WSPR), and thus benefits from results of
the WSPR drafting team supervised by the Director of the ILO Social Protection
Department, Isabel Ortiz, consisting of Xenia Scheil-Adlung, Health Policy Coordinator;
Krzysztof Hagemejer, former Chief of the Social Policy, Governance and Standards
Branch; Anne Drouin, Chief of the Public Finance, Actuarial and Statistics Services
Branch; Florence Bonnet, former Social Security Statistics Coordinator; Christina
Behrendt, Senior Social Protection Policy Specialist; Emmanuelle St-Pierre Guilbault,
Legal Specialist; and John Woodall, formerly Coordinator Pension Policy. Thorsten
Behrendt, Health Specialist, gave additional inputs. In addition, ILO technical departments,
particularly Frank Hoffer, Senior Research Officer, ILO Bureau for Workers’ Activities
and field offices commented on the prior version and guidance was received from the
ILO’s Deputy Director-General for Policy, Sandra Polaski.
The ILO is particularly grateful to Integrare, Instituto de Cooperacion Social,
Spain, particularly Andrea Nove, for information and data development regarding
rural/urban aspects. Further, helpful initial comments were received from other United
Nations organizations on the WSPR, including from David Evans, Director of the
Department of Health Systems Financing, WHO, Katja Hujo, Research Coordinator,
UNRISD; Alex Izurieta, Senior Economic Affairs Officer, UNCTAD; Gabriele Köhler,
formerly South Asia Regional Adviser on Social Policy, UNICEF; Hans-Horst
Konkolewsky, Secretary-General, International Social Security Association; Joseph
Kutzin, Coordinator, Health Financing Policy, WHO; Daniel Lopez Acuña, Adviser to the
Director General, WHO, UNICEF; Krista Orama, Focal Point for the Rights of Persons
with Disabilities, OHCHR; Shahra Razavi, Chief Research and Data Section,
UNWOMEN; Stefania Tripodi, Human Rights Officer, OHCHR; UNICEF; Ilcheong Yi,
Research Coordinator, UNRISD; Michael Cichon, former Director of the ILO Social
Security Department and now President of the International Council on Social Welfare;
and comments of three anonymous peer reviewers.
Addressing the Global Health Crisis: Universal Health Protection Policies 1
1. Introduction
Health protection coverage is crucial for every human being and to the economy as
a whole since labour productivity requires a healthy workforce and employment effects of
the health sector significantly contribute to overall employment in most countries.
In fact, good health is a prerequisite for sustainable development, economic
growth and equity: A labour force can only be fully productive if based on all people at
working age that are not deprived by sickness, disability or low life expectancy. It is also
important that all people at working age are in a position to generate income from work.
Given this relationship, the economic returns on investing in health are estimated at 24 per
cent of economic growth in developing countries between 2000 and 2011 taking into
account increases in both national income and life years gained (The Lancet Commission,
2013).
Access to health protection is thus a key for both good health of the population and
for boosting the economy. Ensuring that everyone can attend quality health care is a
prerequisite for sustainable development based on equity and inclusiveness. To effectively
address the global health protection crisis, universality of health coverage must involve
equal access to needed health care for all people wherever they live and work, in rural or
urban areas, in the formal or informal economy, no matter if one is poor or wealthy,
women or men, elderly or children.
However, equitable health coverage does not occur automatically even if wealth
increases. It requires inclusive policies addressing inequities resulting from access barriers
both within and beyond the health sector: Within the health sector, often inequities in
access to health care occur in the absence of legislation that affiliates the people to a health
scheme or system, by services that are of low quality or not affordable due to high out-of-
pocket payments (OOP), or just not available due to the absence of health workers to
deliver needed care. It is also important to address issues beyond the health sector that
induce access inequities to health care such as poverty.
Removing the root causes behind these developments involves in-depth analyses
and the development of a set of comprehensive policies such as closing coverage gaps in
legislation, developing fair health financing mechanisms and ensuring the availability of
health services even in remote areas. Revealing the economic potential of universal health
coverage also requires shaping inclusive labour market and developmental policies
alleviating poverty, as unemployment and lack of income range high among the barriers to
access needed health care given the need to pay for health care. Only such comprehensive
policies have the potential to recover investments in health care at the national level and
yield returns of investments through higher productivity and employment.
In the following we are assessing the dimensions and extent of the global health
protection crisis and thus missed opportunities for sustainable development based on
equally shared benefits. Further we suggest policy responses to address the crisis. We will
use the framework of the Social Protection Floor approach as outlined in ILO
Recommendation 202 concerning National Floors of Social Protection (2012). It stipulates
that all residents and children in a given country should be guaranteed by legislation at
least essential health care, prevention and maternal care. Universality thereby implies
rights-based approaches that are implemented with a view to provide access to available
care of acceptable quality. In addition, it is necessary that co-payments, user fees and other
costs involved are affordable and that financial protection is provided in order to avoid
hardship or impoverishment. Finally, effective access requires good governance of
schemes and systems, which should be based on accountability, including participatory
processes such as social and national dialogue.
2 Addressing the Global Health Crisis: Universal Health Protection Policies
2. The dimensions of the global health crisis
2.1. The missing right to health
Legal health coverage informs about entitlements to benefits prescribed by
national law. They are a prerequisite to universal health protection that is rights-based and
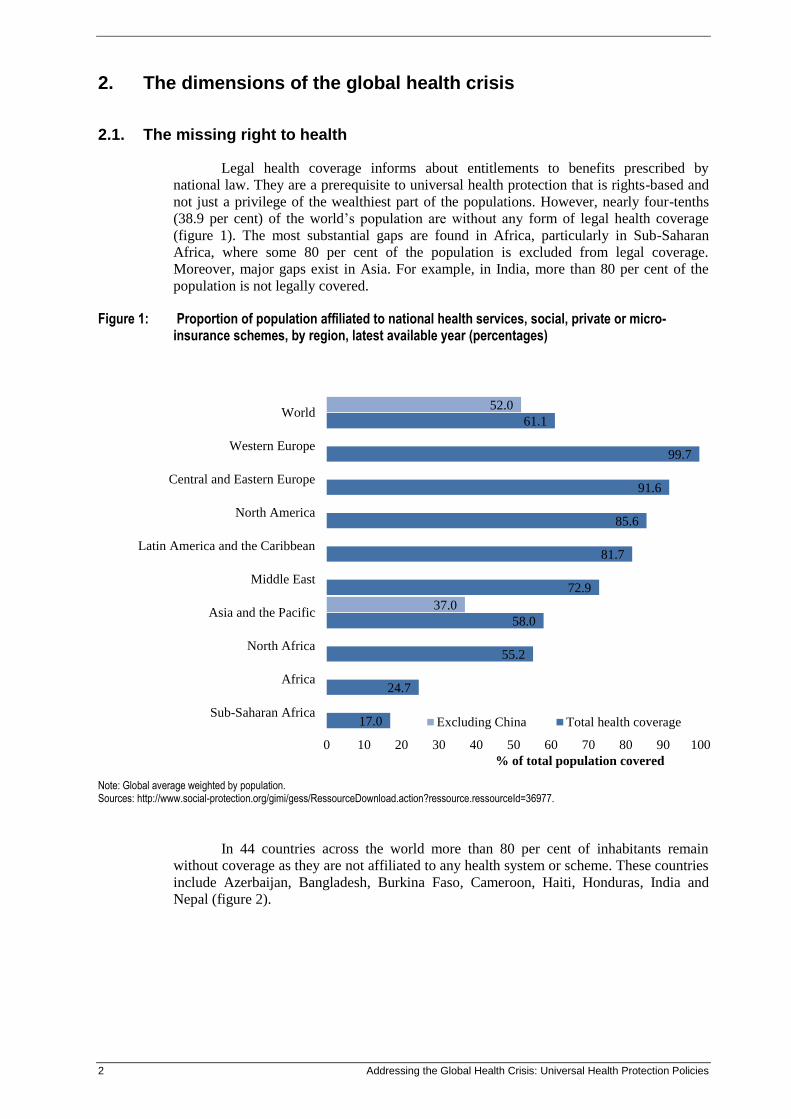
not just a privilege of the wealthiest part of the populations. However, nearly four-tenths
(38.9 per cent) of the world’s population are without any form of legal health coverage
(figure 1). The most substantial gaps are found in Africa, particularly in Sub-Saharan
Africa, where some 80 per cent of the population is excluded from legal coverage.
Moreover, major gaps exist in Asia. For example, in India, more than 80 per cent of the
population is not legally covered.
Figure 1: Proportion of population affiliated to national health services, social, private or micro-insurance schemes, by region, latest available year (percentages)
Note: Global average weighted by population. Sources: http://www.social-protection.org/gimi/gess/RessourceDownload.action?ressource.ressourceId=36977.
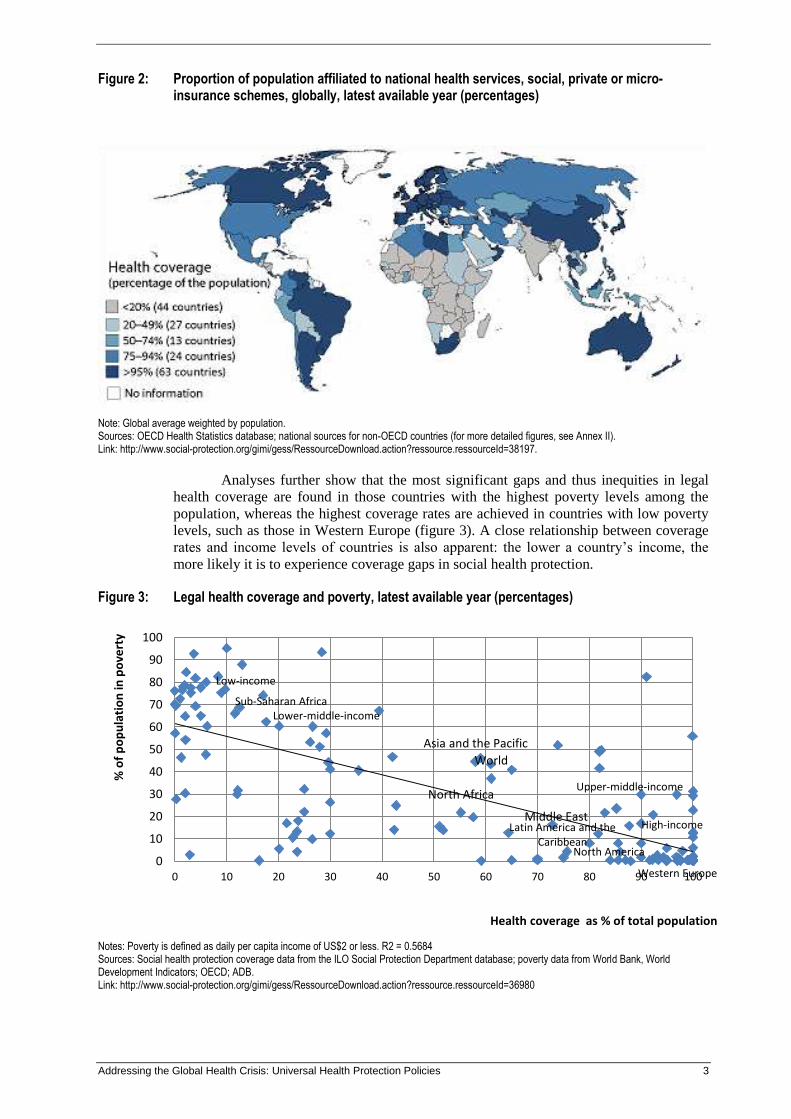
In 44 countries across the world more than 80 per cent of inhabitants remain
without coverage as they are not affiliated to any health system or scheme. These countries
include Azerbaijan, Bangladesh, Burkina Faso, Cameroon, Haiti, Honduras, India and
Nepal (figure 2).
17.0
24.7
55.2
58.0
72.9
81.7
85.6
91.6
99.7
61.1
37.0
52.0
0 10 20 30 40 50 60 70 80 90 100
Sub-Saharan Africa
Africa
North Africa
Asia and the Pacific
Middle East
Latin America and the Caribbean
North America
Central and Eastern Europe
Western Europe
World
% of total population covered
Excluding China Total health coverage
Addressing the Global Health Crisis: Universal Health Protection Policies 3
Figure 2: Proportion of population affiliated to national health services, social, private or micro-insurance schemes, globally, latest available year (percentages)
Note: Global average weighted by population. Sources: OECD Health Statistics database; national sources for non-OECD countries (for more detailed figures, see Annex II). Link: http://www.social-protection.org/gimi/gess/RessourceDownload.action?ressource.ressourceId=38197.
Analyses further show that the most significant gaps and thus inequities in legal
health coverage are found in those countries with the highest poverty levels among the
population, whereas the highest coverage rates are achieved in countries with low poverty
levels, such as those in Western Europe (figure 3). A close relationship between coverage
rates and income levels of countries is also apparent: the lower a country’s income, the
more likely it is to experience coverage gaps in social health protection.
Figure 3: Legal health coverage and poverty, latest available year (percentages)
Notes: Poverty is defined as daily per capita income of US$2 or less. R2 = 0.5684 Sources: Social health protection coverage data from the ILO Social Protection Department database; poverty data from World Bank, World Development Indicators; OECD; ADB. Link: http://www.social-protection.org/gimi/gess/RessourceDownload.action?ressource.ressourceId=36980
North Africa
Sub-Saharan Africa
Latin America and the Caribbean
North America
Western Europe
Asia and the Pacific
Middle East
World
Low-income
Lower-middle-income
Upper-middle-income
High-income
0
10
20
30
40
50
60
70
80
90
100
0 10 20 30 40 50 60 70 80 90 100
% o
f p
op
ula
tio
n in
po
vert
y
Health coverage as % of total population
4 Addressing the Global Health Crisis: Universal Health Protection Policies
2.2. The impoverishment due to high costs of health care
Taking up health care often involves private OOP, such as user fees and co-
payments by those entitled to benefits, entire costs of treatments by those lacking coverage
and opportunity costs related to transport to health facilities. Such expenditure is frequently
significant and might lead to impoverishment or deepened poverty for those who are poor
already. In the worst case, people are totally excluded from access to any needed health
care because they do not have the means to pay for it. Thus, OOP might constitute an
important barrier to access health care even if most in need.
Despite these negative implications, OOP are observed in nearly all countries
throughout the world: More than 40 per cent of the global burden of health expenditure is
borne by private households. The regressive character of OOP stands in stark contrast to
the key principles of solidarity in financing and the idea of sharing risk across different
socio-economic groups.
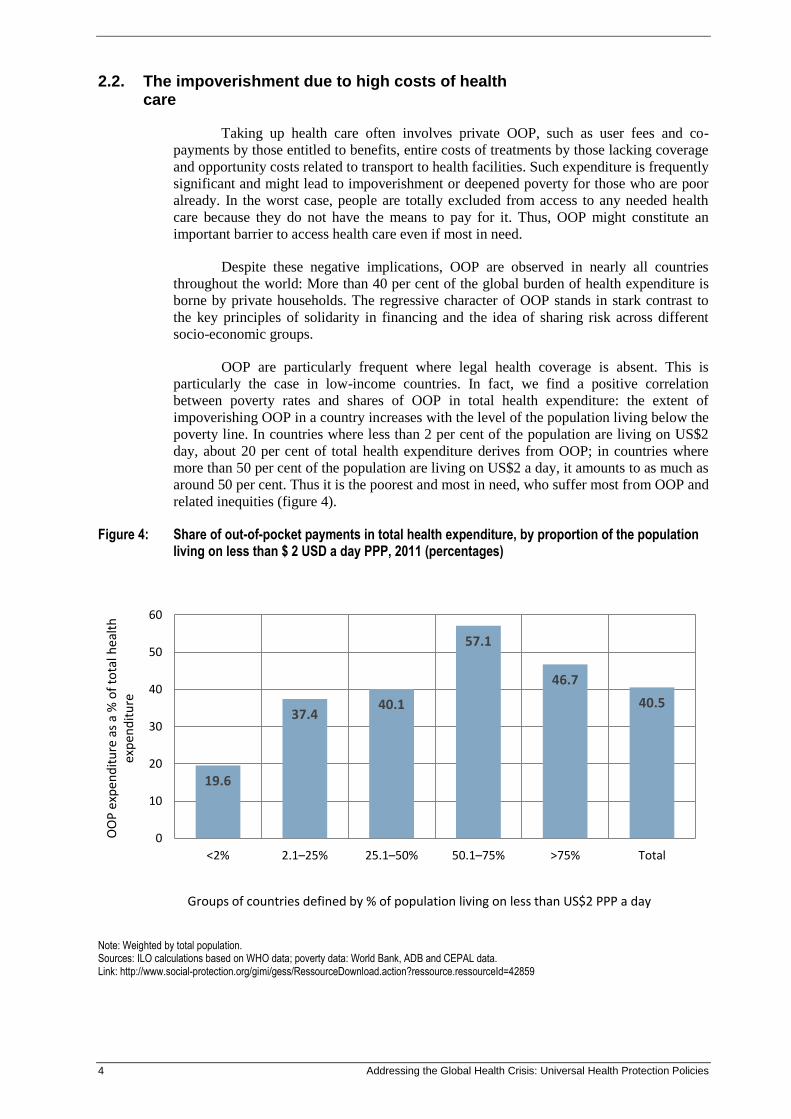
OOP are particularly frequent where legal health coverage is absent. This is
particularly the case in low-income countries. In fact, we find a positive correlation
between poverty rates and shares of OOP in total health expenditure: the extent of
impoverishing OOP in a country increases with the level of the population living below the
poverty line. In countries where less than 2 per cent of the population are living on US$2
day, about 20 per cent of total health expenditure derives from OOP; in countries where
more than 50 per cent of the population are living on US$2 a day, it amounts to as much as
around 50 per cent. Thus it is the poorest and most in need, who suffer most from OOP and
related inequities (figure 4).
Figure 4: Share of out-of-pocket payments in total health expenditure, by proportion of the population living on less than $ 2 USD a day PPP, 2011 (percentages)
Note: Weighted by total population. Sources: ILO calculations based on WHO data; poverty data: World Bank, ADB and CEPAL data. Link: http://www.social-protection.org/gimi/gess/RessourceDownload.action?ressource.ressourceId=42859
19.6
37.4 40.1
57.1
46.7
40.5
0
10
20
30
40
50
60
<2% 2.1–25% 25.1–50% 50.1–75% >75% Total
OO
P e
xpen
dit
ure
as
a %
of
tota
l hea
lth
ex
pen
dit
ure
Groups of countries defined by % of population living on less than US$2 PPP a day
Addressing the Global Health Crisis: Universal Health Protection Policies 5
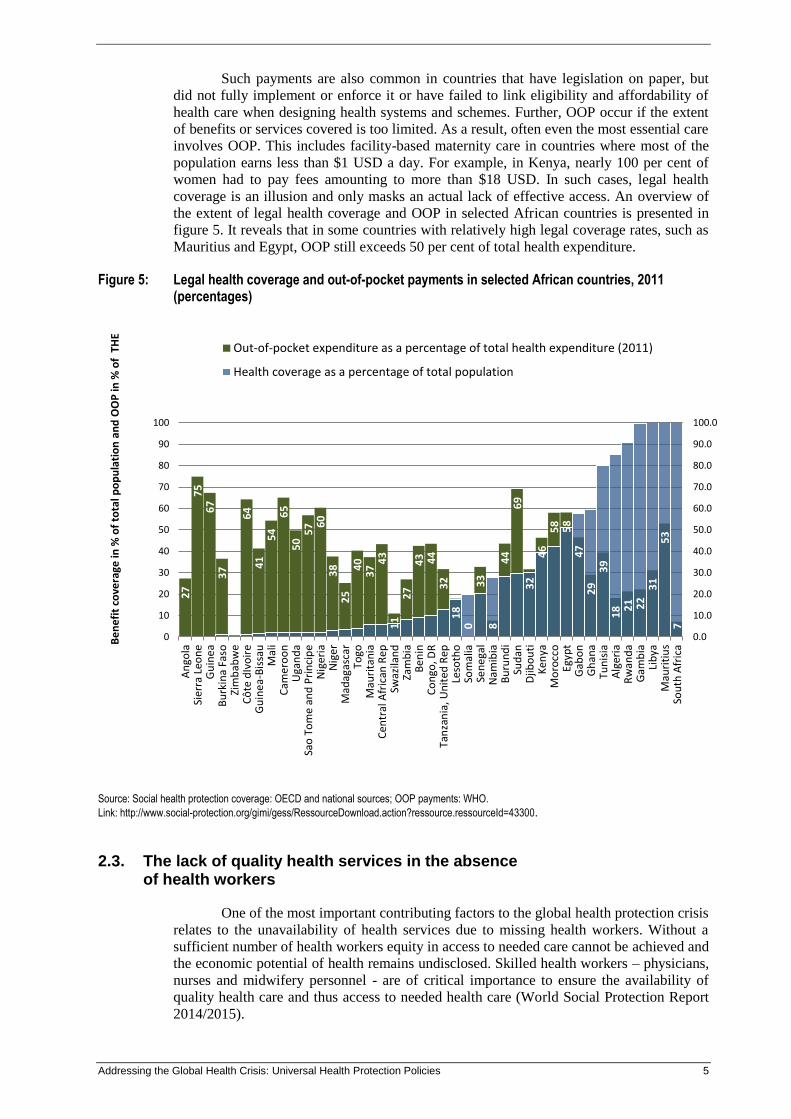
Such payments are also common in countries that have legislation on paper, but
did not fully implement or enforce it or have failed to link eligibility and affordability of
health care when designing health systems and schemes. Further, OOP occur if the extent
of benefits or services covered is too limited. As a result, often even the most essential care
involves OOP. This includes facility-based maternity care in countries where most of the
population earns less than $1 USD a day. For example, in Kenya, nearly 100 per cent of
women had to pay fees amounting to more than $18 USD. In such cases, legal health
coverage is an illusion and only masks an actual lack of effective access. An overview of
the extent of legal health coverage and OOP in selected African countries is presented in
figure 5. It reveals that in some countries with relatively high legal coverage rates, such as
Mauritius and Egypt, OOP still exceeds 50 per cent of total health expenditure.
Figure 5: Legal health coverage and out-of-pocket payments in selected African countries, 2011 (percentages)
Source: Social health protection coverage: OECD and national sources; OOP payments: WHO.
Link: http://www.social-protection.org/gimi/gess/RessourceDownload.action?ressource.ressourceId=43300.
2.3. The lack of quality health services in the absence of health workers
One of the most important contributing factors to the global health protection crisis
relates to the unavailability of health services due to missing health workers. Without a
sufficient number of health workers equity in access to needed care cannot be achieved and
the economic potential of health remains undisclosed. Skilled health workers – physicians,
nurses and midwifery personnel - are of critical importance to ensure the availability of
quality health care and thus access to needed health care (World Social Protection Report
2014/2015).
27
7
5
67
3
7
64
4
1
54
6
5
50
57
60
3
8
25
4
0
37
43
1
1
27
4
3
44
3
2
18
0
3
3
8
44
6
9
32
4
6
58
5
8
47
2
9
39
1
8 21
2
2
31
5
3
7
0.0
10.0
20.0
30.0
40.0
50.0
60.0
70.0
80.0
90.0
100.0
0
10
20
30
40
50
60
70
80
90
100
An
gola
Sier
ra L
eon
eG
uin
ea
Bu
rkin
a Fa
soZi
mb
abw
eC
ôte
dIv
oir
eG
uin
ea-
Bis
sau
Mal
iC
amer
oo
nU
gan
da
Sao
To
me
and
Pri
nci
pe
Nig
eria
Nig
erM
adag
asca
rTo
goM
auri
tan
iaC
entr
al A
fric
an R
epSw
azila
nd
Zam
bia
Ben
inC
on
go, D
RTa
nza
nia
, Un
ited
Rep
Leso
tho
Som
alia
Sen
ega
lN
amib
iaB
uru
nd
iSu
dan
Djib
ou
tiK
enya
Mo
rocc
oEg
ypt
Gab
on
Gh
ana
Tun
isia
Alg
eria
Rw
and
aG
amb
iaLi
bya
Mau
riti
us
Sou
th A
fric
aBe
ne
fit
cove
rage
in %
of
tota
l po
pu
lati
on
an
d O
OP
in %
of
TH
E
Out-of-pocket expenditure as a percentage of total health expenditure (2011)
Health coverage as a percentage of total population
6 Addressing the Global Health Crisis: Universal Health Protection Policies
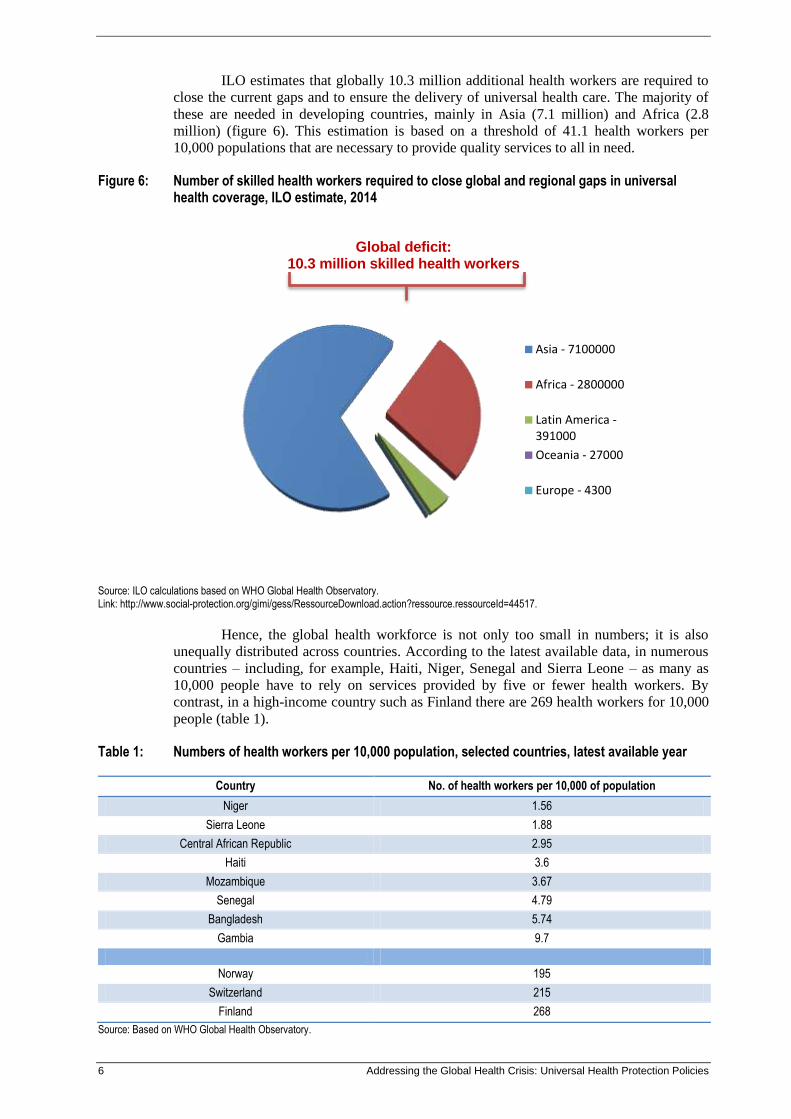
ILO estimates that globally 10.3 million additional health workers are required to
close the current gaps and to ensure the delivery of universal health care. The majority of
these are needed in developing countries, mainly in Asia (7.1 million) and Africa (2.8
million) (figure 6). This estimation is based on a threshold of 41.1 health workers per
10,000 populations that are necessary to provide quality services to all in need.
Figure 6: Number of skilled health workers required to close global and regional gaps in universal health coverage, ILO estimate, 2014
Global deficit:
10.3 million skilled health workers
Source: ILO calculations based on WHO Global Health Observatory. Link: http://www.social-protection.org/gimi/gess/RessourceDownload.action?ressource.ressourceId=44517.
Hence, the global health workforce is not only too small in numbers; it is also
unequally distributed across countries. According to the latest available data, in numerous
countries – including, for example, Haiti, Niger, Senegal and Sierra Leone – as many as
10,000 people have to rely on services provided by five or fewer health workers. By
contrast, in a high-income country such as Finland there are 269 health workers for 10,000
people (table 1).
Table 1: Numbers of health workers per 10,000 population, selected countries, latest available year
Country No. of health workers per 10,000 of population
Niger 1.56
Sierra Leone 1.88
Central African Republic 2.95
Haiti 3.6
Mozambique 3.67
Senegal 4.79
Bangladesh 5.74
Gambia 9.7
Norway 195
Switzerland 215
Finland 268
Source: Based on WHO Global Health Observatory.
Asia - 7100000
Africa - 2800000
Latin America -391000
Oceania - 27000
Europe - 4300
Addressing the Global Health Crisis: Universal Health Protection Policies 7
Moreover, decent working conditions, particularly decent wages are missing in
many countries and even declined in recent years: the wage bills of health workers have
fallen, sometimes drastically. In the Democratic Republic of Congo and Myanmar, for
example, they declined by about 40 per cent during economic crises between 2007 and
2009 (UNICEF 2010).
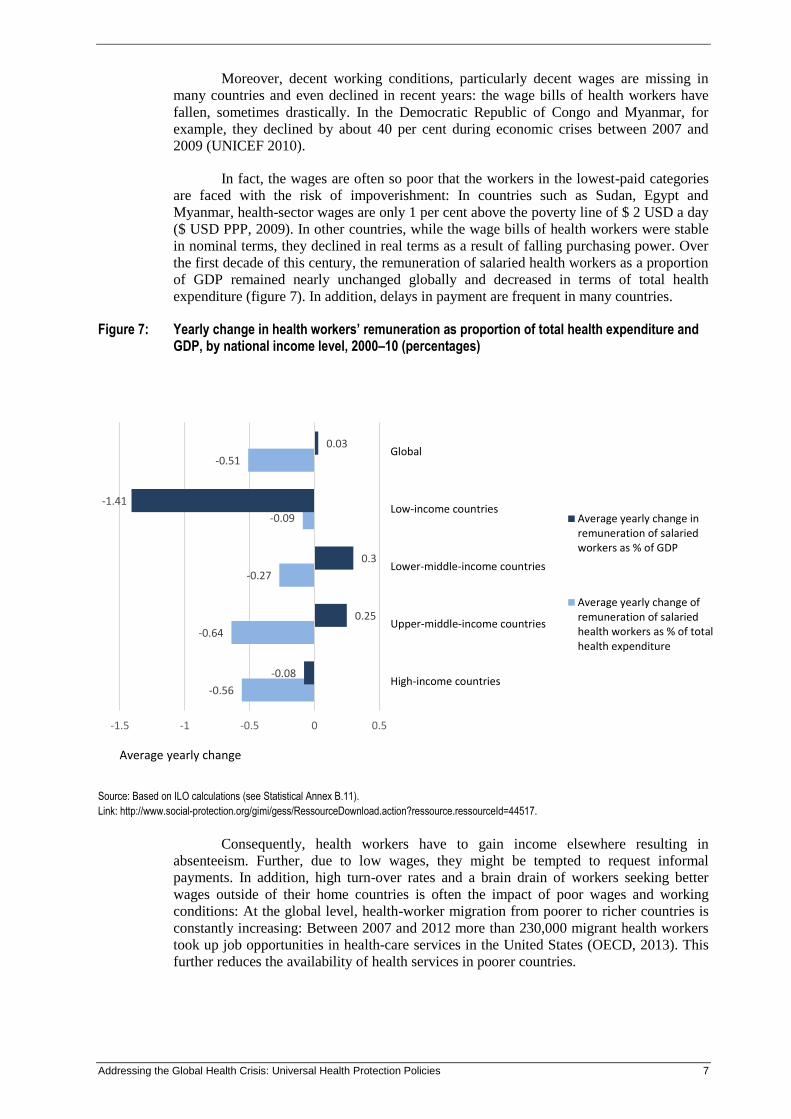
In fact, the wages are often so poor that the workers in the lowest-paid categories
are faced with the risk of impoverishment: In countries such as Sudan, Egypt and
Myanmar, health-sector wages are only 1 per cent above the poverty line of $ 2 USD a day
($ USD PPP, 2009). In other countries, while the wage bills of health workers were stable
in nominal terms, they declined in real terms as a result of falling purchasing power. Over
the first decade of this century, the remuneration of salaried health workers as a proportion
of GDP remained nearly unchanged globally and decreased in terms of total health
expenditure (figure 7). In addition, delays in payment are frequent in many countries.
Figure 7: Yearly change in health workers’ remuneration as proportion of total health expenditure and GDP, by national income level, 2000–10 (percentages)
Source: Based on ILO calculations (see Statistical Annex B.11).
Link: http://www.social-protection.org/gimi/gess/RessourceDownload.action?ressource.ressourceId=44517.
Consequently, health workers have to gain income elsewhere resulting in
absenteeism. Further, due to low wages, they might be tempted to request informal
payments. In addition, high turn-over rates and a brain drain of workers seeking better
wages outside of their home countries is often the impact of poor wages and working
conditions: At the global level, health-worker migration from poorer to richer countries is
constantly increasing: Between 2007 and 2012 more than 230,000 migrant health workers
took up job opportunities in health-care services in the United States (OECD, 2013). This
further reduces the availability of health services in poorer countries.
-0.56
-0.64
-0.27
-0.09
-0.51
-0.08
0.25
0.3
-1.41
0.03
-1.5 -1 -0.5 0 0.5
High-income countries
Upper-middle-income countries
Lower-middle-income countries
Low-income countries
Global
Average yearly change
Average yearly change inremuneration of salariedworkers as % of GDP
Average yearly change ofremuneration of salariedhealth workers as % of totalhealth expenditure
8 Addressing the Global Health Crisis: Universal Health Protection Policies
3. The magnitude of the global crisis
3.1. Gaps in affordability, availability and financial protection for quality health care
The global deficit in access to health care services consists of multiple partly
interrelated dimensions that contribute to the current health protection crisis: Gaps in legal
health coverage, availability, affordability and financial protection of quality services.
Indicators that reflect best these aspects include the population coverage of legislation,
deficits in the density of health workers, health financing deficits and private expenditure
in the form of OOP. Finally, maternal mortality rates can be used to show the overall
performance of the health system.
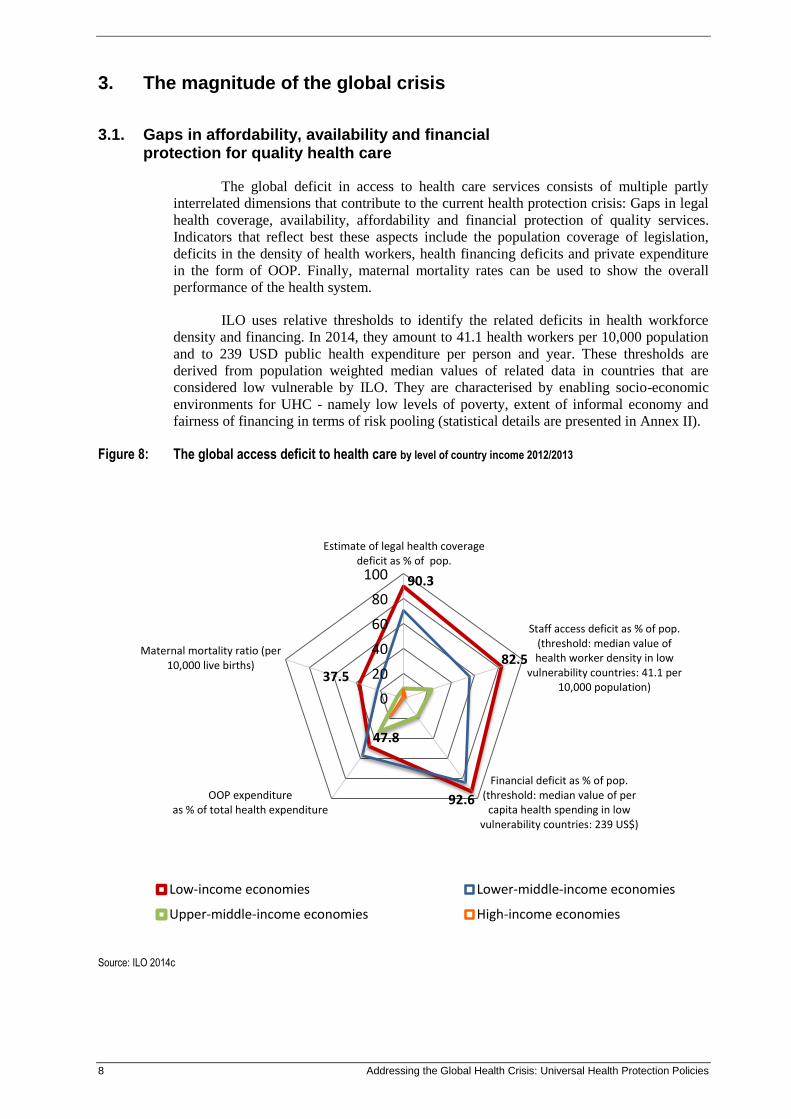
ILO uses relative thresholds to identify the related deficits in health workforce
density and financing. In 2014, they amount to 41.1 health workers per 10,000 population
and to 239 USD public health expenditure per person and year. These thresholds are
derived from population weighted median values of related data in countries that are
considered low vulnerable by ILO. They are characterised by enabling socio-economic
environments for UHC - namely low levels of poverty, extent of informal economy and
fairness of financing in terms of risk pooling (statistical details are presented in Annex II).
Figure 8: The global access deficit to health care by level of country income 2012/2013
Source: ILO 2014c
90.3
82.5
92.6
47.8
37.5
0
20
40
60
80
100
Estimate of legal health coveragedeficit as % of pop.
Staff access deficit as % of pop.(threshold: median value ofhealth worker density in low
vulnerability countries: 41.1 per10,000 population)
Financial deficit as % of pop.(threshold: median value of per
capita health spending in lowvulnerability countries: 239 US$)
OOP expenditureas % of total health expenditure
Maternal mortality ratio (per10,000 live births)
Low-income economies Lower-middle-income economies
Upper-middle-income economies High-income economies
Addressing the Global Health Crisis: Universal Health Protection Policies 9
Figure 8 provides a comprehensive overview of the global access deficit to health
care in countries grouped by income level. Concerning low income countries, it reveals
that
• more than 90 per cent of the population remains without any legal health coverage
to provide access to the most essential health care;
• more than 80 per cent of the population lacks access to health care due to the
absence of health workers needed to provide such services;
• the current financial deficit exceeds 90 per cent of necessary expenditure to cover
the costs of quality health care;
• with OOP accounting for more than 45 per cent of total health expenditure, the
affordability of health services and financial protection is a severe problem and
financial hardship as a result of private health expenditure is assumed to be very
prevalent;
• the maternal mortality ratio is estimated to be as high as 37.5 deaths per 10,000
live births in low-income countries, and is often directly related to gaps in the
availability of skilled health workers, particularly midwives.
In addition to these deficits in effective access to health care, it should be noted
that in most countries certain groups, such as the rural population, women, the elderly,
minorities and people with special needs such as those affected by HIV/AIDS, are even
more likely to face barriers to access than the general population (Scheil-Adlung and Kuhl,
2012).
Further, when comparing different groups of countries, or different schemes within
countries, it is important to be aware that the scope of benefits provided by the various
systems and schemes may vary significantly. Depending on economic, financial,
epidemiological and social conditions, the scope of benefits might range from providing a
limited number of public health and clinical interventions in primary care facilities to
comprehensive benefit packages, limited by the exclusion of some services. Thus the
figure above does not reflect the wide disparities in effective access to care both within and
across countries.
3.2. Rural areas: Globally most neglected
When analysing the gaps and deficits observed at global level through a
rural/urban lens, inequities become even more visible: In many countries, the place of
living and working defines if access to needed health care is available, affordable and
financially protected. Figure 9 reveals the large global and regional differences and
inequities in rural/urban health coverage and related gaps towards universal health
protection:
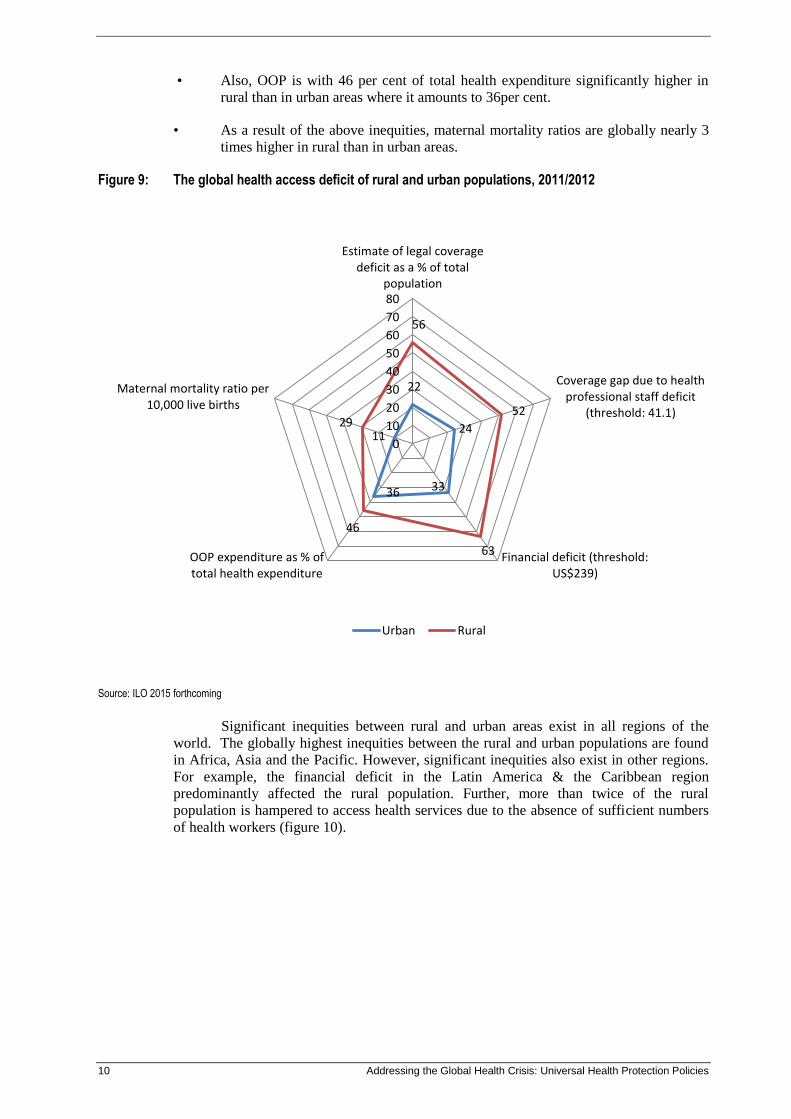
• 56 per cent of the global population living in rural areas are deprived from legal
health coverage while 22 per cent of the global urban population is experiencing
coverage gaps.
• 52 per cent of the rural population cannot access needed health services as the
number of health workers is too low to deliver these services; in urban areas this
concerns 24 per cent of the population.
• 63 per cent of the rural population has no or only inadequate access to health care
services due to financial deficits in health expenditure compared to 33 per cent of
the urban population.
10 Addressing the Global Health Crisis: Universal Health Protection Policies
• Also, OOP is with 46 per cent of total health expenditure significantly higher in
rural than in urban areas where it amounts to 36per cent.
• As a result of the above inequities, maternal mortality ratios are globally nearly 3
times higher in rural than in urban areas.
Figure 9: The global health access deficit of rural and urban populations, 2011/2012
Source: ILO 2015 forthcoming
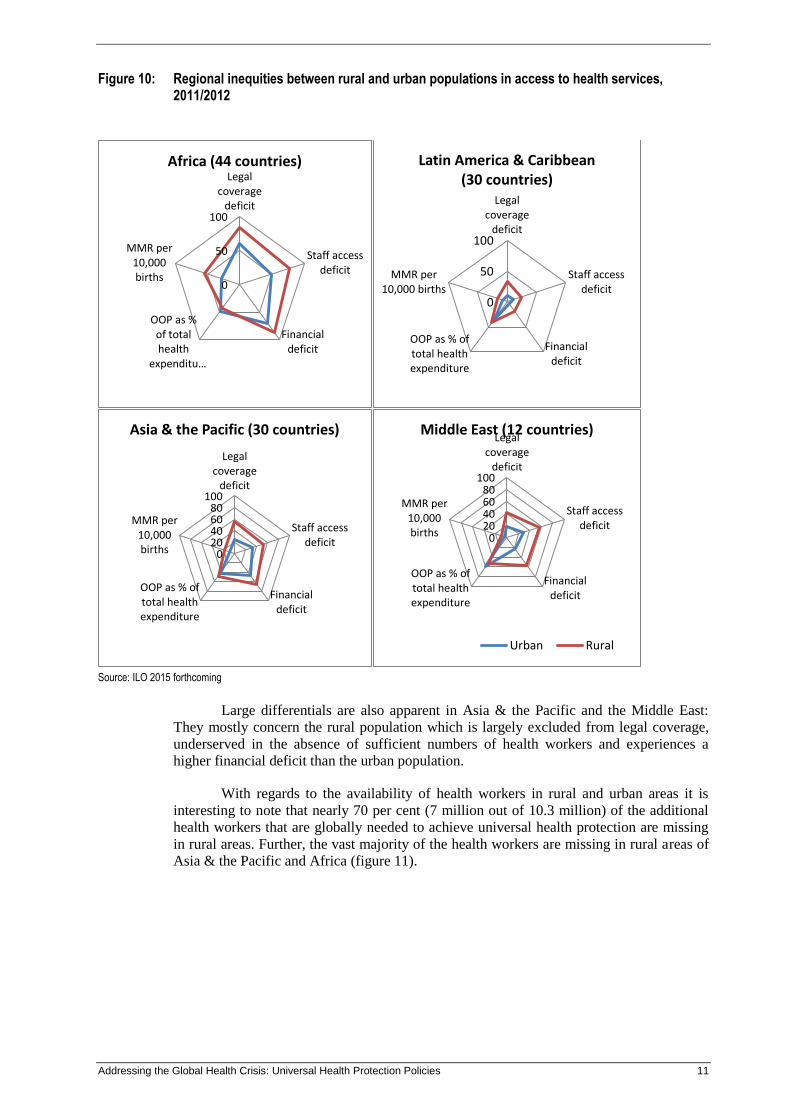
Significant inequities between rural and urban areas exist in all regions of the
world. The globally highest inequities between the rural and urban populations are found
in Africa, Asia and the Pacific. However, significant inequities also exist in other regions.
For example, the financial deficit in the Latin America & the Caribbean region
predominantly affected the rural population. Further, more than twice of the rural
population is hampered to access health services due to the absence of sufficient numbers
of health workers (figure 10).
22
24
33 36
11
56
52
63
46
29
0
10
20
30
40
50
60
70
80
Estimate of legal coveragedeficit as a % of total
population
Coverage gap due to healthprofessional staff deficit
(threshold: 41.1)
Financial deficit (threshold:US$239)
OOP expenditure as % oftotal health expenditure
Maternal mortality ratio per10,000 live births
Urban Rural
Addressing the Global Health Crisis: Universal Health Protection Policies 11
Figure 10: Regional inequities between rural and urban populations in access to health services, 2011/2012
Source: ILO 2015 forthcoming
Large differentials are also apparent in Asia & the Pacific and the Middle East:
They mostly concern the rural population which is largely excluded from legal coverage,
underserved in the absence of sufficient numbers of health workers and experiences a
higher financial deficit than the urban population.
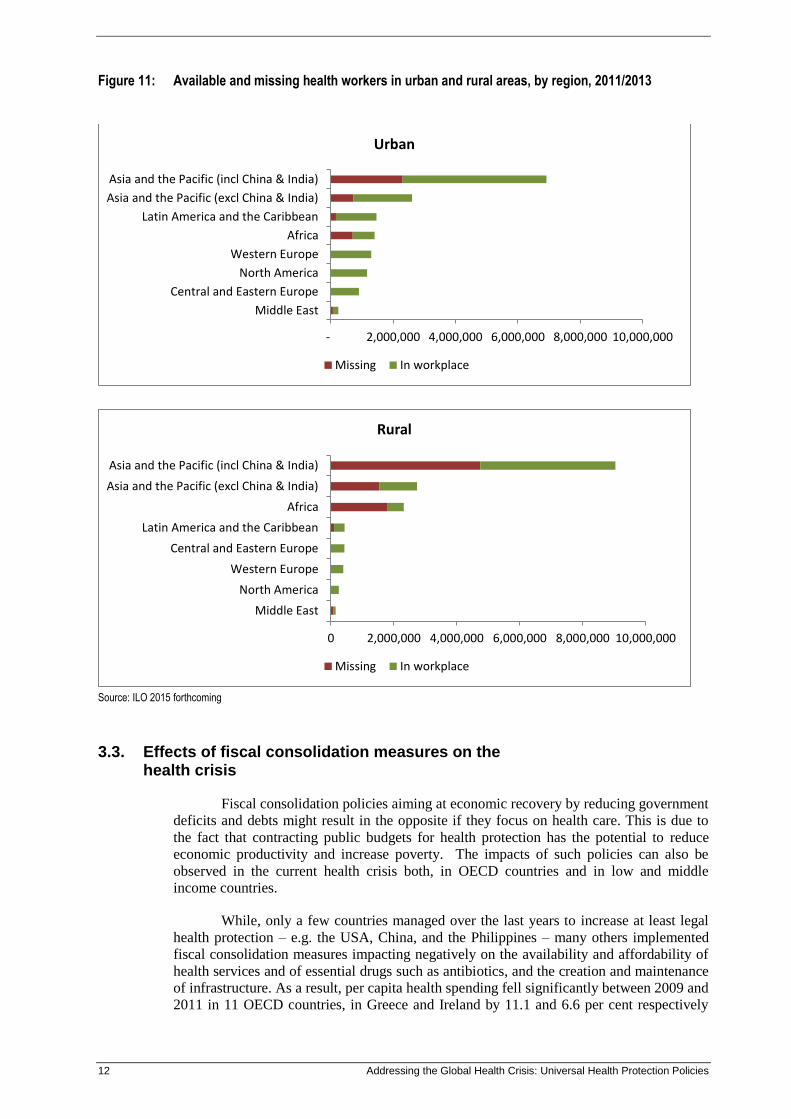
With regards to the availability of health workers in rural and urban areas it is
interesting to note that nearly 70 per cent (7 million out of 10.3 million) of the additional
health workers that are globally needed to achieve universal health protection are missing
in rural areas. Further, the vast majority of the health workers are missing in rural areas of
Asia & the Pacific and Africa (figure 11).
0
50
100
Legalcoverage
deficit
Staff accessdeficit
Financialdeficit
OOP as %of totalhealth
expenditu…
MMR per10,000births
Africa (44 countries)
0
50
100
Legalcoverage
deficit
Staff accessdeficit
Financialdeficit
OOP as % oftotal healthexpenditure
MMR per10,000 births
Latin America & Caribbean (30 countries)
020406080
100
Legalcoverage
deficit
Staff accessdeficit
Financialdeficit
OOP as % oftotal healthexpenditure
MMR per10,000births
Asia & the Pacific (30 countries)
020406080
100
Legalcoverage
deficit
Staff accessdeficit
Financialdeficit
OOP as % oftotal healthexpenditure
MMR per10,000births
Middle East (12 countries)
Urban Rural
12 Addressing the Global Health Crisis: Universal Health Protection Policies
Figure 11: Available and missing health workers in urban and rural areas, by region, 2011/2013
Source: ILO 2015 forthcoming
3.3. Effects of fiscal consolidation measures on the health crisis
Fiscal consolidation policies aiming at economic recovery by reducing government
deficits and debts might result in the opposite if they focus on health care. This is due to
the fact that contracting public budgets for health protection has the potential to reduce
economic productivity and increase poverty. The impacts of such policies can also be
observed in the current health crisis both, in OECD countries and in low and middle
income countries.
While, only a few countries managed over the last years to increase at least legal
health protection – e.g. the USA, China, and the Philippines – many others implemented
fiscal consolidation measures impacting negatively on the availability and affordability of
health services and of essential drugs such as antibiotics, and the creation and maintenance
of infrastructure. As a result, per capita health spending fell significantly between 2009 and
2011 in 11 OECD countries, in Greece and Ireland by 11.1 and 6.6 per cent respectively
- 2,000,000 4,000,000 6,000,000 8,000,000 10,000,000
Middle East
Central and Eastern Europe
North America
Western Europe
Africa
Latin America and the Caribbean
Asia and the Pacific (excl China & India)
Asia and the Pacific (incl China & India)
Urban
Missing In workplace
0 2,000,000 4,000,000 6,000,000 8,000,000 10,000,000
Middle East
North America
Western Europe
Central and Eastern Europe
Latin America and the Caribbean
Africa
Asia and the Pacific (excl China & India)
Asia and the Pacific (incl China & India)
Rural
Missing In workplace
Addressing the Global Health Crisis: Universal Health Protection Policies 13
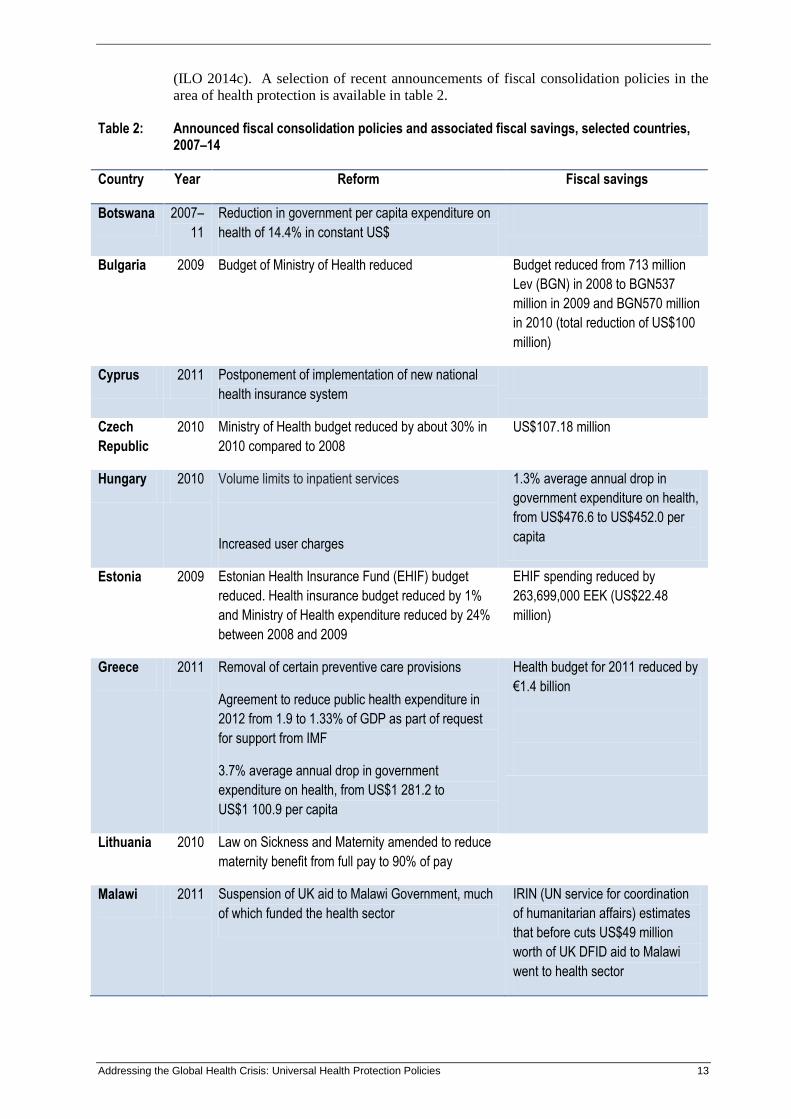
(ILO 2014c). A selection of recent announcements of fiscal consolidation policies in the
area of health protection is available in table 2.
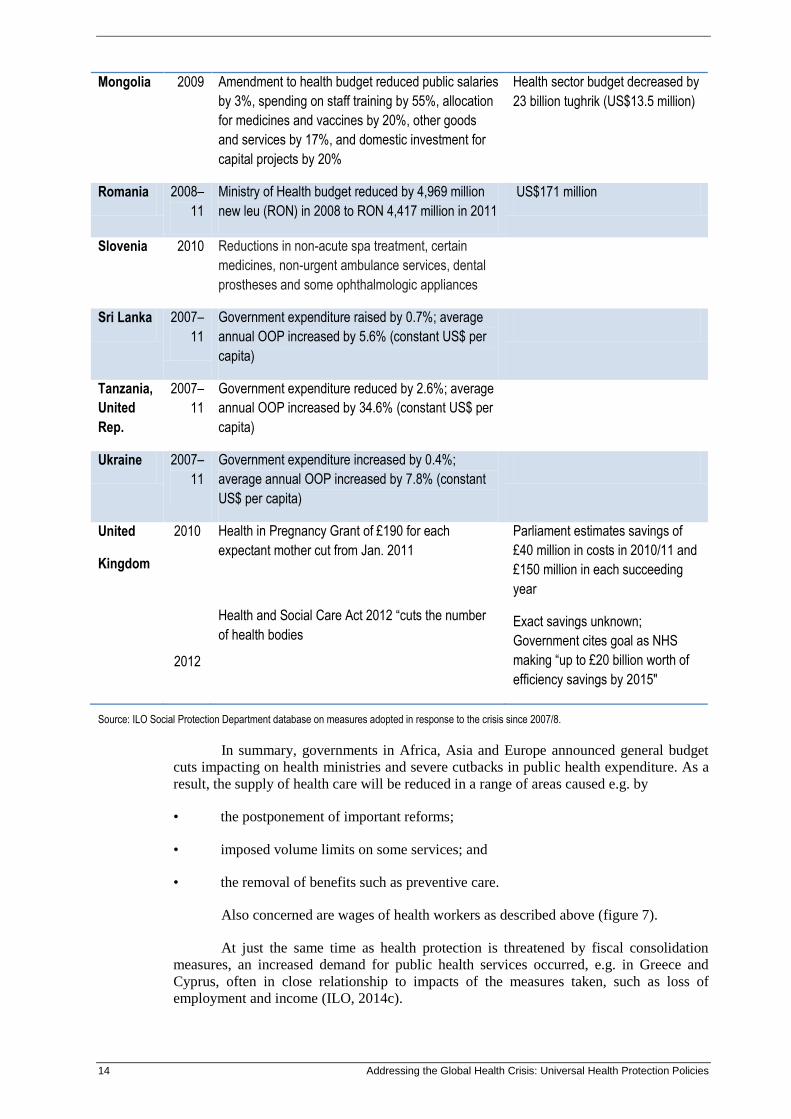
Table 2: Announced fiscal consolidation policies and associated fiscal savings, selected countries, 2007–14
Country Year Reform Fiscal savings
Botswana 2007–
11
Reduction in government per capita expenditure on
health of 14.4% in constant US$
Bulgaria 2009 Budget of Ministry of Health reduced Budget reduced from 713 million
Lev (BGN) in 2008 to BGN537
million in 2009 and BGN570 million
in 2010 (total reduction of US$100
million)
Cyprus 2011 Postponement of implementation of new national
health insurance system
Czech
Republic
2010 Ministry of Health budget reduced by about 30% in
2010 compared to 2008
US$107.18 million
Hungary 2010 Volume limits to inpatient services
Increased user charges
1.3% average annual drop in
government expenditure on health,
from US$476.6 to US$452.0 per
capita
Estonia 2009 Estonian Health Insurance Fund (EHIF) budget
reduced. Health insurance budget reduced by 1%
and Ministry of Health expenditure reduced by 24%
between 2008 and 2009
EHIF spending reduced by
263,699,000 EEK (US$22.48
million)
Greece 2011 Removal of certain preventive care provisions
Agreement to reduce public health expenditure in
2012 from 1.9 to 1.33% of GDP as part of request
for support from IMF
3.7% average annual drop in government
expenditure on health, from US$1 281.2 to
US$1 100.9 per capita
Health budget for 2011 reduced by
€1.4 billion
Lithuania 2010 Law on Sickness and Maternity amended to reduce
maternity benefit from full pay to 90% of pay
Malawi 2011 Suspension of UK aid to Malawi Government, much
of which funded the health sector
IRIN (UN service for coordination
of humanitarian affairs) estimates
that before cuts US$49 million
worth of UK DFID aid to Malawi
went to health sector
14 Addressing the Global Health Crisis: Universal Health Protection Policies
Mongolia 2009 Amendment to health budget reduced public salaries
by 3%, spending on staff training by 55%, allocation
for medicines and vaccines by 20%, other goods
and services by 17%, and domestic investment for
capital projects by 20%
Health sector budget decreased by
23 billion tughrik (US$13.5 million)
Romania 2008–
11
Ministry of Health budget reduced by 4,969 million
new leu (RON) in 2008 to RON 4,417 million in 2011
US$171 million
Slovenia 2010 Reductions in non-acute spa treatment, certain
medicines, non-urgent ambulance services, dental
prostheses and some ophthalmologic appliances
Sri Lanka 2007–
11
Government expenditure raised by 0.7%; average
annual OOP increased by 5.6% (constant US$ per
capita)
Tanzania,
United
Rep.
2007–
11
Government expenditure reduced by 2.6%; average
annual OOP increased by 34.6% (constant US$ per
capita)
Ukraine 2007–
11
Government expenditure increased by 0.4%;
average annual OOP increased by 7.8% (constant
US$ per capita)
United
Kingdom
2010
2012
Health in Pregnancy Grant of £190 for each
expectant mother cut from Jan. 2011
Health and Social Care Act 2012 “cuts the number
of health bodies
Parliament estimates savings of
£40 million in costs in 2010/11 and
£150 million in each succeeding
year
Exact savings unknown;
Government cites goal as NHS
making “up to £20 billion worth of
efficiency savings by 2015"
Source: ILO Social Protection Department database on measures adopted in response to the crisis since 2007/8.
In summary, governments in Africa, Asia and Europe announced general budget
cuts impacting on health ministries and severe cutbacks in public health expenditure. As a
result, the supply of health care will be reduced in a range of areas caused e.g. by
• the postponement of important reforms;
• imposed volume limits on some services; and
• the removal of benefits such as preventive care.
Also concerned are wages of health workers as described above (figure 7).
At just the same time as health protection is threatened by fiscal consolidation
measures, an increased demand for public health services occurred, e.g. in Greece and
Cyprus, often in close relationship to impacts of the measures taken, such as loss of
employment and income (ILO, 2014c).
Addressing the Global Health Crisis: Universal Health Protection Policies 15
Overall, the impact of fiscal consolidation measures has been to stall or even
reverse progress towards universal health coverage by sharpening inequities in access to
health care, increasing the financial burden on private households, reducing benefits and
thus increasing exclusion.
As for their impact on the economy, it can be concluded that, rather than curing the
symptoms of debts and deficits, fiscal consolidation measures in the area of health
protection have acted as barriers to economic recovery by weakening the productivity of
the workforce and reducing employment of much-needed health workers. In addition, these
measures have had negative impacts on the right to work and on adequate standards of
living, particularly those of the most vulnerable segments of the population that have been
hit hardest by budget cuts.
4. Addressing the health protection crisis: Universal health protection policies creating sustainable development
Countries that are most affected by the health protection crisis are characterized by
significant coverage and access deficits. Thus, health protection cannot boost the economy
and contribute to inclusive growth and sustainable development.
This can be only be achieved by increasing solidarity in the context of universal
coverage if health care schemes and systems are well designed and embedded in
appropriate economic and labour market policies. In such an environment, universal health
protection has the potential to enhance productivity, employment, income generation and
to alleviate poverty.
The economic impacts of investments in health care regarding sustainable
development and economic growth may be summarized as follows:
• Increased labour productivity through reduced absenteeism and disability;
• Growing labour force due to reductions in disability, mortality and increased life
expectancy;
• Employment effects and job growth arising from the improved physical capacities
of workers and from both direct employment in the health sector and multiplier
effects in industry, local businesses and other sectors;
• Increasing economic activities due to the contribution of the health sector to the
economy
• Income generation, based on increased ability to work;
• In the longer term, growing tax bases arising from the indirect economic effects of
investments in health will generate more public funds;
• Stabilization of the economy in times of crises, by cushioning the impacts of
economic crises on individual health and ensuring continued employment for those
in the health sector and related sectors;
• Poverty alleviation, through minimizing the private health expenditure of those
who are poor or near poverty.
Given these close relationships between health protection and the economy at
large, investments will recover large parts of health expenditure at the national level. Thus,
16 Addressing the Global Health Crisis: Universal Health Protection Policies
providing effective access to health care for all in need can contribute to a virtuous cycle of
mutual reinforcement that takes place between the development of a health protection
system, sustained economic growth and population health and wellbeing (Kim et al. 2013).
Country examples include Thailand, where the introduction of universal health
protection has crowded in economic activities, accounting for economic gains of as much
as 1.2 times of the original spending (McManus 2012). Other country examples such as
Rwanda indicate that well-managed expansions of health protection policies and a fast
growing economy are complementary to each other (Kim et al. 2013).
4.1. Guaranteeing the right to adequate health care for all
Given the critical importance of human rights to health both to individuals and to
sustainable development, it is important that countries and development partners across the
world be aligned in support of the objective of establishing universal coverage.
In recognition of this imperative, the right to health protection has been at the core
of the ILO mandate since its foundation in 1919. The extension of such coverage to all in
need has been a priority since 1944, as stated in the Declaration of Philadelphia. The first
formulation of guidance to achieve universal coverage dates back to the same year, when
the ILO’s constituents adopted the Medical Care Recommendation, 1944 (No. 69) which
states: “The medical care service should cover all members of the community, whether or
not they are gainfully occupied” (para. 8).
Since then, this objective and the specific means for its realization have been spelt
out in numerous ILO Conventions and Recommendations, most recently in the Social
Protection Floors Recommendation, 2012 (No. 202), which emphasizes that in each
country, all residents and children should be guaranteed access to health care, and that this
should include at least essential health care, prevention and maternal care, financed
through social protection systems and schemes so as to avoid financial access barriers, e.g.
through excessive out-of-pocket payments. Recommendation No. 202 specifies the need
for
• Legal health coverage by a social health protection system or scheme, e.g. through
entitlements to benefits prescribed by national law; that is, rights-based protection
(contrasting to e.g. charitable provision) through national health services and/or
national, social or private health insurance schemes operated in line with certain
conditions; and
• Guaranteed access to at least essential health care that meets the criteria of
availability, accessibility, acceptability and quality (AAAQ)1 , without risk of
hardship or increased risk of poverty due to the financial consequences of gaining
such access.
Universality of health protection implies that in all countries, rights-based
approaches, anchored and framed in legislation, should exist to cover the whole
population, including workers in the formal and informal economy and their families. The
implementation and enforcement of these approaches is a prerequisite for access to health
care when needed.
1 These criteria have been set out in UN (2000).
Addressing the Global Health Crisis: Universal Health Protection Policies 17
According to Recommendation No. 202, universal health coverage further requires
effective access to at least essential health care as defined at national level and also income
replacement during periods of sickness, provided equally to all in need. This necessitates
the availability of acceptable quality care, which entails a sufficient number of skilled
health workers for service delivery and adequate funds e.g. for drugs and infrastructure. In
addition, it is necessary that co-payments, user fees and other costs involved in taking up
care are affordable and that financial protection is provided in order to avoid hardship or
impoverishment. Finally, effective access requires good governance of schemes and
systems, which should be based on accountability, including participatory processes such
as social and national dialogue.
Thus, the Recommendation defines a concept of universal coverage in health that
entails taking into account both legal coverage and access to health care: only the
combination of both will lead to meaningful protection for the population and ensure
equitable access as a matter of right to services that meet the AAAQ criteria. The ILO has
developed tools and indicators for measuring the status quo and progress towards universal
health coverage on both dimensions.
The notion of universal health coverage was also developed over the years in other
UN agencies, particularly the World Health Organization (WHO), which referred to it in,
for example, a resolution of the World Health Assembly (WHO, 2011b) encouraging
countries to aim for universal coverage. Today, the principle of universal health coverage
has gained momentum and the UN General Assembly has asked the WHO and other UN
agencies, including the ILO, to give high priority to working jointly towards universal
health coverage in the context of wider approaches to social protection, in consultation
with UN member States (UN, 2012c).
4.2. Fair financing of health protection for sustainable development
Developing national financing mechanisms that generate sufficient funds is a key
to tackle gaps in health protection and progress towards universality and sustainable
development. Generally, sources of funds include taxes and contributions from employers
and employees. While very frequent, OOP are not considered as a source of funding health
protection by ILO. Also premium payments in the context of private health insurance – if
based on premiums calculated on risks and limiting the extent of benefits to the principle
of equivalence of payments made – are not considered as a fair financing mechanism given
the need for burden sharing and financial protection of the sick when in need of expensive
health care.
Taxes can be used for fully tax funded systems, such as National Health Services
e.g. in the UK or as subsidies e.g. to cover the expenditure of the poor in national health
insurance schemes such as in Ghana. Contributions equally shared by employees and
employers are found in social insurance schemes such as in Germany. Both tax and
contribution collection can be designed efficiently and effectively to create sufficient fiscal
space for universal health protection that stimulates sustainable development. An overview
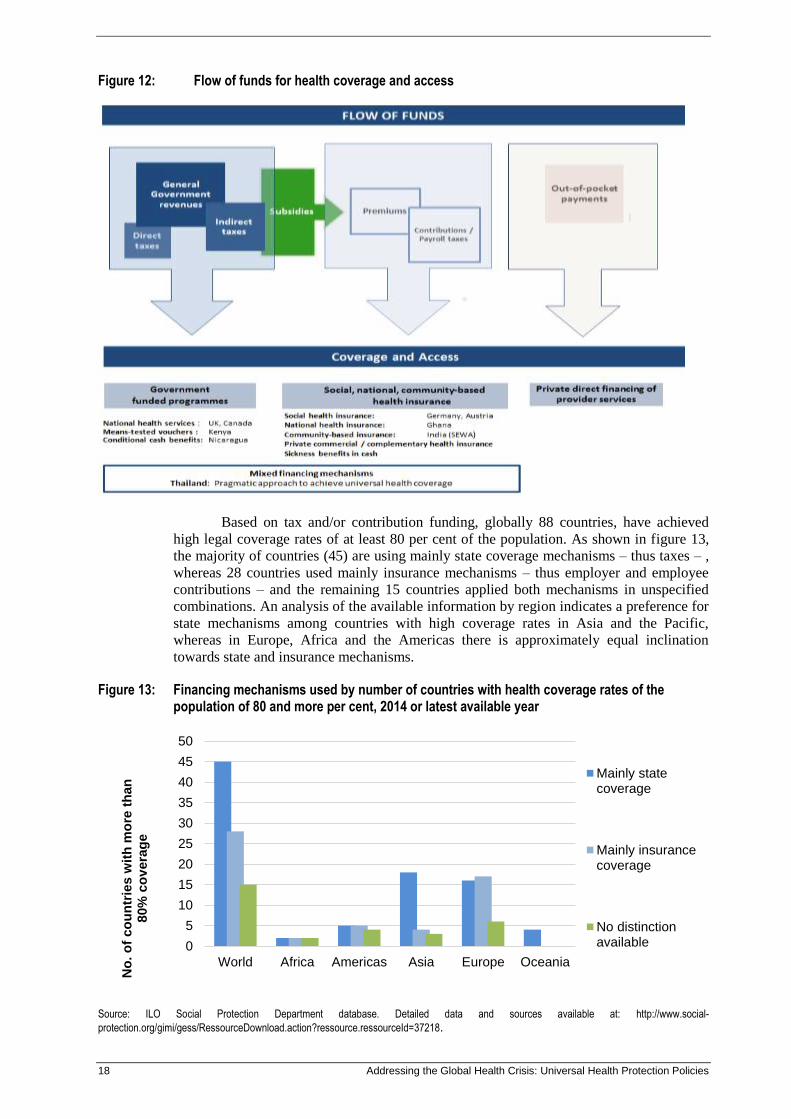
of the flow of funds for health financing is provided in figure 12.
18 Addressing the Global Health Crisis: Universal Health Protection Policies
Figure 12: Flow of funds for health coverage and access
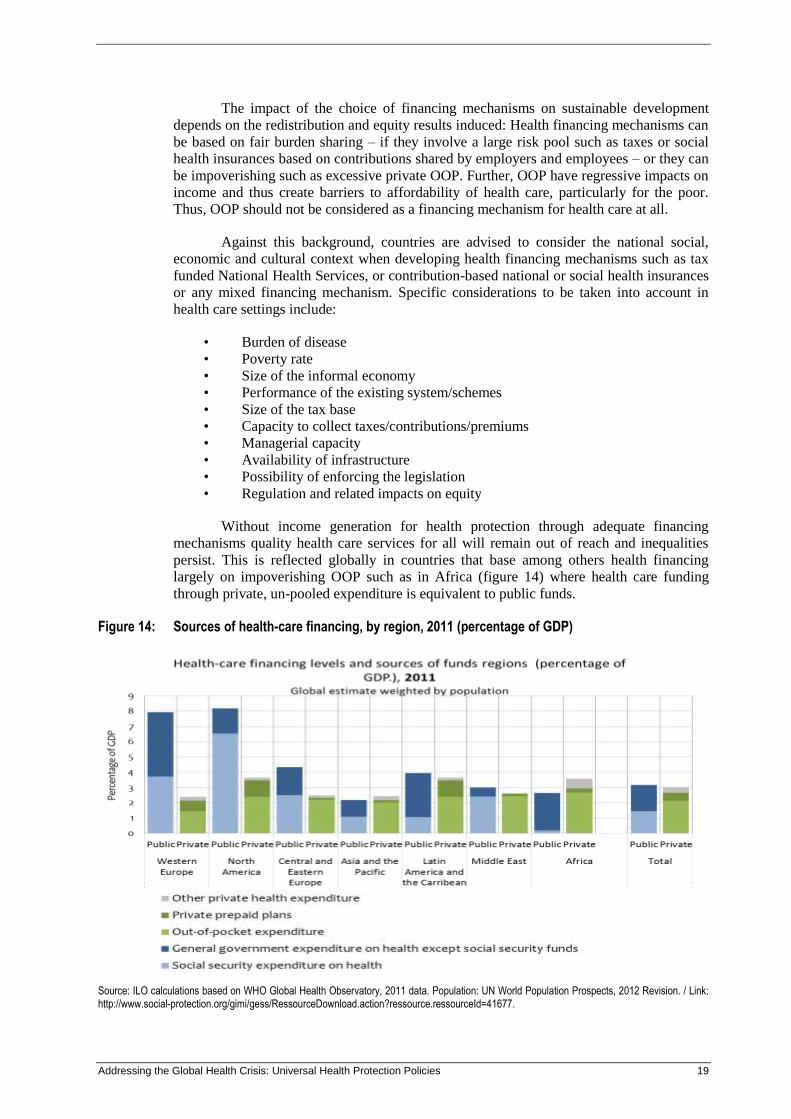
Based on tax and/or contribution funding, globally 88 countries, have achieved
high legal coverage rates of at least 80 per cent of the population. As shown in figure 13,
the majority of countries (45) are using mainly state coverage mechanisms – thus taxes – ,
whereas 28 countries used mainly insurance mechanisms – thus employer and employee
contributions – and the remaining 15 countries applied both mechanisms in unspecified
combinations. An analysis of the available information by region indicates a preference for
state mechanisms among countries with high coverage rates in Asia and the Pacific,
whereas in Europe, Africa and the Americas there is approximately equal inclination
towards state and insurance mechanisms.
Figure 13: Financing mechanisms used by number of countries with health coverage rates of the population of 80 and more per cent, 2014 or latest available year
Source: ILO Social Protection Department database. Detailed data and sources available at: http://www.social-
protection.org/gimi/gess/RessourceDownload.action?ressource.ressourceId=37218.
0
5
10
15
20
25
30
35
40
45
50
World Africa Americas Asia Europe Oceania
No
. o
f co
un
trie
s w
ith
mo
re t
han
80%
co
vera
ge
Mainly statecoverage
Mainly insurancecoverage
No distinctionavailable
Addressing the Global Health Crisis: Universal Health Protection Policies 19
The impact of the choice of financing mechanisms on sustainable development
depends on the redistribution and equity results induced: Health financing mechanisms can
be based on fair burden sharing – if they involve a large risk pool such as taxes or social
health insurances based on contributions shared by employers and employees – or they can
be impoverishing such as excessive private OOP. Further, OOP have regressive impacts on
income and thus create barriers to affordability of health care, particularly for the poor.
Thus, OOP should not be considered as a financing mechanism for health care at all.
Against this background, countries are advised to consider the national social,
economic and cultural context when developing health financing mechanisms such as tax
funded National Health Services, or contribution-based national or social health insurances
or any mixed financing mechanism. Specific considerations to be taken into account in
health care settings include:
• Burden of disease
• Poverty rate
• Size of the informal economy
• Performance of the existing system/schemes
• Size of the tax base
• Capacity to collect taxes/contributions/premiums
• Managerial capacity
• Availability of infrastructure
• Possibility of enforcing the legislation
• Regulation and related impacts on equity
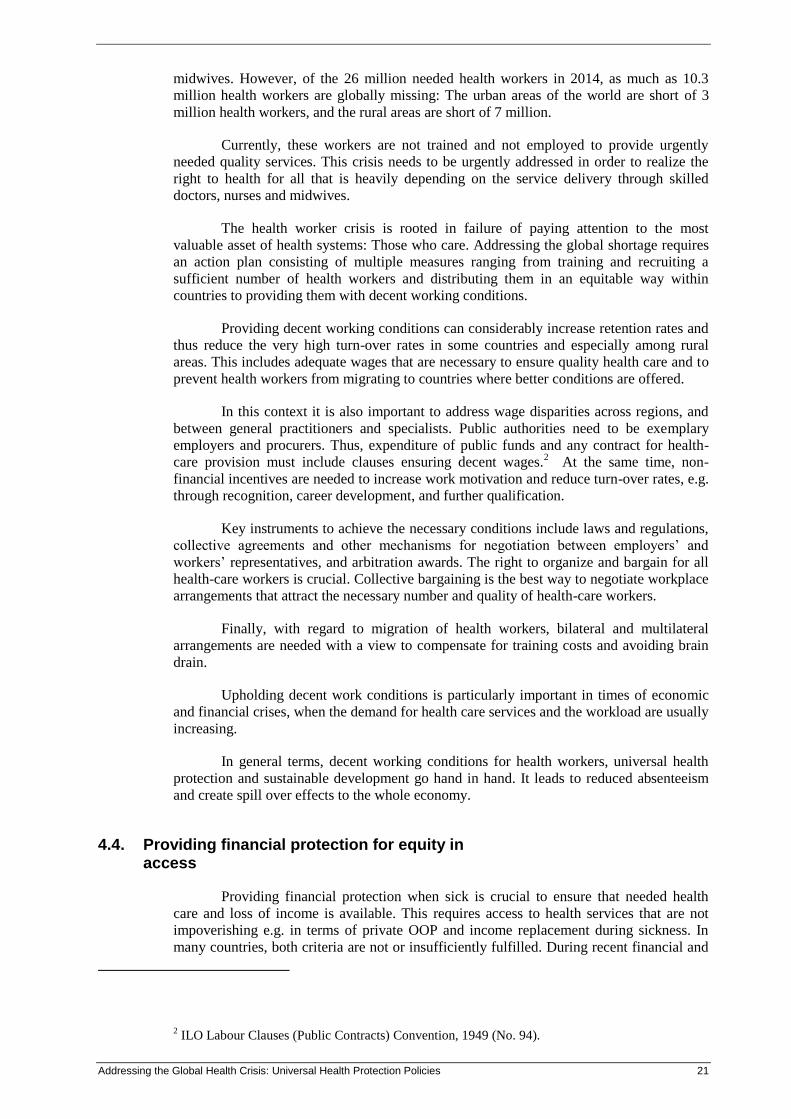
Without income generation for health protection through adequate financing
mechanisms quality health care services for all will remain out of reach and inequalities
persist. This is reflected globally in countries that base among others health financing
largely on impoverishing OOP such as in Africa (figure 14) where health care funding
through private, un-pooled expenditure is equivalent to public funds.
Figure 14: Sources of health-care financing, by region, 2011 (percentage of GDP)
Source: ILO calculations based on WHO Global Health Observatory, 2011 data. Population: UN World Population Prospects, 2012 Revision. / Link: http://www.social-protection.org/gimi/gess/RessourceDownload.action?ressource.ressourceId=41677.
20 Addressing the Global Health Crisis: Universal Health Protection Policies
Often countries decide to use a mix of financing mechanisms. The reasons for
using mixed financing mechanisms are often linked to the desire to generate sufficient
funds from different sources and to make best use of the respective advantages of the
different mechanisms, such as large risk pools, generation of stable revenues and reaching
out to populations in remote areas. An overview of observations on some aspects of
performance of key financing mechanisms towards sustainable development is provided in
table 3.
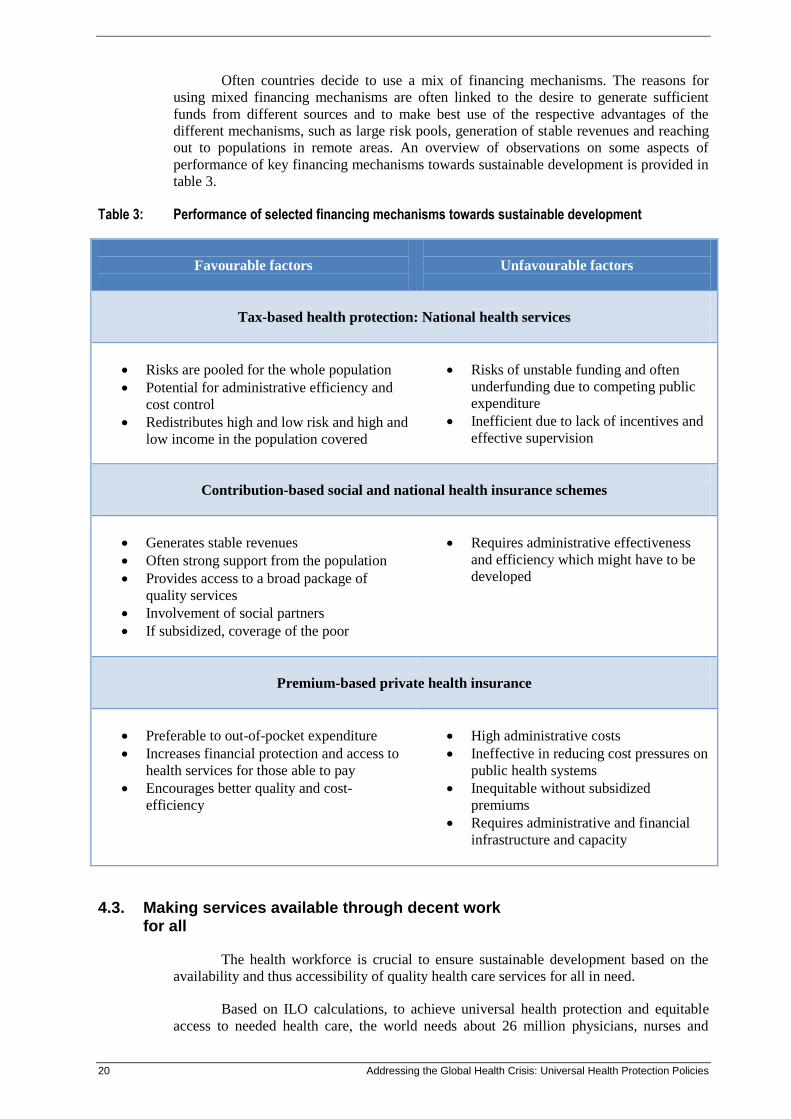
Table 3: Performance of selected financing mechanisms towards sustainable development
Favourable factors
Unfavourable factors
Tax-based health protection: National health services
Risks are pooled for the whole population
Potential for administrative efficiency and
cost control
Redistributes high and low risk and high and
low income in the population covered
Risks of unstable funding and often
underfunding due to competing public
expenditure
Inefficient due to lack of incentives and
effective supervision
Contribution-based social and national health insurance schemes
Generates stable revenues
Often strong support from the population
Provides access to a broad package of
quality services
Involvement of social partners
If subsidized, coverage of the poor
Requires administrative effectiveness
and efficiency which might have to be
developed
Premium-based private health insurance
Preferable to out-of-pocket expenditure
Increases financial protection and access to
health services for those able to pay
Encourages better quality and cost-
efficiency
High administrative costs
Ineffective in reducing cost pressures on
public health systems
Inequitable without subsidized
premiums
Requires administrative and financial
infrastructure and capacity
4.3. Making services available through decent work for all
The health workforce is crucial to ensure sustainable development based on the
availability and thus accessibility of quality health care services for all in need.
Based on ILO calculations, to achieve universal health protection and equitable
access to needed health care, the world needs about 26 million physicians, nurses and
Addressing the Global Health Crisis: Universal Health Protection Policies 21
midwives. However, of the 26 million needed health workers in 2014, as much as 10.3
million health workers are globally missing: The urban areas of the world are short of 3
million health workers, and the rural areas are short of 7 million.
Currently, these workers are not trained and not employed to provide urgently
needed quality services. This crisis needs to be urgently addressed in order to realize the
right to health for all that is heavily depending on the service delivery through skilled
doctors, nurses and midwives.
The health worker crisis is rooted in failure of paying attention to the most
valuable asset of health systems: Those who care. Addressing the global shortage requires
an action plan consisting of multiple measures ranging from training and recruiting a
sufficient number of health workers and distributing them in an equitable way within
countries to providing them with decent working conditions.
Providing decent working conditions can considerably increase retention rates and
thus reduce the very high turn-over rates in some countries and especially among rural
areas. This includes adequate wages that are necessary to ensure quality health care and to
prevent health workers from migrating to countries where better conditions are offered.
In this context it is also important to address wage disparities across regions, and
between general practitioners and specialists. Public authorities need to be exemplary
employers and procurers. Thus, expenditure of public funds and any contract for health-
care provision must include clauses ensuring decent wages.2 At the same time, non-
financial incentives are needed to increase work motivation and reduce turn-over rates, e.g.
through recognition, career development, and further qualification.
Key instruments to achieve the necessary conditions include laws and regulations,
collective agreements and other mechanisms for negotiation between employers’ and
workers’ representatives, and arbitration awards. The right to organize and bargain for all
health-care workers is crucial. Collective bargaining is the best way to negotiate workplace
arrangements that attract the necessary number and quality of health-care workers.
Finally, with regard to migration of health workers, bilateral and multilateral
arrangements are needed with a view to compensate for training costs and avoiding brain
drain.
Upholding decent work conditions is particularly important in times of economic
and financial crises, when the demand for health care services and the workload are usually
increasing.
In general terms, decent working conditions for health workers, universal health
protection and sustainable development go hand in hand. It leads to reduced absenteeism
and create spill over effects to the whole economy.
4.4. Providing financial protection for equity in access
Providing financial protection when sick is crucial to ensure that needed health
care and loss of income is available. This requires access to health services that are not
impoverishing e.g. in terms of private OOP and income replacement during sickness. In
many countries, both criteria are not or insufficiently fulfilled. During recent financial and
2 ILO Labour Clauses (Public Contracts) Convention, 1949 (No. 94).
22 Addressing the Global Health Crisis: Universal Health Protection Policies
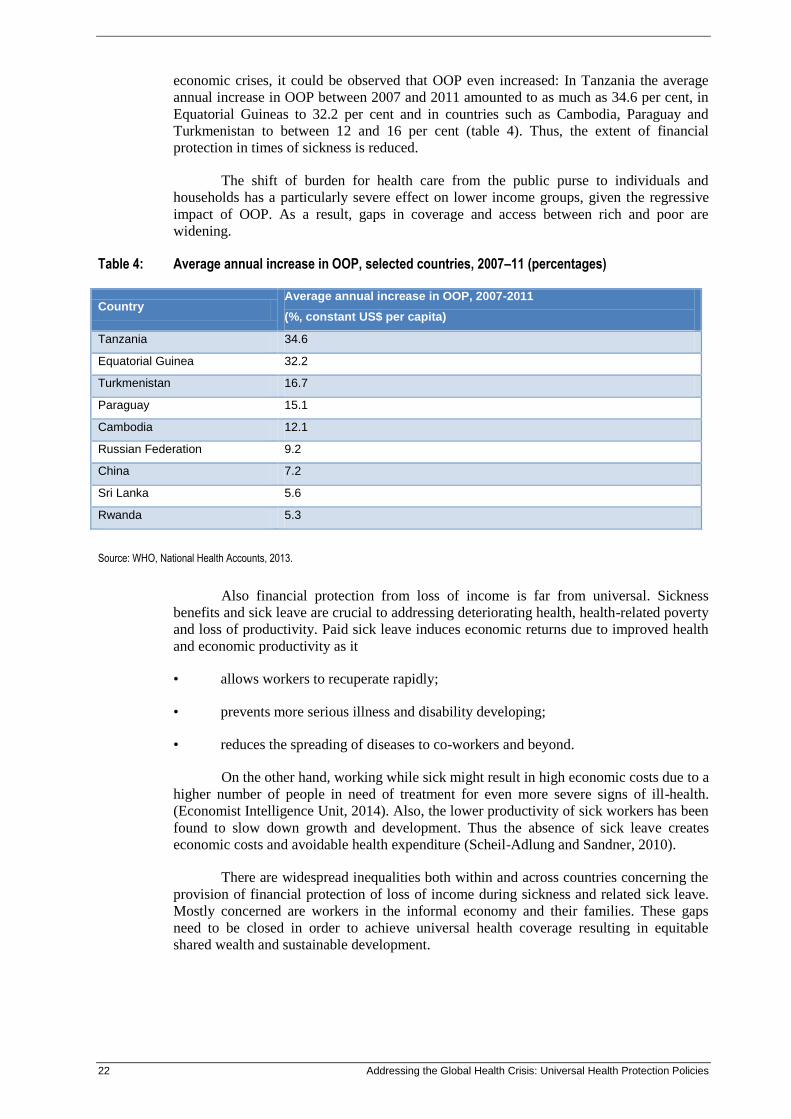
economic crises, it could be observed that OOP even increased: In Tanzania the average
annual increase in OOP between 2007 and 2011 amounted to as much as 34.6 per cent, in
Equatorial Guineas to 32.2 per cent and in countries such as Cambodia, Paraguay and
Turkmenistan to between 12 and 16 per cent (table 4). Thus, the extent of financial
protection in times of sickness is reduced.
The shift of burden for health care from the public purse to individuals and
households has a particularly severe effect on lower income groups, given the regressive
impact of OOP. As a result, gaps in coverage and access between rich and poor are
widening.
Table 4: Average annual increase in OOP, selected countries, 2007–11 (percentages)
Country Average annual increase in OOP, 2007-2011
(%, constant US$ per capita)
Tanzania 34.6
Equatorial Guinea 32.2
Turkmenistan 16.7
Paraguay 15.1
Cambodia 12.1
Russian Federation 9.2
China 7.2
Sri Lanka 5.6
Rwanda 5.3
Source: WHO, National Health Accounts, 2013.
Also financial protection from loss of income is far from universal. Sickness
benefits and sick leave are crucial to addressing deteriorating health, health-related poverty
and loss of productivity. Paid sick leave induces economic returns due to improved health
and economic productivity as it
• allows workers to recuperate rapidly;
• prevents more serious illness and disability developing;
• reduces the spreading of diseases to co-workers and beyond.
On the other hand, working while sick might result in high economic costs due to a
higher number of people in need of treatment for even more severe signs of ill-health.
(Economist Intelligence Unit, 2014). Also, the lower productivity of sick workers has been
found to slow down growth and development. Thus the absence of sick leave creates
economic costs and avoidable health expenditure (Scheil-Adlung and Sandner, 2010).
There are widespread inequalities both within and across countries concerning the
provision of financial protection of loss of income during sickness and related sick leave.
Mostly concerned are workers in the informal economy and their families. These gaps
need to be closed in order to achieve universal health coverage resulting in equitable
shared wealth and sustainable development.
Addressing the Global Health Crisis: Universal Health Protection Policies 23
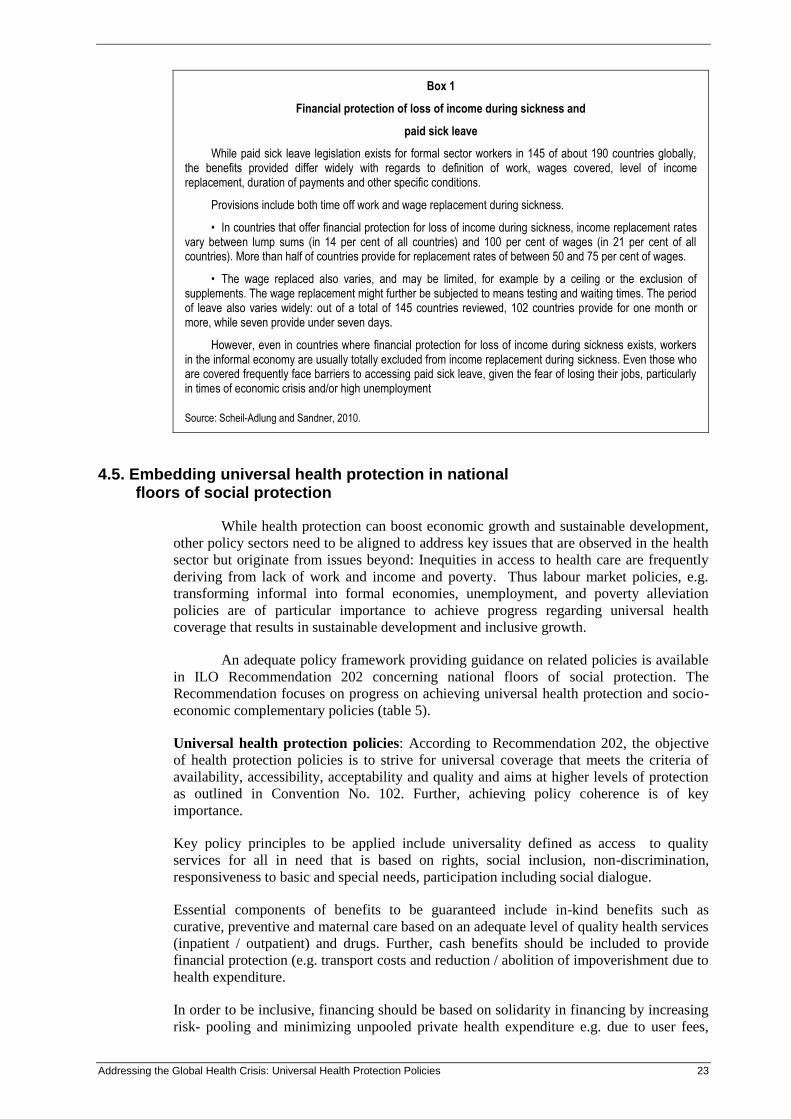
Box 1
Financial protection of loss of income during sickness and
paid sick leave
While paid sick leave legislation exists for formal sector workers in 145 of about 190 countries globally, the benefits provided differ widely with regards to definition of work, wages covered, level of income replacement, duration of payments and other specific conditions.
Provisions include both time off work and wage replacement during sickness.
• In countries that offer financial protection for loss of income during sickness, income replacement rates vary between lump sums (in 14 per cent of all countries) and 100 per cent of wages (in 21 per cent of all countries). More than half of countries provide for replacement rates of between 50 and 75 per cent of wages.
• The wage replaced also varies, and may be limited, for example by a ceiling or the exclusion of supplements. The wage replacement might further be subjected to means testing and waiting times. The period of leave also varies widely: out of a total of 145 countries reviewed, 102 countries provide for one month or more, while seven provide under seven days.
However, even in countries where financial protection for loss of income during sickness exists, workers in the informal economy are usually totally excluded from income replacement during sickness. Even those who are covered frequently face barriers to accessing paid sick leave, given the fear of losing their jobs, particularly in times of economic crisis and/or high unemployment
Source: Scheil-Adlung and Sandner, 2010.
4.5. Embedding universal health protection in national floors of social protection
While health protection can boost economic growth and sustainable development,
other policy sectors need to be aligned to address key issues that are observed in the health
sector but originate from issues beyond: Inequities in access to health care are frequently
deriving from lack of work and income and poverty. Thus labour market policies, e.g.
transforming informal into formal economies, unemployment, and poverty alleviation
policies are of particular importance to achieve progress regarding universal health
coverage that results in sustainable development and inclusive growth.
An adequate policy framework providing guidance on related policies is available
in ILO Recommendation 202 concerning national floors of social protection. The
Recommendation focuses on progress on achieving universal health protection and socio-
economic complementary policies (table 5).
Universal health protection policies: According to Recommendation 202, the objective
of health protection policies is to strive for universal coverage that meets the criteria of
availability, accessibility, acceptability and quality and aims at higher levels of protection
as outlined in Convention No. 102. Further, achieving policy coherence is of key
importance.
Key policy principles to be applied include universality defined as access to quality
services for all in need that is based on rights, social inclusion, non-discrimination,
responsiveness to basic and special needs, participation including social dialogue.
Essential components of benefits to be guaranteed include in-kind benefits such as
curative, preventive and maternal care based on an adequate level of quality health services
(inpatient / outpatient) and drugs. Further, cash benefits should be included to provide
financial protection (e.g. transport costs and reduction / abolition of impoverishment due to
health expenditure.
In order to be inclusive, financing should be based on solidarity in financing by increasing
risk- pooling and minimizing unpooled private health expenditure e.g. due to user fees,
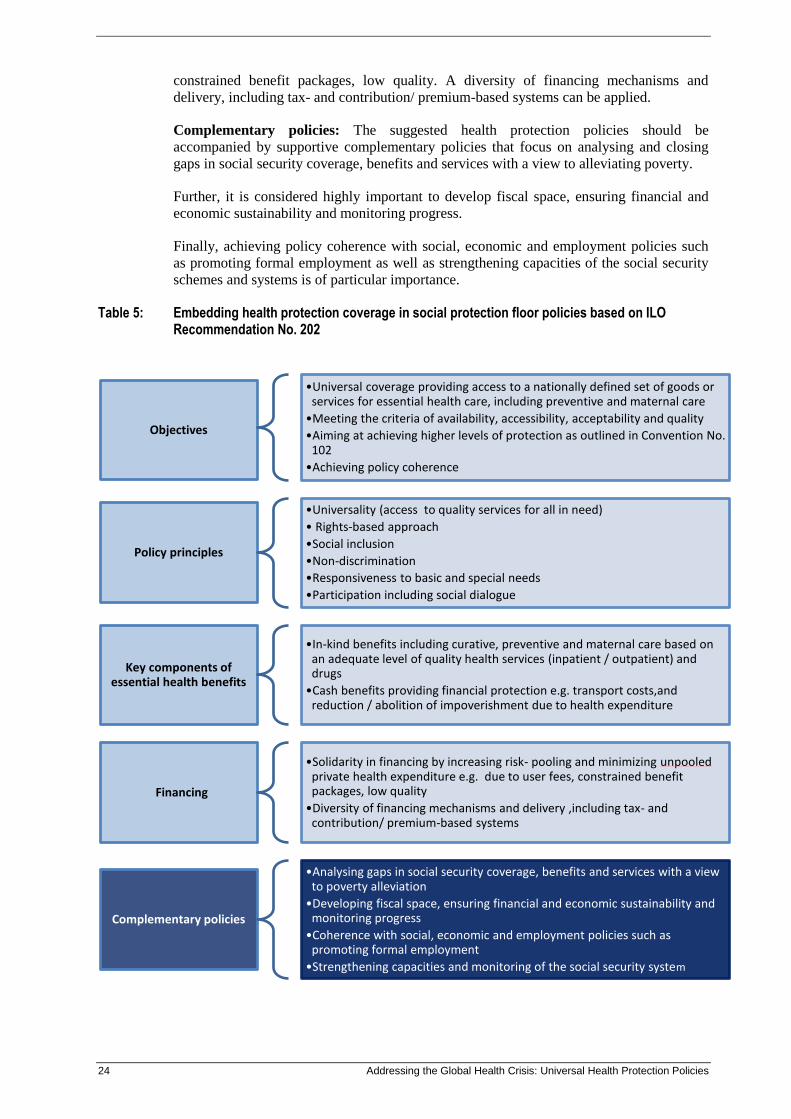
24 Addressing the Global Health Crisis: Universal Health Protection Policies
constrained benefit packages, low quality. A diversity of financing mechanisms and
delivery, including tax- and contribution/ premium-based systems can be applied.
Complementary policies: The suggested health protection policies should be
accompanied by supportive complementary policies that focus on analysing and closing
gaps in social security coverage, benefits and services with a view to alleviating poverty.
Further, it is considered highly important to develop fiscal space, ensuring financial and
economic sustainability and monitoring progress.
Finally, achieving policy coherence with social, economic and employment policies such
as promoting formal employment as well as strengthening capacities of the social security
schemes and systems is of particular importance.
Table 5: Embedding health protection coverage in social protection floor policies based on ILO Recommendation No. 202
Objectives
•Universal coverage providing access to a nationally defined set of goods or services for essential health care, including preventive and maternal care
•Meeting the criteria of availability, accessibility, acceptability and quality
•Aiming at achieving higher levels of protection as outlined in Convention No. 102
•Achieving policy coherence
Policy principles
•Universality (access to quality services for all in need)
• Rights-based approach
•Social inclusion
•Non-discrimination
•Responsiveness to basic and special needs
•Participation including social dialogue
Key components of essential health benefits
•In-kind benefits including curative, preventive and maternal care based on an adequate level of quality health services (inpatient / outpatient) and drugs
•Cash benefits providing financial protection e.g. transport costs,and reduction / abolition of impoverishment due to health expenditure
Financing
•Solidarity in financing by increasing risk- pooling and minimizing unpooled private health expenditure e.g. due to user fees, constrained benefit packages, low quality
•Diversity of financing mechanisms and delivery ,including tax- and contribution/ premium-based systems
Complementary policies
•Analysing gaps in social security coverage, benefits and services with a view to poverty alleviation
•Developing fiscal space, ensuring financial and economic sustainability and monitoring progress
•Coherence with social, economic and employment policies such as promoting formal employment
•Strengthening capacities and monitoring of the social security system
Addressing the Global Health Crisis: Universal Health Protection Policies 25
If well designed and implemented such health protection policies embedded in
national social protection floors can be a catalyst for sustainable development, economic
growth and equity. Scaling up global and national health coverage rates and providing
effective access to necessary health benefits, particularly in low- and middle-income
countries, will end the downward spiral of ill-health and poverty and contribute to more
equitably shared prosperity. Further, in addressing equally the needs for essential health
care and income support, the policies suggested provide ample scope for tackling the root
causes of inequities in access to health care and contributing to universal coverage of
social protection in health. When implementing coherent policies across the social,
economic and health sectors, governments should emphasize poverty alleviation and
labour market policies in order to avoid unintended increase in inequality and to create
economic spill-over effects.
5. Conclusions
Health protection is a human right for everybody. However, the world is facing a
severe health protection crisis. In the absence of health protection, care is often not
accessible, available, affordable or of acceptable quality. This is a tragedy for the 40 per
cent of the global population that is excluded from this right. In low income countries as
much as about 90 per cent of the population is excluded from rights to health protection.
Within countries, those most concerned are living in rural areas.
Further, high shares of OOP increase and deepen poverty, the shortage of skilled
health workers, especially in rural areas, widens the availability and the access gap to
needed health care. All of these barriers to access health care for individuals are at the
same time barriers for sustainable development and economic growth given the impacts on
the workforce, productivity and employment. Given the potential gains in health,
development and economic progress health protection for all is a fundamental for all
countries. Now is the time to progress towards health protection for all and end the
unpreparedness for epidemics like Ebola that kill uncountable people and force the
economies of whole countries to a standstill.
However, closing gaps and deficits will not happen automatically through market
forces or economic growth. Achieving progress towards health protection for all requires
well designed and frequently evaluated policies as well as considering lessons learnt.
Needed is a policy framework that addresses specific issues observed in health protection
but also issues beyond that cause barriers to universal health protection, such as
uncoordinated social and economic policies as most recently experienced with impacts of
austerity policies (ILO 2014).
Progressing towards universal protection in health requires at country level three
important steps:
1. Identify the extent of gaps and deficits in legal coverage, availability and
affordability of services as well as assess the financial deficit that needs to be
closed. This involves assessing access barriers such as fragmentation of coverage
e.g. due to a large number of uncoordinated schemes and systems that might
reduce the positive impacts of risk-pooling and cross-subsidization, and result in
inaccessibility of needed services due to various reasons ranging from poverty to
place of living.
2. Develop an enabling policy framework addressing issues within the health sector
and root causes of these issues beyond the health sector such as poverty, informal
economy and unemployment. Thus, it is necessary to align health protection
policies aiming at universal protection with e.g. economic, labour market and
social policies by focusing on poverty alleviation and income generation.
26 Addressing the Global Health Crisis: Universal Health Protection Policies
3. Implement inclusive legislation in line with fiscal space assessments and closing
gaps in accessibility of health care e.g. due to gaps in financial protection and a
sufficient number of health workers that are trained, recruited, provided with
decent working conditions and distributed in an equitably way across rural and
urban areas. It also requires fair financing mechanisms and adequate benefit
packages in order to be meaningful for the population covered and the economy as
a whole. Closing these gaps would lead to the highest rates of return in terms of
sustainability, economic growth and equity in the world’s poorest countries.
An enabling framework of such policies is provided in ILO Recommendation 202
concerning National Floors of Social Protection. It connects the right to health protection
with the underlying social and economic determinants and addresses these links at the
systemic level, both within and beyond the health sector. Key issues such as the lack of
decent working conditions for the entire workforce or specific sectors are addressed by
focusing on decent working conditions and coordination of social and labour market
policies that aim at poverty alleviation, increasing employment and transforming informal
into formal economies.
Besides technical knowledge it is important that committed governments, social
partners and civil society jointly develop a political vision of health protection for all and
best ways to realize objectives that match the needs of the population in terms of
availability, affordability and quality. Thus, social dialogue is essential when progressing –
whether the issues are of an administrative or managerial nature within a scheme or
system, or result from incoherent policies at the national, regional or community level.
The above policy options have the potential to effectively fight the global health
protection crisis, achieve health protection for all and develop economic returns of
investments – in all countries, and at all levels of national income.
Addressing the Global Health Crisis: Universal Health Protection Policies 27
Bibliography
Asante, A.; Martins, N.; Otim, M.; Dewdney, J. 2014. Retaining doctors in rural
Timor-Leste: A critical appraisal of the opportunities and challenges, in Bulletin of the
World Health Organization, Vol. 92, pp. 277–82.
Busch, K.; Hermann, C.; Hinrichs, K.; Schulten, K. 2013. Euro crisis, austerity
policy and the European social model: How crisis policies in southern Europe threaten the
EU’s social dimension (Berlin, Friedrich Ebert Foundation). Available at:
http://library.fes.de/pdf-files/id/ipa/09656.pdf [16 Apr. 2014].
(EIU) Economist Intelligence Unit. 2014. Out of office: An overview of workplace
absenteeism in Europe (London).
Evans, T.G.; Chowdhury, A.M.R.; Evans, D.B.; Fidler, A.; Lindelow, M.; Mills,
A.; Scheil-Adlung, X. 2012. Thailand’s universal coverage scheme: Achievements and
challenges – An independent assessment of the first 10 years (2001–2010), Synthesis
report (Bangkok, Health Systems Research Institute). Available at:
http://uhcforward.org/sites/uhcforward.org/files/book018.pdf [16 Apr. 2014].
FAO (Food and Agriculture Organization). 2004. Globalization of food systems in
developing countries: Impact on food security and nutrition, FAO Food and Nutrition
Paper No. 83 (Rome). Available at:
http://www.fao.org/docrep/007/y5736e/y5736e00.HTM [16 Apr. 2014].
Global Health Workforce Alliance; WHO (World Health Organization). 2014. A
universal truth: No health without a workforce (Geneva). Available at:
http://www.who.int/workforcealliance/knowledge/resources/hrhreport2013/en/ [16 Apr.
2014].
Hernandez-Pena, P.; Poulier, J.P. et al. 2013. Health worker remuneration in WHO
member States, in World Health Organization Bulletin, Vol. 91, No. 11, pp. 808–15.
ILO (International Labour Office). 2008. Can low-income countries afford basic
social security?, Social Security Policy Briefings (Geneva). Available at:
http://www.ilo.org/gimi/gess/ShowRessource.action?ressource.ressourceId=5951 [16 Apr.
2014].
ILO (International Labour Office). 2009. Protecting people, promoting jobs: A
survey of country employment and social protection policy responses to the global
economic crisis in 54 countries, an ILO report to the G20 Leaders’ Summit, Pittsburgh,
24–25 Sep. (Geneva).
ILO (International Labour Office). 2010a. Extending social security to all: A guide
through challenges and options (Geneva). Available at:
http://www.ilo.org/global/publications/ilobookstore/order-
online/books/WCMS_146616/lang--en/index.htm [16 Apr. 2014].
ILO (International Labour Office). 2010b. Maternity at work: A review of national
legislation. Findings from the ILO Database of Conditions of Work and Employment Laws
(Geneva). Available at:
http://www.ilo.org/global/publications/books/WCMS_124442/lang--en/index.htm [16 Apr.
2014].
ILO (International Labour Office). 2011. Report of the Director-General: A new
era of social justice, Report I(A), International Labour Conference, 100th Session, Geneva,
2011 (Geneva). Available at:
28 Addressing the Global Health Crisis: Universal Health Protection Policies
http://www.ilo.org/ilc/ILCSessions/100thSession/reports/reportssubmitted/
WCMS_155656/lang--en/index.htm [16 Apr. 2014].
ILO (International Labour Office). 2012a. The strategy of the International Labour
Organization. Social security for all: Building social protection floors and comprehensive
social security systems (Geneva). Available at:
http://www.ilo.org/secsoc/informationresources/publications-and-tools/books-and-
reports/WCMS_SECSOC_34188/lang--en/index.htm [16 Apr. 2014].
ILO (International Labour Office). 2012b. China’s latest revolution: Basic health
care for all, 3 Sep. Available at: http://www.ilo.org/global/about-the-
ilo/newsroom/features/WCMS_188582/lang--en/index.htm [16 Apr. 2014].
ILO (International Labour Office); World Bank; DfID (UK Department for
International Development); UNICEF (United Nations Children’s Fund); ISSA
(International Social Security Association); ODI (Overseas Development Institute);
International Policy Center for Inclusive Growth; HelpAge International. 2013. Joint
proposal on international social protection data harmonisation, input to 3rd meeting of the
Social Protection Inter-Agency Cooperation Board (SPIAC-B) (Geneva and Washington,
DC). Available at: http://www.ilo.org/newyork/issues-at-work/social-protection/social-
protection-interagency-cooperation-board/third-meeting/WCMS_227154/lang--
en/index.htm [16 Apr. 2014].
ILO (International Labour Office). 2014a. Employment policies for sustainable
recovery and development: Recurrent discussion under the ILO Declaration on Social
Justice for a Fair Globalization, Report VI, International Labour Conference, 103rd
Session, Geneva, 2014 (Geneva). Available at: http://www.ilo.org/wcmsp5/groups/public/-
--ed_norm/---relconf/documents/meetingdocument/wcms_240032.pdf [16 Apr. 2014].
ILO (International Labour Office). 2014b. Maternity and paternity at work: Law
and practice across the world (Geneva).
ILO (International Labour Office). 2014c. World Social Protection Report
2014/15: Building economic recovery, inclusive development and social justice (Geneva).
Available at:http://www.ilo.org/global/research/global-reports/world-social-security-
report/2014/lang--en/index.htm [16 Sep. 2014].
ILO (International Labour Office). 2015. Forthcoming. Gaps in rural health
protection. (Geneva)
Kentikelenis, A.; Karanikolos, M.; Papanicolas, I.; Basu, S.; McKee, M.; Stuckler,
D. 2011. Health effects of financial crisis: Omens of a Greek tragedy, in The Lancet, Vol.
378, Issue No. 9801, pp. 1457–58. Available at:
http://www.thelancet.com/journals/lancet/article/PIIS0140-6736(11)61556-0/fulltext [16
Apr. 2014].
OECD (Organisation for Economic Co-operation and Development). 2013.
International Migration Outlook 2013 (Paris). Available at:
http://www.oecd.org/els/mig/imo2013.htm [20 Apr. 2014].
OECD (Organisation for Economic Co-operation and Development). 2014. Health
Statistics database. Available at:
http://stats.oecd.org/index.aspx?DataSetCode=HEALTH_STAT [20 Apr. 2014].
Ortiz, I.; Cummins, M. 2013. The age of austerity: A review of public
expenditures and adjustment measures in 181 countries, Working Paper (New York and
Geneva, Initiative for Policy Dialogue and the South Centre). Available at:
Addressing the Global Health Crisis: Universal Health Protection Policies 29
http://policydialogue.org/files/publications/Age_of_Austerity_Ortiz_and_Cummins.pdf
[20 Apr. 2014].
Scheil-Adlung, X.; Sandner, L. 2010. Paid sick leave: Incidence, patterns and
expenditure in times of crises, Extension of Social Security ESS Paper No. 27 (Geneva,
ILO). Available at: http://www.ilo.org/secsoc/information-resources/publications-and-
tools/Workingpapers/WCMS_207675/lang--en/index.htm [20 Apr. 2014].
Scheil-Adlung, X.; Bonnet, F. 2011. Beyond legal coverage: Assessing the
performance of social health protection, in International Social Security Review, Vol. 64,
No. 3, pp. 21–38.
Scheil-Adlung, X.; Kuhl, C. 2012. Evidence on gender inequities in social health
protection: The case of women living in rural areas, Extension of Social Security ESS
Paper No. 29 (Geneva). Available at: http://www.social-
protection.org/gimi/gess/ShowRessource.action?ressource.ressourceId=28986 [20 Apr.
2014].
SSA (Social Security Administration of the United States); ISSA (International
Social Security Association). 2012a. Social security programs throughout the world: The
Americas, 2011 (Washington, DC and Geneva). Available at:
http://www.socialsecurity.gov/policy/docs/progdesc/ssptw/2010-2011/americas/index.html
[20 Apr. 2014].
SSA (Social Security Administration of the United States); ISSA (International
Social Security Association). 2012b. Social security programs throughout the world:
Europe, 2012 (Washington, DC and Geneva). Available at:
http://www.ssa.gov/policy/docs/progdesc/ssptw/2012-2013/europe/ [20 Apr. 2014].
SSA (Social Security Administration of the United States); ISSA (International
Social Security Association). 2013a. Social security programs throughout the world: Asia
and Pacific, 2012 (Washington, DC and Geneva ). Available at:
http://www.ssa.gov/policy/docs/progdesc/ssptw/2012-2013/asia/china.html [20 Apr. 2014].
SSA (Social Security Administration of the United States); ISSA (International
Social Security Association). 2013b. Social security programs throughout the World:
Africa, 2013 (Washington, DC and Geneva). Available at:
http://www.socialsecurity.gov/policy/docs/progdesc/ssptw/2012-2013/africa/index.html
[20 Apr. 2014].
UN ECLAC (United Nations Economic Commission for Latin America and the
Caribbean). 2014. Conditional Cash Transfer Programmes database: Non-contributory
social protection programmes in Latin America and the Caribbean database. Available at:
http://dds.cepal.org/bdptc/en/ [20 Apr. 2014].
UN (United Nations). 2012a. World Population Prospects, 2012 Revision.
Available at: http://esa.un.org/wpp/ [20 Apr. 2014].
UN (United Nations). 2012b. Global health and foreign policy, Resolution adopted
by the UN General Assembly, 67th Session, New York, 12 Dec. Available at:
http://www.un.org/ga/search/view_doc.asp?symbol=A/67/L.36 [20 Apr. 2014].
UNICEF (United Nations Children’s Fund). 2010. Protecting salaries of frontline
teachers and health workers, Social and Economic Policy Working Brief (New York).
Available at:
http://www.unicef.org/socialpolicy/files/Protecting_Salaries_of_Frontline_Teachers_and_
Healthcare_Workers_final%281%29.pdf [20 Apr. 2014].
30 Addressing the Global Health Crisis: Universal Health Protection Policies
WHO (World Health Organization). 2011. Sustainable health financing structures
and universal coverage, Resolution No. WH64.9 adopted by 64th World Health Assembly
(Geneva).
WHO (World Health Organization). 2012. Spending on health: A global overview,
Fact sheet No. 319 (Geneva).
WHO (World Health Organization). 2014a. Global Health Observatory. Available
at http://apps.who.int/ghodata/ [20 Apr. 2014].
WHO (World Health Organization). 2014b. National Health Accounts. Available
at: http://www.who.int/health-accounts/en/ [20 Apr. 2014] .
The World Bank. 2014. World Development Indicators. Available at:
http://data.worldbank.org/data-catalog/world-development-indicators [20 Apr. 2014].
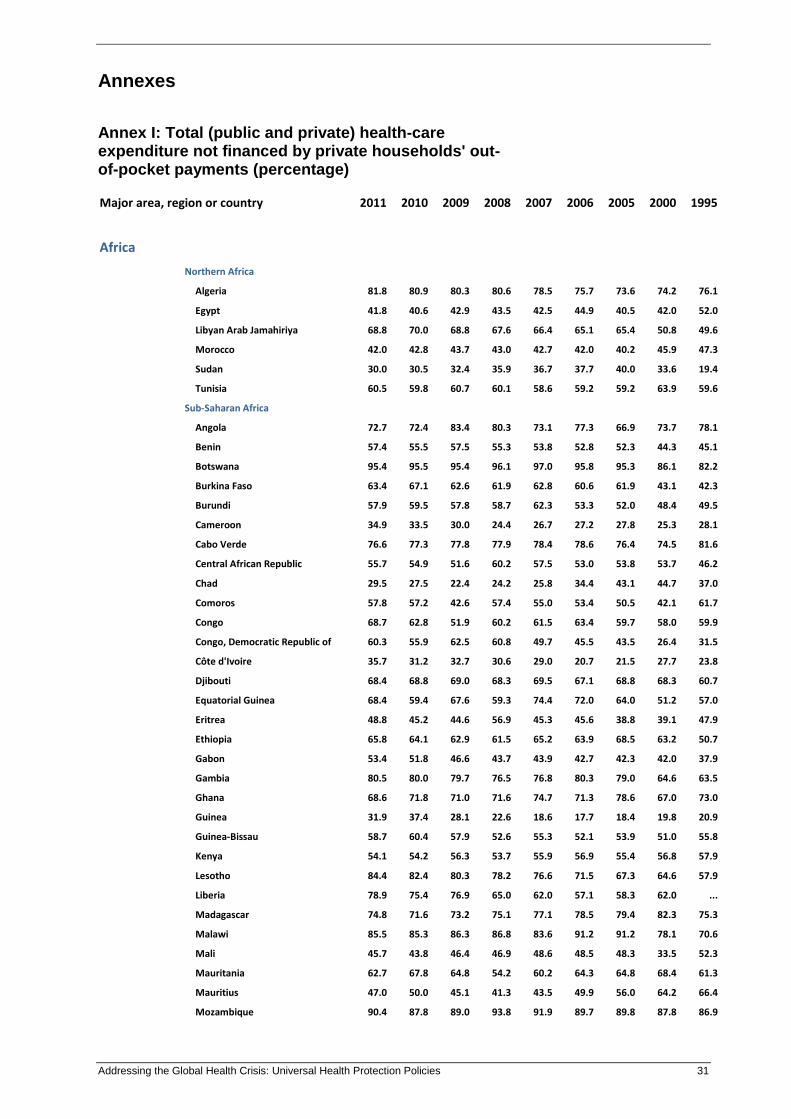
Addressing the Global Health Crisis: Universal Health Protection Policies 31
Annexes
Annex I: Total (public and private) health-care expenditure not financed by private households' out-of-pocket payments (percentage)
Major area, region or country 2011 2010 2009 2008 2007 2006 2005 2000 1995
Africa
Northern Africa
Algeria 81.8 80.9 80.3 80.6 78.5 75.7 73.6 74.2 76.1
Egypt 41.8 40.6 42.9 43.5 42.5 44.9 40.5 42.0 52.0
Libyan Arab Jamahiriya 68.8 70.0 68.8 67.6 66.4 65.1 65.4 50.8 49.6
Morocco 42.0 42.8 43.7 43.0 42.7 42.0 40.2 45.9 47.3
Sudan 30.0 30.5 32.4 35.9 36.7 37.7 40.0 33.6 19.4
Tunisia 60.5 59.8 60.7 60.1 58.6 59.2 59.2 63.9 59.6
Sub-Saharan Africa
Angola 72.7 72.4 83.4 80.3 73.1 77.3 66.9 73.7 78.1
Benin 57.4 55.5 57.5 55.3 53.8 52.8 52.3 44.3 45.1
Botswana 95.4 95.5 95.4 96.1 97.0 95.8 95.3 86.1 82.2
Burkina Faso 63.4 67.1 62.6 61.9 62.8 60.6 61.9 43.1 42.3
Burundi 57.9 59.5 57.8 58.7 62.3 53.3 52.0 48.4 49.5
Cameroon 34.9 33.5 30.0 24.4 26.7 27.2 27.8 25.3 28.1
Cabo Verde 76.6 77.3 77.8 77.9 78.4 78.6 76.4 74.5 81.6
Central African Republic 55.7 54.9 51.6 60.2 57.5 53.0 53.8 53.7 46.2
Chad 29.5 27.5 22.4 24.2 25.8 34.4 43.1 44.7 37.0
Comoros 57.8 57.2 42.6 57.4 55.0 53.4 50.5 42.1 61.7
Congo 68.7 62.8 51.9 60.2 61.5 63.4 59.7 58.0 59.9
Congo, Democratic Republic of 60.3 55.9 62.5 60.8 49.7 45.5 43.5 26.4 31.5
Côte d'Ivoire 35.7 31.2 32.7 30.6 29.0 20.7 21.5 27.7 23.8
Djibouti 68.4 68.8 69.0 68.3 69.5 67.1 68.8 68.3 60.7
Equatorial Guinea 68.4 59.4 67.6 59.3 74.4 72.0 64.0 51.2 57.0
Eritrea 48.8 45.2 44.6 56.9 45.3 45.6 38.8 39.1 47.9
Ethiopia 65.8 64.1 62.9 61.5 65.2 63.9 68.5 63.2 50.7
Gabon 53.4 51.8 46.6 43.7 43.9 42.7 42.3 42.0 37.9
Gambia 80.5 80.0 79.7 76.5 76.8 80.3 79.0 64.6 63.5
Ghana 68.6 71.8 71.0 71.6 74.7 71.3 78.6 67.0 73.0
Guinea 31.9 37.4 28.1 22.6 18.6 17.7 18.4 19.8 20.9
Guinea-Bissau 58.7 60.4 57.9 52.6 55.3 52.1 53.9 51.0 55.8
Kenya 54.1 54.2 56.3 53.7 55.9 56.9 55.4 56.8 57.9
Lesotho 84.4 82.4 80.3 78.2 76.6 71.5 67.3 64.6 57.9
Liberia 78.9 75.4 76.9 65.0 62.0 57.1 58.3 62.0 ...
Madagascar 74.8 71.6 73.2 75.1 77.1 78.5 79.4 82.3 75.3
Malawi 85.5 85.3 86.3 86.8 83.6 91.2 91.2 78.1 70.6
Mali 45.7 43.8 46.4 46.9 48.6 48.5 48.3 33.5 52.3
Mauritania 62.7 67.8 64.8 54.2 60.2 64.3 64.8 68.4 61.3
Mauritius 47.0 50.0 45.1 41.3 43.5 49.9 56.0 64.2 66.4
Mozambique 90.4 87.8 89.0 93.8 91.9 89.7 89.8 87.8 86.9
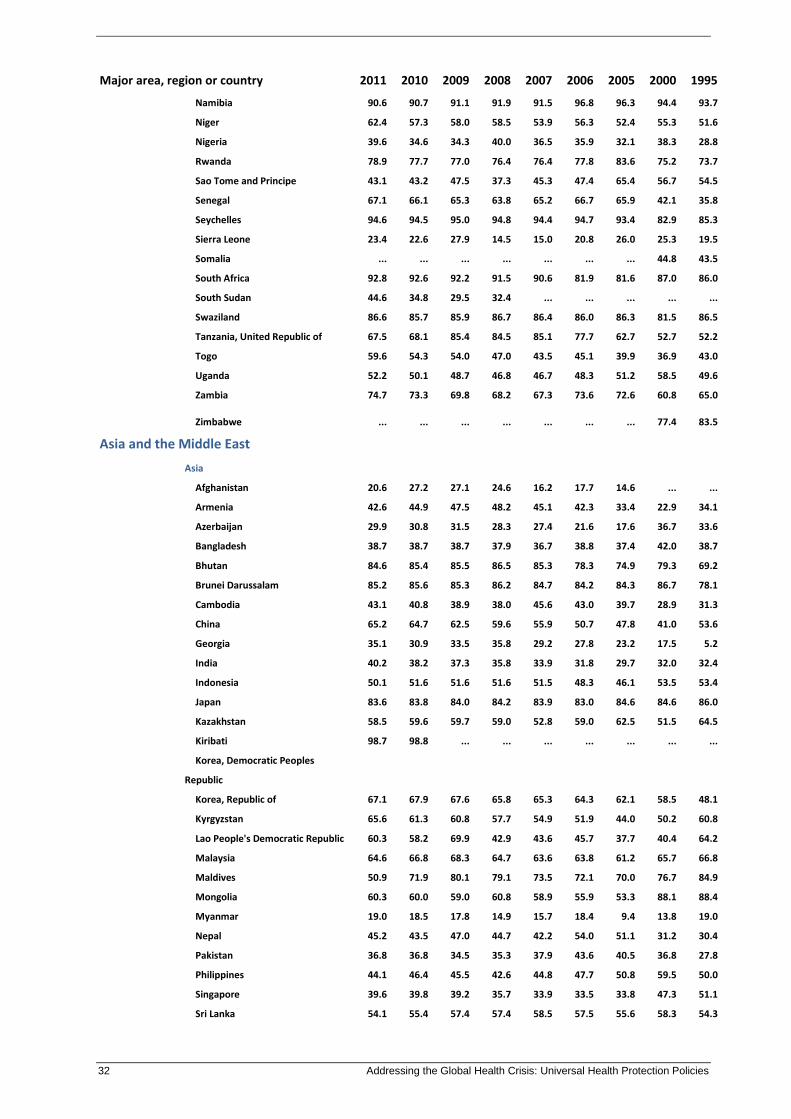
32 Addressing the Global Health Crisis: Universal Health Protection Policies
Major area, region or country 2011 2010 2009 2008 2007 2006 2005 2000 1995
Namibia 90.6 90.7 91.1 91.9 91.5 96.8 96.3 94.4 93.7
Niger 62.4 57.3 58.0 58.5 53.9 56.3 52.4 55.3 51.6
Nigeria 39.6 34.6 34.3 40.0 36.5 35.9 32.1 38.3 28.8
Rwanda 78.9 77.7 77.0 76.4 76.4 77.8 83.6 75.2 73.7
Sao Tome and Principe 43.1 43.2 47.5 37.3 45.3 47.4 65.4 56.7 54.5
Senegal 67.1 66.1 65.3 63.8 65.2 66.7 65.9 42.1 35.8
Seychelles 94.6 94.5 95.0 94.8 94.4 94.7 93.4 82.9 85.3
Sierra Leone 23.4 22.6 27.9 14.5 15.0 20.8 26.0 25.3 19.5
Somalia ... ... ... ... ... ... ... 44.8 43.5
South Africa 92.8 92.6 92.2 91.5 90.6 81.9 81.6 87.0 86.0
South Sudan 44.6 34.8 29.5 32.4 ... ... ... ... ...
Swaziland 86.6 85.7 85.9 86.7 86.4 86.0 86.3 81.5 86.5
Tanzania, United Republic of 67.5 68.1 85.4 84.5 85.1 77.7 62.7 52.7 52.2
Togo 59.6 54.3 54.0 47.0 43.5 45.1 39.9 36.9 43.0
Uganda 52.2 50.1 48.7 46.8 46.7 48.3 51.2 58.5 49.6
Zambia 74.7 73.3 69.8 68.2 67.3 73.6 72.6 60.8 65.0
Zimbabwe ... ... ... ... ... ... ... 77.4 83.5
Asia and the Middle East
Asia
Afghanistan 20.6 27.2 27.1 24.6 16.2 17.7 14.6 ... ...
Armenia 42.6 44.9 47.5 48.2 45.1 42.3 33.4 22.9 34.1
Azerbaijan 29.9 30.8 31.5 28.3 27.4 21.6 17.6 36.7 33.6
Bangladesh 38.7 38.7 38.7 37.9 36.7 38.8 37.4 42.0 38.7
Bhutan 84.6 85.4 85.5 86.5 85.3 78.3 74.9 79.3 69.2
Brunei Darussalam 85.2 85.6 85.3 86.2 84.7 84.2 84.3 86.7 78.1
Cambodia 43.1 40.8 38.9 38.0 45.6 43.0 39.7 28.9 31.3
China 65.2 64.7 62.5 59.6 55.9 50.7 47.8 41.0 53.6
Georgia 35.1 30.9 33.5 35.8 29.2 27.8 23.2 17.5 5.2
India 40.2 38.2 37.3 35.8 33.9 31.8 29.7 32.0 32.4
Indonesia 50.1 51.6 51.6 51.6 51.5 48.3 46.1 53.5 53.4
Japan 83.6 83.8 84.0 84.2 83.9 83.0 84.6 84.6 86.0
Kazakhstan 58.5 59.6 59.7 59.0 52.8 59.0 62.5 51.5 64.5
Kiribati 98.7 98.8 ... ... ... ... ... ... ...
Korea, Democratic Peoples
Republic
Korea, Republic of 67.1 67.9 67.6 65.8 65.3 64.3 62.1 58.5 48.1
Kyrgyzstan 65.6 61.3 60.8 57.7 54.9 51.9 44.0 50.2 60.8
Lao People's Democratic Republic 60.3 58.2 69.9 42.9 43.6 45.7 37.7 40.4 64.2
Malaysia 64.6 66.8 68.3 64.7 63.6 63.8 61.2 65.7 66.8
Maldives 50.9 71.9 80.1 79.1 73.5 72.1 70.0 76.7 84.9
Mongolia 60.3 60.0 59.0 60.8 58.9 55.9 53.3 88.1 88.4
Myanmar 19.0 18.5 17.8 14.9 15.7 18.4 9.4 13.8 19.0
Nepal 45.2 43.5 47.0 44.7 42.2 54.0 51.1 31.2 30.4
Pakistan 36.8 36.8 34.5 35.3 37.9 43.6 40.5 36.8 27.8
Philippines 44.1 46.4 45.5 42.6 44.8 47.7 50.8 59.5 50.0
Singapore 39.6 39.8 39.2 35.7 33.9 33.5 33.8 47.3 51.1
Sri Lanka 54.1 55.4 57.4 57.4 58.5 57.5 55.6 58.3 54.3
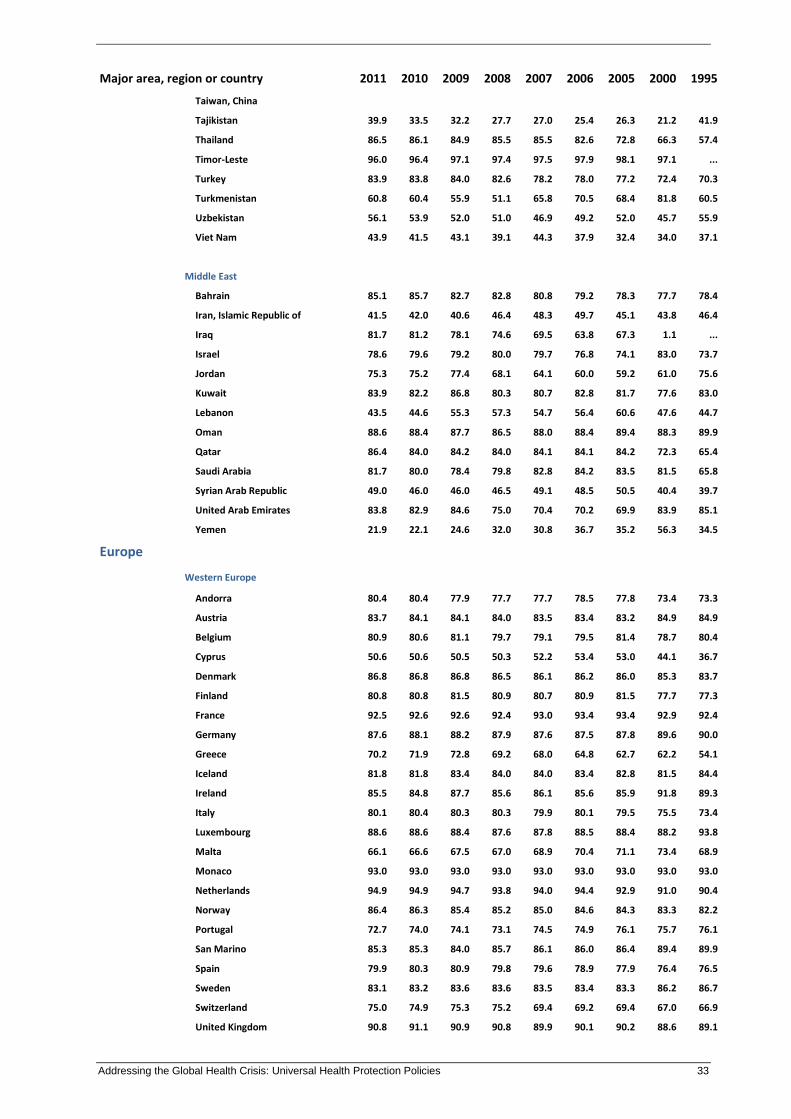
Addressing the Global Health Crisis: Universal Health Protection Policies 33
Major area, region or country 2011 2010 2009 2008 2007 2006 2005 2000 1995
Taiwan, China
Tajikistan 39.9 33.5 32.2 27.7 27.0 25.4 26.3 21.2 41.9
Thailand 86.5 86.1 84.9 85.5 85.5 82.6 72.8 66.3 57.4
Timor-Leste 96.0 96.4 97.1 97.4 97.5 97.9 98.1 97.1 ...
Turkey 83.9 83.8 84.0 82.6 78.2 78.0 77.2 72.4 70.3
Turkmenistan 60.8 60.4 55.9 51.1 65.8 70.5 68.4 81.8 60.5
Uzbekistan 56.1 53.9 52.0 51.0 46.9 49.2 52.0 45.7 55.9
Viet Nam 43.9 41.5 43.1 39.1 44.3 37.9 32.4 34.0 37.1
Middle East
Bahrain 85.1 85.7 82.7 82.8 80.8 79.2 78.3 77.7 78.4
Iran, Islamic Republic of 41.5 42.0 40.6 46.4 48.3 49.7 45.1 43.8 46.4
Iraq 81.7 81.2 78.1 74.6 69.5 63.8 67.3 1.1 ...
Israel 78.6 79.6 79.2 80.0 79.7 76.8 74.1 83.0 73.7
Jordan 75.3 75.2 77.4 68.1 64.1 60.0 59.2 61.0 75.6
Kuwait 83.9 82.2 86.8 80.3 80.7 82.8 81.7 77.6 83.0
Lebanon 43.5 44.6 55.3 57.3 54.7 56.4 60.6 47.6 44.7
Oman 88.6 88.4 87.7 86.5 88.0 88.4 89.4 88.3 89.9
Qatar 86.4 84.0 84.2 84.0 84.1 84.1 84.2 72.3 65.4
Saudi Arabia 81.7 80.0 78.4 79.8 82.8 84.2 83.5 81.5 65.8
Syrian Arab Republic 49.0 46.0 46.0 46.5 49.1 48.5 50.5 40.4 39.7
United Arab Emirates 83.8 82.9 84.6 75.0 70.4 70.2 69.9 83.9 85.1
Yemen 21.9 22.1 24.6 32.0 30.8 36.7 35.2 56.3 34.5
Europe
Western Europe
Andorra 80.4 80.4 77.9 77.7 77.7 78.5 77.8 73.4 73.3
Austria 83.7 84.1 84.1 84.0 83.5 83.4 83.2 84.9 84.9
Belgium 80.9 80.6 81.1 79.7 79.1 79.5 81.4 78.7 80.4
Cyprus 50.6 50.6 50.5 50.3 52.2 53.4 53.0 44.1 36.7
Denmark 86.8 86.8 86.8 86.5 86.1 86.2 86.0 85.3 83.7
Finland 80.8 80.8 81.5 80.9 80.7 80.9 81.5 77.7 77.3
France 92.5 92.6 92.6 92.4 93.0 93.4 93.4 92.9 92.4
Germany 87.6 88.1 88.2 87.9 87.6 87.5 87.8 89.6 90.0
Greece 70.2 71.9 72.8 69.2 68.0 64.8 62.7 62.2 54.1
Iceland 81.8 81.8 83.4 84.0 84.0 83.4 82.8 81.5 84.4
Ireland 85.5 84.8 87.7 85.6 86.1 85.6 85.9 91.8 89.3
Italy 80.1 80.4 80.3 80.3 79.9 80.1 79.5 75.5 73.4
Luxembourg 88.6 88.6 88.4 87.6 87.8 88.5 88.4 88.2 93.8
Malta 66.1 66.6 67.5 67.0 68.9 70.4 71.1 73.4 68.9
Monaco 93.0 93.0 93.0 93.0 93.0 93.0 93.0 93.0 93.0
Netherlands 94.9 94.9 94.7 93.8 94.0 94.4 92.9 91.0 90.4
Norway 86.4 86.3 85.4 85.2 85.0 84.6 84.3 83.3 82.2
Portugal 72.7 74.0 74.1 73.1 74.5 74.9 76.1 75.7 76.1
San Marino 85.3 85.3 84.0 85.7 86.1 86.0 86.4 89.4 89.9
Spain 79.9 80.3 80.9 79.8 79.6 78.9 77.9 76.4 76.5
Sweden 83.1 83.2 83.6 83.6 83.5 83.4 83.3 86.2 86.7
Switzerland 75.0 74.9 75.3 75.2 69.4 69.2 69.4 67.0 66.9
United Kingdom 90.8 91.1 90.9 90.8 89.9 90.1 90.2 88.6 89.1
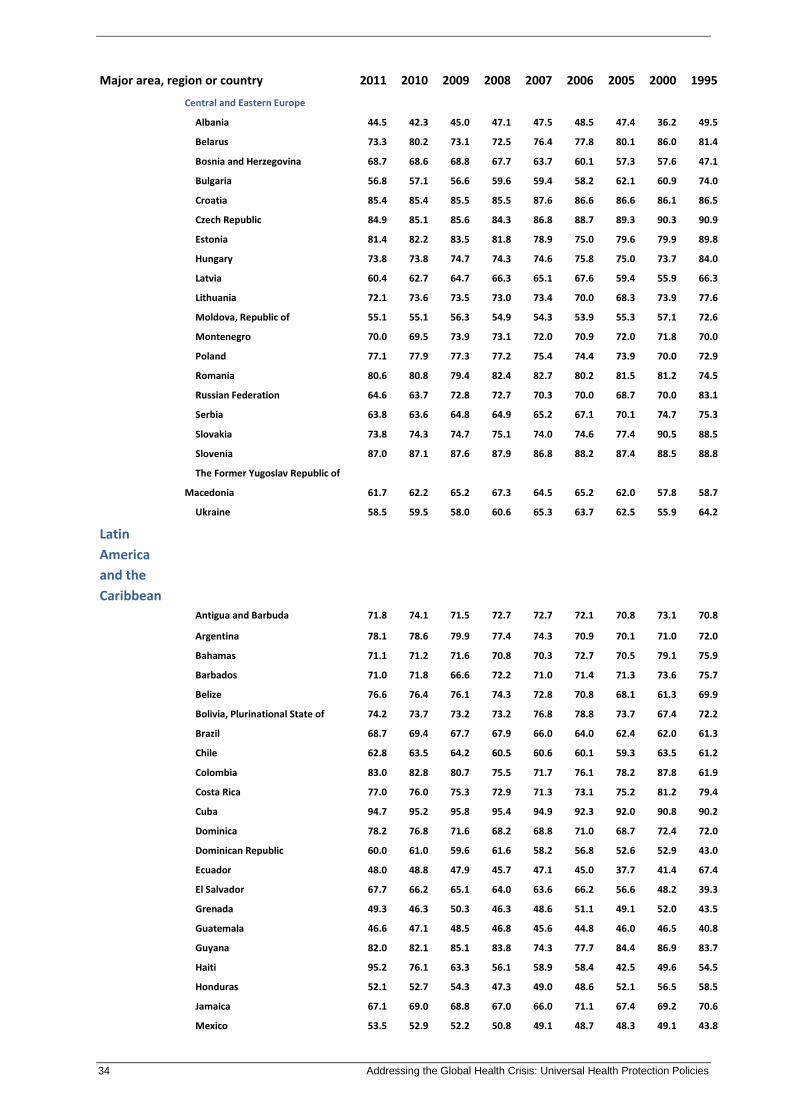
34 Addressing the Global Health Crisis: Universal Health Protection Policies
Major area, region or country 2011 2010 2009 2008 2007 2006 2005 2000 1995
Central and Eastern Europe
Albania 44.5 42.3 45.0 47.1 47.5 48.5 47.4 36.2 49.5
Belarus 73.3 80.2 73.1 72.5 76.4 77.8 80.1 86.0 81.4
Bosnia and Herzegovina 68.7 68.6 68.8 67.7 63.7 60.1 57.3 57.6 47.1
Bulgaria 56.8 57.1 56.6 59.6 59.4 58.2 62.1 60.9 74.0
Croatia 85.4 85.4 85.5 85.5 87.6 86.6 86.6 86.1 86.5
Czech Republic 84.9 85.1 85.6 84.3 86.8 88.7 89.3 90.3 90.9
Estonia 81.4 82.2 83.5 81.8 78.9 75.0 79.6 79.9 89.8
Hungary 73.8 73.8 74.7 74.3 74.6 75.8 75.0 73.7 84.0
Latvia 60.4 62.7 64.7 66.3 65.1 67.6 59.4 55.9 66.3
Lithuania 72.1 73.6 73.5 73.0 73.4 70.0 68.3 73.9 77.6
Moldova, Republic of 55.1 55.1 56.3 54.9 54.3 53.9 55.3 57.1 72.6
Montenegro 70.0 69.5 73.9 73.1 72.0 70.9 72.0 71.8 70.0
Poland 77.1 77.9 77.3 77.2 75.4 74.4 73.9 70.0 72.9
Romania 80.6 80.8 79.4 82.4 82.7 80.2 81.5 81.2 74.5
Russian Federation 64.6 63.7 72.8 72.7 70.3 70.0 68.7 70.0 83.1
Serbia 63.8 63.6 64.8 64.9 65.2 67.1 70.1 74.7 75.3
Slovakia 73.8 74.3 74.7 75.1 74.0 74.6 77.4 90.5 88.5
Slovenia 87.0 87.1 87.6 87.9 86.8 88.2 87.4 88.5 88.8
The Former Yugoslav Republic of
Macedonia 61.7 62.2 65.2 67.3 64.5 65.2 62.0 57.8 58.7
Ukraine 58.5 59.5 58.0 60.6 65.3 63.7 62.5 55.9 64.2
Latin
America
and the
Caribbean
Antigua and Barbuda 71.8 74.1 71.5 72.7 72.7 72.1 70.8 73.1 70.8
Argentina 78.1 78.6 79.9 77.4 74.3 70.9 70.1 71.0 72.0
Bahamas 71.1 71.2 71.6 70.8 70.3 72.7 70.5 79.1 75.9
Barbados 71.0 71.8 66.6 72.2 71.0 71.4 71.3 73.6 75.7
Belize 76.6 76.4 76.1 74.3 72.8 70.8 68.1 61.3 69.9
Bolivia, Plurinational State of 74.2 73.7 73.2 73.2 76.8 78.8 73.7 67.4 72.2
Brazil 68.7 69.4 67.7 67.9 66.0 64.0 62.4 62.0 61.3
Chile 62.8 63.5 64.2 60.5 60.6 60.1 59.3 63.5 61.2
Colombia 83.0 82.8 80.7 75.5 71.7 76.1 78.2 87.8 61.9
Costa Rica 77.0 76.0 75.3 72.9 71.3 73.1 75.2 81.2 79.4
Cuba 94.7 95.2 95.8 95.4 94.9 92.3 92.0 90.8 90.2
Dominica 78.2 76.8 71.6 68.2 68.8 71.0 68.7 72.4 72.0
Dominican Republic 60.0 61.0 59.6 61.6 58.2 56.8 52.6 52.9 43.0
Ecuador 48.0 48.8 47.9 45.7 47.1 45.0 37.7 41.4 67.4
El Salvador 67.7 66.2 65.1 64.0 63.6 66.2 56.6 48.2 39.3
Grenada 49.3 46.3 50.3 46.3 48.6 51.1 49.1 52.0 43.5
Guatemala 46.6 47.1 48.5 46.8 45.6 44.8 46.0 46.5 40.8
Guyana 82.0 82.1 85.1 83.8 74.3 77.7 84.4 86.9 83.7
Haiti 95.2 76.1 63.3 56.1 58.9 58.4 42.5 49.6 54.5
Honduras 52.1 52.7 54.3 47.3 49.0 48.6 52.1 56.5 58.5
Jamaica 67.1 69.0 68.8 67.0 66.0 71.1 67.4 69.2 70.6
Mexico 53.5 52.9 52.2 50.8 49.1 48.7 48.3 49.1 43.8
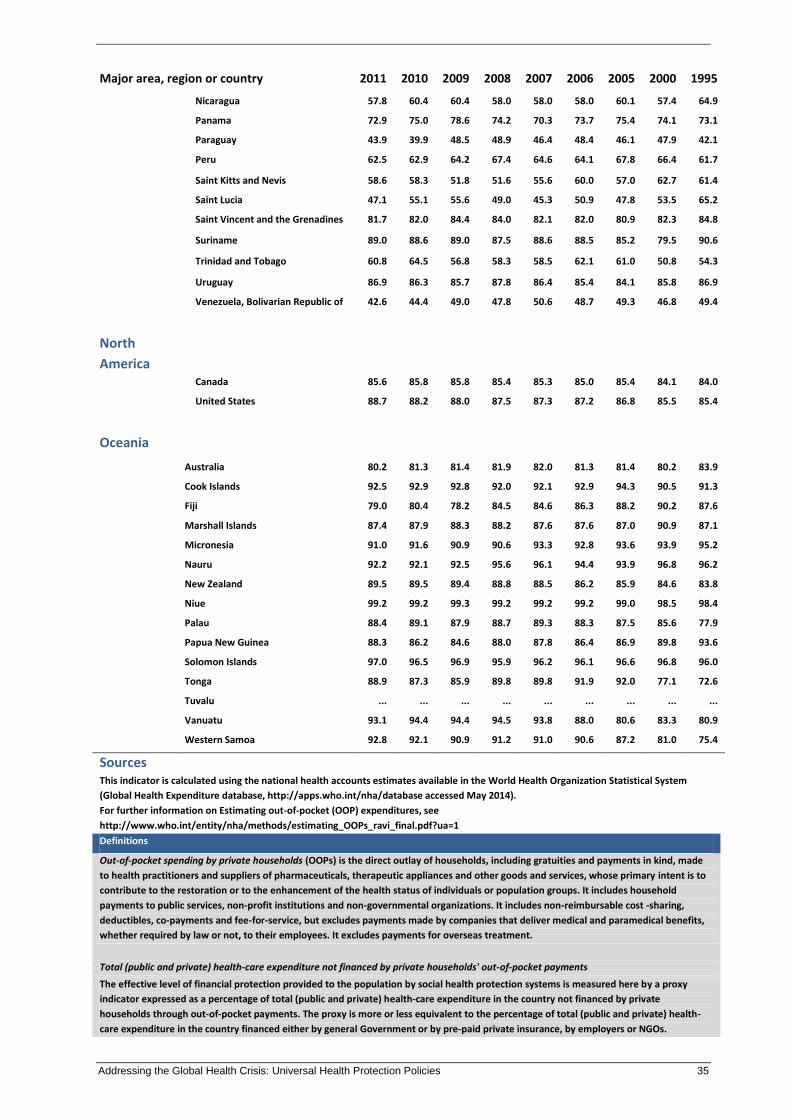
Addressing the Global Health Crisis: Universal Health Protection Policies 35
Major area, region or country 2011 2010 2009 2008 2007 2006 2005 2000 1995
Nicaragua 57.8 60.4 60.4 58.0 58.0 58.0 60.1 57.4 64.9
Panama 72.9 75.0 78.6 74.2 70.3 73.7 75.4 74.1 73.1
Paraguay 43.9 39.9 48.5 48.9 46.4 48.4 46.1 47.9 42.1
Peru 62.5 62.9 64.2 67.4 64.6 64.1 67.8 66.4 61.7
Saint Kitts and Nevis 58.6 58.3 51.8 51.6 55.6 60.0 57.0 62.7 61.4
Saint Lucia 47.1 55.1 55.6 49.0 45.3 50.9 47.8 53.5 65.2
Saint Vincent and the Grenadines 81.7 82.0 84.4 84.0 82.1 82.0 80.9 82.3 84.8
Suriname 89.0 88.6 89.0 87.5 88.6 88.5 85.2 79.5 90.6
Trinidad and Tobago 60.8 64.5 56.8 58.3 58.5 62.1 61.0 50.8 54.3
Uruguay 86.9 86.3 85.7 87.8 86.4 85.4 84.1 85.8 86.9
Venezuela, Bolivarian Republic of 42.6 44.4 49.0 47.8 50.6 48.7 49.3 46.8 49.4
North
America
Canada 85.6 85.8 85.8 85.4 85.3 85.0 85.4 84.1 84.0
United States 88.7 88.2 88.0 87.5 87.3 87.2 86.8 85.5 85.4
Oceania
Australia 80.2 81.3 81.4 81.9 82.0 81.3 81.4 80.2 83.9
Cook Islands 92.5 92.9 92.8 92.0 92.1 92.9 94.3 90.5 91.3
Fiji 79.0 80.4 78.2 84.5 84.6 86.3 88.2 90.2 87.6
Marshall Islands 87.4 87.9 88.3 88.2 87.6 87.6 87.0 90.9 87.1
Micronesia 91.0 91.6 90.9 90.6 93.3 92.8 93.6 93.9 95.2
Nauru 92.2 92.1 92.5 95.6 96.1 94.4 93.9 96.8 96.2
New Zealand 89.5 89.5 89.4 88.8 88.5 86.2 85.9 84.6 83.8
Niue 99.2 99.2 99.3 99.2 99.2 99.2 99.0 98.5 98.4
Palau 88.4 89.1 87.9 88.7 89.3 88.3 87.5 85.6 77.9
Papua New Guinea 88.3 86.2 84.6 88.0 87.8 86.4 86.9 89.8 93.6
Solomon Islands 97.0 96.5 96.9 95.9 96.2 96.1 96.6 96.8 96.0
Tonga 88.9 87.3 85.9 89.8 89.8 91.9 92.0 77.1 72.6
Tuvalu ... ... ... ... ... ... ... ... ...
Vanuatu 93.1 94.4 94.4 94.5 93.8 88.0 80.6 83.3 80.9
Western Samoa 92.8 92.1 90.9 91.2 91.0 90.6 87.2 81.0 75.4
Sources This indicator is calculated using the national health accounts estimates available in the World Health Organization Statistical System
(Global Health Expenditure database, http://apps.who.int/nha/database accessed May 2014).
For further information on Estimating out-of-pocket (OOP) expenditures, see
http://www.who.int/entity/nha/methods/estimating_OOPs_ravi_final.pdf?ua=1
Definitions
Out-of-pocket spending by private households (OOPs) is the direct outlay of households, including gratuities and payments in kind, made
to health practitioners and suppliers of pharmaceuticals, therapeutic appliances and other goods and services, whose primary intent is to
contribute to the restoration or to the enhancement of the health status of individuals or population groups. It includes household
payments to public services, non-profit institutions and non-governmental organizations. It includes non-reimbursable cost -sharing,
deductibles, co-payments and fee-for-service, but excludes payments made by companies that deliver medical and paramedical benefits,
whether required by law or not, to their employees. It excludes payments for overseas treatment.
Total (public and private) health-care expenditure not financed by private households' out-of-pocket payments
The effective level of financial protection provided to the population by social health protection systems is measured here by a proxy
indicator expressed as a percentage of total (public and private) health-care expenditure in the country not financed by private
households through out-of-pocket payments. The proxy is more or less equivalent to the percentage of total (public and private) health-
care expenditure in the country financed either by general Government or by pre-paid private insurance, by employers or NGOs.
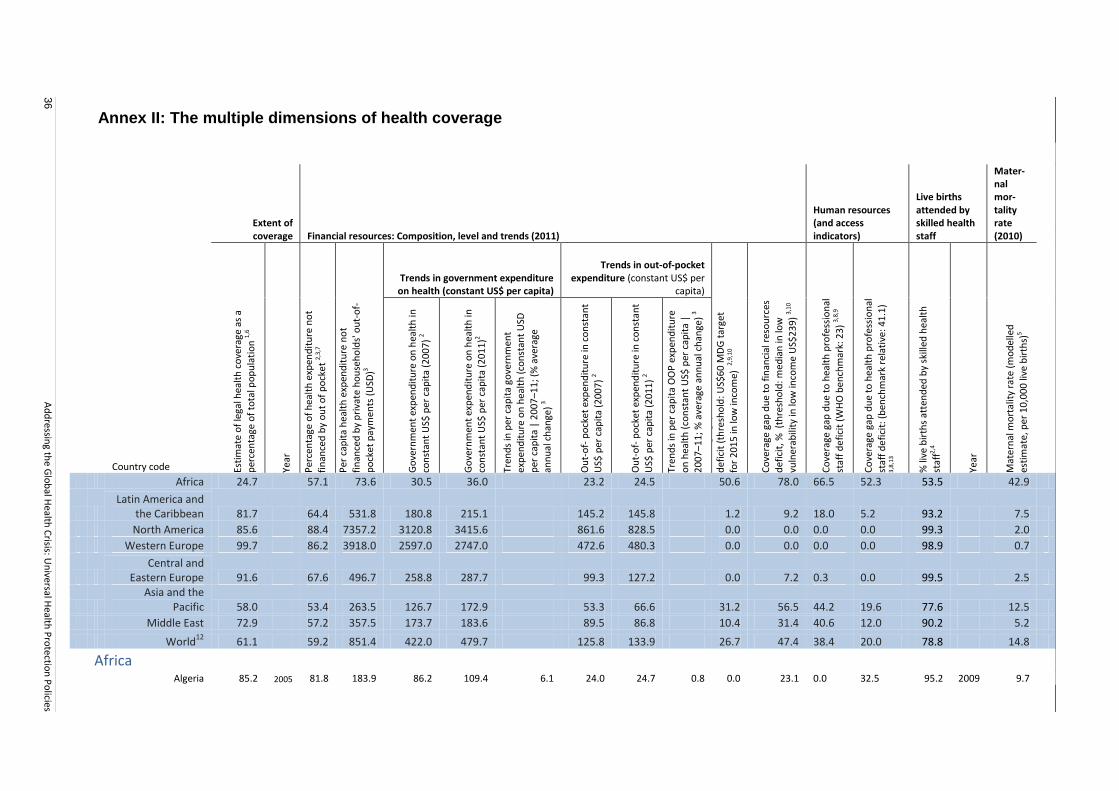
36
Ad
dressin
g the G
lob
al Health
Crisis: U
niversal H
ealth P
rotectio
n P
olicies
Annex II: The multiple dimensions of health coverage
Extent of coverage Financial resources: Composition, level and trends (2011)
Human resources (and access indicators)
Live births attended by skilled health staff
Mater-nal mor-tality rate (2010)
Trends in government expenditure on health (constant US$ per capita)
Trends in out-of-pocket expenditure (constant US$ per
capita)
Country code Esti
mat
e o
f le
gal h
ealt
h c
ove
rage
as
a
per
cen
tage
of
tota
l po
pu
lati
on
1,6
Year
Per
cen
tage
of
hea
lth
exp
end
itu
re n
ot
fin
ance
d b
y o
ut
of
po
cke
t 2,
3,7
Per
cap
ita
hea
lth
exp
end
itu
re n
ot
fin
ance
d b
y p
riva
te h
ou
seh
old
s' o
ut-
of-
po
cket
pay
men
ts (
USD
)3
Go
vern
men
t ex
pen
dit
ure
on
hea
lth
in
con
stan
t U
S$ p
er c
apit
a (2
00
7)
2
Go
vern
men
t ex
pen
dit
ure
on
hea
lth
in
con
stan
t U
S$ p
er c
apit
a (2
01
1)2
Tren
ds
in p
er c
apit
a go
vern
men
t ex
pen
dit
ure
on
hea
lth
(co
nst
ant
USD
per
cap
ita
| 2
00
7–1
1; (
% a
vera
ge
ann
ual
ch
ange
) 3
Ou
t-o
f- p
ock
et e
xpen
dit
ure
in c
on
stan
t U
S$ p
er c
apit
a (2
00
7)
2
Ou
t-o
f- p
ock
et e
xpen
dit
ure
in c
on
stan
t
US$
per
cap
ita
(20
11
) 2
Tren
ds
in p
er c
apit
a O
OP
exp
end
itu
re
on
hea
lth
(co
nst
ant
US$
per
cap
ita
| 2
00
7–1
1; %
ave
rage
an
nu
al c
han
ge)
3
Co
vera
ge g
ap d
ue
to f
inan
cial
res
ou
rces
d
efic
it (
thre
sho
ld: U
S$6
0 M
DG
tar
get
for
20
15
in lo
w in
com
e) 2,
9,10
Co
vera
ge g
ap d
ue
to f
inan
cial
res
ou
rces
d
efic
it, %
(th
resh
old
: med
ian
in lo
w
vuln
erab
ility
in lo
w in
com
e U
S$2
39
) 3,
10
Co
vera
ge g
ap d
ue
to h
ealt
h p
rofe
ssio
nal
staf
f d
efi
cit
(WH
O b
ench
mar
k: 2
3)
3,8,
9
Co
vera
ge g
ap d
ue
to h
ealt
h p
rofe
ssio
nal
staf
f d
efi
cit:
(b
ench
mar
k re
lati
ve: 4
1.1
) 3,
8,1
3
% li
ve b
irth
s at
ten
ded
by
skill
ed h
ealt
h
staf
f2,4
Year
Mat
ern
al m
ort
alit
y ra
te (
mo
del
led
esti
mat
e, p
er 1
0,0
00
live
bir
ths)
5
Africa 24.7 57.1 73.6 30.5 36.0 23.2 24.5 50.6 78.0 66.5 52.3 53.5 42.9
Latin America and
the Caribbean 81.7 64.4 531.8 180.8 215.1 145.2 145.8 1.2 9.2 18.0 5.2 93.2 7.5
North America 85.6 88.4 7357.2 3120.8 3415.6 861.6 828.5 0.0 0.0 0.0 0.0 99.3 2.0
Western Europe 99.7 86.2 3918.0 2597.0 2747.0 472.6 480.3 0.0 0.0 0.0 0.0 98.9 0.7
Central and
Eastern Europe 91.6 67.6 496.7 258.8 287.7 99.3 127.2 0.0 7.2 0.3 0.0 99.5 2.5
Asia and the
Pacific 58.0 53.4 263.5 126.7 172.9 53.3 66.6 31.2 56.5 44.2 19.6 77.6 12.5
Middle East 72.9 57.2 357.5 173.7 183.6 89.5 86.8 10.4 31.4 40.6 12.0 90.2 5.2
World12
61.1 59.2 851.4 422.0 479.7 125.8 133.9 26.7 47.4 38.4 20.0 78.8 14.8
Africa
Algeria 85.2 2005 81.8 183.9 86.2 109.4 6.1 24.0 24.7 0.8 0.0 23.1 0.0 32.5 95.2 2009 9.7
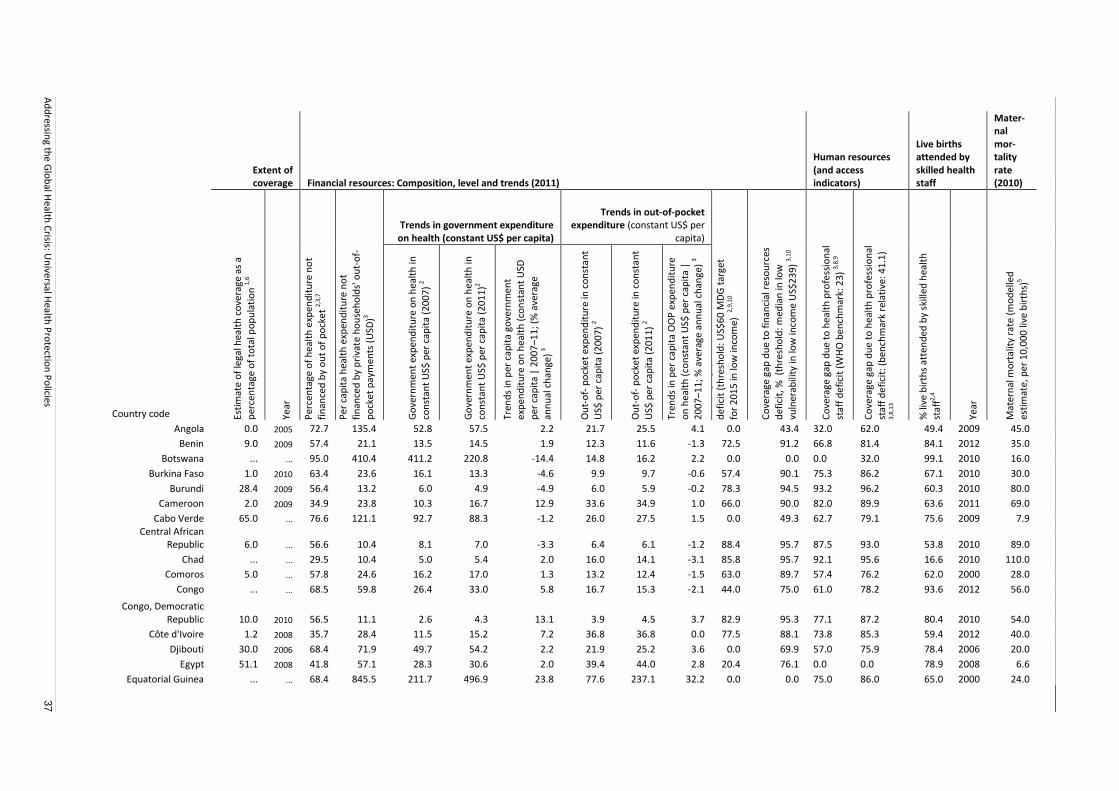
Ad
dressin
g the G
lob
al Health
Crisis: U
niversal H
ealth P
rotectio
n P
olicies
37
Extent of coverage Financial resources: Composition, level and trends (2011)
Human resources (and access indicators)
Live births attended by skilled health staff
Mater-nal mor-tality rate (2010)
Trends in government expenditure on health (constant US$ per capita)
Trends in out-of-pocket expenditure (constant US$ per
capita)
Country code Esti
mat
e o
f le
gal h
ealt
h c
ove
rage
as
a
per
cen
tage
of
tota
l po
pu
lati
on
1,6
Year
Per
cen
tage
of
hea
lth
exp
end
itu
re n
ot
fin
ance
d b
y o
ut
of
po
cke
t 2,
3,7
Per
cap
ita
hea
lth
exp
end
itu
re n
ot
fin
ance
d b
y p
riva
te h
ou
seh
old
s' o
ut-
of-
po
cket
pay
men
ts (
USD
)3
Go
vern
men
t ex
pen
dit
ure
on
hea
lth
in
con
stan
t U
S$ p
er c
apit
a (2
00
7)
2
Go
vern
men
t ex
pen
dit
ure
on
hea
lth
in
con
stan
t U
S$ p
er c
apit
a (2
01
1)2
Tren
ds
in p
er c
apit
a go
vern
men
t ex
pen
dit
ure
on
hea
lth
(co
nst
ant
USD
per
cap
ita
| 2
00
7–1
1; (
% a
vera
ge
ann
ual
ch
ange
) 3
Ou
t-o
f- p
ock
et e
xpen
dit
ure
in c
on
stan
t U
S$ p
er c
apit
a (2
00
7)
2
Ou
t-o
f- p
ock
et e
xpen
dit
ure
in c
on
stan
t
US$
per
cap
ita
(20
11
) 2
Tren
ds
in p
er c
apit
a O
OP
exp
end
itu
re
on
hea
lth
(co
nst
ant
US$
per
cap
ita
| 2
00
7–1
1; %
ave
rage
an
nu
al c
han
ge)
3
Co
vera
ge g
ap d
ue
to f
inan
cial
res
ou
rces
d
efic
it (
thre
sho
ld: U
S$6
0 M
DG
tar
get
for
20
15
in lo
w in
com
e) 2,
9,10
Co
vera
ge g
ap d
ue
to f
inan
cial
res
ou
rces
d
efic
it, %
(th
resh
old
: med
ian
in lo
w
vuln
erab
ility
in lo
w in
com
e U
S$2
39
) 3,
10
Co
vera
ge g
ap d
ue
to h
ealt
h p
rofe
ssio
nal
staf
f d
efi
cit
(WH
O b
ench
mar
k: 2
3)
3,8,
9
Co
vera
ge g
ap d
ue
to h
ealt
h p
rofe
ssio
nal
staf
f d
efi
cit:
(b
ench
mar
k re
lati
ve: 4
1.1
) 3,
8,13
% li
ve b
irth
s at
ten
ded
by
skill
ed h
ealt
h
staf
f2,4
Year
Mat
ern
al m
ort
alit
y ra
te (
mo
del
led
esti
mat
e, p
er 1
0,0
00
live
bir
ths)
5
Angola 0.0 2005 72.7 135.4 52.8 57.5 2.2 21.7 25.5 4.1 0.0 43.4 32.0 62.0 49.4 2009 45.0
Benin 9.0 2009 57.4 21.1 13.5 14.5 1.9 12.3 11.6 -1.3 72.5 91.2 66.8 81.4 84.1 2012 35.0
Botswana ... ... 95.0 410.4 411.2 220.8 -14.4 14.8 16.2 2.2 0.0 0.0 0.0 32.0 99.1 2010 16.0
Burkina Faso 1.0 2010 63.4 23.6 16.1 13.3 -4.6 9.9 9.7 -0.6 57.4 90.1 75.3 86.2 67.1 2010 30.0
Burundi 28.4 2009 56.4 13.2 6.0 4.9 -4.9 6.0 5.9 -0.2 78.3 94.5 93.2 96.2 60.3 2010 80.0
Cameroon 2.0 2009 34.9 23.8 10.3 16.7 12.9 33.6 34.9 1.0 66.0 90.0 82.0 89.9 63.6 2011 69.0
Cabo Verde 65.0 ... 76.6 121.1 92.7 88.3 -1.2 26.0 27.5 1.5 0.0 49.3 62.7 79.1 75.6 2009 7.9
Central African
Republic 6.0 ... 56.6 10.4 8.1 7.0 -3.3 6.4 6.1 -1.2 88.4 95.7 87.5 93.0 53.8 2010 89.0
Chad ... ... 29.5 10.4 5.0 5.4 2.0 16.0 14.1 -3.1 85.8 95.7 92.1 95.6 16.6 2010 110.0
Comoros 5.0 ... 57.8 24.6 16.2 17.0 1.3 13.2 12.4 -1.5 63.0 89.7 57.4 76.2 62.0 2000 28.0
Congo ... ... 68.5 59.8 26.4 33.0 5.8 16.7 15.3 -2.1 44.0 75.0 61.0 78.2 93.6 2012 56.0
Congo, Democratic
Republic 10.0 2010 56.5 11.1 2.6 4.3 13.1 3.9 4.5 3.7 82.9 95.3 77.1 87.2 80.4 2010 54.0
Côte d'Ivoire 1.2 2008 35.7 28.4 11.5 15.2 7.2 36.8 36.8 0.0 77.5 88.1 73.8 85.3 59.4 2012 40.0
Djibouti 30.0 2006 68.4 71.9 49.7 54.2 2.2 21.9 25.2 3.6 0.0 69.9 57.0 75.9 78.4 2006 20.0
Egypt 51.1 2008 41.8 57.1 28.3 30.6 2.0 39.4 44.0 2.8 20.4 76.1 0.0 0.0 78.9 2008 6.6
Equatorial Guinea ... ... 68.4 845.5 211.7 496.9 23.8 77.6 237.1 32.2 0.0 0.0 75.0 86.0 65.0 2000 24.0
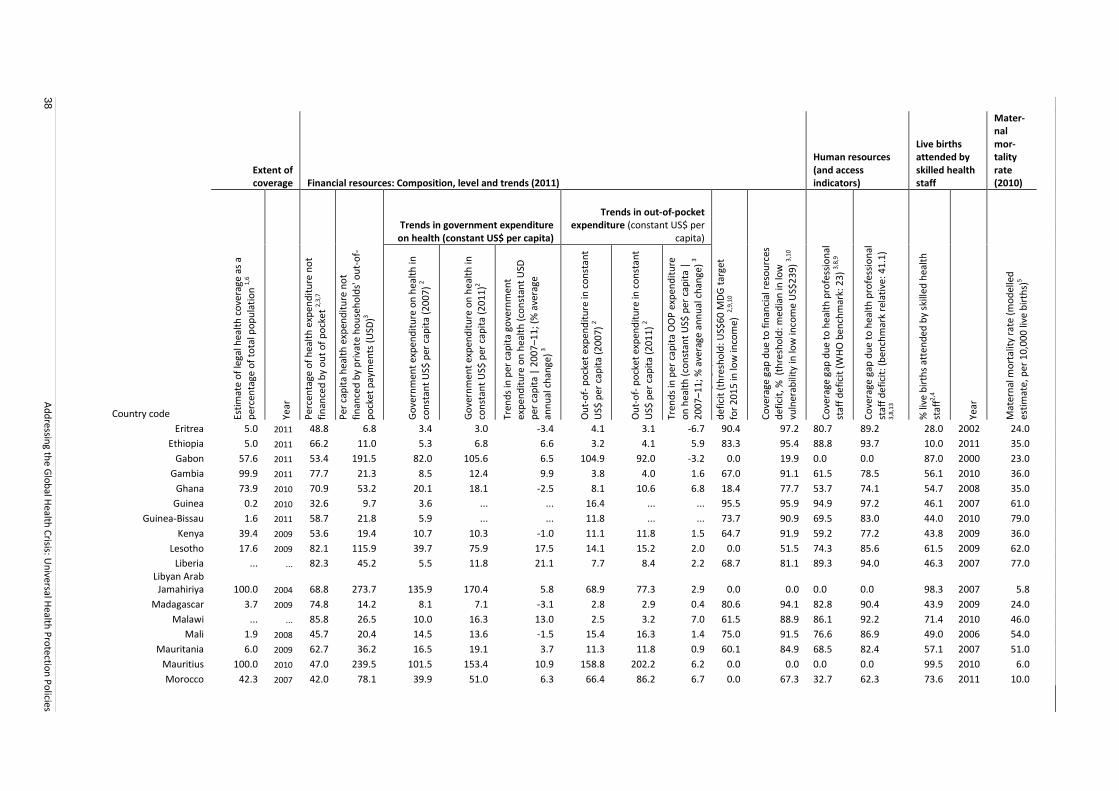
38
Ad
dressin
g the G
lob
al Health
Crisis: U
niversal H
ealth P
rotectio
n P
olicies
Extent of coverage Financial resources: Composition, level and trends (2011)
Human resources (and access indicators)
Live births attended by skilled health staff
Mater-nal mor-tality rate (2010)
Trends in government expenditure on health (constant US$ per capita)
Trends in out-of-pocket expenditure (constant US$ per
capita)
Country code Esti
mat
e o
f le
gal h
ealt
h c
ove
rage
as
a
per
cen
tage
of
tota
l po
pu
lati
on
1,6
Year
Per
cen
tage
of
hea
lth
exp
end
itu
re n
ot
fin
ance
d b
y o
ut
of
po
cke
t 2,
3,7
Per
cap
ita
hea
lth
exp
end
itu
re n
ot
fin
ance
d b
y p
riva
te h
ou
seh
old
s' o
ut-
of-
po
cket
pay
men
ts (
USD
)3
Go
vern
men
t ex
pen
dit
ure
on
hea
lth
in
con
stan
t U
S$ p
er c
apit
a (2
00
7)
2
Go
vern
men
t ex
pen
dit
ure
on
hea
lth
in
con
stan
t U
S$ p
er c
apit
a (2
01
1)2
Tren
ds
in p
er c
apit
a go
vern
men
t ex
pen
dit
ure
on
hea
lth
(co
nst
ant
USD
per
cap
ita
| 2
00
7–1
1; (
% a
vera
ge
ann
ual
ch
ange
) 3
Ou
t-o
f- p
ock
et e
xpen
dit
ure
in c
on
stan
t U
S$ p
er c
apit
a (2
00
7)
2
Ou
t-o
f- p
ock
et e
xpen
dit
ure
in c
on
stan
t
US$
per
cap
ita
(20
11
) 2
Tren
ds
in p
er c
apit
a O
OP
exp
end
itu
re
on
hea
lth
(co
nst
ant
US$
per
cap
ita
| 2
00
7–1
1; %
ave
rage
an
nu
al c
han
ge)
3
Co
vera
ge g
ap d
ue
to f
inan
cial
res
ou
rces
d
efic
it (
thre
sho
ld: U
S$6
0 M
DG
tar
get
for
20
15
in lo
w in
com
e) 2,
9,10
Co
vera
ge g
ap d
ue
to f
inan
cial
res
ou
rces
d
efic
it, %
(th
resh
old
: med
ian
in lo
w
vuln
erab
ility
in lo
w in
com
e U
S$2
39
) 3,
10
Co
vera
ge g
ap d
ue
to h
ealt
h p
rofe
ssio
nal
staf
f d
efi
cit
(WH
O b
ench
mar
k: 2
3)
3,8,
9
Co
vera
ge g
ap d
ue
to h
ealt
h p
rofe
ssio
nal
staf
f d
efi
cit:
(b
ench
mar
k re
lati
ve: 4
1.1
) 3,
8,13
% li
ve b
irth
s at
ten
ded
by
skill
ed h
ealt
h
staf
f2,4
Year
Mat
ern
al m
ort
alit
y ra
te (
mo
del
led
esti
mat
e, p
er 1
0,0
00
live
bir
ths)
5
Eritrea 5.0 2011 48.8 6.8 3.4 3.0 -3.4 4.1 3.1 -6.7 90.4 97.2 80.7 89.2 28.0 2002 24.0
Ethiopia 5.0 2011 66.2 11.0 5.3 6.8 6.6 3.2 4.1 5.9 83.3 95.4 88.8 93.7 10.0 2011 35.0
Gabon 57.6 2011 53.4 191.5 82.0 105.6 6.5 104.9 92.0 -3.2 0.0 19.9 0.0 0.0 87.0 2000 23.0
Gambia 99.9 2011 77.7 21.3 8.5 12.4 9.9 3.8 4.0 1.6 67.0 91.1 61.5 78.5 56.1 2010 36.0
Ghana 73.9 2010 70.9 53.2 20.1 18.1 -2.5 8.1 10.6 6.8 18.4 77.7 53.7 74.1 54.7 2008 35.0
Guinea 0.2 2010 32.6 9.7 3.6 ... ... 16.4 ... ... 95.5 95.9 94.9 97.2 46.1 2007 61.0
Guinea-Bissau 1.6 2011 58.7 21.8 5.9 ... ... 11.8 ... ... 73.7 90.9 69.5 83.0 44.0 2010 79.0
Kenya 39.4 2009 53.6 19.4 10.7 10.3 -1.0 11.1 11.8 1.5 64.7 91.9 59.2 77.2 43.8 2009 36.0
Lesotho 17.6 2009 82.1 115.9 39.7 75.9 17.5 14.1 15.2 2.0 0.0 51.5 74.3 85.6 61.5 2009 62.0
Liberia ... ... 82.3 45.2 5.5 11.8 21.1 7.7 8.4 2.2 68.7 81.1 89.3 94.0 46.3 2007 77.0
Libyan Arab Jamahiriya 100.0 2004 68.8 273.7 135.9 170.4 5.8 68.9 77.3 2.9 0.0 0.0 0.0 0.0 98.3 2007 5.8
Madagascar 3.7 2009 74.8 14.2 8.1 7.1 -3.1 2.8 2.9 0.4 80.6 94.1 82.8 90.4 43.9 2009 24.0
Malawi ... ... 85.8 26.5 10.0 16.3 13.0 2.5 3.2 7.0 61.5 88.9 86.1 92.2 71.4 2010 46.0
Mali 1.9 2008 45.7 20.4 14.5 13.6 -1.5 15.4 16.3 1.4 75.0 91.5 76.6 86.9 49.0 2006 54.0
Mauritania 6.0 2009 62.7 36.2 16.5 19.1 3.7 11.3 11.8 0.9 60.1 84.9 68.5 82.4 57.1 2007 51.0
Mauritius 100.0 2010 47.0 239.5 101.5 153.4 10.9 158.8 202.2 6.2 0.0 0.0 0.0 0.0 99.5 2010 6.0
Morocco 42.3 2007 42.0 78.1 39.9 51.0 6.3 66.4 86.2 6.7 0.0 67.3 32.7 62.3 73.6 2011 10.0

Ad
dressin
g the G
lob
al Health
Crisis: U
niversal H
ealth P
rotectio
n P
olicies
39
Extent of coverage Financial resources: Composition, level and trends (2011)
Human resources (and access indicators)
Live births attended by skilled health staff
Mater-nal mor-tality rate (2010)
Trends in government expenditure on health (constant US$ per capita)
Trends in out-of-pocket expenditure (constant US$ per
capita)
Country code Esti
mat
e o
f le
gal h
ealt
h c
ove
rage
as
a
per
cen
tage
of
tota
l po
pu
lati
on
1,6
Year
Per
cen
tage
of
hea
lth
exp
end
itu
re n
ot
fin
ance
d b
y o
ut
of
po
cke
t 2,
3,7
Per
cap
ita
hea
lth
exp
end
itu
re n
ot
fin
ance
d b
y p
riva
te h
ou
seh
old
s' o
ut-
of-
po
cket
pay
men
ts (
USD
)3
Go
vern
men
t ex
pen
dit
ure
on
hea
lth
in
con
stan
t U
S$ p
er c
apit
a (2
00
7)
2
Go
vern
men
t ex
pen
dit
ure
on
hea
lth
in
con
stan
t U
S$ p
er c
apit
a (2
01
1)2
Tren
ds
in p
er c
apit
a go
vern
men
t ex
pen
dit
ure
on
hea
lth
(co
nst
ant
USD
per
cap
ita
| 2
00
7–1
1; (
% a
vera
ge
ann
ual
ch
ange
) 3
Ou
t-o
f- p
ock
et e
xpen
dit
ure
in c
on
stan
t U
S$ p
er c
apit
a (2
00
7)
2
Ou
t-o
f- p
ock
et e
xpen
dit
ure
in c
on
stan
t
US$
per
cap
ita
(20
11
) 2
Tren
ds
in p
er c
apit
a O
OP
exp
end
itu
re
on
hea
lth
(co
nst
ant
US$
per
cap
ita
| 2
00
7–1
1; %
ave
rage
an
nu
al c
han
ge)
3
Co
vera
ge g
ap d
ue
to f
inan
cial
res
ou
rces
d
efic
it (
thre
sho
ld: U
S$6
0 M
DG
tar
get
for
20
15
in lo
w in
com
e) 2,
9,10
Co
vera
ge g
ap d
ue
to f
inan
cial
res
ou
rces
d
efic
it, %
(th
resh
old
: med
ian
in lo
w
vuln
erab
ility
in lo
w in
com
e U
S$2
39
) 3,
10
Co
vera
ge g
ap d
ue
to h
ealt
h p
rofe
ssio
nal
staf
f d
efi
cit
(WH
O b
ench
mar
k: 2
3)
3,8,
9
Co
vera
ge g
ap d
ue
to h
ealt
h p
rofe
ssio
nal
staf
f d
efi
cit:
(b
ench
mar
k re
lati
ve: 4
1.1
) 3,
8,13
% li
ve b
irth
s at
ten
ded
by
skill
ed h
ealt
h
staf
f2,4
Year
Mat
ern
al m
ort
alit
y ra
te (
mo
del
led
esti
mat
e, p
er 1
0,0
00
live
bir
ths)
5
Mozambique 4.0 2011 91.0 32.0 12.1 11.5 -1.4 1.7 2.7 12.6 69.8 86.6 86.8 92.6 54.3 2011 49.0
Namibia 28.0 2007 92.3 261.2 143.4 120.3 -4.3 22.4 24.0 1.7 0.0 0.0 0.0 29.7 81.4 2007 20.0
Niger 3.1 2003 62.4 12.6 7.1 7.0 -0.3 6.6 4.8 -7.7 82.4 94.7 93.9 96.6 17.7 2006 59.0
Nigeria 2.2 2008 39.6 31.5 20.5 19.9 -0.7 38.7 32.8 -4.0 57.1 86.8 27.8 59.6 34.4 2008 63.0
Rwanda 91.0 2010 78.6 49.3 13.8 23.1 13.7 6.9 8.5 5.3 27.4 79.4 71.4 84.0 69.0 2010 34.0
Sao Tome and
Principe 2.1 2009 43.1 50.6 17.4 23.9 8.3 31.8 40.9 6.5 30.2 78.8 10.1 49.7 80.6 2009 7.0
Senegal 20.1 2007 67.3 45.1 25.7 28.6 2.7 16.1 16.2 0.1 36.0 81.2 81.0 89.4 65.1 2011 37.0
Seychelles 90.0 2011 94.6 414.7 407.9 464.9 3.3 24.7 27.5 2.7 0.0 0.0 0.0 0.0 99.0 2009 ...
Sierra Leone 0.0 2008 25.1 17.2 5.5 9.5 14.5 40.4 47.1 3.9 85.2 92.8 91.6 95.3 60.8 2010 89.0
Somalia 20.0 2006 ... ... ... ... ... ... ... ... ... ... 94.6 97.0 9.4 2006 100.0
South Africa 100.0 2010 92.8 639.6 195.4 245.2 5.8 41.1 37.1 -2.6 0.0 0.0 0.0 0.0 91.0 2003 30.0
South Sudan ... ... ... ... ... ... ... ... ... ... ... ... ... ... ... ... ...
Sudan 29.7 2009 30.9 32.0 16.5 15.9 -1.0 31.4 41.0 6.8 54.1 86.6 49.4 71.7 23.2 2006 73.0
Swaziland 6.2 2006 86.9 230.2 114.2 135.5 4.4 23.0 26.4 3.5 0.0 3.7 0.0 0.0 82.0 2010 32.0
Tanzania, United
Rep. of 13.0 2010 68.3 25.5 14.4 13.0 -2.6 3.4 11.0 34.6 55.4 89.3 91.1 95.0 48.9 2010 46.0
Togo 4.0 2010 59.6 26.8 8.6 16.5 17.8 14.6 12.8 -3.3 63.8 88.8 85.8 92.1 43.9 2010 30.0
Tunisia 80.0 2005 60.5 161.4 105.6 125.8 4.5 83.5 90.1 1.9 0.0 32.5 0.0 0.0 94.6 2006 5.6
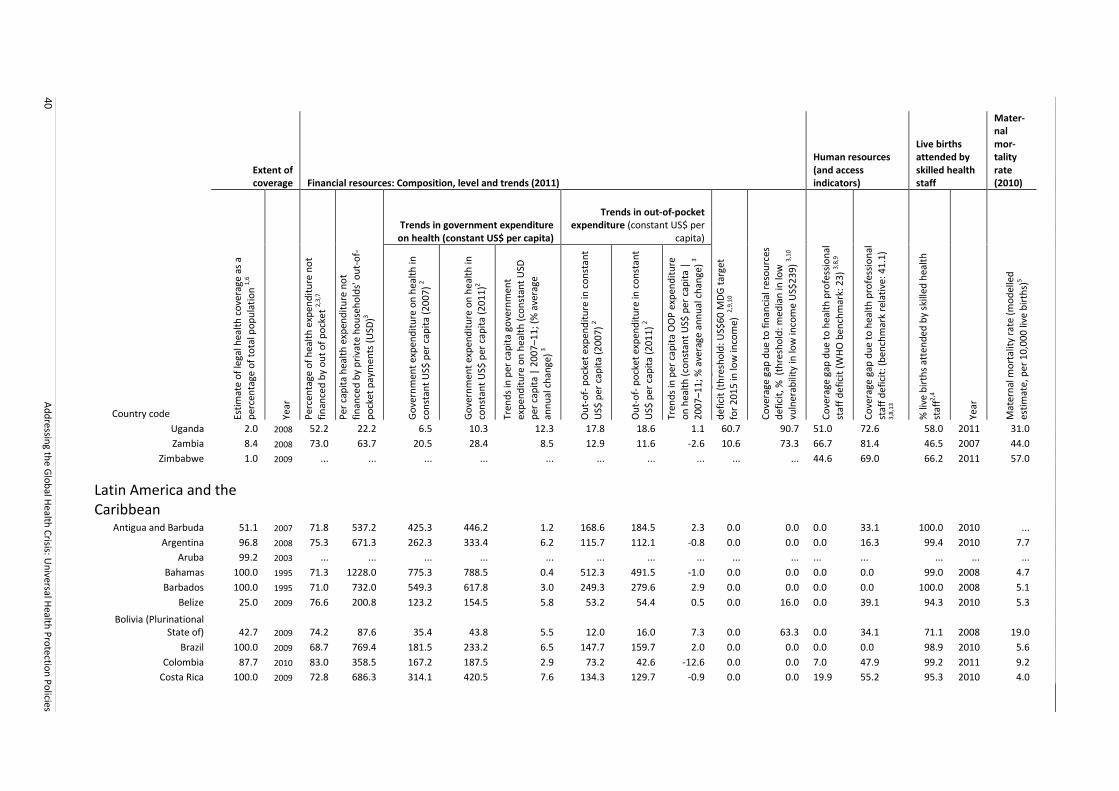
40
Ad
dressin
g the G
lob
al Health
Crisis: U
niversal H
ealth P
rotectio
n P
olicies
Extent of coverage Financial resources: Composition, level and trends (2011)
Human resources (and access indicators)
Live births attended by skilled health staff
Mater-nal mor-tality rate (2010)
Trends in government expenditure on health (constant US$ per capita)
Trends in out-of-pocket expenditure (constant US$ per
capita)
Country code Esti
mat
e o
f le
gal h
ealt
h c
ove
rage
as
a
per
cen
tage
of
tota
l po
pu
lati
on
1,6
Year
Per
cen
tage
of
hea
lth
exp
end
itu
re n
ot
fin
ance
d b
y o
ut
of
po
cke
t 2,
3,7
Per
cap
ita
hea
lth
exp
end
itu
re n
ot
fin
ance
d b
y p
riva
te h
ou
seh
old
s' o
ut-
of-
po
cket
pay
men
ts (
USD
)3
Go
vern
men
t ex
pen
dit
ure
on
hea
lth
in
con
stan
t U
S$ p
er c
apit
a (2
00
7)
2
Go
vern
men
t ex
pen
dit
ure
on
hea
lth
in
con
stan
t U
S$ p
er c
apit
a (2
01
1)2
Tren
ds
in p
er c
apit
a go
vern
men
t ex
pen
dit
ure
on
hea
lth
(co
nst
ant
USD
per
cap
ita
| 2
00
7–1
1; (
% a
vera
ge
ann
ual
ch
ange
) 3
Ou
t-o
f- p
ock
et e
xpen
dit
ure
in c
on
stan
t U
S$ p
er c
apit
a (2
00
7)
2
Ou
t-o
f- p
ock
et e
xpen
dit
ure
in c
on
stan
t
US$
per
cap
ita
(20
11
) 2
Tren
ds
in p
er c
apit
a O
OP
exp
end
itu
re
on
hea
lth
(co
nst
ant
US$
per
cap
ita
| 2
00
7–1
1; %
ave
rage
an
nu
al c
han
ge)
3
Co
vera
ge g
ap d
ue
to f
inan
cial
res
ou
rces
d
efic
it (
thre
sho
ld: U
S$6
0 M
DG
tar
get
for
20
15
in lo
w in
com
e) 2,
9,10
Co
vera
ge g
ap d
ue
to f
inan
cial
res
ou
rces
d
efic
it, %
(th
resh
old
: med
ian
in lo
w
vuln
erab
ility
in lo
w in
com
e U
S$2
39
) 3,
10
Co
vera
ge g
ap d
ue
to h
ealt
h p
rofe
ssio
nal
staf
f d
efi
cit
(WH
O b
ench
mar
k: 2
3)
3,8,
9
Co
vera
ge g
ap d
ue
to h
ealt
h p
rofe
ssio
nal
staf
f d
efi
cit:
(b
ench
mar
k re
lati
ve: 4
1.1
) 3,
8,13
% li
ve b
irth
s at
ten
ded
by
skill
ed h
ealt
h
staf
f2,4
Year
Mat
ern
al m
ort
alit
y ra
te (
mo
del
led
esti
mat
e, p
er 1
0,0
00
live
bir
ths)
5
Uganda 2.0 2008 52.2 22.2 6.5 10.3 12.3 17.8 18.6 1.1 60.7 90.7 51.0 72.6 58.0 2011 31.0
Zambia 8.4 2008 73.0 63.7 20.5 28.4 8.5 12.9 11.6 -2.6 10.6 73.3 66.7 81.4 46.5 2007 44.0
Zimbabwe 1.0 2009 ... ... ... ... ... ... ... ... ... ... 44.6 69.0 66.2 2011 57.0
Latin America and the Caribbean
Antigua and Barbuda 51.1 2007 71.8 537.2 425.3 446.2 1.2 168.6 184.5 2.3 0.0 0.0 0.0 33.1 100.0 2010 ...
Argentina 96.8 2008 75.3 671.3 262.3 333.4 6.2 115.7 112.1 -0.8 0.0 0.0 0.0 16.3 99.4 2010 7.7
Aruba 99.2 2003 ... ... ... ... ... ... ... ... ... ... ... ... ... ... ...
Bahamas 100.0 1995 71.3 1228.0 775.3 788.5 0.4 512.3 491.5 -1.0 0.0 0.0 0.0 0.0 99.0 2008 4.7
Barbados 100.0 1995 71.0 732.0 549.3 617.8 3.0 249.3 279.6 2.9 0.0 0.0 0.0 0.0 100.0 2008 5.1
Belize 25.0 2009 76.6 200.8 123.2 154.5 5.8 53.2 54.4 0.5 0.0 16.0 0.0 39.1 94.3 2010 5.3
Bolivia (Plurinational
State of) 42.7 2009 74.2 87.6 35.4 43.8 5.5 12.0 16.0 7.3 0.0 63.3 0.0 34.1 71.1 2008 19.0
Brazil 100.0 2009 68.7 769.4 181.5 233.2 6.5 147.7 159.7 2.0 0.0 0.0 0.0 0.0 98.9 2010 5.6
Colombia 87.7 2010 83.0 358.5 167.2 187.5 2.9 73.2 42.6 -12.6 0.0 0.0 7.0 47.9 99.2 2011 9.2
Costa Rica 100.0 2009 72.8 686.3 314.1 420.5 7.6 134.3 129.7 -0.9 0.0 0.0 19.9 55.2 95.3 2010 4.0
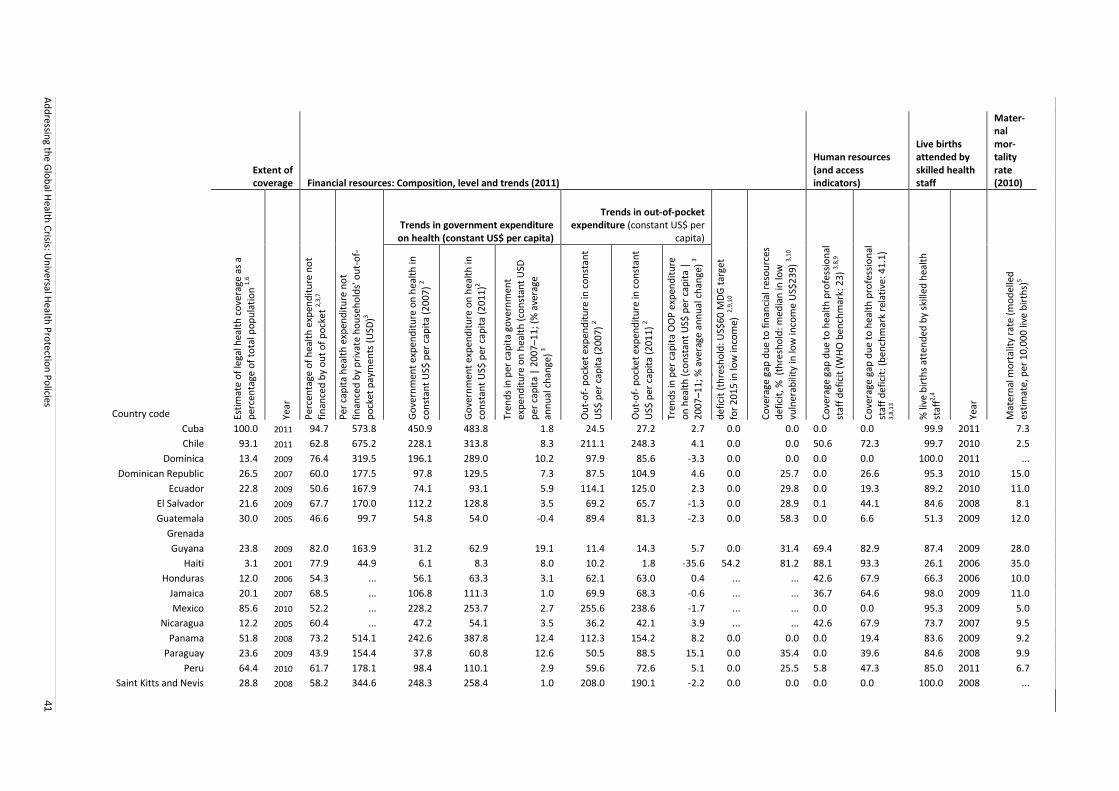
Ad
dressin
g the G
lob
al Health
Crisis: U
niversal H
ealth P
rotectio
n P
olicies
41
Extent of coverage Financial resources: Composition, level and trends (2011)
Human resources (and access indicators)
Live births attended by skilled health staff
Mater-nal mor-tality rate (2010)
Trends in government expenditure on health (constant US$ per capita)
Trends in out-of-pocket expenditure (constant US$ per
capita)
Country code Esti
mat
e o
f le
gal h
ealt
h c
ove
rage
as
a
per
cen
tage
of
tota
l po
pu
lati
on
1,6
Year
Per
cen
tage
of
hea
lth
exp
end
itu
re n
ot
fin
ance
d b
y o
ut
of
po
cke
t 2,
3,7
Per
cap
ita
hea
lth
exp
end
itu
re n
ot
fin
ance
d b
y p
riva
te h
ou
seh
old
s' o
ut-
of-
po
cket
pay
men
ts (
USD
)3
Go
vern
men
t ex
pen
dit
ure
on
hea
lth
in
con
stan
t U
S$ p
er c
apit
a (2
00
7)
2
Go
vern
men
t ex
pen
dit
ure
on
hea
lth
in
con
stan
t U
S$ p
er c
apit
a (2
01
1)2
Tren
ds
in p
er c
apit
a go
vern
men
t ex
pen
dit
ure
on
hea
lth
(co
nst
ant
USD
per
cap
ita
| 2
00
7–1
1; (
% a
vera
ge
ann
ual
ch
ange
) 3
Ou
t-o
f- p
ock
et e
xpen
dit
ure
in c
on
stan
t U
S$ p
er c
apit
a (2
00
7)
2
Ou
t-o
f- p
ock
et e
xpen
dit
ure
in c
on
stan
t
US$
per
cap
ita
(20
11
) 2
Tren
ds
in p
er c
apit
a O
OP
exp
end
itu
re
on
hea
lth
(co
nst
ant
US$
per
cap
ita
| 2
00
7–1
1; %
ave
rage
an
nu
al c
han
ge)
3
Co
vera
ge g
ap d
ue
to f
inan
cial
res
ou
rces
d
efic
it (
thre
sho
ld: U
S$6
0 M
DG
tar
get
for
20
15
in lo
w in
com
e) 2,
9,10
Co
vera
ge g
ap d
ue
to f
inan
cial
res
ou
rces
d
efic
it, %
(th
resh
old
: med
ian
in lo
w
vuln
erab
ility
in lo
w in
com
e U
S$2
39
) 3,
10
Co
vera
ge g
ap d
ue
to h
ealt
h p
rofe
ssio
nal
staf
f d
efi
cit
(WH
O b
ench
mar
k: 2
3)
3,8,
9
Co
vera
ge g
ap d
ue
to h
ealt
h p
rofe
ssio
nal
staf
f d
efi
cit:
(b
ench
mar
k re
lati
ve: 4
1.1
) 3,
8,13
% li
ve b
irth
s at
ten
ded
by
skill
ed h
ealt
h
staf
f2,4
Year
Mat
ern
al m
ort
alit
y ra
te (
mo
del
led
esti
mat
e, p
er 1
0,0
00
live
bir
ths)
5
Cuba 100.0 2011 94.7 573.8 450.9 483.8 1.8 24.5 27.2 2.7 0.0 0.0 0.0 0.0 99.9 2011 7.3
Chile 93.1 2011 62.8 675.2 228.1 313.8 8.3 211.1 248.3 4.1 0.0 0.0 50.6 72.3 99.7 2010 2.5
Dominica 13.4 2009 76.4 319.5 196.1 289.0 10.2 97.9 85.6 -3.3 0.0 0.0 0.0 0.0 100.0 2011 ...
Dominican Republic 26.5 2007 60.0 177.5 97.8 129.5 7.3 87.5 104.9 4.6 0.0 25.7 0.0 26.6 95.3 2010 15.0
Ecuador 22.8 2009 50.6 167.9 74.1 93.1 5.9 114.1 125.0 2.3 0.0 29.8 0.0 19.3 89.2 2010 11.0
El Salvador 21.6 2009 67.7 170.0 112.2 128.8 3.5 69.2 65.7 -1.3 0.0 28.9 0.1 44.1 84.6 2008 8.1
Guatemala 30.0 2005 46.6 99.7 54.8 54.0 -0.4 89.4 81.3 -2.3 0.0 58.3 0.0 6.6 51.3 2009 12.0
Grenada
Guyana 23.8 2009 82.0 163.9 31.2 62.9 19.1 11.4 14.3 5.7 0.0 31.4 69.4 82.9 87.4 2009 28.0
Haiti 3.1 2001 77.9 44.9 6.1 8.3 8.0 10.2 1.8 -35.6 54.2 81.2 88.1 93.3 26.1 2006 35.0
Honduras 12.0 2006 54.3 ... 56.1 63.3 3.1 62.1 63.0 0.4 ... ... 42.6 67.9 66.3 2006 10.0
Jamaica 20.1 2007 68.5 ... 106.8 111.3 1.0 69.9 68.3 -0.6 ... ... 36.7 64.6 98.0 2009 11.0
Mexico 85.6 2010 52.2 ... 228.2 253.7 2.7 255.6 238.6 -1.7 ... ... 0.0 0.0 95.3 2009 5.0
Nicaragua 12.2 2005 60.4 ... 47.2 54.1 3.5 36.2 42.1 3.9 ... ... 42.6 67.9 73.7 2007 9.5
Panama 51.8 2008 73.2 514.1 242.6 387.8 12.4 112.3 154.2 8.2 0.0 0.0 0.0 19.4 83.6 2009 9.2
Paraguay 23.6 2009 43.9 154.4 37.8 60.8 12.6 50.5 88.5 15.1 0.0 35.4 0.0 39.6 84.6 2008 9.9
Peru 64.4 2010 61.7 178.1 98.4 110.1 2.9 59.6 72.6 5.1 0.0 25.5 5.8 47.3 85.0 2011 6.7
Saint Kitts and Nevis 28.8 2008 58.2 344.6 248.3 258.4 1.0 208.0 190.1 -2.2 0.0 0.0 0.0 0.0 100.0 2008 ...
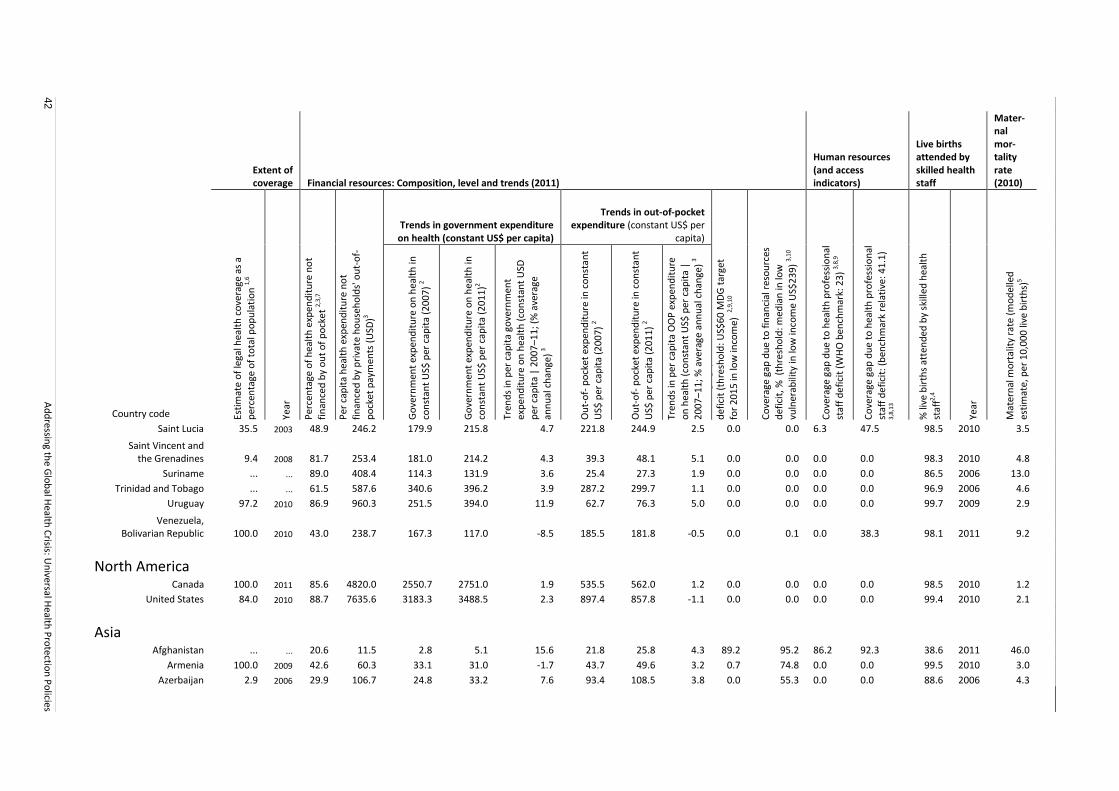
42
Ad
dressin
g the G
lob
al Health
Crisis: U
niversal H
ealth P
rotectio
n P
olicies
Extent of coverage Financial resources: Composition, level and trends (2011)
Human resources (and access indicators)
Live births attended by skilled health staff
Mater-nal mor-tality rate (2010)
Trends in government expenditure on health (constant US$ per capita)
Trends in out-of-pocket expenditure (constant US$ per
capita)
Country code Esti
mat
e o
f le
gal h
ealt
h c
ove
rage
as
a
per
cen
tage
of
tota
l po
pu
lati
on
1,6
Year
Per
cen
tage
of
hea
lth
exp
end
itu
re n
ot
fin
ance
d b
y o
ut
of
po
cke
t 2,
3,7
Per
cap
ita
hea
lth
exp
end
itu
re n
ot
fin
ance
d b
y p
riva
te h
ou
seh
old
s' o
ut-
of-
po
cket
pay
men
ts (
USD
)3
Go
vern
men
t ex
pen
dit
ure
on
hea
lth
in
con
stan
t U
S$ p
er c
apit
a (2
00
7)
2
Go
vern
men
t ex
pen
dit
ure
on
hea
lth
in
con
stan
t U
S$ p
er c
apit
a (2
01
1)2
Tren
ds
in p
er c
apit
a go
vern
men
t ex
pen
dit
ure
on
hea
lth
(co
nst
ant
USD
per
cap
ita
| 2
00
7–1
1; (
% a
vera
ge
ann
ual
ch
ange
) 3
Ou
t-o
f- p
ock
et e
xpen
dit
ure
in c
on
stan
t U
S$ p
er c
apit
a (2
00
7)
2
Ou
t-o
f- p
ock
et e
xpen
dit
ure
in c
on
stan
t
US$
per
cap
ita
(20
11
) 2
Tren
ds
in p
er c
apit
a O
OP
exp
end
itu
re
on
hea
lth
(co
nst
ant
US$
per
cap
ita
| 2
00
7–1
1; %
ave
rage
an
nu
al c
han
ge)
3
Co
vera
ge g
ap d
ue
to f
inan
cial
res
ou
rces
d
efic
it (
thre
sho
ld: U
S$6
0 M
DG
tar
get
for
20
15
in lo
w in
com
e) 2,
9,10
Co
vera
ge g
ap d
ue
to f
inan
cial
res
ou
rces
d
efic
it, %
(th
resh
old
: med
ian
in lo
w
vuln
erab
ility
in lo
w in
com
e U
S$2
39
) 3,
10
Co
vera
ge g
ap d
ue
to h
ealt
h p
rofe
ssio
nal
staf
f d
efi
cit
(WH
O b
ench
mar
k: 2
3)
3,8,
9
Co
vera
ge g
ap d
ue
to h
ealt
h p
rofe
ssio
nal
staf
f d
efi
cit:
(b
ench
mar
k re
lati
ve: 4
1.1
) 3,
8,13
% li
ve b
irth
s at
ten
ded
by
skill
ed h
ealt
h
staf
f2,4
Year
Mat
ern
al m
ort
alit
y ra
te (
mo
del
led
esti
mat
e, p
er 1
0,0
00
live
bir
ths)
5
Saint Lucia 35.5 2003 48.9 246.2 179.9 215.8 4.7 221.8 244.9 2.5 0.0 0.0 6.3 47.5 98.5 2010 3.5
Saint Vincent and
the Grenadines 9.4 2008 81.7 253.4 181.0 214.2 4.3 39.3 48.1 5.1 0.0 0.0 0.0 0.0 98.3 2010 4.8
Suriname ... ... 89.0 408.4 114.3 131.9 3.6 25.4 27.3 1.9 0.0 0.0 0.0 0.0 86.5 2006 13.0
Trinidad and Tobago ... ... 61.5 587.6 340.6 396.2 3.9 287.2 299.7 1.1 0.0 0.0 0.0 0.0 96.9 2006 4.6
Uruguay 97.2 2010 86.9 960.3 251.5 394.0 11.9 62.7 76.3 5.0 0.0 0.0 0.0 0.0 99.7 2009 2.9
Venezuela,
Bolivarian Republic 100.0 2010 43.0 238.7 167.3 117.0 -8.5 185.5 181.8 -0.5 0.0 0.1 0.0 38.3 98.1 2011 9.2
North America
Canada 100.0 2011 85.6 4820.0 2550.7 2751.0 1.9 535.5 562.0 1.2 0.0 0.0 0.0 0.0 98.5 2010 1.2
United States 84.0 2010 88.7 7635.6 3183.3 3488.5 2.3 897.4 857.8 -1.1 0.0 0.0 0.0 0.0 99.4 2010 2.1
Asia
Afghanistan ... ... 20.6 11.5 2.8 5.1 15.6 21.8 25.8 4.3 89.2 95.2 86.2 92.3 38.6 2011 46.0
Armenia 100.0 2009 42.6 60.3 33.1 31.0 -1.7 43.7 49.6 3.2 0.7 74.8 0.0 0.0 99.5 2010 3.0
Azerbaijan 2.9 2006 29.9 106.7 24.8 33.2 7.6 93.4 108.5 3.8 0.0 55.3 0.0 0.0 88.6 2006 4.3
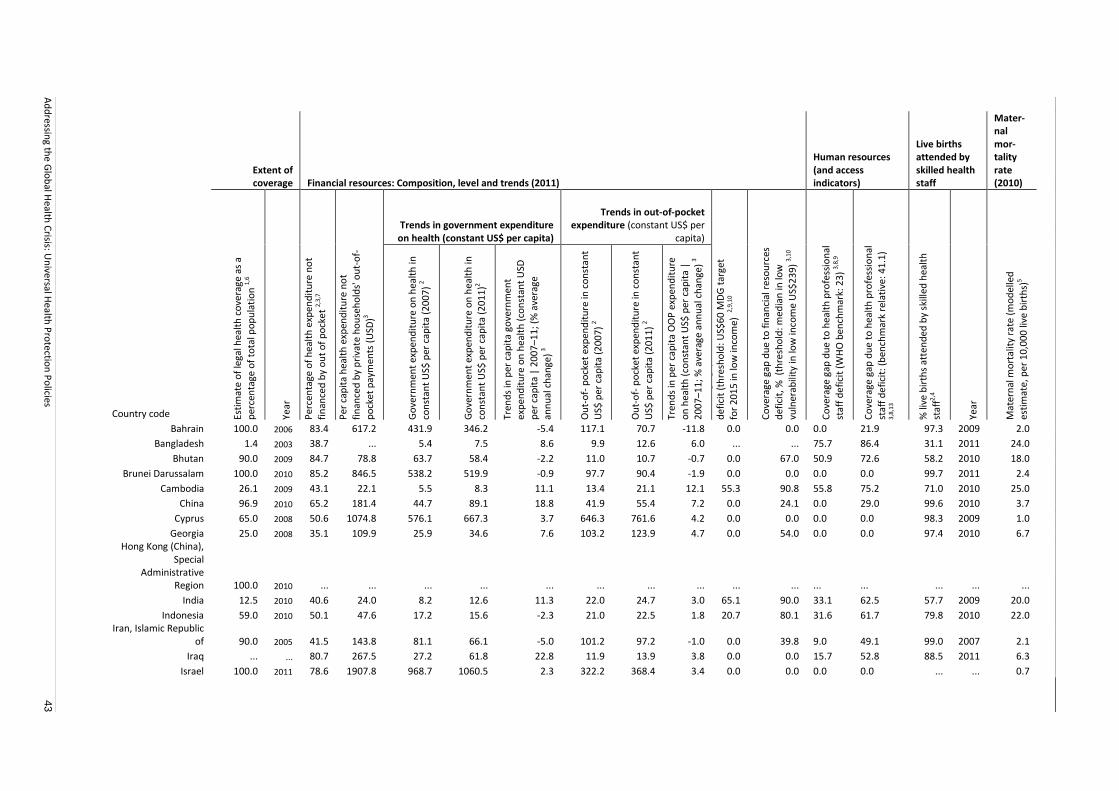
Ad
dressin
g the G
lob
al Health
Crisis: U
niversal H
ealth P
rotectio
n P
olicies
43
Extent of coverage Financial resources: Composition, level and trends (2011)
Human resources (and access indicators)
Live births attended by skilled health staff
Mater-nal mor-tality rate (2010)
Trends in government expenditure on health (constant US$ per capita)
Trends in out-of-pocket expenditure (constant US$ per
capita)
Country code Esti
mat
e o
f le
gal h
ealt
h c
ove
rage
as
a
per
cen
tage
of
tota
l po
pu
lati
on
1,6
Year
Per
cen
tage
of
hea
lth
exp
end
itu
re n
ot
fin
ance
d b
y o
ut
of
po
cke
t 2,
3,7
Per
cap
ita
hea
lth
exp
end
itu
re n
ot
fin
ance
d b
y p
riva
te h
ou
seh
old
s' o
ut-
of-
po
cket
pay
men
ts (
USD
)3
Go
vern
men
t ex
pen
dit
ure
on
hea
lth
in
con
stan
t U
S$ p
er c
apit
a (2
00
7)
2
Go
vern
men
t ex
pen
dit
ure
on
hea
lth
in
con
stan
t U
S$ p
er c
apit
a (2
01
1)2
Tren
ds
in p
er c
apit
a go
vern
men
t ex
pen
dit
ure
on
hea
lth
(co
nst
ant
USD
per
cap
ita
| 2
00
7–1
1; (
% a
vera
ge
ann
ual
ch
ange
) 3
Ou
t-o
f- p
ock
et e
xpen
dit
ure
in c
on
stan
t U
S$ p
er c
apit
a (2
00
7)
2
Ou
t-o
f- p
ock
et e
xpen
dit
ure
in c
on
stan
t
US$
per
cap
ita
(20
11
) 2
Tren
ds
in p
er c
apit
a O
OP
exp
end
itu
re
on
hea
lth
(co
nst
ant
US$
per
cap
ita
| 2
00
7–1
1; %
ave
rage
an
nu
al c
han
ge)
3
Co
vera
ge g
ap d
ue
to f
inan
cial
res
ou
rces
d
efic
it (
thre
sho
ld: U
S$6
0 M
DG
tar
get
for
20
15
in lo
w in
com
e) 2,
9,10
Co
vera
ge g
ap d
ue
to f
inan
cial
res
ou
rces
d
efic
it, %
(th
resh
old
: med
ian
in lo
w
vuln
erab
ility
in lo
w in
com
e U
S$2
39
) 3,
10
Co
vera
ge g
ap d
ue
to h
ealt
h p
rofe
ssio
nal
staf
f d
efi
cit
(WH
O b
ench
mar
k: 2
3)
3,8,
9
Co
vera
ge g
ap d
ue
to h
ealt
h p
rofe
ssio
nal
staf
f d
efi
cit:
(b
ench
mar
k re
lati
ve: 4
1.1
) 3,
8,13
% li
ve b
irth
s at
ten
ded
by
skill
ed h
ealt
h
staf
f2,4
Year
Mat
ern
al m
ort
alit
y ra
te (
mo
del
led
esti
mat
e, p
er 1
0,0
00
live
bir
ths)
5
Bahrain 100.0 2006 83.4 617.2 431.9 346.2 -5.4 117.1 70.7 -11.8 0.0 0.0 0.0 21.9 97.3 2009 2.0
Bangladesh 1.4 2003 38.7 ... 5.4 7.5 8.6 9.9 12.6 6.0 ... ... 75.7 86.4 31.1 2011 24.0
Bhutan 90.0 2009 84.7 78.8 63.7 58.4 -2.2 11.0 10.7 -0.7 0.0 67.0 50.9 72.6 58.2 2010 18.0
Brunei Darussalam 100.0 2010 85.2 846.5 538.2 519.9 -0.9 97.7 90.4 -1.9 0.0 0.0 0.0 0.0 99.7 2011 2.4
Cambodia 26.1 2009 43.1 22.1 5.5 8.3 11.1 13.4 21.1 12.1 55.3 90.8 55.8 75.2 71.0 2010 25.0
China 96.9 2010 65.2 181.4 44.7 89.1 18.8 41.9 55.4 7.2 0.0 24.1 0.0 29.0 99.6 2010 3.7
Cyprus 65.0 2008 50.6 1074.8 576.1 667.3 3.7 646.3 761.6 4.2 0.0 0.0 0.0 0.0 98.3 2009 1.0
Georgia 25.0 2008 35.1 109.9 25.9 34.6 7.6 103.2 123.9 4.7 0.0 54.0 0.0 0.0 97.4 2010 6.7
Hong Kong (China), Special
Administrative Region 100.0 2010 ... ... ... ... ... ... ... ... ... ... ... ... ... ... ...
India 12.5 2010 40.6 24.0 8.2 12.6 11.3 22.0 24.7 3.0 65.1 90.0 33.1 62.5 57.7 2009 20.0
Indonesia 59.0 2010 50.1 47.6 17.2 15.6 -2.3 21.0 22.5 1.8 20.7 80.1 31.6 61.7 79.8 2010 22.0
Iran, Islamic Republic
of 90.0 2005 41.5 143.8 81.1 66.1 -5.0 101.2 97.2 -1.0 0.0 39.8 9.0 49.1 99.0 2007 2.1
Iraq ... ... 80.7 267.5 27.2 61.8 22.8 11.9 13.9 3.8 0.0 0.0 15.7 52.8 88.5 2011 6.3
Israel 100.0 2011 78.6 1907.8 968.7 1060.5 2.3 322.2 368.4 3.4 0.0 0.0 0.0 0.0 ... ... 0.7
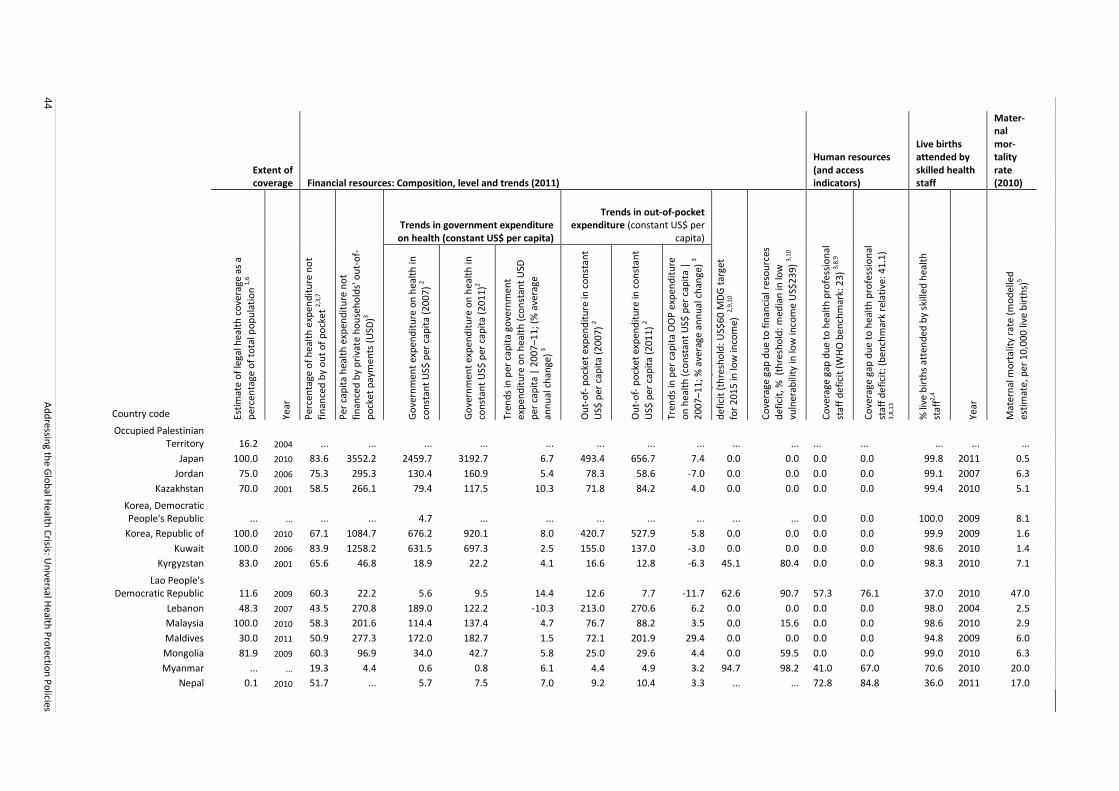
44
Ad
dressin
g the G
lob
al Health
Crisis: U
niversal H
ealth P
rotectio
n P
olicies
Extent of coverage Financial resources: Composition, level and trends (2011)
Human resources (and access indicators)
Live births attended by skilled health staff
Mater-nal mor-tality rate (2010)
Trends in government expenditure on health (constant US$ per capita)
Trends in out-of-pocket expenditure (constant US$ per
capita)
Country code Esti
mat
e o
f le
gal h
ealt
h c
ove
rage
as
a
per
cen
tage
of
tota
l po
pu
lati
on
1,6
Year
Per
cen
tage
of
hea
lth
exp
end
itu
re n
ot
fin
ance
d b
y o
ut
of
po
cke
t 2,
3,7
Per
cap
ita
hea
lth
exp
end
itu
re n
ot
fin
ance
d b
y p
riva
te h
ou
seh
old
s' o
ut-
of-
po
cket
pay
men
ts (
USD
)3
Go
vern
men
t ex
pen
dit
ure
on
hea
lth
in
con
stan
t U
S$ p
er c
apit
a (2
00
7)
2
Go
vern
men
t ex
pen
dit
ure
on
hea
lth
in
con
stan
t U
S$ p
er c
apit
a (2
01
1)2
Tren
ds
in p
er c
apit
a go
vern
men
t ex
pen
dit
ure
on
hea
lth
(co
nst
ant
USD
per
cap
ita
| 2
00
7–1
1; (
% a
vera
ge
ann
ual
ch
ange
) 3
Ou
t-o
f- p
ock
et e
xpen
dit
ure
in c
on
stan
t U
S$ p
er c
apit
a (2
00
7)
2
Ou
t-o
f- p
ock
et e
xpen
dit
ure
in c
on
stan
t
US$
per
cap
ita
(20
11
) 2
Tren
ds
in p
er c
apit
a O
OP
exp
end
itu
re
on
hea
lth
(co
nst
ant
US$
per
cap
ita
| 2
00
7–1
1; %
ave
rage
an
nu
al c
han
ge)
3
Co
vera
ge g
ap d
ue
to f
inan
cial
res
ou
rces
d
efic
it (
thre
sho
ld: U
S$6
0 M
DG
tar
get
for
20
15
in lo
w in
com
e) 2,
9,10
Co
vera
ge g
ap d
ue
to f
inan
cial
res
ou
rces
d
efic
it, %
(th
resh
old
: med
ian
in lo
w
vuln
erab
ility
in lo
w in
com
e U
S$2
39
) 3,
10
Co
vera
ge g
ap d
ue
to h
ealt
h p
rofe
ssio
nal
staf
f d
efi
cit
(WH
O b
ench
mar
k: 2
3)
3,8,
9
Co
vera
ge g
ap d
ue
to h
ealt
h p
rofe
ssio
nal
staf
f d
efi
cit:
(b
ench
mar
k re
lati
ve: 4
1.1
) 3,
8,13
% li
ve b
irth
s at
ten
ded
by
skill
ed h
ealt
h
staf
f2,4
Year
Mat
ern
al m
ort
alit
y ra
te (
mo
del
led
esti
mat
e, p
er 1
0,0
00
live
bir
ths)
5
Occupied Palestinian
Territory 16.2 2004 ... ... ... ... ... ... ... ... ... ... ... ... ... ... ...
Japan 100.0 2010 83.6 3552.2 2459.7 3192.7 6.7 493.4 656.7 7.4 0.0 0.0 0.0 0.0 99.8 2011 0.5
Jordan 75.0 2006 75.3 295.3 130.4 160.9 5.4 78.3 58.6 -7.0 0.0 0.0 0.0 0.0 99.1 2007 6.3
Kazakhstan 70.0 2001 58.5 266.1 79.4 117.5 10.3 71.8 84.2 4.0 0.0 0.0 0.0 0.0 99.4 2010 5.1
Korea, Democratic People's Republic ... ... ... ... 4.7 ... ... ... ... ... ... ... 0.0 0.0 100.0 2009 8.1
Korea, Republic of 100.0 2010 67.1 1084.7 676.2 920.1 8.0 420.7 527.9 5.8 0.0 0.0 0.0 0.0 99.9 2009 1.6
Kuwait 100.0 2006 83.9 1258.2 631.5 697.3 2.5 155.0 137.0 -3.0 0.0 0.0 0.0 0.0 98.6 2010 1.4
Kyrgyzstan 83.0 2001 65.6 46.8 18.9 22.2 4.1 16.6 12.8 -6.3 45.1 80.4 0.0 0.0 98.3 2010 7.1
Lao People's
Democratic Republic 11.6 2009 60.3 22.2 5.6 9.5 14.4 12.6 7.7 -11.7 62.6 90.7 57.3 76.1 37.0 2010 47.0
Lebanon 48.3 2007 43.5 270.8 189.0 122.2 -10.3 213.0 270.6 6.2 0.0 0.0 0.0 0.0 98.0 2004 2.5
Malaysia 100.0 2010 58.3 201.6 114.4 137.4 4.7 76.7 88.2 3.5 0.0 15.6 0.0 0.0 98.6 2010 2.9
Maldives 30.0 2011 50.9 277.3 172.0 182.7 1.5 72.1 201.9 29.4 0.0 0.0 0.0 0.0 94.8 2009 6.0
Mongolia 81.9 2009 60.3 96.9 34.0 42.7 5.8 25.0 29.6 4.4 0.0 59.5 0.0 0.0 99.0 2010 6.3
Myanmar ... ... 19.3 4.4 0.6 0.8 6.1 4.4 4.9 3.2 94.7 98.2 41.0 67.0 70.6 2010 20.0
Nepal 0.1 2010 51.7 ... 5.7 7.5 7.0 9.2 10.4 3.3 ... ... 72.8 84.8 36.0 2011 17.0
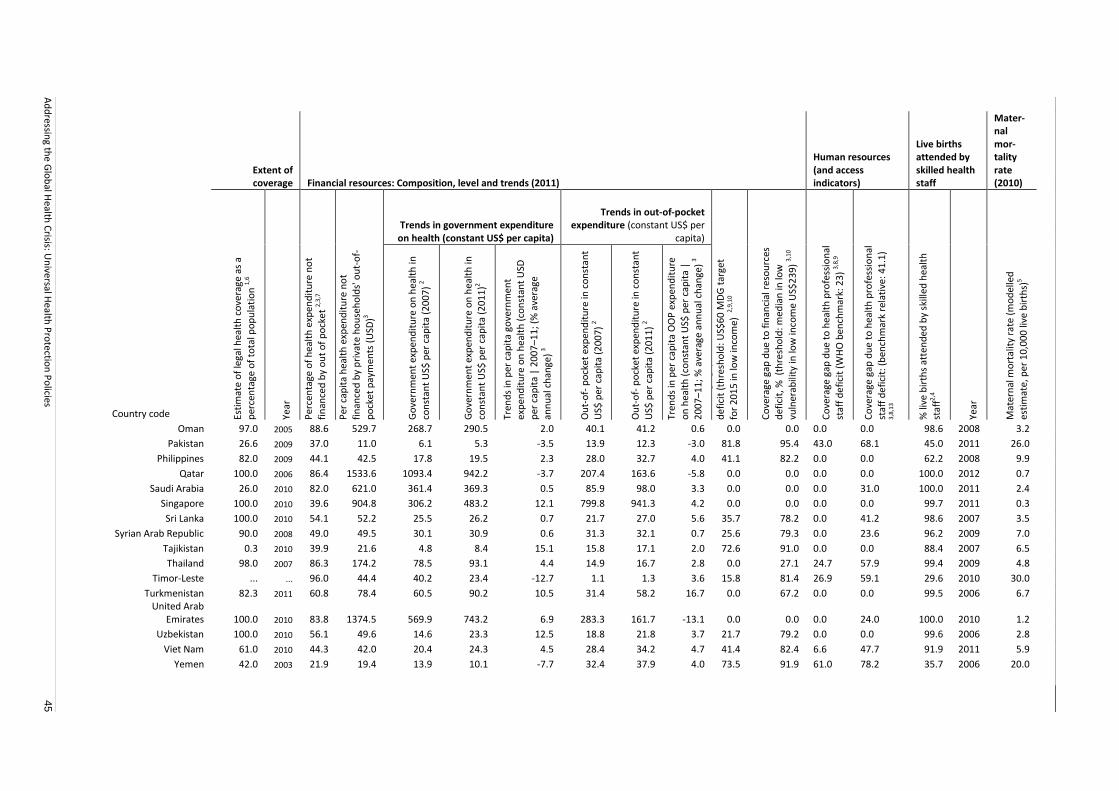
Ad
dressin
g the G
lob
al Health
Crisis: U
niversal H
ealth P
rotectio
n P
olicies
45
Extent of coverage Financial resources: Composition, level and trends (2011)
Human resources (and access indicators)
Live births attended by skilled health staff
Mater-nal mor-tality rate (2010)
Trends in government expenditure on health (constant US$ per capita)
Trends in out-of-pocket expenditure (constant US$ per
capita)
Country code Esti
mat
e o
f le
gal h
ealt
h c
ove
rage
as
a
per
cen
tage
of
tota
l po
pu
lati
on
1,6
Year
Per
cen
tage
of
hea
lth
exp
end
itu
re n
ot
fin
ance
d b
y o
ut
of
po
cke
t 2,
3,7
Per
cap
ita
hea
lth
exp
end
itu
re n
ot
fin
ance
d b
y p
riva
te h
ou
seh
old
s' o
ut-
of-
po
cket
pay
men
ts (
USD
)3
Go
vern
men
t ex
pen
dit
ure
on
hea
lth
in
con
stan
t U
S$ p
er c
apit
a (2
00
7)
2
Go
vern
men
t ex
pen
dit
ure
on
hea
lth
in
con
stan
t U
S$ p
er c
apit
a (2
01
1)2
Tren
ds
in p
er c
apit
a go
vern
men
t ex
pen
dit
ure
on
hea
lth
(co
nst
ant
USD
per
cap
ita
| 2
00
7–1
1; (
% a
vera
ge
ann
ual
ch
ange
) 3
Ou
t-o
f- p
ock
et e
xpen
dit
ure
in c
on
stan
t U
S$ p
er c
apit
a (2
00
7)
2
Ou
t-o
f- p
ock
et e
xpen
dit
ure
in c
on
stan
t
US$
per
cap
ita
(20
11
) 2
Tren
ds
in p
er c
apit
a O
OP
exp
end
itu
re
on
hea
lth
(co
nst
ant
US$
per
cap
ita
| 2
00
7–1
1; %
ave
rage
an
nu
al c
han
ge)
3
Co
vera
ge g
ap d
ue
to f
inan
cial
res
ou
rces
d
efic
it (
thre
sho
ld: U
S$6
0 M
DG
tar
get
for
20
15
in lo
w in
com
e) 2,
9,10
Co
vera
ge g
ap d
ue
to f
inan
cial
res
ou
rces
d
efic
it, %
(th
resh
old
: med
ian
in lo
w
vuln
erab
ility
in lo
w in
com
e U
S$2
39
) 3,
10
Co
vera
ge g
ap d
ue
to h
ealt
h p
rofe
ssio
nal
staf
f d
efi
cit
(WH
O b
ench
mar
k: 2
3)
3,8,
9
Co
vera
ge g
ap d
ue
to h
ealt
h p
rofe
ssio
nal
staf
f d
efi
cit:
(b
ench
mar
k re
lati
ve: 4
1.1
) 3,
8,13
% li
ve b
irth
s at
ten
ded
by
skill
ed h
ealt
h
staf
f2,4
Year
Mat
ern
al m
ort
alit
y ra
te (
mo
del
led
esti
mat
e, p
er 1
0,0
00
live
bir
ths)
5
Oman 97.0 2005 88.6 529.7 268.7 290.5 2.0 40.1 41.2 0.6 0.0 0.0 0.0 0.0 98.6 2008 3.2
Pakistan 26.6 2009 37.0 11.0 6.1 5.3 -3.5 13.9 12.3 -3.0 81.8 95.4 43.0 68.1 45.0 2011 26.0
Philippines 82.0 2009 44.1 42.5 17.8 19.5 2.3 28.0 32.7 4.0 41.1 82.2 0.0 0.0 62.2 2008 9.9
Qatar 100.0 2006 86.4 1533.6 1093.4 942.2 -3.7 207.4 163.6 -5.8 0.0 0.0 0.0 0.0 100.0 2012 0.7
Saudi Arabia 26.0 2010 82.0 621.0 361.4 369.3 0.5 85.9 98.0 3.3 0.0 0.0 0.0 31.0 100.0 2011 2.4
Singapore 100.0 2010 39.6 904.8 306.2 483.2 12.1 799.8 941.3 4.2 0.0 0.0 0.0 0.0 99.7 2011 0.3
Sri Lanka 100.0 2010 54.1 52.2 25.5 26.2 0.7 21.7 27.0 5.6 35.7 78.2 0.0 41.2 98.6 2007 3.5
Syrian Arab Republic 90.0 2008 49.0 49.5 30.1 30.9 0.6 31.3 32.1 0.7 25.6 79.3 0.0 23.6 96.2 2009 7.0
Tajikistan 0.3 2010 39.9 21.6 4.8 8.4 15.1 15.8 17.1 2.0 72.6 91.0 0.0 0.0 88.4 2007 6.5
Thailand 98.0 2007 86.3 174.2 78.5 93.1 4.4 14.9 16.7 2.8 0.0 27.1 24.7 57.9 99.4 2009 4.8
Timor-Leste ... ... 96.0 44.4 40.2 23.4 -12.7 1.1 1.3 3.6 15.8 81.4 26.9 59.1 29.6 2010 30.0
Turkmenistan 82.3 2011 60.8 78.4 60.5 90.2 10.5 31.4 58.2 16.7 0.0 67.2 0.0 0.0 99.5 2006 6.7
United Arab
Emirates 100.0 2010 83.8 1374.5 569.9 743.2 6.9 283.3 161.7 -13.1 0.0 0.0 0.0 24.0 100.0 2010 1.2
Uzbekistan 100.0 2010 56.1 49.6 14.6 23.3 12.5 18.8 21.8 3.7 21.7 79.2 0.0 0.0 99.6 2006 2.8
Viet Nam 61.0 2010 44.3 42.0 20.4 24.3 4.5 28.4 34.2 4.7 41.4 82.4 6.6 47.7 91.9 2011 5.9
Yemen 42.0 2003 21.9 19.4 13.9 10.1 -7.7 32.4 37.9 4.0 73.5 91.9 61.0 78.2 35.7 2006 20.0
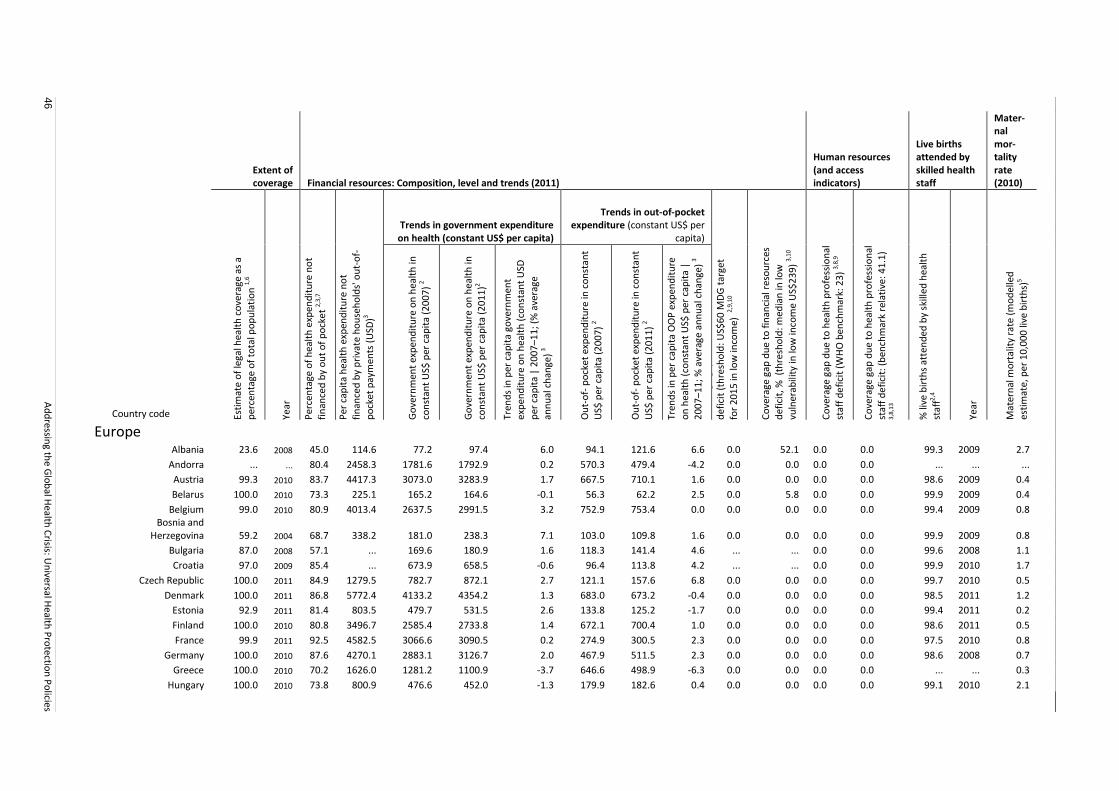
46
Ad
dressin
g the G
lob
al Health
Crisis: U
niversal H
ealth P
rotectio
n P
olicies
Extent of coverage Financial resources: Composition, level and trends (2011)
Human resources (and access indicators)
Live births attended by skilled health staff
Mater-nal mor-tality rate (2010)
Trends in government expenditure on health (constant US$ per capita)
Trends in out-of-pocket expenditure (constant US$ per
capita)
Country code Esti
mat
e o
f le
gal h
ealt
h c
ove
rage
as
a
per
cen
tage
of
tota
l po
pu
lati
on
1,6
Year
Per
cen
tage
of
hea
lth
exp
end
itu
re n
ot
fin
ance
d b
y o
ut
of
po
cke
t 2,
3,7
Per
cap
ita
hea
lth
exp
end
itu
re n
ot
fin
ance
d b
y p
riva
te h
ou
seh
old
s' o
ut-
of-
po
cket
pay
men
ts (
USD
)3
Go
vern
men
t ex
pen
dit
ure
on
hea
lth
in
con
stan
t U
S$ p
er c
apit
a (2
00
7)
2
Go
vern
men
t ex
pen
dit
ure
on
hea
lth
in
con
stan
t U
S$ p
er c
apit
a (2
01
1)2
Tren
ds
in p
er c
apit
a go
vern
men
t ex
pen
dit
ure
on
hea
lth
(co
nst
ant
USD
per
cap
ita
| 2
00
7–1
1; (
% a
vera
ge
ann
ual
ch
ange
) 3
Ou
t-o
f- p
ock
et e
xpen
dit
ure
in c
on
stan
t U
S$ p
er c
apit
a (2
00
7)
2
Ou
t-o
f- p
ock
et e
xpen
dit
ure
in c
on
stan
t
US$
per
cap
ita
(20
11
) 2
Tren
ds
in p
er c
apit
a O
OP
exp
end
itu
re
on
hea
lth
(co
nst
ant
US$
per
cap
ita
| 2
00
7–1
1; %
ave
rage
an
nu
al c
han
ge)
3
Co
vera
ge g
ap d
ue
to f
inan
cial
res
ou
rces
d
efic
it (
thre
sho
ld: U
S$6
0 M
DG
tar
get
for
20
15
in lo
w in
com
e) 2,
9,10
Co
vera
ge g
ap d
ue
to f
inan
cial
res
ou
rces
d
efic
it, %
(th
resh
old
: med
ian
in lo
w
vuln
erab
ility
in lo
w in
com
e U
S$2
39
) 3,
10
Co
vera
ge g
ap d
ue
to h
ealt
h p
rofe
ssio
nal
staf
f d
efi
cit
(WH
O b
ench
mar
k: 2
3)
3,8,
9
Co
vera
ge g
ap d
ue
to h
ealt
h p
rofe
ssio
nal
staf
f d
efi
cit:
(b
ench
mar
k re
lati
ve: 4
1.1
) 3,
8,13
% li
ve b
irth
s at
ten
ded
by
skill
ed h
ealt
h
staf
f2,4
Year
Mat
ern
al m
ort
alit
y ra
te (
mo
del
led
esti
mat
e, p
er 1
0,0
00
live
bir
ths)
5
Europe
Albania 23.6 2008 45.0 114.6 77.2 97.4 6.0 94.1 121.6 6.6 0.0 52.1 0.0 0.0 99.3 2009 2.7
Andorra ... ... 80.4 2458.3 1781.6 1792.9 0.2 570.3 479.4 -4.2 0.0 0.0 0.0 0.0 ... ... ...
Austria 99.3 2010 83.7 4417.3 3073.0 3283.9 1.7 667.5 710.1 1.6 0.0 0.0 0.0 0.0 98.6 2009 0.4
Belarus 100.0 2010 73.3 225.1 165.2 164.6 -0.1 56.3 62.2 2.5 0.0 5.8 0.0 0.0 99.9 2009 0.4
Belgium 99.0 2010 80.9 4013.4 2637.5 2991.5 3.2 752.9 753.4 0.0 0.0 0.0 0.0 0.0 99.4 2009 0.8
Bosnia and
Herzegovina 59.2 2004 68.7 338.2 181.0 238.3 7.1 103.0 109.8 1.6 0.0 0.0 0.0 0.0 99.9 2009 0.8
Bulgaria 87.0 2008 57.1 ... 169.6 180.9 1.6 118.3 141.4 4.6 ... ... 0.0 0.0 99.6 2008 1.1
Croatia 97.0 2009 85.4 ... 673.9 658.5 -0.6 96.4 113.8 4.2 ... ... 0.0 0.0 99.9 2010 1.7
Czech Republic 100.0 2011 84.9 1279.5 782.7 872.1 2.7 121.1 157.6 6.8 0.0 0.0 0.0 0.0 99.7 2010 0.5
Denmark 100.0 2011 86.8 5772.4 4133.2 4354.2 1.3 683.0 673.2 -0.4 0.0 0.0 0.0 0.0 98.5 2011 1.2
Estonia 92.9 2011 81.4 803.5 479.7 531.5 2.6 133.8 125.2 -1.7 0.0 0.0 0.0 0.0 99.4 2011 0.2
Finland 100.0 2010 80.8 3496.7 2585.4 2733.8 1.4 672.1 700.4 1.0 0.0 0.0 0.0 0.0 98.6 2011 0.5
France 99.9 2011 92.5 4582.5 3066.6 3090.5 0.2 274.9 300.5 2.3 0.0 0.0 0.0 0.0 97.5 2010 0.8
Germany 100.0 2010 87.6 4270.1 2883.1 3126.7 2.0 467.9 511.5 2.3 0.0 0.0 0.0 0.0 98.6 2008 0.7
Greece 100.0 2010 70.2 1626.0 1281.2 1100.9 -3.7 646.6 498.9 -6.3 0.0 0.0 0.0 0.0 ... ... 0.3
Hungary 100.0 2010 73.8 800.9 476.6 452.0 -1.3 179.9 182.6 0.4 0.0 0.0 0.0 0.0 99.1 2010 2.1
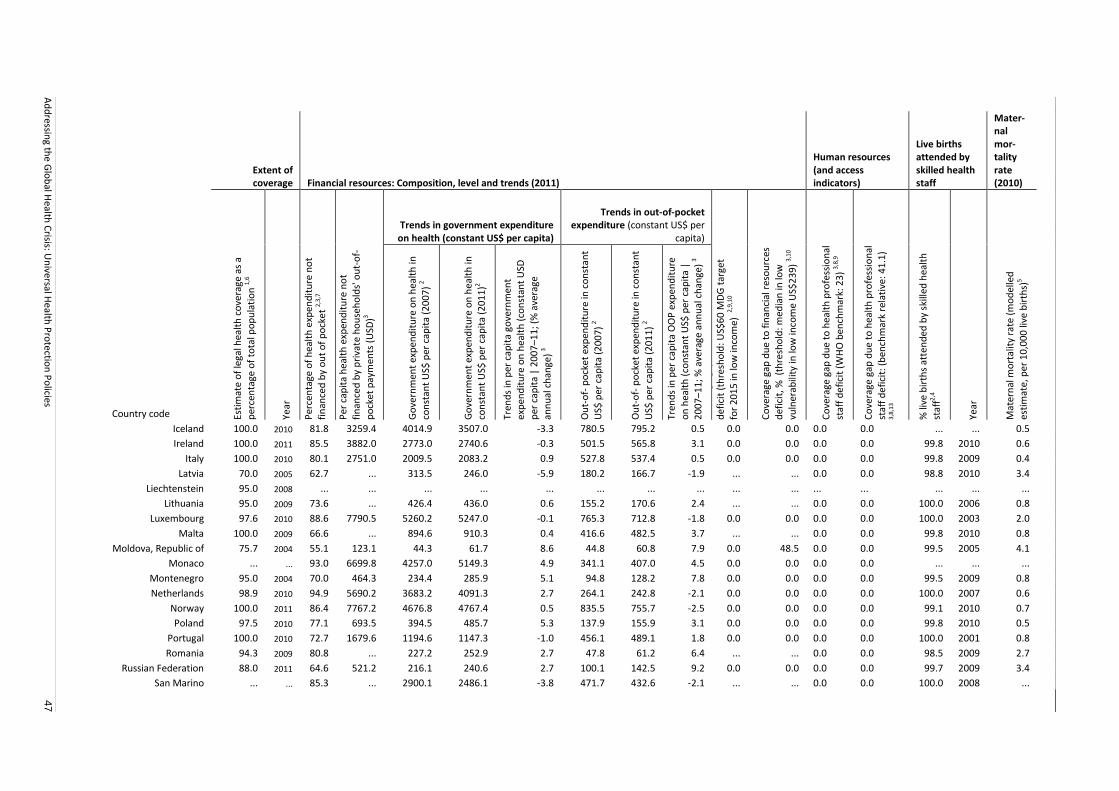
Ad
dressin
g the G
lob
al Health
Crisis: U
niversal H
ealth P
rotectio
n P
olicies
47
Extent of coverage Financial resources: Composition, level and trends (2011)
Human resources (and access indicators)
Live births attended by skilled health staff
Mater-nal mor-tality rate (2010)
Trends in government expenditure on health (constant US$ per capita)
Trends in out-of-pocket expenditure (constant US$ per
capita)
Country code Esti
mat
e o
f le
gal h
ealt
h c
ove
rage
as
a
per
cen
tage
of
tota
l po
pu
lati
on
1,6
Year
Per
cen
tage
of
hea
lth
exp
end
itu
re n
ot
fin
ance
d b
y o
ut
of
po
cke
t 2,
3,7
Per
cap
ita
hea
lth
exp
end
itu
re n
ot
fin
ance
d b
y p
riva
te h
ou
seh
old
s' o
ut-
of-
po
cket
pay
men
ts (
USD
)3
Go
vern
men
t ex
pen
dit
ure
on
hea
lth
in
con
stan
t U
S$ p
er c
apit
a (2
00
7)
2
Go
vern
men
t ex
pen
dit
ure
on
hea
lth
in
con
stan
t U
S$ p
er c
apit
a (2
01
1)2
Tren
ds
in p
er c
apit
a go
vern
men
t ex
pen
dit
ure
on
hea
lth
(co
nst
ant
USD
per
cap
ita
| 2
00
7–1
1; (
% a
vera
ge
ann
ual
ch
ange
) 3
Ou
t-o
f- p
ock
et e
xpen
dit
ure
in c
on
stan
t U
S$ p
er c
apit
a (2
00
7)
2
Ou
t-o
f- p
ock
et e
xpen
dit
ure
in c
on
stan
t
US$
per
cap
ita
(20
11
) 2
Tren
ds
in p
er c
apit
a O
OP
exp
end
itu
re
on
hea
lth
(co
nst
ant
US$
per
cap
ita
| 2
00
7–1
1; %
ave
rage
an
nu
al c
han
ge)
3
Co
vera
ge g
ap d
ue
to f
inan
cial
res
ou
rces
d
efic
it (
thre
sho
ld: U
S$6
0 M
DG
tar
get
for
20
15
in lo
w in
com
e) 2,
9,10
Co
vera
ge g
ap d
ue
to f
inan
cial
res
ou
rces
d
efic
it, %
(th
resh
old
: med
ian
in lo
w
vuln
erab
ility
in lo
w in
com
e U
S$2
39
) 3,
10
Co
vera
ge g
ap d
ue
to h
ealt
h p
rofe
ssio
nal
staf
f d
efi
cit
(WH
O b
ench
mar
k: 2
3)
3,8,
9
Co
vera
ge g
ap d
ue
to h
ealt
h p
rofe
ssio
nal
staf
f d
efi
cit:
(b
ench
mar
k re
lati
ve: 4
1.1
) 3,
8,13
% li
ve b
irth
s at
ten
ded
by
skill
ed h
ealt
h
staf
f2,4
Year
Mat
ern
al m
ort
alit
y ra
te (
mo
del
led
esti
mat
e, p
er 1
0,0
00
live
bir
ths)
5
Iceland 100.0 2010 81.8 3259.4 4014.9 3507.0 -3.3 780.5 795.2 0.5 0.0 0.0 0.0 0.0 ... ... 0.5
Ireland 100.0 2011 85.5 3882.0 2773.0 2740.6 -0.3 501.5 565.8 3.1 0.0 0.0 0.0 0.0 99.8 2010 0.6
Italy 100.0 2010 80.1 2751.0 2009.5 2083.2 0.9 527.8 537.4 0.5 0.0 0.0 0.0 0.0 99.8 2009 0.4
Latvia 70.0 2005 62.7 ... 313.5 246.0 -5.9 180.2 166.7 -1.9 ... ... 0.0 0.0 98.8 2010 3.4
Liechtenstein 95.0 2008 ... ... ... ... ... ... ... ... ... ... ... ... ... ... ...
Lithuania 95.0 2009 73.6 ... 426.4 436.0 0.6 155.2 170.6 2.4 ... ... 0.0 0.0 100.0 2006 0.8
Luxembourg 97.6 2010 88.6 7790.5 5260.2 5247.0 -0.1 765.3 712.8 -1.8 0.0 0.0 0.0 0.0 100.0 2003 2.0
Malta 100.0 2009 66.6 ... 894.6 910.3 0.4 416.6 482.5 3.7 ... ... 0.0 0.0 99.8 2010 0.8
Moldova, Republic of 75.7 2004 55.1 123.1 44.3 61.7 8.6 44.8 60.8 7.9 0.0 48.5 0.0 0.0 99.5 2005 4.1
Monaco ... ... 93.0 6699.8 4257.0 5149.3 4.9 341.1 407.0 4.5 0.0 0.0 0.0 0.0 ... ... ...
Montenegro 95.0 2004 70.0 464.3 234.4 285.9 5.1 94.8 128.2 7.8 0.0 0.0 0.0 0.0 99.5 2009 0.8
Netherlands 98.9 2010 94.9 5690.2 3683.2 4091.3 2.7 264.1 242.8 -2.1 0.0 0.0 0.0 0.0 100.0 2007 0.6
Norway 100.0 2011 86.4 7767.2 4676.8 4767.4 0.5 835.5 755.7 -2.5 0.0 0.0 0.0 0.0 99.1 2010 0.7
Poland 97.5 2010 77.1 693.5 394.5 485.7 5.3 137.9 155.9 3.1 0.0 0.0 0.0 0.0 99.8 2010 0.5
Portugal 100.0 2010 72.7 1679.6 1194.6 1147.3 -1.0 456.1 489.1 1.8 0.0 0.0 0.0 0.0 100.0 2001 0.8
Romania 94.3 2009 80.8 ... 227.2 252.9 2.7 47.8 61.2 6.4 ... ... 0.0 0.0 98.5 2009 2.7
Russian Federation 88.0 2011 64.6 521.2 216.1 240.6 2.7 100.1 142.5 9.2 0.0 0.0 0.0 0.0 99.7 2009 3.4
San Marino ... ... 85.3 ... 2900.1 2486.1 -3.8 471.7 432.6 -2.1 ... ... 0.0 0.0 100.0 2008 ...
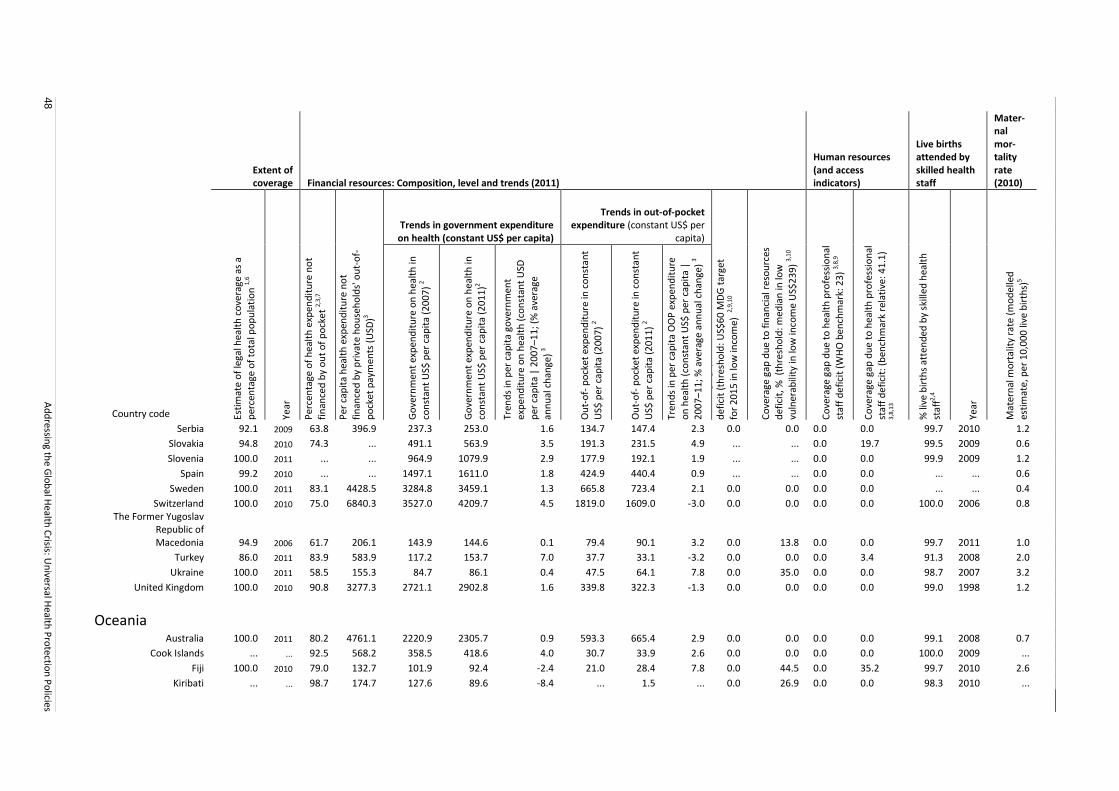
48
Ad
dressin
g the G
lob
al Health
Crisis: U
niversal H
ealth P
rotectio
n P
olicies
Extent of coverage Financial resources: Composition, level and trends (2011)
Human resources (and access indicators)
Live births attended by skilled health staff
Mater-nal mor-tality rate (2010)
Trends in government expenditure on health (constant US$ per capita)
Trends in out-of-pocket expenditure (constant US$ per
capita)
Country code Esti
mat
e o
f le
gal h
ealt
h c
ove
rage
as
a
per
cen
tage
of
tota
l po
pu
lati
on
1,6
Year
Per
cen
tage
of
hea
lth
exp
end
itu
re n
ot
fin
ance
d b
y o
ut
of
po
cke
t 2,
3,7
Per
cap
ita
hea
lth
exp
end
itu
re n
ot
fin
ance
d b
y p
riva
te h
ou
seh
old
s' o
ut-
of-
po
cket
pay
men
ts (
USD
)3
Go
vern
men
t ex
pen
dit
ure
on
hea
lth
in
con
stan
t U
S$ p
er c
apit
a (2
00
7)
2
Go
vern
men
t ex
pen
dit
ure
on
hea
lth
in
con
stan
t U
S$ p
er c
apit
a (2
01
1)2
Tren
ds
in p
er c
apit
a go
vern
men
t ex
pen
dit
ure
on
hea
lth
(co
nst
ant
USD
per
cap
ita
| 2
00
7–1
1; (
% a
vera
ge
ann
ual
ch
ange
) 3
Ou
t-o
f- p
ock
et e
xpen
dit
ure
in c
on
stan
t U
S$ p
er c
apit
a (2
00
7)
2
Ou
t-o
f- p
ock
et e
xpen
dit
ure
in c
on
stan
t
US$
per
cap
ita
(20
11
) 2
Tren
ds
in p
er c
apit
a O
OP
exp
end
itu
re
on
hea
lth
(co
nst
ant
US$
per
cap
ita
| 2
00
7–1
1; %
ave
rage
an
nu
al c
han
ge)
3
Co
vera
ge g
ap d
ue
to f
inan
cial
res
ou
rces
d
efic
it (
thre
sho
ld: U
S$6
0 M
DG
tar
get
for
20
15
in lo
w in
com
e) 2,
9,10
Co
vera
ge g
ap d
ue
to f
inan
cial
res
ou
rces
d
efic
it, %
(th
resh
old
: med
ian
in lo
w
vuln
erab
ility
in lo
w in
com
e U
S$2
39
) 3,
10
Co
vera
ge g
ap d
ue
to h
ealt
h p
rofe
ssio
nal
staf
f d
efi
cit
(WH
O b
ench
mar
k: 2
3)
3,8,
9
Co
vera
ge g
ap d
ue
to h
ealt
h p
rofe
ssio
nal
staf
f d
efi
cit:
(b
ench
mar
k re
lati
ve: 4
1.1
) 3,
8,13
% li
ve b
irth
s at
ten
ded
by
skill
ed h
ealt
h
staf
f2,4
Year
Mat
ern
al m
ort
alit
y ra
te (
mo
del
led
esti
mat
e, p
er 1
0,0
00
live
bir
ths)
5
Serbia 92.1 2009 63.8 396.9 237.3 253.0 1.6 134.7 147.4 2.3 0.0 0.0 0.0 0.0 99.7 2010 1.2
Slovakia 94.8 2010 74.3 ... 491.1 563.9 3.5 191.3 231.5 4.9 ... ... 0.0 19.7 99.5 2009 0.6
Slovenia 100.0 2011 ... ... 964.9 1079.9 2.9 177.9 192.1 1.9 ... ... 0.0 0.0 99.9 2009 1.2
Spain 99.2 2010 ... ... 1497.1 1611.0 1.8 424.9 440.4 0.9 ... ... 0.0 0.0 ... ... 0.6
Sweden 100.0 2011 83.1 4428.5 3284.8 3459.1 1.3 665.8 723.4 2.1 0.0 0.0 0.0 0.0 ... ... 0.4
Switzerland 100.0 2010 75.0 6840.3 3527.0 4209.7 4.5 1819.0 1609.0 -3.0 0.0 0.0 0.0 0.0 100.0 2006 0.8
The Former Yugoslav Republic of Macedonia 94.9 2006 61.7 206.1 143.9 144.6 0.1 79.4 90.1 3.2 0.0 13.8 0.0 0.0 99.7 2011 1.0
Turkey 86.0 2011 83.9 583.9 117.2 153.7 7.0 37.7 33.1 -3.2 0.0 0.0 0.0 3.4 91.3 2008 2.0
Ukraine 100.0 2011 58.5 155.3 84.7 86.1 0.4 47.5 64.1 7.8 0.0 35.0 0.0 0.0 98.7 2007 3.2
United Kingdom 100.0 2010 90.8 3277.3 2721.1 2902.8 1.6 339.8 322.3 -1.3 0.0 0.0 0.0 0.0 99.0 1998 1.2
Oceania
Australia 100.0 2011 80.2 4761.1 2220.9 2305.7 0.9 593.3 665.4 2.9 0.0 0.0 0.0 0.0 99.1 2008 0.7
Cook Islands ... ... 92.5 568.2 358.5 418.6 4.0 30.7 33.9 2.6 0.0 0.0 0.0 0.0 100.0 2009 ...
Fiji 100.0 2010 79.0 132.7 101.9 92.4 -2.4 21.0 28.4 7.8 0.0 44.5 0.0 35.2 99.7 2010 2.6
Kiribati ... ... 98.7 174.7 127.6 89.6 -8.4 ... 1.5 ... 0.0 26.9 0.0 0.0 98.3 2010 ...
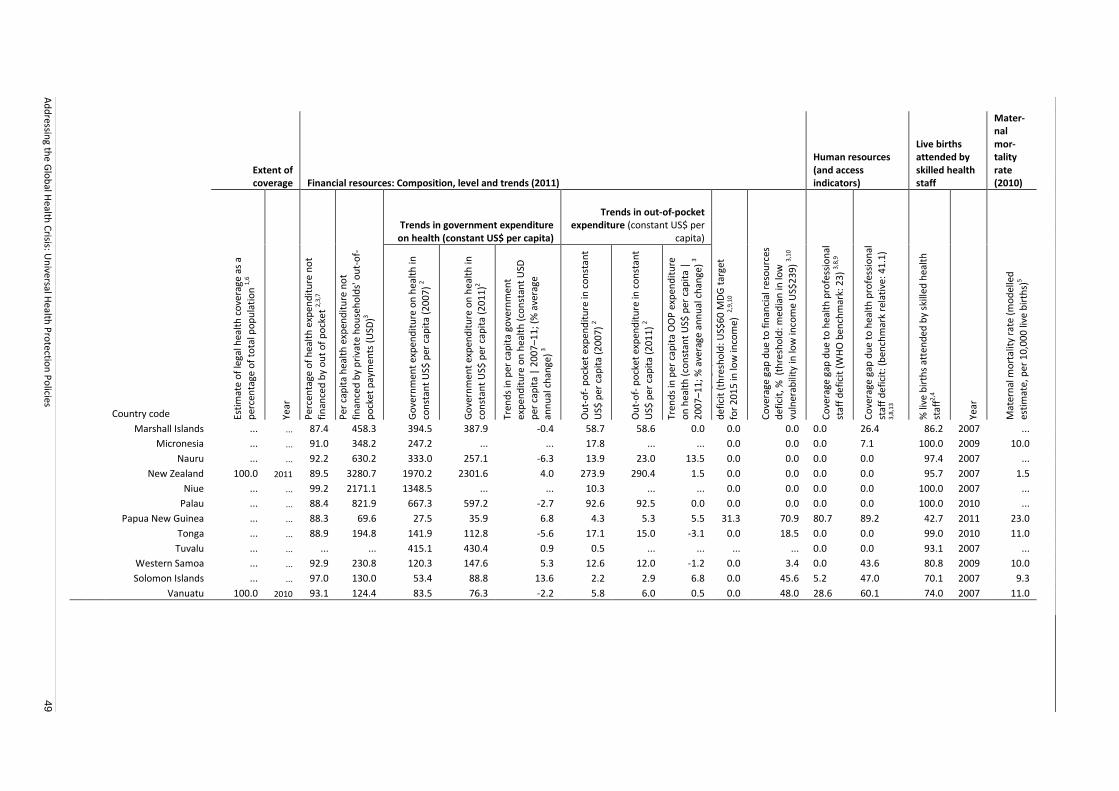
Ad
dressin
g the G
lob
al Health
Crisis: U
niversal H
ealth P
rotectio
n P
olicies
49
Extent of coverage Financial resources: Composition, level and trends (2011)
Human resources (and access indicators)
Live births attended by skilled health staff
Mater-nal mor-tality rate (2010)
Trends in government expenditure on health (constant US$ per capita)
Trends in out-of-pocket expenditure (constant US$ per
capita)
Country code Esti
mat
e o
f le
gal h
ealt
h c
ove
rage
as
a
per
cen
tage
of
tota
l po
pu
lati
on
1,6
Year
Per
cen
tage
of
hea
lth
exp
end
itu
re n
ot
fin
ance
d b
y o
ut
of
po
cke
t 2,
3,7
Per
cap
ita
hea
lth
exp
end
itu
re n
ot
fin
ance
d b
y p
riva
te h
ou
seh
old
s' o
ut-
of-
po
cket
pay
men
ts (
USD
)3
Go
vern
men
t ex
pen
dit
ure
on
hea
lth
in
con
stan
t U
S$ p
er c
apit
a (2
00
7)
2
Go
vern
men
t ex
pen
dit
ure
on
hea
lth
in
con
stan
t U
S$ p
er c
apit
a (2
01
1)2
Tren
ds
in p
er c
apit
a go
vern
men
t ex
pen
dit
ure
on
hea
lth
(co
nst
ant
USD
per
cap
ita
| 2
00
7–1
1; (
% a
vera
ge
ann
ual
ch
ange
) 3
Ou
t-o
f- p
ock
et e
xpen
dit
ure
in c
on
stan
t U
S$ p
er c
apit
a (2
00
7)
2
Ou
t-o
f- p
ock
et e
xpen
dit
ure
in c
on
stan
t
US$
per
cap
ita
(20
11
) 2
Tren
ds
in p
er c
apit
a O
OP
exp
end
itu
re
on
hea
lth
(co
nst
ant
US$
per
cap
ita
| 2
00
7–1
1; %
ave
rage
an
nu
al c
han
ge)
3
Co
vera
ge g
ap d
ue
to f
inan
cial
res
ou
rces
d
efic
it (
thre
sho
ld: U
S$6
0 M
DG
tar
get
for
20
15
in lo
w in
com
e) 2,
9,10
Co
vera
ge g
ap d
ue
to f
inan
cial
res
ou
rces
d
efic
it, %
(th
resh
old
: med
ian
in lo
w
vuln
erab
ility
in lo
w in
com
e U
S$2
39
) 3,
10
Co
vera
ge g
ap d
ue
to h
ealt
h p
rofe
ssio
nal
staf
f d
efi
cit
(WH
O b
ench
mar
k: 2
3)
3,8,
9
Co
vera
ge g
ap d
ue
to h
ealt
h p
rofe
ssio
nal
staf
f d
efi
cit:
(b
ench
mar
k re
lati
ve: 4
1.1
) 3,
8,13
% li
ve b
irth
s at
ten
ded
by
skill
ed h
ealt
h
staf
f2,4
Year
Mat
ern
al m
ort
alit
y ra
te (
mo
del
led
esti
mat
e, p
er 1
0,0
00
live
bir
ths)
5
Marshall Islands ... ... 87.4 458.3 394.5 387.9 -0.4 58.7 58.6 0.0 0.0 0.0 0.0 26.4 86.2 2007 ...
Micronesia ... ... 91.0 348.2 247.2 ... ... 17.8 ... ... 0.0 0.0 0.0 7.1 100.0 2009 10.0
Nauru ... ... 92.2 630.2 333.0 257.1 -6.3 13.9 23.0 13.5 0.0 0.0 0.0 0.0 97.4 2007 ...
New Zealand 100.0 2011 89.5 3280.7 1970.2 2301.6 4.0 273.9 290.4 1.5 0.0 0.0 0.0 0.0 95.7 2007 1.5
Niue ... ... 99.2 2171.1 1348.5 ... ... 10.3 ... ... 0.0 0.0 0.0 0.0 100.0 2007 ...
Palau ... ... 88.4 821.9 667.3 597.2 -2.7 92.6 92.5 0.0 0.0 0.0 0.0 0.0 100.0 2010 ...
Papua New Guinea ... ... 88.3 69.6 27.5 35.9 6.8 4.3 5.3 5.5 31.3 70.9 80.7 89.2 42.7 2011 23.0
Tonga ... ... 88.9 194.8 141.9 112.8 -5.6 17.1 15.0 -3.1 0.0 18.5 0.0 0.0 99.0 2010 11.0
Tuvalu ... ... ... ... 415.1 430.4 0.9 0.5 ... ... ... ... 0.0 0.0 93.1 2007 ...
Western Samoa ... ... 92.9 230.8 120.3 147.6 5.3 12.6 12.0 -1.2 0.0 3.4 0.0 43.6 80.8 2009 10.0
Solomon Islands ... ... 97.0 130.0 53.4 88.8 13.6 2.2 2.9 6.8 0.0 45.6 5.2 47.0 70.1 2007 9.3
Vanuatu 100.0 2010 93.1 124.4 83.5 76.3 -2.2 5.8 6.0 0.5 0.0 48.0 28.6 60.1 74.0 2007 11.0

50 Universal Health Protection
Sources 1 Non-OECD countries: consult detailed sources available at: http://www.social-protection.org/gimi/gess/ RessFileDownload.do?ressourceId=37218; OECD countries: OECD Health Data 2011 , Health care coverage. Information available at: http://www. oecd.org/document/30/0,3746,en_2649_37407_12968734_1_1_1_37407,00.html. 2 World Health Organization, Global Health Expenditure database, http://apps.who.int/nha/database/ DataExplorerRegime.aspx, accessed May 2014. 3 ILO calculation based on World Health Organization, Global Health Expenditure database or Global Health Observatory. 4 World Health Organization, Global Health Observatory, http://apps.who.int/gho/data/view.main, accessed May 2014. 5 World Bank, World Development Indicators database, http://data.worldbank.org/data-catalog/worlddevelopment-indicators, accessed May 2014. Notes n.a: Not applicable. …: Not available. 6 Estimate of health coverage as a percentage of total population. Coverage includes affiliated members of health insurance or estimation of the population having free access to health care services provided by the State. Consult detailed data and sources available at: http://www.social-protection.org/gimi/gess/ RessourceDownload.action?ressource.ressourceId=37218. 7 Out-of-pocket expenditure as a percentage of total health expenditure: see table B.10. 8 Percentage of the population not covered due to professional health staff deficit (based on 1. median value in low vulnerability group of countries or 2. WHO threshold). The ILO staff access deficit indicator reflects the supply side of access availability – in this case the availability of human resources at a level that guarantees at least basic, but universal, effective access to everybody. To estimate access to the services of skilled medical professionals (physicians and nursing and midwifery personnel), it uses as a proxy the relative difference between the density of health professionals in a given country and its median value in countries with a low level of vulnerability (population access to services of medical professionals in countries with low vulnerability is thus used as a threshold for other countries). The relative ILO threshold corresponds to the median value in the group of countries assessed as ‘low vulnerable’ (regarding the structure of employment and poverty). Based on 2011 data from WHO (number of physicians, nursing and midwifery personnel per 10,000), the estimated median value is 41.1 per 10,000 population when weighted by total population. Another way to look at it is to refer to population not covered due to a deficit from the supply side (see second part of example below). Then, the ILO staff access deficit indicator estimates the dimension of the overall performance of health-care delivery as a percentage of the population that has no access to health care if needed. This value is above the minimum set by WHO for primary care delivery, which is 23 per 10,000. Professional staff includes physicians and nursing and midwifery personnel as defined by WHO. See Indicator definitions and metadata (http://apps.who.int/gho/indicatorregistry/App_Main/view_indicator.aspx?iid=3105, accessed May 2014). 9 WHO threshold: It has been estimated, in the World Health Report 2006, that countries with fewer than 23 physicians, nurses and midwives per 10,000 population generally fail to achieve adequate coverage rates for selected primary health-care interventions as prioritized by the Millennium Development Goals framework (WHO Health Statistics 2012, pp. 82: http://www.who.int/gho/publications/world_health_ statistics/WHS2012_IndicatorCompendium.pdf, accessed May 2014). 10 Coverage gap due to financial resources deficit based on median value in low vulnerability group of countries. The ILO financial deficit indicator follows the same principle as the access deficit indicator regarding total health spending (in US$ per capita and per year) except out-of-pocket payments. The relative median value in 2011 in group of countries assessed as ‘low vulnerable’ is estimated at 239 US$ per capita and per year. 11 According to the World Health Organization, ensuring access to the types of interventions and treatments needed to address MDGs 4, 5 and 6 requires on average “little more than US$ 60 per capita [annually] by 2015”: WHO, The World Health Report: Health systems financing: The path to universal coverage, World Health Organization (Geneva, 2010). 12 Aggregate measures are weighted by total population (2012) from United Nations Population Division, UN
World Population Prospects, 2012 Revision. 13 Example of calculation of the ILO Coverage gap due to health professional staff deficit using a relative threshold.
Algeria Burkina Faso
Total of health professional staff [A=B+C] 106776 7671
Number of nursing and midwifery personnel [B] 65919 7129
Number of physicians [C] 40857 542
Total population (in thousands) [D] 38482 10051
Number of health professional per 10 000 persons [F=A/D*10] 27.75 7.63
The ILO staff access deficit indicator [(threshold-valuecountry X)/benchmarck * 100] 32.5 81.4
If referring to population covered:
Total population covered if applying threshold* (thousands) [E=A/threshold*10] 25980 1866
Total population not covered due to health professional staff deficit (thousands) [F=D-E] 12502 8185
Percentage of total population not covered due to health professional staff deficit G=F/D*100
32.5 81.4