Embed Size (px)
Citation preview
Addressing the Legacy of Underinvestment in Agriculture
John E. Lamb, Agribusiness Team Leader Agriculture and Rural Development Department
World Bank, Washington, DC
WORKSHOP ON AID FOR TRADE AND AGRICULTURE: MAINSTREAMING AID FOR TRADE AT A THEMATIC LEVEL
Committee on Trade and Development, World Trade Organization
Geneva 17 March 2010
“In the 21st century agriculture remains fundamental for poverty reduction, economic growth and environmental
sustainability” (World Development Report 2008)
World Development Report 2008
2
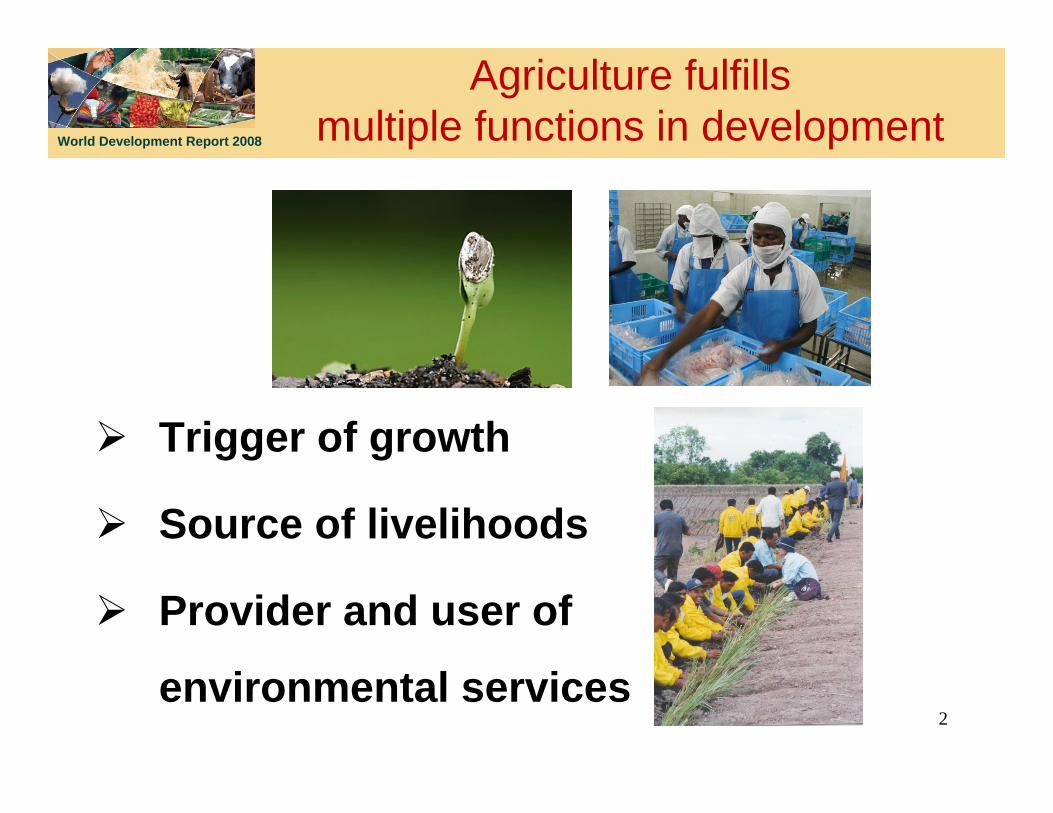
Agriculture fulfills multiple functions in development
Trigger of growth
Source of livelihoods
Provider and user of
environmental services
World Development Report 2008
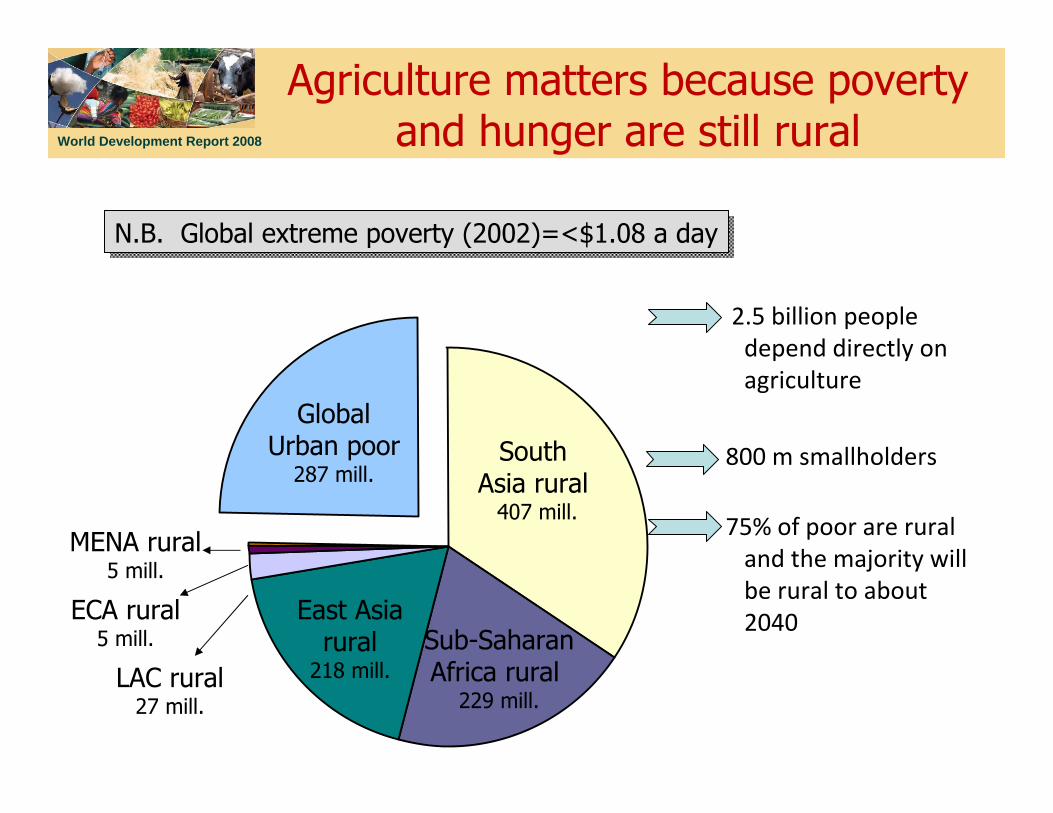
2.5 billion people depend directly on agriculture
800 m smallholders
75% of poor are rural and the majority will be rural to about 2040
N.B. Global extreme poverty (2002)=<$1.08 a dayN.B. Global extreme poverty (2002)=<$1.08 a day
GlobalUrban poor
287 mill.South
Asia rural 407 mill.
Sub-SaharanAfrica rural
229 mill.
East Asia rural
218 mill.LAC rural27 mill.
ECA rural5 mill.
MENA rural5 mill.
Agriculture matters because poverty and hunger are still rural
World Development Report 2008
4
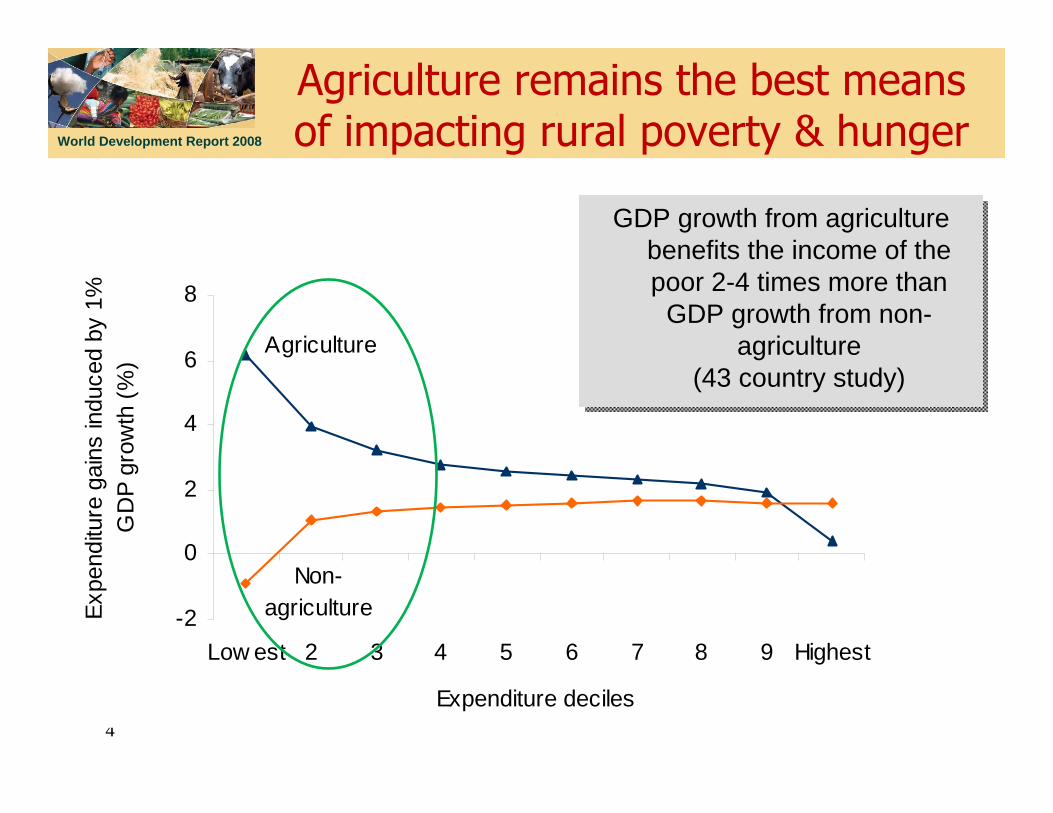
Agriculture
Non-agriculture-2
0
2
4
6
8
Low est 2 3 4 5 6 7 8 9 Highest
Expenditure deciles
Expe
nditu
re g
ains
indu
ced
by 1
%
GD
P gr
owth
(%)
GDP growth from agriculture benefits the income of the poor 2-4 times more than
GDP growth from non-agriculture
(43 country study)
GDP growth from agriculture benefits the income of the poor 2-4 times more than
GDP growth from non-agriculture
(43 country study)
Agriculture remains the best means of impacting rural poverty & hunger

World Development Report 2008
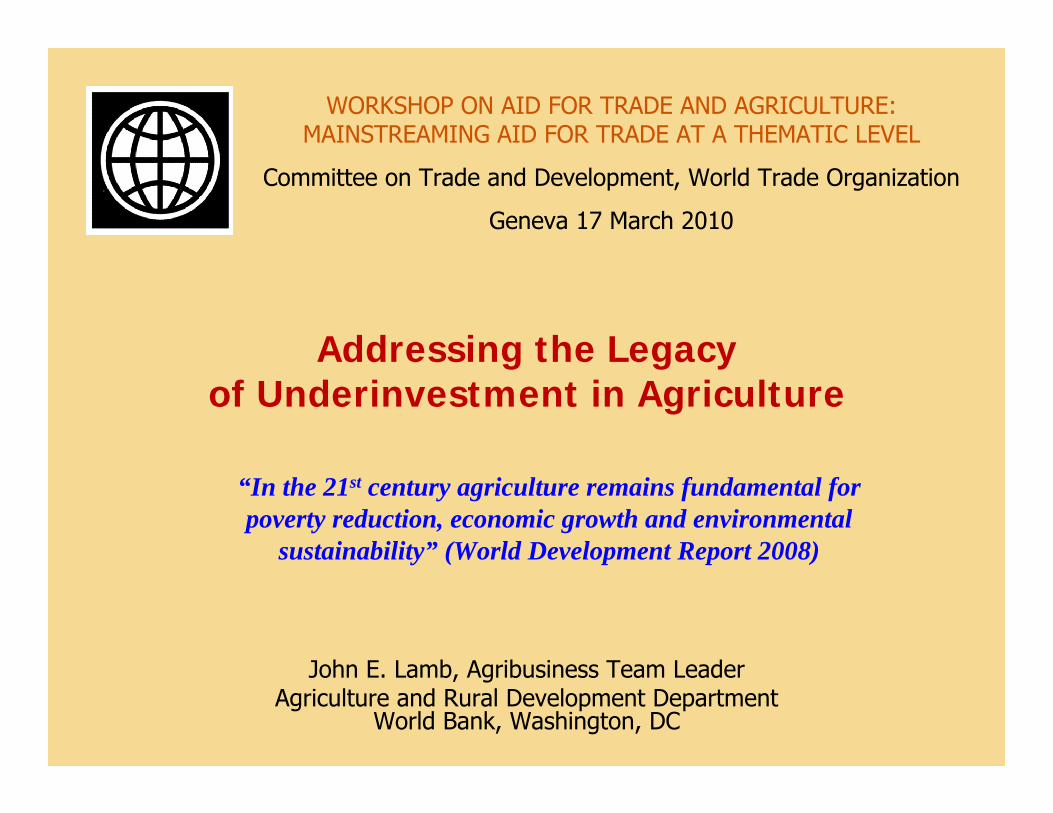
Increased Net Farm Income
Increased Agricultural
GrowthPayment of Rent,
Labor, etc
Intermediate Consumption
Outlays
Sale of Goodsand Services
(esp. rural)
Intermediate Consumption
Outlays
Payment of Rent, Labor, etc
Decreased Poverty
&
Hunger
Income from Rural Non-farm Enterprises
Why is agriculture so powerful?Multiplier effects in the rural economy

World Development Report 2008
Increased Net Farm Income
Increased Agricultural
GrowthPayment of Rent,
Labor, etc
Intermediate Consumption
Outlays
Sale of Goodsand Services
(esp. rural)
Intermediate Consumption
Outlays
Payment of Rent, Labor, etc
Decreased Poverty
&
Hunger
Income from Rural Non-farm Enterprises
Direct and indirect impacts from sale of “tradables” + induced effects from “non-tradables”=1.8 or more
Type 1: Direct Employment Impact
Type 2: Indirect Employment Impacts
Type 3: Induced Income Impacts
World Development Report 2008
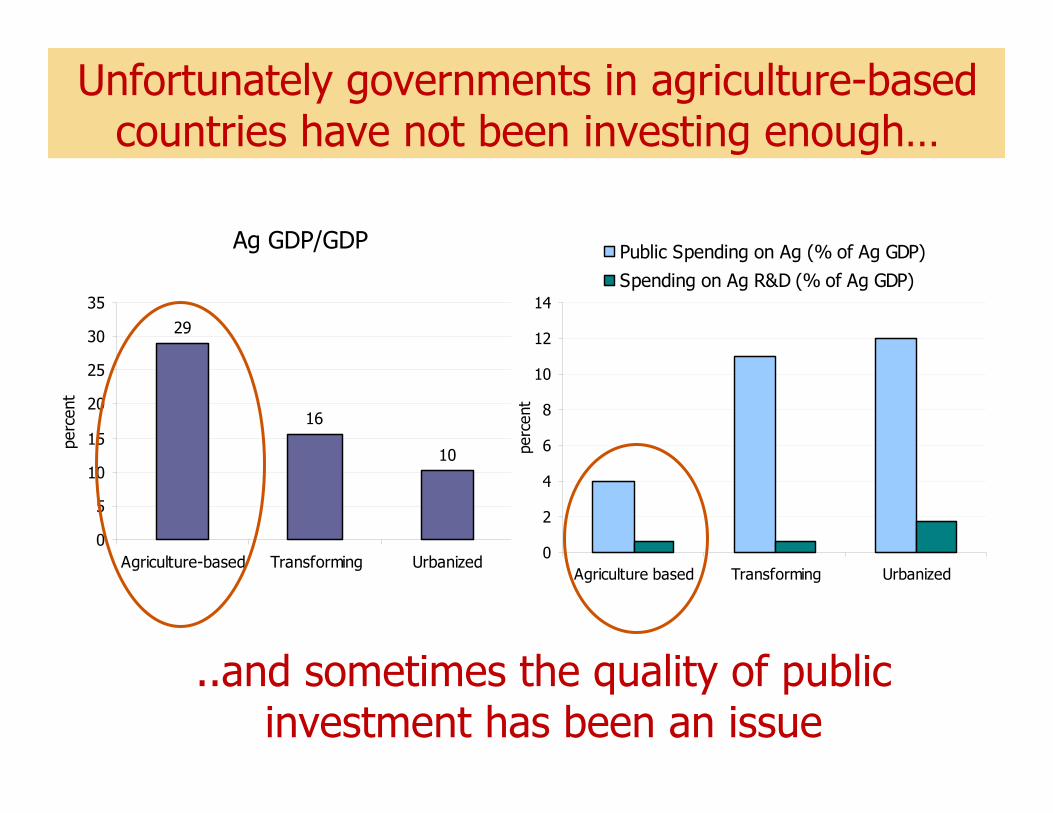
Unfortunately governments in agriculture-based countries have not been investing enough…
Ag GDP/GDP
29
16
10
0
5
10
15
20
25
30
35
Agriculture-based Transforming Urbanized
perc
ent
0
2
4
6
8
10
12
14
Agriculture based Transforming Urbanized
perc
ent
Public Spending on Ag (% of Ag GDP)Spending on Ag R&D (% of Ag GDP)
..and sometimes the quality of public investment has been an issue
World Development Report 2008
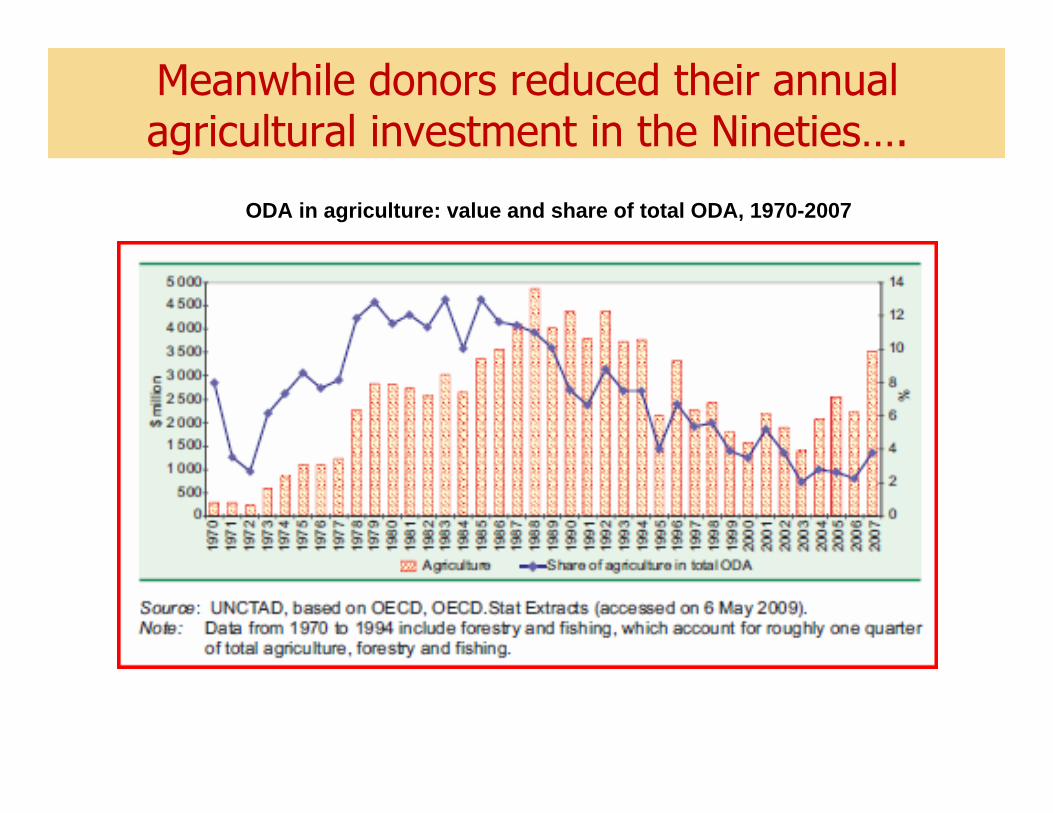
Meanwhile donors reduced their annual agricultural investment in the Nineties….
ODA in agriculture: value and share of total ODA, 1970-2007
World Development Report 2008
-102030405060708090
100
1990 1992 1994 1996 1998 2000 2002 2004
% p
over
ty in
rur
al a
reas
0
2
4
6
8
10
12
14
% O
DA
to a
gric
ultu
re
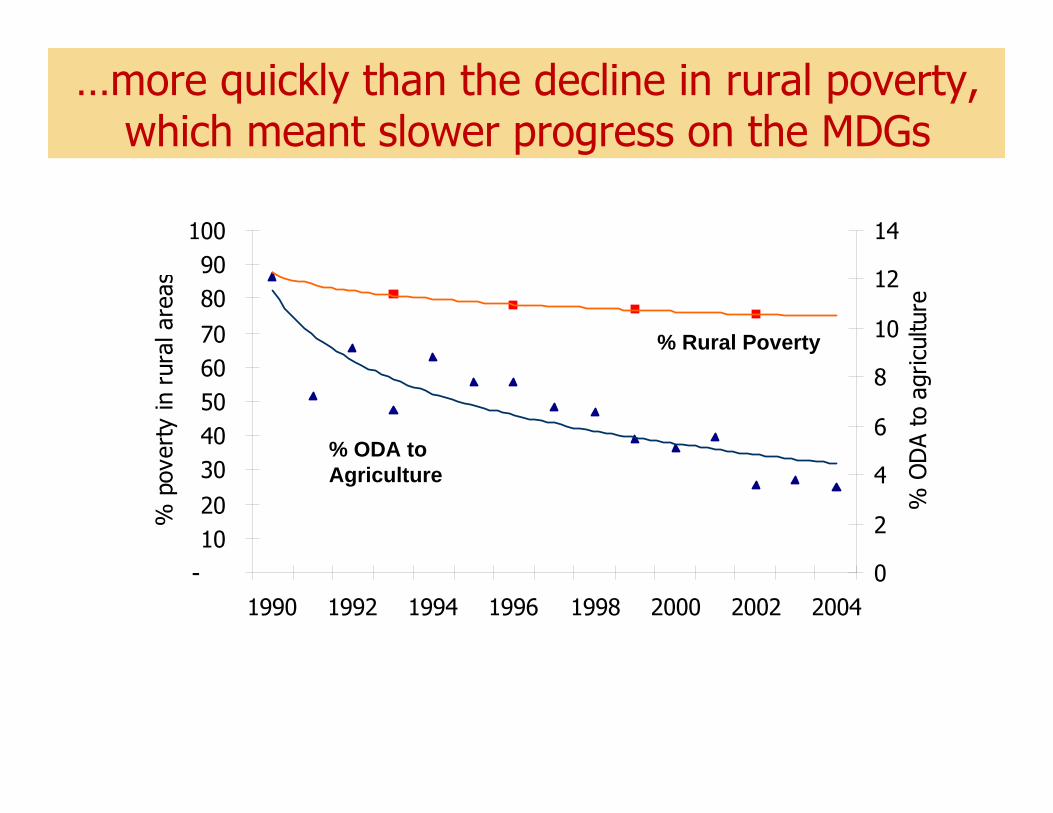
% Rural Poverty
% ODA to Agriculture
…more quickly than the decline in rural poverty, which meant slower progress on the MDGs
World Development Report 2008
10
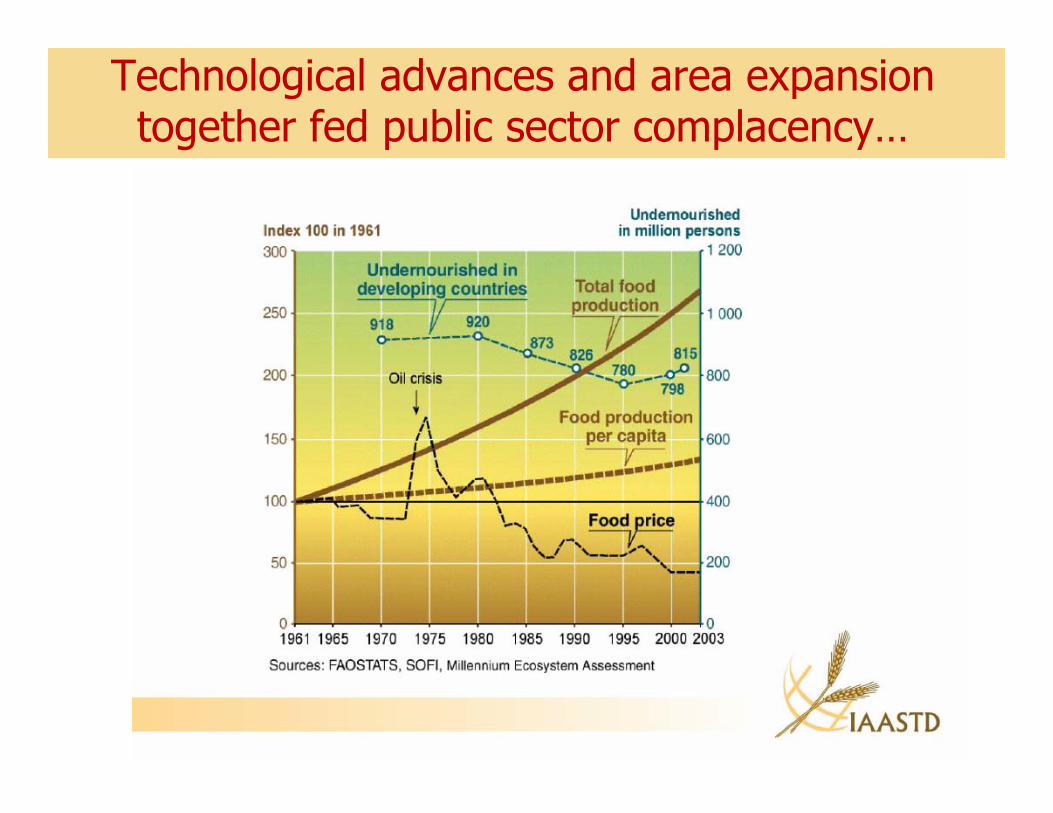
Technological advances and area expansion together fed public sector complacency…
World Development Report 2008
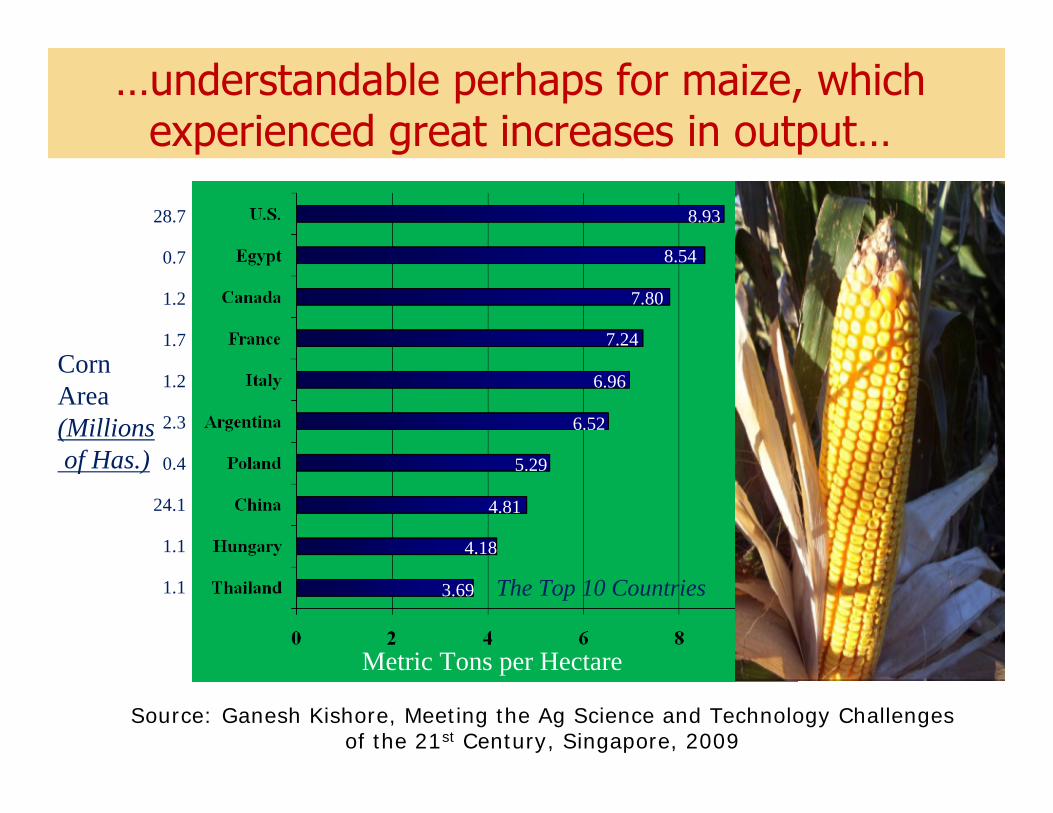
Metric Tons per Hectare
The Top 10 Countries
8.93
8.54
7.80
7.24
6.96
6.52
5.29
4.81
4.18
3.69
28.7
0.7
1.2
1.7
1.2
2.3
0.4
24.1
1.1
1.1
Corn Area (Millionsof Has.)
Source: Ganesh Kishore, Meeting the Ag Science and Technology Challengesof the 21st Century, Singapore, 2009
…understandable perhaps for maize, which experienced great increases in output…

World Development Report 2008
Year1970 1980 1990 2000G
loba
l rou
gh ri
ce p
rodu
ctio
n (0
00 0
00 t)
200
250
300
350
400
450
500
550
600
650
1980s: 3.1% per year1990s: 1.4% per year2000s: 0.8% per year
Global Rice Yield Gains
YEAR
1960 1970 1980 1990 2000 2010200
300
400
500
600G
loba
l whe
at p
rodu
ctio
n (0
00 0
00 t)
1980s: 2.9% per year1990s: 0.9% per year2000s: 0.4% per year
Global Wheat Yield Gains
..yet we all should have paid more attention to declining rates of yield gain for other cereals…
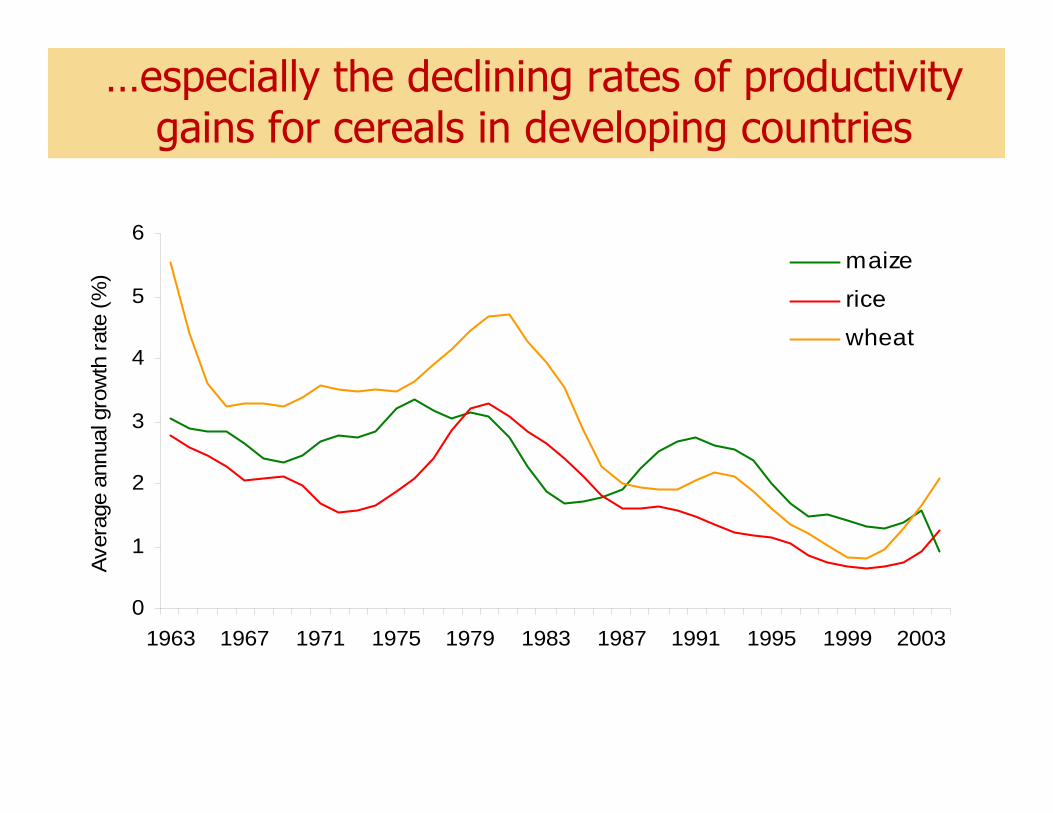
World Development Report 2008
0
1
2
3
4
5
6
1963 1967 1971 1975 1979 1983 1987 1991 1995 1999 2003
Aver
age
annu
al g
row
th ra
te (%
) maize
rice
wheat
…especially the declining rates of productivity gains for cereals in developing countries
World Development Report 2008
14
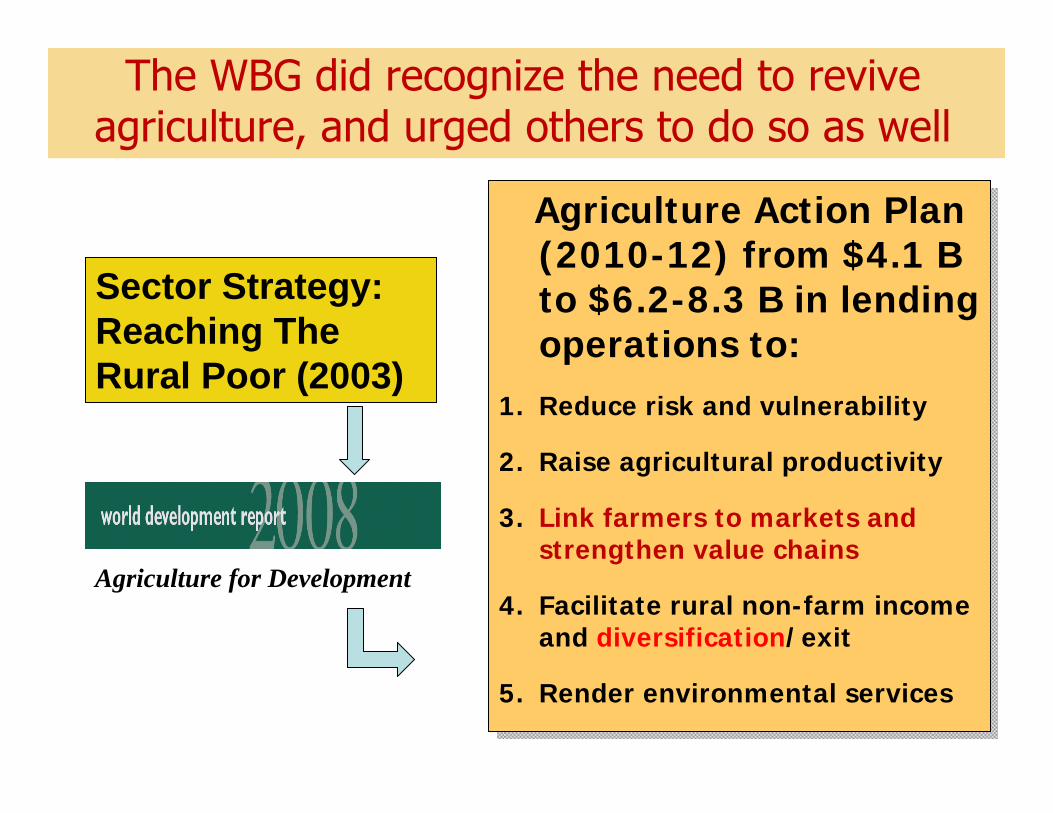
The WBG did recognize the need to revive agriculture, and urged others to do so as well
Agriculture Action Plan (2010-12) from $4.1 B to $6.2-8.3 B in lending operations to:
1. Reduce risk and vulnerability
2. Raise agricultural productivity
3. Link farmers to markets and strengthen value chains
4. Facilitate rural non-farm income and diversification/exit
5. Render environmental services
Sector Strategy: Reaching The Rural Poor (2003)
Agriculture for Development
World Development Report 2008
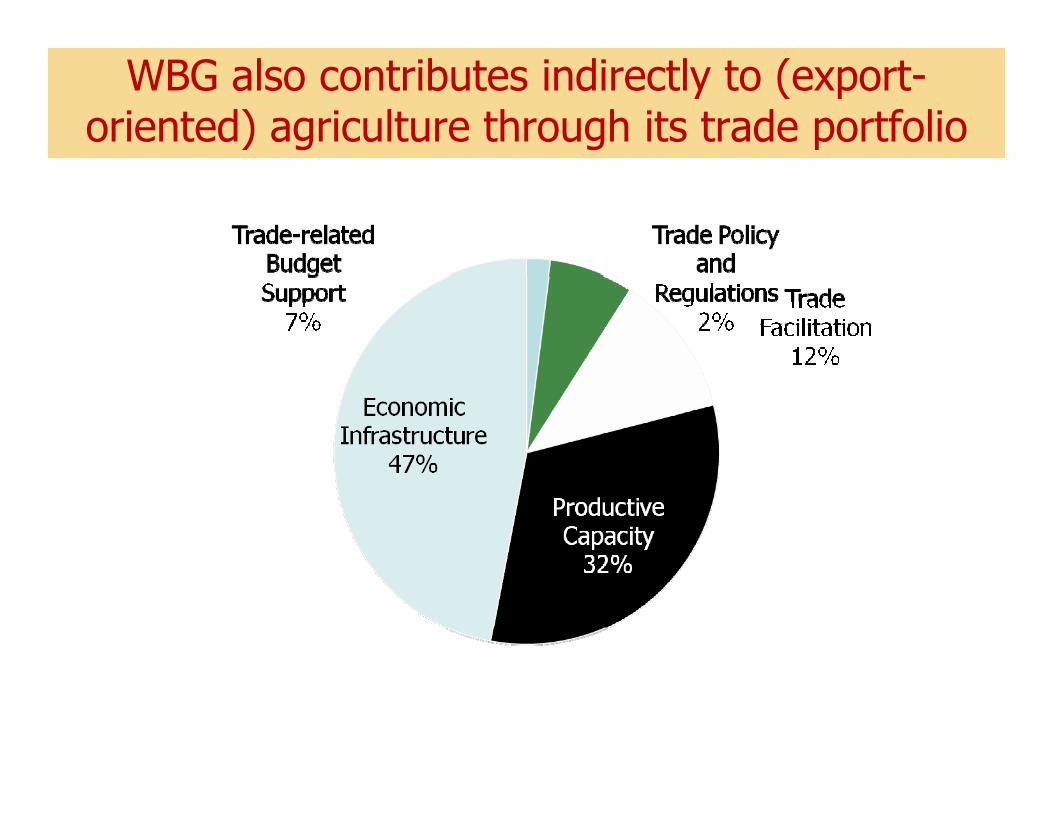
WBG also contributes indirectly to (export-oriented) agriculture through its trade portfolio
World Development Report 2008
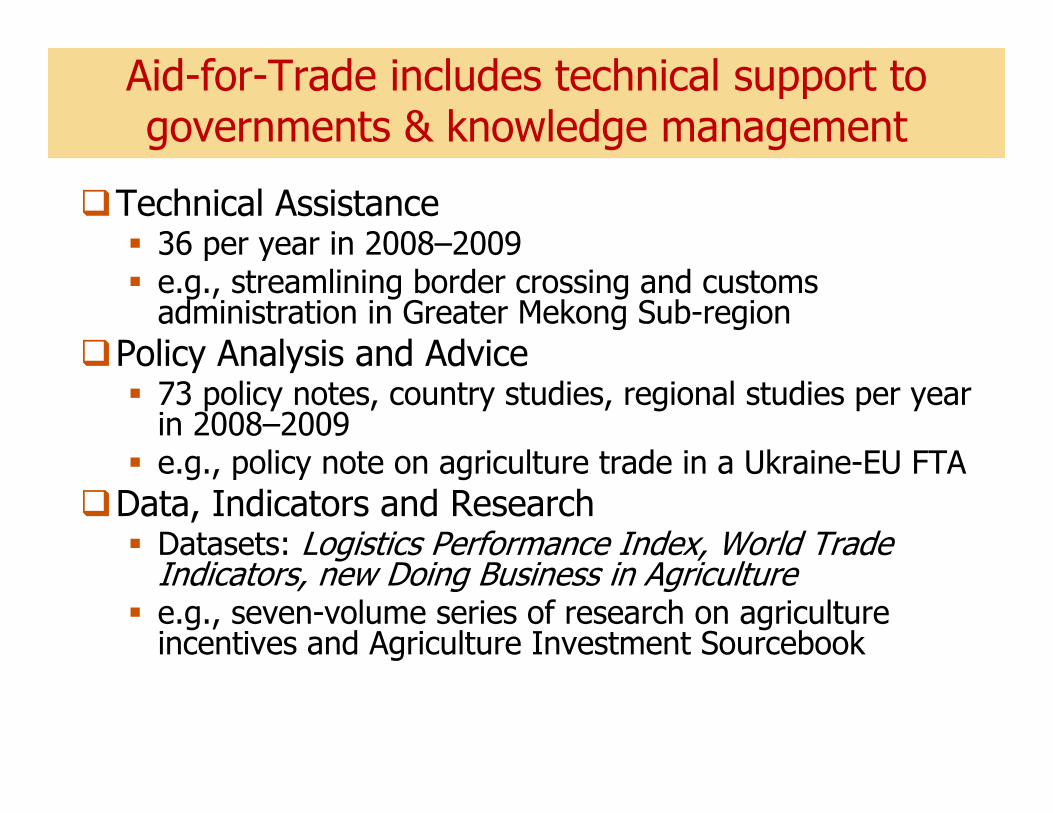
Aid-for-Trade includes technical support to governments & knowledge management
Technical Assistance36 per year in 2008–2009e.g., streamlining border crossing and customs administration in Greater Mekong Sub-region
Policy Analysis and Advice73 policy notes, country studies, regional studies per year in 2008–2009e.g., policy note on agriculture trade in a Ukraine-EU FTA
Data, Indicators and ResearchDatasets: Logistics Performance Index, World Trade Indicators, new Doing Business in Agriculture e.g., seven-volume series of research on agriculture incentives and Agriculture Investment Sourcebook

World Development Report 2008
Aid-for-Trade also includes financing that contributes to agricultural development
Guarantees to leverage private financeGlobal Trade Finance Program US$ 5.5B since 2005 in revolving fund to stimulate trade financial flows to developing countries, involving 174 banks in 77 developing countries
Seed financing for external programsStandards and Trade Development FacilityTrade Standards Practitioners Network
IBRD lending and IDA creditsJilin Province Agricultural Product and Safety ($142 M)Ukraine Agricultural Competitiveness and Food Safety ($75 M)
AHIF Avian and Human Influenza Facility ($500 M)
World Development Report 2008
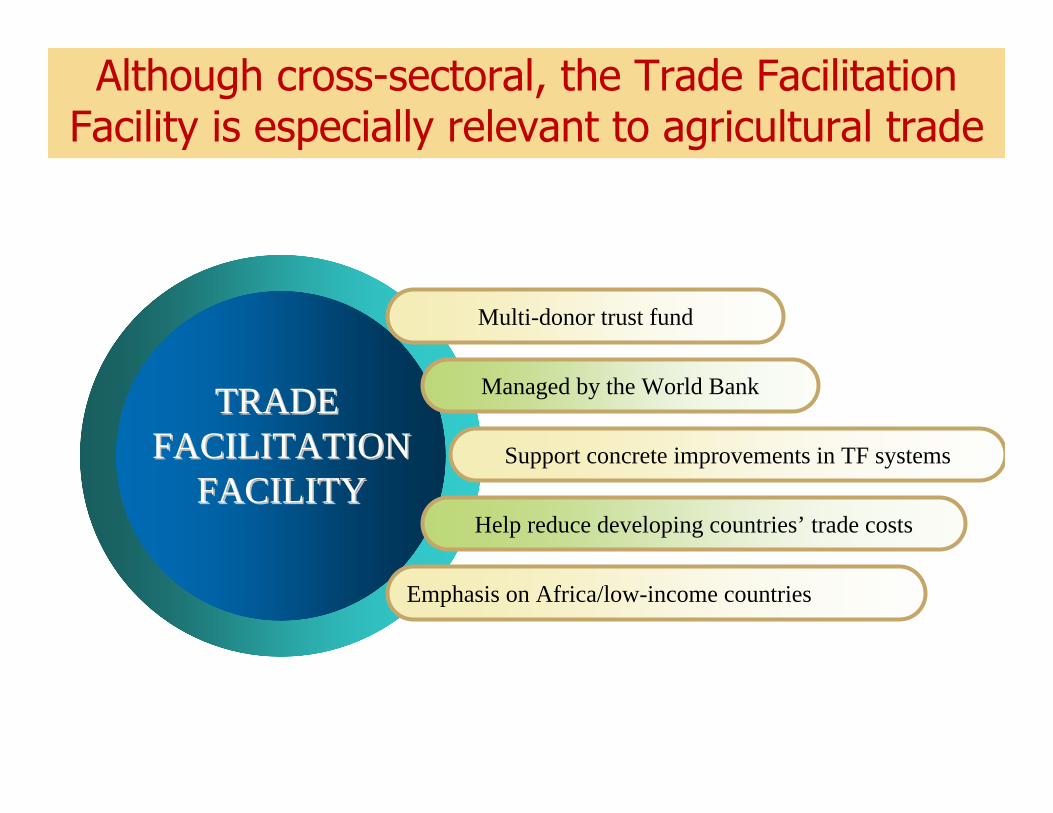
Although cross-sectoral, the Trade Facilitation Facility is especially relevant to agricultural trade
Multi-donor trust fund
Managed by the World Bank
Support concrete improvements in TF systems
Help reduce developing countries’ trade costs
Emphasis on Africa/low-income countries
TRADE TRADE FACILITATIONFACILITATION
FACILITYFACILITY
World Development Report 2008
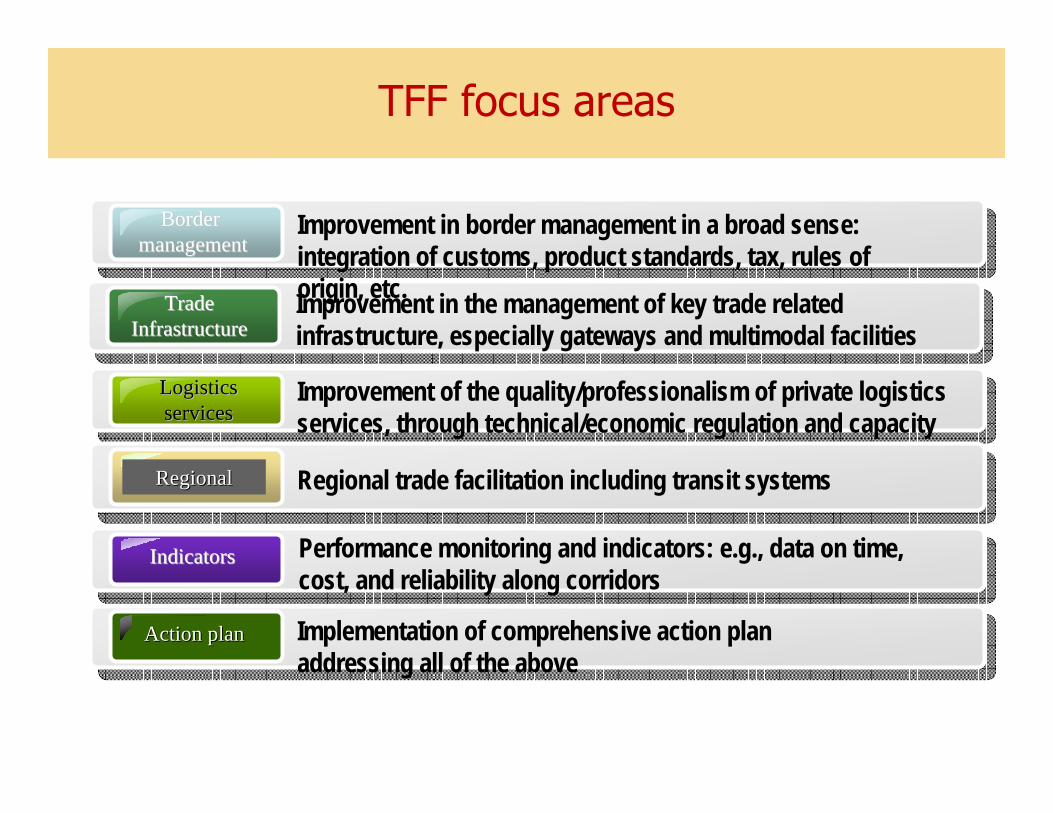
TFF focus areas
Border Border managementmanagement
Improvement in border management in a broad sense: integration of customs, product standards, tax, rules of origin, etc.TradeTrade
InfrastructureInfrastructureImprovement in the management of key trade related infrastructure, especially gateways and multimodal facilities
LogisticsLogisticsservicesservices
Improvement of the quality/professionalism of private logistics services, through technical/economic regulation and capacity building
RegionalRegional Regional trade facilitation including transit systems
IndicatorsIndicators Performance monitoring and indicators: e.g., data on time, cost, and reliability along corridors
Action planAction plan Implementation of comprehensive action plan addressing all of the above
World Development Report 2008
20
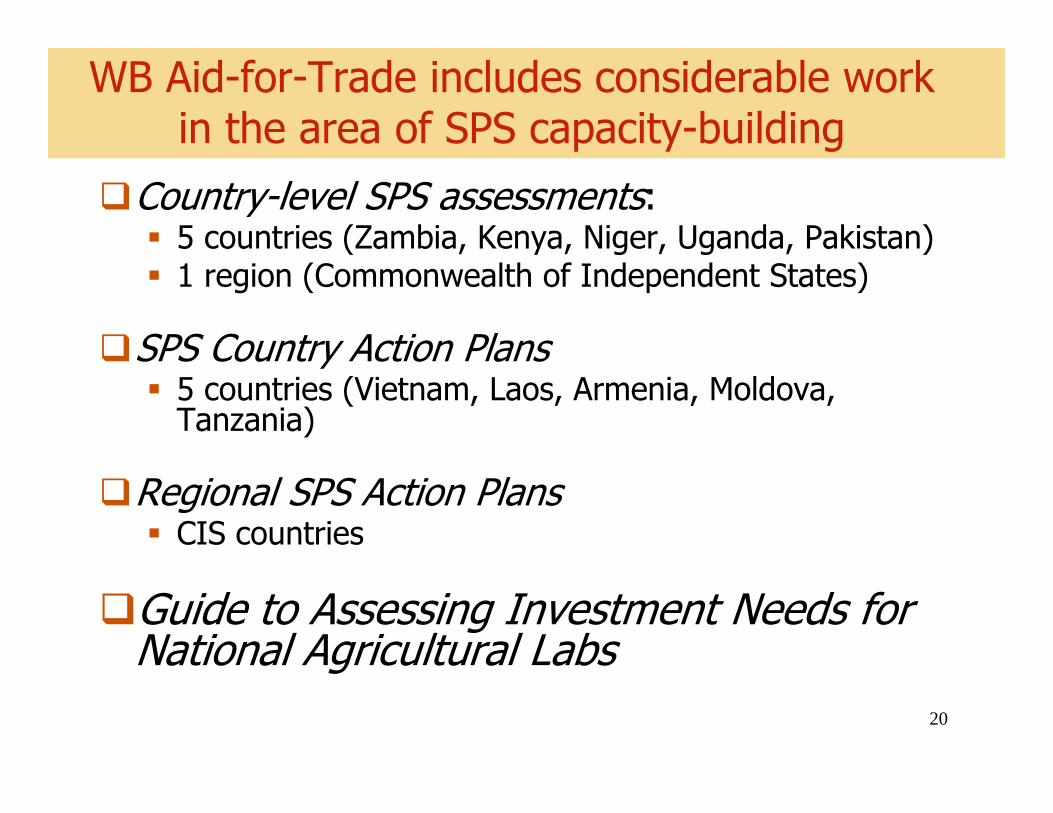
WB Aid-for-Trade includes considerable work in the area of SPS capacity-building
Country-level SPS assessments: 5 countries (Zambia, Kenya, Niger, Uganda, Pakistan)1 region (Commonwealth of Independent States)
SPS Country Action Plans5 countries (Vietnam, Laos, Armenia, Moldova, Tanzania)
Regional SPS Action PlansCIS countries
Guide to Assessing Investment Needs for National Agricultural Labs
World Development Report 2008
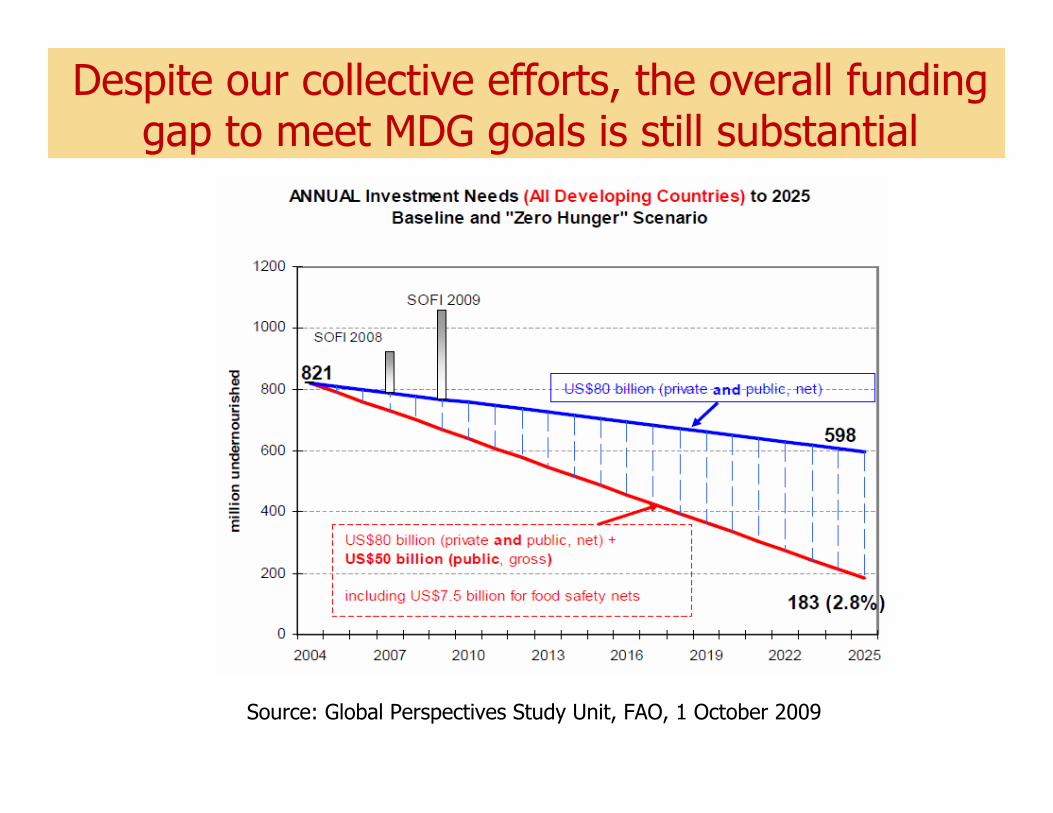
Despite our collective efforts, the overall funding gap to meet MDG goals is still substantial
Source: Global Perspectives Study Unit, FAO, 1 October 2009
World Development Report 2008
22
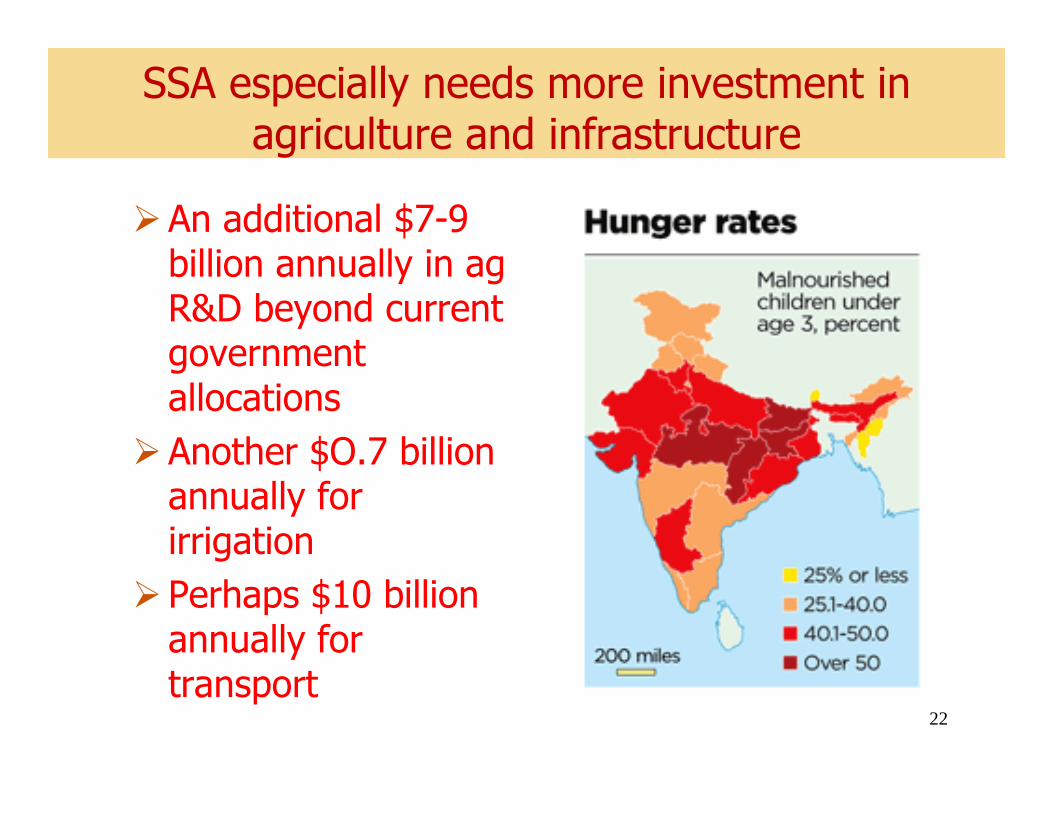
SSA especially needs more investment in agriculture and infrastructure
An additional $7-9 billion annually in ag R&D beyond current government allocationsAnother $O.7 billion annually for irrigationPerhaps $10 billion annually for transport

World Development Report 2008
23
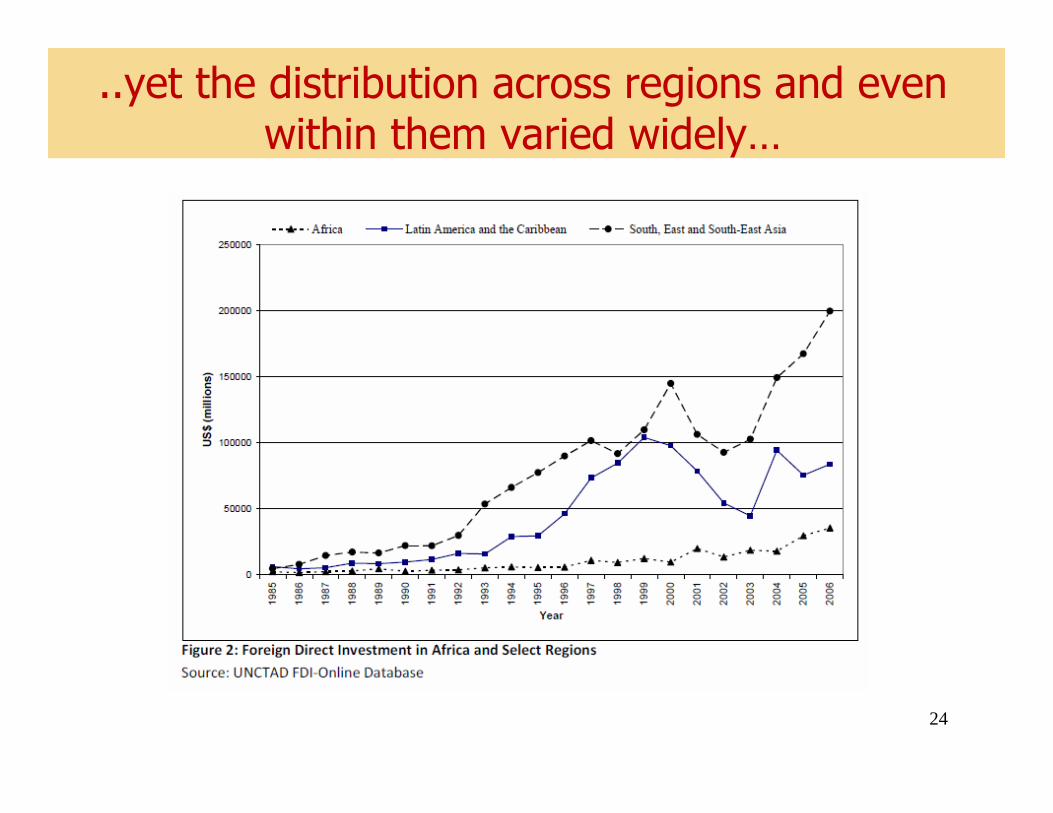
What about private investment flows?
FDI did rise sharply from 2003-2007, and the share for developing countries increased gradually
World Development Report 2008
24
..yet the distribution across regions and even within them varied widely…
World Development Report 2008
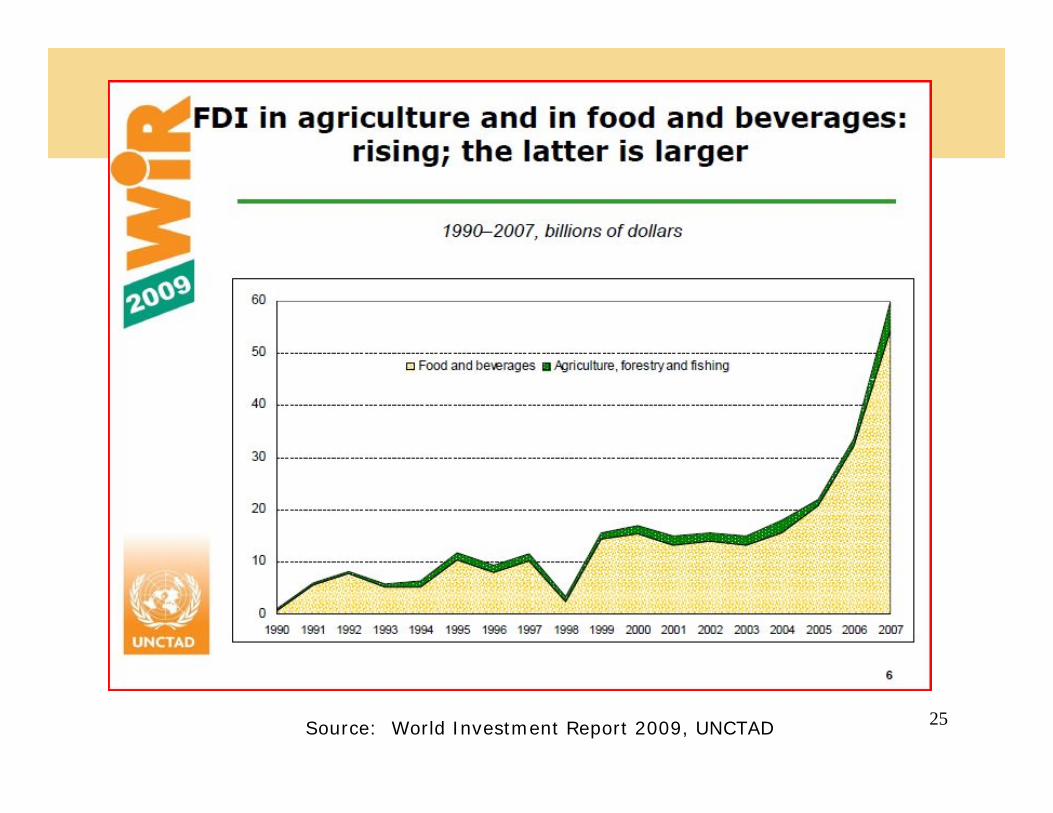
25Source: World Investment Report 2009, UNCTAD

World Development Report 2008
26
Source: World Investment Report 2009, UNCTAD
World Development Report 2008
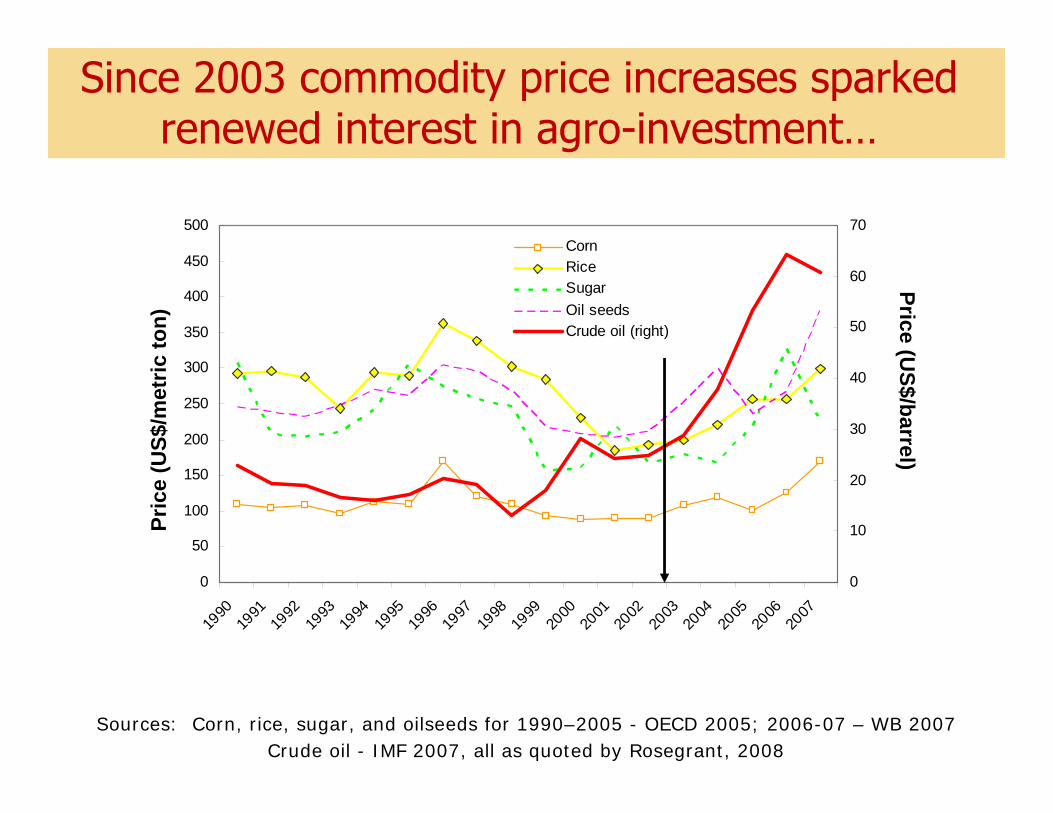
Sources: Corn, rice, sugar, and oilseeds for 1990–2005 - OECD 2005; 2006-07 – WB 2007 Crude oil - IMF 2007, all as quoted by Rosegrant, 2008
0
50
100
150
200
250
300
350
400
450
500
1990
1991
1992
1993
1994
1995
1996
1997
1998
1999
2000
2001
2002
2003
2004
2005
2006
2007
0
10
20
30
40
50
60
70CornRiceSugarOil seedsCrude oil (right)
Pric
e (U
S$/m
etric
ton)
Price (US$/barrel)
Since 2003 commodity price increases sparked renewed interest in agro-investment…

World Development Report 2008
28
US used 80 million tons of corn (24%) for ethanol in 2007 and around 100 million in 2008 (31%)In effect, 75% of increase in global corn production from 2004-07 went for ethanol in USBiodiesel used about 9 million tons of vegetable oils in 2008 (7% of global supplies)Brazil used about 55% of sugar cane for ethanol, but sugar exports remained adequate to prevent major price increases
…which was partly attributable to the rising share of production going to non-food uses…
World Development Report 2008
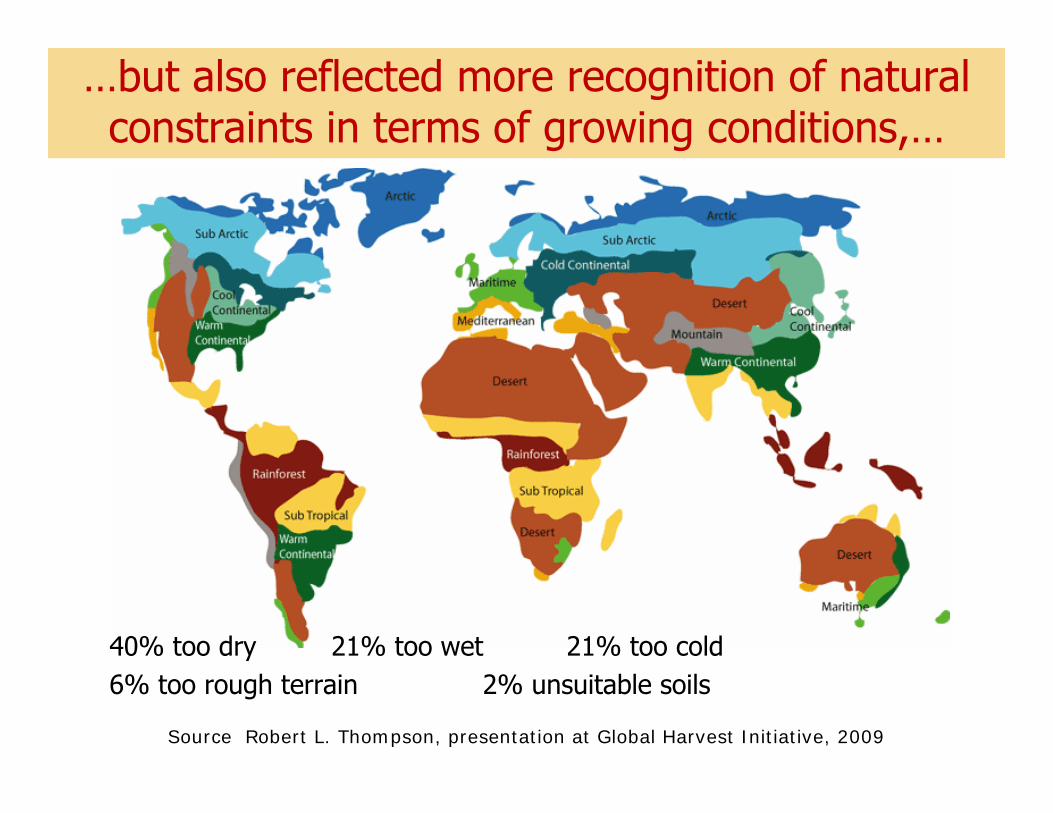
40% too dry 21% too wet 21% too cold6% too rough terrain 2% unsuitable soils
…but also reflected more recognition of natural constraints in terms of growing conditions,…
Source Robert L. Thompson, presentation at Global Harvest Initiative, 2009
World Development Report 2008
30
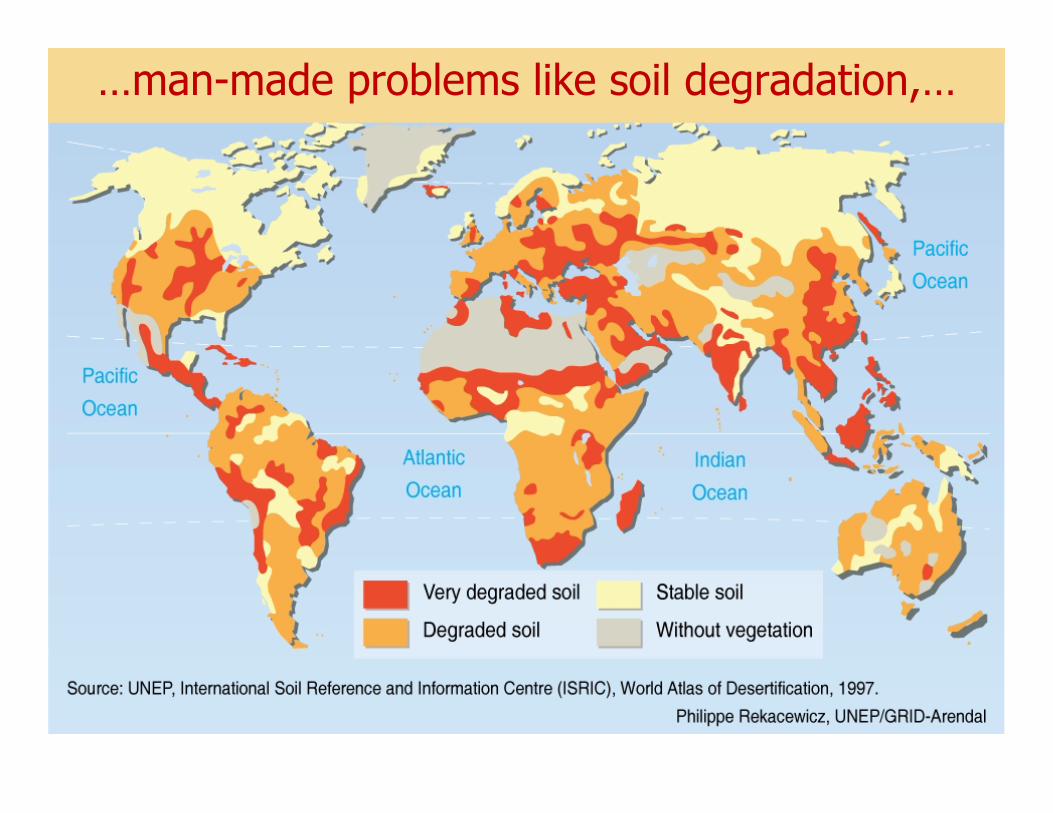
…man-made problems like soil degradation,…

World Development Report 2008
31
…and excessive water consumption…
World Development Report 2008
32
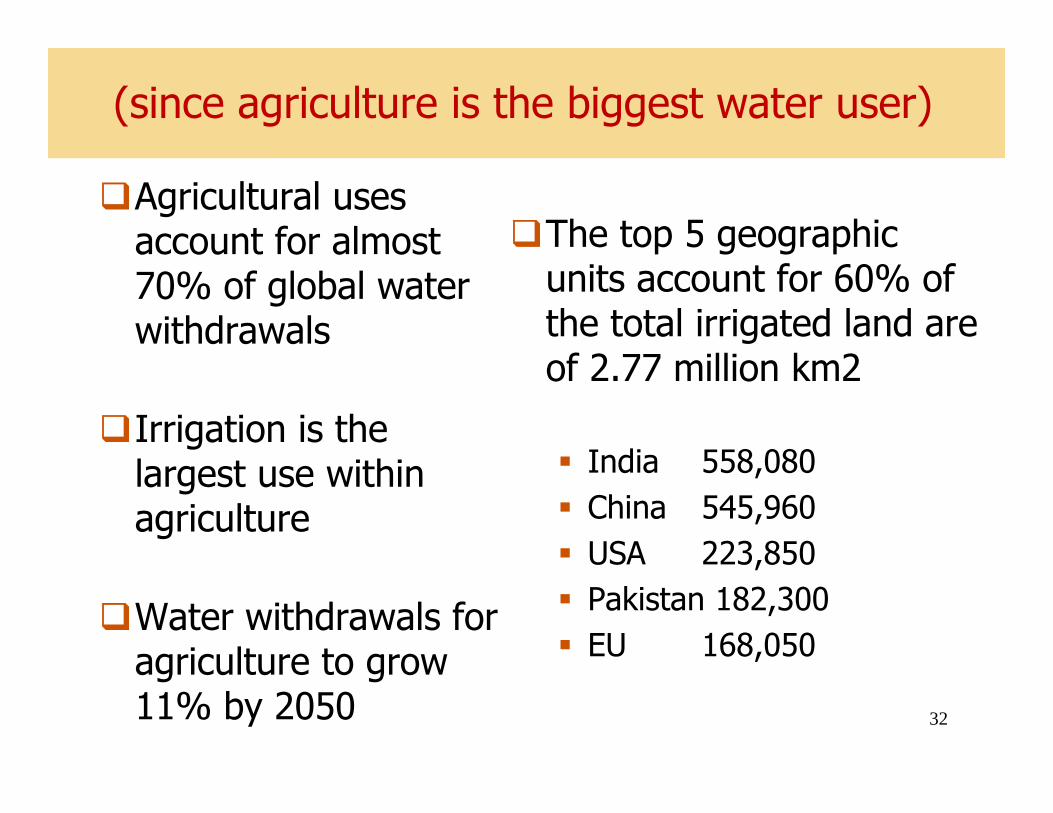
Agricultural uses account for almost 70% of global water withdrawals
Irrigation is the largest use within agriculture
Water withdrawals for agriculture to grow 11% by 2050
The top 5 geographic units account for 60% of the total irrigated land are of 2.77 million km2
India 558,080China 545,960USA 223,850Pakistan 182,300EU 168,050
(since agriculture is the biggest water user)

World Development Report 2008
Greater weather variability with more extreme eventsLess precipitation and more groundwater depletion in some areas, with longer droughtsExcess rainfall in other areas, that often lack catchment facilitiesIncreased flooding and loss of coastal areas Reduction in crop yields and agriculture productivity in some producing areas Increased spread/longer cycles of pests/diseasesLower livestock productivity due to stress, and higher costs as feed and energy prices rise Lower labor productivity as daytime temperatures rise and water becomes scarce
There is also rising awareness of climate change impacts and the need for adaptation
World Development Report 2008
34
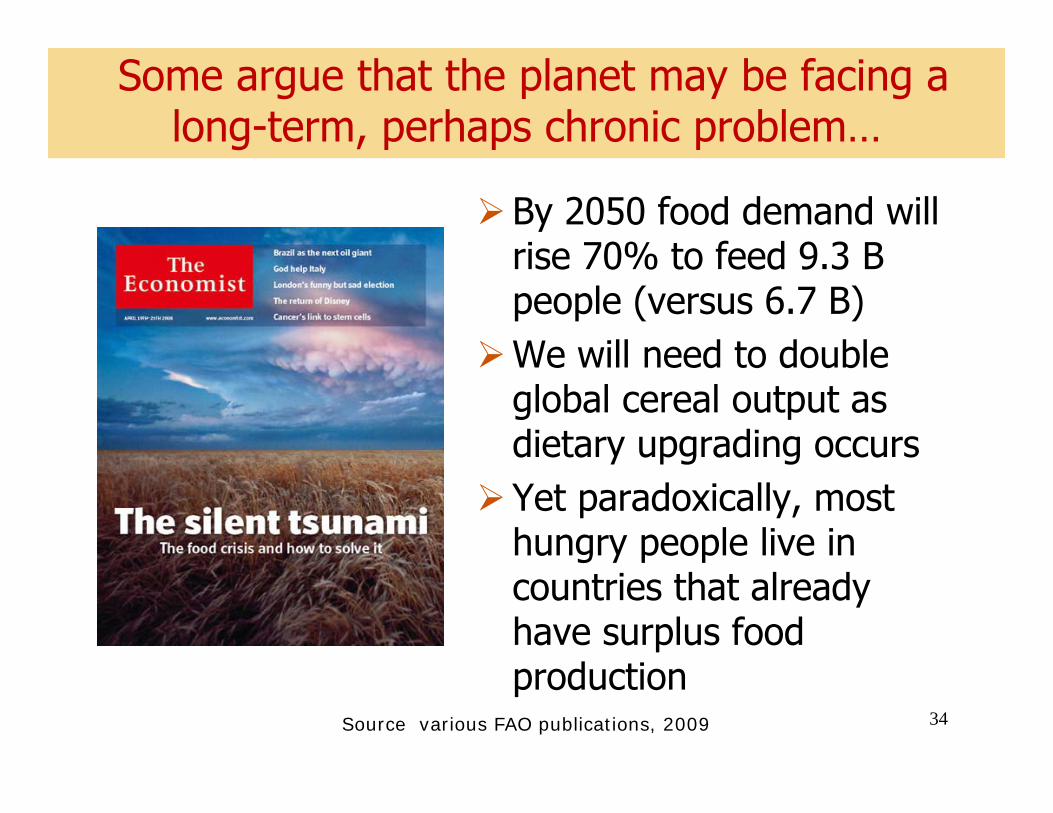
Some argue that the planet may be facing a long-term, perhaps chronic problem…
By 2050 food demand will rise 70% to feed 9.3 B people (versus 6.7 B)We will need to double global cereal output as dietary upgrading occursYet paradoxically, most hungry people live in countries that already have surplus food production
Source various FAO publications, 2009
World Development Report 2008
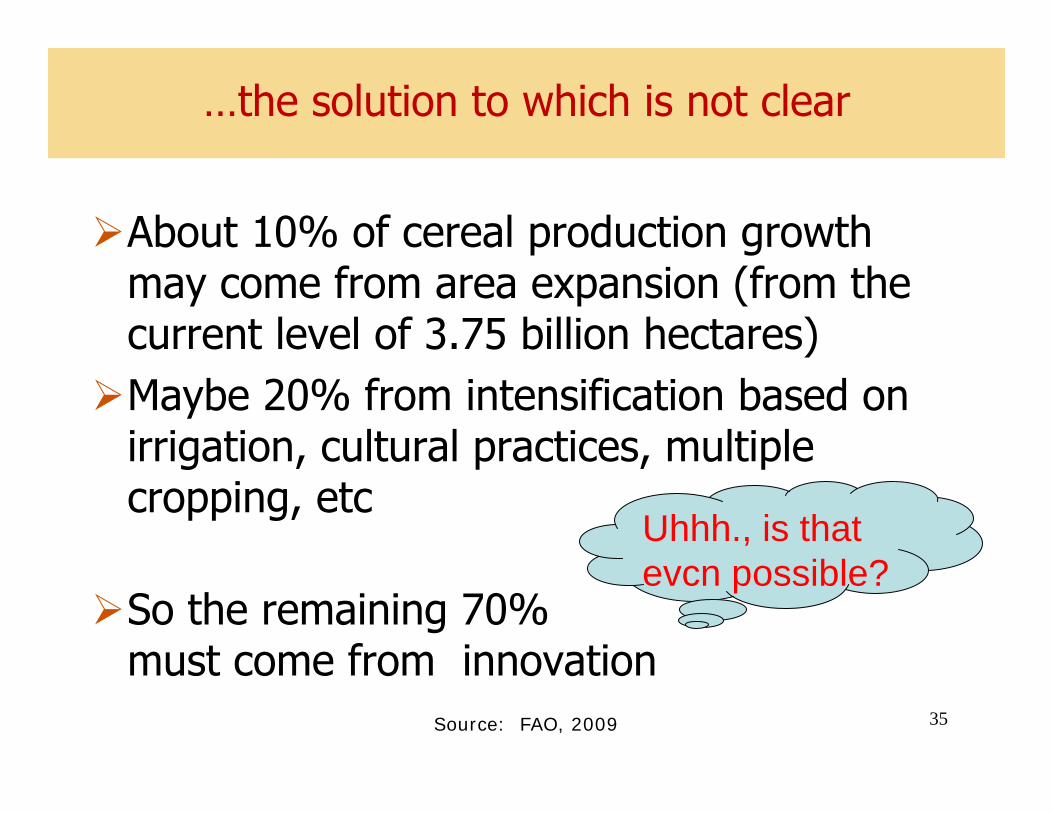
35
…the solution to which is not clear
About 10% of cereal production growth may come from area expansion (from the current level of 3.75 billion hectares)Maybe 20% from intensification based on irrigation, cultural practices, multiple cropping, etc
So the remaining 70% must come from innovation
Uhhh., is that evcn possible?
Source: FAO, 2009
World Development Report 2008
Gene Gun
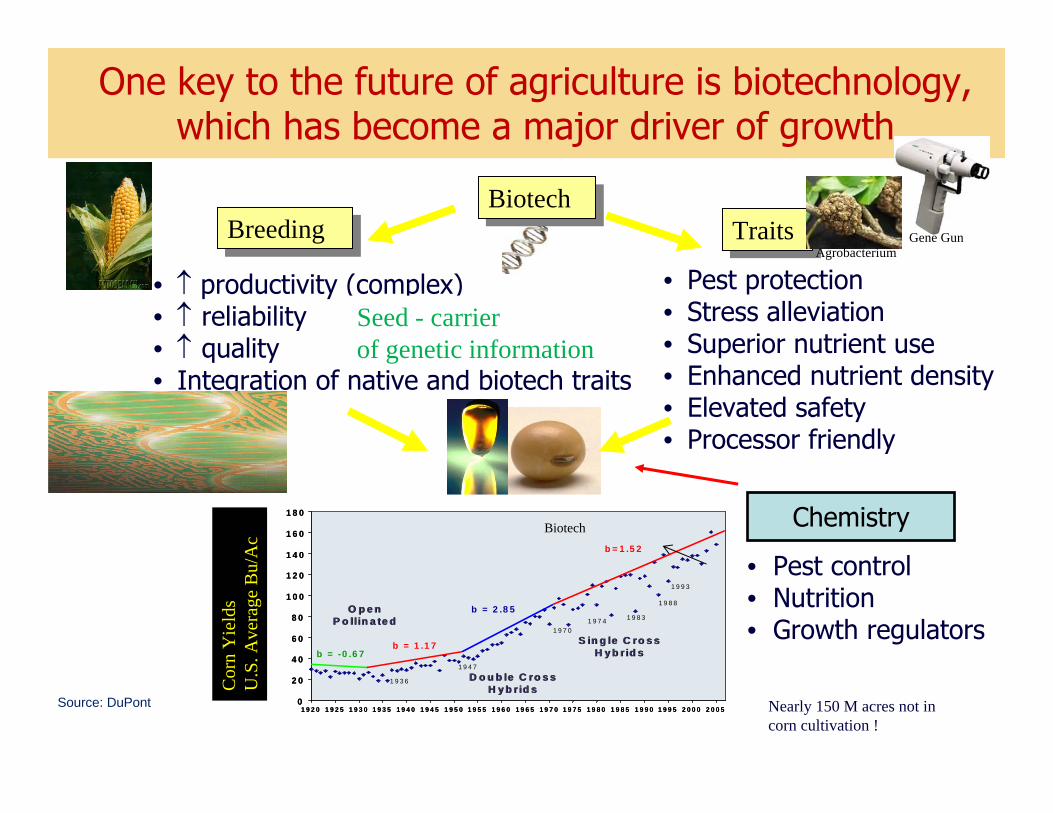
BiotechBiotechTraitsTraits
• ↑ productivity (complex)• ↑ reliability• ↑ quality• Integration of native and biotech traits
• Pest protection• Stress alleviation• Superior nutrient use • Enhanced nutrient density• Elevated safety• Processor friendly
0
2 0
4 0
6 0
8 0
1 0 0
1 2 0
1 4 0
1 6 0
1 8 0
1 9 2 0 1 9 2 5 1 9 3 0 1 9 3 5 1 9 4 0 1 9 4 5 1 9 5 0 1 9 5 5 1 9 6 0 1 9 6 5 1 9 7 0 1 9 7 5 1 9 8 0 1 9 8 5 1 9 9 0 1 9 9 5 2 0 0 0 2 0 0 5
b = 1 .5 2
b = 2 .8 5O p e n P o llin a te d
O p e n P o llin a te d
b = -0 .6 7b = 1 .1 7
D o u b le C ro s s H y b r id s
D o u b le C ro s s H y b r id s
S in g le C ro s s H y b r id s
S in g le C ro s s H y b r id s
1 9 8 8
1 9 8 3
1 9 7 01 9 7 4
1 9 9 3
1 9 3 6
1 9 4 7
Cor
n Y
ield
sU
.S. A
vera
ge B
u/A
cBreedingBreeding
Agrobacterium
Biotech Chemistry
• Pest control• Nutrition• Growth regulators
Seed - carrierof genetic information
Source: DuPont Nearly 150 M acres not in corn cultivation !
One key to the future of agriculture is biotechnology, which has become a major driver of growth

World Development Report 2008
…another key is agro-enterprise investment, which can bring many benefits if done right…
√ Capital deepening and broadening√ Better production, post-harvest handling,
processing technology√ Better product quality√ BOP value propositions including food fortification√ Creation or stimulation of a local market√ Modern management know-how√ Investment in collateral businesses√ Cross-cutting productive infrastructure
World Development Report 2008
…and export-oriented agro-investment can bring still more benefits…
√ Introduction of scale and other economies√ Better quality assurance systems√ Adherence to WTO SPS commitments √ Compliance with private food safety,
environmental and social requirements √ Linkages to larger, more diverse markets, coupled
with traceability√ Value –addition through innovation in products
and processes as well as branding √ Improved social services in rural areas not easily
served by government
World Development Report 2008
39
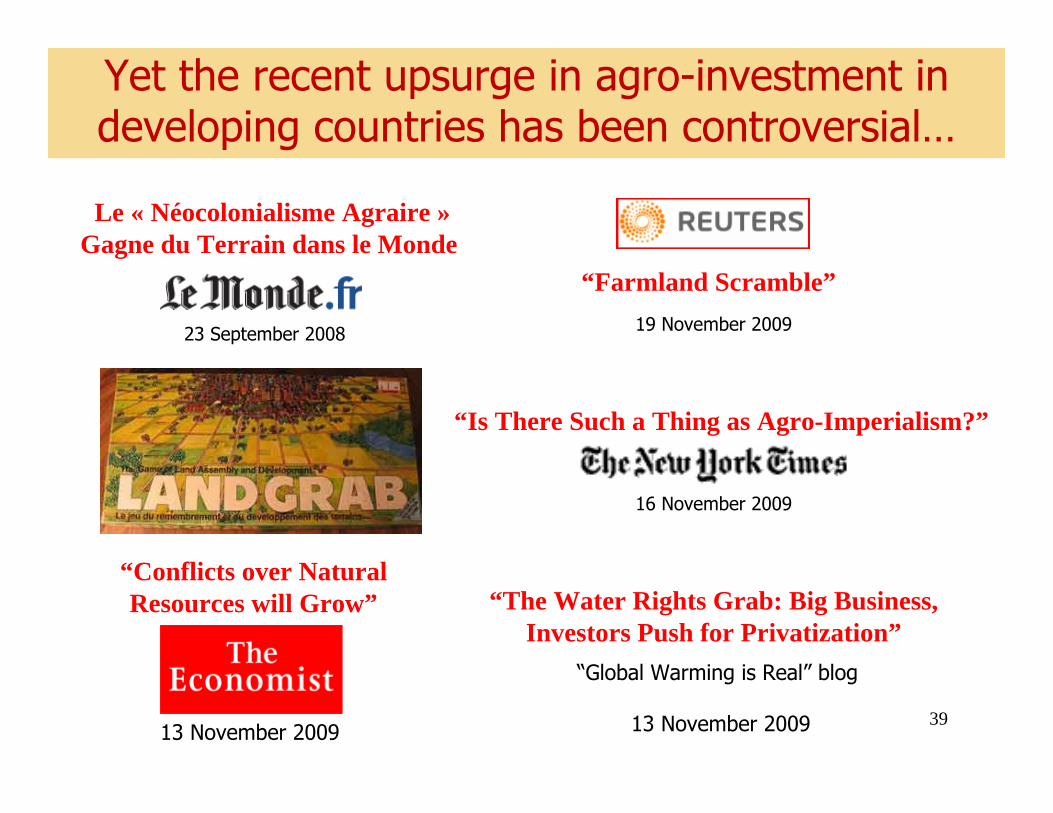
Yet the recent upsurge in agro-investment in developing countries has been controversial…
16 November 2009
“Is There Such a Thing as Agro-Imperialism?”
Le « Néocolonialisme Agraire »Gagne du Terrain dans le Monde
23 September 2008 19 November 2009
“Farmland Scramble”
“The Water Rights Grab: Big Business, Investors Push for Privatization”
“Global Warming is Real” blog
13 November 2009
“Conflicts over Natural Resources will Grow”
13 November 2009
World Development Report 2008
40
…so it is critical that agro-enterprise stay faithful to its Mission, which is…
To responsibly and sustainably grow, pack, process, and deliver consistently to consumers and other users…
…food, feed, fiber, and biomass in sufficient quantity
…that is safe to consume, compliant with applicable regulations, and in conformity with buyer needs and expectations…
…at prices that are viable over time for both seller and buyer
World Development Report 2008
International agencies are framing an appropriate response to pressures on land….
World Development Report 2008
42
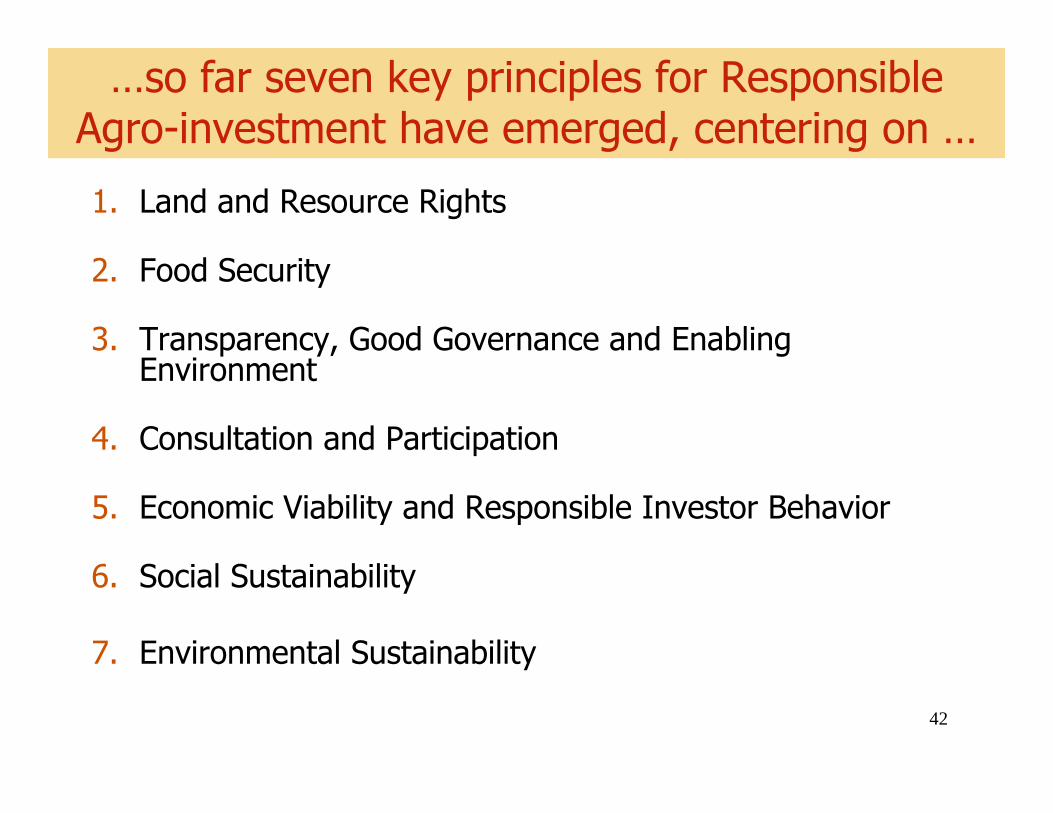
1. Land and Resource Rights
2. Food Security
3. Transparency, Good Governance and Enabling Environment
4. Consultation and Participation
5. Economic Viability and Responsible Investor Behavior
6. Social Sustainability
7. Environmental Sustainability
…so far seven key principles for Responsible Agro-investment have emerged, centering on …
World Development Report 2008
43
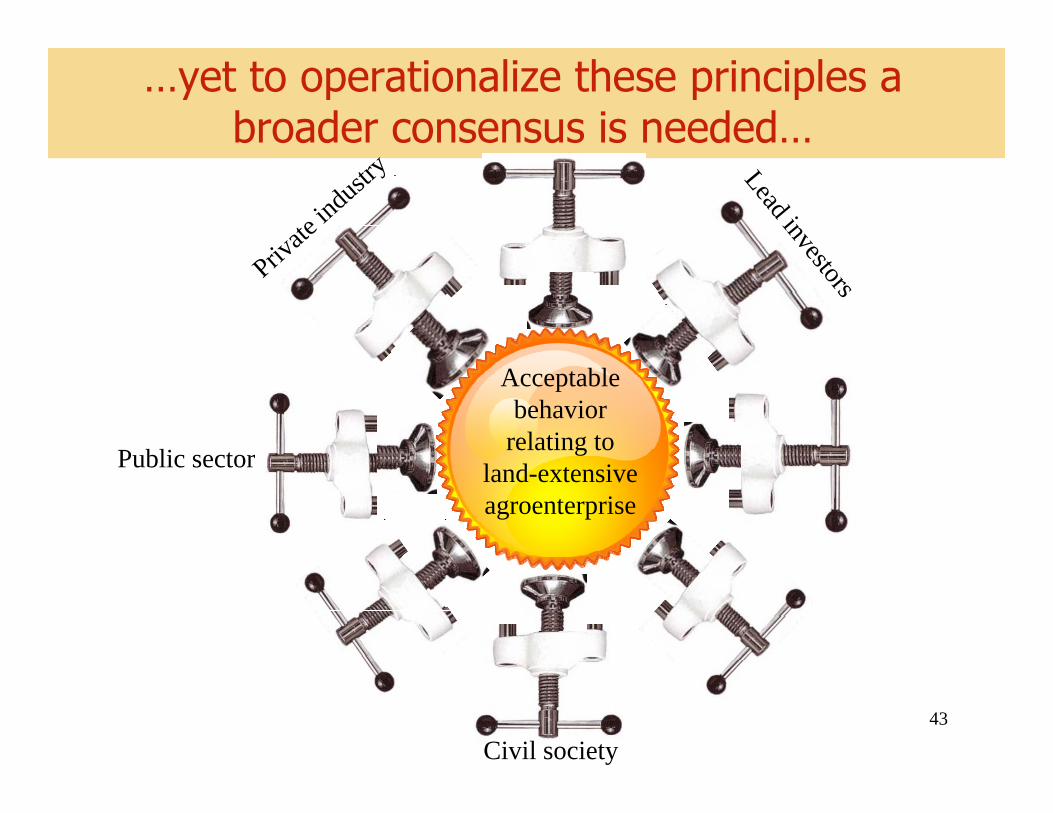
…yet to operationalize these principles a broader consensus is needed…
Private
indu
stry Lead investors
Public sector
Civil society
Acceptable behavior
relating to land-extensive agroenterprise
World Development Report 2008
44
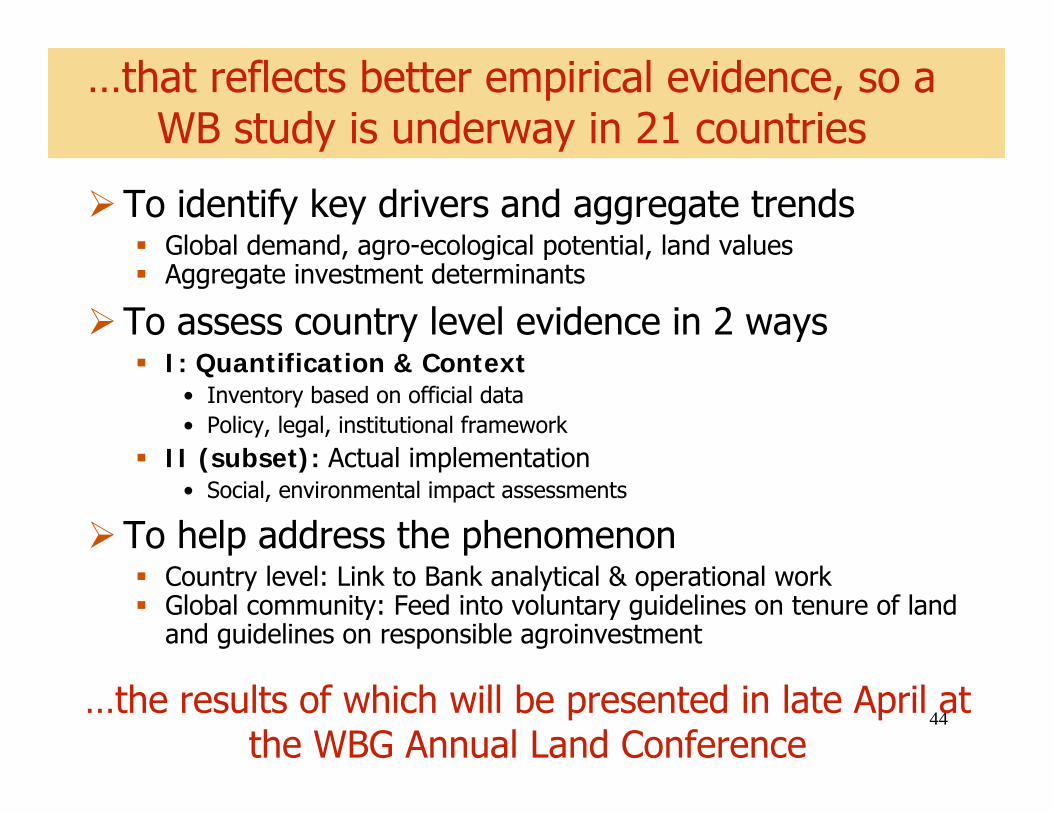
…that reflects better empirical evidence, so a WB study is underway in 21 countries
To identify key drivers and aggregate trendsGlobal demand, agro-ecological potential, land valuesAggregate investment determinants
To assess country level evidence in 2 waysI: Quantification & Context
• Inventory based on official data• Policy, legal, institutional framework
II (subset): Actual implementation• Social, environmental impact assessments
To help address the phenomenonCountry level: Link to Bank analytical & operational workGlobal community: Feed into voluntary guidelines on tenure of land and guidelines on responsible agroinvestment
…the results of which will be presented in late April at the WBG Annual Land Conference
World Development Report 2008
45
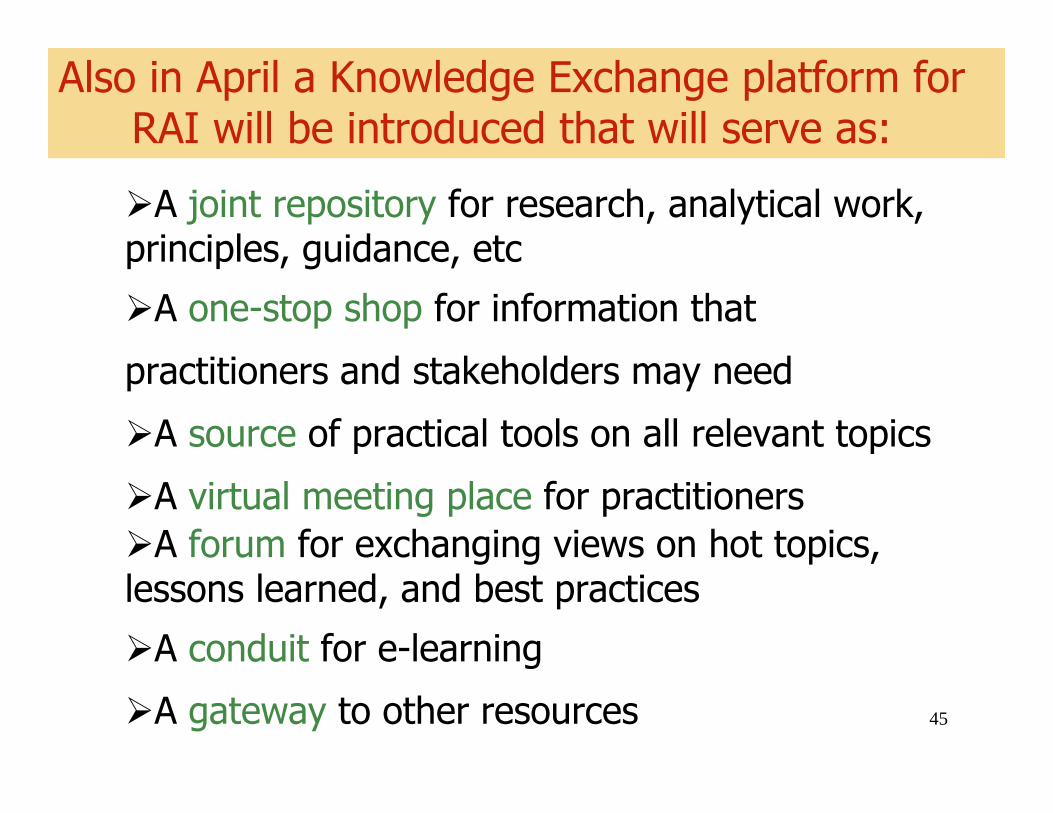
Also in April a Knowledge Exchange platform for RAI will be introduced that will serve as:
A joint repository for research, analytical work, principles, guidance, etc
A one-stop shop for information that
practitioners and stakeholders may need
A source of practical tools on all relevant topics
A virtual meeting place for practitionersA forum for exchanging views on hot topics,
lessons learned, and best practices
A conduit for e-learning
A gateway to other resources
World Development Report 2008
46
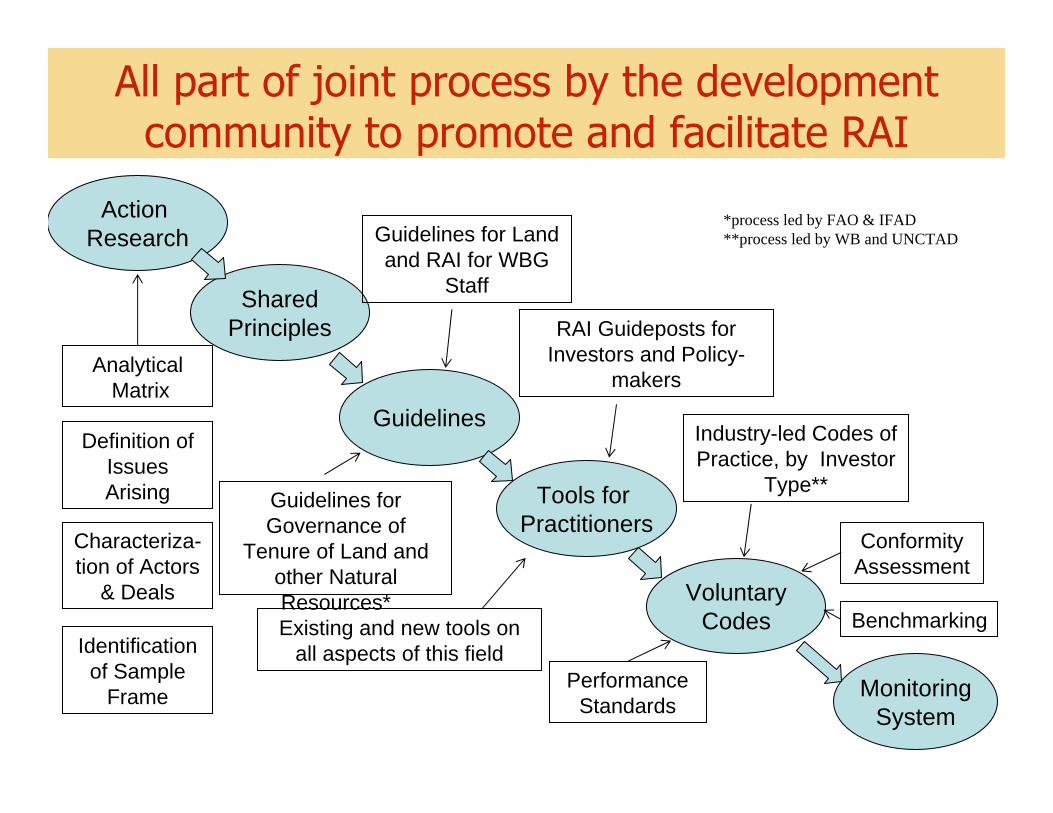
Characteriza-tion of Actors
& Deals
Definition ofIssues Arising
AnalyticalMatrix
Performance Standards
Conformity Assessment
Guidelines for Governance of
Tenure of Land and other Natural Resources*
Industry-led Codes of Practice, by Investor
Type**
Action Research
Guidelines
SharedPrinciples
Tools for Practitioners
VoluntaryCodes
MonitoringSystem
Identification of Sample
Frame
Guidelines for Land and RAI for WBG
Staff
*process led by FAO & IFAD**process led by WB and UNCTAD
RAI Guideposts for Investors and Policy-
makers
Existing and new tools on all aspects of this field
All part of joint process by the development community to promote and facilitate RAI
Benchmarking
World Development Report 2008
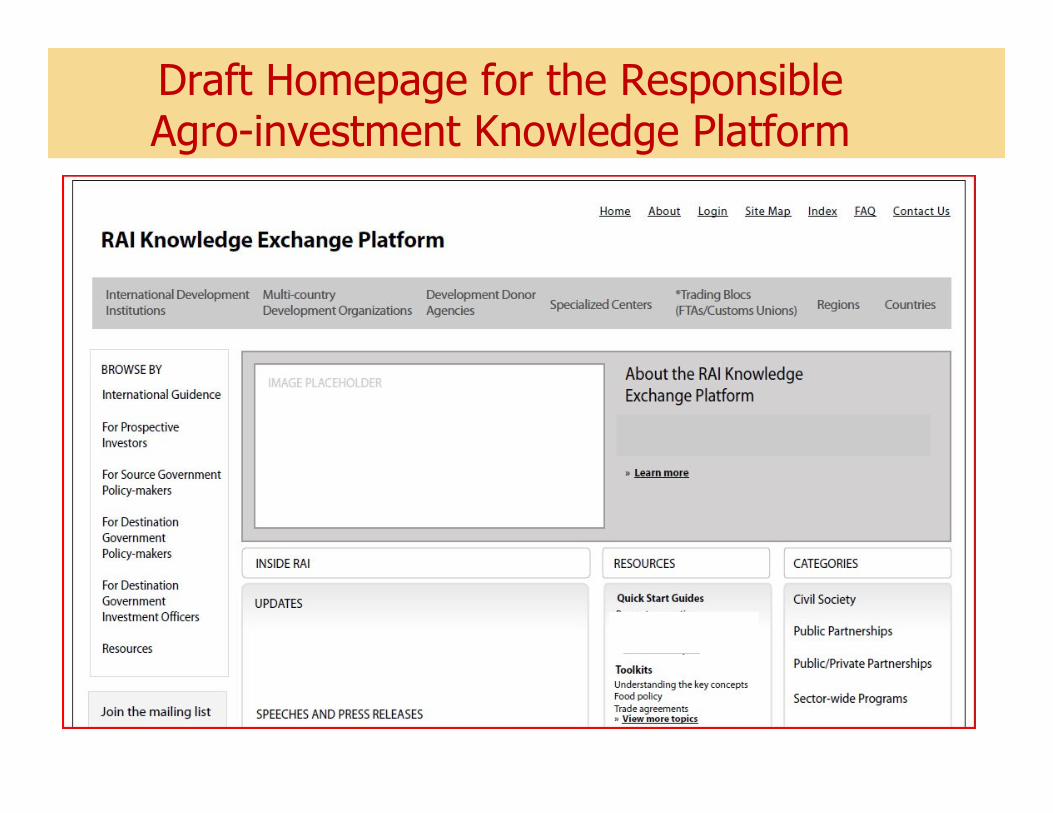
Draft Homepage for the Responsible Agro-investment Knowledge Platform
World Development Report 2008
Annex 1: Detailed slides for each RAI Principle
World Development Report 2008
49
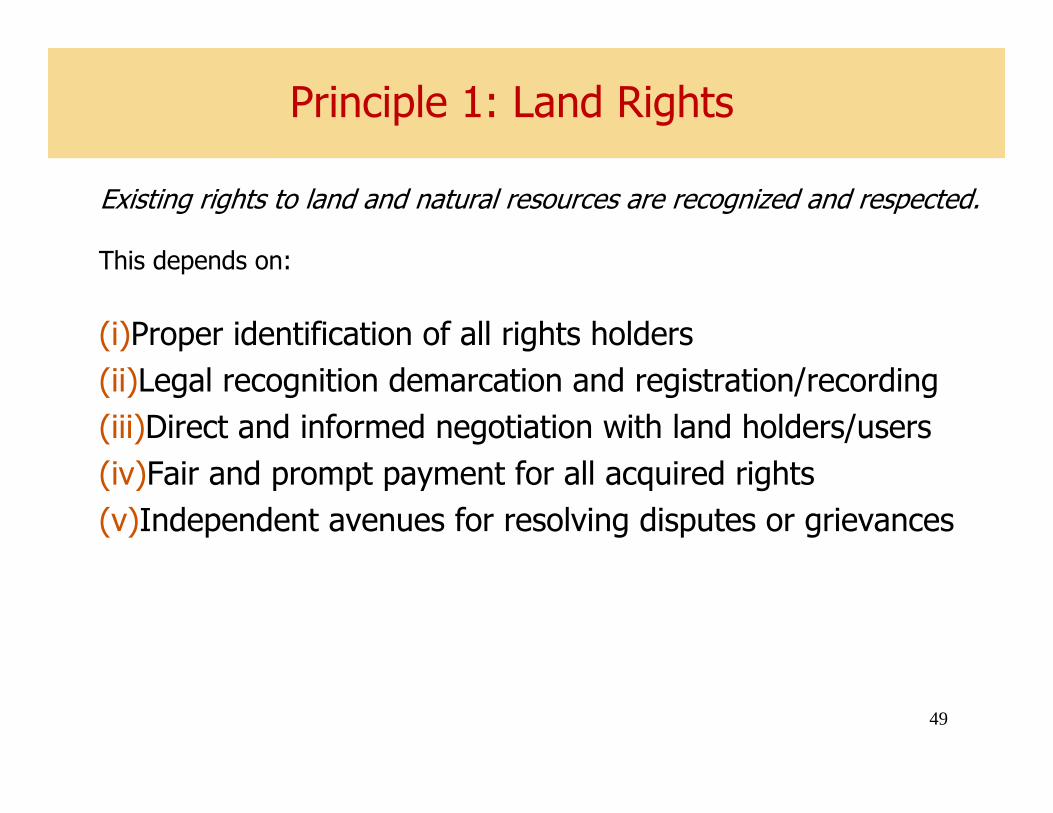
Existing rights to land and natural resources are recognized and respected.
This depends on:
(i)Proper identification of all rights holders (ii)Legal recognition demarcation and registration/recording (iii)Direct and informed negotiation with land holders/users (iv)Fair and prompt payment for all acquired rights(v)Independent avenues for resolving disputes or grievances
Principle 1: Land Rights
World Development Report 2008
50
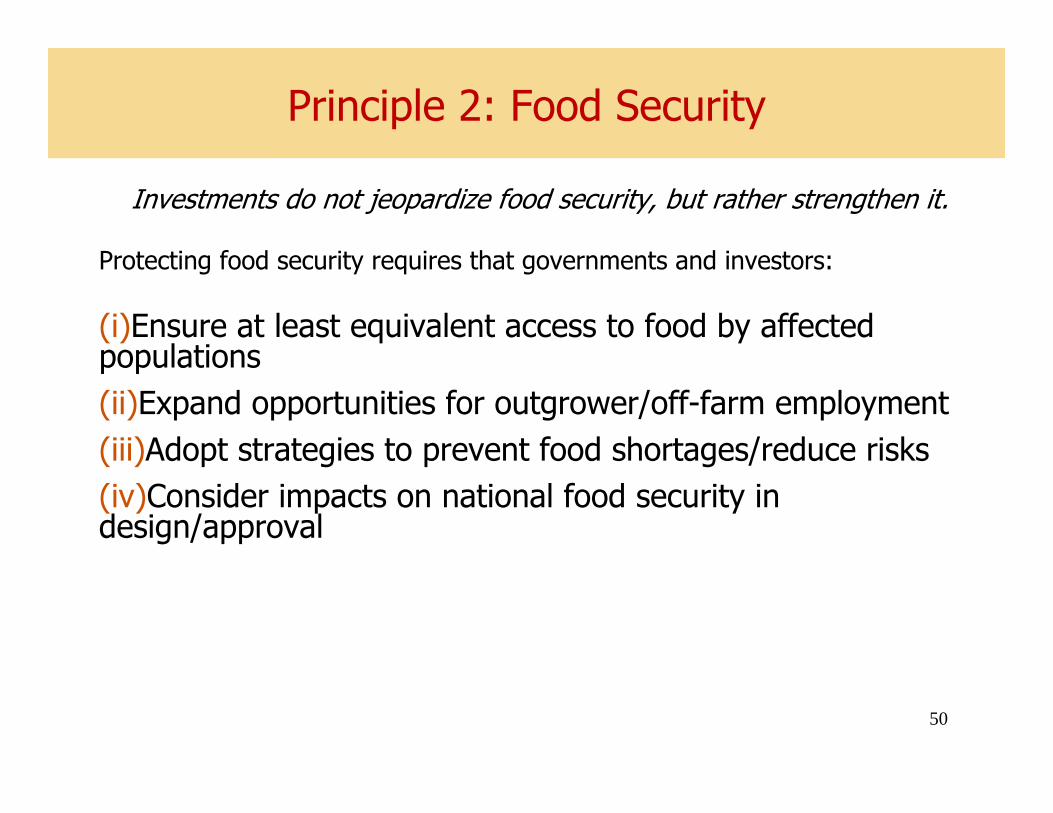
Investments do not jeopardize food security, but rather strengthen it.
Protecting food security requires that governments and investors:
(i)Ensure at least equivalent access to food by affected populations(ii)Expand opportunities for outgrower/off-farm employment(iii)Adopt strategies to prevent food shortages/reduce risks(iv)Consider impacts on national food security in design/approval
Principle 2: Food Security

World Development Report 2008
51
Processes for accessing land and making associated investments are transparent, monitored, and ensure accountability by all stakeholders.
Public and private sector policies, rules, and practices should ensure that:
(i)All relevant information is publicly available (ii)Institutions have capacity to operate efficiently and transparently, practice good governance, & are audited(iii)An independent system to monitor progress towards a better investment climate is in place
Principle 3: Transparency
World Development Report 2008
52
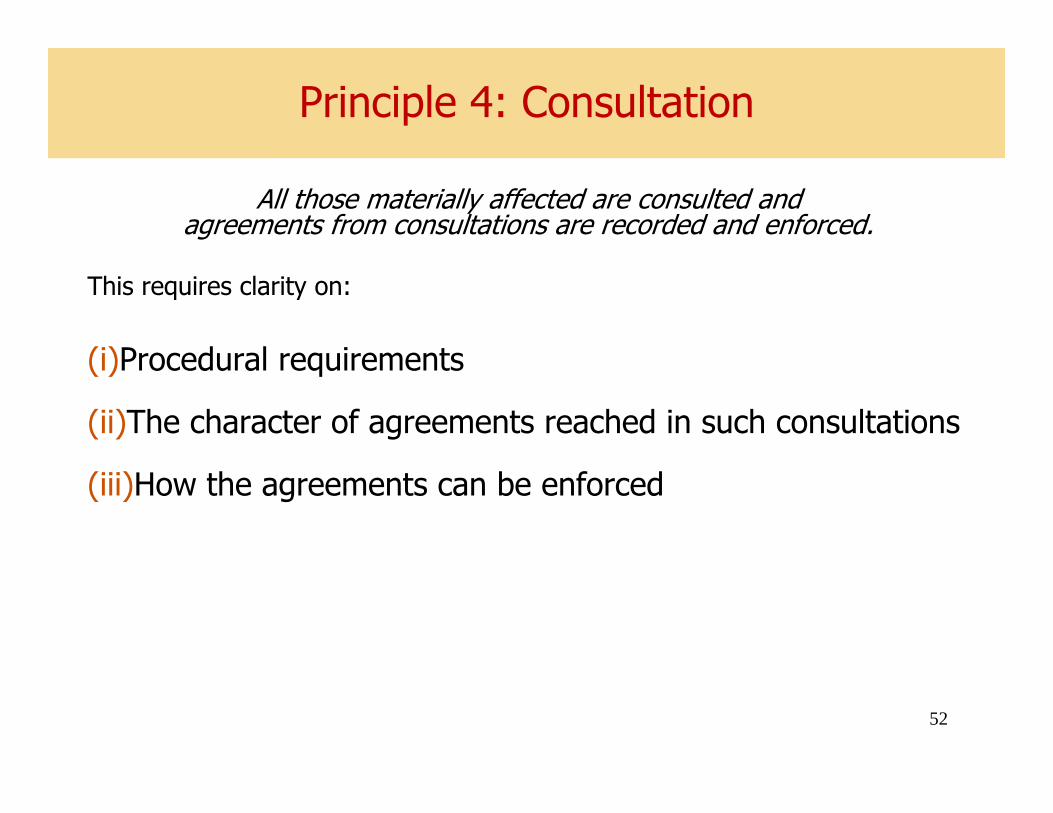
All those materially affected are consulted and agreements from consultations are recorded and enforced.
This requires clarity on:
(i)Procedural requirements
(ii)The character of agreements reached in such consultations
(iii)How the agreements can be enforced
Principle 4: Consultation

World Development Report 2008
53
Projects are viable economically, respect the rule of law, reflect industry best practice, and result in durable shared value.
All investors (whether private or government-linked) should:
(i)Comply with laws, international treaties, best practices
(ii)Adhere to global best practices
(iii)Aim to increase shareholder value & benefit host area
Governments must also assess economic viability in a cost-effective way and integrate major projects into broader development strategies.
Principle 5: Responsible Investing
World Development Report 2008
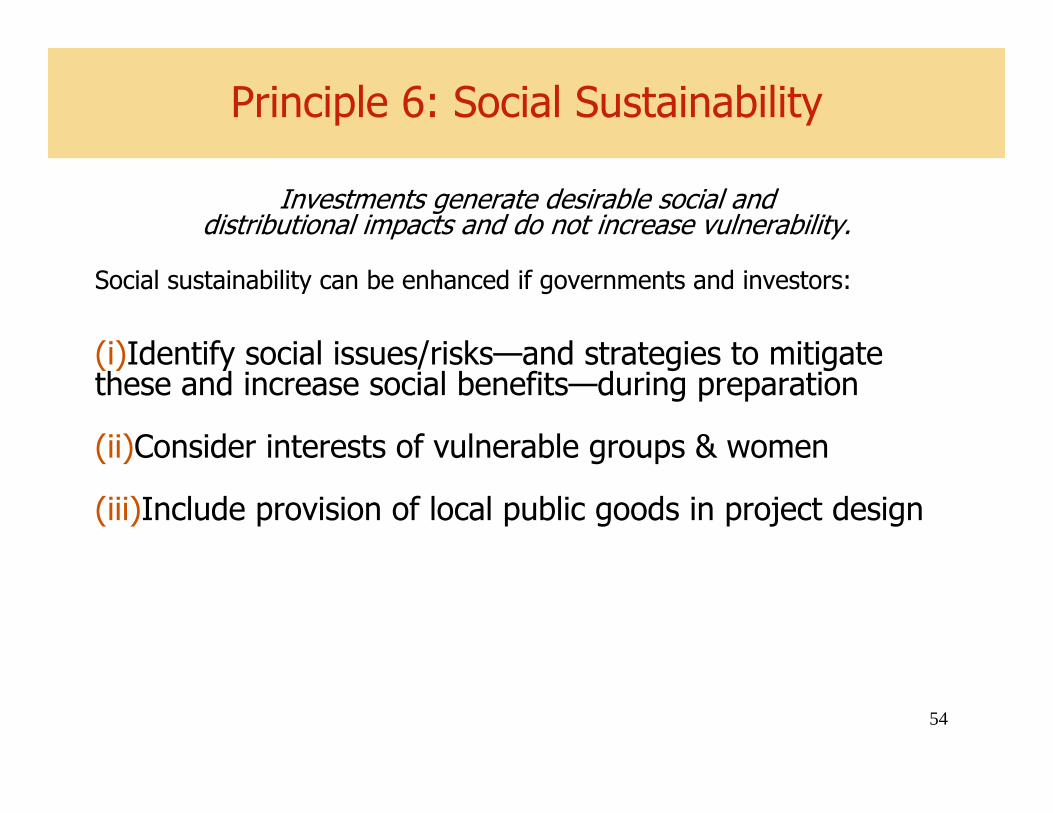
54
Investments generate desirable social and distributional impacts and do not increase vulnerability.
Social sustainability can be enhanced if governments and investors:
(i)Identify social issues/risks—and strategies to mitigate these and increase social benefits—during preparation
(ii)Consider interests of vulnerable groups & women
(iii)Include provision of local public goods in project design
Principle 6: Social Sustainability
World Development Report 2008
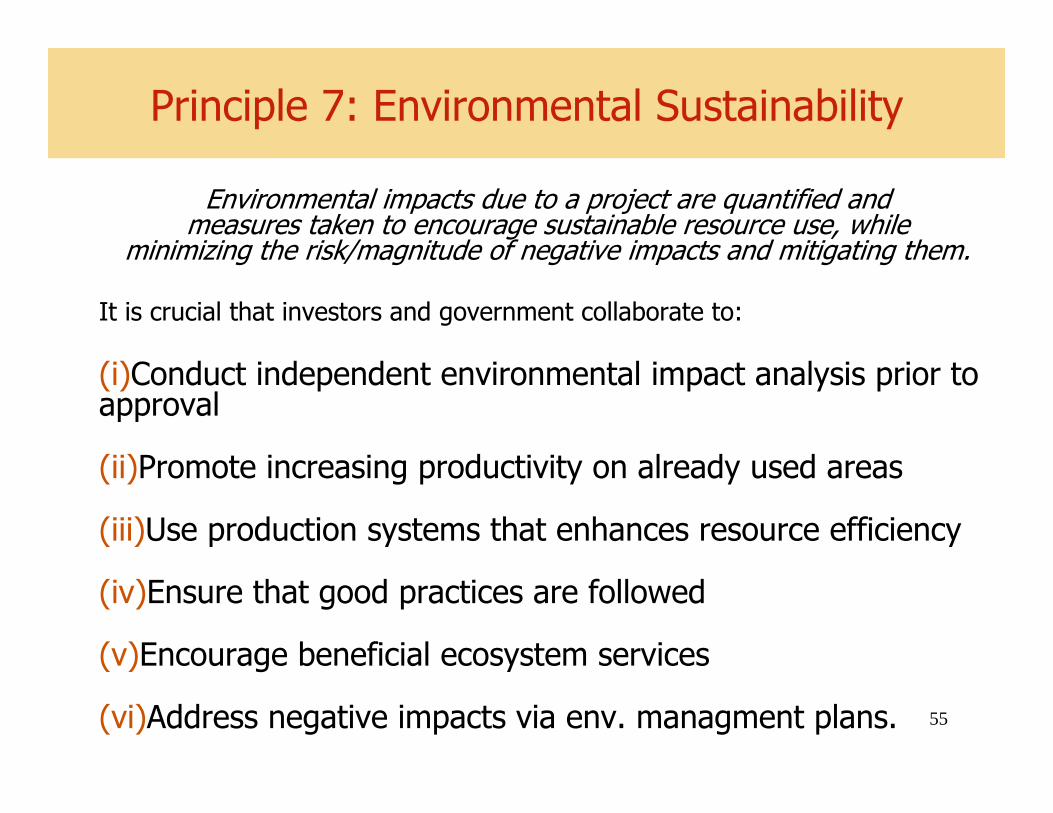
55
Environmental impacts due to a project are quantified and measures taken to encourage sustainable resource use, while
minimizing the risk/magnitude of negative impacts and mitigating them.
It is crucial that investors and government collaborate to:
(i)Conduct independent environmental impact analysis prior to approval
(ii)Promote increasing productivity on already used areas
(iii)Use production systems that enhances resource efficiency
(iv)Ensure that good practices are followed
(v)Encourage beneficial ecosystem services
(vi)Address negative impacts via env. managment plans.
Principle 7: Environmental Sustainability