Embed Size (px)
Citation preview
PAS Project 1
Addressing the Urban Sanitation Challenge Ground realities and emerging opportunitiesGround realities and emerging opportunities
M M ht Meera Mehta Symposium on Urban Sanitation Challenges in the Developing World
lBIRAC, Bangalore Nov 6 2014
CEPT University, INDIA

Challenge of Open Defecation
Globally, 100 million people in urban areas resort to open defecation pOf these 48% are in India
India, 48.2
Indonesia, 17.3
Nigeria, 12.4
INDIA Sudan, 2.5
Pakistan, 2.3
Philippines, 1.6
INDIA
Madagascar, 1.4
Ethiopia, 1.3
Benin, 1.2
South Sudan 1 1South Sudan, 1.1
Rest of the World, 15.5
Source: Based on information from WHO / UNICEF Joint Monitoring Programme (JMP – 2013) for Water Supply and Sanitation; Retrieved on 20th Sep 2013 from http://www.wssinfo.org/data‐estimates/table/

India story – faltering on sanitation!
Share of urban population for India is 11% as compared to
India’s share 47% of urban population resorting to open defecation
4750
% share of urban population ‐ versus ‐% of urban population resorting to OD
p p g p
3640
19
26
20
30
Region/ Country wise % share of urban population
15
11910
20
Region/ Country wise % share of urban population resorting to OD
00
China Countries with low middle income
India Sub‐Saharan Africa
Source: WHO / UNICEF Joint Monitoring Programme (JMP – 2013) for Water Supply and Sanitation; Retrieved on 20th Sep 2013 from http://www.wssinfo.org/data‐estimates/table/
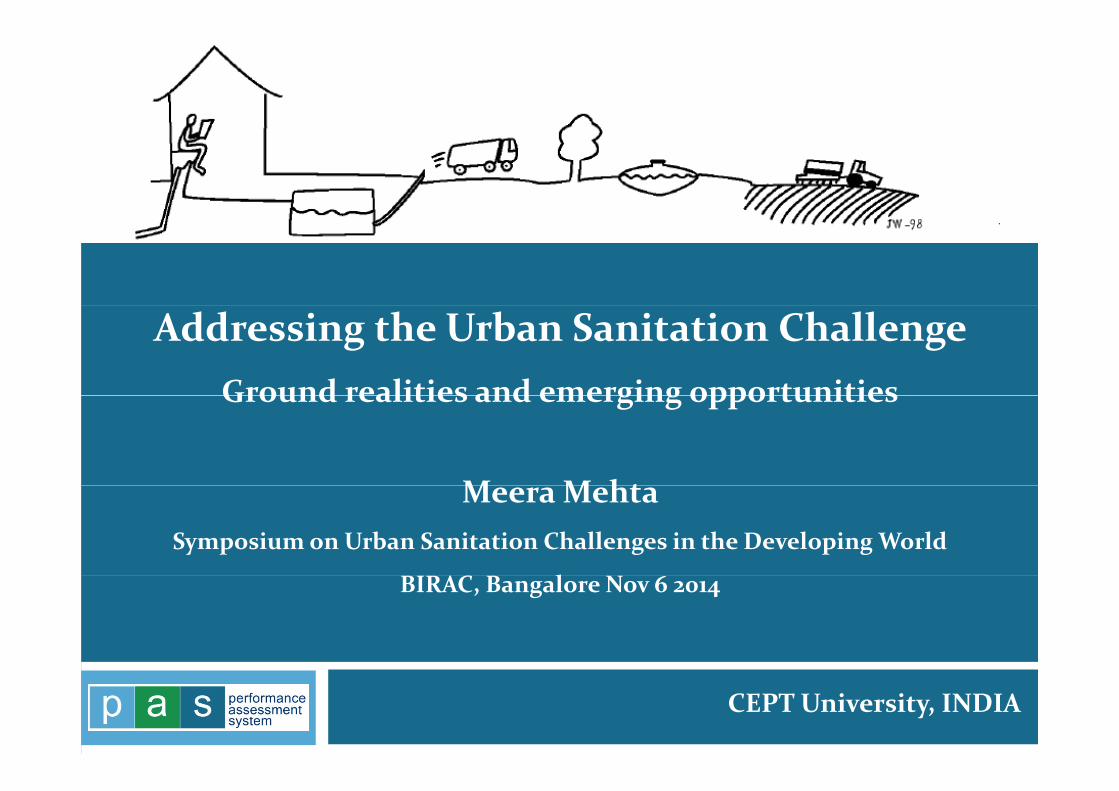
Challengeofwastewater
100120
Access to sewerage services in LAMIC
80
Different types of sanitation systems in urban India
1190
020406080100
4050607080
% of cities
1190
6Middle East and North Africa
Europe and
Central Asia
Latin America and
Caribbean
East Asia and Pacific
South Asia Sub Saharan Africa
0102030
Fully sewage Fully onsite Mixed sanitation
%
5
369
Sewerage Coverage (%) HH sewer conn
Source: IBNET(2011), WHO (2010)
Fully sewage system
Fully onsite sanitation system
Mixed sanitation system
Source: CEPT University, PAS Project
JMP‐WHO data for 2010 suggests limited access tosewerage connections across most regions except ECAsewerage connections across most regions except ECA
In India – only 5 cities have universal sewerage systemswhereas nearly 1200 cities have fully onsite systems

Global goals and targets beyond 2015
From July 2013 Report of the UN Secretary General A life of dignity for all: accelerating progress towards the Millennium Development Goals and d i h UN d l d b d advancing the UN development agenda beyond 2015
“No person should go hungry, lack shelter or clean water and sanitation, face social and economic exclusion or …. These are human rights, and form the foundations for a decent life.” (p.3)g f f f f (p 3)
From JMP’s Post‐2015 group for WASH Universal access to adequate sanitation at home (2040)q ( 4 ) Complete elimination of open defecation (2030) Sustainability and progressively eliminating inequities
From UN‐Open Working Group on SDGs July 2014 zero draft Proposed Goal 6: Ensure availability and sustainable use of water and
sanitation for all By 2030 universal access to safe and affordable water and adequate
sanitation and hygiene for all Improve water quality by reducing pollution, doubling wastewater
treatment and increasing recycling and reuse by x% globallytreatment and increasing recycling and reuse by x% globally

Why is urban sanitation important?
Much greater negative externality of poor sanitation in urban areassanitation in urban areas
Significant public health impacts of open defecation – stunting outbreaks of diseases: higher in urban – stunting, outbreaks of diseases: higher in urban due to density
Increasing priority of government
“Pehle shauchalaya, phir devalaya…” “First Pehle shauchalaya, phir devalaya… First toilets, then temples…”
Narendra Modi, Prime Minister of IndiaAt f ti i d i N D lhi f th th O t b 2013At a function organized in New Delhi for the youth, October, 2013
The Union Cabinet approval to an ambitious 5‐year
S t hh Bh t Mi i i ll 4041 t t tSwatchh Bharat Mission covering all 4041 statutory
towns starting Oct 2, 2014 with a focus on towns starting Oct 2, 2014 with a focus on
elimination of open defecation and …. Swatchh Bharat Programme for Urban Areas: PIB, Government of India Cabinet, September 24 2014

There are large gaps in urban sanitation service chain
67 025 54 778
Access TreatmentContainment and Conveyance
Communitytoilets
Opendefecation
67,025
6%
12% 7%Pit toiletsOthers1
54,7784%
Individual
45%Septic tanks Untreatedwaste 79%
Individual toilets 82%
Sewerageconnections 44%
Treated
Access to type of sanitation for HH in urban India
disposal of waste by HH with personal toilets
Treatedwaste 21%
treatment of waste water in urban India2
(in ‘000 HH)p
(in ‘000 HH)
37 million practice open defecation in urban India
28 million people with individual toilets use unsanitary/ unimproved
30,004 MLD untreated wastewater is discharged in water
Note: (1) Others category includes census categories of “pour flush toilets‐other systems, night soil disposed intro open drain and latrines serviced by humans and animals”, (2) based on “Status of Sewage Treatment in India” report by Central Pollution Control Board of India (CPCB), 2005
Source: Analysis of access, and containment and conveyance is based on information from Census of India 2011
y/ ptoilets
gbodies or on land
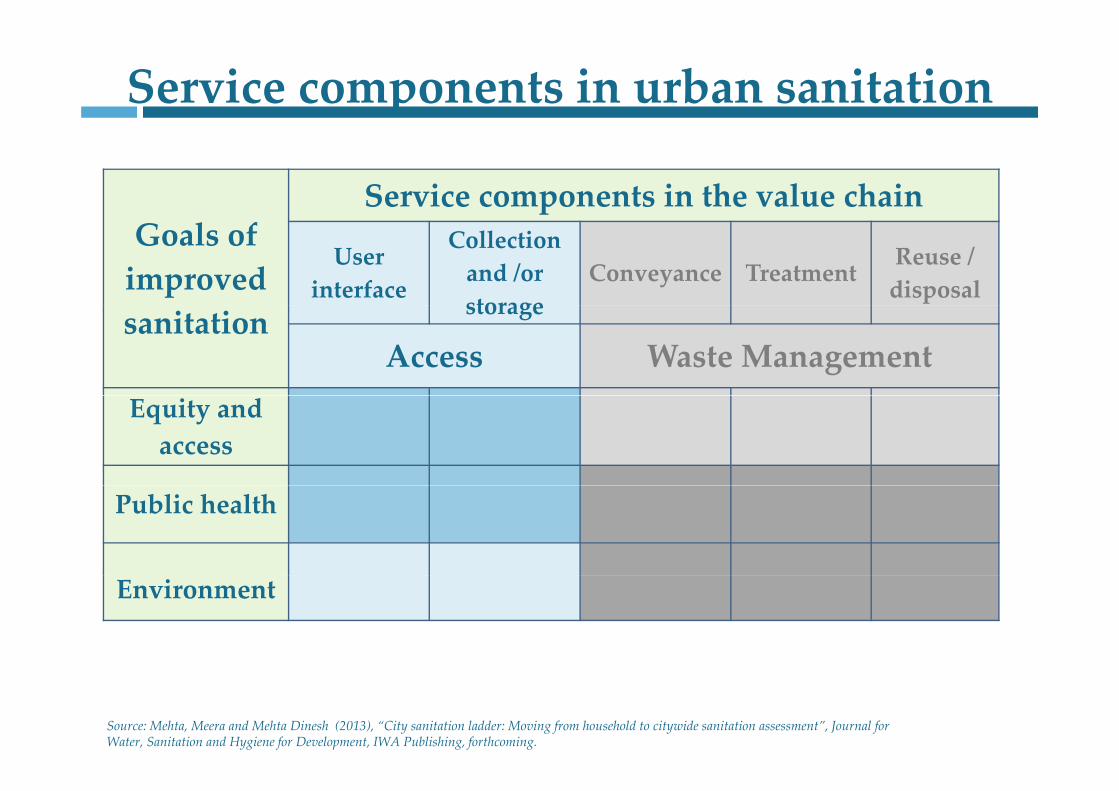
Service components in urban sanitation
Service components in the value chainGoals of improved
User interface
Collection and /or storage
Conveyance TreatmentReuse / disposal
sanitation storage
Access Waste ManagementEquity and access
Public health
Environment
Source: Mehta, Meera and Mehta Dinesh (2013), “City sanitation ladder: Moving from household to citywide sanitation assessment”, Journal for Water, Sanitation and Hygiene for Development, IWA Publishing, forthcoming.
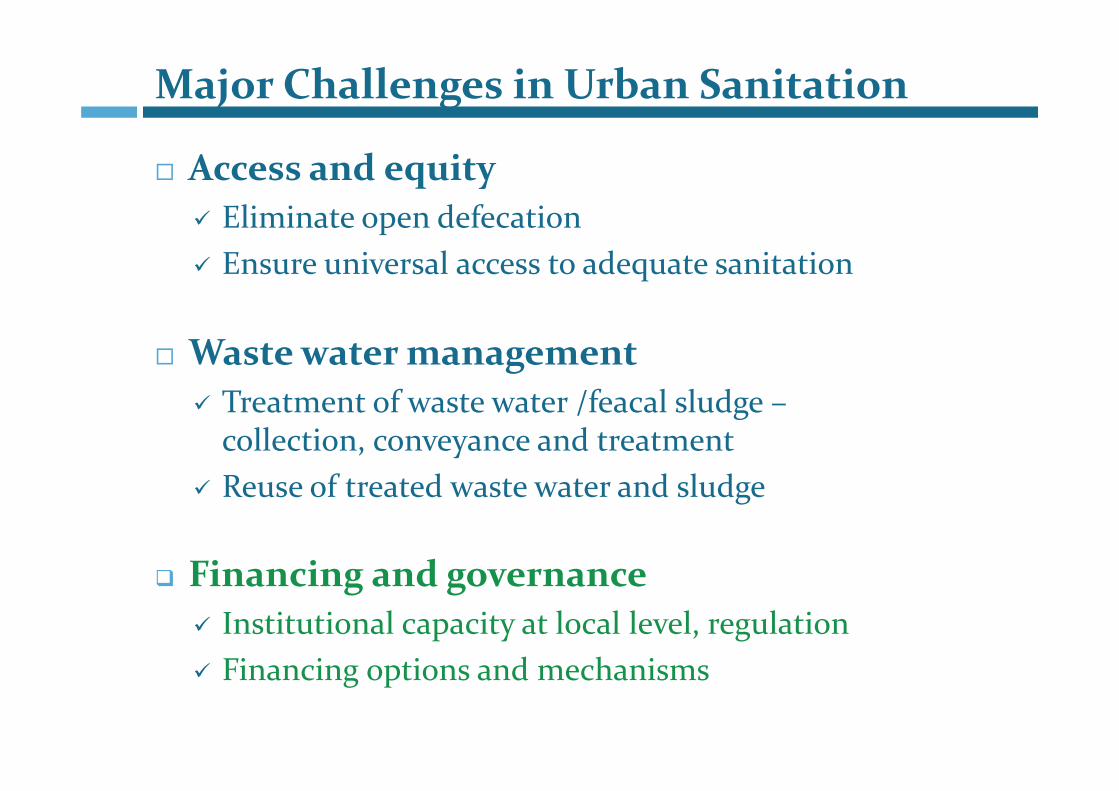
Major Challenges in Urban Sanitation
Access and equity Eliminate open defecation Eliminate open defecation Ensure universal access to adequate sanitation
Waste water management T t t f t t /f l l d Treatment of waste water /feacal sludge –collection, conveyance and treatment
Reuse of treated waste water and sludge Reuse of treated waste water and sludge
Financing and governance Financing and governance Institutional capacity at local level, regulation Fi i ti d h i Financing options and mechanisms

Eliminating open defecation

Progress on MDG – missing the target?
2015
G i tiGap in meeting the MDG target
Basic accessBasic access increased from 50%
to 60%
OD still high at 13%
Source: Projections by PAS Project based on data from WHO‐UNICEF Joint Monitoring Program, 2013 Update

Progress on new ‘SDG’ – by 2030 / 2040?
Estimated proportion of the population using improved sanitation and population resorting to OD
Policy changes needed for universal improved
80
90
100
80%
psanitation by 2040
The rate of increase for
?? 100%
60
70
rcen
tage (%
) 72.5%
61.6%
‘improved sanitation at home’ will need to increase significantly – double/triple
30
40
50
Pup
ulation pe
r
Need to convert community toilets by promoting sharing b h h ld / f ili
10
20
3P
20.3%
8.0%
10.1%7.2%
20.3% 20.% by 5 households/ families
Based on past trends open 01980 1990 2000 2010 2020 2030 2040 2050
Year
Based on past trends open defecation from urban India is likely to be eradicated by
8Total Improved (%) Shared (%)
Open Defecation (%) Other Unimproved (%)
2028.
Source: Projections by PAS Project based on data from WHO‐UNICEF Joint Monitoring Program, 2013 Update


Space and affordability constraints
60
30 Gujarat
Maharashtra
0No space Lack affordability Lack space and Renter
Latent demand?
affordability
Two main reasons for not having “own toilets” in our cities”1. Lack of space to build an own toilet2. Lack of affordability to meet the toilet costs 2. Lack of affordability to meet the toilet costs
Source: Based on household surveys in Gujarat and Maharashtra done under he PAS Project at CEPT University in 2010.
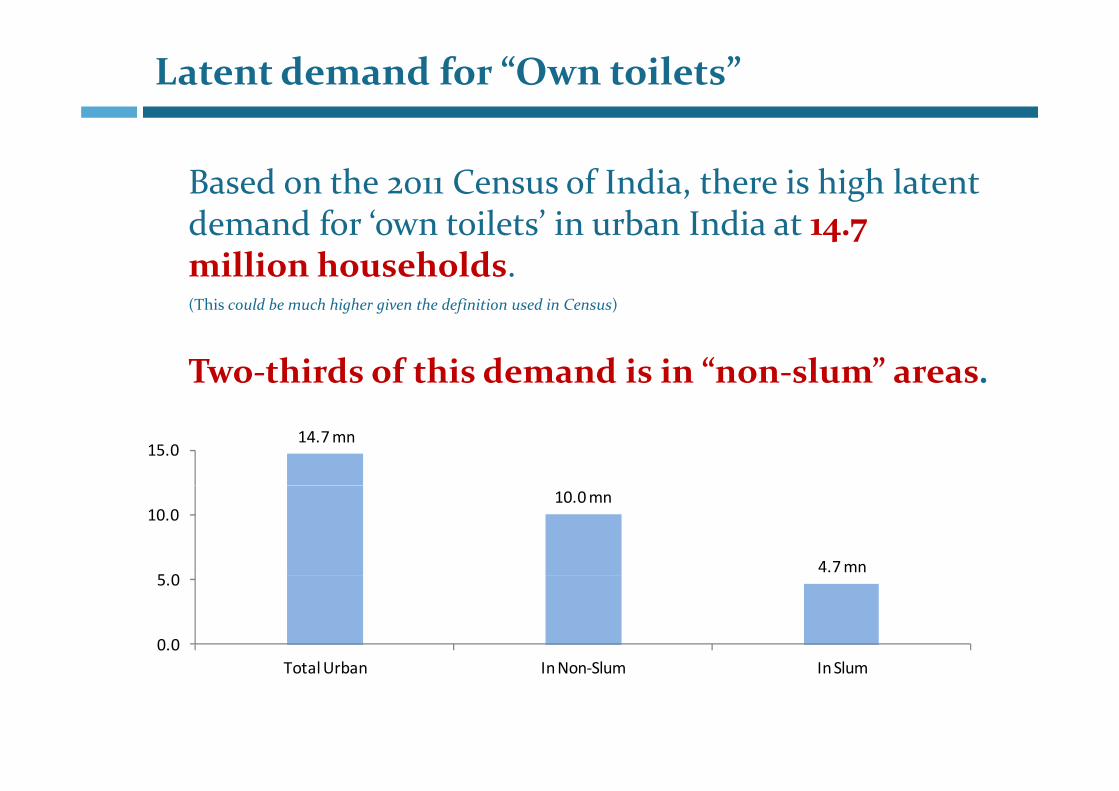
Latent demand for “Own toilets”
Based on the 2011 Census of India, there is high latent d d f ‘ t il t ’ i b I di t demand for ‘own toilets’ in urban India at 14.7 million households. (This could be much higher given the definition used in Census)(This could be much higher given the definition used in Census)
Two‐thirds of this demand is in “non‐slum” areas.
14.7 mn15.0
10.0 mn
4.7 mn5 0
10.0
0.0
5.0
T t lU b I N Sl I SlTotal Urban In Non‐Slum In Slum
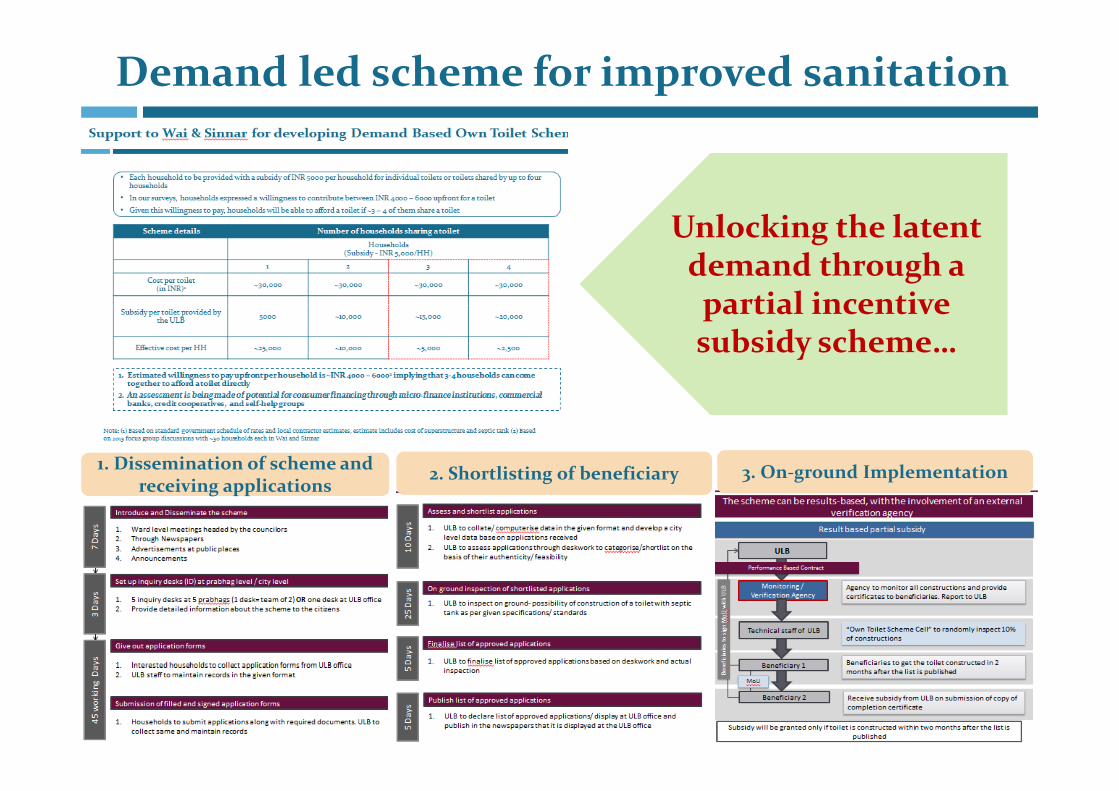
Demand led scheme for improved sanitation
U l ki h l Unlocking the latent demand through a partial incentive partial incentive subsidy scheme…
1. Dissemination of scheme and receiving applications
2. Shortlisting of beneficiary 3. On‐ground Implementationreceiving applications

Addressing affordability constraint
Partial subsidy through a demand based Partial subsidy through a demand based scheme at city level can address affordability concerns to some extentconcerns to some extent
Household surveys suggest that most households that lack own toilets will require access to credit that lack own toilets will require access to credit to build a toilet. There is some willingness to take a loan to build a toileta loan to build a toilet
How do we get potential lenders to lend in a it th t d l l l it l l ?city that develops a local city level program?

Options for waste water management
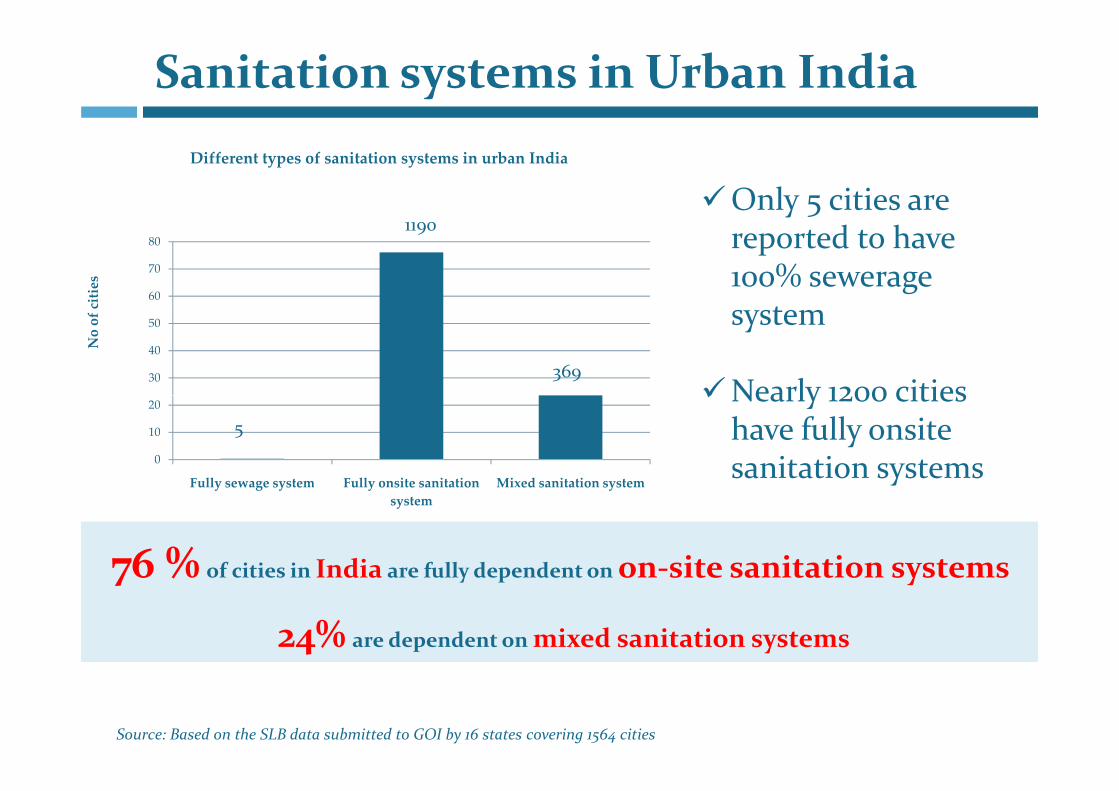
Sanitation systems in Urban India Different types of sanitation systems in urban India
Only 5 cities are
60
70
80
cities
1190y 5
reported to have 100% sewerage
30
40
50
No of c
369
system
Nearly 1200 cities
0
10
20
Fully sewage system Fully onsite sanitation Mixed sanitation system
5
Nearly 1200 cities have fully onsite sanitation systems
76 %of cities in India are fully dependent on on‐site sanitation systems
Fully sewage system Fully onsite sanitation system
Mixed sanitation systemy
76 %of cities in India are fully dependent on on site sanitation systems
24% are dependent on mixed sanitation systems
Source: Based on the SLB data submitted to GOI by 16 states covering 1564 cities

ChallengeOnsite sanitation – emerging questions
38 2% SEPTIC TANKS38.2%URBAN HHs HAVE SEPTIC TANKS
Are septic tanks linked to soak pitsAre septic tanks linked to soak pitsA th b ilt C d / S ifi ti ?Are they built as per Codes / Specifications ?
How often are they cleaned ?Where does the effluent flow ?Where does the effluent flow ?
What happens to the SLUDGE?

Support to Citywide Strategies
Key Activities in Preparation of City Sanitation PlansSupport to cities in state of Maharashtra, India
Citywide sanitation improvement plans with non‐conventional systems that would have the same outcomes
Implementation of citywide solutions based on local priorities

Existing situation in cities
Pour flush latrinesPour flush latrines Existing Pit and Septic Existing Pit and Septic Open / covered drainsOpen / covered drains
User interfaceUser interface CollectionCollection ConveyanceConveyance TreatmentTreatment Reuse /DisposalReuse /Disposal
Pour flush latrinesPour flush latrines tank with drain fieldtank with drain field Open / covered drainsOpen / covered drains
No treatment of fecal No treatment of fecal
No conveyance system in new developments
No conveyance system in new developments
Into river or natural drain
Into river or natural drain
No treatment of fecal sludge
No treatment of fecal sludge Dumping along
with solid wasteDumping along with solid waste
Lack of 100% coverage Lack of scientific disposal
Old city area - Inadequate primary treatment but good conveyance through open drains
Lack of 100% coverage of conveyance system Lack of treatment facility Lack of scientific disposal
of septage New developments - Improved primary treatment through septic
tanks but no drains or have soak pits
Missing links in Sanitation value chainMissing links in Sanitation value chain
Pour flush toilets
gg

Existing Sanitation situation in small cities
USER INTERFACE COLLECTION/ STORAGE CONVEYANCE TREATMENT/ DISPOSAL

Septage collection: Inappropriate design and location of household septic tanks often makes access difficult for regular cleaning and emptying
Septic tanks are below the toilets and don’t have access
covers
Inaccessible septic tanks withsealed tops
Septic tanks often empty into drains
Individual toilets
In many toilets, septic tanks 2 Chambered septic tanks located Newer toilets have 2‐3 chambered
Community toilets
y , plocated behind the complex behind community toilets
3septic tanks with access covers
Source: City Sanitation Plan, PAS Project – CEPT University

Wastewater collection and conveyance: Current issues
Effluent and grey‐water being discharged into drains Widespread clogging of drains
Source: City Sanitation Plan, PAS Project – CEPT University

Current status of disposal of wastewater and septage in cities
Wastewater dumps into the river Septage is disposed off in the open
Source: City Sanitation Plan, PAS Project – CEPT University

End‐to‐end integrated fecal sludge management (IFSM)
Access Collection Conveyance Treatment Disposal / Reuse
P fl h S ti N t t t Di d ff Pour flush toilets Septic tanks Suction
emptier truckNo treatment
facilityDisposed off on dumping site
Current value
• Septage disposed off on dumping site without treatment
• Septic tanks lack manhole covers
S ti t k t
• Only 2‐4 % of septic tanks cleanedannually
• No facility for fecal sludge treatment
chainwithout treatment• Septic tanks are not
of standard size
• No database on septic tanks for properties
annually
Pour flush toilets Septic tanks Suction
emptier trucksSludge drying
bedsRevenue from
compost
• Safe dumping of • Providing access • Preparing a schedule • Installing fecal
Proposed value
• Safe dumping of treated fecal matter and/or the sale of septage at a fixed rate to nearby farms or agro‐businesses
• Providing access manhole covers to allow regular cleaning
• Enforcing regulations on septic tanks design
• Preparing a schedule for period cleaning of septic tanks, to ensure that all septic tank are cleaned at least once in 3 years
• Installing fecal sludge drying beds for the treatment of fecal sludge
value chain
gtanks design
• Data base of properties with septic tanks
3 y
• Enforcing regulations and penalties for periodicity of septic tank cleaning and safe tank cleaning and safe handling of sludge
• Payment using local taxes using escrow mechanisms

From complaint redressal to a regular IFSM service
Current septage management practice Recommended septage management practice
~2‐4% of tanks cleaned per year ~33% of tanks cleaned per year
P d l iC b i
2 4% of tanks cleaned per year(once in >8‐10 years)
33% of tanks cleaned per year(once in 3 ‐5 years)
Proposed solutionCurrent barriers
Cleaning is done on‐call by the household, who do not see the need for regular cleaning
Septic tanks will be cleaned on a pre‐determined schedule
1 1
The cleaning services of the ULB are currently treated as a complaint redressal system for overflowing septic tanks rather than a regular
cleaning and maintenance service
Regulations and penalties will be set in place to ensure periodic cleaning
Awareness generation activities will educate households about the need for regular cleaning
Each town has only 1 truck, owned and operated by the ULB
Each town will get an additional 1‐ 3 trucks to meet service standards, which will be operated
by a private player
g households about the need for regular cleaning
2 2
y p p y
Households pay ~INR 400‐1000 to get tanks cleaned, but only once in >8‐10 years when the
tanks overflow
Local taxes levied by the ULB as per municipal act 1 will be used to recover the operating
expenses for regular cleaning
33
Note (1) Maharashtra Municipal Councils, Nagar Panchayats and Industrial Townships Act, 1965, Chapter IX : Municipal taxation, Section 108
p g g

Good risk mitigation and allocation can attract good contractors and help reduce contract price
Several risks involved during lifecycle of the
project, where PPP is involved.
These need to be addressed
Concerns about addressingth i k i d b the risks were raised by private sector during
interactions

Existing Wastewater f lows - Wai
User interface Containment Conveyance Treatment Reuse /Disposal
On premise
Toilets
(68%)
Community
toilets (30%)
Reuse in
agriculture
Water bodies
Solid waste
dump site
Reuse as
compost
Septage
treatment
facility
City
environment
(open spaces,
corridors etc)
Bathrooms
Kitchens
Groundwater
Drains Land or water
bodies
Sewerage
network (conventional,
settled)
Reuse as
compost
WW treatment
facility
Reuse in
agriculture
Remains in Tank
Soak pit
Sewerage
connection
Groundwater
Septic tanks
Wa
st
e w
at
er
1
33
7
ML
/Y
EA
R
Open
defecation
Grey water Black water Effluent Septage
STP
Pit toilets
Safe emptying
80 % 91.1 %
11.1 %
80 %
20 %
0.4 %
1.9 %
17.8 % 0.2 %
6.3 %
0.4 %
1.9 %
6.3 %
0.2 %

Improvement Proposal - Wai
User interface Containment Conveyance Treatment Reuse /Disposal
Wa
st
e w
at
er
1
33
7
ML
/Y
EA
R
Safe emptying
Reuse in
agriculture
Water bodies
Solid waste
dump site
STP
Reuse as
compost
Septage
treatment
facility
City
environment (open spaces,
corridors etc)
Groundwater
Drains
Land or water
bodies
Sewerage
network
(settled)
Reuse as
compost
Grey water Black water Effluent Septage
WW treatment
facility
Reuse in
agriculture
Remains in Tank
Pit toilets
Soak pit
Sewerage
connection
(settled)
Septic tanks
Groundwater
On premise
Toilets
Community
toilets
Bathrooms
Kitchens
Open
defecation
Treatment
Septage
treatment
facility
WW treatment
facility
20 %
80 %
80 %
20 %
80 %
6.7 %
12.9 %
92.9 %
42.9 %
50.0 %
6.7 % 6.7 %
80 %
0.2 %
0.2 %

Financing options for sanitation

Leveraging funds for making cities ODF
Demand led schemes Active participation of state and urban local governments with locally led schemes with applications from households households
Partial subsidies to unlock latent demand
L li i d bli f d b l i Leverage limited public funds by exploring innovative new sources of funds Facilitate access to affordable credit for all households Policy changes to increase credit flows – Explicit focus on
i i i P i i S L di (PSL)sanitation in Priority Sector Lending (PSL) Explore new sources of funds
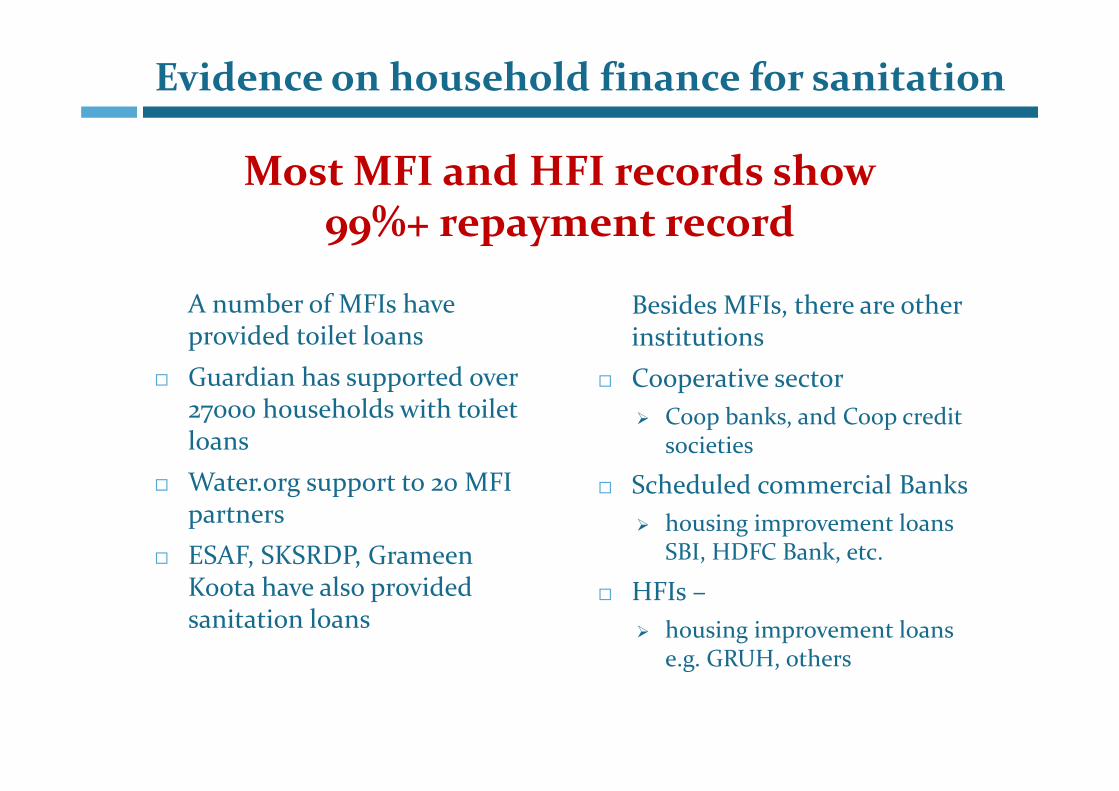
Evidence on household finance for sanitation
Most MFI and HFI records show% r p m nt r rd
A number of MFIs have Besides MFIs there are other
99%+ repayment record
A number of MFIs have provided toilet loans
Guardian has supported over
Besides MFIs, there are other institutions
Cooperative sector27000 households with toilet loans
Water org support to 20 MFI
Coop banks, and Coop credit societies
Scheduled commercial Banks Water.org support to 20 MFI partners
ESAF, SKSRDP, Grameen
Scheduled commercial Banks housing improvement loans
SBI, HDFC Bank, etc. Koota have also provided sanitation loans
HFIs – housing improvement loans
e.g. GRUH, others
35
e.g. GRUH, others
But, additional funds are needed
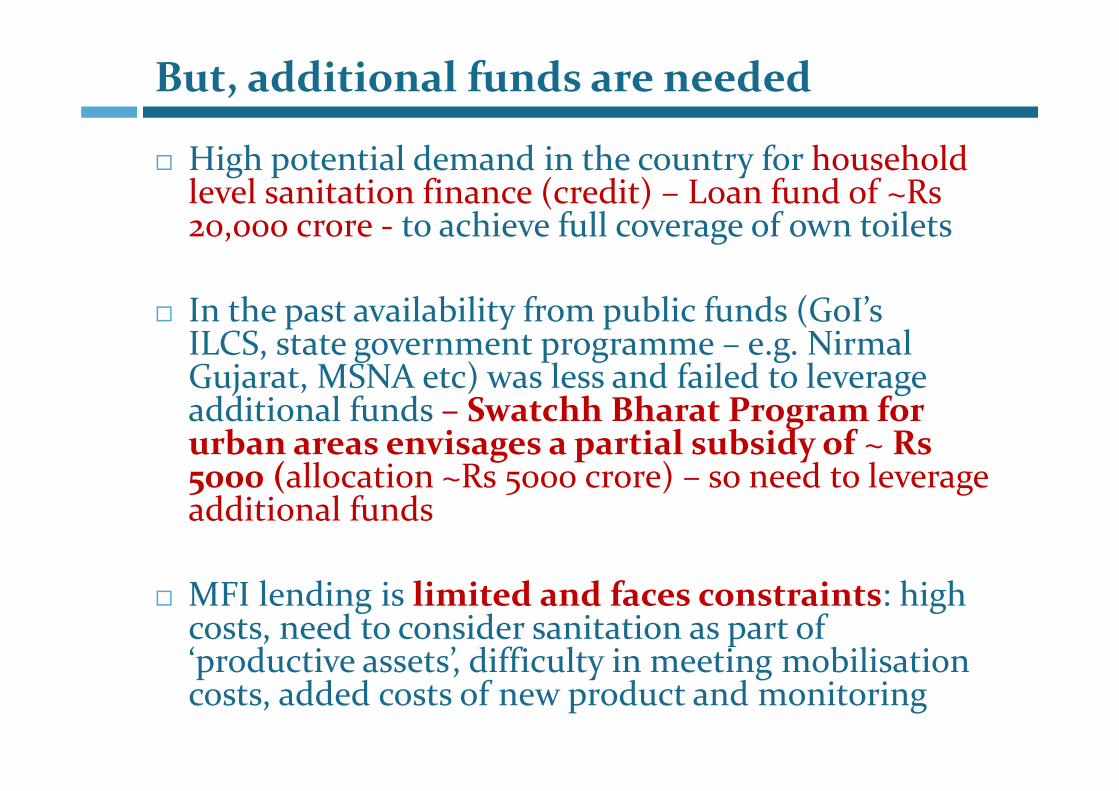
High potential demand in the country for household level sanitation finance (credit) – Loan fund of ~Rs
hi f ll f il20,000 crore ‐ to achieve full coverage of own toilets
In the past availability from public funds (GoI’s In the past availability from public funds (GoI sILCS, state government programme – e.g. Nirmal Gujarat, MSNA etc) was less and failed to leverage dd l f d hh h fj g
additional funds – Swatchh Bharat Program for urban areas envisages a partial subsidy of ~ Rs 5000 (allocation ~Rs 5000 crore) – so need to leverage 5000 (allocation Rs 5000 crore) so need to leverage additional funds
MFI lending is limited and faces constraints: high costs, need to consider sanitation as part of ‘productive assets’ difficulty in meeting mobilisationproductive assets, difficulty in meeting mobilisationcosts, added costs of new product and monitoring

Funds are needed for three purposes
Partial Subsidies to unlock demand and improve paffordability
Debt funds for on‐lending by lenders –Debt funds for on lending by lenders MFIs, HFIs, AHFIs, ‐ at affordable and competitive ratesrates
Support grantsFor lenders to meet mobilization /monitoring costs which For lenders to meet mobilization /monitoring costs, which cannot be easily covered through capped margins
For Cities/ ULBs to meet costs of technical support in For Cities/ ULBs to meet costs of technical support in preparing demand led schemes, monitoring
For statewide /local campaigns, awareness generation/ p g , g

What is required to make all cities OD free in 5 years
INR Crores
Investments for toilets 64,447 Assuming it takes INR 30 thousand to build a toilet64,447 to build a toilet
Partial incentive subsidy 12,371 (19%) Assuming Rs 5000 per HH for all households not having a toilet
HH Savings 10,392 (16%) Assuming Rs 5000 and Rs 3000 for APL and BPL HHs respectively
Loans 41,684 (65%)
Loan Fund 22,755 Considering repayment period of 3 years – returnable capital
G t 14 6 8 S b id Grants 14,678 Subsidy + support costs
Support costs 2,306Administration, technical assistance to HHs and monitoring costs awareness generationcosts, awareness generation
Partial incentive subsidy 12,371
L4.39 Investments/Public costs
Leverage8.78 If half of the public costs are
mobilized through CSR , etc.
Source: Estimates based on analysis by the PAS Project, CEPT University, using data from Census of India 2011 and base. Monetary figures are in current prices.
Potential sources of funds
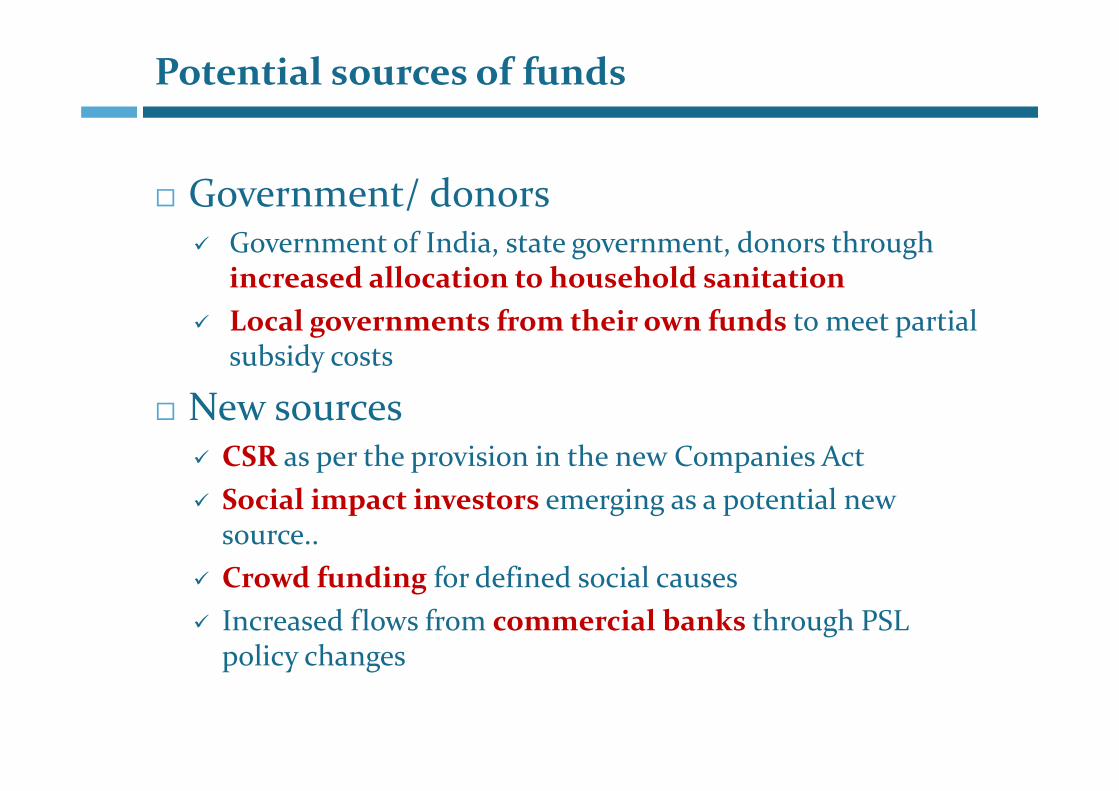
Government/ donors Government of India, state government, donors through
increased allocation to household sanitation Local governments from their own funds to meet partial
subsidy costs
N New sources CSR as per the provision in the new Companies Act Social impact investors emerging as a potential new
source.. Crowd funding for defined social causes Crowd funding for defined social causes Increased flows from commercial banks through PSL
policy changespolicy changes
CSR – a potential new source
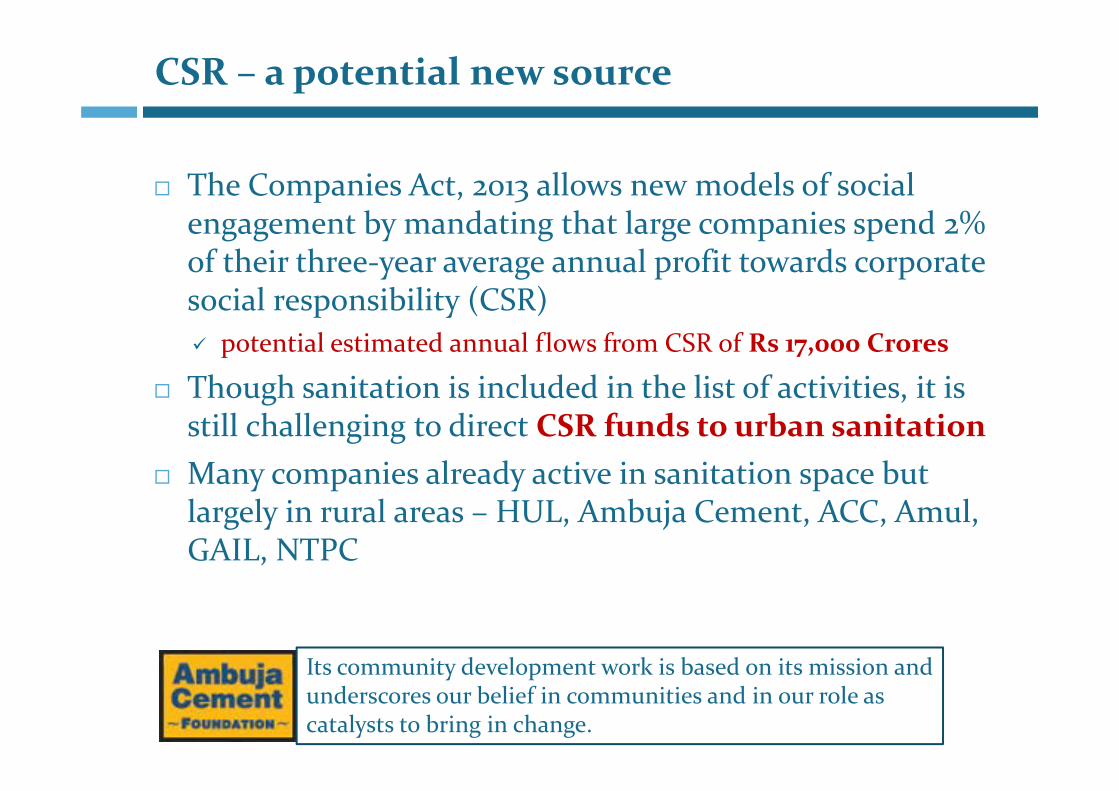
The Companies Act, 2013 allows new models of social t b d ti th t l i d % engagement by mandating that large companies spend 2%
of their three‐year average annual profit towards corporate social responsibility (CSR) social responsibility (CSR) potential estimated annual flows from CSR of Rs 17,000 Crores
Though sanitation is included in the list of activities, it is Though sanitation is included in the list of activities, it is still challenging to direct CSR funds to urban sanitation
Many companies already active in sanitation space but y p y plargely in rural areas – HUL, Ambuja Cement, ACC, Amul, GAIL, NTPC
Its community development work is based on its mission and Its community development work is based on its mission and underscores our belief in communities and in our role as catalysts to bring in change.
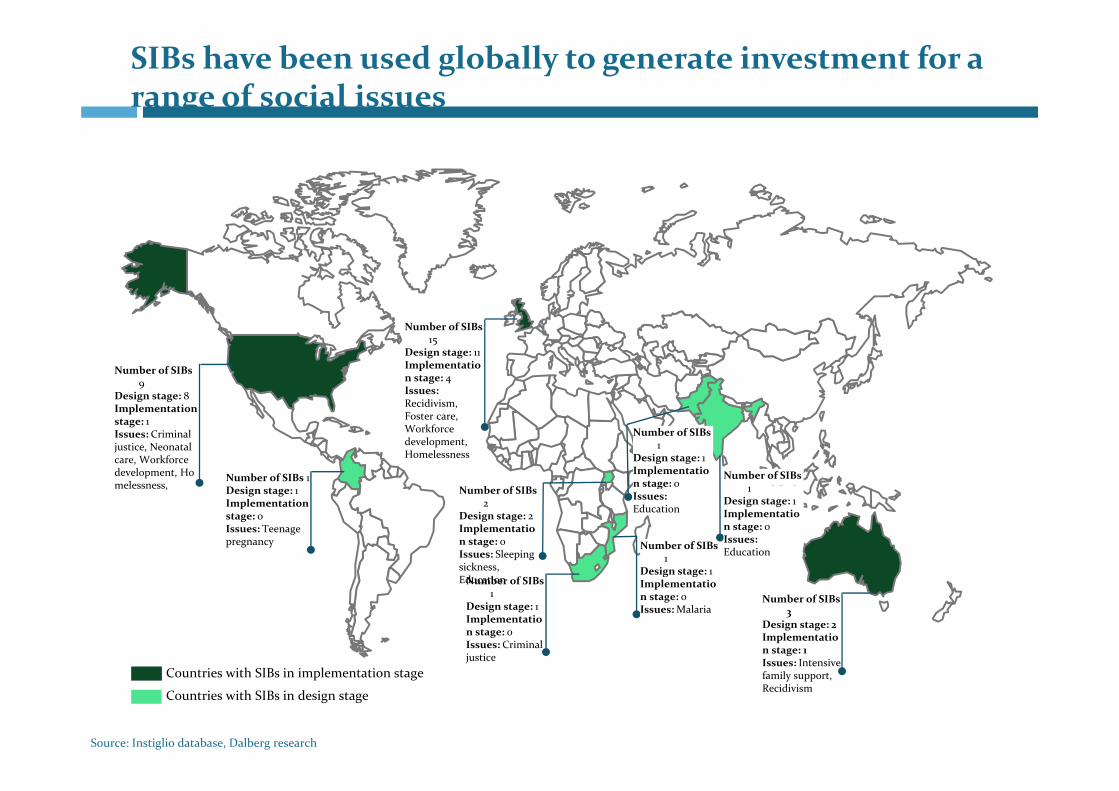
SIBs have been used globally to generate investment for a range of social issues
Number of SIBs 15
Design stage: 11Implementation stage: 4Issues:
Number of SIBs 9
Design stage: 8Recidivism, Foster care, Workforce development, Homelessness
Design stage: 8Implementation stage: 1Issues: Criminal justice, Neonatal care, Workforce development, Homelessness
Number of SIBs 1 Number of SIBs
Number of SIBs 1
Design stage: 1Implementation stage: 0melessness, Design stage: 1
Implementation stage: 0Issues: Teenage pregnancy Number of SIBs
1Design stage: 1
1Design stage: 1Implementation stage: 0Issues: Education
Number of SIBs 2
Design stage: 2Implementation stage: 0Issues: Sleeping sickness,
n stage: 0Issues: Education
Number of SIBs 1
Design stage: 1Implementation stage: 0Issues: Criminal justice
g gImplementation stage: 0Issues: Malaria
Number of SIBs 3
Design stage: 2Implementation stage: 1Issues: Intensive
Education
Source: Instiglio database, Dalberg research
Issues: Intensive family support, Recidivism
Countries with SIBs in implementation stage
Countries with SIBs in design stage

Social impact investors
Social impact investors emerging as a potential new source High net worth individuals (HNI) source.. High net worth individuals (HNI), Institutional social investors, Foundations
For example, a recent 3‐year Debt Funds for Cancer Cure by HDFC Mutual Fund mobilized about Rs 77 + Rs 180 crore. The dividend from this was provided to Indian Cancer The dividend from this was provided to Indian Cancer Society. The first HDFC‐CC Debt Fund provided Rs 11 crore to ICS in two years.

Crowdfunding is fast emerging as an important source
2012‐More than 450 Crowdfunding Platforms 2012‐More than 450 Crowdfunding Platforms • 2011‐ Amount raised US$1.5 billion • 2014‐ amount increased to US$ 5.1 billion
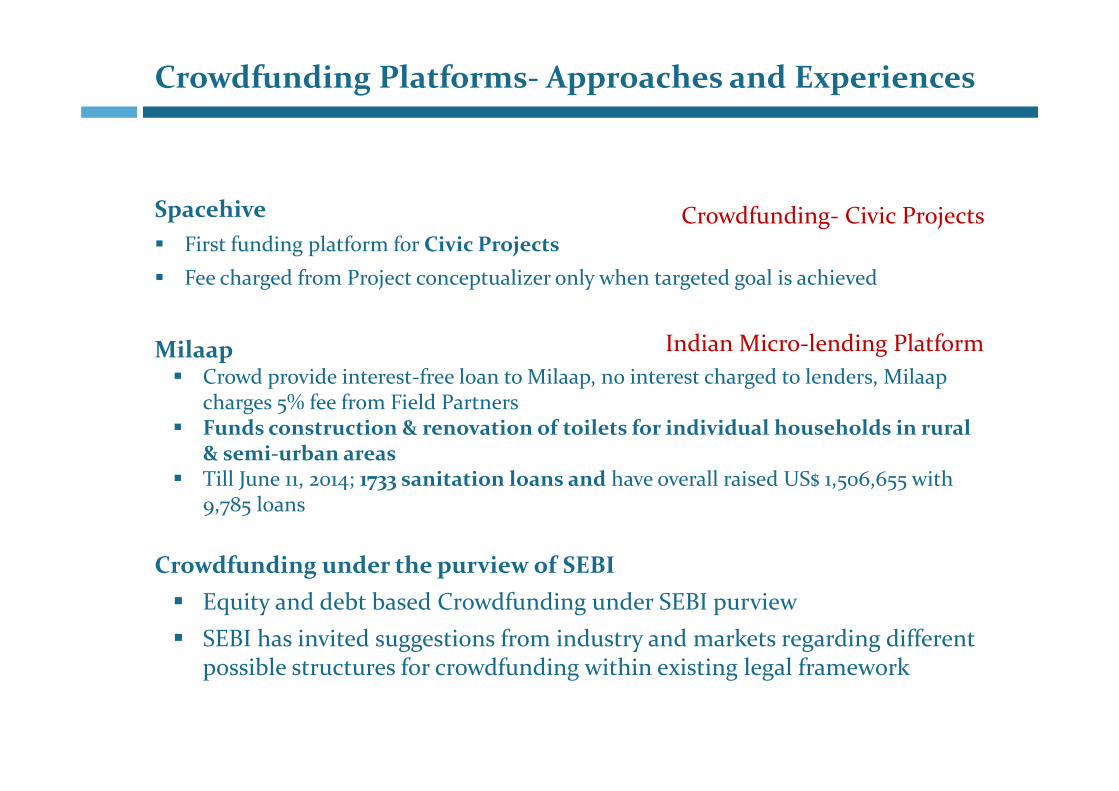
Crowdfunding Platforms‐ Approaches and Experiences
Spacehive Crowdfunding Civic ProjectsSpacehive First funding platform for Civic Projects Fee charged from Project conceptualizer only when targeted goal is achieved
Crowdfunding‐ Civic Projects
Milaap Crowd provide interest‐free loan to Milaap, no interest charged to lenders, Milaap
h % f f Fi ld P
Indian Micro‐lending Platform
charges 5% fee from Field Partners Funds construction & renovation of toilets for individual households in rural
& semi‐urban areas Till June 11, 2014; 1733 sanitation loans and have overall raised US$ 1,506,655 with Till June 11, 2014; 1733 sanitation loans and have overall raised US$ 1,506,655 with
9,785 loans
Crowdfunding under the purview of SEBIg p Equity and debt based Crowdfunding under SEBI purview SEBI has invited suggestions from industry and markets regarding different
possible structures for crowdfunding within existing legal frameworkpossible structures for crowdfunding within existing legal framework

Fund mechanisms to capture new sources
Possible structures at different levels
National /state ‐ Urban Sanitation Development Impact Fund (USDIF)p ( ) to mobilize debt funds for on‐lending at affordable costs to meet the support costs of potential lenders S d b CSR t/d f d i l b k Sourced by CSR, government/donor funds, commercial banks
through PSL
State / City sanitation fund (CSF) to meet support costs for city governments
id i l b id h h ld to provide partial subsidy to households Sourced by CSR, local benefactors, government/donor funds

Summary recap – 1
Emerging national (and global) priority on sanitation and particularly on eliminating open defecationp y g p
High latent demand for ‘own toilets’ in urban areas, to facilitate hi d l k f i i fithis need to look for innovative finance Public funds are used to LEVERAGE additional resources To ensure that the new schemes are DEMAND led and not supply drivenpp y
It is necessary to evolve appropriate fund mechanisms to t d h l th t fi i tit ti capture and channel the new sources to finance institutions,
households and cities
For waste water management, the need is to focus on onsite sanitation systems. Build capacities of local governments to develop and manage PPP contracts to develop and manage PPP contracts
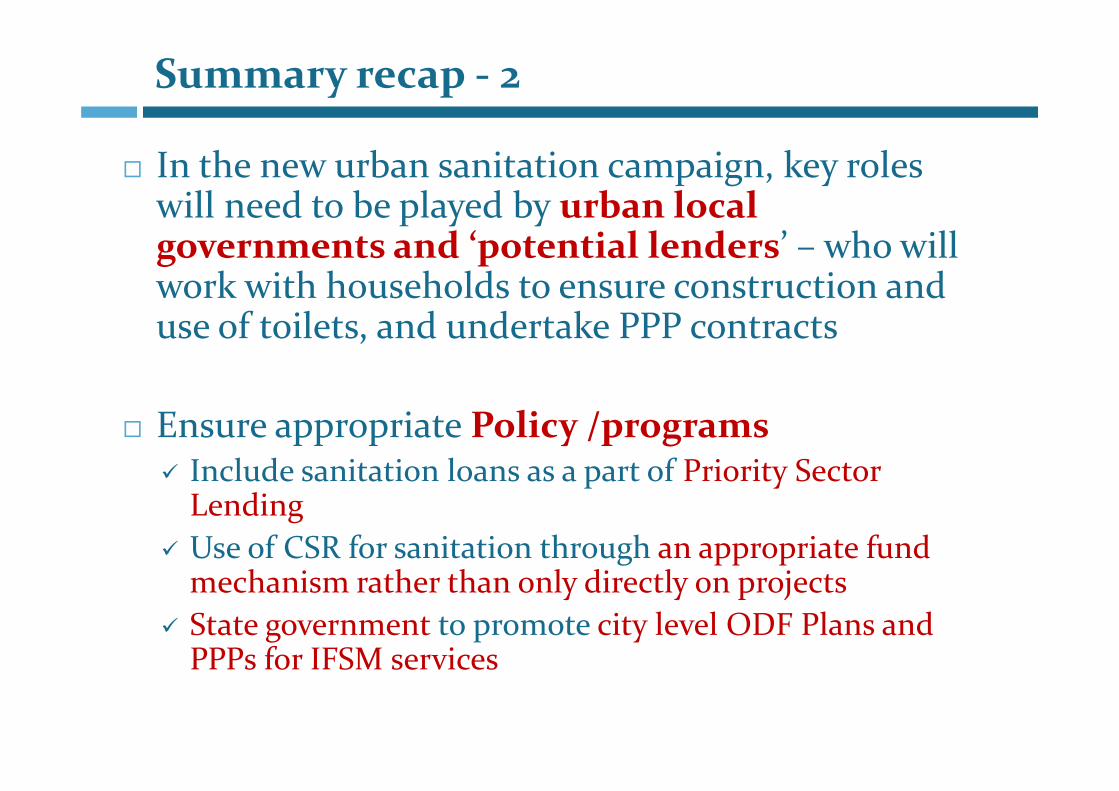
Summary recap ‐ 2
In the new urban sanitation campaign, key roles will need to be played by urban local will need to be played by urban local governments and ‘potential lenders’ – who will work with households to ensure construction and use of toilets, and undertake PPP contracts
Ensure appropriate Policy /programs Include sanitation loans as a part of Priority Sector p yLending
Use of CSR for sanitation through an appropriate fund h i th th l di tl j tmechanism rather than only directly on projects
State government to promote city level ODF Plans and PPPs for IFSM services PPPs for IFSM services
Thank you
www.pas.org.in
@pas_project
https://twitter.com/pas_project
PAS projecthttp://fb.com/pas.cept


![[Sanitation challenge #5] opinions!](https://img.pdfslide.net/doc/110x75/55a08c241a28ab81228b468c/sanitation-challenge-5-opinions.jpg)