Embed Size (px)
Citation preview

Addressing Two Critical Topics

Invest & Create
Ramp & Optimize
Expand
Invest & Create
Ramp & Optimize
Expand
Reinventing the Footwear Industry is Difficult to Put on a Timeline
NIKE and Flex are developing a new operating model• Flex is adapting its Platform capabilities for the footwear industry• NIKE is adapting to Design for Automation processes
Targeting profitability during 2H FY19• Automation-enabling growth • Productivity and yield improvement drive efficiency
Multi-billion dollar TAM opportunity; Flex and NIKE are committed partners• High growth• High margins

Mike McNamaraChief Executive Officer
The Power of the Platform

In the Age of Intelligence, Selling a Product is Not Enough . . .

Products Create Value Through Interconnected Systems

Traditional Industry Boundaries are DisappearingCompetencies in a single industry are no longer sufficient

Our Capabilities Across Industries are Unparalleled
Healthcare Automotive Industrial Home Appliances
Capital Equipment
Energy StorageTelecom
Enterprise Compute
AR/VRConnected Living
Mobile
Networking
Building and Construction
Apparel Lighting

Ford
Cisc
o
Joh
n D
ee
re
CG
Gro
up
J &
J
Ne
spre
sso
Wh
irlp
oo
l
In the Age of Intelligence, Cross-Industry Ecosystems are Necessary
Vertically deep, customers benefit from our horizontal breadth
Customers increasingly rely on Flex to provide a broad array of capabilities

Continuously Focused Investment for Over Five Years is Driving GrowthThe Flex Platform is our core competitive advantage
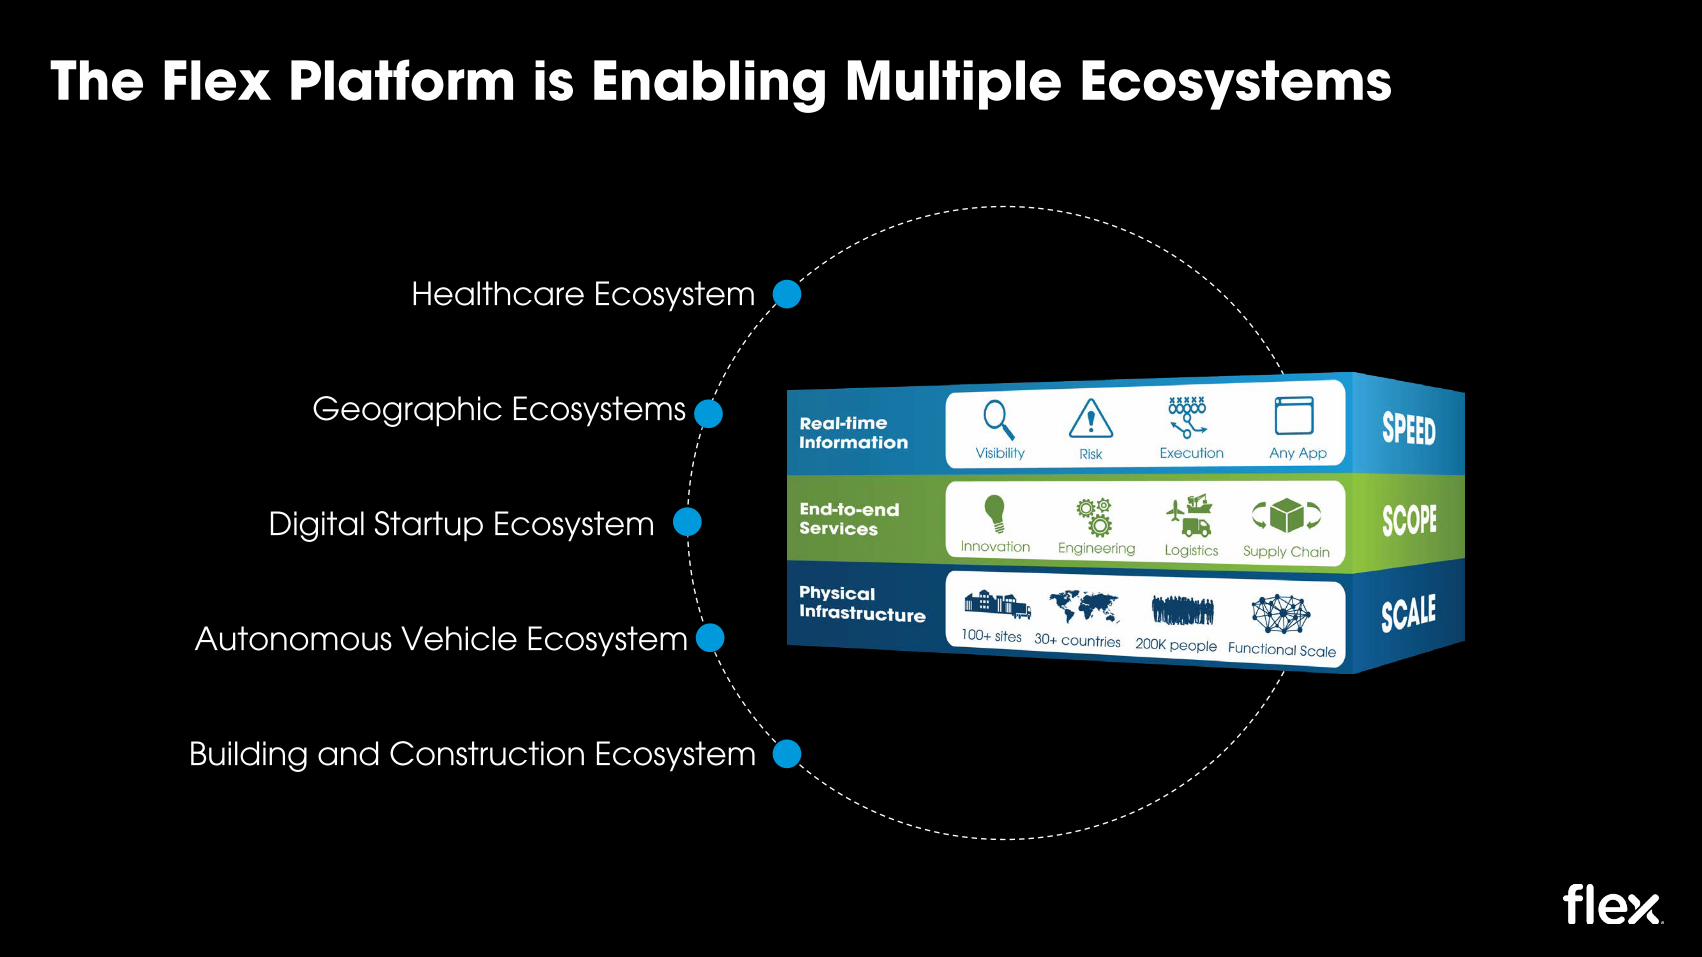
The Flex Platform is Enabling Multiple Ecosystems
Healthcare Ecosystem
Building and Construction Ecosystem
Autonomous Vehicle Ecosystem
Geographic Ecosystems
Digital Startup Ecosystem

Each Ecosystem Leverages Many Flex Capabilities
Healthcare Building andConstruction
AutonomousVehicles
Digital Health Software
Connected Home
Automation
FDA Facilities
Pharma Manufacturing
5G
Data Center Design
CEC Competencies
Automotive Grade
Manufacturing
YTWO Formative Software
Lighting
Solar
Energy Storage
Connected Home
Worldwide Footprint

Structural Drivers of Value Creation
Portfolio Evolution
Sketch-to-Scale®
Platform Enabled Opportunities

Portfolio Evolution Continues to be Extremely Successful
CEC24%
HRS3%IEI
12%
CTG61%
FY07
$19B
15%
CEC30%
HRS19%
IEI24%
CTG27%
FY18
$25B
43%
Revenue
CEC42%
HRS12%
IEI16%
CTG30% FY13
$24B
28%
The balanced portfolio drives free cash flow, stable earnings and drives future capabilities
Portfolio Evolution

3%
9%5%
18%
CEC CTG IEI HRS CEC CTG IEI HRS
FY 2013 FY 2020E
7%
17%
34%29%
34%
CEC CTG IEI HRSFY 2018
27%
~40%
Sketch-to-Scale Revenue Increases EngagementMore customers rely on us earlier in the product lifecycle
Sketch-to-Scale
25%-35%
35%-45%

The Platform Enables Multiple High-Value Opportunities
• Leverages Platform capabilities
• Generates revenue pull-through
• Creates high equity valuations
• Takes advantage of outside investor funding and know-how
• Attracts world-class talent into focused businesses
Platform Enabled
Opportunities
BrightInsight
Leveraging our core to drive upside

ChennaiBangalore
PuneMumbai
Gurgaon
Kolkata
Vizag
Hyderabad
The Platform Enables Flex to Capture New TAM in India
GDP per Capita1 Internet Penetration
$6,821
$16,660
$34,997
$3,574
$7,183
$16,421
2027E2007 2017
China
India
1) IMF, Internal Estimates
In 10 years, India’s per capita income will be the same as China’s last year.
4%
96%
2007
60%
34%
66%
2017
40%1.2
2021E
1.3 1.4
Billions of People
Leveraging our core for localization in one of the world’s fastest growing markets
• Manufacturing• Design• Global Business Services (GBS)• Flex Global Services (FGS)
Flex Footprint
Source: International Telecommunications Union, Jan 2018, Telecom Regulatory Authority on India, India Telecom Sector, 2017 and Cisco, VNI Complete Forecast, 2017

ChennaiBangalore
PuneMumbai
Gurgaon
Kolkata
Vizag
Hyderabad
The Platform Enables Flex to Capture New TAM in India
GDP per Capita1 Internet Penetration
$6,821
$16,660
$34,997
$3,574
$7,183
$16,421
2027E2007 2017
China
India
1) IMF, Internal Estimates
In 10 years, India’s per capita income will be the same as China’s last year.
4%
96%
2007
60%
34%
66%
2017
40%1.2
2021E
1.3 1.4
Billions of People
Leveraging our core for localization in one of the world’s fastest growing markets
• Manufacturing• Design• Global Business Services (GBS)• Flex Global Services (FGS)
Flex Footprint
India is the next China
Consumer demand will lead
Flex has the expertise
to succeed
Source: International Telecommunications Union, Jan 2018, Telecom Regulatory Authority on India, India Telecom Sector, 2017 and Cisco, VNI Complete Forecast, 2017
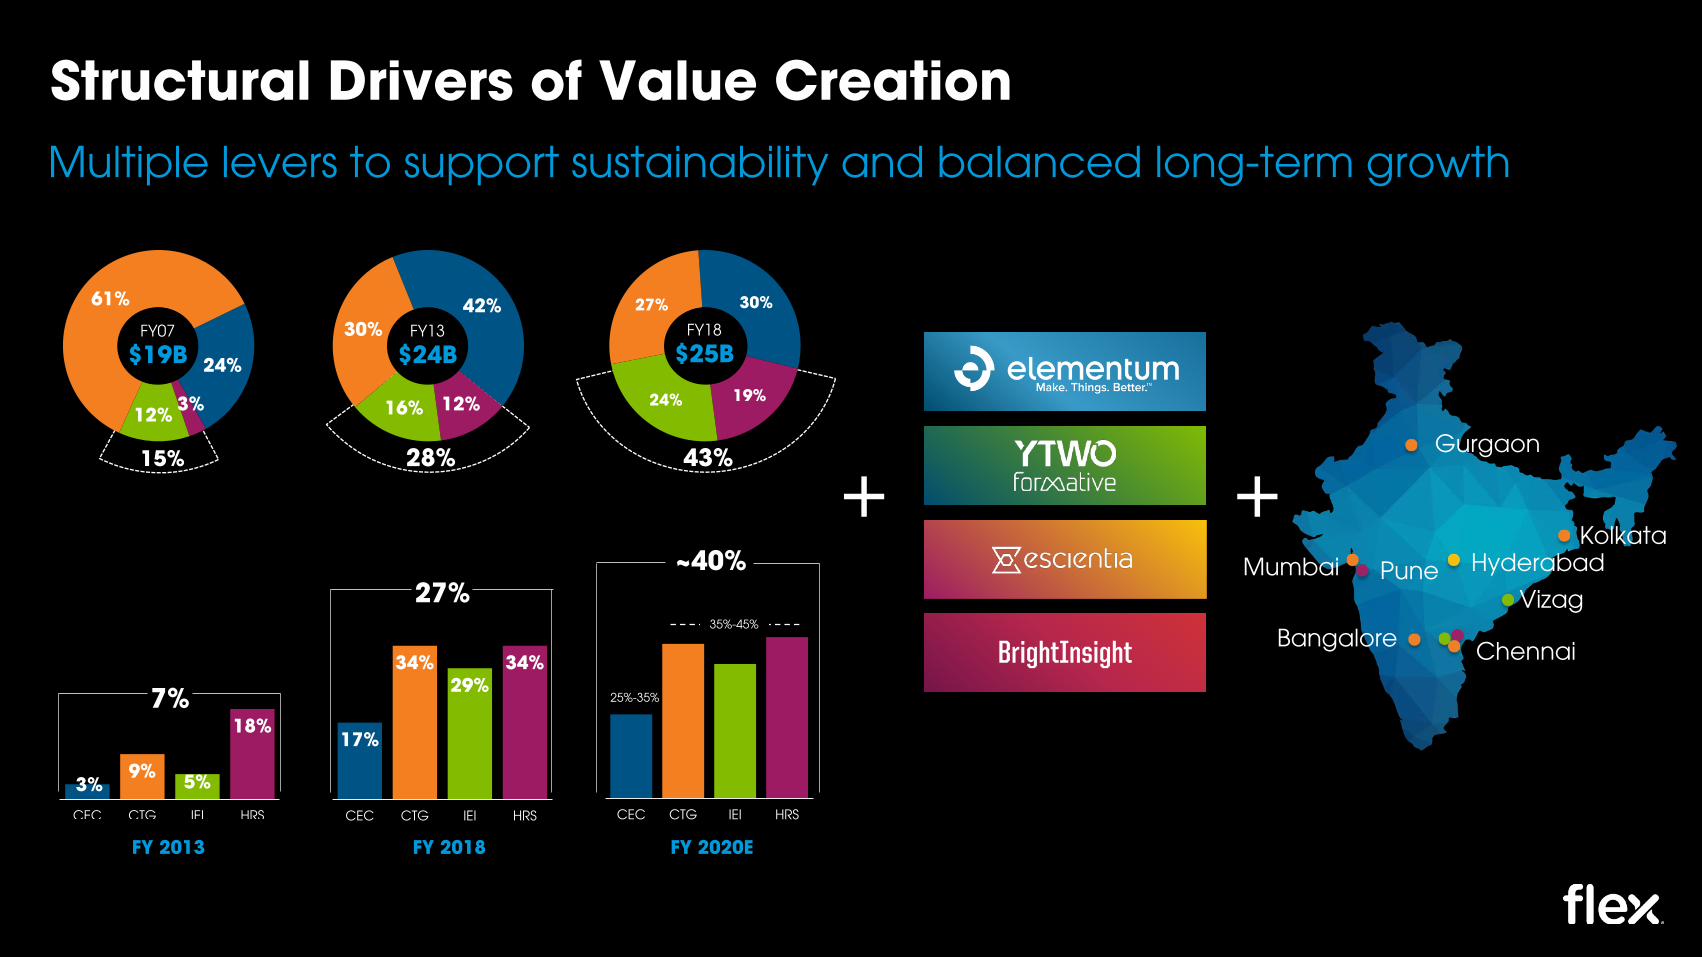
Structural Drivers of Value Creation
3%9% 5%
18%
CEC CTG IEI HRS
17%
34%29%
34%
CEC CTG IEI HRS CEC CTG IEI HRS
FY 2013 FY 2020EFY 2018
7%
27%~40%
+
24%
3%12%
61%
FY07
$19B
15%
30%
19%24%
27%FY18
$25B
43%
42%
12%16%
30% FY13
$24B
28%
25%-35%
35%-45%
BrightInsight ChennaiBangalore
PuneMumbai
Gurgaon
Kolkata
Vizag
Hyderabad
+
Multiple levers to support sustainability and balanced long-term growth

In the Age of Intelligence, the Flex Platform is Highly Differentiated
Expansiveset of
capabilitiesdrive organic
growth
Balancedparticipation in industries andecosystems
drives stability
Leveraged platform-enabled
investmentscreate upside

Snapshot of What will be Shared Today
CEC• Flat revenue FY19
• Return to growth
• Stable to improving margins
HRS• Outstanding
bookings
• Moderate revenue growth in 2019
• Average 10% growth over the next few years
• High margin stability
IEI• Continued 10%+
revenue growth
• Another year of margin expansion
• Diversified portfolio
CTG• Rapid growth
• Increasing margins/OP
• Significant mix shift
• NIKE recoverysecond half
• No change to margin targets
We are expecting accelerated organic growth

Snapshot of What You will Hear TodayInvestments in 1H FY19 expected to yield 2H Margin/OP expansion
2H FY19• Margin expansion
• OP expansion
• Higher leverage in SG&A
1H FY19• Investment in capex and working capital
• Ramping 25,000 people this year
• Elevated start-up costs
• Repositioned organization to be a simpler, more effective operating model