Embed Size (px)
Citation preview
Adequate Yearly Progress 2012Comfort ISD
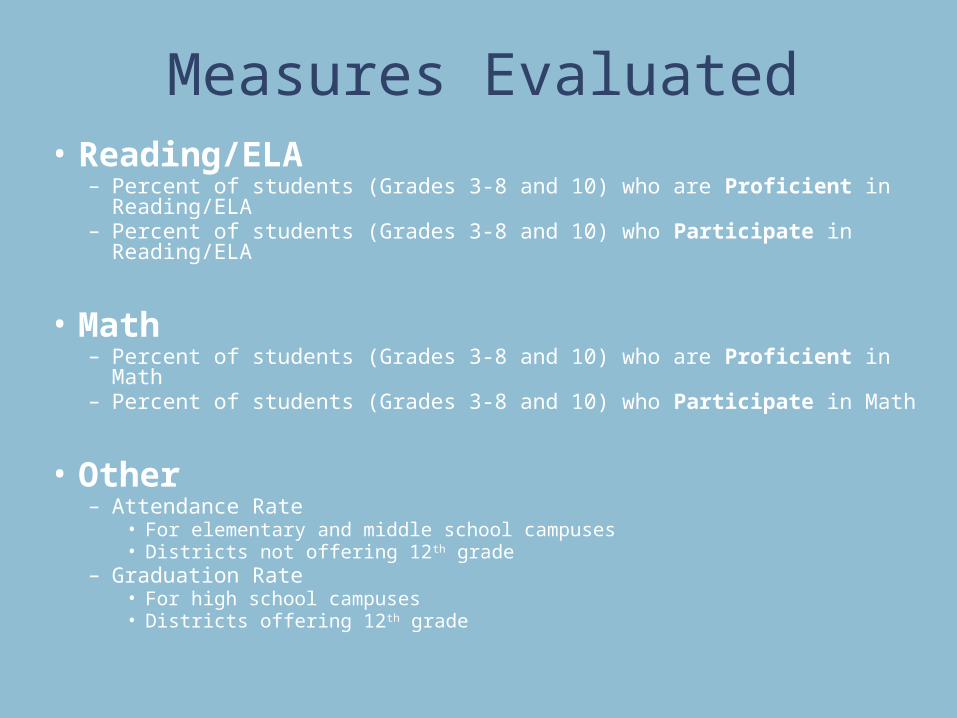
Measures Evaluated• Reading/ELA
– Percent of students (Grades 3-8 and 10) who are Proficient in Reading/ELA
– Percent of students (Grades 3-8 and 10) who Participate in Reading/ELA
• Math– Percent of students (Grades 3-8 and 10) who are Proficient in Math– Percent of students (Grades 3-8 and 10) who Participate in Math
• Other– Attendance Rate
• For elementary and middle school campuses• Districts not offering 12th grade
– Graduation Rate• For high school campuses• Districts offering 12th grade
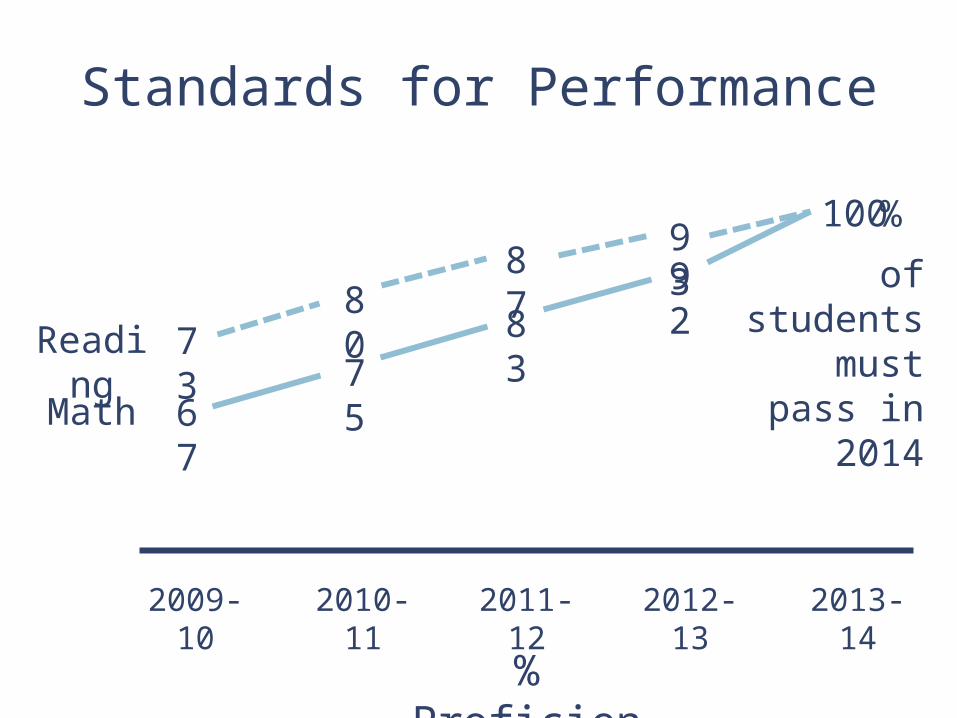
Standards for Performance
2011-12 2012-13 2013-142010-112009-10
6775
8392
100
% Proficient
Math
7380
8793
Reading
%
of students must pass
in 2014
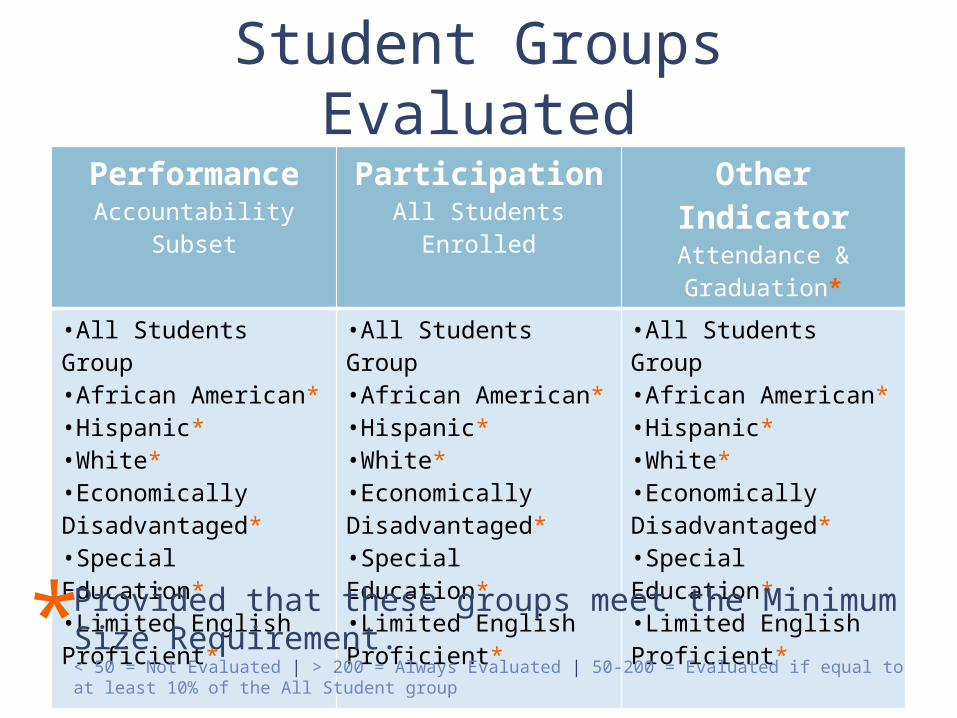
Student Groups EvaluatedPerformance
Accountability SubsetParticipation
All Students EnrolledOther Indicator
Attendance & Graduation*
•All Students Group•African American*•Hispanic*•White*•Economically Disadvantaged*•Special Education*•Limited English Proficient*
•All Students Group•African American*•Hispanic*•White*•Economically Disadvantaged*•Special Education*•Limited English Proficient*
•All Students Group•African American*•Hispanic*•White*•Economically Disadvantaged*•Special Education*•Limited English Proficient*
Provided that these groups meet the Minimum Size Requirement. < 50 = Not Evaluated | > 200 = Always Evaluated | 50-200 = Evaluated if equal to at least 10% of the All Student group*
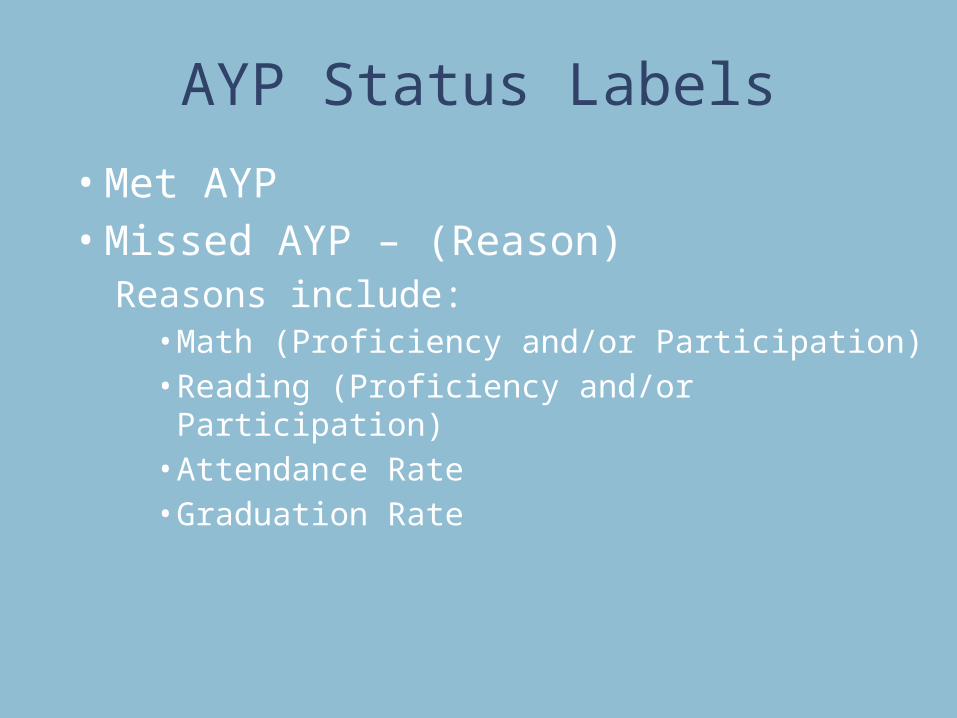
AYP Status Labels
• Met AYP• Missed AYP – (Reason)
Reasons include:• Math (Proficiency and/or Participation)• Reading (Proficiency and/or Participation)• Attendance Rate• Graduation Rate
23
1
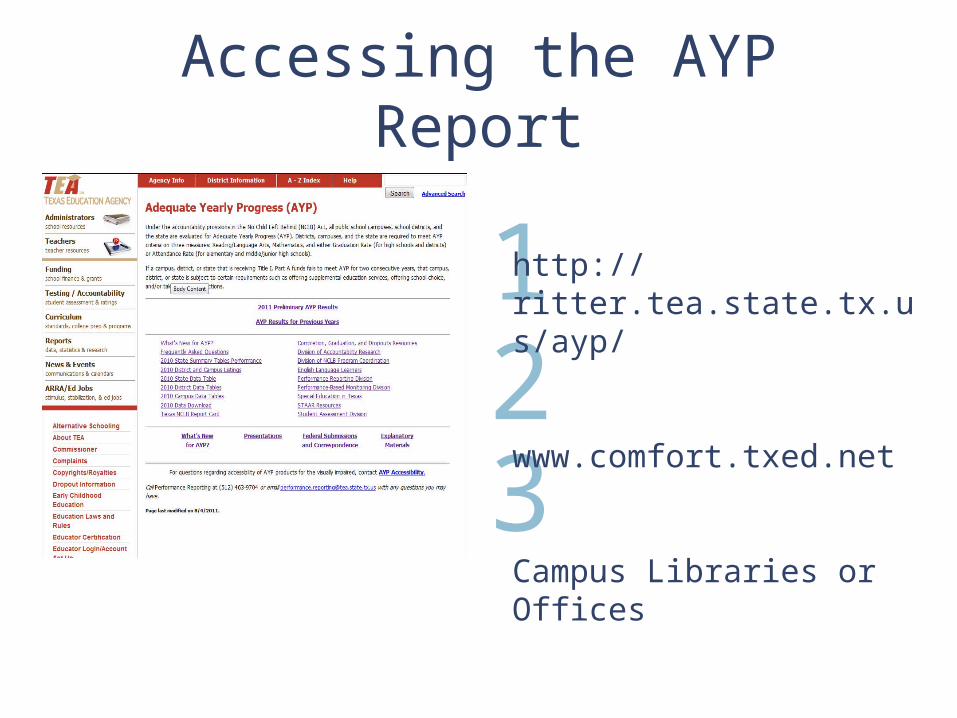
Accessing the AYP Report
http://ritter.tea.state.tx.us/ayp/
www.comfort.txed.net
Campus Libraries or Offices
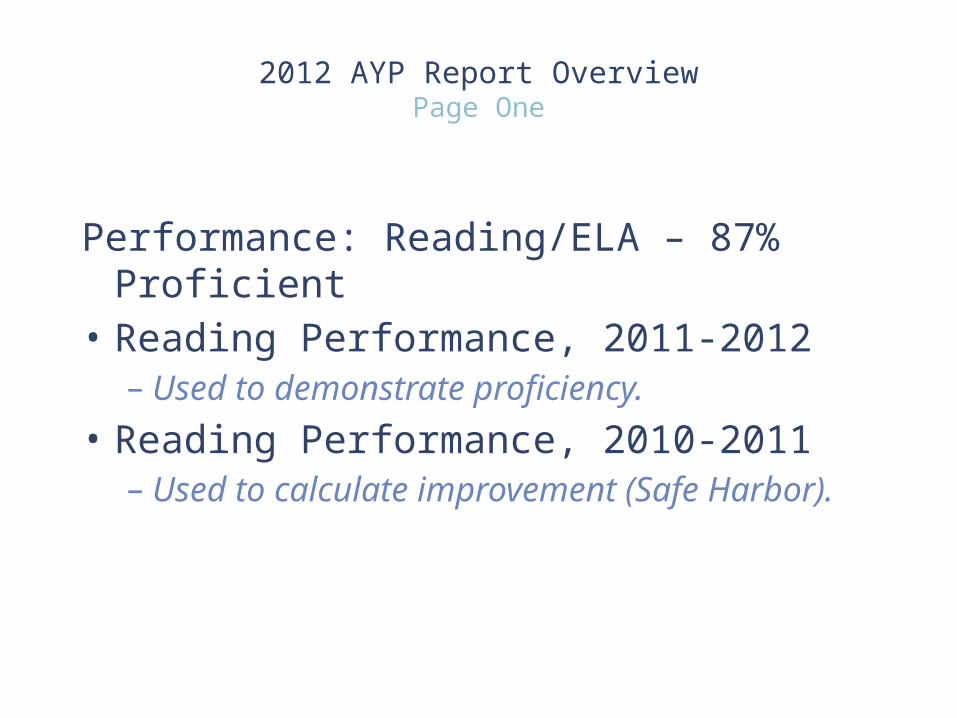
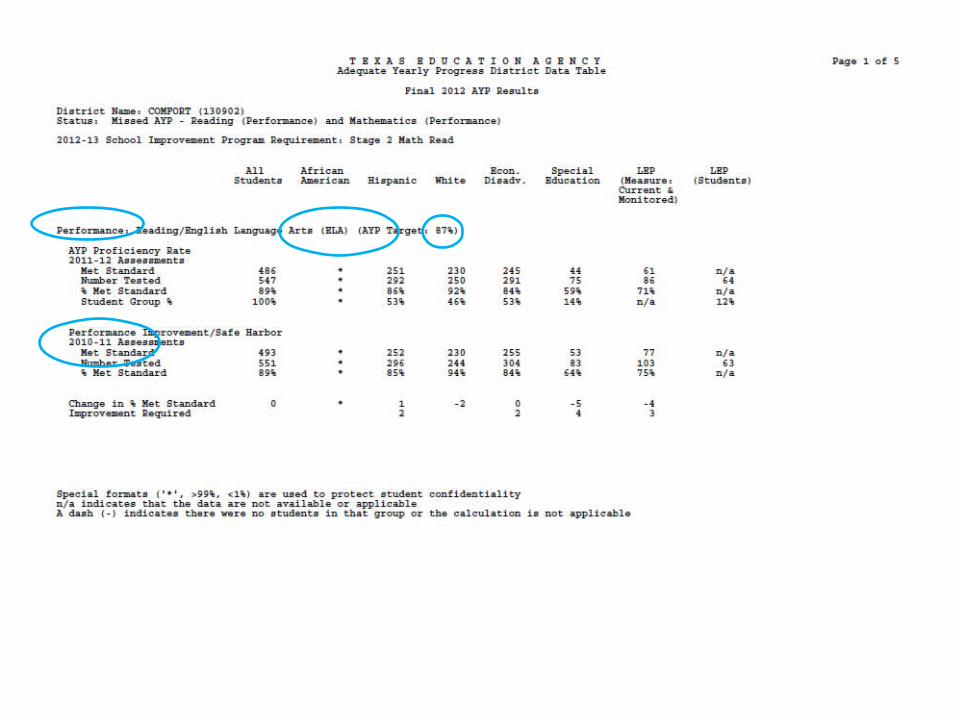
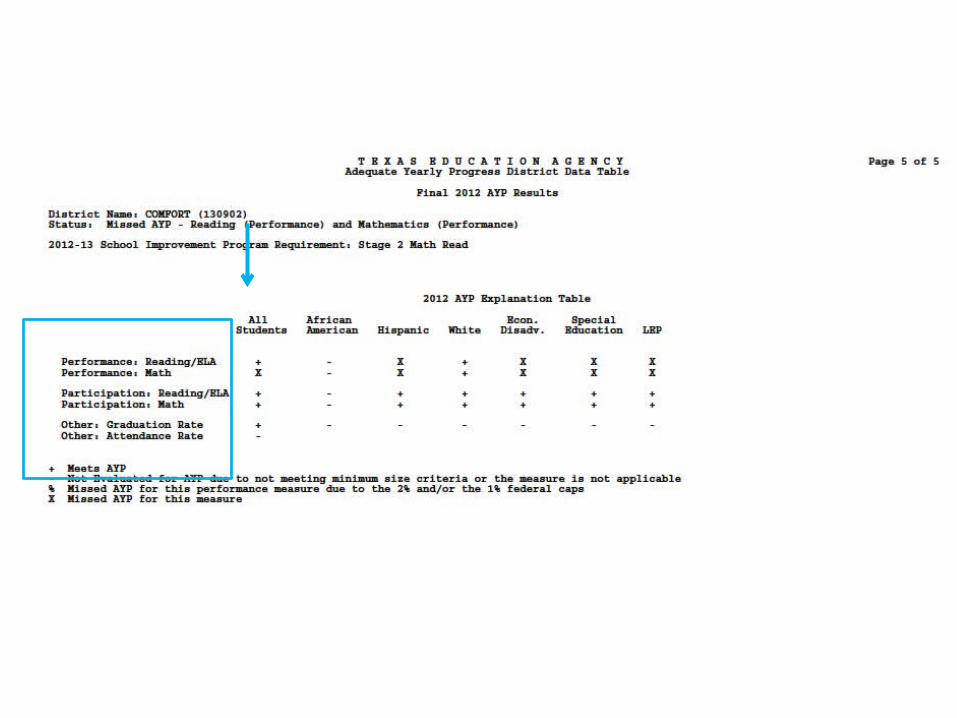
2012 AYP Report OverviewPage One
Performance: Reading/ELA – 87% Proficient• Reading Performance, 2011-2012– Used to demonstrate proficiency.
• Reading Performance, 2010-2011 – Used to calculate improvement (Safe Harbor).
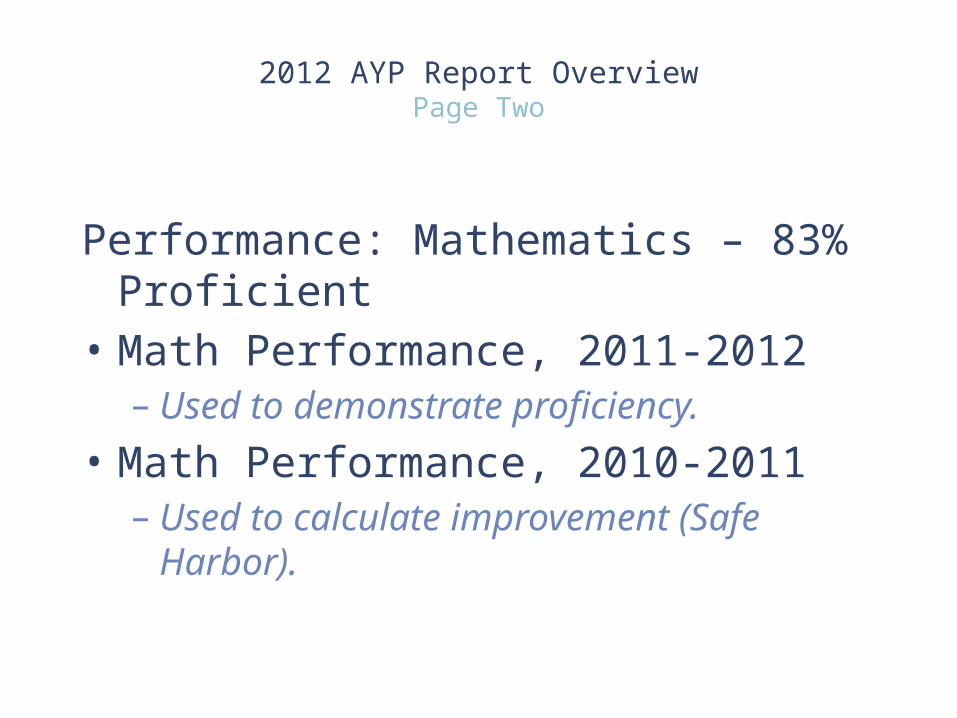
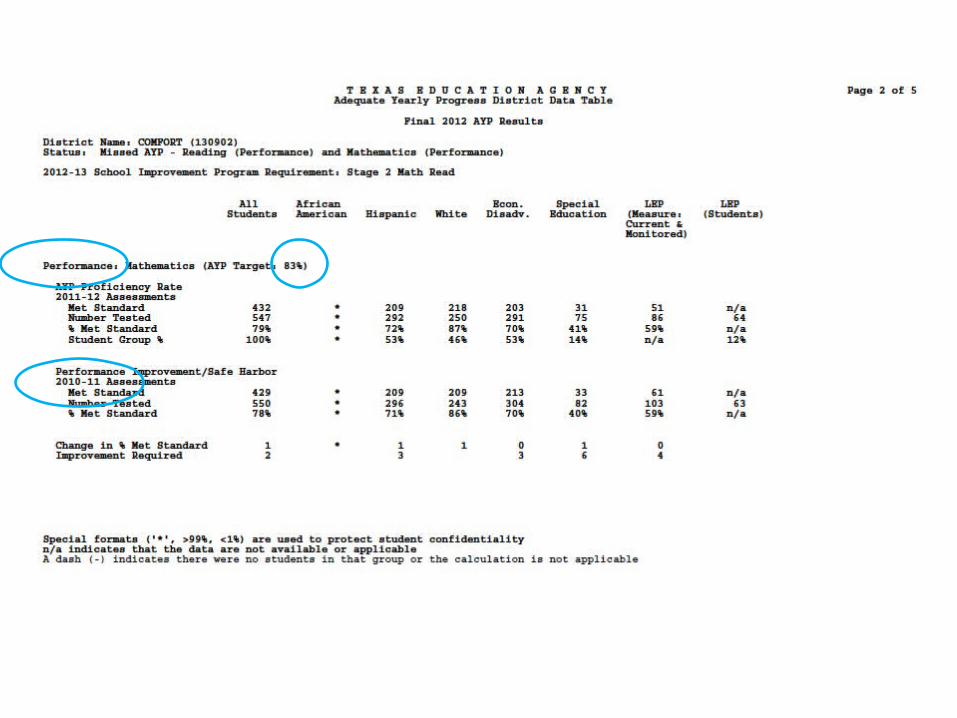
Performance: Mathematics – 83% Proficient• Math Performance, 2011-2012– Used to demonstrate proficiency.
• Math Performance, 2010-2011 – Used to calculate improvement (Safe Harbor).
2012 AYP Report OverviewPage Two
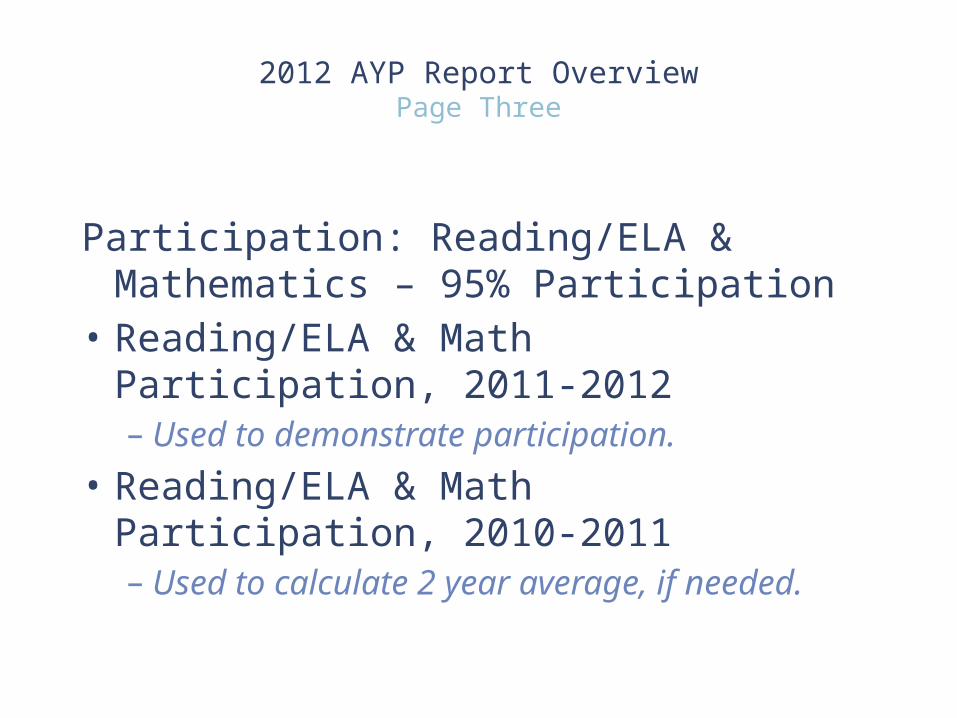
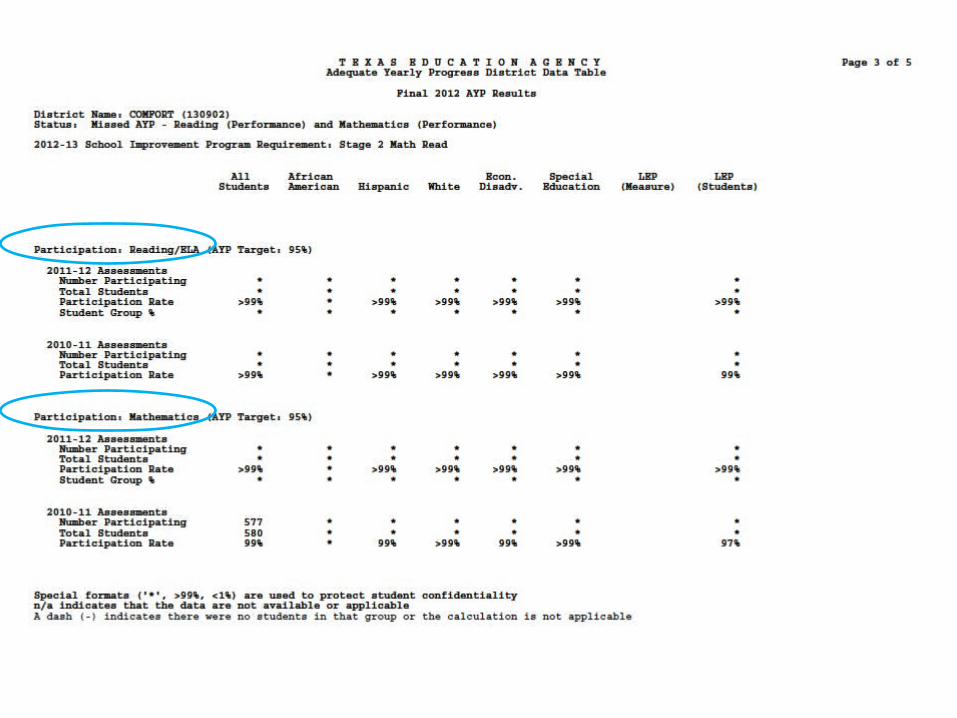
Participation: Reading/ELA & Mathematics – 95% Participation
• Reading/ELA & Math Participation, 2011-2012– Used to demonstrate participation.
• Reading/ELA & Math Participation, 2010-2011– Used to calculate 2 year average, if needed.
2012 AYP Report OverviewPage Three
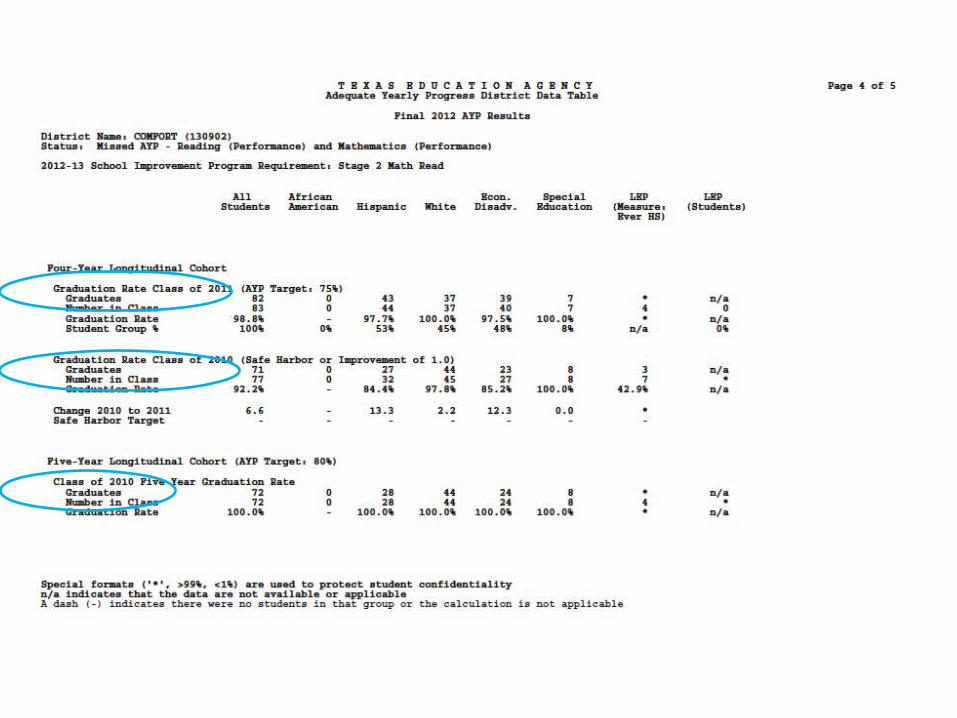
Graduation Rate (75%) or Attendance Rate (90%)• Graduation or Attendance Rate, 2011-2012– Used to calculate whether or not the campus or
district met the target rate.• Graduation or Attendance Rate, 2010-2011– Used to demonstrate improvement.
• 5 Year Longitudinal Graduation Rate, 2011-2012– Class of 2010
2012 AYP Report OverviewPage Four
AYP Explanation Table• Summarizes the results of the AYP report
2012 AYP Report OverviewPage Five
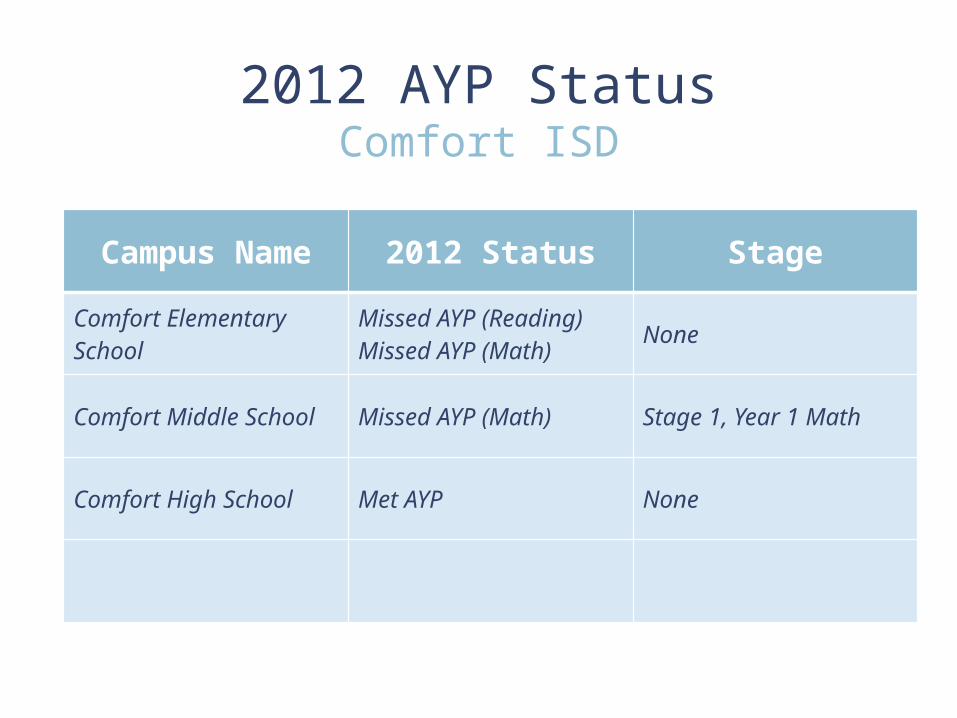
2012 AYP StatusComfort ISD
Campus Name 2012 Status Stage
Comfort Elementary School Missed AYP (Reading)Missed AYP (Math) None
Comfort Middle School Missed AYP (Math) Stage 1, Year 1 Math
Comfort High School Met AYP None
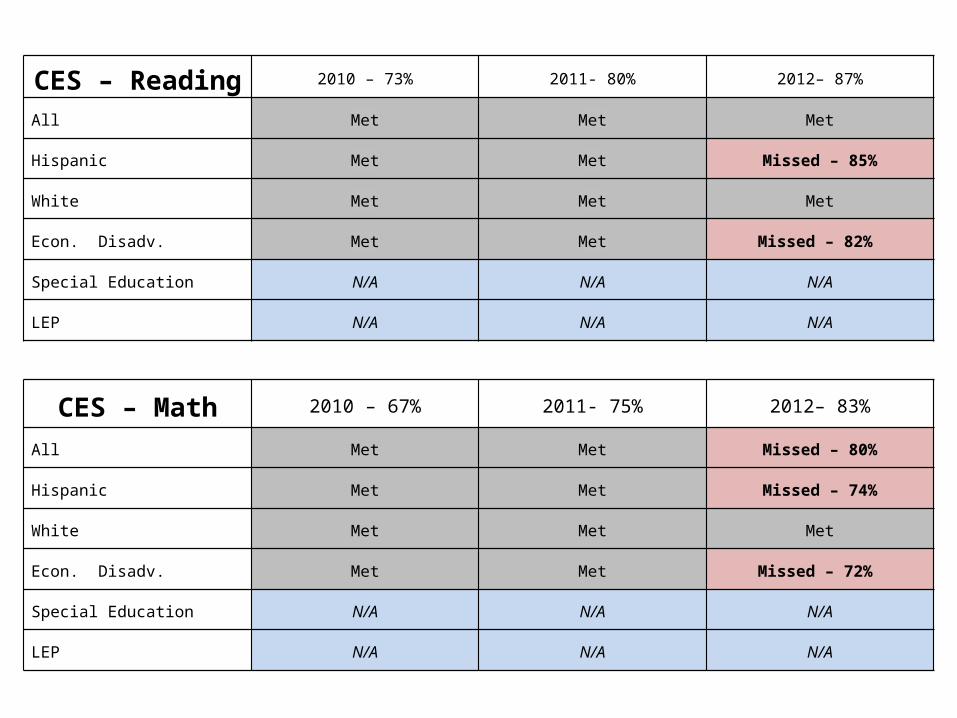
CES – Reading 2010 – 73% 2011- 80% 2012– 87%
All Met Met Met
Hispanic Met Met Missed – 85%
White Met Met Met
Econ. Disadv. Met Met Missed – 82%
Special Education N/A N/A N/A
LEP N/A N/A N/A
CES – Math 2010 – 67% 2011- 75% 2012– 83%
All Met Met Missed – 80%
Hispanic Met Met Missed – 74%
White Met Met Met
Econ. Disadv. Met Met Missed – 72%
Special Education N/A N/A N/A
LEP N/A N/A N/A
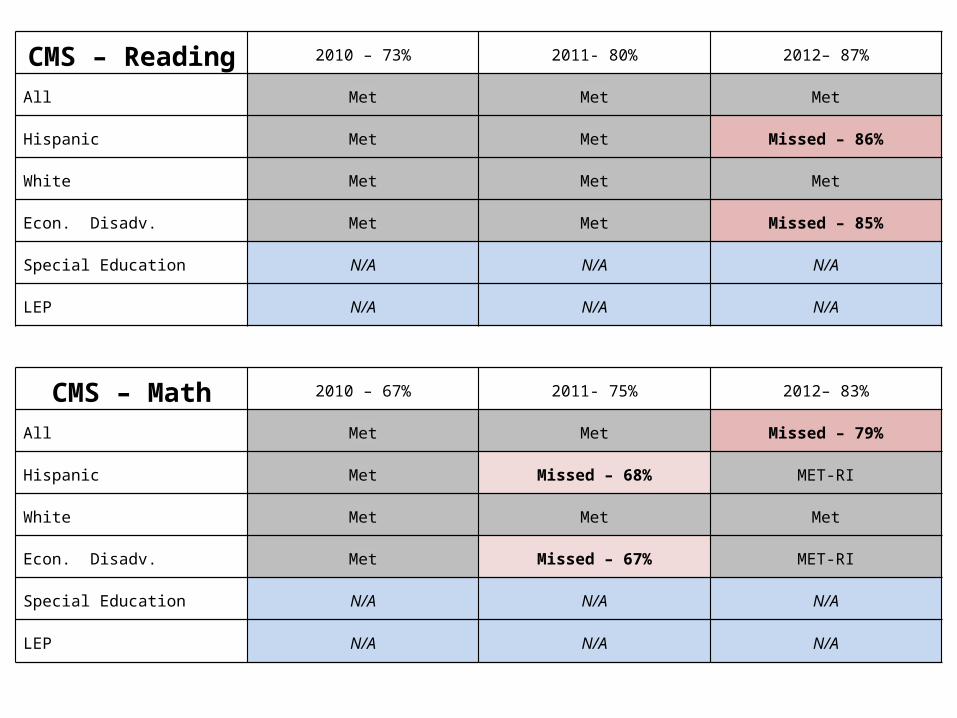
CMS – Reading 2010 – 73% 2011- 80% 2012– 87%
All Met Met Met
Hispanic Met Met Missed – 86%
White Met Met Met
Econ. Disadv. Met Met Missed – 85%
Special Education N/A N/A N/A
LEP N/A N/A N/A
CMS – Math 2010 – 67% 2011- 75% 2012– 83%
All Met Met Missed – 79%
Hispanic Met Missed – 68% MET-RI
White Met Met Met
Econ. Disadv. Met Missed – 67% MET-RI
Special Education N/A N/A N/A
LEP N/A N/A N/A
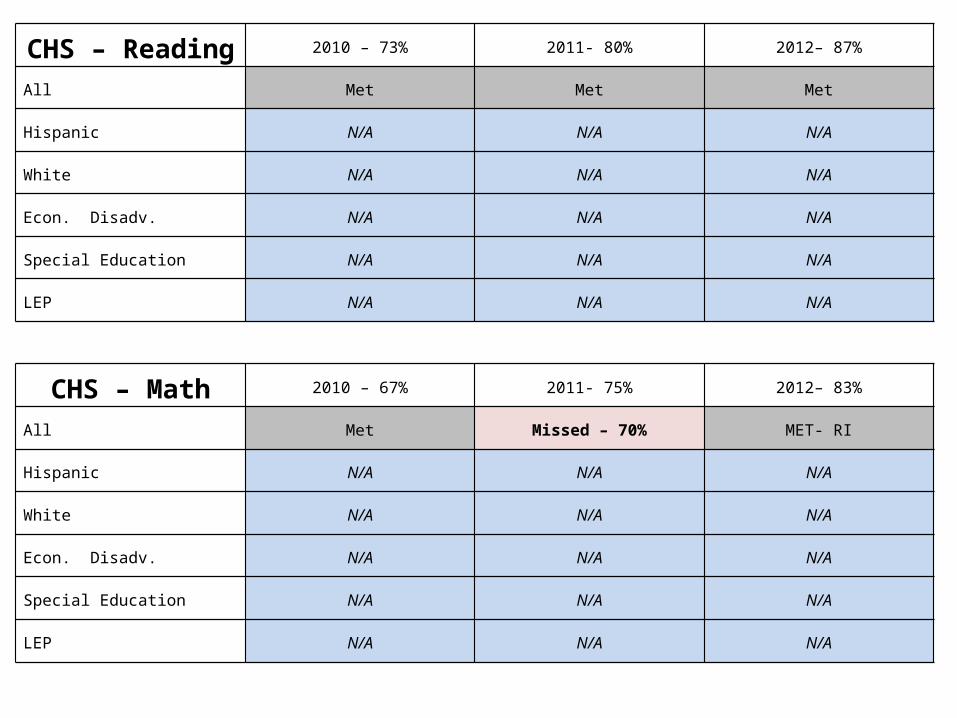
CHS – Reading 2010 – 73% 2011- 80% 2012– 87%
All Met Met Met
Hispanic N/A N/A N/A
White N/A N/A N/A
Econ. Disadv. N/A N/A N/A
Special Education N/A N/A N/A
LEP N/A N/A N/A
CHS – Math 2010 – 67% 2011- 75% 2012– 83%
All Met Missed – 70% MET- RI
Hispanic N/A N/A N/A
White N/A N/A N/A
Econ. Disadv. N/A N/A N/A
Special Education N/A N/A N/A
LEP N/A N/A N/A
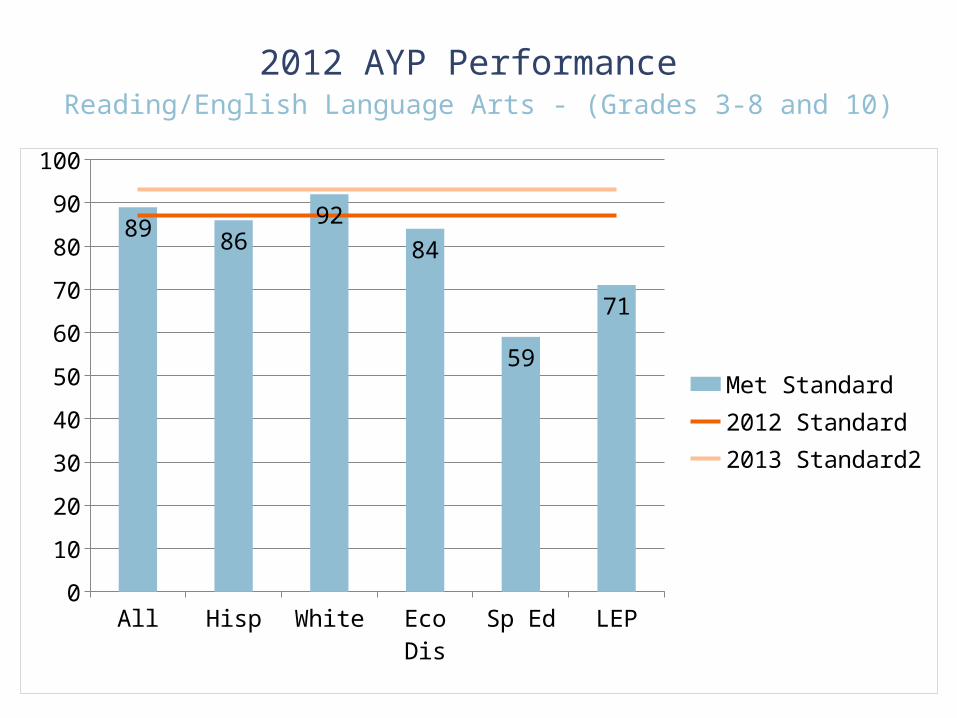
2012 AYP Performance Reading/English Language Arts - (Grades 3-8 and 10)
All Hisp White Eco Dis Sp Ed LEP0
10
20
30
40
50
60
70
80
90
100
89 8692
84
59
71
Met Standard2012 Standard2013 Standard2
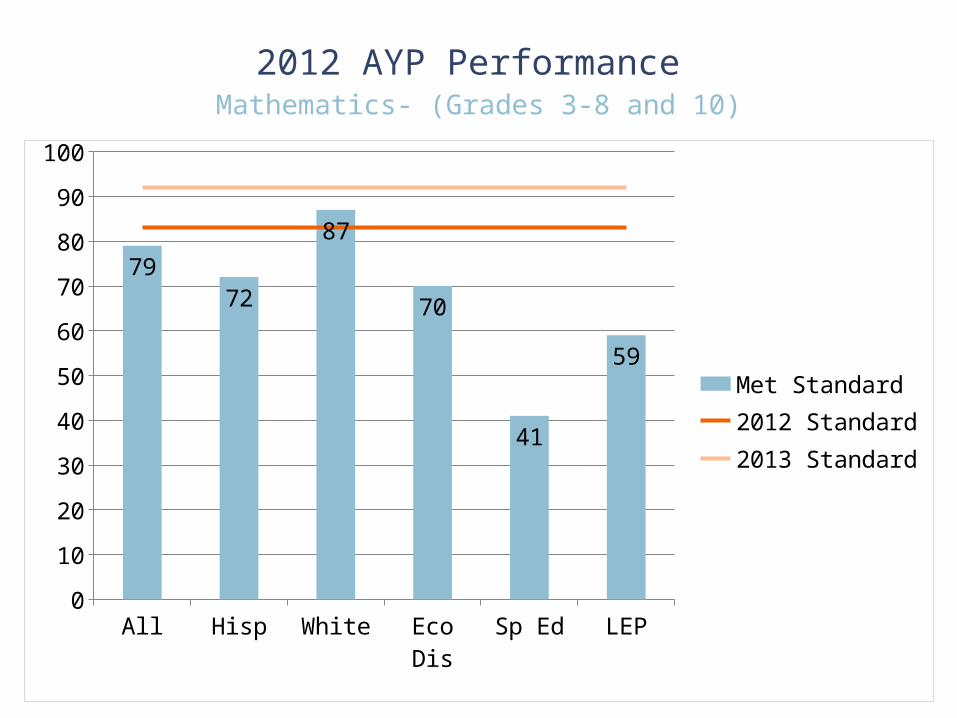
2012 AYP Performance Mathematics- (Grades 3-8 and 10)
All Hisp White Eco Dis Sp Ed LEP0
10
20
30
40
50
60
70
80
90
100
7972
87
70
41
59 Met Standard2012 Standard2013 Standard
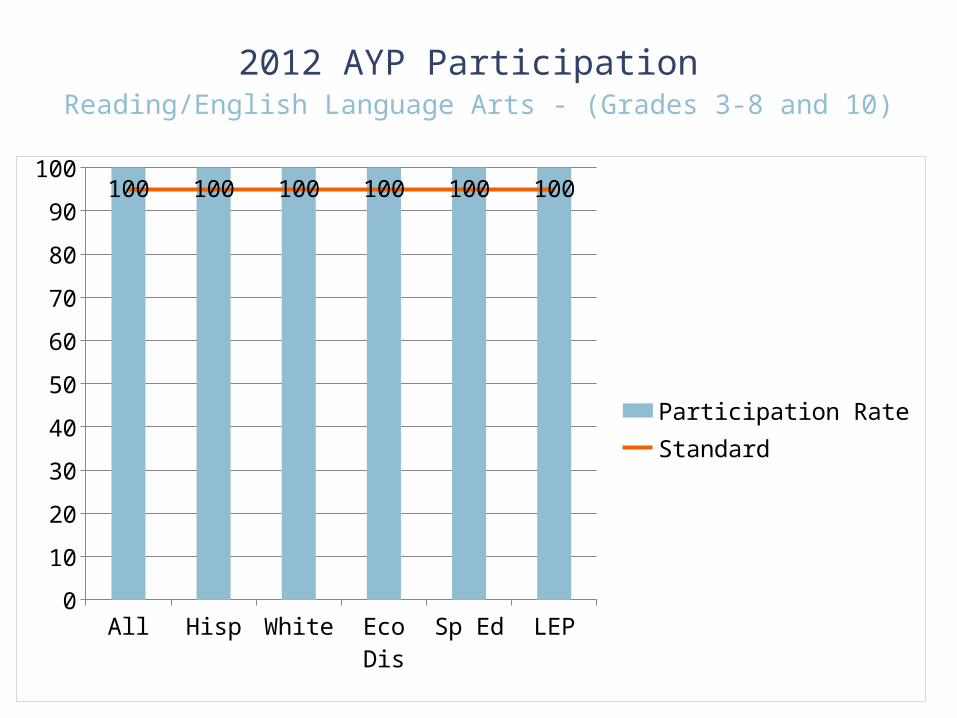
2012 AYP Participation Reading/English Language Arts - (Grades 3-8 and 10)
All Hisp White Eco Dis Sp Ed LEP0
10
20
30
40
50
60
70
80
90
100100 100 100 100 100 100
Participation RateStandard
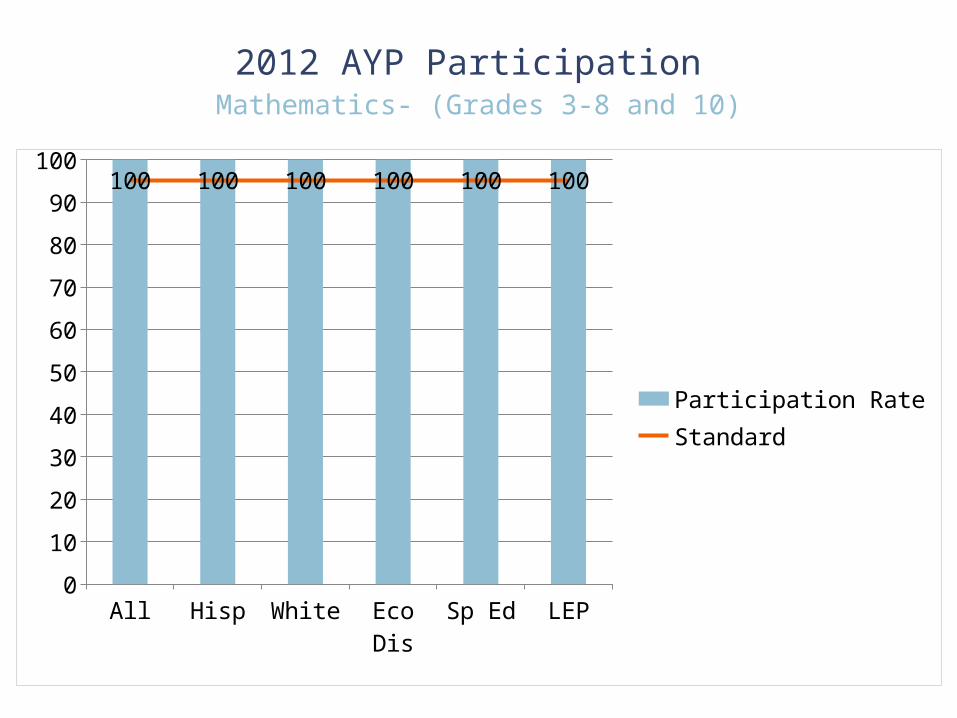
2012 AYP Participation Mathematics- (Grades 3-8 and 10)
All Hisp White Eco Dis Sp Ed LEP0
10
20
30
40
50
60
70
80
90
100100 100 100 100 100 100
Participation RateStandard
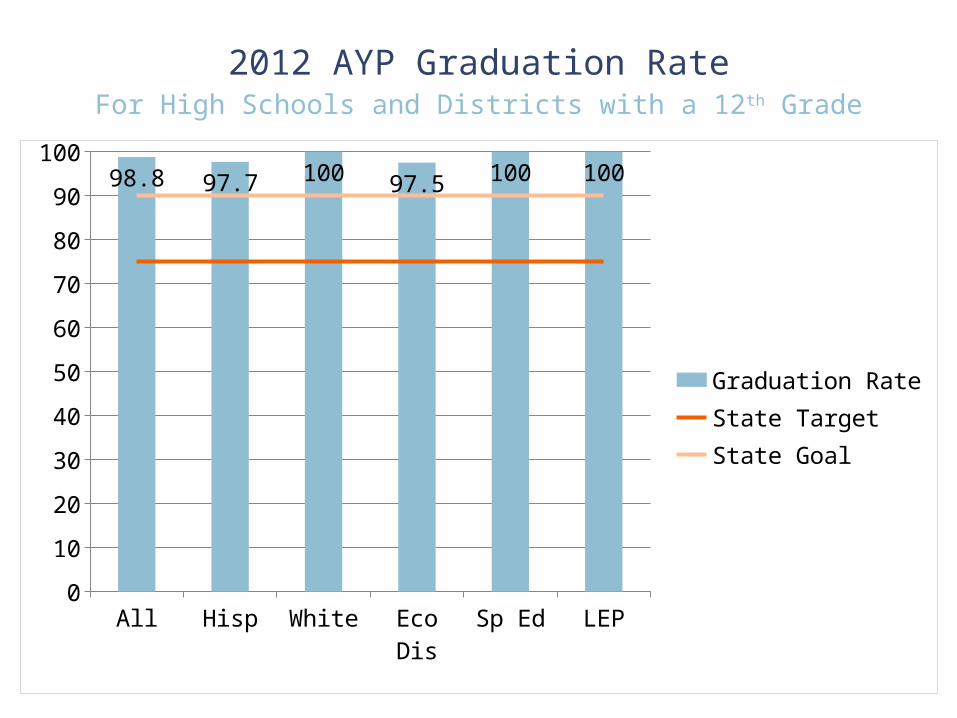
2012 AYP Graduation RateFor High Schools and Districts with a 12th Grade
All Hisp White Eco Dis Sp Ed LEP0
10
20
30
40
50
60
70
80
90
10098.8 97.7 100 97.5 100 100
Graduation RateState TargetState Goal