Embed Size (px)
Citation preview
8/8/2019 AdEx 2009 - European online advertising expenditure
http://slidepdf.com/reader/full/adex-2009-european-online-advertising-expenditure 1/41
AdEx 2009European onlineadvertisingexpenditure
Published September 2010
8/8/2019 AdEx 2009 - European online advertising expenditure
http://slidepdf.com/reader/full/adex-2009-european-online-advertising-expenditure 2/41
Introduction 3About this report 4
Executive summary 5
Europe and the US 6
23 European markets in perspective 7
Europe retrospective 8
Update on ‘10 before 10’ 10
Search top of the formats in 2009 11
Search 12
Classifieds 15
Display 17
Regional and country detail
Western Europe 20
Central and Eastern Europe 23
Forecasting the European advertising market in 2009-2010 25
2010-2011 Forecast 25
Online TV advertising 27
Mobile advertising 29
Top 10 properties December 2009 30
Top 10 ad publisher sites by ad impressions 32
Internet penetration in Europe 34
Appendix i – Definition of formats 36
Appendix ii – Participating IABs 37
Appendix iii – Methodology and adjusted data 38
Appendix iv – Estimates and adjustments 39
Appendix v – Our research partners 40Special thanks 41
Contents
IAB Europe AdEX 2009Published September 2010© IAB Europe
8/8/2019 AdEx 2009 - European online advertising expenditure
http://slidepdf.com/reader/full/adex-2009-european-online-advertising-expenditure 3/41
Introduction
One thing the digital advertising industry cannot be accused of iscomplacency: we devote a great deal of time, energy and money tocontinually challenging ourselves. As a young industry in a rapidlymoving environment, IAB Europe’s members know that if we don’tadapt, we won’t survive. This year’s AdEx Europe Benchmark reportshows that our self-examination is paying off: in extremely difficulteconomic times Europe’s online advertising market has continued togrow and - what’s more - it was the only advertising format thatdidn’t go backwards in 2009. The internet share of the totaladvertising market approached 20%, almost doubling its slice of the
market over two years.
Search advertising once again led the field recording a 10.8%increase on a like-for-like basis, a slowdown from the previous yearbut a notable achievement nonetheless. Display advertising was flatand even down in most mature markets. We took brand advertisingas our theme for this year’s Interact Congress in Barcelona,recognising the need to reinforce the message that brand advertisingoffers unique scope in creativity, innovation and engagement and it iscapable of delivering the enhanced measurement standards
advertisers seek to justify more investment in campaigns. Pressureon budgets had kept them relying on tried and tested formats, butthe good news is that display is already sprouting the green shoots ofrecovery in the first quarter of 2010. Video on digital platformscombined with social media is capable of delivering reach andefficiency measures to challenge any traditional media.
Growth in the most mature online ad markets UK, France, Germany,Netherlands, Spain and Italy - slowed to single digit rates, thoughSpain and Italy grew more as they started from a lower base. Growth
in Spain was remarkable when compared to the collapse of itstraditional advertising market at –23%. Only four markets posteddouble-digit growth in 2009: Greece, Austria, Poland and Turkeyagain starting from low bases.
Our reach this year has expanded with Russia, Switzerland, Bulgariaand Slovakia joining the AdEx Europe Benchmark – we welcome themwholeheartedly as members and celebrate the fresh perspectiveseach one brings to the report. In addition, we received figures fromIreland - one of our newest IABs - once the AdEx research had been
produced and released in June. We’re pleased to provide some Irishfigures in this report, but you won’t see the numbers in the totalfigures for 2010.
Alain HeureuxIAB Europe Presidentand CEO
My thanks to Catherine Borrel of IAB Europe and Vincent Létang Daniel Knapp of Screen Digest for presenting so clearly the data ananalysis of research covering 23 markets ranging from the maturemarkets of the Nordic nations and Western Europe to the emergingmarkets in Eastern and Southern Europe. In addition to auditing theAdEx data, Screen Digest’s analysts have provided some forwardlooking commentary and data that we hope you’ll find useful. I woalso like to thank our members InSites Consulting, comScore andNielsen Online for providing us with additional data for this report
As the fourth issue of this report, IAB Europe is proud toacknowledge that our annual report has become essential reading foeveryone connected to the digital advertising industry in marketsthroughout the world. We hope that once again you will find the dainsight and forecasts in this report useful for your business.
We look forward to the next chapter!
Regards
Alain Heureux
3IAB Europe AdEX 2009Published September 2010© IAB Europe
8/8/2019 AdEx 2009 - European online advertising expenditure
http://slidepdf.com/reader/full/adex-2009-european-online-advertising-expenditure 4/41
The sources of the online advertising spend data contained withinthis report are the annual industry benchmarking studies run by eacnational Interactive Advertising Bureau (IAB) in Europe. The natiobenchmarking studies represent the income of thousands of websiteand online advertising businesses.
The results reported are considered the closest measurement ofonline advertising revenues across Europe as the data is compileddirectly by local IABs based on information supplied by companiesselling advertising online. Only IABs that were able to provide 12
months of advertising expenditure data are included.
The data for this report is stated on the basis of actual gross incom(the monies actually paid by the advertiser, including any agencycommission). The report incorporated data from the following fouronline advertising sectors:
w Display advertisingw Search (pay per click fees)w Classifieds & Directoriesw Other
IAB Europe in partnership with Screen Digest collates and aggregathe data and makes the adjustments necessary to enable the data to bcomparable. More details of this process are provided in the Append
The result is comparable data based on actual revenues from acrossEurope. This is the fourth edition of the report, and therefore onceagain we are able to include year-on-year comparisons in the reportfor those countries that have participated for at least two years.
Screen Digest does not audit the information or the data from localIABs and provides no opinion or other form of assurance with respto the information. Only aggregate results are published andindividual company information is held in strict confidence by theaudit partners of local IAB studies.
The figures featured in this report include data from 23 IABs. Inaddition we have figures for the Irish market detailed in theAppendix, however these were not published in time to be included
the main report
4
About this report
IAB Europe AdEX 2009Published September 2010© IAB Europe
8/8/2019 AdEx 2009 - European online advertising expenditure
http://slidepdf.com/reader/full/adex-2009-european-online-advertising-expenditure 5/41
8/8/2019 AdEx 2009 - European online advertising expenditure
http://slidepdf.com/reader/full/adex-2009-european-online-advertising-expenditure 6/41
EuropeUSA
Total online ad spend Europe vs USA2008 & 2009
0
5
10
15
20
2008 2009Source: IAB Europe/Screen Digest ©
B i l l i o
n E
u r o s
€ 16.3 € 16.8
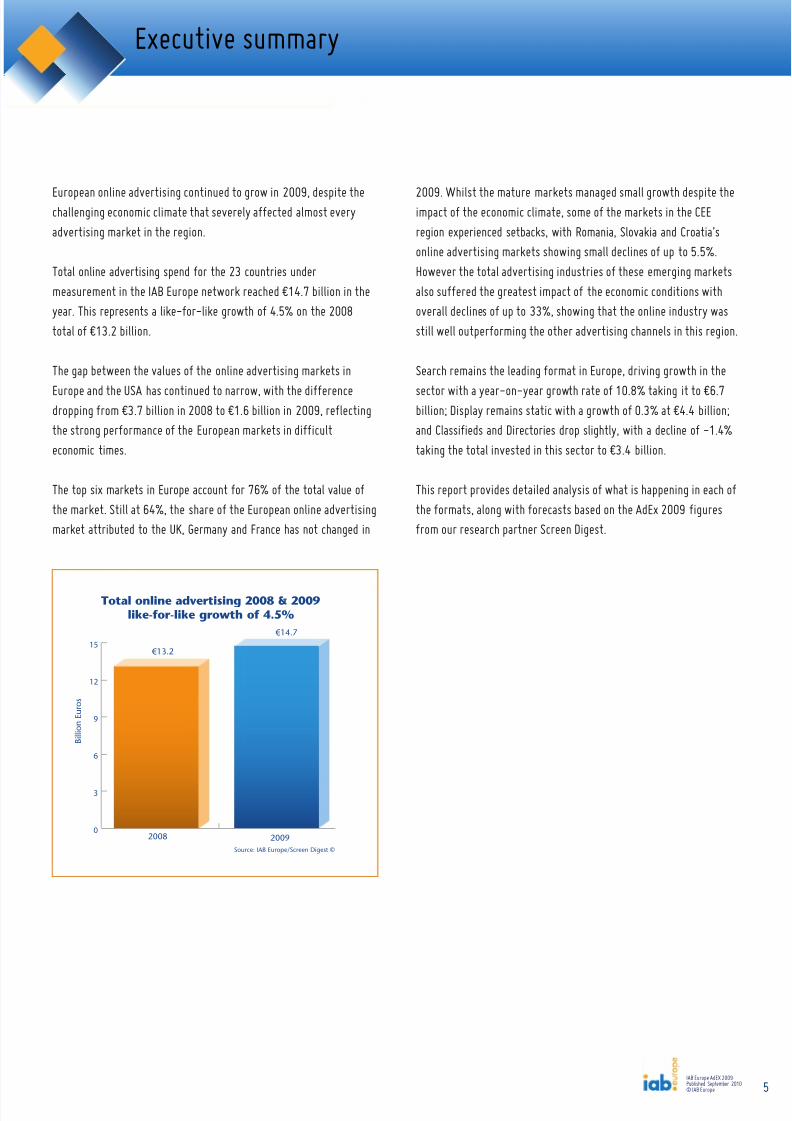
€ 14.7
€ 13.2
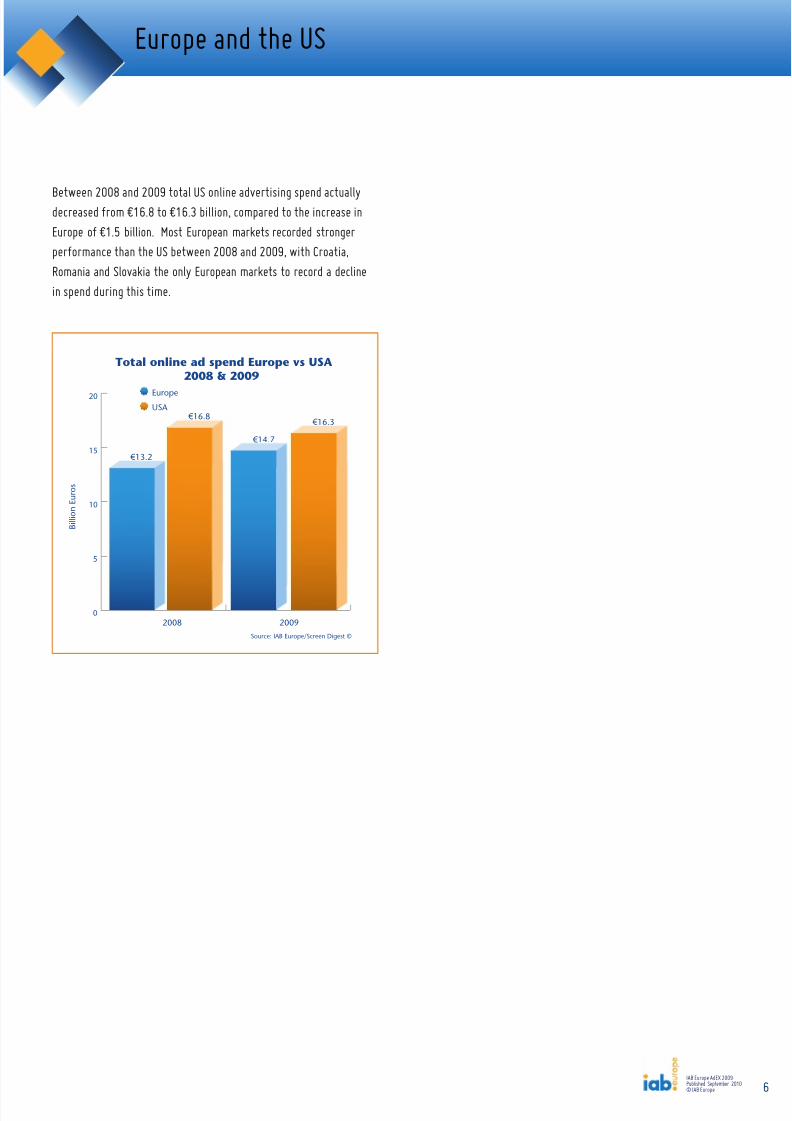
Between 2008 and 2009 total US online advertising spend actuallydecreased from €16.8 to €16.3 billion, compared to the increase inEurope of €1.5 billion. Most European markets recorded strongerperformance than the US between 2008 and 2009, with Croatia,Romania and Slovakia the only European markets to record a declinein spend during this time.
6
Europe and the US
IAB Europe AdEX 2009Published September 2010© IAB Europe
8/8/2019 AdEx 2009 - European online advertising expenditure
http://slidepdf.com/reader/full/adex-2009-european-online-advertising-expenditure 7/41
Source: IAB Europe/Screen Digest ©
Total by country 2008 and 2009
Million Euros
0 1000 2000 3000 4000 5000
20092008
Romania
Croatia
Slovenia
Slovakia
Greece
HungaryTurkey
Finland
Austria
Belgium
Poland
Denmark
Norway
Sweden
Spain
Netherlands
Italy
France
GermanyUK
€ 3,834 € 4,011
€ 2,939
€ 1,731 € 3,092
€ 849 € 798
€ 1,760
€ 800 € 815
€ 635 € 683
€ 455 € 467
€ 374 € 401
€ 296 € 263
€ 384
€ 390
€ 280
€ 228
€ 293 € 200
€ 79 € 120 € 108
€ 182 € 174
€ 69 € 46
€ 85
€ 21 € 20 € 24 € 26
€ 14 € 13
€ 15 € 15
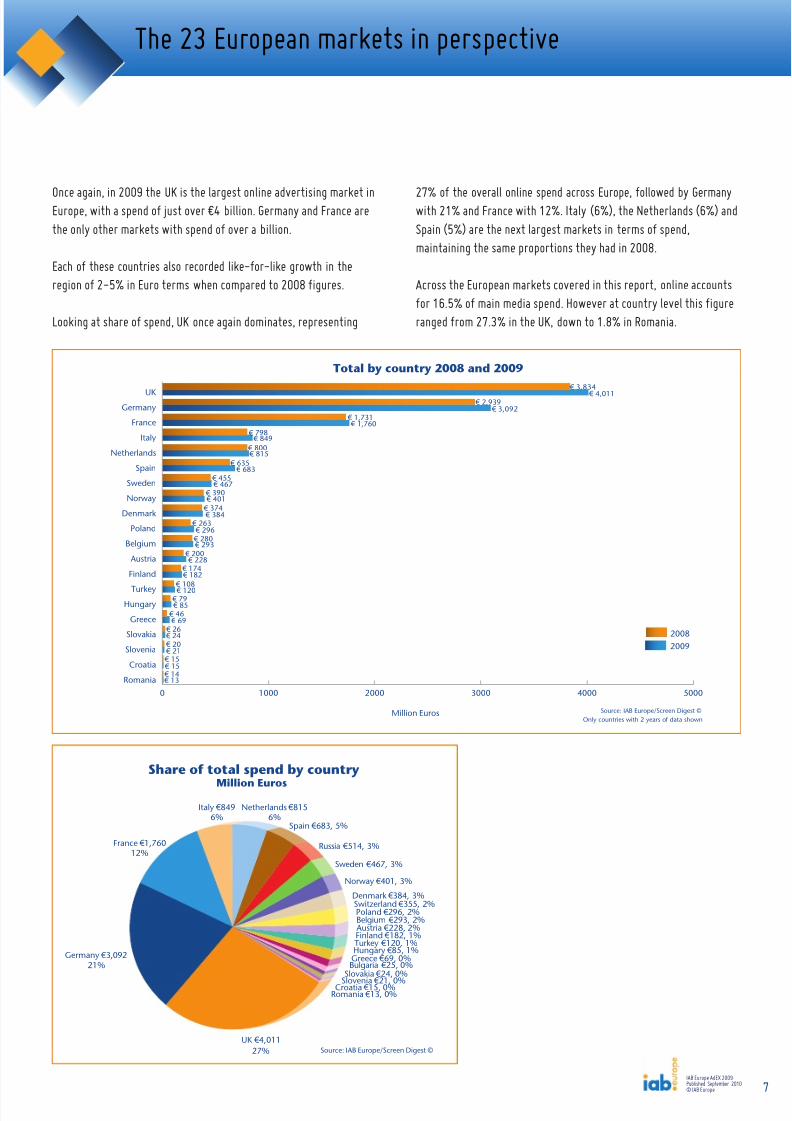
Once again, in 2009 the UK is the largest online advertising market inEurope, with a spend of just over €4 billion. Germany and France arethe only other markets with spend of over a billion.
Each of these countries also recorded like-for-like growth in theregion of 2-5% in Euro terms when compared to 2008 figures.
Looking at share of spend, UK once again dominates, representing
7
27% of the overall online spend across Europe, followed by Germawith 21% and France with 12%. Italy (6%), the Netherlands (6%) aSpain (5%) are the next largest markets in terms of spend,maintaining the same proportions they had in 2008.
Across the European markets covered in this report, online accountfor 16.5% of main media spend. However at country level this figuranged from 27.3% in the UK, down to 1.8% in Romania.
The 23 European markets in perspective
Share of total spend by countryMillion Euros
Source: IAB Europe/Screen Digest ©UK € 4,011
Germany € 3,09221%
France € 1,76012%
Netherlands € 8156%
Italy € 8496%
Spain € 683, 5%
Russia € 514, 3%
Sweden € 467, 3%
Norway € 401, 3%
Denmark € 384, 3%Switzerland € 355, 2%Poland € 296, 2%Belgium € 293, 2%
Austria € 228, 2%Finland € 182, 1%Turkey € 120, 1%Hungary € 85, 1%Greece € 69, 0%Bulgaria € 25, 0%
Slovakia € 24, 0%Slovenia € 21, 0%Croatia € 15, 0%
Romania € 13, 0%
27%
Only countries with 2 years of data shown
IAB Europe AdEX 2009Published September 2010© IAB Europe
8/8/2019 AdEx 2009 - European online advertising expenditure
http://slidepdf.com/reader/full/adex-2009-european-online-advertising-expenditure 8/41
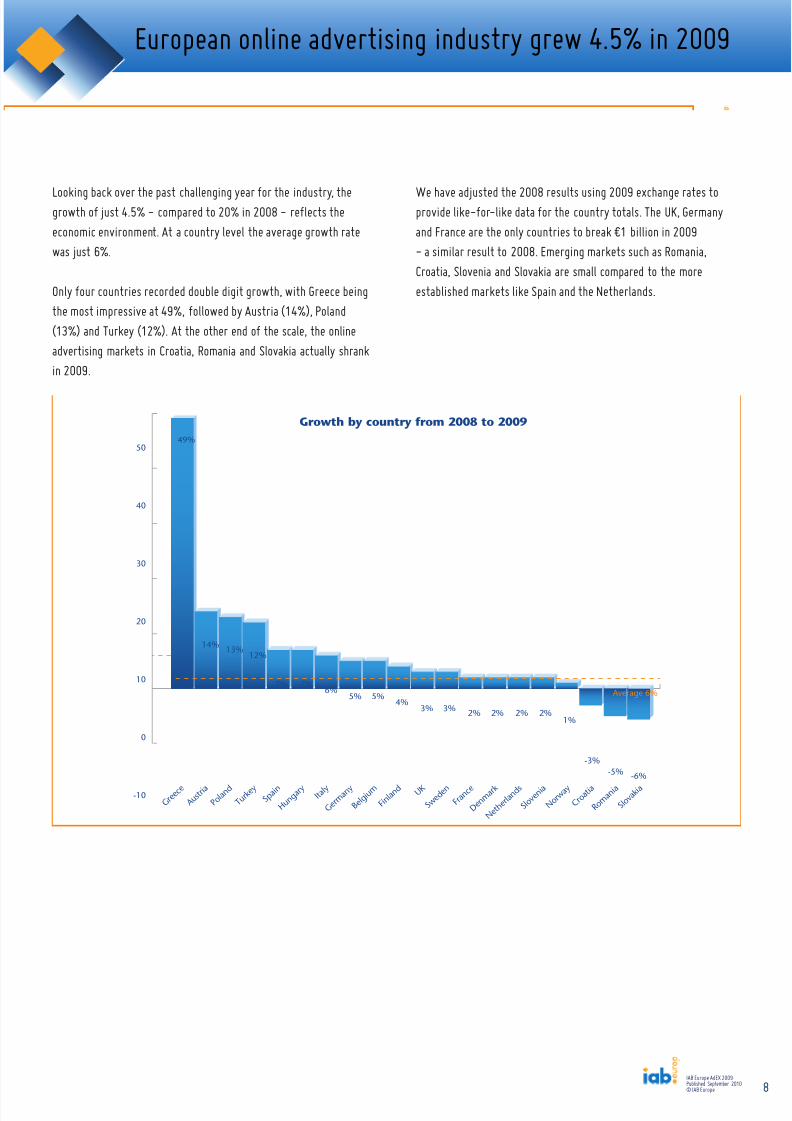
Looking back over the past challenging year for the industry, thegrowth of just 4.5% - compared to 20% in 2008 - reflects theeconomic environment. At a country level the average growth ratewas just 6%.
Only four countries recorded double digit growth, with Greece beingthe most impressive at 49%, followed by Austria (14%), Poland(13%) and Turkey (12%). At the other end of the scale, the onlineadvertising markets in Croatia, Romania and Slovakia actually shrankin 2009.
We have adjusted the 2008 results using 2009 exchange rates toprovide like-for-like data for the country totals. The UK, Germanyand France are the only countries to break €1 billion in 2009- a similar result to 2008. Emerging markets such as Romania,Croatia, Slovenia and Slovakia are small compared to the moreestablished markets like Spain and the Netherlands.
8
European online advertising industry grew 4.5% in 2009
Source: IAB Europe/Screen Digest ©
Growth by country from 2008 to 2009
G r e e c e
A u s t r i a
P o l a n d
T u r k e y S p a
i n H u
n g a r y I t a l y
G e r m
a n y B e l
g i u m F i n
l a n d U K S w
e d e n
F r a n c e
D e n m
a r k
N e t h e
r l a n d s
S l o v e n
i a N o
r w a y
C r o a t i a
R o m a n i a
S l o v a k
i a-10
0
10
20
30
40
50
Average 6%
49%
14% 13%12%
7% 7%6%
5% 5%4%
3% 3% 2% 2% 2% 2%1%
-3%-5% -6%
IAB Europe AdEX 2009Published September 2010© IAB Europe
8/8/2019 AdEx 2009 - European online advertising expenditure
http://slidepdf.com/reader/full/adex-2009-european-online-advertising-expenditure 9/419
European online advertising industry grew 4.5% in 2009
Source: IAB Europe/Screen Digest ©
0 1000 2000 3000 4000 5000
Romania € 13Croatia
SloveniaSlovakiaBulgariaGreece
HungaryTurkeyFinland Austria
BelgiumPoland
SwitzerlandDenmark
NorwaySweden
RussiaSpain
NetherlandsItaly
FranceGermany
UK
€ 15 € 21 € 24 € 25
€ 69 € 85 € 120
€ 182 €
228
€ 293 € 296
€ 355 € 384
€ 401 € 467 € 514
€ 683 € 815
€ 849 € 1760
€ 4011 € 3092
Online advertising spend by country 2009
Million Euros
IAB Europe AdEX 2009Published September 2010© IAB Europe
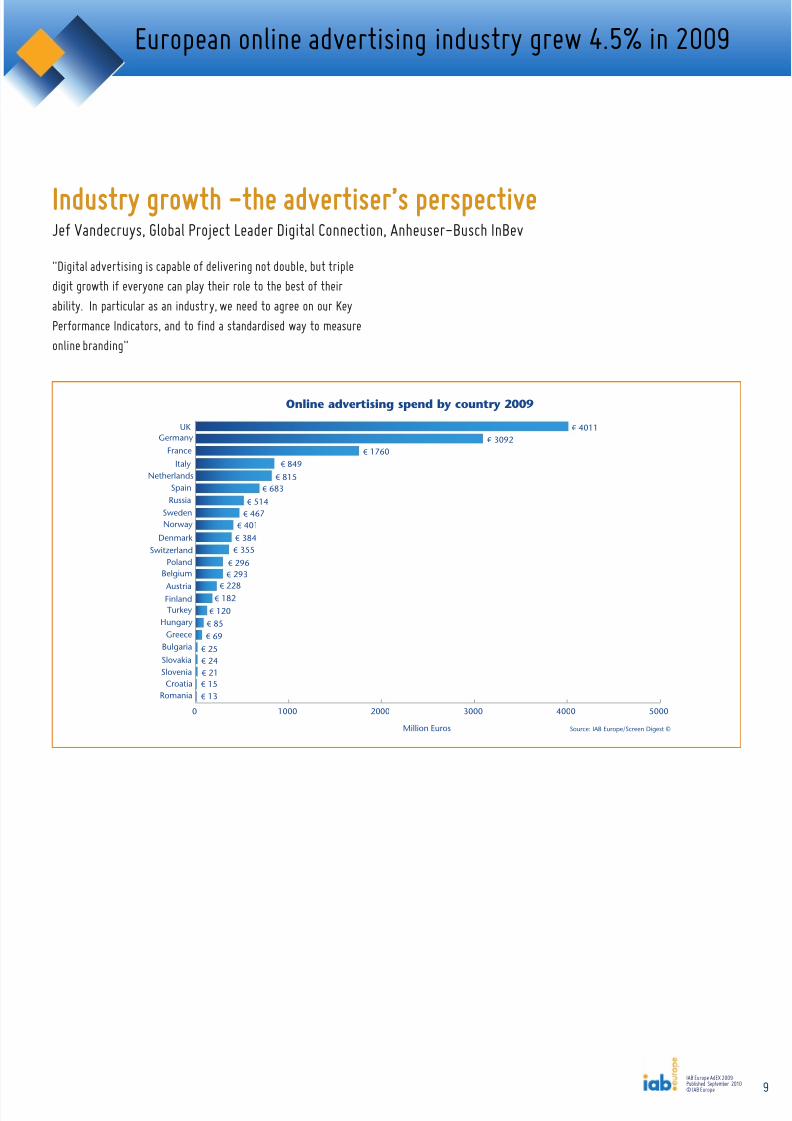
"Digital advertising is capable of delivering not double, but tripledigit growth if everyone can play their role to the best of theirability. In particular as an industry, we need to agree on our KeyPerformance Indicators, and to find a standardised way to measureonline branding"
Jef Vandecruys, Global Project Leader Digital Connection, Anheuser-Busch InBevIndustry growth -the advertiser’s perspective
8/8/2019 AdEx 2009 - European online advertising expenditure
http://slidepdf.com/reader/full/adex-2009-european-online-advertising-expenditure 10/4110IAB Europe AdEX 2009Published September 2010© IAB Europe
10 before 10 achieve d
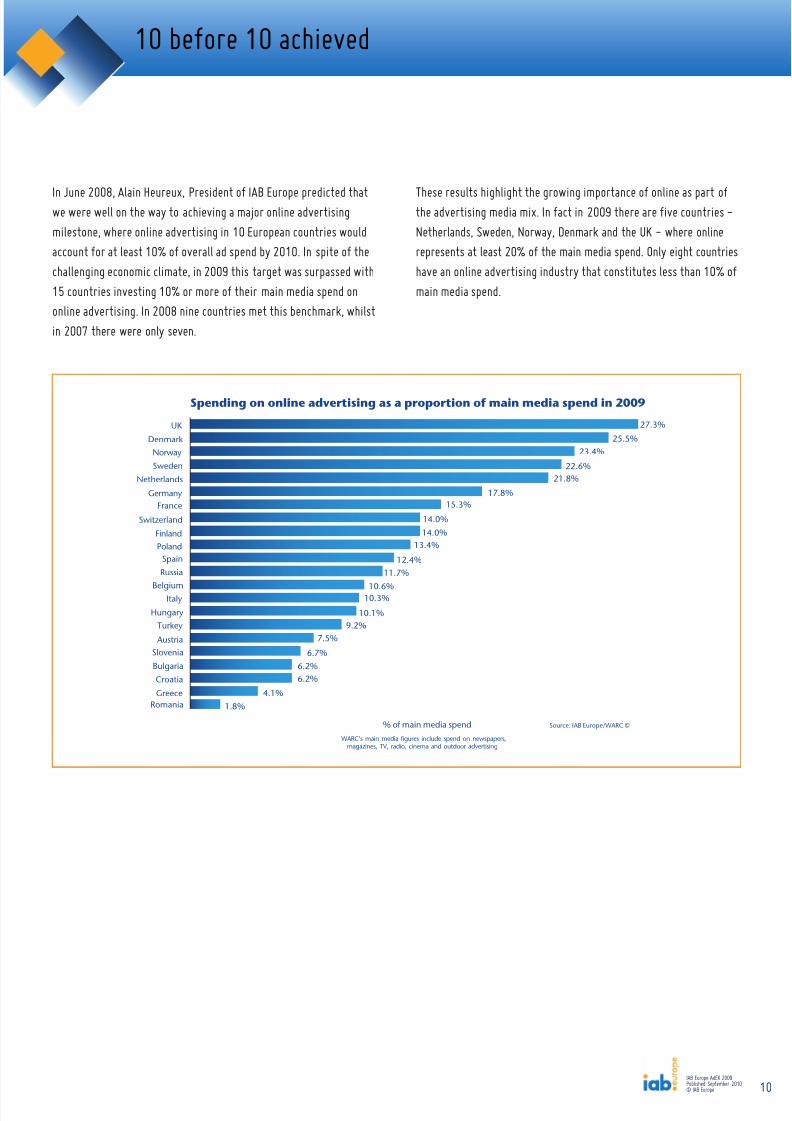
In June 2008, Alain Heureux, President of IAB Europe predicted thatwe were well on the way to achieving a major online advertisingmilestone, where online advertising in 10 European countries wouldaccount for at least 10% of overall ad spend by 2010. In spite of thechallenging economic climate, in 2009 this target was surpassed with15 countries investing 10% or more of their main media spend ononline advertising. In 2008 nine countries met this benchmark, whilstin 2007 there were only seven.
These results highlight the growing importance of online as part ofthe advertising media mix. In fact in 2009 there are five countries -Netherlands, Sweden, Norway, Denmark and the UK - where onlinerepresents at least 20% of the main media spend. Only eight countrieshave an online advertising industry that constitutes less than 10% ofmain media spend.
WARC’s main media figures include spend on newspapers,magazines, TV, radio, cinema and outdoor advertising
UK 27.3%
Spending on online advertising as a proportion of main media spend in 2009
Source: IAB Europe/WARC ©
DenmarkNorwaySweden
Netherlands
GermanyFrance
Switzerland
FinlandPoland
SpainRussia
BelgiumItaly
HungaryTurkey
AustriaSloveniaBulgariaCroatia
GreeceRomania
25.5%23.4%
22.6%21.8%
17.8%15.3%
14.0%14.0%
13.4%
12.4%11.7%
10.6%10.3%
10.1%9.2%
7.5%
6.7%6.2%6.2%
4.1%1.8%
% of main media spend
8/8/2019 AdEx 2009 - European online advertising expenditure
http://slidepdf.com/reader/full/adex-2009-european-online-advertising-expenditure 11/41
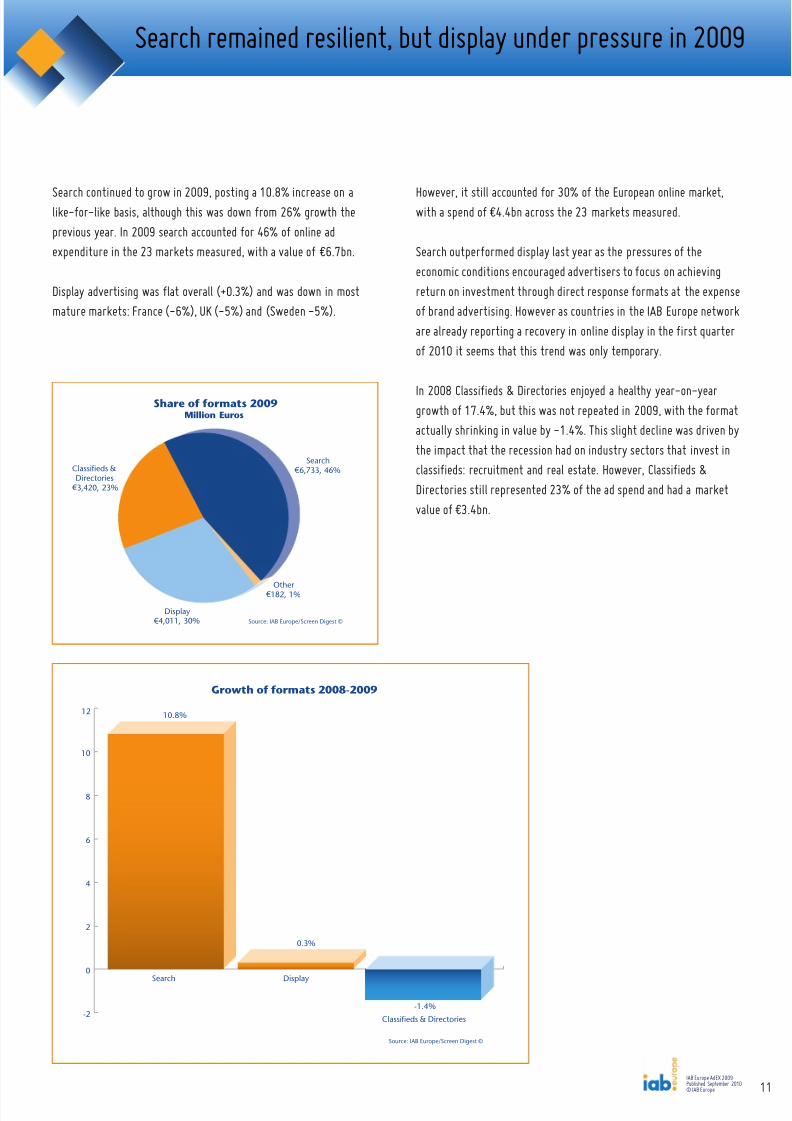
However, it still accounted for 30% of the European online market,with a spend of €4.4bn across the 23 markets measured.
Search outperformed display last year as the pressures of theeconomic conditions encouraged advertisers to focus on achievingreturn on investment through direct response formats at the expensof brand advertising. However as countries in the IAB Europe netware already reporting a recovery in online display in the first quarteof 2010 it seems that this trend was only temporary.
In 2008 Classifieds & Directories enjoyed a healthy year-on-yeargrowth of 17.4%, but this was not repeated in 2009, with the formaactually shrinking in value by -1.4%. This slight decline was driventhe impact that the recession had on industry sectors that invest inclassifieds: recruitment and real estate. However, Classifieds &Directories still represented 23% of the ad spend and had a marketvalue of €3.4bn.
Share of formats 2009Million Euros
Source: IAB Europe/Screen Digest ©
Classifieds &Directories
€ 3,420, 23%
Search € 6,733, 46%
Other € 182, 1%
Display € 4,011, 30%
Search continued to grow in 2009, posting a 10.8% increase on alike-for-like basis, although this was down from 26% growth theprevious year. In 2009 search accounted for 46% of online adexpenditure in the 23 markets measured, with a value of €6.7bn.
Display advertising was flat overall (+0.3%) and was down in mostmature markets: France (-6%), UK (-5%) and (Sweden -5%).
11
Search remained resilient, but display under pressure in 2009
Source: IAB Europe/Screen Digest ©
Growth of formats 2008-2009
-2
0
2
4
6
8
10
12
Classifieds & Directories
DisplaySearch
10.8%
0.3%
-1.4%
IAB Europe AdEX 2009Published September 2010© IAB Europe
8/8/2019 AdEx 2009 - European online advertising expenditure
http://slidepdf.com/reader/full/adex-2009-european-online-advertising-expenditure 12/41
Search value and growth
A u s t r i a
B e l g i u m B u l g a
r i a C r o a
t i a
D e n m a r k
F i n l a n d
F r a n c e
G e r m a n y
G r e e c e
H u n g a r y
I t a l y
N e t h e r l a n
d s
N o r w a y
P o l a n d
R o m a n i a
R u s s i a
S l o v a k i a
S l o v e n i a
S p a i n
S w e d e n
S w i t z e r l a
n d T u r k
e y U K
Source: IAB Europe/Screen Digest ©
0
500
1000
1500
2000
2500
Growth 2008-2009
2009 Value
M i l l i o n
E u r o s
G r o w
t h %
75
100
50
25
0
-25
12
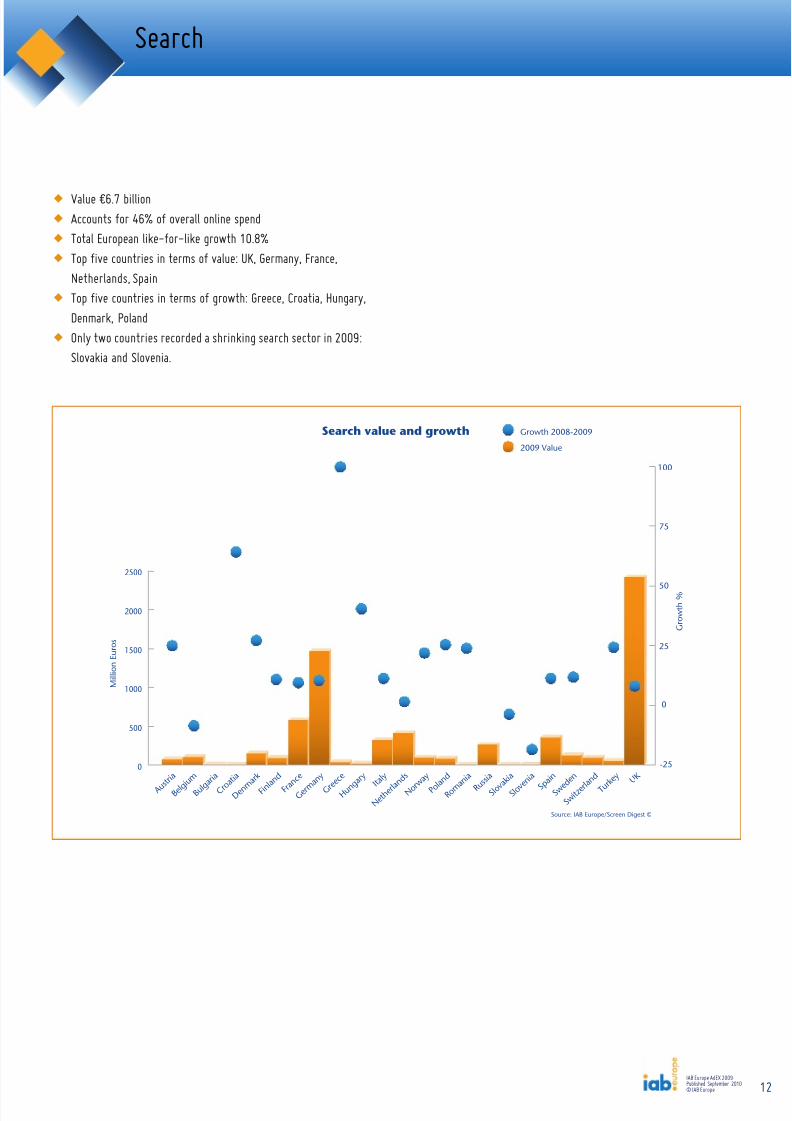
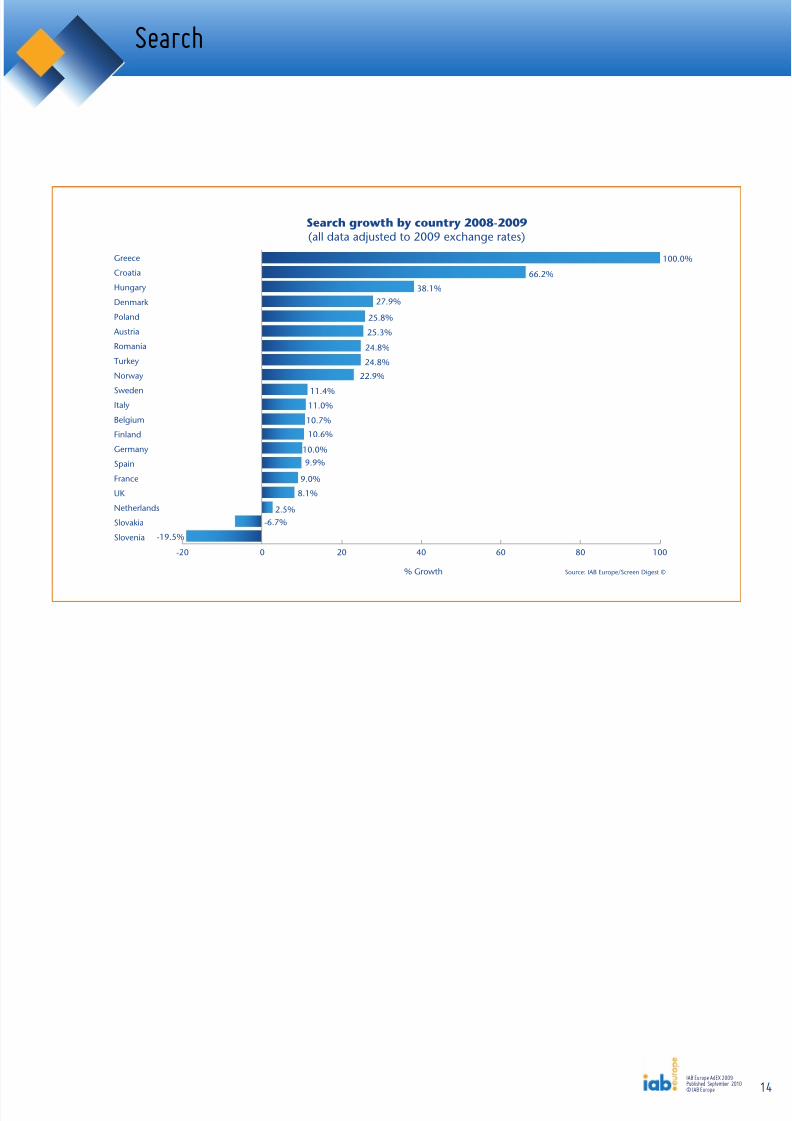
w Value €6.7 billionw Accounts for 46% of overall online spendw Total European like-for-like growth 10.8%w Top five countries in terms of value: UK, Germany, France,
Netherlands, Spainw Top five countries in terms of growth: Greece, Croatia, Hungary,
Denmark, Polandw Only two countries recorded a shrinking search sector in 2009:
Slovakia and Slovenia.
Search
IAB Europe AdEX 2009Published September 2010© IAB Europe
8/8/2019 AdEx 2009 - European online advertising expenditure
http://slidepdf.com/reader/full/adex-2009-european-online-advertising-expenditure 13/4113
Search
2009
2008
Romania
Slovakia
Slovenia
Croatia
Bulgaria
Hungary
Greece
Turkey
Austria
Poland
Finland
Switzerland
Norway
Belgium
Sweden
Denmark
Russia
Italy
Spain
Netherlands
France
Germany
UK € 2,200€ 2,409
Search value by country 2008 and 2009(all data adjusted to 2009 exchange rates)
€ 1,328€ 1,461
€ 525€ 572
€ 400€ 410
€ 324€ 356
€ 285€
316€ 255
€ 116€ 149
€ 112€ 125
€ 95€ 105
€ 78€ 96
€ 95€ 85€ 93
€ 65€ 82
€ 60€ 75
€ 43€ 54
€ 20€ 40
€ 13€ 18
€ 7€ 3€ 5€ 6€ 4€ 4€ 4
€ 1
Source: IAB Europe/Screen Digest © Million Euros
0 500 1000 1500 2000 2500
IAB Europe AdEX 2009Published September 2010© IAB Europe
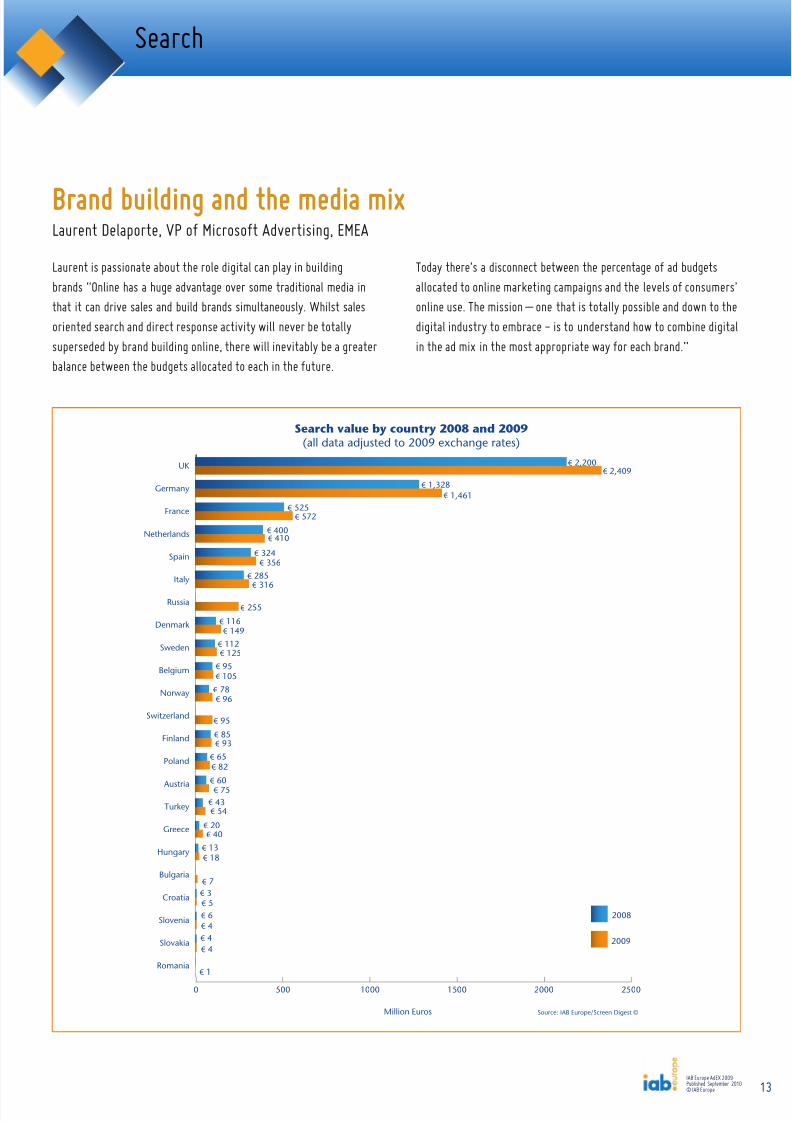
Laurent is passionate about the role digital can play in buildingbrands “Online has a huge advantage over some traditional media inthat it can drive sales and build brands simultaneously. Whilst salesoriented search and direct response activity will never be totallysuperseded by brand building online, there will inevitably be a greaterbalance between the budgets allocated to each in the future.
Laurent Delaporte, VP of Microsoft Advertising, EMEABrand building and the media mix
Today there’s a disconnect between the percentage of ad budgetsallocated to online marketing campaigns and the levels of consumeonline use. The mission – one that is totally possible and down to tdigital industry to embrace - is to understand how to combine digitin the ad mix in the most appropriate way for each brand.”
8/8/2019 AdEx 2009 - European online advertising expenditure
http://slidepdf.com/reader/full/adex-2009-european-online-advertising-expenditure 14/4114
Search
-20 0 20 40 60 80 100
-19.5%
-6.7%2.5%
8.1%
9.0%
10.0%
10.6%
10.7%
11.0%
9.9%
11.4%
22.9%
24.8%
24.8%
25.3%
25.8%
27.9%38.1%
66.2%
100.0%Greece
Croatia
Hungary
Denmark
Poland
Austria
Romania
Turkey
Norway
SwedenItaly
Belgium
Finland
Germany
Spain
France
UK
Netherlands
Slovakia
Slovenia
Source: IAB Europe/Screen Digest ©
Search growth by country 2008-2009(all data adjusted to 2009 exchange rates)
% Growth
IAB Europe AdEX 2009Published September 2010© IAB Europe
8/8/2019 AdEx 2009 - European online advertising expenditure
http://slidepdf.com/reader/full/adex-2009-european-online-advertising-expenditure 15/41
M i l l i o n
E u r o s
G r o w
t h %
Growth 2008-2009
2009 Value
Classifieds & directories value and growth
Source: IAB Europe/Screen Digest ©
0
100
200
300
400
500
600
-40
700
800
-30
-20
-10
0
10
20
30
40
A u s t r i a
B e l g i u m
B u l g a r
i a C r o
a t i a
D e n m
a r k F i n
l a n d F r a
n c e
G e r m
a n y G r e
e c e
H u n g a r
y I t a l
y
N e t h e
r l a n d s
N o r w a
y P o l
a n d
R o m a n i
a R u s
s i a S l o
v a k i a
S l o v e n
i a S p a
i n S w
e d e n
S w i t z e
r l a n d T u r
k e y U K
15
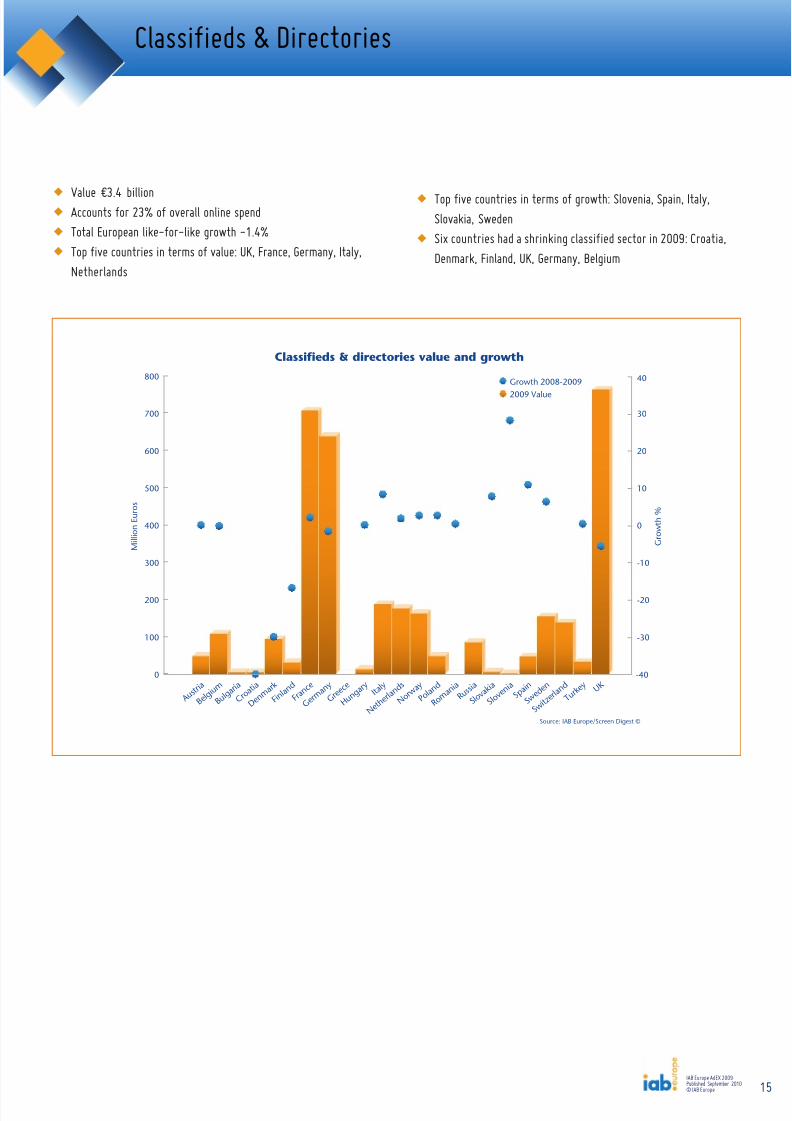
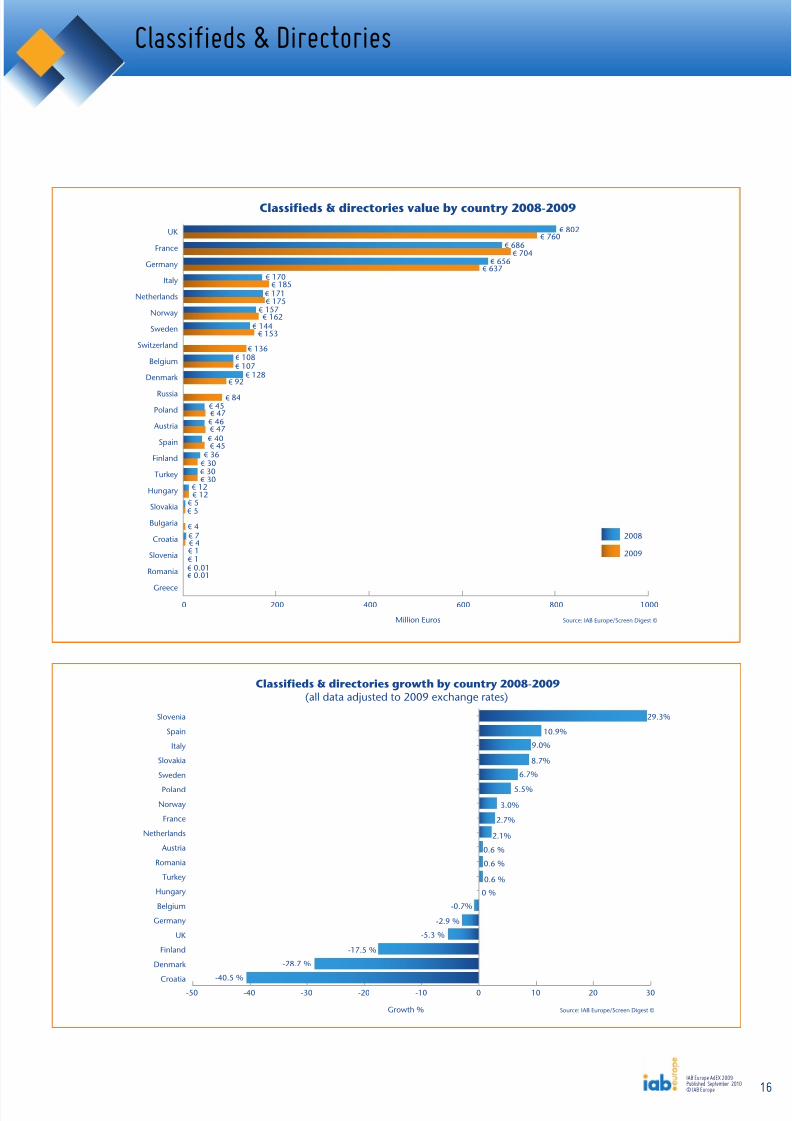
w Top five countries in terms of growth: Slovenia, Spain, Italy,Slovakia, Sweden
w Six countries had a shrinking classified sector in 2009: Croatia,Denmark, Finland, UK, Germany, Belgium
wValue €3.4 billion
w Accounts for 23% of overall online spendw Total European like-for-like growth -1.4%w Top five countries in terms of value: UK, France, Germany, Italy,
Netherlands
Classifieds& Directories
IAB Europe AdEX 2009Published September 2010© IAB Europe
8/8/2019 AdEx 2009 - European online advertising expenditure
http://slidepdf.com/reader/full/adex-2009-european-online-advertising-expenditure 16/41
0 200 400 600 800 1000
2009
2008
Greece
Romania
Slovenia
Croatia
Bulgaria
Slovakia
Hungary
Turkey
Finland
Spain
Austria
Poland
Russia
Denmark
Belgium
Switzerland
Sweden
Norway
Netherlands
Italy
Germany
France
UK € 802€ 760
€ 686€ 704
€ 656€ 637
€ 170€ 185
€ 171€ 175
€ 157€ 162
€ 144€ 153
€ 136€ 108€ 107
€ 128€ 92
€ 84€ 45€ 47
€ 46€ 47
€ 40€ 45
€ 36€ 30€ 30€ 30
€ 12€ 12
€ 5€ 5
€ 4€ 7€ 4€ 1€ 1€ 0.01€ 0.01
Classifieds & directories value by country 2008-2009
Source: IAB Europe/Screen Digest © Million Euros
Classifieds& Directories
Source: IAB Europe/Screen Digest ©
Classifieds & directories growth by country 2008-2009(all data adjusted to 2009 exchange rates)
Growth %
-50 -40 -30 -20 -10 0 10 20 30Croatia
Denmark
Finland
UK
Germany
Belgium
Hungary
Turkey
Romania
Austria
Netherlands
France
Norway
Poland
Sweden
Slovakia
Italy
Spain
Slovenia 29.3%
10.9%
9.0%
8.7%
6.7%
5.5%
3.0%
2.7%
2.1%
0.6 %
0.6 %
0.6 %
0 %
-0.7%
-2.9 %
-5.3 %
-17.5 %
-28.7 %
-40.5 %
16IAB Europe AdEX 2009Published September 2010© IAB Europe
8/8/2019 AdEx 2009 - European online advertising expenditure
http://slidepdf.com/reader/full/adex-2009-european-online-advertising-expenditure 17/41
M i l l i o n E u r o s
G r o w
t h %
Growth 2008-20092009 Value
Display value and growth
Source: IAB Europe/Screen Digest ©
A u s t r i a
B e l g i u m
B u l g a r
i a C r o
a t i a
D e n m
a r k F i n
l a n d F r a
n c e
G e r m
a n y G r e
e c e
H u n g a r
y I t a l
y
N e t h e
r l a n d s
N o r w a
y P o l
a n d
R o m a n i
a R u s
s i a S p a
i n S l o
v a k i a
S l o v e n
i a S w
e d e n
S w i t z e
r l a n d T u r
k e y U K0
200
400
600
800
1000
-20
-10
0
10
20
30
17
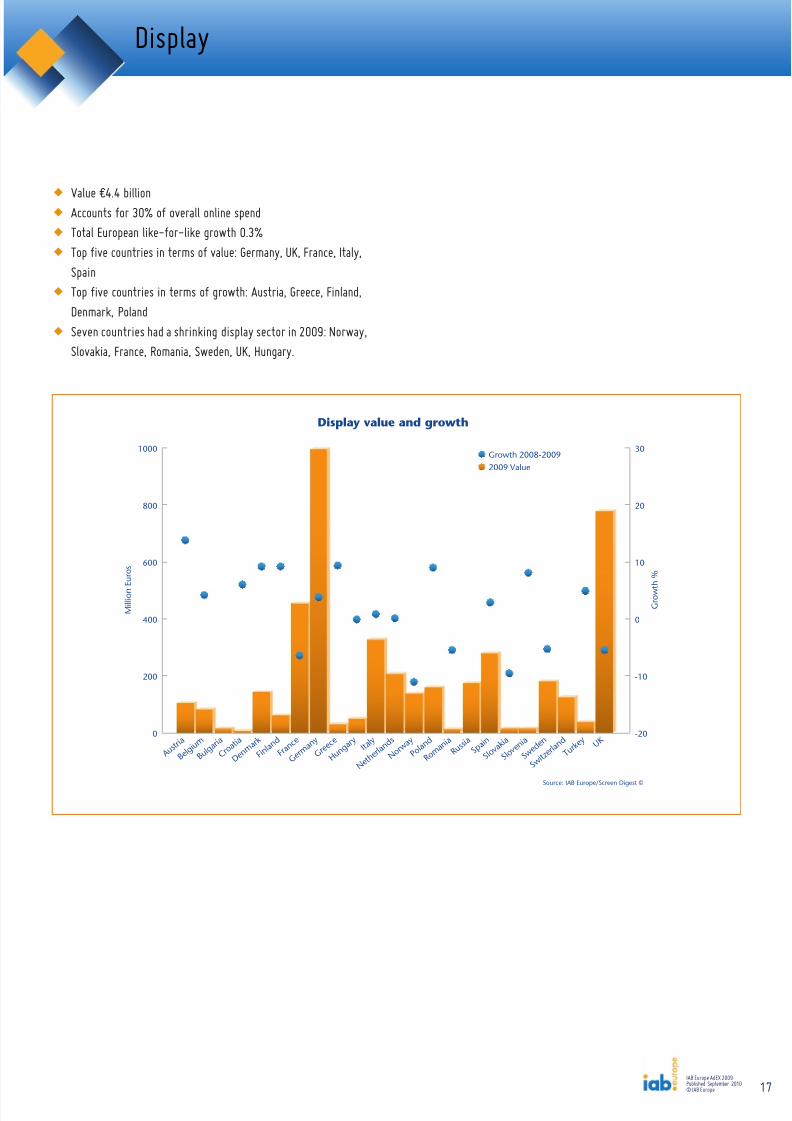
w Value €4.4 billionw Accounts for 30% of overall online spendw Total European like-for-like growth 0.3%w Top five countries in terms of value: Germany, UK, France, Italy,
Spainw Top five countries in terms of growth: Austria, Greece, Finland,
Denmark, Polandw Seven countries had a shrinking display sector in 2009: Norway,
Slovakia, France, Romania, Sweden, UK, Hungary.
Display
IAB Europe AdEX 2009Published September 2010© IAB Europe
8/8/2019 AdEx 2009 - European online advertising expenditure
http://slidepdf.com/reader/full/adex-2009-european-online-advertising-expenditure 18/41
0 200 400 600 800 1000
2009
2008
Croatia
Romania
Greece
Turkey
Hungary
Finland
Belgium
Austria
Switzerland
Norway
Denmark
Poland
Russia
Sweden
Netherlands
Italy
France
UK
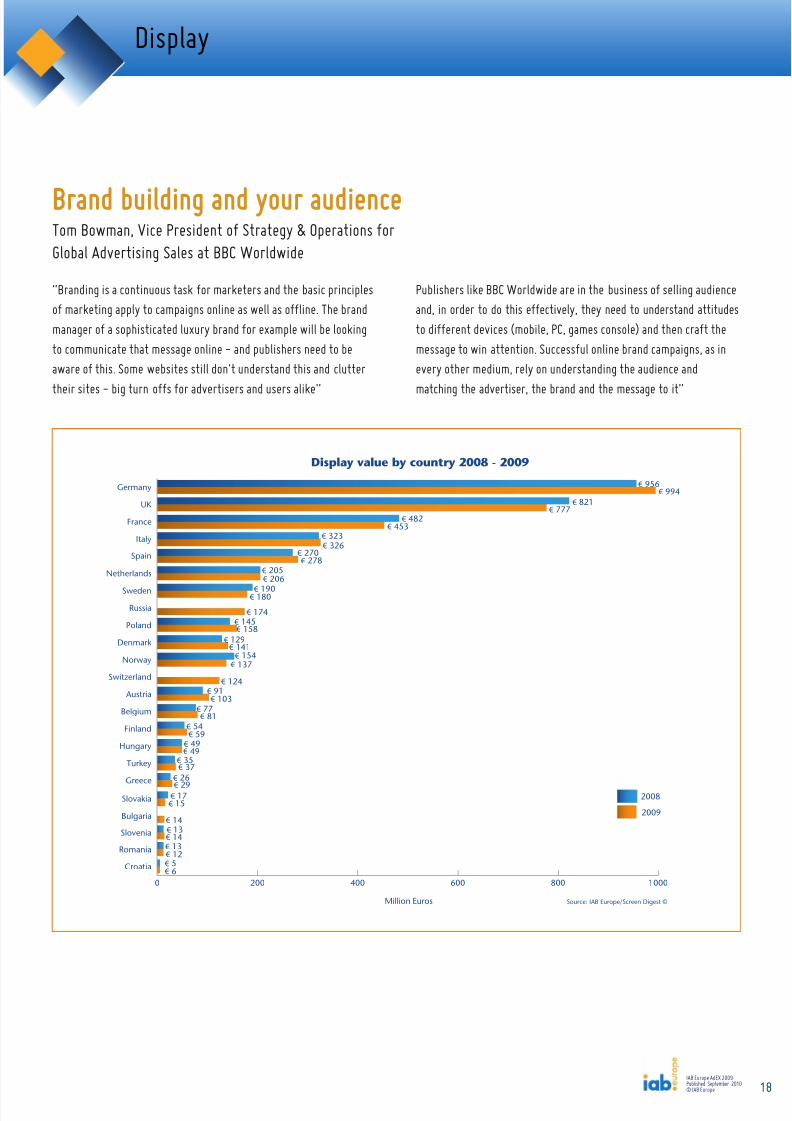
Germany € 956€ 994
€ 821€ 777
€ 482€ 453
€ 323€ 326
€ 205€ 206
€ 190€ 180
€ 174€ 145€ 158
€ 129€ 141
€ 154€ 137
€ 124€ 91
€ 103€ 77
€ 81€ 54€ 59
€ 49€ 49
€ 35€ 37
€ 26€ 29
€ 270Spain € 278
Bulgaria
Slovakia € 15€ 17
€ 14Slovenia € 13
€ 14€ 13€ 12€ 5€ 6
Display value by country 2008 - 2009
Source: IAB Europe/Screen Digest ©Million Euros
18
Display
IAB Europe AdEX 2009Published September 2010© IAB Europe
“Branding is a continuous task for marketers and the basic principlesof marketing apply to campaigns online as well as offline. The brandmanager of a sophisticated luxury brand for example will be lookingto communicate that message online - and publishers need to beaware of this. Some websites still don't understand this and clutter
their sites - big turn offs for advertisers and users alike”
Tom Bowman, Vice President of Strategy & Operations forGlobal Advertising Sales at BBC Worldwide
Brand building and your audience
Publishers like BBC Worldwide are in the business of selling audieand, in order to do this effectively, they need to understand attitudeto different devices (mobile, PC, games console) and then craft themessage to win attention. Successful online brand campaigns, as inevery other medium, rely on understanding the audience and
matching the advertiser, the brand and the message to it”
8/8/2019 AdEx 2009 - European online advertising expenditure
http://slidepdf.com/reader/full/adex-2009-european-online-advertising-expenditure 19/41
-12 -9 -6 -3 0 3 6 9 12 15
Norway
Slovakia
France
Romania
Sweden
UK
Hungary
Netherlands
Italy
Spain
Germany
Belgium
Turkey
Croatia
Slovenia
Poland
Denmark
Finland
Greece
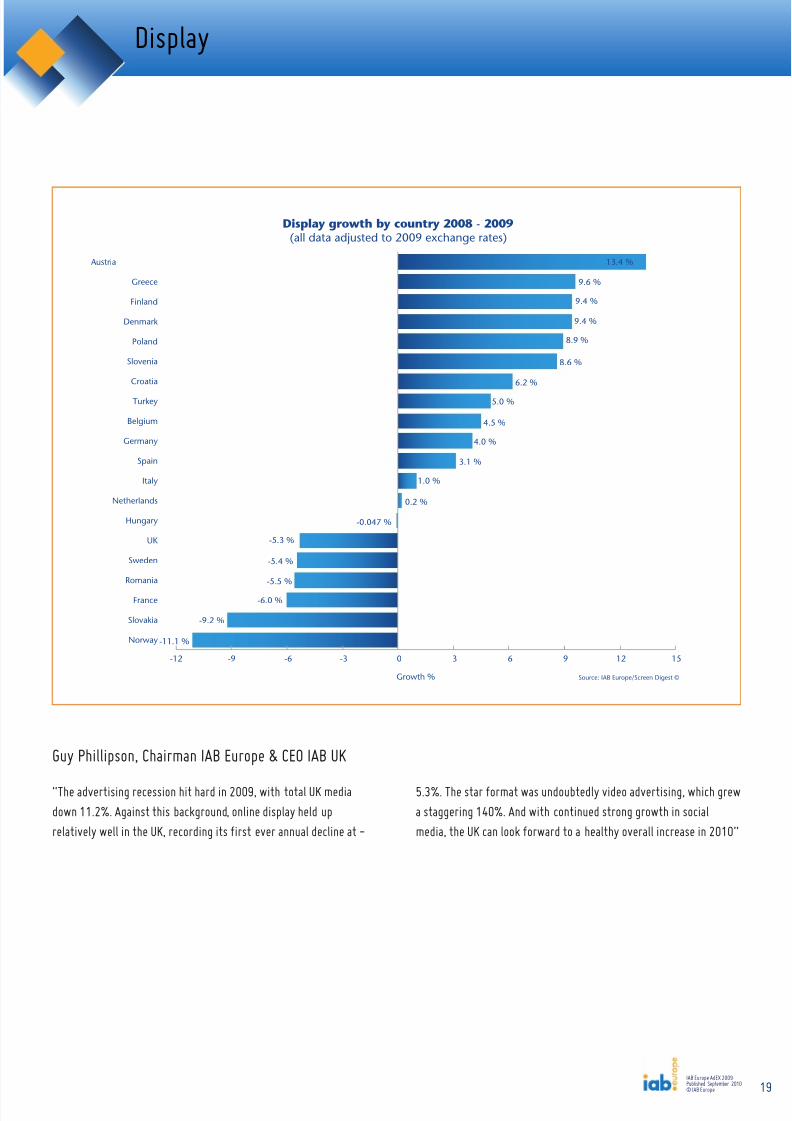
Austria 13.4 %
9.6 %
9.4 %
9.4 %
8.9 %
8.6 %
6.2 %
-5.4 %
4.0 %
4.5 %
5.0 %
-5.3 %
-0.047 %
0.2 %
1.0 %
3.1 %
-11.1 %
-9.2 %
-6.0 %
-5.5 %
Display growth by country 2008 - 2009(all data adjusted to 2009 exchange rates)
Source: IAB Europe/Screen Digest ©Growth %
19
Display
IAB Europe AdEX 2009Published September 2010© IAB Europe
“The advertising recession hit hard in 2009, with total UK mediadown 11.2%. Against this background, online display held uprelatively well in the UK, recording its first ever annual decline at -
Guy Phillipson, Chairman IAB Europe & CEO IAB UK
5.3%. The star format was undoubtedly video advertising, which ga staggering 140%. And with continued strong growth in socialmedia, the UK can look forward to a healthy overall increase in 20
8/8/2019 AdEx 2009 - European online advertising expenditure
http://slidepdf.com/reader/full/adex-2009-european-online-advertising-expenditure 20/41
M i l l i o n
E u r o s
DisplayClassifieds & DirectoriesSearchOther
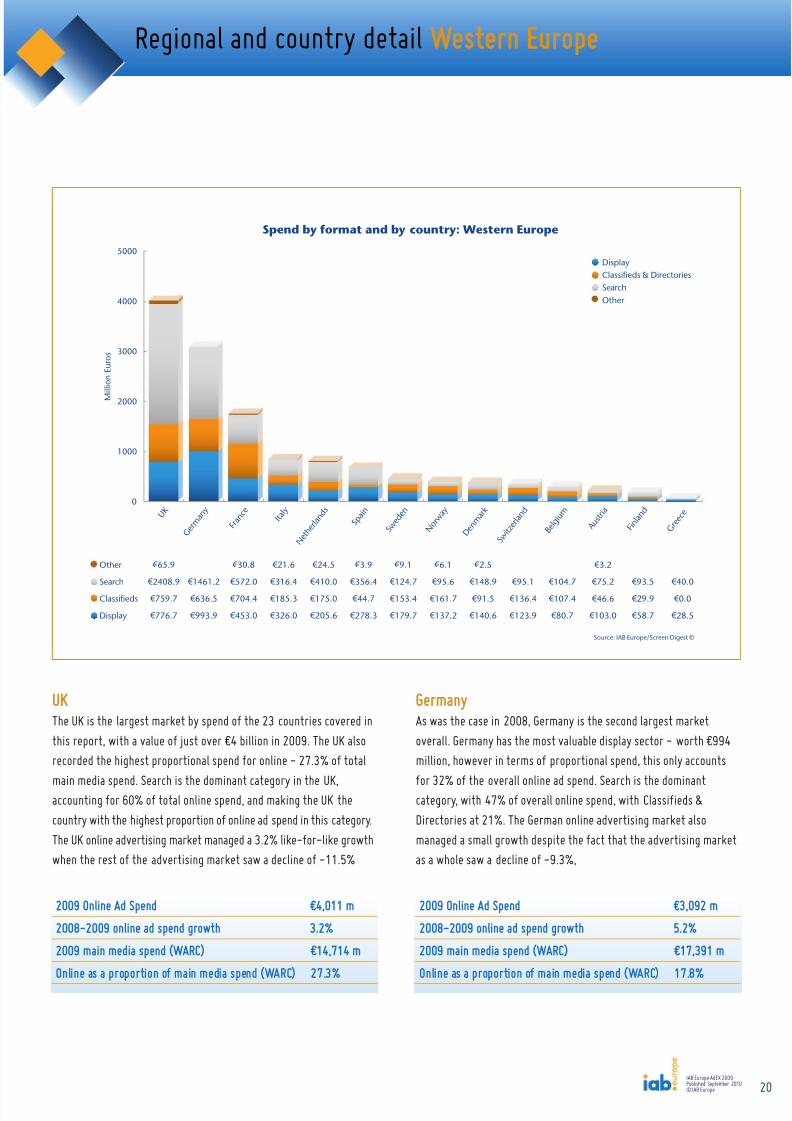
Spend by format and by country: Western Europe
U K
G e r m
a n y
F r a n c
e I t a l y
N e t h e
r l a n d s
S p a i n
S w e d
e n
N o r w
a y
D e n m
a r k
S w i t z e
r l a n d
B e l g i u m
A u s t r i a
F i n l a n d
Source: IAB Europe/Screen Digest ©
Other
Search
Classifieds
Display
€ 65.9
€ 2408.9
€ 759.7
€ 776.7
€ 1461.2
€ 636.5
€ 993.9
€ 30.8
€ 572.0
€ 704.4
€ 453.0
€ 21.6
€ 316.4
€ 185.3
€ 326.0
€ 24.5
€ 410.0
€ 175.0
€ 205.6
€ 3.9
€ 356.4
€ 44.7
€ 278.3
€ 9.1
€ 124.7
€ 153.4
€ 179.7
€ 6.1
€ 95.6
€ 161.7
€ 137.2
€ 2.5
€ 148.9
€ 91.5
€ 140.6
€ 95.1
€ 136.4
€ 123.9
€ 104.7
€ 107.4
€ 80.7
€ 3.2
€ 75.2
€ 46.6
€ 103.0
€ 93.5
€ 29.9
€ 58.7
0
1000
2000
3000
4000
5000
G r e e
c e
€ 40.0
€ 0.0
€ 28.5
20
GermanyAs was the case in 2008, Germany is the second largest marketoverall. Germany has the most valuable display sector - worth €994million, however in terms of proportional spend, this only accounts
for 32% of the overall online ad spend. Search is the dominantcategory, with 47% of overall online spend, with Classifieds &Directories at 21%. The German online advertising market alsomanaged a small growth despite the fact that the advertising markeas a whole saw a decline of -9.3%,
UKThe UK is the largest market by spend of the 23 countries covered inthis report, with a value of just over €4 billion in 2009. The UK alsorecorded the highest proportional spend for online - 27.3% of total
main media spend. Search is the dominant category in the UK,accounting for 60% of total online spend, and making the UK thecountry with the highest proportion of online ad spend in this category.The UK online advertising market managed a 3.2% like-for-like growthwhen the rest of the advertising market saw a decline of -11.5%
Regional and country detailWestern Europe
2009 Online Ad Spend €4,011 m2008-2009 online ad spend growth 3.2%2009 main media spend (WARC) €14,714 mOnline as a proportion of main media spend (WARC) 27.3%
2009 Online Ad Spend €3,092 m2008-2009 online ad spend growth 5.2%2009 main media spend (WARC) €17,391 mOnline as a proportion of main media spend (WARC) 17.8%
IAB Europe AdEX 2009Published September 2010© IAB Europe
8/8/2019 AdEx 2009 - European online advertising expenditure
http://slidepdf.com/reader/full/adex-2009-european-online-advertising-expenditure 21/4121
SpainSpain had the third highest proportional spend on Search in Europe,52%. Display is the second largest category at 41%, whilst Classifi& Directories account for only 7% of online spend. Growth was juabove average at 7.1% and achieved when the advertising market awhole saw a decline of -20%. As online still only accounts for 12.of main media spend there is still room for strong growth.
SwedenAt 22.6% Sweden has the third highest proportion of online spend part of the overall main media mix. Display accounts for 38% ofspend, followed by Classifieds & Directories (33%) and Search (27The modest growth of 2.7% in online advertising was achieved in ayear where the advertising market as a whole saw a decline of -13.4%
NorwayNorway has the second highest proportion of main media spenddevoted to online - 23.4%. The majority of spend, 40%, goes onClassifieds & Directories. This is the highest proportion in Europe,position shared with France where 40% of spend also goes towardsClassifieds & Directories. Display represents 34% of online spend Norway, while Search accounts for just 24%.
FranceFrance, along with Norway, has the largest classified market in termsof proportional spend (both 40%), and the second largest after theUK in terms of spend (€704m). Search is the second most popularcategory at 32%, followed by Display at 26%. The online advertisingmarket in France managed a small growth despite the fact that theadvertising market as a whole saw a decline of -12.5%
ItalyItaly is the fourth largest market in Europe, maintaining its positionfrom 2008. Display is the dominant sector, but only by 1% inproportional spend terms accounting for 38% of the spend comparedto Search on 37%. Classifieds & Directories come a distant third at22%. However as online still represents only 10.3% of main media
spend, considerably below many other Western European markets,there is still room for industry growth in the near future.
NetherlandsThe Netherlands is the fifth largest market in terms of spend. As oneof the most mature European markets, the Netherlands saw littlegrowth in online advertising spend in 2009 - just 1.8%. This wasachieved despite the advertising market as a whole declining by -13.1%in the same period. Search is the predominant category, accountingfor 50% of spend, followed by Display (25%) and Classifieds &Directories (21%). 21.8% of the Netherlands main media spend goestowards online, which is the fifth largest proportion in Europe.
Regional and country detailWestern Europe
2009 Online Ad Spend €1,760 m2008-2009 online ad spend growth 2.2%2009 main media spend (WARC) €11,525 mOnline as a proportion of main media spend (WARC) 15.3%
2009 Online Ad Spend €683 m2008-2009 online ad spend growth 7.1%2009 main media spend (WARC) €5,502 mOnline as a proportion of main media spend (WARC) 12.4%
2009 Online Ad Spend €849 m2008-2009 online ad spend growth 6.4%2009 main media spend (WARC) €8,259 mOnline as a proportion of main media spend (WARC) 10.3%
2009 Online Ad Spend €467 m2008-2009 online ad spend growth 2.7%2009 main media spend (WARC) €2,069 mOnline as a proportion of main media spend (WARC) 23%
2009 Online Ad Spend €401 m2008-2009 online ad spend growth 1.4%2009 main media spend (WARC) €1,714 mOnline as a proportion of main media spend (WARC) 23.4%
2009 Online Ad Spend €815 m2008-2009 online ad spend growth 1.8%2009 main media spend (WARC) €3,746 mOnline as a proportion of main media spend (WARC) 21.8%
IAB Europe AdEX 2009Published September 2010© IAB Europe
8/8/2019 AdEx 2009 - European online advertising expenditure
http://slidepdf.com/reader/full/adex-2009-european-online-advertising-expenditure 22/4122
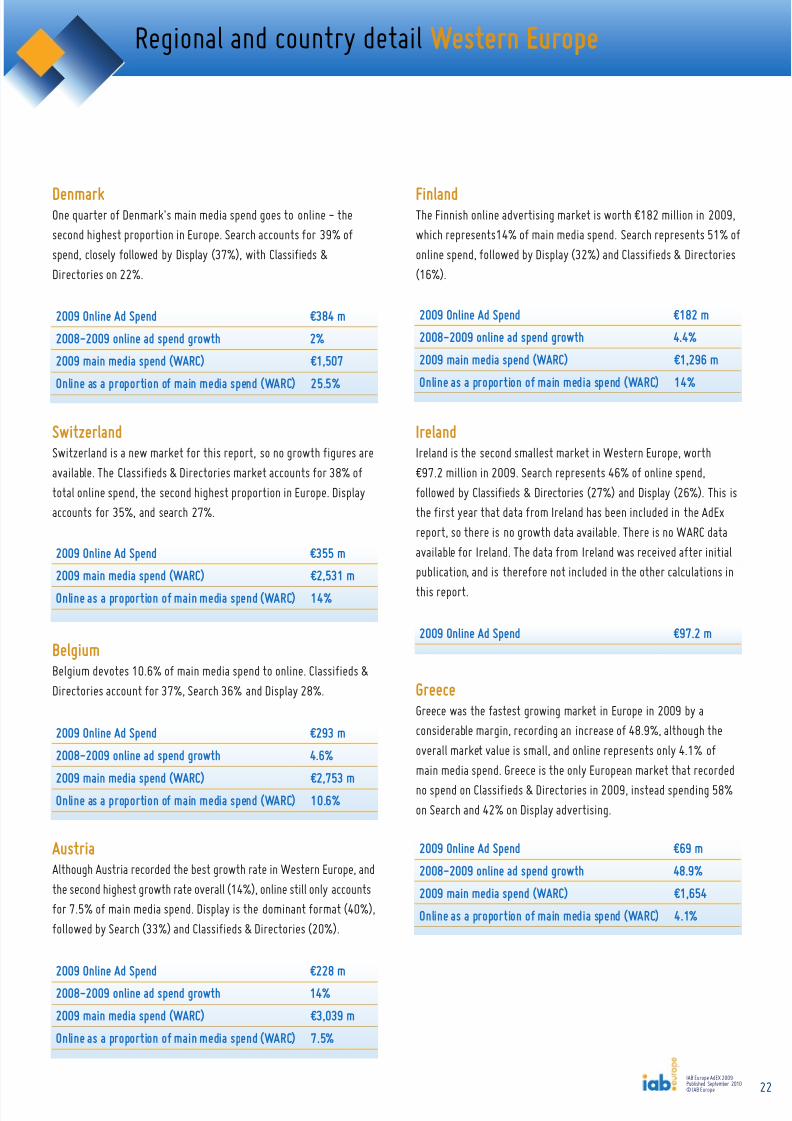
FinlandThe Finnish online advertising market is worth €182 million in 200which represents14% of main media spend. Search represents 51%online spend, followed by Display (32%) and Classifieds & Directo(16%).
IrelandIreland is the second smallest market in Western Europe, worth€97.2 million in 2009. Search represents 46% of online spend,followed by Classifieds & Directories (27%) and Display (26%). Tthe first year that data from Ireland has been included in the AdExreport, so there is no growth data available. There is no WARC datavailable for Ireland. The data from Ireland was received after initipublication, and is therefore not included in the other calculations i
this report.
GreeceGreece was the fastest growing market in Europe in 2009 by aconsiderable margin, recording an increase of 48.9%, although theoverall market value is small, and online represents only 4.1% ofmain media spend. Greece is the only European market that recordno spend on Classifieds & Directories in 2009, instead spending 58on Search and 42% on Display advertising.
DenmarkOne quarter of Denmark's main media spend goes to online - thesecond highest proportion in Europe. Search accounts for 39% ofspend, closely followed by Display (37%), with Classifieds &Directories on 22%.
SwitzerlandSwitzerland is a new market for this report, so no growth figures areavailable. The Classifieds & Directories market accounts for 38% oftotal online spend, the second highest proportion in Europe. Displayaccounts for 35%, and search 27%.
BelgiumBelgium devotes 10.6% of main media spend to online. Classifieds &Directories account for 37%, Search 36% and Display 28%.
AustriaAlthough Austria recorded the best growth rate in Western Europe, andthe second highest growth rate overall (14%), online still only accountsfor 7.5% of main media spend. Display is the dominant format (40%),followed by Search (33%) and Classifieds & Directories (20%).
Regional and country detailWestern Europe
2009 Online Ad Spend €384 m2008-2009 online ad spend growth 2%2009 main media spend (WARC) €1,507Online as a proportion of main media spend (WARC) 25.5%
2009 Online Ad Spend €182 m2008-2009 online ad spend growth 4.4%2009 main media spend (WARC) €1,296 mOnline as a proportion of main media spend (WARC) 14%
2009 Online Ad Spend €355 m2009 main media spend (WARC) €2,531 mOnline as a proportion of main media spend (WARC) 14%
2009 Online Ad Spend €97.2 m
2009 Online Ad Spend €228 m2008-2009 online ad spend growth 14%2009 main media spend (WARC) €3,039 mOnline as a proportion of main media spend (WARC) 7.5%
2009 Online Ad Spend €293 m2008-2009 online ad spend growth 4.6%2009 main media spend (WARC) €2,753 mOnline as a proportion of main media spend (WARC) 10.6%
2009 Online Ad Spend €69 m2008-2009 online ad spend growth 48.9%2009 main media spend (WARC) €1,654Online as a proportion of main media spend (WARC) 4.1%
IAB Europe AdEX 2009Published September 2010© IAB Europe
8/8/2019 AdEx 2009 - European online advertising expenditure
http://slidepdf.com/reader/full/adex-2009-european-online-advertising-expenditure 23/4123
M i l l i o n
E u r o s
DisplayClassifieds & DirectoriesSearchOther
Spend by format and by country: Central and Eastern Europe
R u s s i a
P o l a n
d
T u r k e
y
H u n g a r y
B u l g a r i a
S l o v a k i a
S l o v e n i a
C r o a
t i a
R o m a
n i a
Source: IAB Europe/Screen Digest ©
Other
Search
Classifieds
Display
€ 255.5
€ 84.2
€ 174.1
€ 8.4
€ 82.4
€ 47.0
€ 158.4
€ 53.8
€ 29.8
€ 36.8
€ 4.7
€ 18.5
€ 12.4
€ 49.1
€ 6.6
€ 4.0
€ 14.0
€ 3.8
€ 5.2
€ 15.3
€ 0.9
€ 4.5
€ 1.2
€ 14.0
€ 5.0
€ 4.0
€ 5.7
€ 0.2
€ 0.6
€ 0.01
€ 12.3
0
100
200
300
400
500
600
Poland
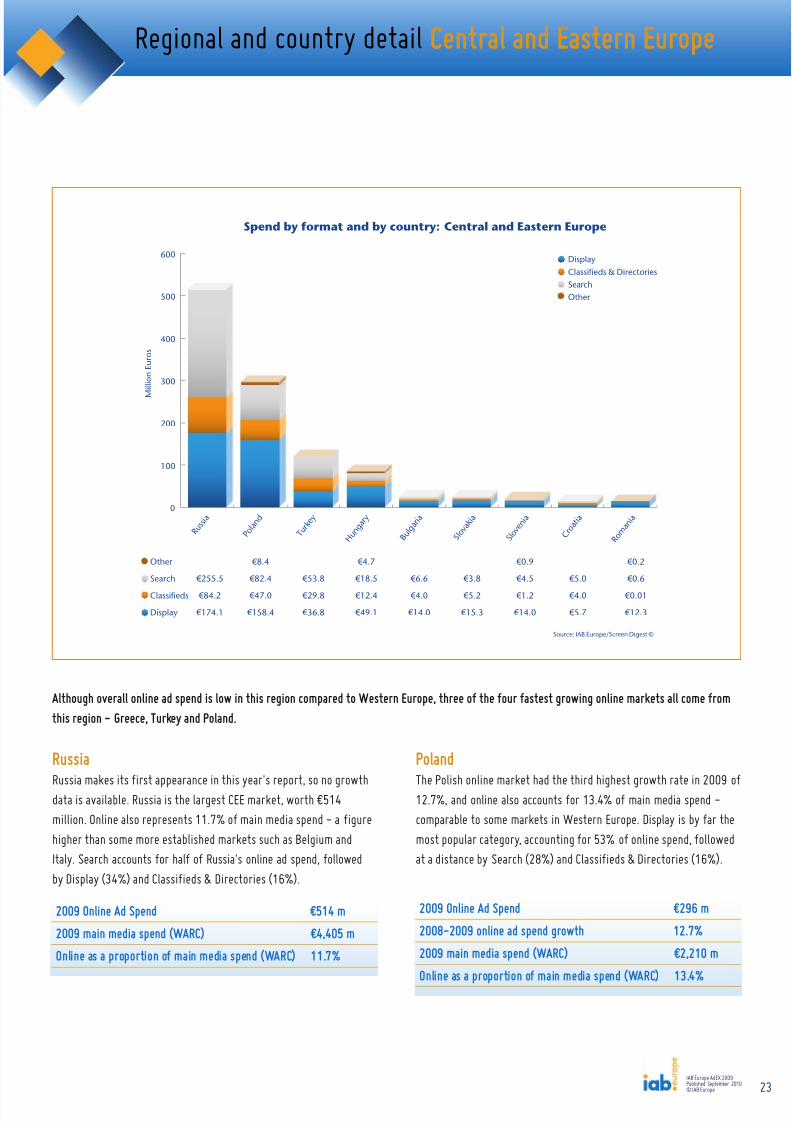
The Polish online market had the third highest growth rate in 2009 12.7%, and online also accounts for 13.4% of main media spend -comparable to some markets in Western Europe. Display is by far tmost popular category, accounting for 53% of online spend, followat a distance by Search (28%) and Classifieds & Directories (16%)
Russia
Russia makes its first appearance in this year's report, so no growthdata is available. Russia is the largest CEE market, worth €514million. Online also represents 11.7% of main media spend - a figurehigher than some more established markets such as Belgium andItaly. Search accounts for half of Russia's online ad spend, followedby Display (34%) and Classifieds & Directories (16%).
Regional and country detailCentral and Eastern Europe
2009 Online Ad Spend €514 m2009 main media spend (WARC) €4,405 mOnline as a proportion of main media spend (WARC) 11.7%
2009 Online Ad Spend €296 m2008-2009 online ad spend growth 12.7%2009 main media spend (WARC) €2,210 m
Online as a proportion of main media spend (WARC) 13.4%
Although overall online ad spend is low in this region compared to Western Europe, three of the four fastest growing online marketthis region - Greece, Turkey and Poland.
IAB Europe AdEX 2009Published September 2010© IAB Europe
8/8/2019 AdEx 2009 - European online advertising expenditure
http://slidepdf.com/reader/full/adex-2009-european-online-advertising-expenditure 24/4124
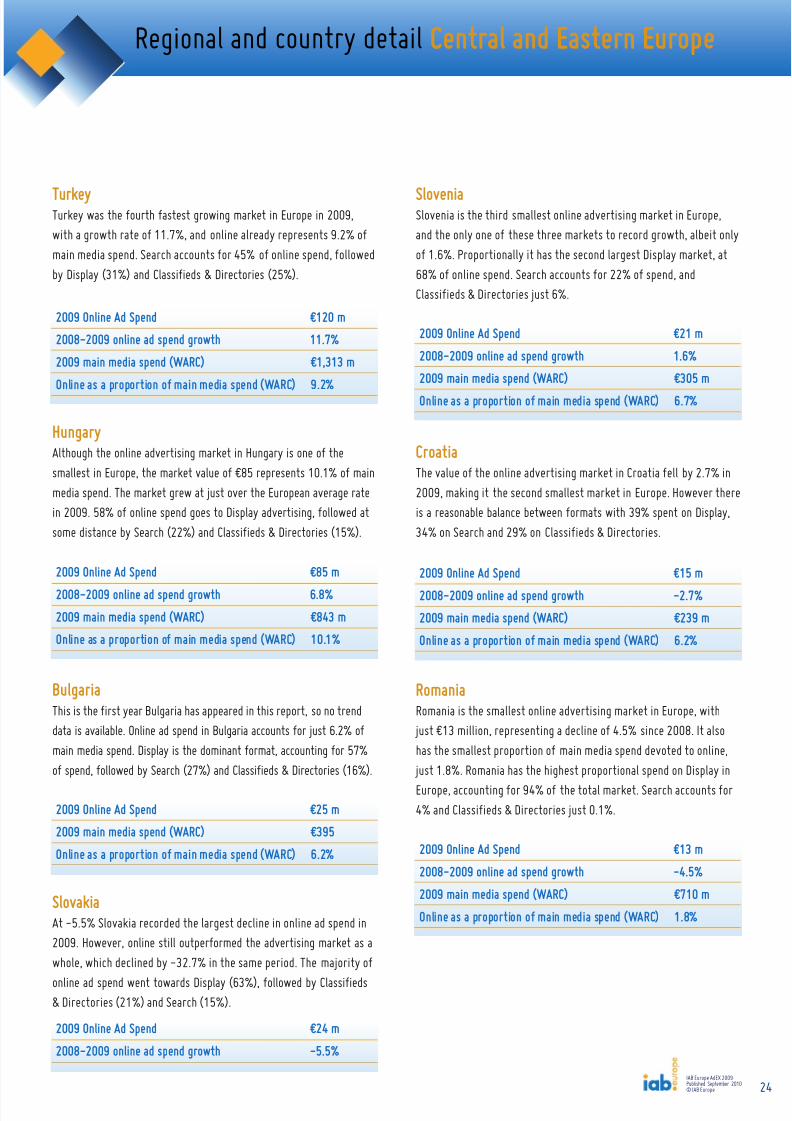
SloveniaSlovenia is the third smallest online advertising market in Europe,and the only one of these three markets to record growth, albeit onlof 1.6%. Proportionally it has the second largest Display market, at68% of online spend. Search accounts for 22% of spend, andClassifieds & Directories just 6%.
CroatiaThe value of the online advertising market in Croatia fell by 2.7% 2009, making it the second smallest market in Europe. However this a reasonable balance between formats with 39% spent on Display34% on Search and 29% on Classifieds & Directories.
RomaniaRomania is the smallest online advertising market in Europe, with just €13 million, representing a decline of 4.5% since 2008. It alsohas the smallest proportion of main media spend devoted to online, just 1.8%. Romania has the highest proportional spend on Display Europe, accounting for 94% of the total market. Search accounts fo4% and Classifieds & Directories just 0.1%.
TurkeyTurkey was the fourth fastest growing market in Europe in 2009,with a growth rate of 11.7%, and online already represents 9.2% ofmain media spend. Search accounts for 45% of online spend, followedby Display (31%) and Classifieds & Directories (25%).
HungaryAlthough the online advertising market in Hungary is one of thesmallest in Europe, the market value of €85 represents 10.1% of mainmedia spend. The market grew at just over the European average ratein 2009. 58% of online spend goes to Display advertising, followed atsome distance by Search (22%) and Classifieds & Directories (15%).
BulgariaThis is the first year Bulgaria has appeared in this report, so no trenddata is available. Online ad spend in Bulgaria accounts for just 6.2% ofmain media spend. Display is the dominant format, accounting for 57%of spend, followed by Search (27%) and Classifieds & Directories (16%).
Regional and country detailCentral and Eastern Europe
2009 Online Ad Spend €120 m2008-2009 online ad spend growth 11.7%2009 main media spend (WARC) €1,313 mOnline as a proportion of main media spend (WARC) 9.2%
2009 Online Ad Spend €25 m2009 main media spend (WARC) €395Online as a proportion of main media spend (WARC) 6.2%
2009 Online Ad Spend €85 m
2008-2009 online ad spend growth 6.8%2009 main media spend (WARC) €843 mOnline as a proportion of main media spend (WARC) 10.1%
2009 Online Ad Spend €24 m2008-2009 online ad spend growth -5.5%
2009 Online Ad Spend €21 m2008-2009 online ad spend growth 1.6%2009 main media spend (WARC) €305 mOnline as a proportion of main media spend (WARC) 6.7%
2009 Online Ad Spend €15 m2008-2009 online ad spend growth -2.7%2009 main media spend (WARC) €239 mOnline as a proportion of main media spend (WARC) 6.2%
IAB Europe AdEX 2009Published September 2010© IAB Europe
SlovakiaAt -5.5% Slovakia recorded the largest decline in online ad spend in2009. However, online still outperformed the advertising market as awhole, which declined by -32.7% in the same period. The majority of
online ad spend went towards Display (63%), followed by Classifieds& Directories (21%) and Search (15%).
2009 Online Ad Spend €13 m2008-2009 online ad spend growth -4.5%2009 main media spend (WARC) €710 mOnline as a proportion of main media spend (WARC) 1.8%
8/8/2019 AdEx 2009 - European online advertising expenditure
http://slidepdf.com/reader/full/adex-2009-european-online-advertising-expenditure 25/4125
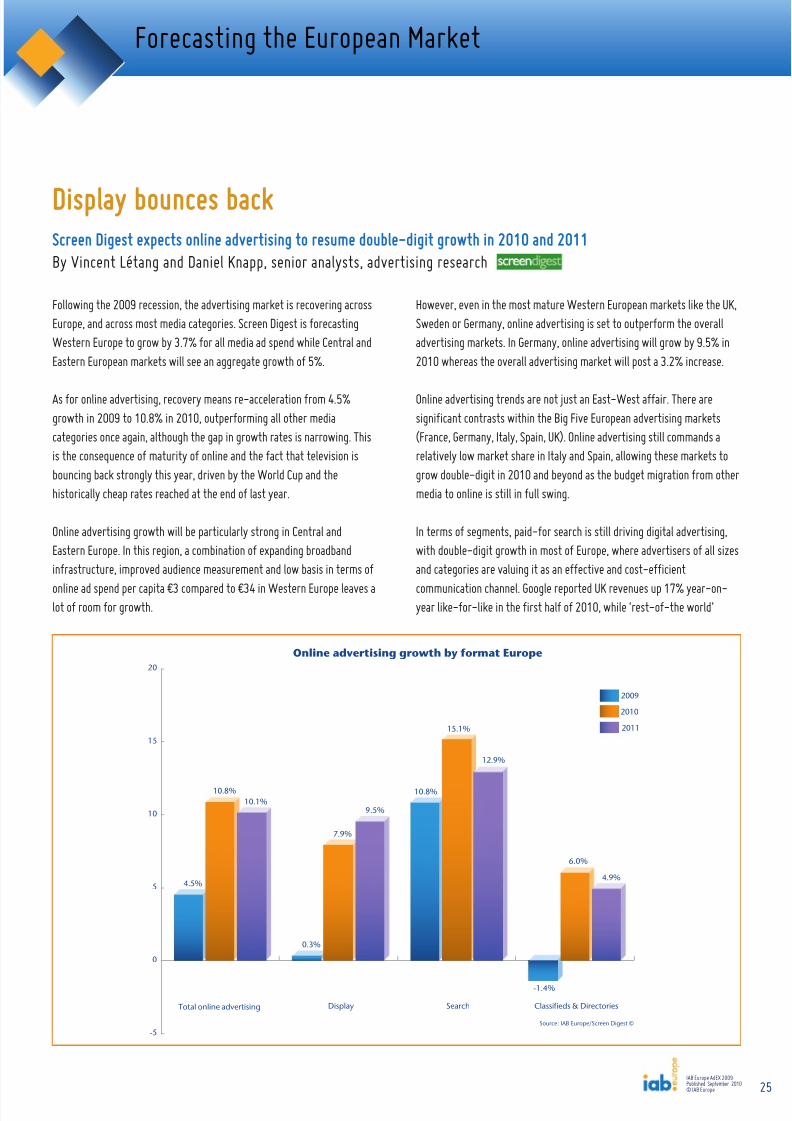
However, even in the most mature Western European markets like the USweden or Germany, online advertising is set to outperform the overalladvertising markets. In Germany, online advertising will grow by 9.5%2010 whereas the overall advertising market will post a 3.2% increase.
Online advertising trends are not just an East-West affair. There aresignificant contrasts within the Big Five European advertising markets(France, Germany, Italy, Spain, UK). Online advertising still commandrelatively low market share in Italy and Spain, allowing these markets tgrow double-digit in 2010 and beyond as the budget migration from otmedia to online is still in full swing.
In terms of segments, paid-for search is still driving digital advertising,with double-digit growth in most of Europe, where advertisers of all siand categories are valuing it as an effective and cost-efficient
communication channel. Google reported UK revenues up 17% year-oyear like-for-like in the first half of 2010, while ‘rest-of-the world’
Forecastingthe European Market
Screen Digest expects online advertising to resume double-digit growth in 2010 and 2011By Vincent Létang and Daniel Knapp, senior analysts, advertising research
Display bounces back
-5
0
5
10
15
20
2011
2010
2009
Classifieds & DirectoriesSearchDisplayTotal online advertising
Online advertising growth by format Europe
4.5%
10.8%10.1%
0.3%
7.9%
9.5%
10.8%
15.1%
12.9%
-1.4%
6.0%
4.9%
Source: IAB Europe/Screen Digest ©
IAB Europe AdEX 2009Published September 2010© IAB Europe
Following the 2009 recession, the advertising market is recovering acrossEurope, and across most media categories. Screen Digest is forecastingWestern Europe to grow by 3.7% for all media ad spend while Central andEastern European markets will see an aggregate growth of 5%.
As for online advertising, recovery means re-acceleration from 4.5%growth in 2009 to 10.8% in 2010, outperforming all other mediacategories once again, although the gap in growth rates is narrowing. Thisis the consequence of maturity of online and the fact that television isbouncing back strongly this year, driven by the World Cup and thehistorically cheap rates reached at the end of last year.
Online advertising growth will be particularly strong in Central andEastern Europe. In this region, a combination of expanding broadbandinfrastructure, improved audience measurement and low basis in terms of
online ad spend per capita €3 compared to €34 in Western Europe leaves alot of room for growth.
8/8/2019 AdEx 2009 - European online advertising expenditure
http://slidepdf.com/reader/full/adex-2009-european-online-advertising-expenditure 26/4126
Forecastingthe European Market
0
5
10
15
20
2011
2010
2009
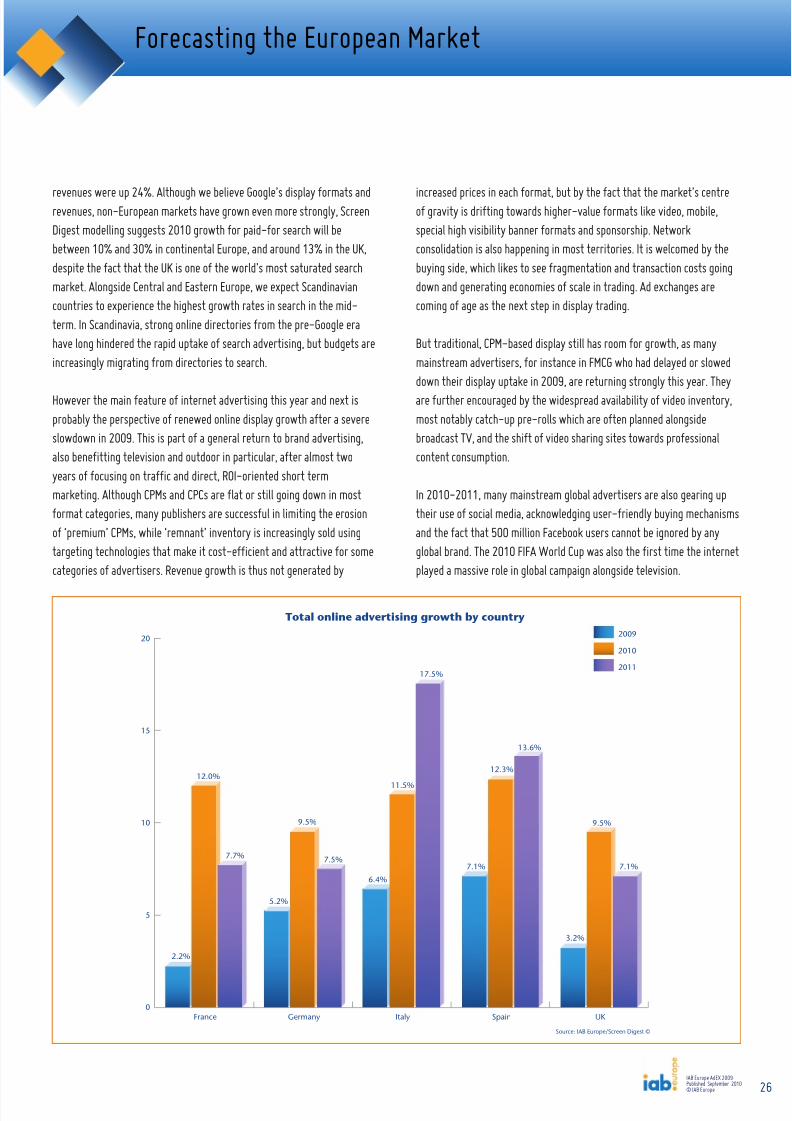
UKSpainItalyGermanyFrance
2.2%
7.7%
12.0%
Total online advertising growth by country
7.5%
9.5%
5.2%
3.2%
13.6%
12.3%
7.1%
17.5%
11.5%
6.4%
9.5%
7.1%
Source: IAB Europe/Screen Digest ©
revenues were up 24%. Although we believe Google’s display formats andrevenues, non-European markets have grown even more strongly, ScreenDigest modelling suggests 2010 growth for paid-for search will bebetween 10% and 30% in continental Europe, and around 13% in the UK,despite the fact that the UK is one of the world’s most saturated searchmarket. Alongside Central and Eastern Europe, we expect Scandinaviancountries to experience the highest growth rates in search in the mid-term. In Scandinavia, strong online directories from the pre-Google erahave long hindered the rapid uptake of search advertising, but budgets areincreasingly migrating from directories to search.
However the main feature of internet advertising this year and next isprobably the perspective of renewed online display growth after a severeslowdown in 2009. This is part of a general return to brand advertising,also benefitting television and outdoor in particular, after almost twoyears of focusing on traffic and direct, ROI-oriented short termmarketing. Although CPMs and CPCs are flat or still going down in mostformat categories, many publishers are successful in limiting the erosionof ‘premium’ CPMs, while ‘remnant’ inventory is increasingly sold usingtargeting technologies that make it cost-efficient and attractive for somecategories of advertisers. Revenue growth is thus not generated by
increased prices in each format, but by the fact that the market’s centreof gravity is drifting towards higher-value formats like video, mobile,special high visibility banner formats and sponsorship. Networkconsolidation is also happening in most territories. It is welcomed by thbuying side, which likes to see fragmentation and transaction costs goindown and generating economies of scale in trading. Ad exchanges arecoming of age as the next step in display trading.
But traditional, CPM-based display still has room for growth, as manymainstream advertisers, for instance in FMCG who had delayed or slowdown their display uptake in 2009, are returning strongly this year. Theare further encouraged by the widespread availability of video inventormost notably catch-up pre-rolls which are often planned alongsidebroadcast TV, and the shift of video sharing sites towards professionalcontent consumption.
In 2010-2011, many mainstream global advertisers are also gearing uptheir use of social media, acknowledging user-friendly buying mechaniand the fact that 500 million Facebook users cannot be ignored by anyglobal brand. The 2010 FIFA World Cup was also the first time the inteplayed a massive role in global campaign alongside television.
IAB Europe AdEX 2009Published September 2010© IAB Europe
8/8/2019 AdEx 2009 - European online advertising expenditure
http://slidepdf.com/reader/full/adex-2009-european-online-advertising-expenditure 27/4127
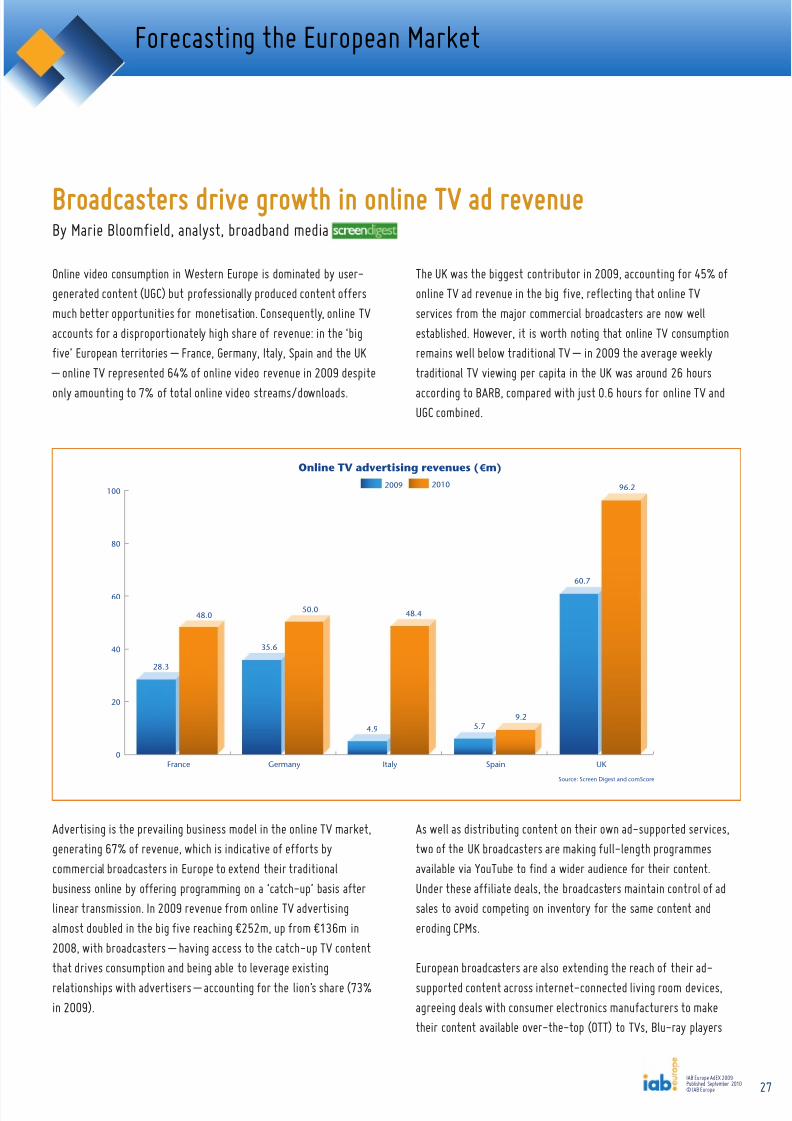
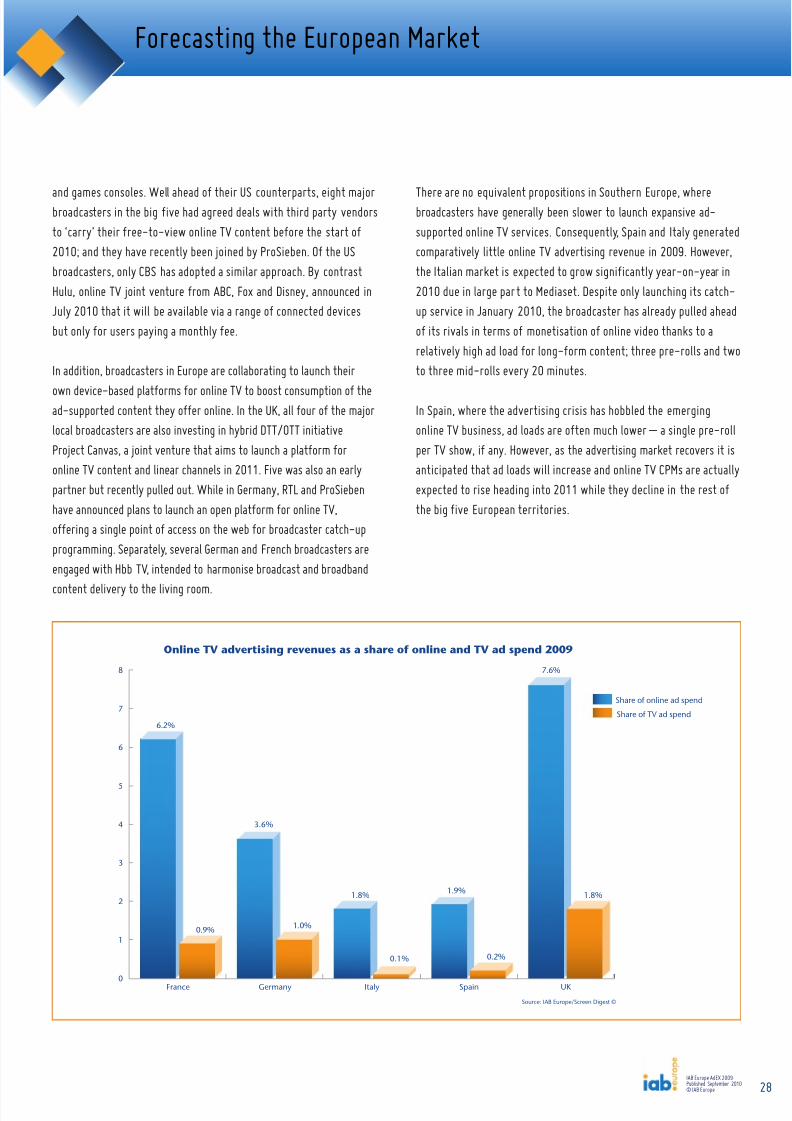
The UK was the biggest contributor in 2009, accounting for 45% oonline TV ad revenue in the big five, reflecting that online TVservices from the major commercial broadcasters are now wellestablished. However, it is worth noting that online TV consumptioremains well below traditional TV – in 2009 the average weeklytraditional TV viewing per capita in the UK was around 26 hours
according to BARB, compared with just 0.6 hours for online TV anUGC combined.
As well as distributing content on their own ad-supported services,two of the UK broadcasters are making full-length programmesavailable via YouTube to find a wider audience for their content.Under these affiliate deals, the broadcasters maintain control of adsales to avoid competing on inventory for the same content anderoding CPMs.
European broadcasters are also extending the reach of their ad-supported content across internet-connected living room devices,agreeing deals with consumer electronics manufacturers to maketheir content available over-the-top (OTT) to TVs, Blu-ray players
Online video consumption in Western Europe is dominated by user-generated content (UGC) but professionally produced content offersmuch better opportunities for monetisation. Consequently, online TVaccounts for a disproportionately high share of revenue: in the ‘bigfive’ European territories – France, Germany, Italy, Spain and the UK – online TV represented 64% of online video revenue in 2009 despite
only amounting to 7% of total online video streams/downloads.
Advertising is the prevailing business model in the online TV market,generating 67% of revenue, which is indicative of efforts bycommercial broadcasters in Europe to extend their traditionalbusiness online by offering programming on a ‘catch-up’ basis afterlinear transmission. In 2009 revenue from online TV advertisingalmost doubled in the big five reaching €252m, up from €136m in2008, with broadcasters – having access to the catch-up TV contentthat drives consumption and being able to leverage existingrelationships with advertisers – accounting for the lion’s share (73%in 2009).
Forecasting the European Market
By Marie Bloomfield, analyst, broadband mediaBroadcasters drive growth in online TV ad revenue
0
20
40
60
80
10020102009
UKSpainItalyGermanyFrance
28.3
48.0
35.6
50.0
4.9
48.4
5.79.2
60.7
96.2
Online TV advertising revenues ( € m)
Source: Screen Digest and comScore
IAB Europe AdEX 2009Published September 2010© IAB Europe
8/8/2019 AdEx 2009 - European online advertising expenditure
http://slidepdf.com/reader/full/adex-2009-european-online-advertising-expenditure 28/41
8/8/2019 AdEx 2009 - European online advertising expenditure
http://slidepdf.com/reader/full/adex-2009-european-online-advertising-expenditure 29/4129
has trouble exiting the lucrative messaging ditch it carved for itselfLG and Samsung will play it safe with multiple operating systems;as for Microsoft and Palm/HP, 2010 is about restructuring an offerrather than a power demonstration.
Operator’s practices with data charging must also be kept in check avoid bill shock. Operators still have to deal with the schizophreniaoffering powerful advertising solutions and respecting the users’permissions/privacy/preferences. With search firmly within thegrasp of online incumbents and display following the same path,messaging remains a great opportunity for operators. However theyneed to work on allowing their inventories to open up, sinceadvertisers usually avoid dealing with operator fragmentation. In thlight, infrastructure vendors might have a substantial opportunity ifthey offer operators the right tools.
The year ahead promises more of the same consolidation, growth amaturation. We can expect operators and tech companies to keep onpreparing for the significant growth ahead, and mobile to integratefurther into advertisers’ digital advertising arsenal.
From a demand side perspective, the smartphone environment isbringing scale, creativity and usability. On top of being a great channfor CRM and social media and a return-channel for other media(typically TV), mobile advertising is now establishing itself in the
display and search environment. Some challenges remain however:fragmentation of standards and currencies; absence of independentthird-party ad-serving and reliance on operators for data and campaigreporting. In terms of audience measurement, the deal betweencomScore and GSMA to aggregate operators’ data on mobile internusage is a major breakthrough but it only applies in the UK so far.
The past 12 months have paved the way for a maturing period in mobile advertising. Can everyone win?
If there were any doubts last year about the strategic importance ofmobile in the future of advertising, they were most likely wiped clean
after the market events of the past 12 months.
After an important peak in funding in 2008, 2009 was more aboutventure exits and bigger players making their moves. Between July 2009and June 2010, mobile advertising saw at least 28 acquisition deals,twice the number of deals for the previous 12 months. If Google(AdMob) and Apple (Quattro Wireless) stood out, we should alsomention companies such as Orange (Unanimis), Nokia (Acuity Mobile) orVelti (Media Cannon) who were active and will likely continue to be so.
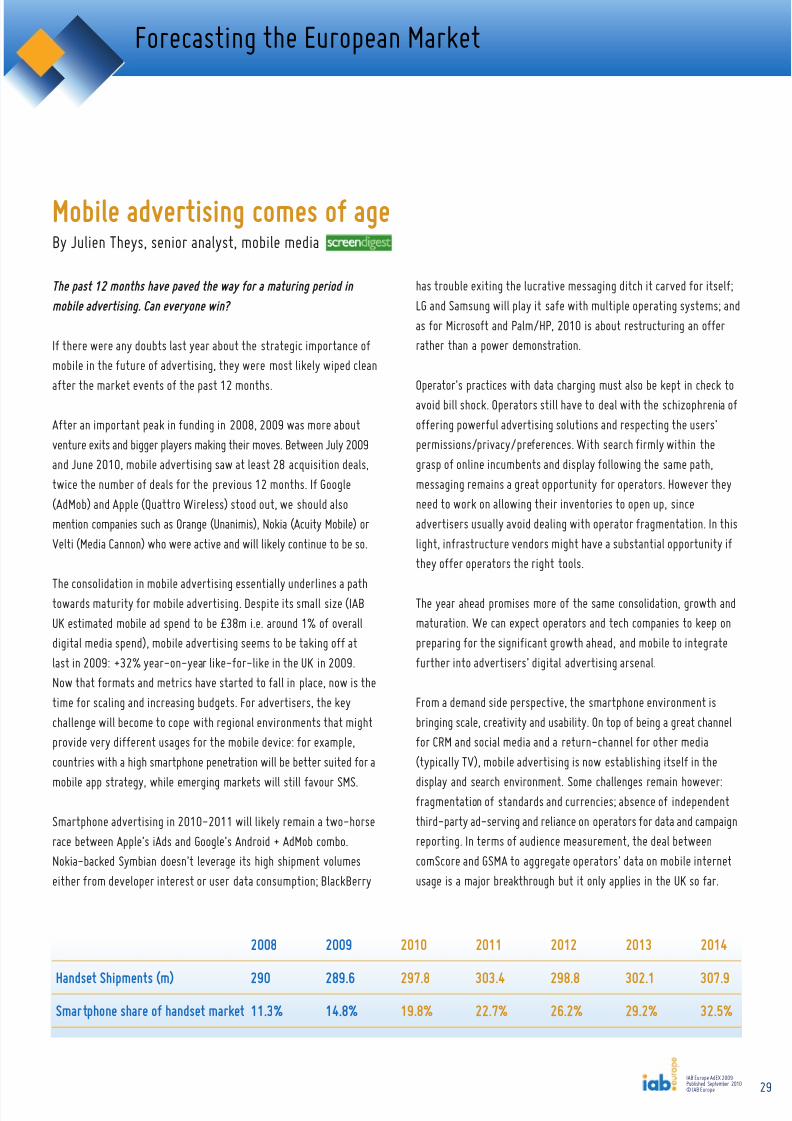
The consolidation in mobile advertising essentially underlines a pathtowards maturity for mobile advertising. Despite its small size (IABUK estimated mobile ad spend to be £38m i.e. around 1% of overalldigital media spend), mobile advertising seems to be taking off atlast in 2009: +32% year-on-year like-for-like in the UK in 2009.Now that formats and metrics have started to fall in place, now is thetime for scaling and increasing budgets. For advertisers, the keychallenge will become to cope with regional environments that mightprovide very different usages for the mobile device: for example,countries with a high smartphone penetration will be better suited for a
mobile app strategy, while emerging markets will still favour SMS.
Smartphone advertising in 2010-2011 will likely remain a two-horserace between Apple’s iAds and Google’s Android + AdMob combo.Nokia-backed Symbian doesn’t leverage its high shipment volumeseither from developer interest or user data consumption; BlackBerry
Forecastingthe European Market
By Julien Theys, senior analyst, mobile mediaMobile advertising comes of age
2008 2009 2010 2011 2012 2013 2014
Handset Shipments (m) 290 289.6 297.8 303.4 298.8 302.1 307.9Smartphone share of handset market 11.3% 14.8%19.8% 22.7% 26.2% 29.2% 32.5%
IAB Europe AdEX 2009Published September 2010© IAB Europe
8/8/2019 AdEx 2009 - European online advertising expenditure
http://slidepdf.com/reader/full/adex-2009-european-online-advertising-expenditure 30/4130
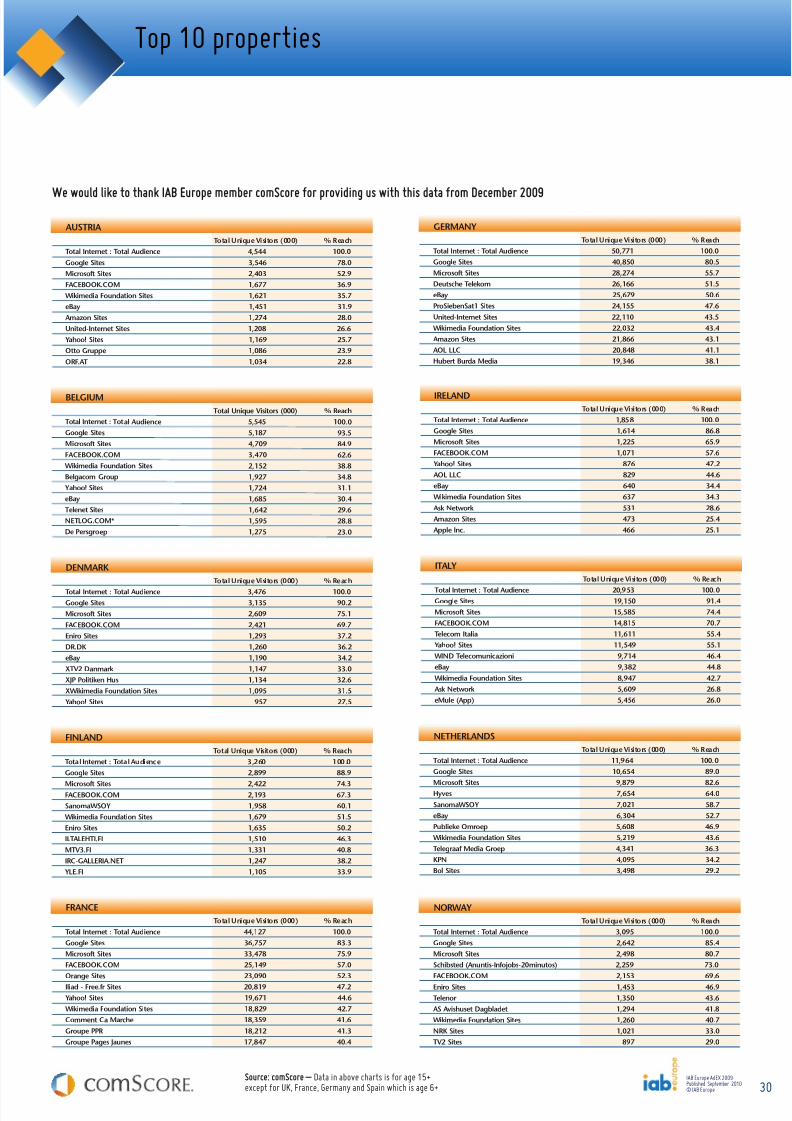
We would like to thank IAB Europe member comScore for providing us with this data from December 2009
Top 10 properties
Total Unique Visitors (000) % ReachTotal Internet : Total Audience 4,544 100.0Google Sites 3,546 78.0Microsoft Sites 2,403 52.9FACEBOOK.COM 1,677 36.9Wikimedia Foundation Sites 1,621 35.7eBay 1,451 31.9Amazon Sites 1,274 28.0United-Internet Sites 1,208 26.6Yahoo! Sites 1,169 25.7Otto Gruppe 1,086 23.9ORF.AT 1,034 22.8
AUSTRIATotal Unique Visitors (000) % Reach
Total Internet : Total Audience 50,771 100.0Google Sites 40,850 80.5Microsoft Sites 28,274 55.7Deutsche Telekom 26,166 51.5eBay 25,679 50.6ProSiebenSat1 Sites 24,155 47.6United-Internet Sites 22,110 43.5Wikimedia Foundation Sites 22,032 43.4Amazon Sites 21,866 43.1AOL LLC 20,848 41.1Hubert Burda Media 19,346 38.1
GERMANY
Total Unique Visitors (000) % ReachTota l Internet : Tot al Audience 5,545 10 0.0Google Site s 5,187 93.5Microsoft Sites 4,709 84.9FACEBOOK.COM 3,470 62.6Wikimedia Foundation Sites 2,152 38.8Belgacom Group 1,927 34.8Yahoo! Sites 1,724 31.1eBay 1,685 30 .4Telenet Sites 1,642 29.6NETLOG.COM* 1,595 28 .8De Persgro ep 1,275 23.0
BELGIUM
Total Unique Visitors (000) % ReachTotal Internet : Total Audience 1,858 100.0Google Sites 1,614 86.8Microsoft Sites 1,225 65.9FACEBOOK.COM 1,071 57.6Yahoo! Sites 876 47.2AOL LLC 829 44.6eBay 640 34.4Wikimedia Foundation Sites 637 34.3Ask Network 531 28.6Amazon Sites 473 25.4Apple Inc. 466 25.1
IRELAND
Total Unique Visitors (000) % ReachTotal Internet : Total Audience 3,476 100.0Google Sites 3,135 90.2Microsoft Sites 2,609 75.1FACEBOOK.COM 2,421 69.7Eniro Sites 1,293 37.2DR.DK 1,260 36.2eBay 1,190 34.2XTV2 Danmark 1,147 33.0XJP Politiken Hus 1,134 32.6XWikimedia Foundation Sites 1,095 31.5Yahoo! Sites 957 27.5
DENMARKTotal Unique Visitors (000) % Reach
Total Internet : Total Audience 20,953 100.0Google Sites 19,150 91.4Microsoft Sites 15,585 74.4FACEBOOK.COM 14,815 70.7Telecom Italia 11,611 55.4Yahoo! Sites 11,549 55.1WIND Telecomunicazioni 9,714 46.4eBay 9,382 44.8Wikimedia Foundation Sites 8,947 42.7Ask Network 5,609 26.8eMule (App) 5,456 26.0
ITALY
Total Unique Visitors (000) % ReachTotal Internet : Total Audience 3,260 100.0Google Sites 2,899 88.9
Microsoft Sites 2,422 74.3FACEBOOK.COM 2,193 67.3SanomaWSOY 1,958 60.1Wikimedia Foundation Sites 1,679 51.5Eniro Sites 1,635 50.2ILTALEHTI.FI 1,510 46.3MTV3.FI 1,331 40.8IRC-GALLERIA.NET 1,247 38.2YLE.FI 1,105 33.9
FINLAND
Total Unique Visitors (000) % ReachTotal Internet : Total Audience 44,127 100.0Google Sites 36,757 83.3Microsoft Sites 33,478 75.9FACEBOOK.COM 25,149 57.0Orange Sites 23,090 52.3Iliad - Free.fr Sites 20,819 47.2Yahoo! Sites 19,671 44.6Wikimedia Foundation Sites 18,829 42.7Comment Ca Marche 18,359 41.6Groupe PPR 18,212 41.3Groupe Pages Jaunes 17,847 40.4
FRANCE
Total Unique Visitors (000) % ReachTotal Internet : Total Audience 11,964 100.0Google Sites 10,654 89.0
Microsoft Sites 9,879 82.6Hyves 7,654 64.0SanomaWSOY 7,021 58.7eBay 6,304 52.7Publieke Omroep 5,608 46.9Wikimedia Foundation Sites 5,219 43.6Telegraaf Media Groep 4,341 36.3KPN 4,095 34.2Bol Sites 3,498 29.2
NETHERLANDS
Total Unique Visitors (000) % ReachTotal Internet : Total Audience 3,095 100.0Google Sites 2,642 85.4Microsoft Sites 2,498 80.7Schibsted (Anuntis-Infojobs-20minutos) 2,259 73.0FACEBOOK.COM 2,153 69.6Eniro Sites 1,453 46.9Telenor 1,350 43.6AS Avishuset Dagbladet 1,294 41.8Wikimedia Foundation Sites 1,260 40.7NRK Sites 1,021 33.0TV2 Sites 897 29.0
NORWAY
IAB Europe AdEX 2009Published September 2010© IAB Europe
Source: comScore – Data in above charts is for age 15+except for UK, France, Germany and Spain which is age 6+
8/8/2019 AdEx 2009 - European online advertising expenditure
http://slidepdf.com/reader/full/adex-2009-european-online-advertising-expenditure 31/412531
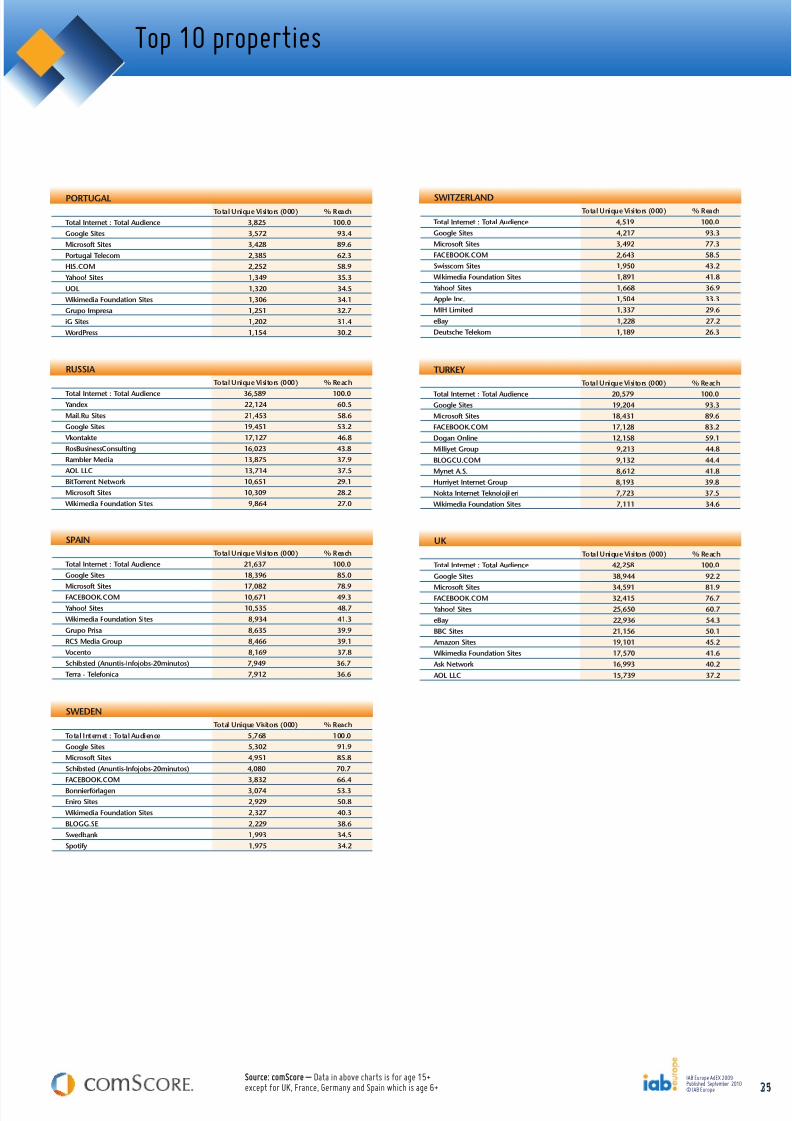
Top 10 properties
Total Unique Visitors (000) % ReachTotal Internet : Total Audience 21,637 100.0Google Sites 18,396 85.0
Microsoft Sites 17,082 78.9FACEBOOK.COM 10,671 49.3Yahoo! Sites 10,535 48.7Wikimedia Foundation Sites 8,934 41.3Grupo Prisa 8,635 39.9RCS Media Group 8,466 39.1Vocento 8,169 37.8Schibsted (Anuntis-Infojobs-20minutos) 7,949 36.7Terra - Telefonica 7,912 36.6
SPAIN
Total Unique Visitors (000) % ReachTotal Internet : Total Audience 5,768 100.0Google Sites 5,302 91.9Microsoft Sites 4,951 85.8Schibsted (Anuntis-Infojobs-20minutos) 4,080 70.7FACEBOOK.COM 3,832 66.4Bonnierförlagen 3,074 53.3Eniro Sites 2,929 50.8Wikimedia Foundation Sites 2,327 40.3BLOGG.SE 2,229 38.6Swedbank 1,993 34.5Spotify 1,975 34.2
SWEDEN
Total Unique Visitors (000) % ReachTotal Internet : Total Audience 4,519 100.0Google Sites 4,217 93.3Microsoft Sites 3,492 77.3FACEBOOK.COM 2,643 58.5Swisscom Sites 1,950 43.2Wikimedia Foundation Sites 1,891 41.8Yahoo! Sites 1,668 36.9Apple Inc. 1,504 33.3MIH Limited 1,337 29.6eBay 1,228 27.2Deutsche Telekom 1,189 26.3
SWITZERLAND
Total Unique Visitors (000) % Reach
Total Internet : Total Audience 20,579 100.0Google Sites 19,204 93.3Microsoft Sites 18,431 89.6FACEBOOK.COM 17,128 83.2Dogan Online 12,158 59.1Milliyet Group 9,213 44.8BLOGCU.COM 9,132 44.4Mynet A.S. 8,612 41.8Hurriyet Internet Group 8,193 39.8Nokta Internet Teknolojileri 7,723 37.5Wikimedia Foundation Sites 7,111 34.6
TURKEY
Total Unique Visitors (000) % ReachTotal Internet : Total Audience 3,825 100.0Google Sites 3,572 93.4Microsoft Sites 3,428 89.6Portugal Telecom 2,385 62.3HI5.COM 2,252 58.9Yahoo! Sites 1,349 35.3UOL 1,320 34.5Wikimedia Foundation Sites 1,306 34.1Grupo Impresa 1,251 32.7iG Sites 1,202 31.4WordPress 1,154 30.2
PORTUGAL
Total Unique Visitors (000) % Reach
Total Internet : Total Audience 36,589 100.0Yandex 22,124 60.5Mail.Ru Sites 21,453 58.6Google Sites 19,451 53.2Vkontakte 17,127 46.8RosBusinessConsulting 16,023 43.8Rambler Media 13,875 37.9AOL LLC 13,714 37.5BitTorrent Network 10,651 29.1Microsoft Sites 10,309 28.2Wikimedia Foundation Sites 9,864 27.0
RUSSIA
Total Unique Visitors (000) % ReachTotal Internet : Total Audience 42,258 100.0Google Sites 38,944 92.2
Microsoft Sites 34,591 81.9FACEBOOK.COM 32,415 76.7Yahoo! Sites 25,650 60.7eBay 22,936 54.3BBC Sites 21,156 50.1Amazon Sites 19,101 45.2Wikimedia Foundation Sites 17,570 41.6Ask Network 16,993 40.2AOL LLC 15,739 37.2
UK
IAB Europe AdEX 2009Published September 2010© IAB Europe
Source: comScore – Data in above charts is for age 15+except for UK, France, Germany and Spain which is age 6+
8/8/2019 AdEx 2009 - European online advertising expenditure
http://slidepdf.com/reader/full/adex-2009-european-online-advertising-expenditure 32/412632
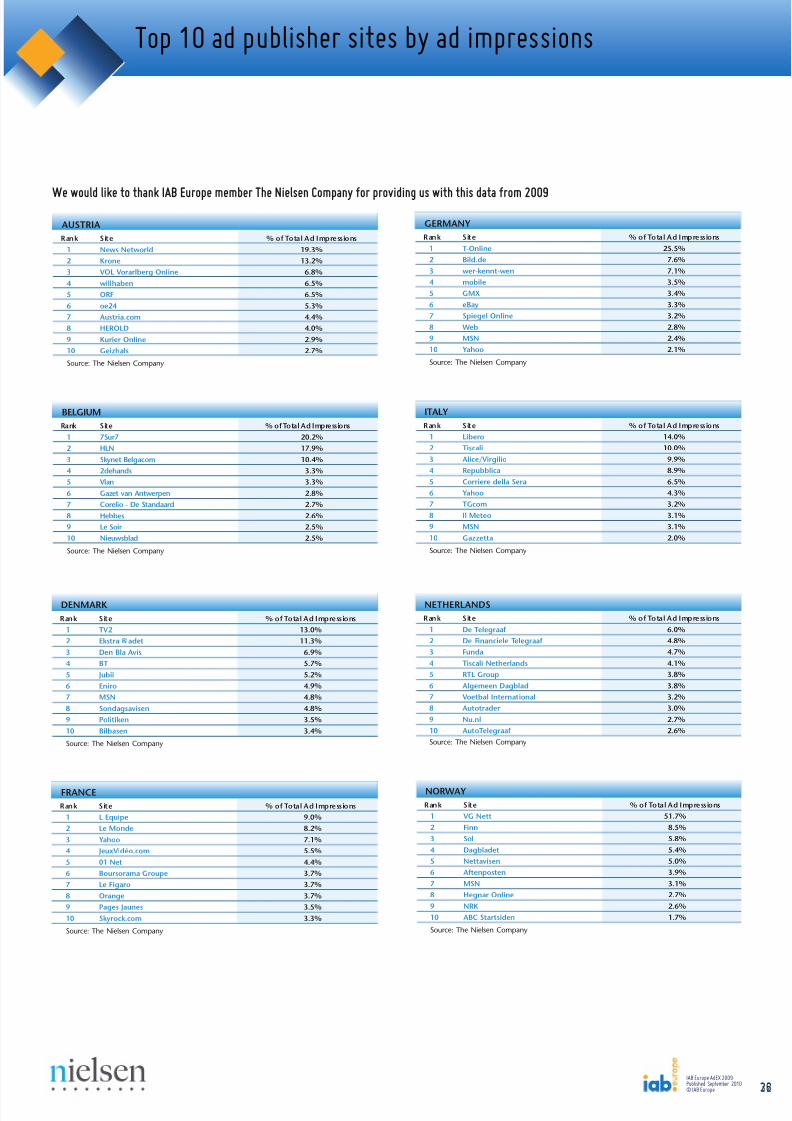
We would like to thank IAB Europe member The Nielsen Company for providing us with this data from 2009
Top 10 ad publisher sites by ad impressions
Rank Site % of Total Ad Impressions1 News Networld 19.3%2 Krone 13.2%3 VOL Vorarlberg Online 6.8%4 willhaben 6.5%5 ORF 6.5%6 oe24 5.3%7 Austria.com 4.4%8 HEROLD 4.0%9 Kurier Online 2.9%10 Geizhals 2.7%
Source: The Nielsen Company
AUSTRIARank Site % of Total Ad Impressions
1 T-Online 25.5%2 Bild.de 7.6%3 wer-kennt-wen 7.1%4 mobile 3.5%5 GMX 3.4%6 eBay 3.3%7 Spiegel Online 3.2%8 Web 2.8%9 MSN 2.4%10 Yahoo 2.1%
Source: The Nielsen Company
GERMANY
Rank Site % of Total Ad Impressions1 7Sur7 20.2%2 HLN 17.9%3 Skynet Belgacom 10.4%4 2dehands 3.3%5 Vlan 3.3%6 Gazet van Antwerpen 2.8%7 Corelio - De Standaard 2.7%8 Hebbes 2.6%9 Le Soir 2.5%10 Nieuwsblad 2.5%
Source: The Nielsen Company
BELGIUMRank Site % of Total Ad Impressions
1 Libero 14.0%2 Tiscali 10.0%3 Alice/Virgilio 9.9%4 Repubblica 8.9%5 Corriere della Sera 6.5%6 Yahoo 4.3%7 TGcom 3.2%8 Il Meteo 3.1%9 MSN 3.1%10 Gazzetta 2.0%
Source: The Nielsen Company
ITALY
Rank Site % of Total Ad Impressions1 TV2 13.0%2 Ekstra Bladet 11.3%3 Den Bla Avis 6.9%4 BT 5.7%5 Jubii 5.2%6 Eniro 4.9%7 MSN 4.8%8 Sondagsavisen 4.8%9 Politiken 3.5%10 Bilbasen 3.4%
Source: The Nielsen Company
DENMARKRank Site % of Total Ad Impressions
1 De Telegraaf 6.0%2 De Financiele Telegraaf 4.8%3 Funda 4.7%4 Tiscali Netherlands 4.1%5 RTL Group 3.8%6 Algemeen Dagblad 3.8%7 Voetbal International 3.2%8 Autotrader 3.0%9 Nu.nl 2.7%10 AutoTelegraaf 2.6%Source: The Nielsen Company
NETHERLANDS
Rank Site % of Total Ad Impressions1 L Equipe 9.0%2 Le Monde 8.2%3 Yahoo 7.1%4 JeuxVidéo.com 5.5%5 01 Net 4.4%6 Boursorama Groupe 3.7%7 Le Figaro 3.7%8 Orange 3.7%9 Pages Jaunes 3.5%10 Skyrock.com 3.3%
Source: The Nielsen Company
FRANCE
IAB Europe AdEX 2009Published September 2010© IAB Europe
Rank Site % of Total Ad Impressions1 VG Nett 51.7%2 Finn 8.5%3 Sol 5.8%4 Dagbladet 5.4%5 Nettavisen 5.0%6 Aftenposten 3.9%7 MSN 3.1%8 Hegnar Online 2.7%9 NRK 2.6%10 ABC Startsiden 1.7%
Source: The Nielsen Company
NORWAY
8/8/2019 AdEx 2009 - European online advertising expenditure
http://slidepdf.com/reader/full/adex-2009-european-online-advertising-expenditure 33/4133
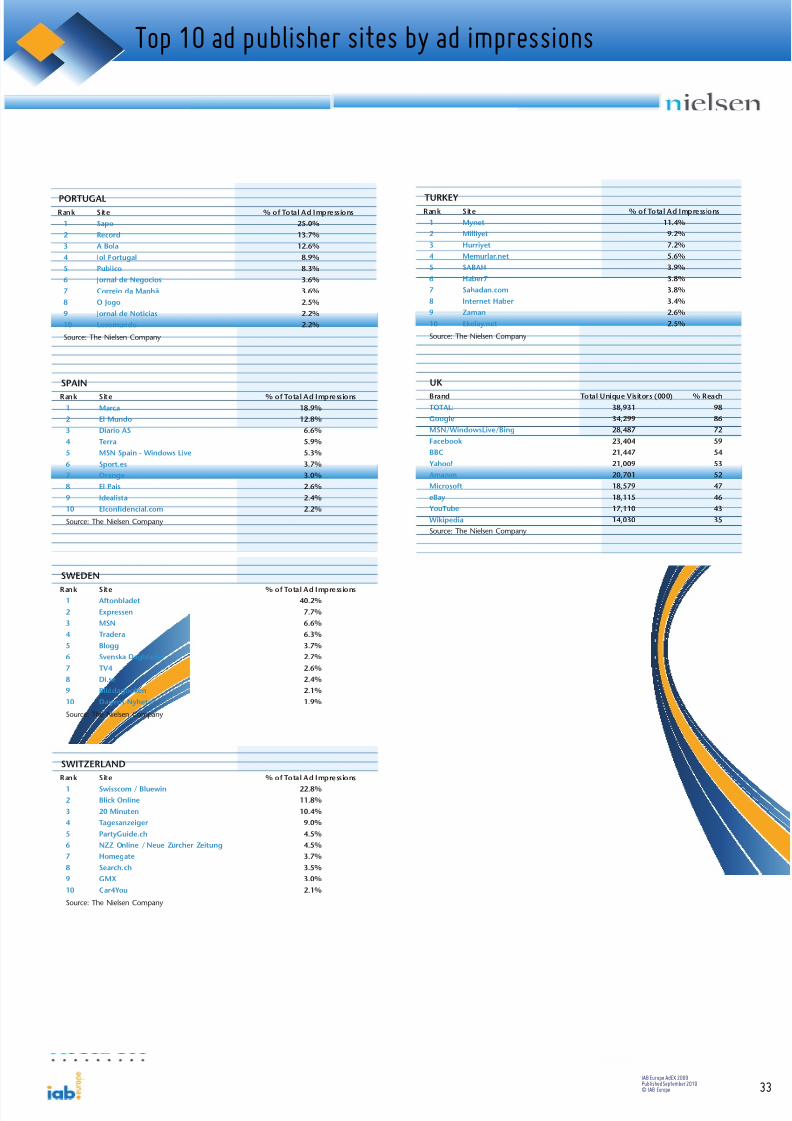
Top 10 ad publisher sites by ad impressions
Rank Site % of Total Ad Impressions1 Mynet 11.4%2 Milliyet 9.2%3 Hurriyet 7.2%4 Memurlar.net 5.6%5 SABAH 3.9%6 Haber7 3.8%7 Sahadan.com 3.8%8 Internet Haber 3.4%9 Zaman 2.6%10 Ekolay.net 2.5%
Source: The Nielsen Company
TURKEYRank Site % of Total Ad Impressions
1 Sapo 25.0%2 Record 13.7%3 A Bola 12.6%4 Iol Portugal 8.9%5 Publico 8.3%6 Jornal de Negocios 3.6%7 Correio da Manhã 3.6%8 O Jogo 2.5%9 Jornal de Noticias 2.2%10 Losomundo 2.2%
Source: The Nielsen Company
PORTUGAL
Rank Site % of Total Ad Impressions1 Marca 18.9%2 El Mundo 12.8%3 Diario AS 6.6%4 Terra 5.9%5 MSN Spain - Windows Live 5.3%6 Sport.es 3.7%7 Orange 3.0%8 El Pais 2.6%9 Idealista 2.4%10 Elconfidencial.com 2.2%
Source: The Nielsen Company
SPAIN
Rank Site % of Total Ad Impressions1 Aftonbladet 40.2%2 Expressen 7.7%3 MSN 6.6%4 Tradera 6.3%5 Blogg 3.7%6 Svenska Dagbladet 2.7%7 TV4 2.6%8 Di.se 2.4%9 Bilddagboken 2.1%10 Dagens Nyheter 1.9%
Source: The Nielsen Company
SWEDEN
Rank Site % of Total Ad Impressions1 Swisscom / Bluewin 22.8%2 Blick Online 11.8%3 20 Minuten 10.4%4 Tagesanzeiger 9.0%5 PartyGuide.ch 4.5%6 NZZ Online / Neue Zürcher Zeitung 4.5%7 Homegate 3.7%8 Search.ch 3.5%9 GMX 3.0%10 Car4You 2.1%
Source: The Nielsen Company
SWITZERLAND
IAB Europe AdEX 2009Published September 2010© IAB Europe
Brand Total Unique Visitors (000) % ReachTOTAL: 38,931 98Google 34,299 86MSN/WindowsLive/Bing 28,487 72Facebook 23,404 59BBC 21,447 54Yahoo! 21,009 53Amazon 20,701 52Microsoft 18,579 47eBay 18,115 46YouTube 17,110 43Wikipedia 14,030 35Source: The Nielsen Company
UK
8/8/2019 AdEx 2009 - European online advertising expenditure
http://slidepdf.com/reader/full/adex-2009-european-online-advertising-expenditure 34/41
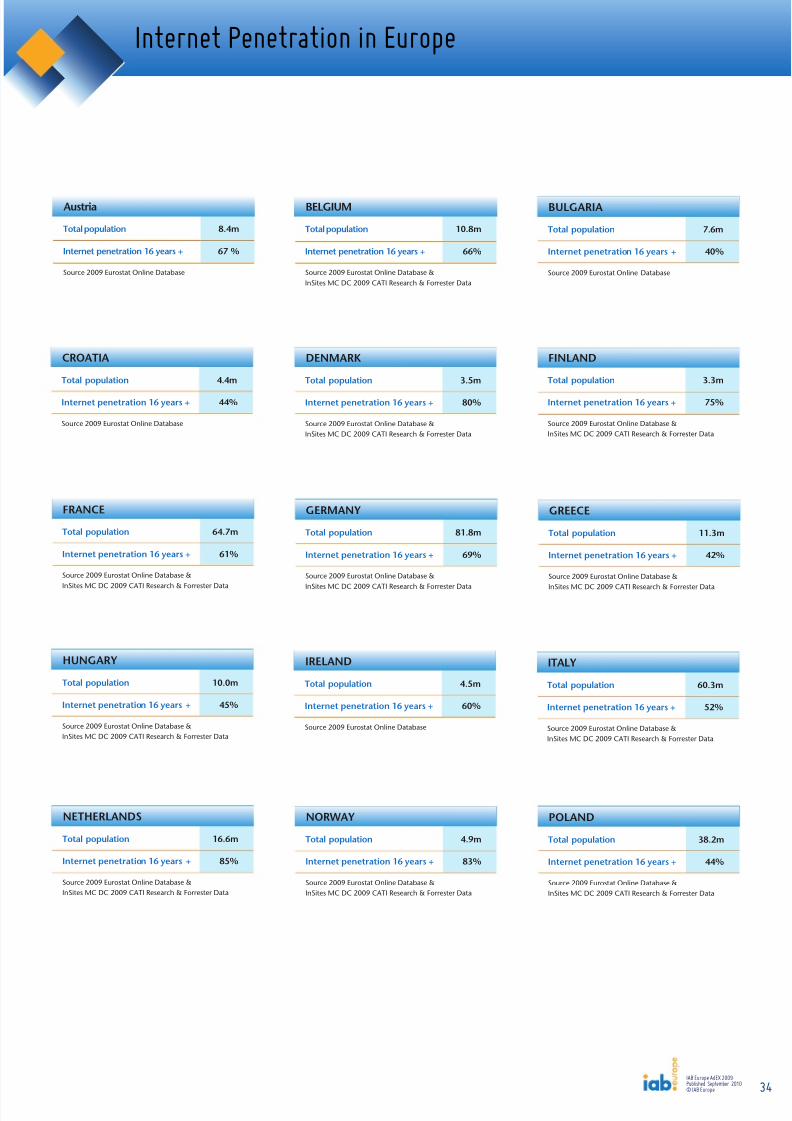
Internet Penetration in Europe
Total population 8.4m
Internet penetration 16 years + 67 %
Source 2009 Eurostat Online Database
Austria
Total population 10.8m
Internet penetration 16 years + 66%
Source 2009 Eurostat Online Database &
InSites MC DC 2009 CATI Research & Forrester Data
BELGIUM
Total population 7.6m
Internet penetration 16 years + 40%
Source 2009 Eurostat Online Database
BULGARIA
Total population 3.5m
Internet penetration 16 years + 80%
Source 2009 Eurostat Online Database &
InSites MC DC 2009 CATI Research & Forrester Data
DENMARK
Total population 3.3m
Internet penetration 16 years + 75%
Source 2009 Eurostat Online Database &
InSites MC DC 2009 CATI Research & Forrester Data
FINLAND
Total population 64.7m
Internet penetration 16 years + 61%
Source 2009 Eurostat Online Database &
InSites MC DC 2009 CATI Research & Forrester Data
FRANCE
Total population 81.8m
Internet penetration 16 years + 69%
Source 2009 Eurostat Online Database &
InSites MC DC 2009 CATI Research & Forrester Data
GERMANY
Total population 11.3m
Internet penetration 16 years + 42%
Source 2009 Eurostat Online Database &
InSites MC DC 2009 CATI Research & Forrester Data
GREECE
Total population 10.0m
Internet penetration 16 years + 45%
Source 2009 Eurostat Online Database &
InSites MC DC 2009 CATI Research & Forrester Data
HUNGARY
Total population 4.5m
Internet penetration 16 years + 60%
Source 2009 Eurostat Online Database
IRELAND
Total population 60.3m
Internet penetration 16 years + 52%
Source 2009 Eurostat Online Database &
InSites MC DC 2009 CATI Research & Forrester Data
ITALY
Total population 16.6m
Internet penetration 16 years + 85%
Source 2009 Eurostat Online Database &
InSites MC DC 2009 CATI Research & Forrester Data
NETHERLANDS
Total population 4.9m
Internet penetration 16 years + 83%
Source 2009 Eurostat Online Database &
InSites MC DC 2009 CATI Research & Forrester Data
NORWAY
Total population 38.2m
Internet penetration 16 years + 44%
Source 2009 Eurostat Online Database &
InSites MC DC 2009 CATI Research & Forrester Data
POLAND
34IAB Europe AdEX 2009Published September 2010© IAB Europe
Total population 4.4m
Internet penetration 16 years + 44%
Source 2009 Eurostat Online Database
CROATIA
8/8/2019 AdEx 2009 - European online advertising expenditure
http://slidepdf.com/reader/full/adex-2009-european-online-advertising-expenditure 35/41
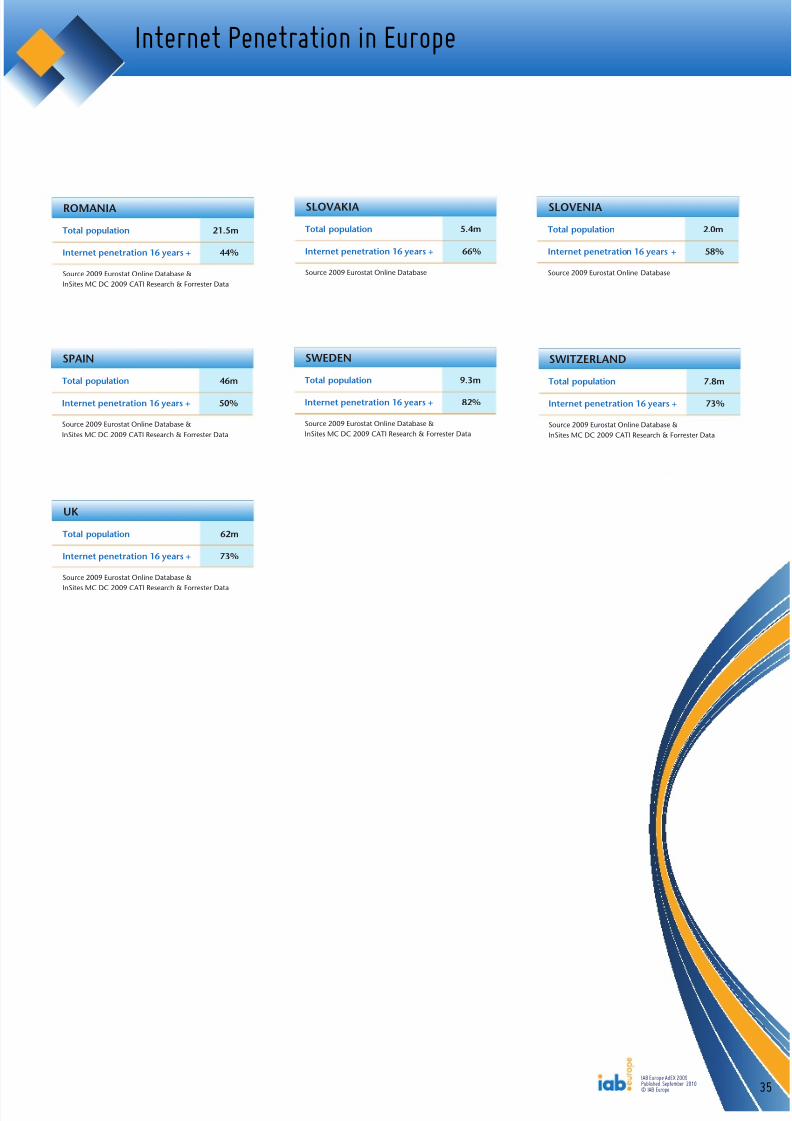
Internet Penetration in Europe
Total population 5.4m
Internet penetration 16 years + 66%
Source 2009 Eurostat Online Database
SLOVAKIA
Total population 2.0m
Internet penetration 16 years + 58%
Source 2009 Eurostat Online Database
SLOVENIA
Total population 46m
Internet penetration 16 years + 50%
Source 2009 Eurostat Online Database &
InSites MC DC 2009 CATI Research & Forrester Data
SPAIN
Total population 9.3m
Internet penetration 16 years + 82%
Source 2009 Eurostat Online Database &
InSites MC DC 2009 CATI Research & Forrester Data
SWEDEN
Total population 7.8m
Internet penetration 16 years + 73%
Source 2009 Eurostat Online Database &
InSites MC DC 2009 CATI Research & Forrester Data
SWITZERLAND
Total population 62m
Internet penetration 16 years + 73%
Source 2009 Eurostat Online Database &
InSites MC DC 2009 CATI Research & Forrester Data
UK
35IAB Europe AdEX 2009Published September 2010© IAB Europe
Total population 21.5m
Internet penetration 16 years + 44%
Source 2009 Eurostat Online Database &
InSites MC DC 2009 CATI Research & Forrester Data
ROMANIA
8/8/2019 AdEx 2009 - European online advertising expenditure
http://slidepdf.com/reader/full/adex-2009-european-online-advertising-expenditure 36/41
Appendix i – definition of formats
The following four formats are collated as part of this report:
Display advertisingAn advertiser pays an internet company for space to display a staticor hyper-linked banner or logo on one or more of the internetcompany’s pages. For the purposes of this report all forms of internetsponsorship, tenancies, rich media formats and non-transactionbased affiliates were collected separately by local IABs and have beenincluded in the figure for display advertising.
Where possible, transaction related payment models have beenexcluded, leaving non-transaction based affiliate revenuesincorporated into display.
SearchFees advertisers pay internet companies to list and/or link theircompany site domain name to a specific search word or phrase(includes paid search revenues), where the fee paid by the client isbased on the number of clicks on the listing results. Searchcategories include:
w Paid listings – text links appear at the top or side of searchresults for specific keywords. The more a marketer pays, thehigher the position it gets. Marketers only pay when a user clickson the text link
w Contextual search - text links appear in an article based on thecontext of the content, instead of a user submitted keyword.Payment only occurs when the link is clicked
w Paid inclusion – guarantees that a marketer’s URL is indexed by asearch engine. The engine’s search algorithms determine thelisting..
ClassifiedsFees advertisers pay internet companies to list specific products orservices (eg. online job boards and employment listings, real estatelistings, automotive listings, yellow pages). Can be either business-to-business or business-to-consumer.
‘Other’ CategoryThis is an umbrella category for smaller non-transaction basedformats. IAB Europe has included newsletter advertising, solus emmobile advertising and in-game advertising in this category wherecountries have measured these formats.
Newsletter is defined as text or banner advertising that appearsaround the unrelated editorial content of email newsletters. Solusemail is defined as an email sent by a media owner to an opt-in listwhere the content of the email is determined by the advertiser.
Mobile advertising is advertising viewed or read on a mobile phone
The Other category does not include email marketing or related cosdefined as an email sent on behalf of an advertiser by an email listmanager.
Contents of ‘Other’ categoryAustria newsletter advertising onlyDenmark supplied as ‘Other’ by FDIMFrance newsletter advertising onlyHungary newsletter and mobile advertisingItaly mobile advertising onlyNetherlands mobile and in-game advertisingNorway newsletter, in-game and mobile advertisingRomania newsletter advertising onlySpain mobile advertising onlySlovenia mobile advertising onlySweden mobile advertising onlyUK mobile, newsletter and solus email advertising
36IAB Europe AdEX 2009Published September 2010© IAB Europe
8/8/2019 AdEx 2009 - European online advertising expenditure
http://slidepdf.com/reader/full/adex-2009-european-online-advertising-expenditure 37/41
Appendix ii – The ParticipatingIABs
IAB Austriawww.iab-austria.atPartner: Focus MR
IAB Belgiumwww.iab-belgium.beSource: CIM
IAB Chapter in Bulgaria(Interactive Association)www.iabulgaria.bg
IAB Chapter in Croatia(INAMA)www.inama.hrSource: PricewaterhouseCoopers
IAB Chapter in Denmark(FDIM)www.fdim.dkPartner: Deloitte
IAB Finlandwww.iab.fi
Partner: TNS Gallup Oy Media Intelligence
IAB Francewww.iabfrance.comPartner: France Pub
IAB Chapter in Germany(OVK)www.bvdw.orgPartner: Nielsen Media Research
IAB Greecewww.iab.gr
IAB Hungarywww.iab.huPartner: PricewaterhouseCoopers
IAB Irelandwww.iabireland.iePartner: PricewaterhouseCoopers Ireland
IAB Italywww.iab.itPartner: Assointernet/Nielsen Media Research
IAB Netherlandswww.iab.nlPartner: Nielsen Media Research
IAB Chapter in Norwaywww. inma.noPartner: ANFA
IAB Polandwww.iabpolska.plPartner: PricewaterhouseCoopers Poland
IAB Romaniawww.iab-romania.roPartner: PricewaterhouseCoopers Romania
IAB Russiawww.iabrus.ruPartner: Russian Association of Communication Agencies
IAB Chapter in Slovakia(AIM)
www.aimsr.skSource: Mediana
IAB Sloveniawww.soz.si
IAB Spainwww.iabspain.netPartner: PricewaterhouseCoopers
IAB Swedenwww.iabsverige.seSource: IRM
IAB SwitzerlandSource: MediaFocus
IAB Turkeywww.iab-turkiye.orgPartner: Turkish Advertising Agencies Association
IAB UKwww.iabuk.netPartner: PricewaterhouseCoopers
37IAB Europe AdEX 2009Published September 2010© IAB Europe
8/8/2019 AdEx 2009 - European online advertising expenditure
http://slidepdf.com/reader/full/adex-2009-european-online-advertising-expenditure 38/41
Appendix iii – Methodology and adjusted data
Each national IAB runs its own annual online advertising spendbenchmark study and as the methodology for the studies variesslightly by country, IAB Europe works with Screen Digest to ensurethat the findings in the European report are comparable. Thisinvolves re-adjusting figures to allow for different originalmethodologies, adjusting currencies where local data is not collectedin Euros and ensuring the year average exchange rate at 2009 has
38
Actual, adjusted and estimated data 2009Million Euros
Source: IAB Europe/Screen Digest ©
Actual € 10,798 Adjusted
€ 2,730
Estimated € 1,173
IAB Europe AdEX 2009Published September 2010© IAB Europe
been used. To provide data for previous year growth rates, the prioryear’s figures are also re-calculated using the current report’s year-average exchange rate in order to give transparency over the growthrate.
The chart below shows the amounts of estimated and adjusted datafor each country
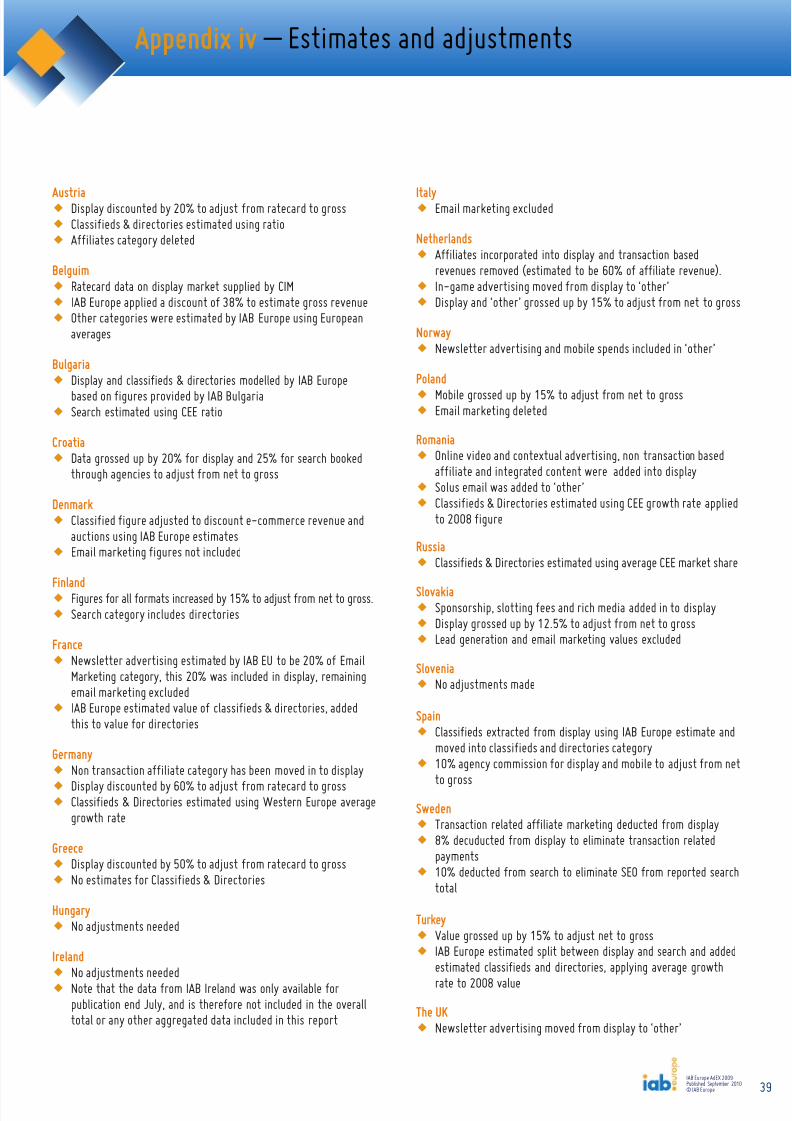
8/8/2019 AdEx 2009 - European online advertising expenditure
http://slidepdf.com/reader/full/adex-2009-european-online-advertising-expenditure 39/41
Appendix iv – Estimates and ad justments
Austriaw Display discounted by 20% to adjust from ratecard to grossw Classifieds & directories estimated using ratiow Affiliates category deleted
Belguimw Ratecard data on display market supplied by CIMw IAB Europe applied a discount of 38% to estimate gross revenuew Other categories were estimated by IAB Europe using European
averages
Bulgariaw Display and classifieds & directories modelled by IAB Europe
based on figures provided by IAB Bulgariaw Search estimated using CEE ratio
Croatiaw Data grossed up by 20% for display and 25% for search booked
through agencies to adjust from net to gross
Denmarkw Classified figure adjusted to discount e-commerce revenue and
auctions using IAB Europe estimatesw Email marketing figures not included
Finlandw Figures for all formats increased by 15% to adjust from net to gross.w Search category includes directories
Francew Newsletter advertising estimated by IAB EU to be 20% of Email
Marketing category, this 20% was included in display, remainingemail marketing excluded
w IAB Europe estimated value of classifieds & directories, addedthis to value for directories
Germanyw Non transaction affiliate category has been moved in to displayw Display discounted by 60% to adjust from ratecard to grossw Classifieds & Directories estimated using Western Europe average
growth rate
Greecew Display discounted by 50% to adjust from ratecard to grossw No estimates for Classifieds & Directories
Hungaryw No adjustments needed
Irelandw No adjustments neededw Note that the data from IAB Ireland was only available for
publication end July, and is therefore not included in the overalltotal or any other aggregated data included in this report
Italyw Email marketing excluded
Netherlandsw Affiliates incorporated into display and transaction based
revenues removed (estimated to be 60% of affiliate revenue).w In-game advertising moved from display to ‘other’w Display and ‘other’ grossed up by 15% to adjust from net to gro
Norwayw Newsletter advertising and mobile spends included in ‘other’
Polandw Mobile grossed up by 15% to adjust from net to grossw Email marketing deleted
Romaniaw Online video and contextual advertising, non transaction based
affiliate and integrated content were added into displayw Solus email was added to ‘other’w Classifieds & Directories estimated using CEE growth rate appl
to 2008 figure
Russiaw Classifieds & Directories estimated using average CEE market sh
Slovakiaw Sponsorship, slotting fees and rich media added in to displayw Display grossed up by 12.5% to adjust from net to grossw Lead generation and email marketing values excluded
Sloveniaw No adjustments made
Spainw Classifieds extracted from display using IAB Europe estimate a
moved into classifieds and directories categoryw 10% agency commission for display and mobile to adjust from
to grossSwedenw Transaction related affiliate marketing deducted from displayw 8% decuducted from display to eliminate transaction related
paymentsw 10% deducted from search to eliminate SEO from reported sear
total
Turkeyw Value grossed up by 15% to adjust net to grossw IAB Europe estimated split between display and search and add
estimated classifieds and directories, applying average growthrate to 2008 value
The UKw Newsletter advertising moved from display to ‘other’
39IAB Europe AdEX 2009Published September 2010© IAB Europe
8/8/2019 AdEx 2009 - European online advertising expenditure
http://slidepdf.com/reader/full/adex-2009-european-online-advertising-expenditure 40/41
Screen Digest is the pre-eminent firm of industry analysts that has beencovering global media markets for over 30 years. Headquartered in Londowith offices in New York and Monterey, California, the firm employs a teaof 40 specialist analysts covering digital media, advertising, film, televisiobroadband, mobile, cinema, home entertainment and gaming in up to 60markets worldwide. A comprehensive suite of online services and reportsprovide the information and analysis that hundreds of media companies
worldwide base their decisions on. Screen Digest's eight dedicated onlineservices have been developed to provide continuously updated data andanalysis on the global media markets, plus detailed forecasts on allaspects of the media industry.
comScore is a global leader in measuring the digital world and the preferredsource of digital marketing intelligence. Through a powerful combination ofbehavioral and survey insights, comScore enables clients to betterunderstand, leverage and profit from the rapidly evolving worldwide web andmobile arena. comScore provides syndicated and custom solutions in onlineaudience measurement, e-commerce, advertising, search, video and mobileand offers dedicated analysts with digital marketing and vertical-specificindustry expertise. Advertising agencies, publishers, marketers and financial
analysts turn to comScore for the industry-leading solutions needed to craftsuccessful digital, marketing, sales, product development and tradingstrategies.
www.comscore.comwww.nielsen-online.com
The Nielsen Company is a global information and media company withleading market positions in marketing and consumer information, televisioand other media measurement, online intelligence, mobile measurement,trade shows and business publications. The privately held company is actiin approximately 100 countries, with headquarters in New York, USA. Fomore information, please visit, nielsen.
www.InSites.eu
InSites Consulting is a full-service consultancy, covering all fields of marketresearch. Using a range of quantitative and qualitative methods, theyprovide clients with custom-made solutions and marketing
recommendations. We combine innovative approaches with proven andhighly accurate methods to design marketing strategies tailored toindividual clients’ needs. InSites partnered with IAB Europe to deliver the MCDC Project, a goldmine of information about European online user behaviouracross 16 territories. Data from this project has been included in theinternet penetration data featured in this report.
www.warc.com
World Advertising Research Center (WARC) is a premier provider ofinformation and insight to the global marketing, advertising, media andresearch industries. WARC, its internet service, is the world's largest singlesource of marketing insight , while its publications and conferences havestrong reputations established over many years.
WARC is an independent company dedicated to recognising and promotingmarketing excellence and effectiveness. Partnerships with the world'sleading industry bodies, together with its own in-house editorial teams,position WARC as a unique information provider.
www.screendigest.com
WARC
Appendix v – Our research partners
40IAB Europe AdEX 2009Published September 2010© IAB Europe
8/8/2019 AdEx 2009 - European online advertising expenditure
http://slidepdf.com/reader/full/adex-2009-european-online-advertising-expenditure 41/41
Special thanks
With sincere thanks to all the contacts at the national IABs who have supported theproduction of this report by supplying and explaining their data to IAB Europe and to ourcorporate members who provided quotes that have been used throughout this report.
Also special thanks to our research partners for supplying internet penetration figures,WARC for their total media figures, our members comScore and Nielsen Online for audiencemeasurement figures and the analysts at Screen Digest for their insight, commentary,forecasts and support.
Contact details
IAB Europewww.IABEurope.euAlain HeureuxPresident, IAB [email protected]
Catherine BorrelResearch Manager, IAB Europe
[email protected]+44 (0) 7870 78 12 60
Lucy GreenPress Relations, IAB [email protected]+44 (0) 7817 69 83 66