Embed Size (px)
Citation preview
pdf version 1.0 (December 2001)
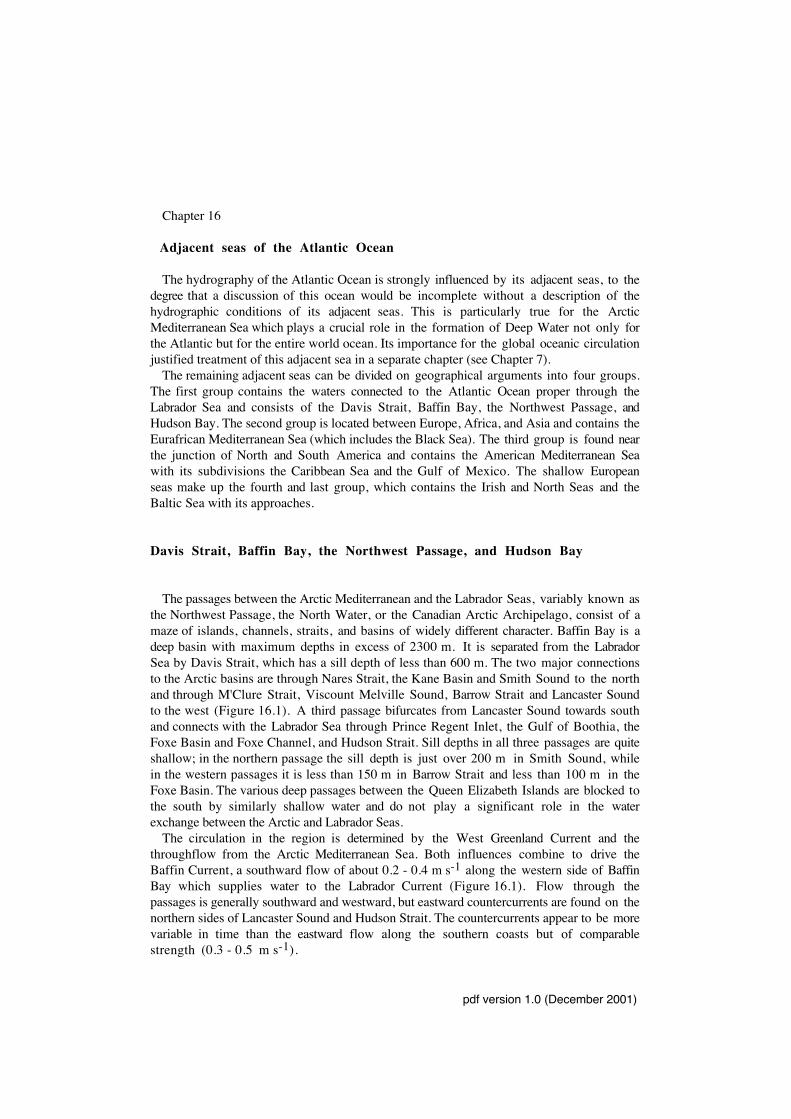
Chapter 16
Adjacent seas of the Atlantic Ocean
The hydrography of the Atlantic Ocean is strongly influenced by its adjacent seas, to thedegree that a discussion of this ocean would be incomplete without a description of thehydrographic conditions of its adjacent seas. This is particularly true for the ArcticMediterranean Sea which plays a crucial role in the formation of Deep Water not only forthe Atlantic but for the entire world ocean. Its importance for the global oceanic circulationjustified treatment of this adjacent sea in a separate chapter (see Chapter 7).
The remaining adjacent seas can be divided on geographical arguments into four groups.The first group contains the waters connected to the Atlantic Ocean proper through theLabrador Sea and consists of the Davis Strait, Baffin Bay, the Northwest Passage, andHudson Bay. The second group is located between Europe, Africa, and Asia and contains theEurafrican Mediterranean Sea (which includes the Black Sea). The third group is found nearthe junction of North and South America and contains the American Mediterranean Seawith its subdivisions the Caribbean Sea and the Gulf of Mexico. The shallow Europeanseas make up the fourth and last group, which contains the Irish and North Seas and theBaltic Sea with its approaches.
Davis Strait, Baffin Bay, the Northwest Passage, and Hudson Bay
The passages between the Arctic Mediterranean and the Labrador Seas, variably known asthe Northwest Passage, the North Water, or the Canadian Arctic Archipelago, consist of amaze of islands, channels, straits, and basins of widely different character. Baffin Bay is adeep basin with maximum depths in excess of 2300 m. It is separated from the LabradorSea by Davis Strait, which has a sill depth of less than 600 m. The two major connectionsto the Arctic basins are through Nares Strait, the Kane Basin and Smith Sound to the northand through M'Clure Strait, Viscount Melville Sound, Barrow Strait and Lancaster Soundto the west (Figure 16.1). A third passage bifurcates from Lancaster Sound towards southand connects with the Labrador Sea through Prince Regent Inlet, the Gulf of Boothia, theFoxe Basin and Foxe Channel, and Hudson Strait. Sill depths in all three passages are quiteshallow; in the northern passage the sill depth is just over 200 m in Smith Sound, whilein the western passages it is less than 150 m in Barrow Strait and less than 100 m in theFoxe Basin. The various deep passages between the Queen Elizabeth Islands are blocked tothe south by similarly shallow water and do not play a significant role in the waterexchange between the Arctic and Labrador Seas.
The circulation in the region is determined by the West Greenland Current and thethroughflow from the Arctic Mediterranean Sea. Both influences combine to drive theBaffin Current, a southward flow of about 0.2 - 0.4 m s-1 along the western side of BaffinBay which supplies water to the Labrador Current (Figure 16.1). Flow through thepassages is generally southward and westward, but eastward countercurrents are found on thenorthern sides of Lancaster Sound and Hudson Strait. The countercurrents appear to be morevariable in time than the eastward flow along the southern coasts but of comparablestrength (0.3 - 0.5 m s-1).

Regional Oceanography: an Introduction
pdf version 1.0 (December 2001)
272
Fig. 16.1. Geography and circulation of the Northwest Passage and connected seas.
The hydrography of Baffin Bay and Northwest Passage shows a distinct layering of watermasses. Unfortunately a generally accepted nomenclature of water masses in the region doesnot exist, and some names found in the literature can be quite misleading. Twoconspicuous features of the vertical temperature distribution in Baffin Bay are a temperaturemaximum at about 500 m depth below a minimum in the range 50 - 200 m(Figure 16.2). The maximum is the result of Atlantic water inflow with the West

pdf version 1.0 (December 2001)
Ajacent Seas of the Atlantic Ocean 273
Greenland Current. This water is sometimes called Atlantic Intermediate Water on accountof its position in the water column and the fact that it is brought into the region from thesouth. However, its origin is in the East Greenland Current and thus ultimately in theArctic Mediterranean Sea, and there is no relation with what is normally called IntermediateWater (water subducted near the Polar Front and characterized by a salinity minimum).Another, more appropriate name for this water is Polar Atlantic Water.
Fig. 16.2. Temperature (°C) in two sections through the Northwest Passage and Baffin Bay.(a) From Smith Sound to Davis Strait, (b) from M'Clure Strait to Lancaster Sound. Arrowsindicate water movement. Typical salinities are indicated in italics. Adapted from Collin (1966).
The low temperature water above the Polar Atlantic Water is also of Arctic origin butadvected from the north. It is drawn from the sub-surface layer of Arctic Surface Water (seeChapter 7) and modified by some injection of brine from the surface during winter freezing.Its salinity is therefore somewhat higher than the salinity of Arctic Surface Water at thesame temperatures. This water is sometimes referred to as Arctic Intermediate Water butagain not related to the Intermediate Water of the temperate zone.
Above the Arctic Intermediate Water is a thin surface layer of not more than 50 m depthwhere water properties change with the seasons. Summer temperatures vary between-0.1 - 5.0°C, and salinities are in the range 30.0 - 35.5.
Below the Atlantic Polar Water temperature decreases and salinity increases slowly untilboth become virtually constant in the Baffin Bay Bottom Water below 1800 m depth(-0.4°C and 34.49 salinity). The low oxygen content (3.6 ml/l) of this water testifies for

Regional Oceanography: an Introduction
pdf version 1.0 (December 2001)
274
the character of Baffin Bay as a small mediterranean dilution basin and correspondingly slowrenewal of its Bottom Water. The details of the formation process are not entirely clear.Irregular discharge of Arctic water through Smith Sound is believed to contribute. There isalso evidence that formation of cold, saline water in shallow regions of Smith Sound andsubsequent sinking along the continental slope, similar to the formation process of ArcticBottom Water (Chapter 7), plays a major role (Bourke et al. 1989).
The hydrography of Hudson Bay is determined by its small water depth of on averageonly 250 m and by seasonally varying river discharge, which gives it the character of alarge estuary. Since estuarine dynamics are not discussed in this book, a few remarks haveto suffice. Foxe Basin and Hudson Bay are completely ice-covered during several months.The ice starts to break up from James Bay in June, and Hudson Bay and Foxe Basin areclear of ice by mid-August. Large amounts of freshwater are poured into the bay during thisperiod. As a consequence, temperature and salinity undergo large seasonal changes with aperiod of strong stratification during late spring and summer. This affects the circulation aswell, so Figure 16.1 can only show the water movement as it prevails during two thirds ofthe year. Lack of ice movement during spring breakup indicates that there is little if anywater movement before the stratification is established by the influx of meltwater. Theeffect of the runoff is felt most strongly towards October when flow across the entirenorthern bay is northward.
Ice coverage in other parts of Northwest Passage is similarly heavy, but satelliteobservations show that up to 10% of the region between Lancaster Sound, Smith Sound,and Greenland are ice-free at any time even through winter. The polynya are produced byoffshore movement of ice in response to the prevailing wind. The dynamics are essentiallythose of coastal upwelling, but the situation is unique because in the upper few hundredmeters temperature increases with depth. Upwelling thus brings warm Atlantic Polar Waterto the surface and keeps the surface layer ice-free.
The Eurafrican Mediterranean Sea
The mediterranean basin between Africa, Europe, and Asia has always been regarded theprototype of a concentration basin, to the extent that it is mostly referred to not as theEurafrican but simply the Mediterranean Sea. It consists of a series of deep basins mostlywell connected with each other, the major exception being the Black Sea which has verylimited communication with the other subdivisions (Figure 16.3). The mean depth of theMediterranean Sea is near 1500 m; maximum depths in the various basins are between2500 m and 5100 m (in a narrow trench off southwestern Greece). A sill between Sicilyand Tunisia with a maximum depth near 400 m divides the region into the western andeastern Mediterranean Sea. Maximum depths in the two subdivisions are about 3400 m inthe west and about 4200 m in the east (if the deep trench is excluded). The secondconnection between the western and eastern basins, the narrow Strait of Messina betweenSicily and mainland Italy, has a sill depth of only 120 m and is of no significance for thegeneral circulation; its reputation as a treacherous passage for ships stems from its strongtidal currents of 2 - 3 m s-1 ascribed to the two monsters Scylla and Charybdis in Homer'smasterful account of the adventures of the ancient Greek navigator Odysseus.

pdf version 1.0 (December 2001)
Ajacent Seas of the Atlantic Ocean 275
Fig. 16.3. Topography and subdivisions of the Eurafrican Mediterranean Sea. The 1000 mcontour is shown, and regions deeper than 3000 m are shaded. The 200 m contour is shown as abroken line where it departs significantly from the 1000 m contour. In addition, the 2000 mcontour is shown as a broken line in the Black Sea.
Communication with the Atlantic Ocean proper is through the Strait of Gibraltar whichis 22 km wide and has a sill depth of 320 m. This poses a severe limitation on the waterexchange and in combination with the atmospheric conditions creates distinctivehydrographic conditions. During most of the year winds over the Mediterranean Sea arefrom the northwest and carry warm dry air, causing large evaporation. During winter thewinds are often northeasterly, bringing dry but cold air into contact with the sea.
Over most of the Mediterranean Sea annual evaporation exceeds rainfall and river runoffby about 1 m, so on average the Mediterranean Sea is a concentration basin. The twoexceptions are the Black and the Adriatic Seas which receive large amounts of freshwaterfrom the Danube and Po rivers and therefore are dilution basins. Water exchange betweenthe Atlantic Ocean proper, the western and eastern Mediterranean Sea, and the Black Sea,which follows the principles discussed with Figure 7.1, therefore consists of inflow ofAtlantic water through the Strait of Gibraltar in an upper layer, outflow of denseMediterranean water below, inflow of relatively fresh Black Sea water through theDardanelles in an upper layer, and outflow of Mediterranean water below (exchange with theAdriatic Sea is similar but not associated with strong currents because of the lack oftopographic restriction between the Adriatic and Ionian Seas). An annual mean budget givesthe following transports (where the actual numbers have been adjusted to give zero balanceand do not imply accuracy to three digits):
inflow (Sv) outflow ( S v ) from the Atlantic 1.107 to the Atlantic 1.041from the Black Sea 0.006precipitation 0.027 evaporation 0.111river runoff 0.011 total 1.152 total 1.152

Regional Oceanography: an Introduction
pdf version 1.0 (December 2001)
276
Fig. 16.4. Satellite thermal image of the Alboran Sea showing the inflow of cool Atlantic Water(white is cold, dark is warm). (a) With two eddies and the Almeria - Oran Front at 1° - 2°W,(b) with a single eddy and the front at 4°W. The two-eddy situation is far more frequent. Thetransition period from one to two eddies is about one month. From Tintore et al. (1988)
Note that the total water exchange through Gibraltar Strait is about thirty times what isrequired to replace the water lost by evaporation. This is because flow betweenmediterranean seas and the open ocean is mainly driven by the density difference betweenthe water masses on either side of the strait (which is, of course, the result of the freshwaterbalance in the mediterranean sea). Inflow velocities in excess of 1 m s-1 in combinationwith a rapidly shoaling bottom in a constricted passage result in a situation where normalocean dynamics give way to hydraulic control of the flow; in other words, in the vicinity ofthe strait the flow axis and the depth of the interface between the layers are not controlledby geostrophy and deflection by the Coriolis force but by the same processes which governthe flow of water over a weir. The inflowing Atlantic water initially continues eastward as afree jet and breaks into one or two large eddies of 150 km diameter before the Coriolis forcecan deflect it to continue along the African coast (Figure 16.4). The changeover from theSpanish to the Algerian coast occurs in a narrow current associated with a front, known asthe Almeria - Oran Front, which separates the relatively fresh Atlantic water from the saltyMediterranean water (Figure 16.5). The Atlantic inflow then continues as the AlgerianCurrent (Figure 16.6), which for at least 300 km maintains the character of a narrow jet ofless than 30 km width with average velocities of 0.4 m s-1, maximum velocities of

pdf version 1.0 (December 2001)
Ajacent Seas of the Atlantic Ocean 277
0.8 m s-1, and a total transport of about 0.5 Sv. Having advanced past 4°E the flowbecomes more diffuse. In the eastern Mediterranean basins it is dominated by eddies, somelarge and stationary as indicated in Figure 16.6, others of only 40 - 60 km diameter butreaching to great depth. Observations have shown them to extend to at least 1000 m, withvelocities exceeding 0.2 m s-1 above the 300 m level.
Fig. 16.6. Upper ocean currents in the Eurafrican Mediterranean Sea. Locations marked A and Bin the Alboran Sea refer to the data shown in Fig. 16.5. Dots indicate areas of winterconvection.
On its way east the Atlantic water encounters saltier but warmer and consequently lessdense Mediterranean water. Outside the Algerian Current it therefore continues submergedunder a shallow surface layer of high salinity and can be followed as a salinity minimum at
Fig. 16.5. Temperature –salinity diagrams for twostations on either side ofthe Almeria - Oran front(locations A and B inFig. 16.6) and for a sta-tion in-between. Note thelayering and associatedtemperature inversion inthe front. After Arnone etal. (1990).

Regional Oceanography: an Introduction
pdf version 1.0 (December 2001)
278
20 - 30 m depth. Being formed outside the Mediterranean Sea and identifiable throughoutthe basin, it can rightly be given the status of a water mass and is usually referred to asAtlantic Water.
The character of the Mediterranean Sea as a concentration basin requires that AtlanticWater is converted into denser water that eventually leaves the sea over the sill of the Straitof Gibraltar. This conversion process involves deep vertical convection during winter. Itdoes not act uniformly in the entire mediterranean basin but occurs in three small regionswhich more than the remainder of the basin are affected by the cold northeasterly winterwinds. Very cold air from Siberia is channeled through the valleys of the Alps and descendsin bursts of strong winds known as mistral on the Ligurian Sea and the northern BalearicBasin; this is the region of origin for Mediterranean Deep Water (MDW), often also calledWestern Mediterranean Deep Water. Similarly cold winter winds descend on the regionbetween Rhodes and Cyprus and on the northern and central Adriatic Sea and are responsiblefor the formation of Levantine Intermediate Water (LIW). Both are characterized by highsalinities, but the details of the formation mechanisms for the two water masses of thelower layer are very different and require some discussion.
The region where MDW is formed is generally under the influence of a cyclonic (anti-clockwise) wind system. This results in a cyclonic ocean circulation with Ekman transportsdirected outwards and upwelling in the centre. As a consequence the LIW, which is found atabout 400 - 500 m depth to the south of the region, here rises to 150 - 200 m, increasingthe salinity of the upper 200 m and reducing the salinity contrast over the water column.The result is a geographically well defined region of reduced vertical stability. Wintercooling reduces the surface temperatures throughout the Mediterranean Sea and reduces thestability further; in the Ligurian Sea and the northern Balearic Basin it leaves the upper200 m of the water column with only marginal stability. When a mistral event reaches theregion, rapid additional cooling produces instability and vigorous sinking of the surfacewater. The sinking occurs in funnels not larger than a few tens of kilometers in diameterand is accompanied by a compensating rise of water from great depth on all sides(Figure 16.7). The water can sink some 800 m within a matter of hours and reach the2500 m level within days (the maximum depth in the region is near 2900 m). Short andviolent as these episodes of MDW formation are, the result of one such episode of a fewdays' duration supplies enough water to feed the lower layer outflow through the Strait ofGibraltar for several weeks. Newly formed MDW is characterized by a potential temperatureof 12.6 - 12.7°C, a salinity of 38.4, and an oxygen content of 4.6 ml/l, much warmer,saltier, and better oxygenated than the North Atlantic Deep Water found at the same depthin the Atlantic Ocean. The residence time of MDW in the Ligurian Sea has been estimatedat 11 ± 2 years.
Similar outbreaks of strong cold winter winds occur in the Adriatic Sea, where they areknown as bora. However, the stability of the water column is also affected by river runoffwhich keeps the surface density low. Currents through the Strait of Otranto are therefore asexpected for a dilution basin: outflow of low salinity water at the surface and inflow of highsalinity Levantine Intermediate Water at its usual depth of 200 - 500 m. The modificationto this simple scheme, in the form of an additional outflow layer below the inflow, comesas a result of the shallowness of the Adriatic Sea north of 42.5°N (less than 200 mdecreasing to less than 100 m north of 43.5°N). This allows the water in the northern andcentral regions to cool very fast during a bora event and to attain a density higher than thedensity of LIW in the south. The dense surface water flows southward on the Italian shelf,

pdf version 1.0 (December 2001)
Ajacent Seas of the Atlantic Ocean 279
bypassing the deep southern basin until it encounters a series of canyons near 41.5°N. Itfalls down the canyons, mixing vigorously with LIW on the way, and leaves Otranto Straitas an outflow below the LIW inflow. Its characteristic properties are 13°C and 38.6salinity, slightly less than the salinity of 38.7 found in the LIW above (which is warmer - 14°C - and thus less dense). The slight reduction in salinity indicates a contribution fromthe Po river.
Fig. 16.7. Observations of Mediterranean Deep Water formation in the Balearic Sea. (a)Potential temperature (°C) over a one-month period in 1969 near 42°N, 5°E showing thedeepening of the mixed layer to 2200 m, (b) a salinity section along 5°20'E showing a columnof newly mixed water near 42°N. Adapted from Sankey (1973).
The cold but relatively fresh bottom water from the Adriatic Sea does not maintain itsidentity very long. It turns eastward and enters the Levantine Basin where it encounterswater freshly formed in the region between Rhodes and Cyprus. The two sources mix, andtogether they form the Levantine Intermediate Water. The Levantine surface source is muchwarmer but significantly more saline (15°C and 39.1 salinity). The resulting mixture givesa potential temperature of 13.3°C, a salinity of 38.67, and a very high oxygen content of5.0 ml/l as the characteristics of LIW.
LIW is saltier but warmer than MDW and has a slightly lower density. As a consequence,a hydrographic station in the central parts of the Mediterranean Sea shows a layering of fourwater masses (Figure 16.8). LIW is easily identifiable as a salinity maximum underneaththe Atlantic Water minimum. A salinity section along the axis of all major basins(Figure 16.9) shows its movement towards the Strait of Gibraltar. In general, MDW is notfound above 600 m depth, so the bulk of the outflow through Gibraltar Strait must beprovided by LIW. However, in the vicinity of the sill hydraulic control causes an uplift of

Regional Oceanography: an Introduction
pdf version 1.0 (December 2001)
280
the thermocline of several hundred meters on the African side, and MDW is able to leavethe Mediterranean Sea (Figure 16.10) at an estimated rate of 0.2 Sv. Once over the sill,MDW and LIW are not much longer recognizable as separate water masses; they sink andspread as (Eurafrican) Mediterranean Water as described in Chapter 15.
Fig. 16.8. Salinity against depth in the eastern and western Mediterranean Sea. MSW:Mediterranean surface water, AW: Atlantic Water, LIW: Levantine Intermediate Water, MDW:Mediterranean Deep Water. Note the difference in the salinity of MDW east and west of SicilyStrait; evaporation is higher in the eastern Mediterranean Sea, and the sill between Sicily andTunisia prevents horizontal mixing between the basins.
Fig. 16.9. Salinity section along the axis of the Eurafrican Mediterranean Sea. The black regionindicates the salinity range 38.4 - 38.5 in the west and 38.4 - 39.1 in the east. Arrows indicatewater mass movement; AW: Atlantic Water, LIW: Levantine Intermediate Water. After Wüst(1961).

pdf version 1.0 (December 2001)
Ajacent Seas of the Atlantic Ocean 281
16.10. Outflow of Levantine Intermediate Water (LIW) and Mediterranean Deep Water (MDW)through Gibraltar Strait as seen in salinity and potential temperature (°C). The section is some15 km west of the narrowest point. MDW is identified by Θ < 12.90°C, LIW by a salinity> 38.44. From Kinder and Parrilla (1987).
The Black Sea has not been mentioned throughout this discussion since its impact on theMediterranean Sea is very small and it is more appropriate to describe it as a separatemediterranean basin. The world's largest inland water basin (area 461,000 km2, volume
16.11. Vertical profiles of temperature(°C), salinity, oxygen (O2, ml/l), andhydrogen sulfide (H2S, ml/l) typical forthe Black Sea. From Tolmazin (1985a).

Regional Oceanography: an Introduction
pdf version 1.0 (December 2001)
282
537,000 km3), the Black Sea is connected with the world ocean by a narrow passage withthree subregions. Bosphorus Strait is on average 60 m deep, 31 km long and at itsnarrowest point only 760 m wide and has a sill depth near 35 m. In the Marmara Sea theconnection broadens to some 75 km width with depths in excess of 1000 m, but furtherpassage to the Eurafrican Mediterranean Sea is again constricted by the Dardanelles, a morethan 100 km long narrow waterway between Europe and Asia. Depths in the Black Seaexceed 2000 m throughout (Figure 16.3). The shallow Sea of Azov connects to the BlackSea through Kerch Strait (sill depth 5 m) in the north; it makes up 9% of the area but only0.5% of the volume of the Black Sea.
Large freshwater input from the Danube, Dniester, Dnieper, Severskiy Donets, and Donrivers produces a positive freshwater balance and gives the Black Sea its character as adilution basin. Luigi Marsigli argued in 1681 already and verified with laboratoryexperiments that underneath the well known surface flow that carries low-salinity waterfrom the Black Sea through the Bosphorus, Marmara Sea, and Dardanelles, there should bea flow of salty Mediterranean water in the opposite direction, produced by the salinity (andthus density) difference between the Mediterranean and Black Seas. Modern observationsconfirm his ideas and give the following freshwater budget, which is believed to haveexisted since Bosphorus Strait opened 9000 years ago:
input (km 3 /year) output (km 3/year) from the Mediterranean Sea 120 to the Mediterranean Sea 260precipitation 140 evaporation 350river runoff 350 total 610 total 610
If this is compared to the total volume of the Black Sea it becomes obvious that waterrenewal in the basin is extremely slow. This is also evident in the distribution of hydrogra-phic properties (Figure 16.11) which show that the inflow is insufficient to keep thesalinity at normal oceanic values and all oxygen is depleted below 200 m depth, resultingin the formation of hydrogen sulfide which makes the Black Sea uninhabitable below200 m.
The apparent uniformity of T-S properties below 200 m gave rise to the idea that theinflowing Mediterranean Water sinks to the bottom and that water renewal at depth isachieved by very slow upwelling. CTD data obtained over the last 30 years (Tolmazin,1985b) indicate that the structure is not as uniform as previously believed. They show aribbon, about 7 - 8 m thick, of Mediterranean water above the shelf floor defying theCoriolis force by bending northward for the first 50 km or so after entering fromBosphorus Strait, apparently under hydraulic control from the shallow sills. The velocitiesin the inflowing water are quite modest, usually less than 0.1 m s-1; however, given theweak density difference between inflow and outflow, they are sufficient to generate hydrauliccontrol. There is evidence to suggest that the inflow is not continuous but occasionallyblocked by weather systems which depress the interface in Bosphorus Strait below the silldepth. Eventually the inflow merges with the general anti-clockwise circulation of thewestern Black Sea, and the Mediterranean water progresses along the Turkish shelf. Allalong its path it is exposed to intense mixing through bottom-induced turbulence, whichcauses parcels of water to separate and float away into the interior. As a result, lenses ofwarm saline oxygenated water are found at various depths in an environment usually devoid

pdf version 1.0 (December 2001)
Ajacent Seas of the Atlantic Ocean 283
of oxygen. This is reflected in age estimates derived from radiocarbon measurements, whichfor the water in the 300 - 2160 m depth range vary from 600 to 2200 years and do notshow a systematic variation with depth. Nevertheless, all water below 200 m depth mustultimately be renewed from Bosphorus Strait.
Away from the entry point for Mediterranean water the circulation in the entire watercolumn is dominated by anti-clockwise motion along the continental slope with three anti-clockwise gyres of about identical size filling the western, central, and eastern basin(Figure 16.6). The western gyre brings water from the northwest shelf region into contactwith the open Black Sea. In winter the water on the shelf is colder than that in the open sea(through a process explained for Bass Strait water in Chapter 17) and sinks as it leaves theregion of shallow water depth. By spreading through the Black Sea at intermediate depth itproduces the temperature minimum regularly observed near 75 m (Figure 16.11). A recentseries of research cruises (Murray, 1991) will allow a much more detailed description of thecirculation and water masses in the Black Sea.
The American Mediterranean Sea
The topography of the Caribbean Sea and the Gulf of Mexico (Figure 16.12) shows asuccession of five basins, separated by sills of less than 2000 m depth and set apart fromthe main Atlantic basins by an island-studded enclosure less than 1000 m deep butcontaining several passages with sill depths of 740 - 2200 m. This alone identifies theregion as a mediterranean sea, similar in structure to the Australasian Mediterranean Sea, adilution basin in the tropics (see Chapter 13). The similarity extends to the fact that bothseas have more than one connection with the main ocean basins and are therefore dominatedin their upper layers by throughflow. The difference is that the Australasian MediterraneanSea is located in a region of large freshwater gain and is a true dilution basin, while overthe Caribbean Sea and the Gulf of Mexico evaporation exceeds precipitation by over 1 mper year, as much as in the case of the Eurafrican Mediterranean Sea and too much to bebalanced by freshwater input from rivers; so the American Mediterranean Sea should reallybe a concentration basin. This is indeed correct: The annual mean salinity, averaged over theupper 200 meters, increases from 36.09 at the inflow through the Lesser Antilles to 36.19in Yucatan Strait and further to 36.39 in the Strait of Florida (Etter et al., 1987). However,for north Atlantic standards these salinities are quite low (Figure 2.5b); they do not reachthe salinity values below the surface layer (compare Figure 16.15). The density increaseassociated with the concentration process is therefore insufficient to cause deep verticalconvection. As a result, deep water renewal does not occur through the sinking of surfacewater (as observed in other concentration basins) but follows the pattern typical for dilutionbasins, i.e. sporadic inflow of oceanic water from outside. This makes the AmericanMediterranean Sea rather unique among all adjacent seas of the world ocean.
The reason for the low salinities in the surface layer is advection of Amazon River waterwith the Guayana and Caribbean Currents. Estimates based on radium measurementsindicate that on average, 15 - 20% of the surface water that enters the Caribbean Sea isderived from the brackish waters of the Orinoco and Amazon River estuaries (Moore et al.,1986). The influence of river runoff is strongly seasonal, with strongest flow occurringbetween May and November; surface salinities in the eastern Caribbean Sea can then drop

Regional Oceanography: an Introduction
pdf version 1.0 (December 2001)
284
to 33 and lower. Even when distributed over the upper 150 - 200 m, the associated densitydecrease is sufficient to de-couple the deep circulation from that at the surface. The water inthe deep basins therefore enters from the southern Sargasso Sea, the Venezuela andColumbia Basins being filled from the Jungfern Passage and the Cayman and YucatanBasins from the Windward Passage (Figure 16.13c). A section following the path throughone of the passages (Figure 16.14) shows the remarkable uniformity of potentialtemperatures below the sill depths and indicates how the water is drawn from a narrow layerat the depth of the sills. Direct observations show the inflow as being confined to a layerless than 200 m thick, as well as being highly variable, often modulated by strong tidalcurrents, and sometimes suppressed for extensive periods. The large scale distribution ofpotential temperature averages over many inflow episodes and gives a good indication of thewater renewal. The variability of the inflow makes estimation of deep water residence timesa difficult task. Numbers found in the literature range from 55 to 800 years.
Fig. 16.12. Topography, subdivisions, and major passages of the American Mediterranean Sea.The 1000, 3000, and 5000 m isobaths are shown, and regions less than 3000 m deep are shaded.
Movement above the sill depths of the passages is dominated by throughflow from theAntilles to Yucatan Strait and into the Gulf of Mexico. The details of the circulation aredetermined by the topography and the location of the source. North Atlantic Deep Water isadvected from the north and consequently enters mainly through Windward Passage, withadditional inflow through Jungfern Passage (Figure 16.13b). Antarctic Intermediate Wateris advected from the southern hemisphere and therefore enters the Caribbean Sea nearlyexclusively through the eastern passages (Figure 16.13a). Central Water is advected withthe North Equatorial Current from the east and finds its way into the Caribbean Sea throughboth the eastern and northern passages (Figure 16.15).

pdf version 1.0 (December 2001)
Ajacent Seas of the Atlantic Ocean 285
Fig. 16.14. Potential temperature (°C) along the section indicated by the dotted line inFig. 16.13c. After Wüst (1963).
Fig. 16.13 Intermediate anddeep water renewal in thebasins of the Caribbean Sea.(a) Salinity at the level of thesalinity minimum near 700 - 850 m, indicating the pathof Antarctic IntermediateWater; (b) oxygen (ml/l) atthe level of the oxygenminimum near 2000 m, indi-cating movement in the upperrange of North Atlantic DeepWater; (c) bottom potentialtemperature (°C), indicatingrenewal paths for the water inthe deep basins. The brokenline indicates the location ofthe section of Fig. 16.14.After Wüst (1963). (The datafor (b) were obtained during1954 - 1958. Data obtainedduring 1932 - 1937 showoxygen levels higher by0.3 ml/l in the east and0.7 ml/l in the west. The in-dicated flow pattern is thesame in both cases.)

Regional Oceanography: an Introduction
pdf version 1.0 (December 2001)
286
The throughflow through the American Mediterranean Sea is part of the system ofwestern boundary currents of the north Atlantic Ocean and therefore associated with largetransports. The total transport through the Caribbean Sea (close to 30 Sv) is well knownfrom detailed measurements in the Strait of Florida, through which all water from YucatanStrait must leave. How much of this flow enters through the passages of the LesserAntilles and how much through Windward Passage is less well established. Earlygeostrophic calculations put the transport through the eastern passages at 26 Sv, leaving4 Sv for Windward Passage. More recent estimates based on a combination of direct currentmeasurements and circulation models reduce the role of the eastern passages significantly,allocating 15 Sv to the Grenada, St. Vincent, and St. Lucia Passages and 5 Sv to theremaining passages in the Lesser Antilles, leaving 10 Sv for Windward Passage (Kinder etal., 1985).
Fig. 16.16. Tracks of 19 satellite-tracked buoys for the period October 1975 - June 1976. FromKinder et al. (1985).
Fig. 16.15. Salinity at the salinity maximum at thetop of the Central Water (approximately 150 - 200 m depth). Depths less than 200 m are shaded.After Wüst (1964).

pdf version 1.0 (December 2001)
Ajacent Seas of the Atlantic Ocean 287
The surface flow through the Caribbean Sea has been documented by drifting buoystracked by satellites. The tracks (Figure 16.16) show the Caribbean Current with speedsaround 0.2 m s-1 in the Grenada Basin, 0.5 m s-1 in the Venezuela, Columbia, andCayman Basins, and 0.8 m s-1 near Yucatan Strait. These velocities are lower than in otherwestern boundary currents and particularly in the western Caribbean Sea lower than thevelocities associated with the eddies produced by the current. This makes the currents highlyvariable and causes occasional flow reversals from westward to eastward in the YucatanBasin. Systematic eastward flow embedded in generally westward movement is found in theGrenada and possibly also in the Venezuela Basin. Observations above the Aves Ridge(Figure 16.17) show a banded flow structure with eastward flow of variable strength near13°N. This flow eventually leaves the Caribbean Sea and enters the Atlantic Ocean as theCaribbean Countercurrent (Figure 14.2). Near 16°N the current appears to be mostlyeastward; but occasionally the flow turns westward with minimum speeds near 16°N.
Fig. 16.17. East-west component of velocity (m s-1, positive is eastward), averaged over0 - 200 m from measurements with an acoustic Doppler current meter, as a function of latitudealong 63.55°W in (a) August 1985, (b) January, (c) March, (d) July, (e) October 1986. Thevelocity scale is correct for (a), other curves are shifted as indicated by the zero velocity line.Adapted from Smith and Morrison (1989).
The continuation of the Caribbean Current through the Gulf of Mexico is known as theLoop Current. This is a true western boundary current which separates from the continentalshelf north of Yucatan Strait. It is therefore characterized by instability of its path andperiodic eddy shedding. Figure 16.18 gives a summary of the circulation features associatedwith the Loop Current. The main path followed by the current penetrates the Gulf to about27°N. The speed of the current in Yucatan Strait usually exceeds 1 m s-1 at the surface butfalls off with depth, reaching 0.4 m s-1 at about 1000 m depth. A southward undercurrentis often found in the last 200 m above the sill depth of 1895 m. It is highly variable, cansustain velocities of 0.05 m s-1 over several months and 0.15 m s-1 in bursts, but amean over three years gave a net southward flow of just under 0.02 m s-1.

Regional Oceanography: an Introduction
pdf version 1.0 (December 2001)
288
Fig. 16.18. Circulation in the Gulf of Mexico. (a) Mean position of the Loop Current during1980 - 1984 (heavy line) and positions inferred from satellite observations of sea surfacetemperature, tracks of satellite tracked drifting buoys indicating eddy movement in the west, andschematic circulation on the northwestern shelf; (b) observed positions of the Loop Current justbefore (thin and dotted lines) and after eddy shedding (heavy lines). Areas shallower than 200 mare shaded.
Fig. 16.19. Temperature along sections A and B shown in Fig. 16.20. Yucatan Strait is on theright. From Lewis and Kirwan (1987).
Occasionally the northern part of the Loop Current separates into a ring and the maincurrent does not reach beyond 25°N for some time (Figure 16.18b). Eddy separation occurson average every 11 months but can vary between 6 and 17 months (Vukovich, 1988). Theeddies or rings are of the anticyclonic, warm core type described in detail in the discussionof the East Australian Current in Chapter 8. Figure 16.19 shows the isothermal core and

pdf version 1.0 (December 2001)
Ajacent Seas of the Atlantic Ocean 289
the depression of the isotherms for one such eddy as it was crossed by two sections alongtracks only about 100 km apart. Note the difference in the depth of the 15 - 25°C isothermsacross Yucatan Strait (the southern end of the sections); the associated thermocline slopeindicates the Loop Current as it leaves the Strait between the two sections. The steep slopeof the isotherms further north in section B indicates where the Loop Current crosses thesection to continue towards Florida Strait.
Fig. 16.20. Long term mean variability of sea level (cm). After Maul and Hermann (1985). Thelines indicate the positions of sections A and B of Fig. 16.19.
Once formed the eddies drift away from the Loop Current in a general southwestwarddirection at 3 - 4 km per day. Like other eddies of western boundary currents they havetypical diameters of 200 - 300 km and surface speeds of 1 - 2 m s-1 depending on age.When they reach the western continental shelf they still induce shelf currents as high as0.7 m s-1. Figure 16.18 shows typical eddy paths as reflected in the movement of driftingbuoys. It is obvious that the direction of water movement in the western Gulf of Mexico atany particular moment is determined by the eddy field. Given their rate of formation andmean drift speed, between one and three eddies are usually present at any one time. The netcirculation, determined geostrophically from smoothed data, indicates anti-cyclonic(clockwise) movement of about 5 Sv around the Gulf and a smaller cyclonic feature in thenorth with a transport of 8 Sv and linked with the circulation on the northern shelf(Figure 16.18a).

Regional Oceanography: an Introduction
pdf version 1.0 (December 2001)
290
The westward passage of the eddies is accompanied by large variations in sea level (asexplained with Figures 2.7 and 3.2 - 3.4), and a map of the long-term mean variability ofsea level is a useful indicator of eddy movement. Figure 16.20 indicates mean sea levelvariability of 0.3 m in the eddy formation region and variability levels near 0.2 m alongthe major eddy drift path. This amounts to about 60% of the variability level in the centreof the Gulf Stream eddy region and indicates the high level of kinetic energy that isdispersed in the western Gulf of Mexico.
The Irish Sea, the North Sea, and the Baltic Sea
The three seas in the last geographical subdivision are all part of the Europeancontinental shelf and therefore mostly shallow, the only notable exception being theNorwegian trench in the North Sea. The Irish and North Seas both have long openconnections with the Atlantic Ocean proper and are dominated by strong tidal currents andfrequent strong winds; they are therefore similar in character. In contrast, communicationbetween the Baltic Sea and the Atlantic Ocean is only indirect (through the North Sea) andseverely restricted, which makes the Baltic Sea the fourth mediterranean sea of the AtlanticOcean. Our discussion of the basics of ocean dynamics in Chapters 1 - 5 did not include themodifications that occur in coastal, shelf, and estuarine areas. With these limitations in ourunderstanding of the processes responsible for water movement and renewal in shallow seaswe have to restrict our description of the circulation and hydrology on the European shelf toa few general remarks.
An important element of the dynamics of shallow seas with a good connection to thedeep ocean is tidal movement. As the tide enters from the ocean the tidal current increasesin magnitude as the water depth decreases. The increase in current speed is not restricted tothe surface layer but occurs at all depths. The associated turbulence acts like a giant stirringmechanism trying to break down the stratification. There is therefore a competition betweensolar heat input at the surface, which acts to stabilize the water column, and mixing fromthe tides, which attempts to homogenize the water column. In deep water tidal currents areweak and the water is stratified. In shallow water the currents are strong and the water iswell-mixed. The transition between the mixed region and the stratified region occurs in a
Fig. 16.21. Sketch of a temperaturesection through a shallow sea front,based on observations from theeastern entry to the EnglishChannel. Note that the temperatureon the shallow side (on the left)equals the temperature in the core ofthe thermocline.

pdf version 1.0 (December 2001)
Ajacent Seas of the Atlantic Ocean 291
frontal zone known as a shallow sea front. Figure 16.21 gives a sketch of such a front.Shallow sea fronts occur at well defined locations which are determined by a combination ofwater depth h and tidal currentu. Energy arguments show that the parameter which measuresthe competition between thermal stabilization and tidal stirring is h/u3.
Fig. 16.22. Shallow sea fronts in the Irish Sea. (a) Sea surface temperature derived from satelliteobservations during May 1980; dark is warm, gray and white is cold (some small scale whitefeatures are clouds). The dark regions are stratified and therefore show warm surface temperature,while the gray regions are mixed. Fronts are found along the edges of the gray regions.(b) Contours of log10 h/u3; the contour closest to the position of the fronts is highlighted.Adapted from Simpson (1981).
The topography of the Irish Sea resembles that of a channel with gentle slopes on eitherside. Maximum depths along the axis are near 110 - 140 m in the south and exceed 250 mbetween northern Ireland and Scotland. East of 4.5°W the depth rarely exceeds 50 m. If thistopography is combined with the magnitude of the tidal current, the resulting distributionof h/u3 gives the contours shown in Figure 16.22. By comparing the contours with the seasurface temperature during May 1980 it is seen that most of the Irish Sea is well-mixedthroughout the year and separated from the stratified regions by shallow sea fronts in thenorth and south.
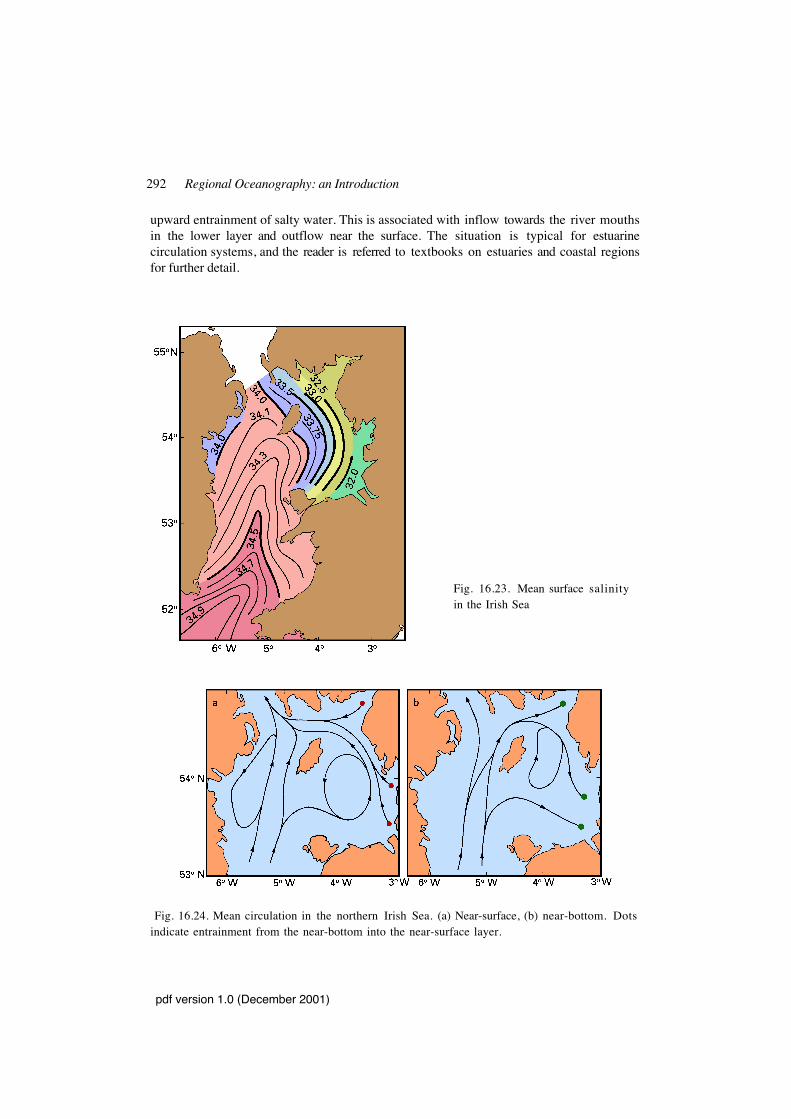
Mean flow through the Irish Sea is weak and difficult to measure directly, due to thedominance of strong tidal flow. It can be deduced from hydrographic properties, whichindicate northward movement with inflow from the Celtic Sea and outflow to the Hebrides(Figure 16.23). The circulation in the eastern Irish Sea is modified by freshwater inputfrom several rivers which lowers the sea surface salinity (Figure 16.24) and produces
Regional Oceanography: an Introduction
pdf version 1.0 (December 2001)
292
upward entrainment of salty water. This is associated with inflow towards the river mouthsin the lower layer and outflow near the surface. The situation is typical for estuarinecirculation systems, and the reader is referred to textbooks on estuaries and coastal regionsfor further detail.
Fig. 16.24. Mean circulation in the northern Irish Sea. (a) Near-surface, (b) near-bottom. Dotsindicate entrainment from the near-bottom into the near-surface layer.
Fig. 16.23. Mean surface salinityin the Irish Sea

pdf version 1.0 (December 2001)
Ajacent Seas of the Atlantic Ocean 293
The introduction of nuclear power stations resulted in contamination of the Europeanshelf with radioactive cesium nuclides from two nuclear fuel reprocessing plants. Sellafield(formerly Windscale), the larger of the two, is located on the coast of the northern Irish Sea.The spreading of 137Cs confirms the concept of mean northward flow and indicates thepassage of Irish Sea water into the North Sea within 3 - 4 years (Figure 16.25). Some137Cs spreads into the Celtic Sea to the south by tidal dispersion and during occasionalwind-driven reversals of the mean flow. The same process disperses some 137Cs from LaHague, the second reprocessing plant which is located on the French coast of the EnglishChannel, westward allowing it to enter the southern Irish Sea with the mean flow.
Fig. 16.25. Spreading of 137Cs from Sellafield (a) and La Hague (b), expressed as average time inyears required for a water particle to travel to the positions indicated by the contours. The distri-bution is the result of dispersion and advection with the mean flow, the latter being indicated bythe asymmetry of the contours with respect to the release point. From Zimmerman (1984).
The inferences made from the distribution of 137Cs can be extended to give informationon the mean water movement of the North Sea as well. Effluent from La Hague spreadsmainly eastward, indicating a net flow of water through the English Channel from the Bayof Biscay into the North Sea. The North Sea itself displays anti-clockwise circulation,evidenced by the movement of Sellafield effluent along the British coast and the spreadingof La Hague effluent along the Scandinavian coast.
The North Sea is generally shallow, with depths around 120 - 150 m in the northdecreasing to 100 m between Aberdeen and Stavanger, to 50 m between Hull and Skagen,and to 30 - 40 m further to the southeast. An exception is the Doggerbank, a shallowregion that stretches from 2°E to 6°E just south of the 50 m isobath. At 54.3°N, 2°E itrises to 13 m and is feared by fishermen for its dangerous waves which can break in severeweather and have caused the loss of more than one vessel. The other exception is theNorwegian trench which stretches along the Norwegian coastline with depths around 300 mand a width of 35 - 80 km at the 250 m depth contour; between 7°E and 9°E it ends in adepression with a maximum depth of 700 m.

Regional Oceanography: an Introduction
pdf version 1.0 (December 2001)
294
The mean circulation can be seen in the salinity distribution which changes little over theyear. Figure 16.26 compares the salinity near the sea surface with the distribution near thebottom. It is seen that the salinity difference between the two surfaces is small over mostof the North Sea; but significant differences are observed in the north and in particular thenortheast. They are related to the water movement and indicate the presence of a two-layercirculation system in the Skagerrak and the Norwegian trench. Low-salinity water from theBaltic Sea enters the North Sea at the surface and joins the northern branch of the anti-clockwise circulation which derives most of its water from the central North Sea. Theinflow is intermittent and controlled by the local wind. High salinity water moves eastwardfrom the open Atlantic Ocean along the southern slope of the Norwegian trench and returnsalong its northern side; some of it fills the depression in the east. Mean currents in thecentral and southern North Sea do not vary much with depth.
Fig. 16.26. Mean salinity and circulation in the North Sea for June. (a) At 7.5 m depth,(b) above the bottom. Bold numbers give average transport in 1000 km3 per year (1000 km3
per year = 0.03 Sv). Adapted from Goedecke et al. (1967).
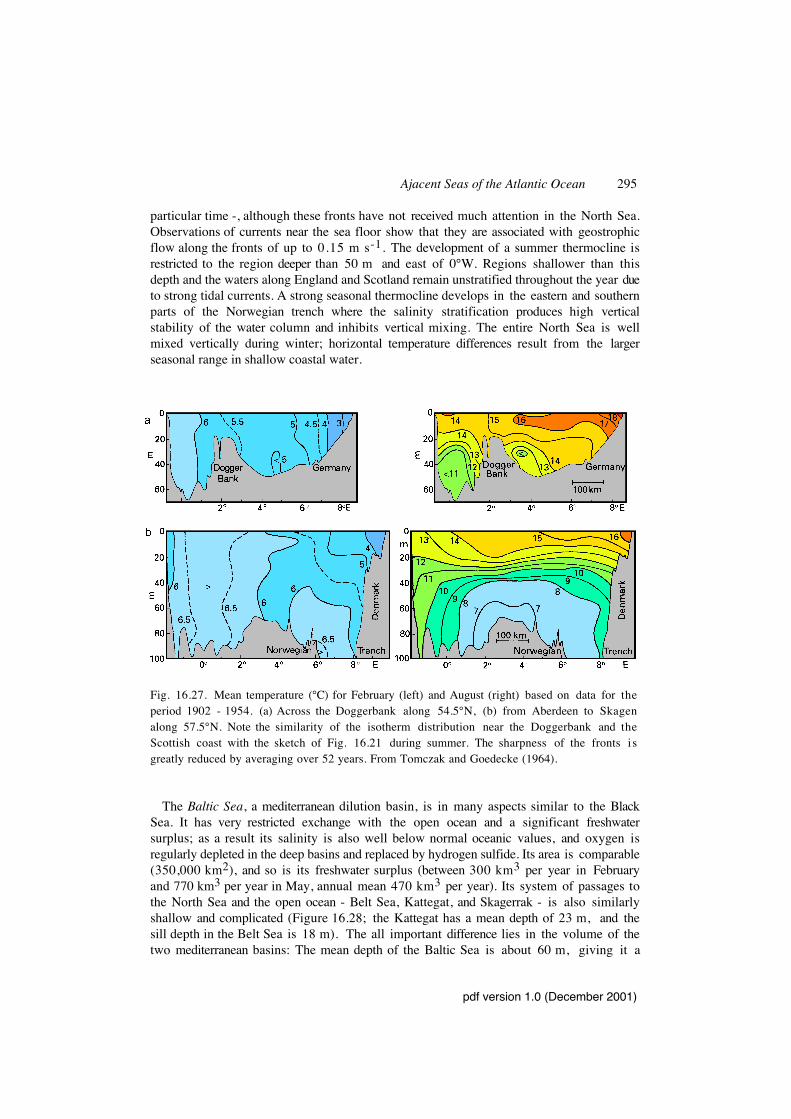
The temperature distribution shows more seasonal variation and regional structure. Seasurface temperatures in the central North Sea vary between 2 - 4°C in winter and 18 - 20°Cin summer, the total range increasing monotonically from northwest to southeast. Close tothe Dutch and German coast the range increases to -1 - 22°C, bringing occasional iceformation. The vertical structure of the temperature field (Figure 16.27) shows the imprintof shallow sea front dynamics (discussed above with the Irish Sea), a clear indication forstrong tidal currents - tides dominate the flow field and sea level in the North Sea at any
pdf version 1.0 (December 2001)
Ajacent Seas of the Atlantic Ocean 295
particular time -, although these fronts have not received much attention in the North Sea.Observations of currents near the sea floor show that they are associated with geostrophicflow along the fronts of up to 0.15 m s-1. The development of a summer thermocline isrestricted to the region deeper than 50 m and east of 0°W. Regions shallower than thisdepth and the waters along England and Scotland remain unstratified throughout the year dueto strong tidal currents. A strong seasonal thermocline develops in the eastern and southernparts of the Norwegian trench where the salinity stratification produces high verticalstability of the water column and inhibits vertical mixing. The entire North Sea is wellmixed vertically during winter; horizontal temperature differences result from the largerseasonal range in shallow coastal water.
Fig. 16.27. Mean temperature (°C) for February (left) and August (right) based on data for theperiod 1902 - 1954. (a) Across the Doggerbank along 54.5°N, (b) from Aberdeen to Skagenalong 57.5°N. Note the similarity of the isotherm distribution near the Doggerbank and theScottish coast with the sketch of Fig. 16.21 during summer. The sharpness of the fronts i sgreatly reduced by averaging over 52 years. From Tomczak and Goedecke (1964).
The Baltic Sea, a mediterranean dilution basin, is in many aspects similar to the BlackSea. It has very restricted exchange with the open ocean and a significant freshwatersurplus; as a result its salinity is also well below normal oceanic values, and oxygen isregularly depleted in the deep basins and replaced by hydrogen sulfide. Its area is comparable(350,000 km2), and so is its freshwater surplus (between 300 km3 per year in Februaryand 770 km3 per year in May, annual mean 470 km3 per year). Its system of passages tothe North Sea and the open ocean - Belt Sea, Kattegat, and Skagerrak - is also similarlyshallow and complicated (Figure 16.28; the Kattegat has a mean depth of 23 m, and thesill depth in the Belt Sea is 18 m). The all important difference lies in the volume of thetwo mediterranean basins: The mean depth of the Baltic Sea is about 60 m, giving it a

Regional Oceanography: an Introduction
pdf version 1.0 (December 2001)
296
total volume of about 20,000 km3 or 4% of the volume of the Black Sea. Thus, while theexchange of water between the Baltic and North Seas carries transports similar to thosebetween the Black and Mediterranean Seas, the amount of basin water requiring renewalthrough inflow from the open ocean is much less, and de-oxygenation in the deep basins isnot permanent. The average salinity (Figure 16.29), on the other hand, is even lower thanin the Black Sea, since the river runoff constitutes 2% of the Baltic Sea volume.
Fig. 16.28. Topography of the Baltic Sea. Depths > 100 m are stippled, with contours drawn for50, 100, 300, and 500 m depth. AD: Arkona Deep, BB: Bornholm Basin, BS: Belt Sea, DS: DarßSill, GD: Gotland Deep, LD: Landsort Deep. Numbers in italics give the probability of total icecoverage (100% = total ice cover every year). The inset shows the minimum (black) andmaxi–mum (stippled) extent of anoxic conditions in the central basins for the period 1979 -1988; adapted from Nehring (1990).

pdf version 1.0 (December 2001)
Ajacent Seas of the Atlantic Ocean 297
Fig. 16.29. Salinity in a section along the axis of the Baltic Sea. Note the change of contouringinterval across the Darß Sill.
The strong salinity stratification provides the water column with ample stability even inwinter, and convective mixing during the cooling period is restricted to the upper 70 m orso. This results in a large seasonal temperature variation at the surface and in combinationwith the low surface salinity leads to regular ice formation (Figure 16.28). Below 70 mdepth the temperature is rather stable and quickly approaches the 5.5°C found throughoutthe year in the deep basins. The thermocline at 70 m is also the upper limit for theoccurrence of hydrogen sulfide during extended periods of stagnation; during most yearshydrogen sulfide does not occur above 120 - 150 m depth.
Water renewal in the Baltic basins is a highly intermittent process. Individual inflowevents last between ten days and three months (average duration 32 days) and are associatedwith a rise of sea level in the Baltic Sea of some 0.6 m. They are restricted to the periodAugust - April; most of them occur in December. Mean inflow velocities are 0.1 m s- 1
near the Darß Sill and 0.08 m s-1 on approaching the Bornholm Basin. On average, theamount of water transported into the Baltic Sea is 200 ± 100 km3, which is 35 - 100% ofthe volume of the Belt Sea. The amount of high salinity water brought in by each event is,however, considerably less, because at the beginning of the inflow the lower layer of theBelt Sea contains a mixture of low salinity Baltic and high salinity North Sea water and hasto be emptied before less diluted high salinity water can flow in. Figure 16.30 shows thevolumes of high salinity water transported by the 90 major events which were identified forthe period 1897 - 1976. It is seen that the events occur in clusters, on average every threeyears, and alternate with periods of 1 - 4 years without major inflow. The same variabilityhas been found in the meridional wind component over the North Atlantic Ocean (Börngenet al., 1990). This suggests that inflow into the Baltic Sea is controlled by interannualvariability of the global climate.
Systematic measurements in the deep basins indicate that long term climate change isalso likely to affect the hydrography of the Baltic Sea. Data collected since 1958(Figure 16.31) indicate that several major renewal events reached the Gotland Deep;however, it is also clear from the data that over the observation period deep water renewal isnot frequent enough to prevent a general increase of hydrogen sulfide concentration and thatno major inflow event occurred after 1976*. This is accompanied by progressive freshening,a result of diffusion through the halocline. Whether this process will continue isimpossible to predict at present. What is clear from the data is that the hydrographic state ofthe Baltic Sea is finely tuned and susceptible to changes in the world climate. It also reacts

Regional Oceanography: an Introduction
pdf version 1.0 (December 2001)
298
strongly to small changes induced by human activity. Present plans to connect Denmarkand Sweden by a system of bridges or tunnels can have a major impact on deep waterrenewal if the sill depths or cross-sections of the Belt Sea passages are changed.
Fig. 16.30. Volumes of high salinity inflow into the Baltic Sea. The gaps during 1914 - 1918and 1939 - 1945 are from lack of observations. From Matthäus and Franck (1990).
Fig. 16.31. Oxygen O2 (ml/l), hydrogen sulfide H2S (ml/l, plotted as negative oxygen), andsalinity S at a station in the Gotland Deep. Strong inflow events occurred in 1965, 1970, 1973,and 1976. Note that after each inflow event salinity and oxygen are higher at 235 m than at200 m, indicating that renewal takes place near the bottom and progresses upward by turbulentdiffusion. After Nehring and Matthäus (1990).
*A major inflow event, comparable in volume to earlier major events, occurred during thewinter of 1992/1993. A full assessment of its impact on water renewal in the Baltic deepbasins was not possible at the time of printing.