Embed Size (px)
Citation preview

1
Adjuvent and New therapeutic interventions in Septic Shock ?
Pierre-François LaterreDepartment of CCM
St Luc University Hospital, UCLBrussels

2
time from hypotension onset (hrs)0-0.50.5-11-2 2-3 3-4 4-5 5-6 6-9 9-1212-2424-3636+
fract
ion
of to
tal p
atie
nts
0.0
0.2
0.4
0.6
0.8
1.0 survival fractioncumulative antibiotic initiation
Cumulative Initiation of Effective Antimicrobial Therapy and Survival in Septic Shock
Kumar et al, CCM
(N = 2740)

3
4

5
Hypothesis ?
• Host response is excessive in sepsis and blocking or suppressing this response should improve outcome ?
• Host response represents a final common pathway whatever the source of infection and modulating the response should work ?

6
Interaction between bacterial products and pattern recognition receptors
Bochud PY, Calandra T, BMJ 2003;326:262-6

7
MONOCYTE-MACROPHAGE
CytokinesChemokinesNitric oxide
Acute phase proteinsPro-coagulants
CD 14
TLR4
MD-2
Signal transduction
TIR
NFkBtk, mapk
3714 genes (12% of the human transcriptome) is
altered over 24 hours upon exposure to LPS
Lowry et al. Nature 2005;437:1032-7
LPS-mediated gene induction

9Hotchkiss and Karl NEJM 2003;348:138
Receptor downregulation (TLR 4, TNFR, HLA-DR)
Soluble (sIL1,6,TNFr) and decoy receptors (IL-1R2)
Receptor antagonists (IL-1ra)
Anti-inflammatory cytokines (IL-4,10,13)
Intracellular inhibitors (SOCS, IkB, Tollip, MyD88s)
Cellular apoptosis of B cells CD4 T cells and FDCs
Sepsis-induced immunosuppression
Sepsis-targeting the host response

10
Immunosuppression of patients who die from sepsis and MOFJS Boomer et al.

11
Anti-Inflammatory Sepsis TrialsApparent Benefit and Confidence Intervals
Natanson et al. Crit Care Med 26:1927‐1931,1998

12
Day 1 Day 4 Day 7
Survivors
**
**
Non‐survivors
40
50
60
70
80
Protein C %
** p < 0.05 for the comparison of survivors with nonsurvivors
Lorente, Chest 1993
Protein C deficiency is associated with an increased mortality

13
20
40
60
80
100
120
r hr
PC A
ntig
en (%
)
Time: PChem WBC Fever 6 hr 12 hr 18 hr 24 hr 36 hr 48 hr 60 hr 72 hr
* * * * * * Denotes Statistical Significance at two-sided 0.05 level
Normal Range: 73.7 - 139.9
Hartman DL., Meister R, Yan SB, et al Chest, 1997
Severe Sepsis Patients
average time to diagnose severe sepsis
Shock Patients
average time to diagnose septic shock

15
PROWESS 28-day results
• N=1690– 6.1% absolute mortality reduction (p=0.006)– Largest reduction in ‘high risk’ subgroups
0 7 14 21 28
70
80
90
100
Study day
% s
urvi
val
0
Placebo
Drotrecogin alfa (activated)
Bernard et al. NEJM 2001

17
Survival in Patients With CAP-Induced High-Risk Severe Sepsis
.
18
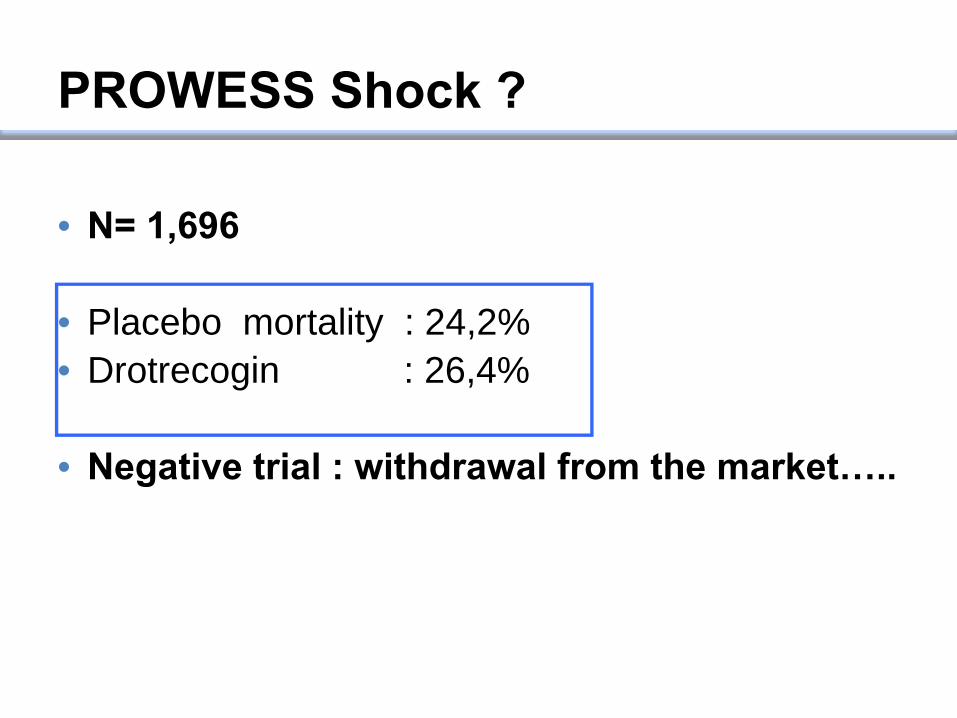
PROWESS Shock ?
• N= 1,696
• Placebo mortality : 24,2%• Drotrecogin : 26,4%
• Negative trial : withdrawal from the market…..

19
Sample Size• 1500 patients• 80% power at an alpha level of .05• Assumptions:
– Placebo mortality rate of 35%– Treatment with drotrecogin alfa
(activated) is associated with a 20% relative risk reduction
– Drotrecogin alfa (activated) mortality rate of 28%

20
PROWESS Shock ?
• Why did it fail ?
– Severity : Placebo mortality 24.2% ??..initial assumption was a 35% mortality rate• Lack of severity ?• Dramatic improvement in sepsis
treatment ?
– Severe bleeding : no difference ? (only trial !) is this a witness of low severiry ?
22
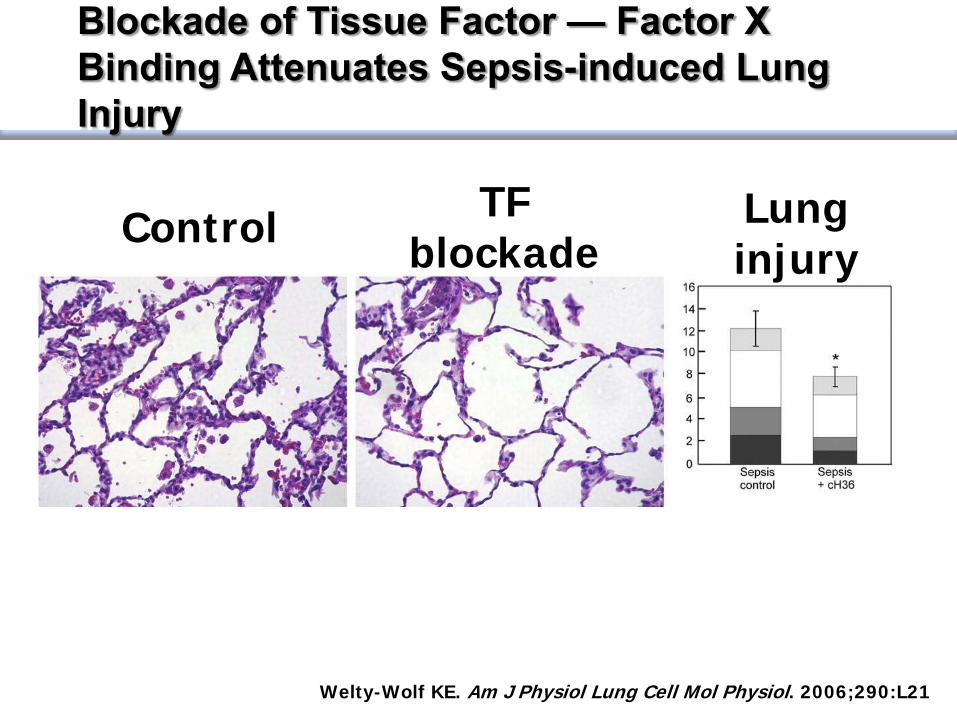
Control TF blockade
Lung injury
Blockade of Tissue Factor — Factor X Binding Attenuates Sepsis-induced Lung Injury
Welty-Wolf KE. Am J Physiol Lung Cell Mol Physiol. 2006;290:L21.

23
28-day All-cause Mortality(ITT population)
17,219,3
17
0
5
10
15
20
28-d
ay M
orta
lity
(%)
Tifacogin 0.025 mg/kg/hTifacogin 0.075 mg/kg/hPlacebo
After 1st Interim Analysis
Overall

24
28 Day All-Cause Mortality, INR > 1.2TFPI versus Placebo

25
RESULTS: 28-day mortality - all patients
P = 0.510
20
40
60
80
100
% mortality
steroids(n=251)
86(34.3%)
placebo(n=248)
78(31.5%)
Corticus

26P value for log rank test: 0.786
placebosteroid
survival
0
0.25
0.50
0.75
1.00
0 5 10 15 20 25 30
day
RESULTS: 28 day survival curves- ACTH non-responders

27
SOFA cardiovascular score
0
1
2
3
4
SOFA
car
diov
ascu
lar
scor
e (m
ean
+/- S
D)
0 1 2 3 4 5 6 7 14 28
Time after study inclusion (days)
Hydrocortisone Placebo(* p < 0.05)
* * * * *

43
E. coli Lipid A Versus Eritoran (E5564) as a Lipid A Antagonist
TLR4 binding
site
Tetra-acyl format (1)
Hexa-acyl format
β hydroxyl myristic acid (3)C-length
(2)
E. colilipid A
Park et al. Nature 2009;7830:1-5

44
Low-dose eritoran: 45 mg/6 days (n=58)
High-dose eritoran: 105 mg/6 days (n=51)
High-Risk Patients: APACHE II >50%
P=0.07
Placebo (n=53)
High-dose eritoran
Placebo
Eritoran Phase II Clinical Trial
Tidswell et al. Crit Care Med 2010;38:72-83

45
APACHE II Quartile
28-D
ay M
orta
lity
(%)
Mortality by APACHE II Quartile
Presence of Shock at Baseline
Mortality by Presence of Shock
28-D
ay M
orta
lity
(%) P=0.598 P=0.434
P=0.105
P=0.083
P=0.503
P=0.913
YES NO
Tidswell et al. Crit Care Med 2010;38:72-83
Eritoran Phase II Clinical Trial Prospectively Defined Subgroups
34.6
28.931.8
24.5

46
Endotoxin in Critically Ill
J Marshall JID 2004

48
ACCESS Trial
159 worldwide study locationsJust under 2000 patients enrolled in trial
A Phase 3, Multicenter, Randomized, Double-Blind, Placebo-Controlled Study Evaluating
Eritoran Tetrasodium in Patients with Severe Sepsis: Can Inhibition of TLR-4 Improve All-Cause Mortality
in Patients with Severe Sepsis?
A Controlled Comparison of Eritoran Tetrasodium and Placebo in Patients with Severe Sepsis

55
Disease Severity and Characteristics
Variables at baselinePlacebo (N=657)
Eritoran (N=1304)
APACHE II Mean (+/-SD) 27.3 (4.52) 27.2 (4.50)21 to 24 209 (31.8%) 441 (33.8%)25 to 26 122 (18.6%) 219 (16.8%)27 to 31 194 (29.5%) 371 (28.5%)32 to 37 128 (19.5%) 265 (20.3%)
All Organ Dysfunctions, n (%) ALI/ARDS 164 (25.0%) 296 (22.7%)Thrombocytopenia 102 (15.5%) 221 (16.9%)Lactic acidosis 333 (50.7%) 625 (47.9%)Shock 533 (81.1%) 1070 (82.1%)AKI 226 (34.4%) 472 (36.2%)
Number of Organ Failures, n (%)1 223 (33.9%) 449 (34.4%)2 234 (35.6%) 443 (34.0%)3 138 (21.0%) 299 (22.9%)4 or 5 62 (9.5%) 110 (8.4%)

57
Variable (Site and type of infection)Placebo (N=657)
Eritoran (N=1304)
Lung 254 (38.7%) 519 (39.8%)Genitourinary 106 (16.1%) 185 (14.2%)Intra-abdominal/GYN 163 (24.8%) 300 (23.0%)Catheter-related blood 6 (0.9%) 24 (1.8%)Skin/soft tissue 50 (7.6%) 91 (7.0%)CNS 12 (1.8%) 27 (2.1%)Endovascular 6 (0.9%) 24 (1.8%)Bone/joint 10 (1.5%) 22 (1.7%)
Type of Infection Gram negative bacteria 215 (32.7%) 421(32.3%)Gram positive bacteria 182 (27.7%) 349 (26.8%)Mixed gram+ and gram− bacteria 76 (11.6%) 136 (10.4%)Fungal / Mixed bacterial and fungal 4 (0.6%)/ 15 (2.3%) 19 (1.5%)/ 34(2.6%)Unknown 143 (21.8%) 299 (22.9%)
Disease Characteristics: Adjudicated by CEC

59
Sepsis Treatment Adjudicated by CEC
Sepsis TreatmentPlacebo(N=657)
Eritoran (N=1304)
Source Control-Adequate 238 (36.2%) 454 (34.8%)Source Control- Inadequate 39 (5.9%) 84 (6.4%)N/A 380 (57.8%) 766 (58.7%)
Antimicrobial Therapy TypeTargeted 487 (74.1%) 952 (73.0%)Empiric 148 (22.5%) 307 (23.5%)
Appropriate Antimicrobial Therapy YES 612 (93.2%) 1199 (91.9%)NO 23 (3.5%) 59 (4.5%)
Time to Appropriate Antimicrobial Rx< 0 hour 270 (41.1%) 517 (39.6%)0 to 4 hours 207 (31.5%) 383 (29.4%)4 < to 8 hours 52 (7.9%) 125 (9.6%)8 < to 12 hours 21 (3.2%) 39 (3.0%)12 < to 24 hours 11 (1.7%) 37 (2.8%)> 24 hours 51 (7.8%) 98 (7.5%)
Appropriate Antimicrobial Duration 604 (91.9%) 1161 (89.0%)

62
28-Day Mortality
0 1 2 3 4 5 6 7 8 9 10 11 12 13 14 15 16 17 18 19 20 21 22 23 24 25 26 27 280.4
0.5
0.6
0.7
0.8
0.9
1.0
Surv
ival
Study Day
Log-rank test P value: 0.5789
Hazard ratio (95% CI): 1.05 (0.88, 1.26)
Placebo
Eritoran
Placebo Censored
Eritoran Censored

63
1-Year Mortality (Secondary Endpoint)
0 30 60 90 120 150 180 210 240 270 300 330 360 3900.4
0.5
0.6
0.7
0.8
0.9
1.0
Surv
ival
Study Day
Log-rank test P value: 0.7924
Hazard ratio (95% CI): 0.98 (0.85, 1.13)
Placebo
Eritoran
Placebo Censored
Eritoran Censored

64
OverallAge Categorized
Age 18−64 yrAge ≥ 65 yr
GenderMaleFemale
RaceBlackWhiteAsianOther
APACHE II Group< 21≥ 21 − ≤ 24> 24 − ≤ 26> 26 − ≤ 31> 31 − ≤ 37> 37
Qualifying Organ DysfunctionLung injury/respiratory distressThrombocytopeniaLactic acidosisShockAcute renal failure
Number of Organ Dysfunctions012345
Time to First Dose of Study Drug from Recognition of Qualifying Organ Dysfunction> 0 − ≤ 4 hours> 4 − ≤ 8 hours> 8 − ≤ 10 hours> 10 − ≤ 12 hours> 12
28-Day MortalitySubgroup Analysis (1)
Worse Better Mortality (%)Difference (95% CI)N Placebo Eritoran
1961
8141147
1145816
120154423958
5650341565393
7
189157500959153
367267743715517
11865338474360
26.9
20.731.3
26.128.1
11.628.725.321.1
19.129.525.838.350.0
25.419.128.428.421.3
21.523.535.542.120.0
31.625.031.025.140.0
28.1
23.031.7
26.530.3
19.529.023.738.5
0.022.428.329.135.866.7
21.430.932.028.021.7
0.024.924.235.136.750.0
26.329.128.726.437.5
−1.1 (−5.3, 3.1)
−2.2 (−8.3, 3.8)−0.4 (−6.1, 5.2)
−0.4 (−5.8, 5.0)−2.2 (−8.8, 4.4)
−7.9 (−21.8, 6.1)−0.3 (−5.1, 4.5)1.6 (−9.8, 13.0)−17.4 (−43.1, 8.3)
−3.3 (−10.1, 3.4)1.2 (−8.8, 11.2)−3.3 (−11.1, 4.5)2.4 (−7.7, 12.6)
−16.7 (−90.7, 57.4)
4.0 (−8.7, 16.6)−11.8 (−27.0, 3.5)−3.6 (−12.2, 4.9)
0.4 (−5.6, 6.4)−0.4 (−14.5, 13.7)
−3.4 (−10.3, 3.4)−0.6 (−7.4, 6.1)0.4 (−9.2, 10.0)
5.4 (−10.5, 21.3)−30.0 (−81.3, 21.3)
5.3 (−12.0, 22.7)−4.1 (−11.4, 3.1)2.3 (−7.6, 12.2)−1.3 (−8.0, 5.3)2.5 (−23.6, 28.6)

65
28-Day MortalitySubgroup Analysis (2)
SOFA Scores − Cardiovascular0 − 12 − 4
SOFA Scores − Respiratory0 − 12 − 4
SOFA Scores − CNS0 − 12 − 4
SOFA Scores − Renal0 − 12 − 4
SOFA Scores − Coagulation0 − 12 − 4
SOFA Scores − Hepatic0 − 12 − 4
Infection SiteLung Primary bloodstreamGenitourinaryAbdomenSkin/soft tissueCNSCatheter-related bacteremiaOther
Primary Care StatusMedicalBurnSurgicalTrauma
Worse Better Mortality (%)N Placebo Eritoran
3011658
2681647
1047866
9051029
1282286
1639255
100050
4174641774546
113
11636
74151
20.428.0
21.328.1
24.329.9
21.530.8
23.736.8
25.933.7
29.541.716.829.616.428.618.222.6
28.50.0
26.26.7
27.628.2
26.428.0
25.130.1
20.634.8
24.836.6
27.525.6
29.826.323.929.235.235.534.334.1
28.80.0
27.916.7
−7.2 (−17.7, 3.3)−0.1 (−4.7, 4.4)
−5.2 (−16.0, 5.6)0.1 (−4.5, 4.7)
−0.8 (−6.3, 4.7)−0.2 (−6.8, 6.3)
0.9 (−4.7, 6.6)−4.0 (−10.0, 2.0)
−1.1 (−6.0, 3.9)0.2 (−11.7, 12.1)
−1.6 (−6.2, 2.9)8.2 (−3.6, 19.9)
−0.3 (−6.4, 5.7)15.4 (−14.4, 45.1)−7.1 (−15.3, 1.1)
0.4 (−8.3, 9.1)−18.9 (−33.4, −4.4)−6.9 (−36.7, −22.8)−16.1 (−47.3, 15.1)−11.6 (−30.7, 7.5)
−0.3 (−5.9, 5.2)0.0 (0.0, 0.0)
−1.7 (−8.4, 5.0)−10.0 (−30.7, 10.7)
Difference (95% CI)

66
28-Day MortalitySubgroup Analysis (3)
Primary Focus of InfectionLungGenitourinaryIntra-abdominal or GYNCatheter-related, bloodstreamSkin or soft tissueCNS (brain or spinal cord)Endovascular infectionBone/jointHead/ear/nose/throatPleuralNoneOtherUnknown
Infection TypeGram positiveGram negativeGram+/gram− bacteriaFungalViralBacterial/fungal/otherUnknownNo evidence of infection
RegionNorth AmericaLatin AmericaEuropeAsiaRest of World
Worse Better Mortality (%)N Placebo Eritoran
77329146330
1413930321317632346
531636212231
4944267
611112895214129
29.913.230.733.322.033.316.720.00.0
20.028.620.056.3
24.722.327.650.00.0
26.735.727.3
29.053.123.423.428.6
27.414.628.333.336.340.766.718.220.08.3
40.550.036.7
33.821.932.447.4
100.026.525.140.0
29.250.025.222.631.0
2.6 (−4.2, 9.3)−1.4 (−9.7, 6.9)2.3 (−6.3, 11.0)
0.0 (−42.2, 42.2)−14.3 (−30.2, 1.7)−7.4 (−40.5, 25.7)−50.0 (−94.3, −5.7)
1.8 (−27.4, 31.0)−20.0 (−66.6, 26.6)11.7 (−21.9, 45.3)−11.9 (−37.1, 13.3)−30.0 (−79.1, 19.1)19.6 (−10.5, 49.7)
−9.1 (−17.4, −0.8)0.5 (−6.3, 7.3)−4.7 (−17.7, 8.2)2.6 (−51.2, 56.5)
0.2 (−26.6, 27.0)10.6 (1.6, 19.6)
−12.7 (−37.2, 11.7)
−0.2 (−7.8, 7.4)3.1 (−17.4, 23.6)−1.8 (−7.7, 4.2)0.7 (−11.0, 12.5)−2.5 (−19.4, 14.5)
Difference (95% CI)
71
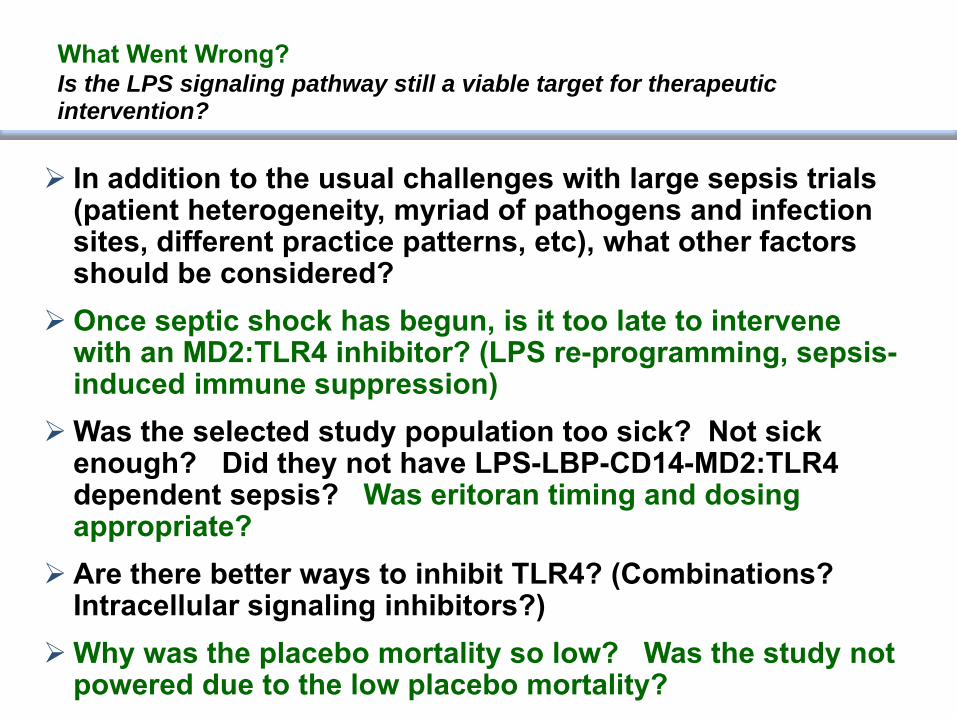
What Went Wrong?Is the LPS signaling pathway still a viable target for therapeutic intervention?
In addition to the usual challenges with large sepsis trials (patient heterogeneity, myriad of pathogens and infection sites, different practice patterns, etc), what other factors should be considered?Once septic shock has begun, is it too late to intervene with an MD2:TLR4 inhibitor? (LPS re-programming, sepsis-induced immune suppression)Was the selected study population too sick? Not sick enough? Did they not have LPS-LBP-CD14-MD2:TLR4 dependent sepsis? Was eritoran timing and dosing appropriate?Are there better ways to inhibit TLR4? (Combinations? Intracellular signaling inhibitors?)Why was the placebo mortality so low? Was the study not powered due to the low placebo mortality?

72

73

74
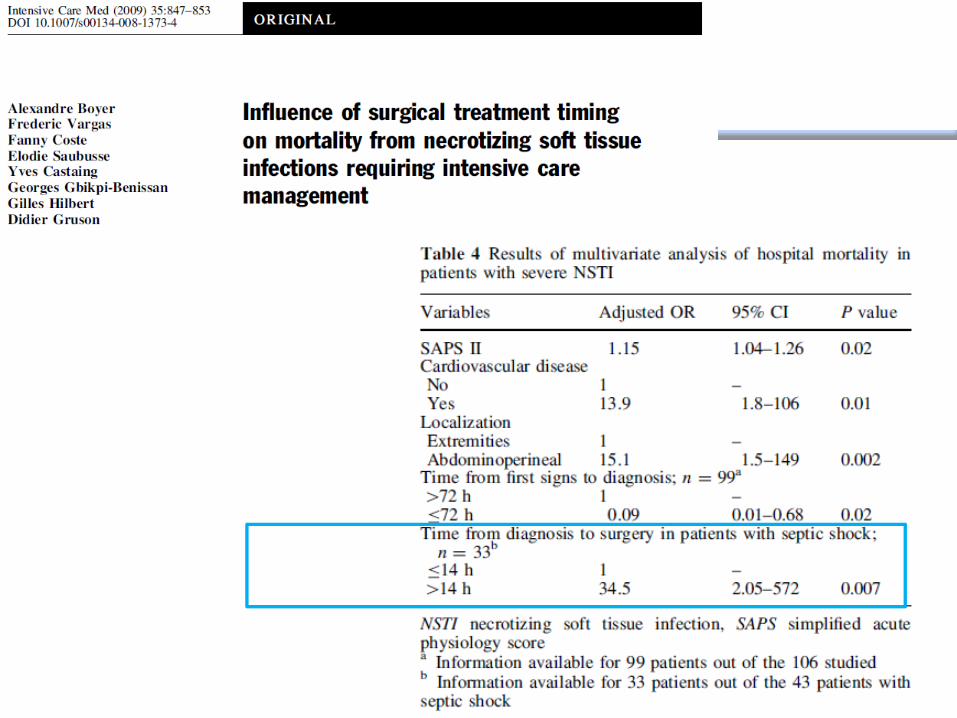
CCM 2009
Anti‐Inflammatory Effect of AP Prevents further Renal Damage (APSEP)
Inflammation (Induction of iNOS) is reduced in AP treated patients
= AP treated
= Placebo
Data published in Critical Care Medicine, February 2009
Proximal tubular renal damage (GSTA1-1)is reduced in AP treated patients

75
AP-Treatment Improved Renal Creatinine Clearance is Sustained During Study Period
Renal Creatinine Clearance remains higher for the treatment group and impaired for the placebo group during the study period (FAS)
Clearance with linear inter/extrapolation for missing values
Baseli
ne 1 2 3 4 5 6 7
0
50
100
150PlaceboAP
14 21 28
Mea
n C
reat
inin
e C
lear
ance
(mL/
min
) w
ith in
ter-
/ext
rapo
latio
n
*
* p<0.02 two-way Anova repeated measures
48 hour AP treatment (iv)

76
AP Treatment Reduces Dialysis Requirement
Placebo AP0
10
20
30
40
37%
19%
3/16
7/19
% R
RT
Inci
denc
e
Yes/no dialysis requirement during 28 daysDialysis Requirement (ITT)
AP‐treatment reduces need for dialysis and relative dialysis duration
P=0.28
EMA advises: reduced dialysis requirement will be pivotal primary endpoint
Relative Dialysis Duration in % (ITT)Total dialysis duration for dialysis patients / Time (d) in the study
Placebo AP0
10
20
30
40
50
p=0.04
Rel
ativ
e du
ratio
n R
RT
(%)

77
PANOBACUMAB: Phase IIa
Laterre. ECCMID 2010
0
10
20
30
40
50
60
70
80
90
100
PP - ICO PP - FCO ITT - ICO ITT - FCO
ResolutionRecurrenceContinuation
ITT: 17 P.a. O11 patients treated with Panobacumab VAP: 14 ‐ HAP: 3
PP: 13 pts (3 doses)VAP: 12 ‐ HAP: 1
4 pts with 1 doseVAP: 2 ‐ HAP: 2
ICO: Initial clinical outcomeFCO: Final clinical outcome
0
20
40
60
80
100
PP ITT
SURVIVAL (D‐30)
PP ITT
fully human monoclonal antibody (IgM

78

79

80
New developments
• V1a agonist FE 202158 (Ferring)– Vasopressin analog– Treatment of septic shock
• Polyclonal anti-TNF antibody– Phase II trial completed (results pending)– Phase III trial ?

81
James S et al. Am Heart J 2009;157:599–605; Wallentin L et al. N Engl J Med 2009;361:1045–1057
Primary endpoint: • CV mortality, MI or stroke Key secondary: • CV mortality, MI or stroke in patients intended for invasive management
• Total mortality or MI + stroke • CV mortality, MI, stroke, recurrent ischemia, TIA or arterial thrombotic events• MI alone/CV mortality alone/stroke alone/total mortality alone
Primary safety: • Total major bleeding (PLATO definition)
6–12‐month exposure
Clopidogrel (n=9291)If pre‐treated, no additional loading dose;if naive, standard 300 mg loading dose,
then 75 mg qd maintenance;(additional 300 mg allowed pre‐PCI)
Ticagrelor (n=9333)180 mg loading dose, then90 mg bid maintenance;(additional 90 mg pre‐PCI)
UA/NSTEMI (moderate‐to‐high risk), STEMI (if primary PCI)All receiving ASA; clopidogrel‐treated or naive;randomized within 24 hours of index event
(n=18,624)
PLATO: Study design

82
PLATO: Main efficacy/safety results
Primary efficacy endpoint: CV death + MI + stroke
Primary safety endpoint: Total major bleeding
16
12
8
2
0
4
6
10
14
11.67
9.80
0 60 120 180 240 300 360
HR 95% Cl P‐value0.84 (0.77, 0.92) <0.001Tic vs. Clop
Clopidogrel (1014/9291)Ticagrelor (864/9333)
Days from randomization
Kaplan
‐Meier (%
)
0
5
10
15
11.58
11.20
0 60 120 180 240 300 360
HR 95% Cl P‐value1.04 (0.95, 1.13) 0.434Tic vs. Clop
Days from first IP dose
Kaplan
‐Meier (%
)
Clopidogrel (929/9186)Ticagrelor (961/9235)
• Non‐CABG major and non‐procedural major/minor bleeding were significantly higher with ticagrelor versus clopidogrel, along with discontinuations due to bleeding

83
0
1
2
3
4
5
6
7
8
9
10
11
12
13
14
15
16
0 10 20 30 40 50 60 70 80 90 90 120 150 180 210 240 270 300 330 360 390
% Died
Days after day 3
Clop
Tic
PLATO: Landmark Analysis of time to death following pneumonia
Deaths reduced more than 30 days after onset

84
Rel. risk reduction of death post AEOITicagrelor better Clopidogrel better
# DiedTic. Clop. OR (95% CI)
0.1 0.1 0.2 0.5 1.0 2.0 5.0
All patients 11/205 49/262 0.25 (0.13–0.49)
Acquired as
Community 5/110 23/133 0.23 (0.08–0.62)
Nosocomial 6/95 26/129 0.27 (0.11–0.68)
‘Nosocomial’ is 2+ days post admit and <7 days post dischargePneumonia preferred terms (broad)
PLATO: Death by CAP vs HAP: Patients with pneumonia AEs on study drug 3 days after AE onset
85
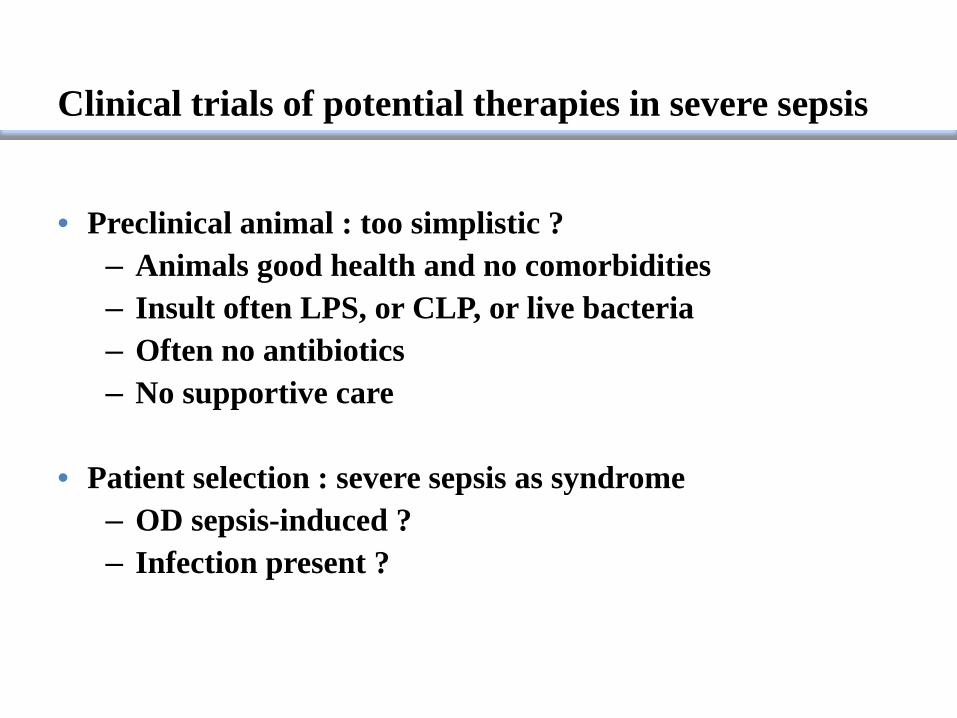
Clinical trials of potential therapies in severe sepsis
• Preclinical animal : too simplistic ?– Animals good health and no comorbidities– Insult often LPS, or CLP, or live bacteria– Often no antibiotics– No supportive care
• Patient selection : severe sepsis as syndrome– OD sepsis-induced ?– Infection present ?

86
Conclusions
• Back to basics• Understanding of pathophysiology to be revisisted• Potential therapies to be redifined• Patients selection
– Other criteria or markers ?– More homogenous populations– Different endpoints ?– Increase sample size if survival has improved ?– Limit variability : CCC and less sites with more
patients per site ?