Embed Size (px)
Citation preview

Admissions to engineering courses: the current situation
Professor Dik Morling
Chair of the Admissions Working Group Engineering Professors’ Council

Key issues: pressure from a number of directions
Engineering in UK HE
New and (it seems) constantly changing visa regulations: attractiveness of UK to overseas students
Building in “employability”: Contribution to economic recovery and the skills agenda
Examinations reform
Changing UK HE landscape: fees regime, student number control, funding for STEM subjects

Key issues: importance of overseas students in engineering
-
10,000
20,000
30,000
40,000
50,000
60,000
70,000
80,000
90,000
2007/08 2008/09 2009/10 2010/11
Stu
den
t FT
E
UK Other EU Non EU
Engineering & technology: undergraduate
16% 17%
17% 18%
Comparative figure is 8% for all HE UG students
Source: HESA. 2011/12 HESA data available April 13

Key issues: importance of overseas students in engineering
-
2,000
4,000
6,000
8,000
10,000
12,000
14,000
16,000
18,000
2007/08 2008/09 2009/10 2010/11
Stu
den
t FT
E
UK Other EU Non EU
59%
Engineering & technology: Postgraduate (taught)
55%
59%
61%
Comparative figure is 46% for all HE PGT students
Source: HESA. 2011/12 HESA data available April 13

Context: undergraduate acceptance trends (Based on 23 August 2012 figures and annual data sets)
Subject group change from 2002 from 2010 from 2011
F1 - Chemistry 46% 3% 0%
F3 - Physics 49% 18% 6%
G1 - Mathematics 90% 0% -4%
G4/I1 - Computer Science -22% -6% -7%
G6/I3 - Software Engineering -2% 6% -5%
H1 - General Engineering 25% -2% 11%
H2 - Civil Engineering 65% -14% -13%
H3 - Mechanical Engineering 66% 5% 1%
H4 - Aerospace Engineering 44% 5% -3%
H6 - Electronic and Electrical Engineering
-40% -12% -12%
H7 - Production and Manufacturing Engineering
-61% -19% -17%
H8 - Chemical, Process and Energy Engineering
116% 16% 0% Source: UCAS
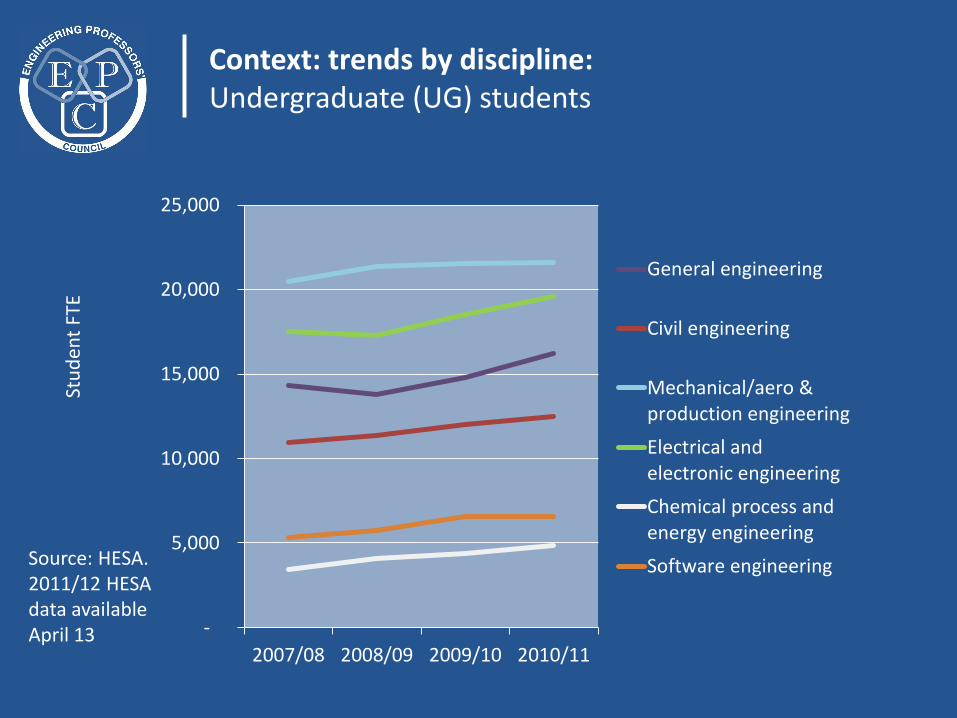
Context: trends by discipline: Undergraduate (UG) students
Stu
den
t FT
E
Source: HESA. 2011/12 HESA data available April 13 -
5,000
10,000
15,000
20,000
25,000
2007/08 2008/09 2009/10 2010/11
General engineering
Civil engineering
Mechanical/aero &production engineering
Electrical andelectronic engineering
Chemical process andenergy engineering
Software engineering

Context: trends by discipline: Postgraduate taught (PGT) students
Source: HESA. 2011/12 HESA data available April 13
Stu
den
t FT
E
-
500
1,000
1,500
2,000
2,500
3,000
3,500
4,000
4,500
5,000
2007/08 2008/09 2009/10 2010/11
General engineering
Civil engineering
Mechanical/aero &production engineering
Electrical and electronicengineering
Chemical process andenergy engineering
Software engineering

EPC 2012/13 enrolments survey: response
1994 Group 18%
Million+ 4%
Not in a Mission Group 12%
Russell Group 50%
University Alliance
16%
83 departments from just over 50 universities responded, representing around half of universities in the UK with UG and/or PGT students registered as studying at least one of the engineering disciplines.

…from across the UK
Midlands 28%
North East England
19%
North West England
8%
Northern Ireland
5%
Scotland 3%
South East England
23%
South West England
10%
Wales 4%
EPC 2012/13 enrolments survey: response

0 5 10 15 20 25
Mineral, metallurgy &materials engineering
Software engineering
General engineering
Chemical engineering
Electrical, electronic &computer engineering
Civil engineering
Mechanical, aero &production engineering
Russell Group
Other
Number of respondents
EPC 2012/13 enrolments survey: response

About the same
Higher
Lower
Non EU PGT
HEU PGT
Non EU UG
HEU UG
60 40 20 0 20 40 60
Number of respondents
73% report a reduction of more than 10% Increase/decrease
compared with 2011/12
EPC 2012/13 enrolments survey: summary
50% report an increase of more than 10%

By Mission Group
Russell Group Other
40 20 0 20 40
No of respondents
40 20 0 20 40
No of respondents
HEU UG
Non EU UG
HEU PGT
Non EU PGT
About the same
Higher
Lower
HEU UG
Non EU UG
HEU PGT
Non EU PGT

By size: HEU undergraduates
More than 10% higher
6-10% higher
0-5% higher
About the same
0-5% lower
6-10% lower
More than 10% lower
Over 200
151-200
101-150
60-100
41-60
20-40
Total number of students in department
10 5 0 5 10 Number of respondents

By size: Non EU undergraduates
10 5 0 5 10
More than 10% higher
6-10% higher
0-5% higher
About the same
0-5% lower
6-10% lower
More than 10% lower
Over 200
151-200
101-150
60-100
41-60
20-40
Total number of students in department
Number of respondents

By size: HEU postgraduate (taught)
Total number of students in department
Number of respondents
More than 10% higher
6-10% higher
0-5% higher
About the same
0-5% lower
6-10% lower
More than 10% lower
Over 200
151-200
101-150
60-100
41-60
20-40
10 5 0 5 10 15 20

By size: Non EU postgraduate (taught)
10 5 0 5 10
Total number of students in department
Number of respondents
More than 10% higher
6-10% higher
0-5% higher
About the same
0-5% lower
6-10% lower
More than 10% lower
Over 200
151-200
101-150
60-100
41-60
20-40

HEU undergraduate: by Mission Group
45 15 0 15 45
Number of respondents
More than 10% higher
6-10% higher
0-5% higher
About the same
0-5% lower
6-10% lower
More than 10% lower
Russell Group
Other
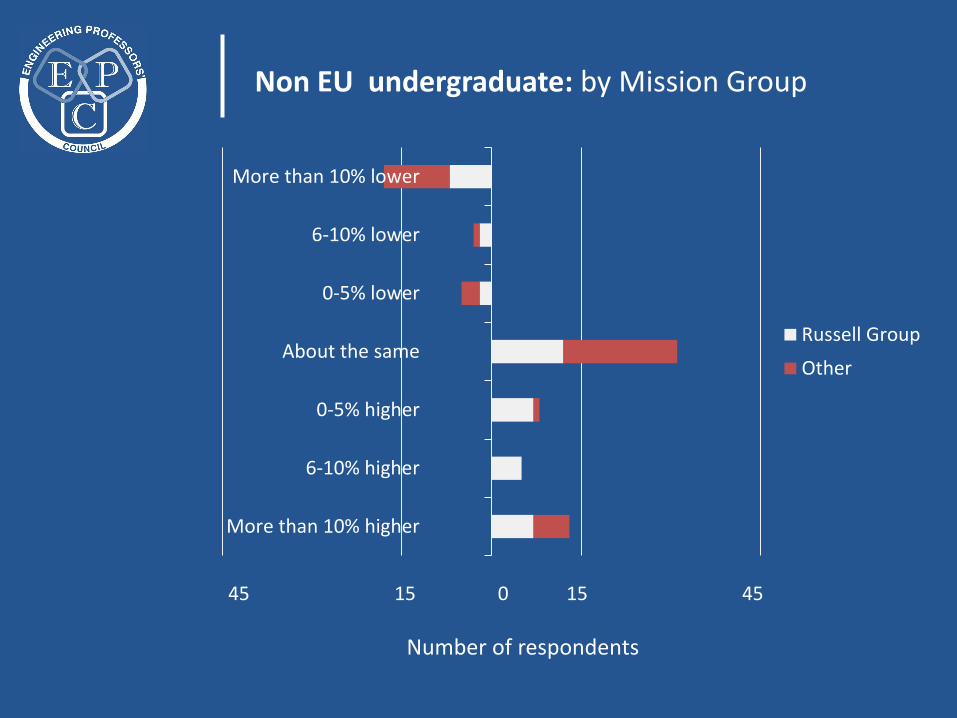
Non EU undergraduate: by Mission Group
Number of respondents
45 15 0 15 45
More than 10% higher
6-10% higher
0-5% higher
About the same
0-5% lower
6-10% lower
More than 10% lower
Russell Group
Other

HEU postgraduate (taught): by Mission Group
Number of respondents
45 15 0 15 45
More than 10% higher
6-10% higher
0-5% higher
About the same
0-5% lower
6-10% lower
More than 10% lower
Russell Group
Other

Non EU postgraduate (taught): by Mission Group
Number of respondents
45 15 0 15 45
More than 10% higher
6-10% higher
0-5% higher
About the same
0-5% lower
6-10% lower
More than 10% lower
Russell Group
Other

HEU undergraduate: all respondents, by discipline
10 5 0 5 10
Number of respondents
More than 10% higher
6-10% higher
0-5% higher
About the same
0-5% lower
6-10% lower
More than 10% lower
Mechanical, aero &production engineering
General engineering
Electrical, electronic &computer engineering
Civil engineering
Chemical engineering

Non EU undergraduate: all respondents, by discipline
10 5 0 5 10
Number of respondents
More than 10% higher
6-10% higher
0-5% higher
About the same
0-5% lower
6-10% lower
More than 10% lower
Mechanical, aero &production engineering
General engineering
Electrical, electronic &computer engineering
Civil engineering
Chemical engineering

HEU postgraduate (taught): all respondents, by discipline
10 5 0 5 10 15 Number of respondents
More than 10% higher
6-10% higher
0-5% higher
About the same
0-5% lower
6-10% lower
More than 10% lower
Mechanical, aero &production engineering
General engineering
Electrical, electronic &computer engineering
Civil engineering
Chemical engineering

Non EU postgraduate (taught): all respondents, by discipline
Number of respondents
More than 10% higher
6-10% higher
0-5% higher
About the same
0-5% lower
6-10% lower
More than 10% lower
Mechanical, aero &production engineering
General engineering
Electrical, electronic &computer engineering
Civil engineering
Chemical engineering
10 5 0 5 10

New website

Members’ area

http://epc.ac.uk Follow us on
Upcoming events
Congress2013: 16/17 April 2013 at the University of Portsmouth
@epc1994