Embed Size (px)
Citation preview

11/10/2013
1
Adolescence and Emerging Adulthood:
A Cultural Approach
Chapter 10
Copyright © Pearson Education 2013
School
Chapter Overview
• History and current state of schooling for
adolescents in the U.S., other industrialized
countries, and developing countries
• Characteristics of effective schools, and the
effects of school climate
• Engagement and achievement in high school
• Cultural, ethnic, gender, and intellectual
differences on adolescents' school experiences
• Factors related to school dropout; prevention
programs
• The emerging adult in college, retention, and
dropout
Copyright © Pearson Education 2013
The Rise of Schooling
Compulsory
education for
adolescents to 16
yrs is a recent
advent in America
The “Age of Adolescence”
In other Western
countries, a similar
trend took place.
Copyright © Pearson Education 2013
Figure 10.1
Attendance a
normative
adolescent
experience
Developing Countries
• Education for urban middle class; adolescents engaged
in productive work, family labour
• Changing with industrialization; increasing enrollment
• Effects of economic development is evident in literacy
rates of youth vs. older generations
E.g., Egypt
Males 15–19 years old
74% can read & write
Females 15–19 years old
59% can read & write
Males 65 + years old
30% can read & write
Females 65 + years old
9% can read & write

11/10/2013
2
Changes in Secondary School
Copyright © Pearson Education 2013
Table 10.1
Secondary School: Changes
19th C For the wealthy,
especially
males;
broad liberal
arts (Latin,
history); no
economic
purpose
1920 Framework for
high school as
we know it; not
just for wealthy;
many
immigrants;
training for
work/citizenship;
comprehensive
(general ed,
vocation
training)
Mid-20th C Expanding school
population;
curriculum
expands to
include family
life, arts
1980s Back to Basics
movement
ALARM ALARM
Discussion
Should high school courses be offered only
on academic subjects such as math and
English, or should courses in music and
physical education also be available?
The benefits of learning the arts:
1.
2.
3.

11/10/2013
3
Discussion
Should physical education be optional?
Diversity of American Education • Local and state level legislation & funding – not national
• Results in diversity in curriculum, rules and requirements, and resources
• 1994 – “Goals 2000” established by federal government toward national educational policy
• 2001 – “No Child Left Behind Act” provided federal funding for national testing, teacher training standards, and evaluation – Canada also has standardized math and literacy tests (E.g.,
Ontario can’t graduate unless pass literacy test
– Canada also has “code of conducts” for teachers and required memberships
• Even still, only 5% of school funding is provided by the federal government
World Stats: School Enrollment
Copyright © Pearson Education 2013
Figure 10.2 Child Info (2012)
11/10/2013
4
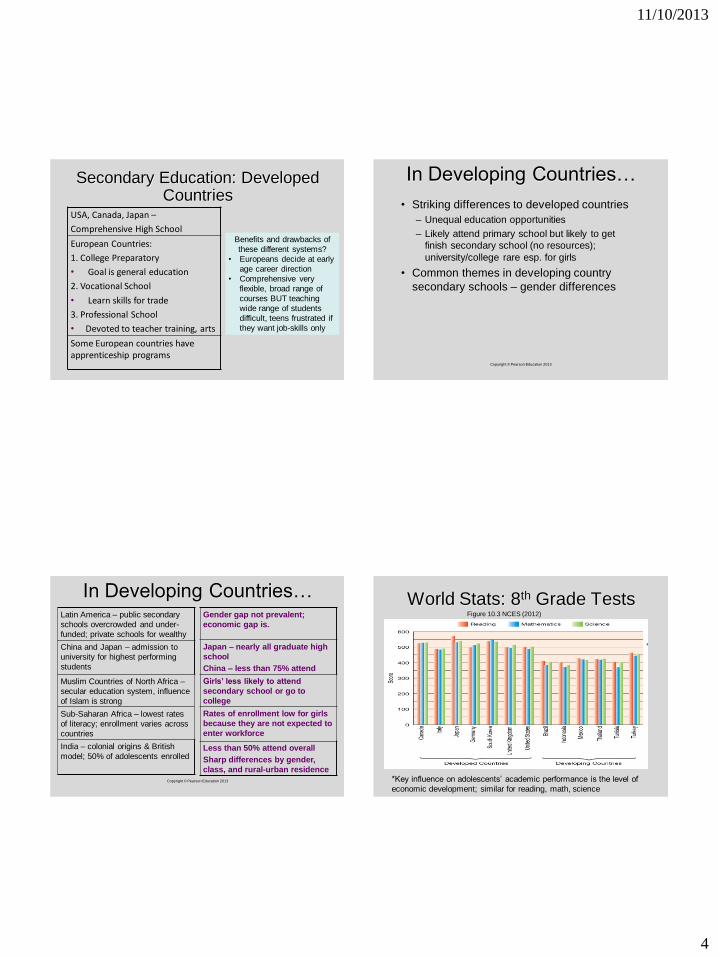
Secondary Education: Developed Countries
USA, Canada, Japan –
Comprehensive High School
European Countries:
1. College Preparatory
• Goal is general education
2. Vocational School
• Learn skills for trade
3. Professional School
• Devoted to teacher training, arts
Some European countries have apprenticeship programs
Benefits and drawbacks of
these different systems?
• Europeans decide at early
age career direction
• Comprehensive very
flexible, broad range of
courses BUT teaching
wide range of students
difficult, teens frustrated if
they want job-skills only
In Developing Countries…
Copyright © Pearson Education 2013
• Striking differences to developed countries
– Unequal education opportunities
– Likely attend primary school but likely to get
finish secondary school (no resources);
university/college rare esp. for girls
• Common themes in developing country
secondary schools – gender differences
In Developing Countries… Latin America – public secondary
schools overcrowded and under-
funded; private schools for wealthy
China and Japan – admission to
university for highest performing
students
Muslim Countries of North Africa –
secular education system, influence
of Islam is strong
Sub-Saharan Africa – lowest rates
of literacy; enrollment varies across
countries
India – colonial origins & British
model; 50% of adolescents enrolled
Gender gap not prevalent;
economic gap is.
Japan – nearly all graduate high
school
China – less than 75% attend
Girls’ less likely to attend
secondary school or go to
college
Rates of enrollment low for girls
because they are not expected to
enter workforce
Less than 50% attend overall
Sharp differences by gender,
class, and rural-urban residence
Copyright © Pearson Education 2013
World Stats: 8th Grade Tests Figure 10.3 NCES (2012)
*Key influence on adolescents’ academic performance is the level of
economic development; similar for reading, math, science

11/10/2013
5
Effective Schools: Size Matters • Characteristics of large schools
• Characteristics of small schools
• Leadership
• Scholars agree: optimum school size for adolescents is
between 500-1000 students
Effective Schools: Size Matters
• Some research claims direct negative relation between class size and academic performance
• Smaller class size linked with:
• Small Class Size preferable for students with academic difficulties, more individual attention
Copyright © Pearson Education 2013
Effective Schools: Size Matters
• 2004 Ontario OSSTF study; N = 784
• As grade 9 and 10 Applied and Academic class size
increased the student’s pass rate declined
• Some relation to location with increase in class size
worse for urban compared with suburban/rural location
Effective Schools: Size Matters
• Other scholars claim that typical variation (between 20 and 40 students) has little affect on achievement – Decreasing class size very expensive
• Small class size preferable for students with academic difficulties, more individual attention
Copyright © Pearson Education 2013
11/10/2013
6
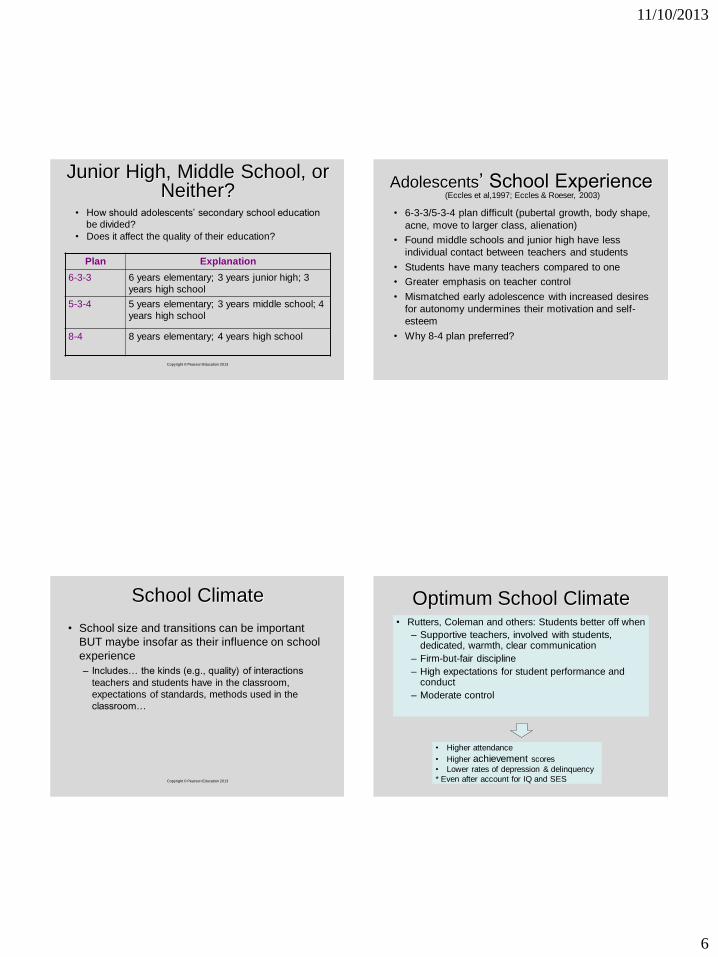
Junior High, Middle School, or Neither?
Plan Explanation
6-3-3 6 years elementary; 3 years junior high; 3
years high school
5-3-4 5 years elementary; 3 years middle school; 4
years high school
8-4 8 years elementary; 4 years high school
Copyright © Pearson Education 2013
• How should adolescents’ secondary school education
be divided?
• Does it affect the quality of their education?
Adolescents’ School Experience
• 6-3-3/5-3-4 plan difficult (pubertal growth, body shape,
acne, move to larger class, alienation)
• Found middle schools and junior high have less
individual contact between teachers and students
• Students have many teachers compared to one
• Greater emphasis on teacher control
• Mismatched early adolescence with increased desires
for autonomy undermines their motivation and self-
esteem
• Why 8-4 plan preferred?
(Eccles et al,1997; Eccles & Roeser, 2003)
School Climate
• School size and transitions can be important
BUT maybe insofar as their influence on school
experience
– Includes… the kinds (e.g., quality) of interactions
teachers and students have in the classroom,
expectations of standards, methods used in the
classroom…
Copyright © Pearson Education 2013
Optimum School Climate • Rutters, Coleman and others: Students better off when
– Supportive teachers, involved with students, dedicated, warmth, clear communication
– Firm-but-fair discipline
– High expectations for student performance and conduct
– Moderate control
• Higher attendance
• Higher achievement scores
• Lower rates of depression & delinquency
* Even after account for IQ and SES

11/10/2013
7
Engagement & Achievement
Engagement: the quality of being psychologically
committed to learning (alert, attentive, aim to learn)
Research indicates that more and more, students
are “physically present but psychologically absent”
(Steinberg, 1996, p. 67)
• Copying, cheating, not interested
Copyright © Pearson Education 2013
Disengagement
What
trends
do you
see?
Copyright © Pearson Education 2013
Figure 10.4 – NCES, 2002, p. 72
• Positive school climate
• Structure of the classroom environment
• Work/leisure environment
• Parents’ high expectations for achievement; involvement in their adolescent’s education
• Authoritative parenting
• Neglectful parenting
Main problem: Beyond the Classroom Discussion
What makes social class (SES) so important
in predicting academic achievement?

11/10/2013
8
School start time: Does it matter? • Adolescents require 8.5-9.5 hours of sleep
Peers, Friends, & School • Naturally compare themselves to peers
• If classmates performing poorly, above-average adolescent feels pretty good (big fish in little pond)
• If classmates high-achievers, might feel inferior
• In relation to school, the influence of friends is greater than that of parents in some respects:
• Friends with high achievement and aspirations support and encourage each other in school
High Achieving Friends vs.
Peers Peer Group Friends
If surrounded by high-achieving
peer group, adolescents have
lower academic self-concept and
expectations
In schools with lower
achievement levels, adolescents
have better academic self-
concepts and expectations
Even low-achieving adolescents
with high-achieving friends are
likely to have higher expectations
and aspirations
Big Fish in a little pond effect
Work Hours & School Performance Beyond 10 hrs/week, the more adolescents
work, the poorer their school performance.
Copyright © Pearson Education 2013
11/10/2013
9
Discussion
• Steinberg (1996) described that socializing with
friends was the adolescents most common daily
activity.
• This amount of time spent with friends averaged to
20 to 25 hours a week which is more than the time
spent on work or school.
• Do you think if social time was limited, it would
increase school performance why or why not?
Copyright © Pearson Education 2013
Ethnic Differences: Achievement
• Consider the ethnic differences in academic
achievement outlined in your chapter
• Explain the concept of effort vs. ability
• What explains these differences? • Some differences are intertwined with issues of social class,
parenting practices, friends’ influences
• Systemic prejudice and discrimination
• Consider these issues in relation to the next slide
on dropout rates….
Copyright © Pearson Education 2013
Gender Differences • Few gender differences in intellectual ability (Ch 5) but
apparent in academic achievement
• Adolescent girls enjoy school environment; are more likely to feel supported by their parents, teachers, and administrators. Boys tend to do less homework, watch more TV, and read fewer books.
• What hypotheses would you propose to explain why boys generally do worse than girls academically, from grade school through adolescence?
• Do you think gender stereotypes or roles come into play?
Copyright © Pearson Education 2013
What about math? • Stereotype = women weaker in math
• Women perform roughly the same as men except when
the test material is advanced; then, often, do worse
• Stereotype threat

11/10/2013
10
Math: Stereotype Threat
Spencer et al. 1999
Math: Stereotype Threat
• Moderating role of
mothers’ gender
stereotypes (not fathers’)
(Tomasetto et al. 2011)
Adolescents with Disabilities
• Disabilities related to school difficulties include speech handicaps, mental retardation, emotional disorders, and learning disabilities
• About 10% of adolescents in American schools have been diagnosed with learning disability
– Reading is the most common source of difficulty
– Boys are twice as likely to have a learning disability
Copyright © Pearson Education 2013
Spotlight: ADHD
Attention-deficit hyperactivity disorder: – Problems of inattention, hyperactivity, impulsiveness
– Classified as learning disability
– One-half of adolescents with LD have been diagnosed with ADHD
– Boys four times as likely as girls to be diagnosed with ADHD
– Nearly 50% of those diagnosed have a sibling or parent with the disorder
– Critics argue the levels of diagnosis indicate improper diagnosis in many cases
– Diagnosis often made without full professional evaluation
– Nearly 9 out of 10 of children diagnosed are treated with Ritalin or other medication
Copyright © Pearson Education 2013

11/10/2013
11
Spotlight: ADORE The Study
• Attention-deficit/hyperactivity Disorder Observational Research in Europe
(ADORE) study
• 1,500 children and adolescents (ages 6–18) in 10 countries
• Pediatricians and child psychiatrists collected observational data at seven points
over two years
• Parents’ assessments showed high agreement with health professionals
Findings
• Higher rates of ADHD among boys than girls; varied widely across countries
• Symptoms similar among boys and girls
• Girls more likely to have additional emotional problems and be bullied by peers
• Boys more likely to have additional conduct problems
• Frequent problems in relationships associated with ADHD among boys and girls
• Parents reported frequent stresses due to children’s ADHD behavior
• European approaches to treatment diverse
Copyright © Pearson Education 2013
ADHD in High School
• Onset of adolescence does not diminish the
difficulties present in children with ADHD
• Poor self-concept, self-esteem, self-confidence,
depression, anxiety, interpersonal awkwardness
• Transition to high school aggravates symptoms
– Increased number of teachers; larger, busier schools
– less personalized, less individual attention and focus
– Schedule variations confusing, poor time management
• Student entitled to support and accommodations;
teacher entitled to access resources for support
Tracking: Stratified Levels
1. Upper – college preparatory level
2. General – for average students
3. Remedial/Special Education –academically behind
• Some schools have a vocational track for technical or trade preparation
• Students across tracks usually take some classes together (e.g., music, physical education)
• Best way to ensure students are engaged?
– Schoolwork best suited to achievement level and ability (not all on college track)
– Dooms students in lower track to second-rate education (labeling, low quality teacher, fall further behind with lower and lower level material)
High School Dropout
• Importance of obtaining education increased
from 50 years ago
• By 2010, only 8% of young people had not
obtained a high school diploma by age 24
What factors are related to school drop-out?
Besides limited job options, what are some
negative consequences of dropping out?

11/10/2013
12
Ethnic Differences
• Decline for all
ethnic groups
• Males more
likely to drop
out (except
Asian)
Figure 10.5 – NCES, 2007, p. 73
College Attendance
Copyright © Pearson Education 2013
Figure 10.6
College Students Recent high school grads that enter college ~70%
Female undergraduate population 58%
Asian Americans who enter college ~90%
White students 71%
Black and Latino students 60%
• Increase over past 2 decades for all groups • More likely for ‘mature students’ to attend • Business still a top major; education and engineering
also high • Takes longer to obtain 4-yr degree
• Tuition increases, loans (not grants), students work, switching majors, internships preferred
• Finances affect retention
College Life: Four Subcultures
1. Collegiate
– Fraternities, sports events, parties
2. Vocational
– Practical: get degree for job
3. Academic
– Drawn to ideas and knowledge
4. Rebel
– Nonconformists
(Clark & Trow, 1966)
Most students are satisfied if they experience personal
growth: distinct identity, intellectual values, socially
confident, critical thinking