Embed Size (px)
Citation preview
1
Adoption of alternative fuel vehicles in the Netherlands
Michael Bastiani1, Erik Pruyt2
Faculty of Technology, Policy, and Management, Delft University of Technology, 2600 GA, Delft, The
Netherlands
Abstract: Today, several Western European nations are considering to reform their tax systems in
order to reach a sustainable and just society. This process takes a lot of time and is subject to many
complexities and uncertainties. Well-designed systemic policies may accelerate this process
substantially. In this paper we investigate the effectiveness of alternative policies to accelerate the
adoption of alternative fuel vehicles in the Netherlands. Recent insights in the Dutch vehicle market
suggest the need for a better understanding of the environmental and financial effects of different
policy alternatives across all sorts of uncertain developments in vehicle and infrastructure
technology, alternative fuel availability and choice behavior. In this paper, we assess the robustness
of alternative policies across parametric uncertainties, but also across structural and model
uncertainties. In order to do so, we construct two system dynamics choice models to include
assumptions of utility maximization as well as regret minimization – which, according to the
literature, could result in very different levels of adoption. We then use these methods to test the
current alternative fuel vehicles policy, a recently proposed alternative, and a closed-loop
alternative.
Key words: Alternative Fuel Vehicles, System Dynamics, Dynamic Choice Modeling, Regret
Minimization, Fiscal Policy Analysis
1. Introduction
The Dutch government and all private partners recognize the vital contribution of mobility to society.
All parties in the Dutch system also recognize that the current automotive system has very negative
effects on the economy, people and the environment (Ministry of Infrastructure and the
Environment, 2014; Bakker, Maat, & van Wee, 2014). That is why these parties are in favor of a
transition towards sustainable mobility. For several years, the Dutch government has been trying to
reduce the negative external effects of automotive mobility by providing tax benefits for low- or
zero-emission cars. However, past and current fiscal measures to stimulate Alternative Fuel Vehicle
(AFV) diffusion in order to reduce the external effects have resulted in rather mixed outcomes.
Dutch subsidies to stimulate the adoption of Electric Vehicles (EV) and Plug-in Hybrid Electric Vehicles
(PHEV) have on the one hand resulted in a considerable adoption of these vehicles on the Dutch car
market. Today, there are approximately 7.000 EVs and 40.000 PHEVs on a total of approximately 8
million passenger vehicles (Dutch Environmental Agency, 2014; Rijksdienst voor Ondernemend
Nederland, 2015).
1 Graduated from Delft University of Technology, [email protected]
2 Delft University of Technology, [email protected]
2
However, the fiscal policy has resulted in unforeseen adverse, even perverse, effects. For instance,
due to a plethora of incentives, sales of the Mitsubishi Outlander PHEV have boomed (Dutch
Environmental Agency, 2014), but are likely to bust with minor changes in the tax system. Although
the Outlander is an expensive SUV, cumulating all tax measures makes that this high-quality car is
practically for free. However, Outlanders contribute only marginally to the reduction of
environmental externalities. Worse, they only do so in comparison to equivalent Internal Combustion
Engine (ICE) vehicles. The Dutch tax system has nevertheless resulted in 15.275 Outlanders in the
Netherlands (Rijksdienst voor Ondernemend Nederland, 2015). In fact, the tax system alone has
made the Outlander the most popular AFV on Dutch roads. Ironically, it may even have seduced
many Dutch to opt for an Outlander instead of a smaller, less polluting, car. Moreover, the costs of
the tax policy have, due to the fact that these SUVs are expensive and are practically paid for by the
tax payer, exploded (Dutch Environmental Agency, 2014). These and other unanticipated ‘side-
effects’ of the Dutch tax policy suggest that a much better understanding of the role of the
government and tax system related to the adoption of AFVs is needed (Wiebes, 2014).
Partly in response to these effects, the system has recently been modified – although marginally, by
enough to change overall choice behavior. Again. However, within a few months’ time, the Dutch tax
system, including tax regulations related to passenger vehicle purchases, ownership and leasing
(Wiebes, 2014), will be drastically reformed. This reform has been announced by the government to
be a major tax shift in favor of labor and against pollution. This green reform is likely to have a very
significant effect on the individual choice behavior related to AFVs and therefore of society as a
whole (Chorus, Koetse, & Hoen, 2013). In view of influencing the governmental policy process,
societal groups have recently suggested vehicle tax policies.
However, societal adoption of AFVs is not dependent on the tax system alone. According to the
Ministry of Infrastructure and the Environment, the transition towards AFVs mostly depends on the
evolution of EV technology and the availability of renewable fuels such as bio fuels and hydrogen
(Ministry of Infrastructure and the Environment, 2014, p. 17). The literature also suggests that social
interaction strongly influences technological adaption (Struben & Sterman, 2008; Keith, 2012;
Struben J. , 2006). The interplay of these endogenous effects makes the transition to AFVs
dynamically complex. Most of these effects are also highly uncertain. Before opting for one
alternative tax policy or another, their environmental effectiveness and financial efficiency should
therefore be tested thoroughly. An integrative approach that allows for exploring the effects of
alternative policies across many possible effects and plausible futures is therefore needed. This is
what the System Dynamics method is used for.
The focus of this research
In this paper, we investigate the robustness and sustainability of alternative tax policies to supporting
the adoption of AFVs across many uncertain technology, fuels and choice behavior evolutions. We
consider the two kinds of robustness discussed by Tetlow (2007): robust performance and robust
stability. Robust performance is all about effectiveness across an ensemble of scenarios or a range of
models. Robust stability captures whether a policy produces stable (economic) behaviour across an
ensemble of scenarios or a range of models.
3
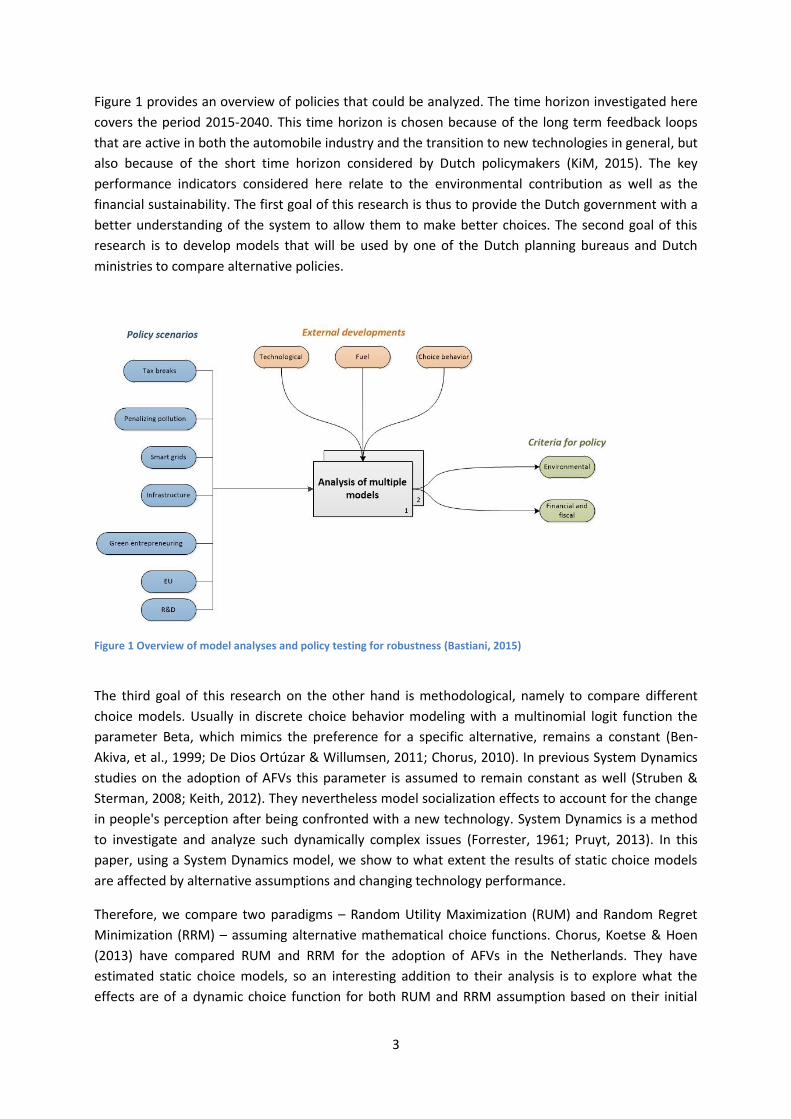
Figure 1 provides an overview of policies that could be analyzed. The time horizon investigated here
covers the period 2015-2040. This time horizon is chosen because of the long term feedback loops
that are active in both the automobile industry and the transition to new technologies in general, but
also because of the short time horizon considered by Dutch policymakers (KiM, 2015). The key
performance indicators considered here relate to the environmental contribution as well as the
financial sustainability. The first goal of this research is thus to provide the Dutch government with a
better understanding of the system to allow them to make better choices. The second goal of this
research is to develop models that will be used by one of the Dutch planning bureaus and Dutch
ministries to compare alternative policies.
Figure 1 Overview of model analyses and policy testing for robustness (Bastiani, 2015)
The third goal of this research on the other hand is methodological, namely to compare different
choice models. Usually in discrete choice behavior modeling with a multinomial logit function the
parameter Beta, which mimics the preference for a specific alternative, remains a constant (Ben-
Akiva, et al., 1999; De Dios Ortúzar & Willumsen, 2011; Chorus, 2010). In previous System Dynamics
studies on the adoption of AFVs this parameter is assumed to remain constant as well (Struben &
Sterman, 2008; Keith, 2012). They nevertheless model socialization effects to account for the change
in people's perception after being confronted with a new technology. System Dynamics is a method
to investigate and analyze such dynamically complex issues (Forrester, 1961; Pruyt, 2013). In this
paper, using a System Dynamics model, we show to what extent the results of static choice models
are affected by alternative assumptions and changing technology performance.
Therefore, we compare two paradigms – Random Utility Maximization (RUM) and Random Regret
Minimization (RRM) – assuming alternative mathematical choice functions. Chorus, Koetse & Hoen
(2013) have compared RUM and RRM for the adoption of AFVs in the Netherlands. They have
estimated static choice models, so an interesting addition to their analysis is to explore what the
effects are of a dynamic choice function for both RUM and RRM assumption based on their initial
4
models. Previous research shows that RUM and RRM lead to different conclusions for the same
choice experiments (Chorus, 2010; Beck, Chorus, Rose, & Hensher, 2013).
By definition, models are always wrong (Sterman, 2002; Pruyt, 2013). That is one reason why policies
tested with models may not perform well when implemented in the real world. Severe or deep
uncertainty may be a more important cause of divergence. Excellent alternatives for many scenarios
may actually perform poorly in some scenarios and in different models. That is why we prefer to test
for policy robustness under deep uncertainty, to come to designing adaptive robust policies
(Hamarat, Kwakkel, & Pruyt, 2012). Adaptive means that the policy can be adapted according to the
circumstances, for example to the market phase of the AFV technology. In order to do so, we use the
Robust Decision Making methodology (Lempert, Popper, & Bankes, 2003; Lempert, Groves, Popper,
& Bankes, 2006). Interestingly, this adaptive policy making approach is in line with the vision of the
Dutch government and AFV-related sectors (Ministry of Infrastructure and the Environment, 2014).
Before studying the effects of alternative vehicle tax systems, we describe our model-based
exploration. In section 2.1 the SD models are described to capture the difference between utility and
regret choice functions. In section 2.2, four financial policies will be simulated. Finally, results will be
discussed in section 3 with an outline for research after this paper will be given.
2. Modeling the dynamics of choice behavior and technological developments
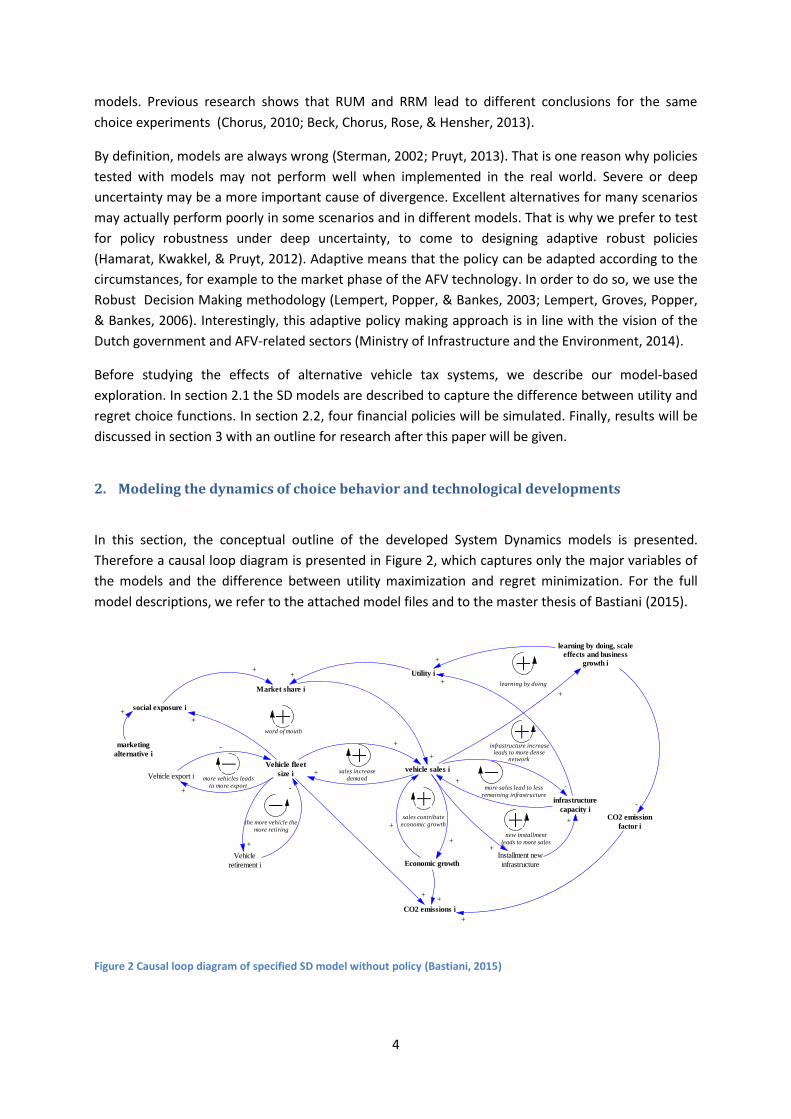
In this section, the conceptual outline of the developed System Dynamics models is presented.
Therefore a causal loop diagram is presented in Figure 2, which captures only the major variables of
the models and the difference between utility maximization and regret minimization. For the full
model descriptions, we refer to the attached model files and to the master thesis of Bastiani (2015).
Figure 2 Causal loop diagram of specified SD model without policy (Bastiani, 2015)
Market share i
vehicle sales i
+
learning by doing, scale
effects and business
growth i
+
infrastructure
capacity i
-+
Vehicle fleet
size i
social exposure i
+
+
marketing
alternative i
+
+
CO2 emissions i
+
CO2 emission
factor i
+
-
Economic growth
+
+
+
+
Utility i
+
+learning by doing+
infrastructure increaseleads to more dense
network
more sales lead to less
remaining infrastructure
Vehicle export i
-
+
more vehicles leads
to more export
Vehicle
retirement i
+
-
the more vehicle the
more retiring
word of mouth
sales increase
demand
sales contribute
economic growth
Installment new
infrastructure
+
+
new installment
leads to more sales
5
Firstly, the vehicle fleet dynamics in the models are described. Secondly, it is showed how society's
choice for a vehicle technology is modeled (with both utility maximization and regret minization) and
how that contributes to the further development of that technology's market in the model. Thirdly,
the feedback loops that largely explain the simulation model's behavior will be discussed. Finally,
multiple tax policies will be tested under parameter uncertainty to obtain robustness.
2.1. The Simulation Models
Vehicle fleet dynamics
Changes in vehicle fleet sizes in the models occur due to new vehicle sales, export and retiring. In
these models, no second hand vehicle sales are modeled. The aging of vehicles (from age 0 to 5 year
to age 5 to 15 year) is internally modeled to represent different buying behavior of people always
driving new vehicles and people driving second hand cars. It is assumed that after fifteen years
vehicles retire on average.
Market shares, utility and regret
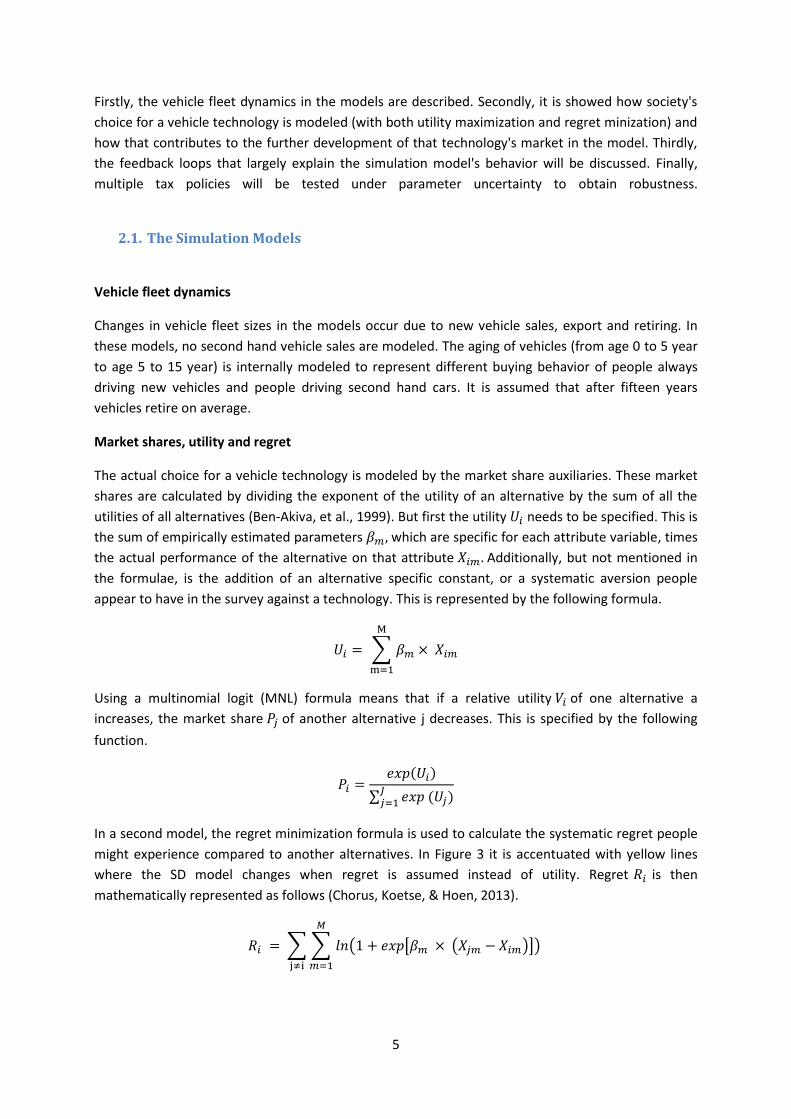
The actual choice for a vehicle technology is modeled by the market share auxiliaries. These market
shares are calculated by dividing the exponent of the utility of an alternative by the sum of all the
utilities of all alternatives (Ben-Akiva, et al., 1999). But first the utility needs to be specified. This is
the sum of empirically estimated parameters which are specific for each attribute variable, times
the actual performance of the alternative on that attribute Additionally, but not mentioned in
the formulae, is the addition of an alternative specific constant, or a systematic aversion people
appear to have in the survey against a technology. This is represented by the following formula.
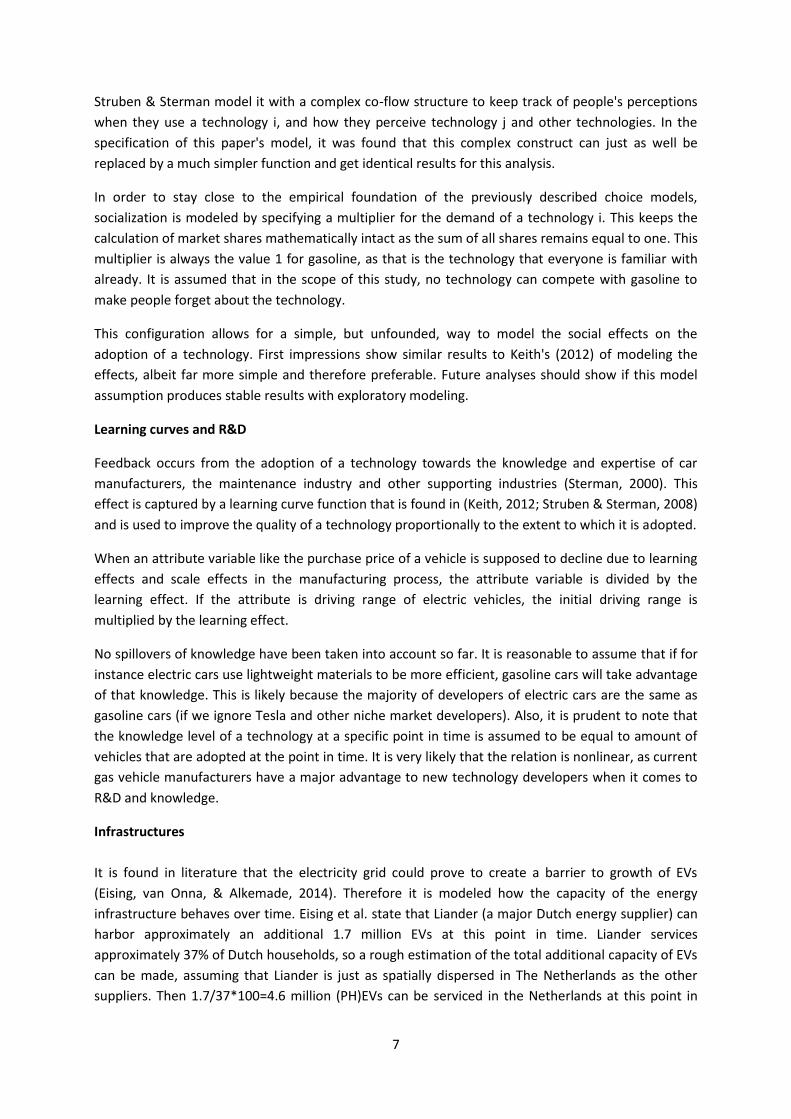
Using a multinomial logit (MNL) formula means that if a relative utility of one alternative a
increases, the market share of another alternative j decreases. This is specified by the following
function.
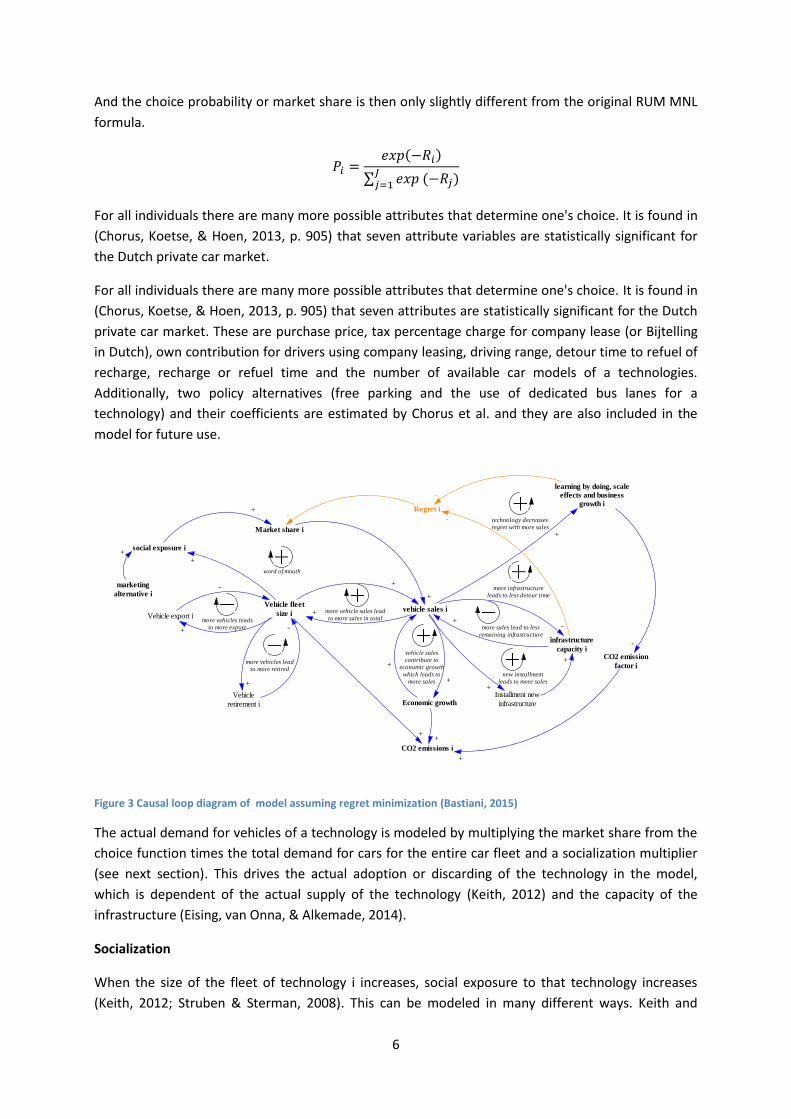
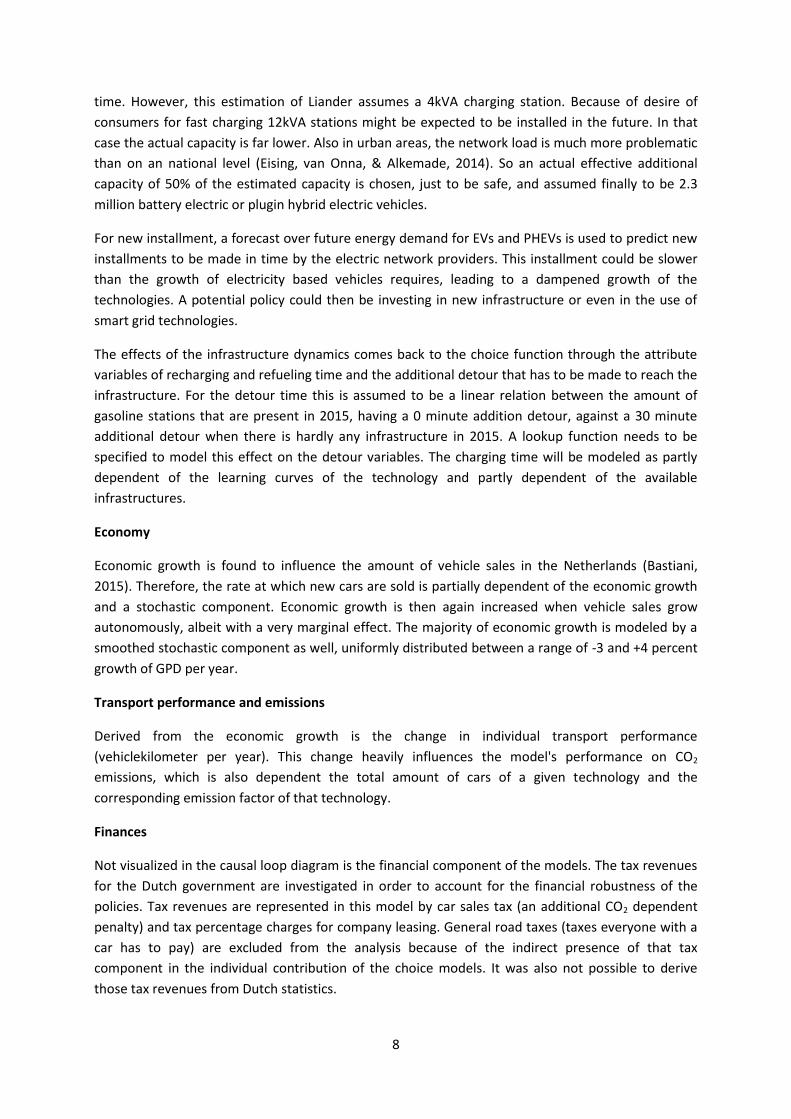
In a second model, the regret minimization formula is used to calculate the systematic regret people
might experience compared to another alternatives. In Figure 3 it is accentuated with yellow lines
where the SD model changes when regret is assumed instead of utility. Regret is then
mathematically represented as follows (Chorus, Koetse, & Hoen, 2013).
6
And the choice probability or market share is then only slightly different from the original RUM MNL
formula.
For all individuals there are many more possible attributes that determine one's choice. It is found in
(Chorus, Koetse, & Hoen, 2013, p. 905) that seven attribute variables are statistically significant for
the Dutch private car market.
For all individuals there are many more possible attributes that determine one's choice. It is found in
(Chorus, Koetse, & Hoen, 2013, p. 905) that seven attributes are statistically significant for the Dutch
private car market. These are purchase price, tax percentage charge for company lease (or Bijtelling
in Dutch), own contribution for drivers using company leasing, driving range, detour time to refuel of
recharge, recharge or refuel time and the number of available car models of a technologies.
Additionally, two policy alternatives (free parking and the use of dedicated bus lanes for a
technology) and their coefficients are estimated by Chorus et al. and they are also included in the
model for future use.
Figure 3 Causal loop diagram of model assuming regret minimization (Bastiani, 2015)
The actual demand for vehicles of a technology is modeled by multiplying the market share from the
choice function times the total demand for cars for the entire car fleet and a socialization multiplier
(see next section). This drives the actual adoption or discarding of the technology in the model,
which is dependent of the actual supply of the technology (Keith, 2012) and the capacity of the
infrastructure (Eising, van Onna, & Alkemade, 2014).
Socialization
When the size of the fleet of technology i increases, social exposure to that technology increases
(Keith, 2012; Struben & Sterman, 2008). This can be modeled in many different ways. Keith and
Market share i
vehicle sales i
+
learning by doing, scale
effects and business
growth i
+
infrastructure
capacity i
-+
Vehicle fleet
size i
social exposure i
+
+
marketing
alternative i
+
+
CO2 emissions i
+
CO2 emission
factor i
+
-
Economic growth
+
+
+
+
technology decreases
regret with more sales
more infrastructure
leads to less detour time
more sales lead to less
remaining infrastructure
Vehicle export i
-
+
more vehicles leads
to more export
Vehicle
retirement i
+
-
more vehicles lead
to more retired
word of mouth
more vehicle sales lead
to more sales in total
vehicle sales
contribute to
economic growth
which leads to
more sales
Installment new
infrastructure
+
+
new installment
leads to more sales
Regret i
-
--
7
Struben & Sterman model it with a complex co-flow structure to keep track of people's perceptions
when they use a technology i, and how they perceive technology j and other technologies. In the
specification of this paper's model, it was found that this complex construct can just as well be
replaced by a much simpler function and get identical results for this analysis.
In order to stay close to the empirical foundation of the previously described choice models,
socialization is modeled by specifying a multiplier for the demand of a technology i. This keeps the
calculation of market shares mathematically intact as the sum of all shares remains equal to one. This
multiplier is always the value 1 for gasoline, as that is the technology that everyone is familiar with
already. It is assumed that in the scope of this study, no technology can compete with gasoline to
make people forget about the technology.
This configuration allows for a simple, but unfounded, way to model the social effects on the
adoption of a technology. First impressions show similar results to Keith's (2012) of modeling the
effects, albeit far more simple and therefore preferable. Future analyses should show if this model
assumption produces stable results with exploratory modeling.
Learning curves and R&D
Feedback occurs from the adoption of a technology towards the knowledge and expertise of car
manufacturers, the maintenance industry and other supporting industries (Sterman, 2000). This
effect is captured by a learning curve function that is found in (Keith, 2012; Struben & Sterman, 2008)
and is used to improve the quality of a technology proportionally to the extent to which it is adopted.
When an attribute variable like the purchase price of a vehicle is supposed to decline due to learning
effects and scale effects in the manufacturing process, the attribute variable is divided by the
learning effect. If the attribute is driving range of electric vehicles, the initial driving range is
multiplied by the learning effect.
No spillovers of knowledge have been taken into account so far. It is reasonable to assume that if for
instance electric cars use lightweight materials to be more efficient, gasoline cars will take advantage
of that knowledge. This is likely because the majority of developers of electric cars are the same as
gasoline cars (if we ignore Tesla and other niche market developers). Also, it is prudent to note that
the knowledge level of a technology at a specific point in time is assumed to be equal to amount of
vehicles that are adopted at the point in time. It is very likely that the relation is nonlinear, as current
gas vehicle manufacturers have a major advantage to new technology developers when it comes to
R&D and knowledge.
Infrastructures
It is found in literature that the electricity grid could prove to create a barrier to growth of EVs
(Eising, van Onna, & Alkemade, 2014). Therefore it is modeled how the capacity of the energy
infrastructure behaves over time. Eising et al. state that Liander (a major Dutch energy supplier) can
harbor approximately an additional 1.7 million EVs at this point in time. Liander services
approximately 37% of Dutch households, so a rough estimation of the total additional capacity of EVs
can be made, assuming that Liander is just as spatially dispersed in The Netherlands as the other
suppliers. Then 1.7/37*100=4.6 million (PH)EVs can be serviced in the Netherlands at this point in
8
time. However, this estimation of Liander assumes a 4kVA charging station. Because of desire of
consumers for fast charging 12kVA stations might be expected to be installed in the future. In that
case the actual capacity is far lower. Also in urban areas, the network load is much more problematic
than on an national level (Eising, van Onna, & Alkemade, 2014). So an actual effective additional
capacity of 50% of the estimated capacity is chosen, just to be safe, and assumed finally to be 2.3
million battery electric or plugin hybrid electric vehicles.
For new installment, a forecast over future energy demand for EVs and PHEVs is used to predict new
installments to be made in time by the electric network providers. This installment could be slower
than the growth of electricity based vehicles requires, leading to a dampened growth of the
technologies. A potential policy could then be investing in new infrastructure or even in the use of
smart grid technologies.
The effects of the infrastructure dynamics comes back to the choice function through the attribute
variables of recharging and refueling time and the additional detour that has to be made to reach the
infrastructure. For the detour time this is assumed to be a linear relation between the amount of
gasoline stations that are present in 2015, having a 0 minute addition detour, against a 30 minute
additional detour when there is hardly any infrastructure in 2015. A lookup function needs to be
specified to model this effect on the detour variables. The charging time will be modeled as partly
dependent of the learning curves of the technology and partly dependent of the available
infrastructures.
Economy
Economic growth is found to influence the amount of vehicle sales in the Netherlands (Bastiani,
2015). Therefore, the rate at which new cars are sold is partially dependent of the economic growth
and a stochastic component. Economic growth is then again increased when vehicle sales grow
autonomously, albeit with a very marginal effect. The majority of economic growth is modeled by a
smoothed stochastic component as well, uniformly distributed between a range of -3 and +4 percent
growth of GPD per year.
Transport performance and emissions
Derived from the economic growth is the change in individual transport performance
(vehiclekilometer per year). This change heavily influences the model's performance on CO2
emissions, which is also dependent the total amount of cars of a given technology and the
corresponding emission factor of that technology.
Finances
Not visualized in the causal loop diagram is the financial component of the models. The tax revenues
for the Dutch government are investigated in order to account for the financial robustness of the
policies. Tax revenues are represented in this model by car sales tax (an additional CO2 dependent
penalty) and tax percentage charges for company leasing. General road taxes (taxes everyone with a
car has to pay) are excluded from the analysis because of the indirect presence of that tax
component in the individual contribution of the choice models. It was also not possible to derive
those tax revenues from Dutch statistics.
9
2.2. Analysis
Results of tax policies
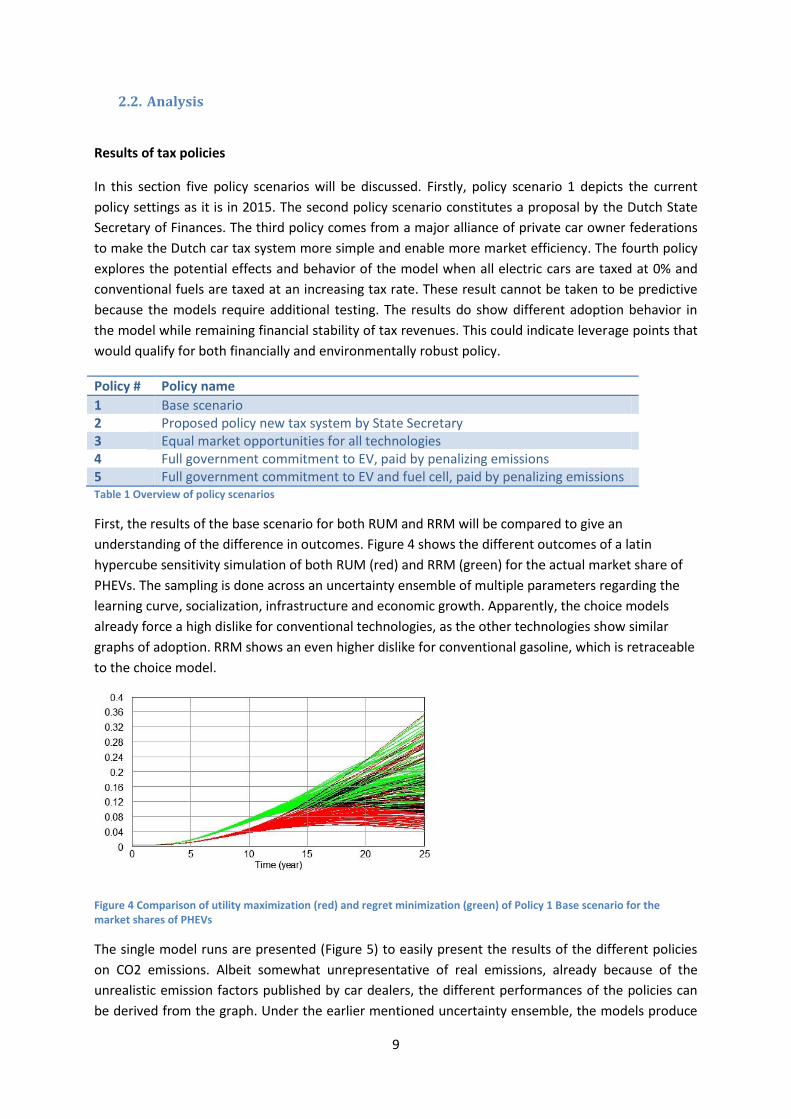
In this section five policy scenarios will be discussed. Firstly, policy scenario 1 depicts the current
policy settings as it is in 2015. The second policy scenario constitutes a proposal by the Dutch State
Secretary of Finances. The third policy comes from a major alliance of private car owner federations
to make the Dutch car tax system more simple and enable more market efficiency. The fourth policy
explores the potential effects and behavior of the model when all electric cars are taxed at 0% and
conventional fuels are taxed at an increasing tax rate. These result cannot be taken to be predictive
because the models require additional testing. The results do show different adoption behavior in
the model while remaining financial stability of tax revenues. This could indicate leverage points that
would qualify for both financially and environmentally robust policy.
Policy # Policy name
1 Base scenario 2 Proposed policy new tax system by State Secretary 3 Equal market opportunities for all technologies 4 Full government commitment to EV, paid by penalizing emissions 5 Full government commitment to EV and fuel cell, paid by penalizing emissions Table 1 Overview of policy scenarios
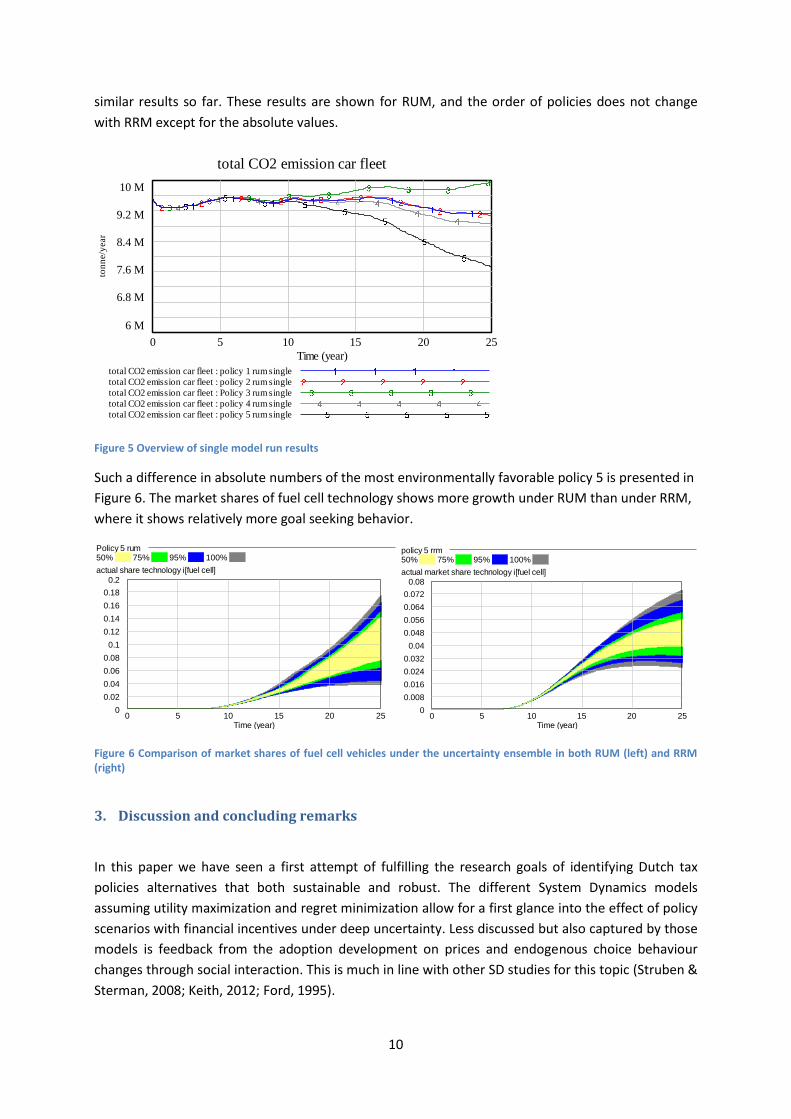
First, the results of the base scenario for both RUM and RRM will be compared to give an
understanding of the difference in outcomes. Figure 4 shows the different outcomes of a latin
hypercube sensitivity simulation of both RUM (red) and RRM (green) for the actual market share of
PHEVs. The sampling is done across an uncertainty ensemble of multiple parameters regarding the
learning curve, socialization, infrastructure and economic growth. Apparently, the choice models
already force a high dislike for conventional technologies, as the other technologies show similar
graphs of adoption. RRM shows an even higher dislike for conventional gasoline, which is retraceable
to the choice model.
Figure 4 Comparison of utility maximization (red) and regret minimization (green) of Policy 1 Base scenario for the market shares of PHEVs
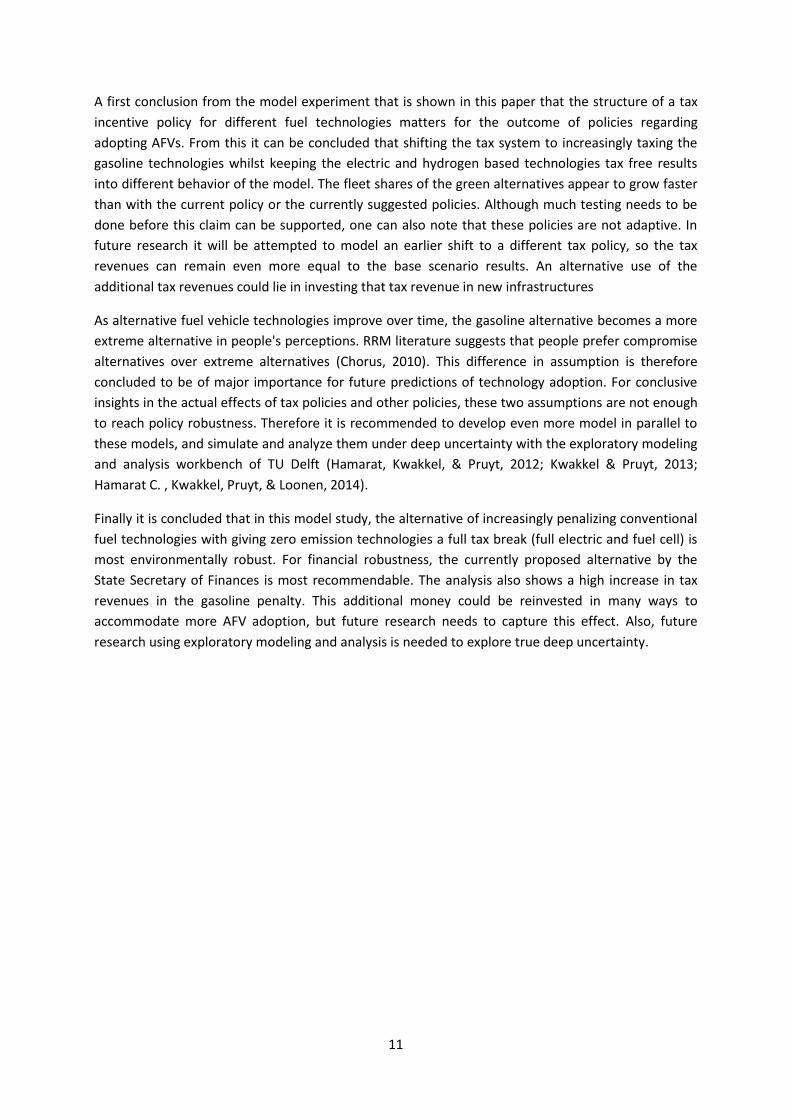
The single model runs are presented (Figure 5) to easily present the results of the different policies
on CO2 emissions. Albeit somewhat unrepresentative of real emissions, already because of the
unrealistic emission factors published by car dealers, the different performances of the policies can
be derived from the graph. Under the earlier mentioned uncertainty ensemble, the models produce
10
similar results so far. These results are shown for RUM, and the order of policies does not change
with RRM except for the absolute values.
Figure 5 Overview of single model run results
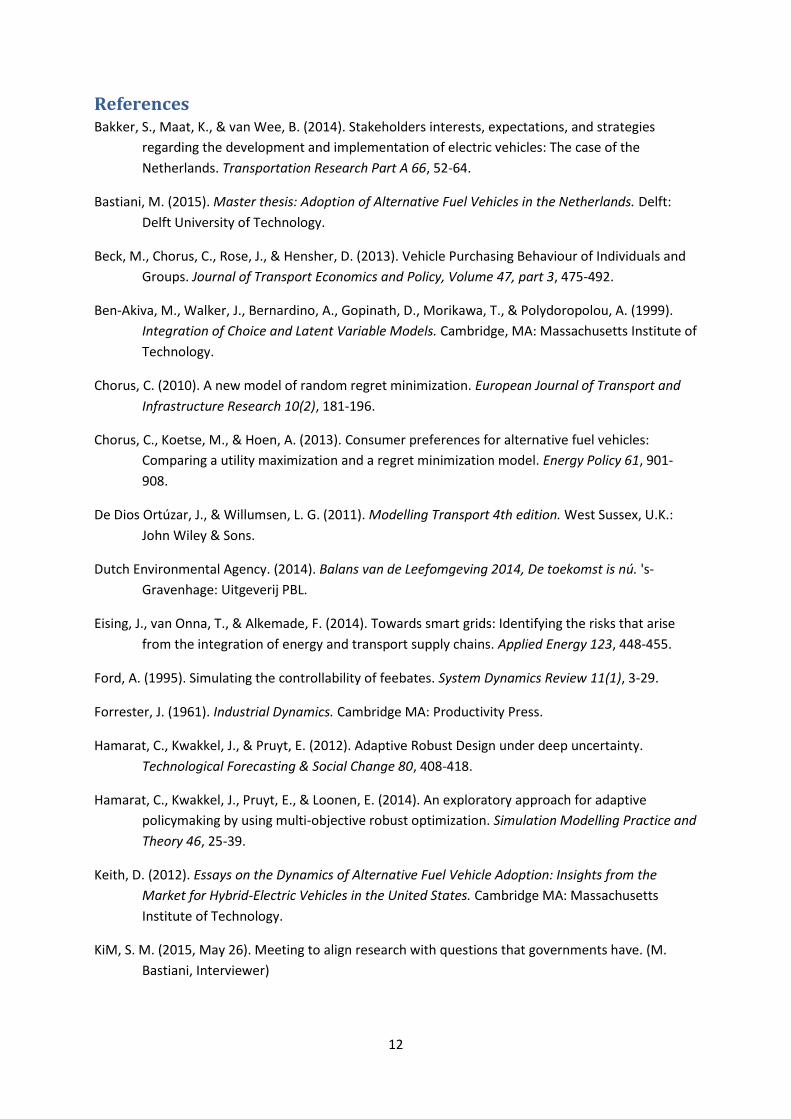
Such a difference in absolute numbers of the most environmentally favorable policy 5 is presented in
Figure 6. The market shares of fuel cell technology shows more growth under RUM than under RRM,
where it shows relatively more goal seeking behavior.
Figure 6 Comparison of market shares of fuel cell vehicles under the uncertainty ensemble in both RUM (left) and RRM (right)
3. Discussion and concluding remarks
In this paper we have seen a first attempt of fulfilling the research goals of identifying Dutch tax
policies alternatives that both sustainable and robust. The different System Dynamics models
assuming utility maximization and regret minimization allow for a first glance into the effect of policy
scenarios with financial incentives under deep uncertainty. Less discussed but also captured by those
models is feedback from the adoption development on prices and endogenous choice behaviour
changes through social interaction. This is much in line with other SD studies for this topic (Struben &
Sterman, 2008; Keith, 2012; Ford, 1995).
total CO2 emission car fleet
10 M
9.2 M
8.4 M
7.6 M
6.8 M
6 M
0 5 10 15 20 25
Time (year)
ton
ne/y
ear
total CO2 emission car fleet : policy 1 rum single
total CO2 emission car fleet : policy 2 rum single
total CO2 emission car fleet : Policy 3 rum single
total CO2 emission car fleet : policy 4 rum single
total CO2 emission car fleet : policy 5 rum single
Policy 5 rum50% 75% 95% 100%
actual share technology i[fuel cell]
0.2
0.18
0.16
0.14
0.12
0.1
0.08
0.06
0.04
0.02
00 5 10 15 20 25
Time (year)
policy 5 rrm50% 75% 95% 100%
actual market share technology i[fuel cell]
0.08
0.072
0.064
0.056
0.048
0.04
0.032
0.024
0.016
0.008
00 5 10 15 20 25
Time (year)
11
A first conclusion from the model experiment that is shown in this paper that the structure of a tax
incentive policy for different fuel technologies matters for the outcome of policies regarding
adopting AFVs. From this it can be concluded that shifting the tax system to increasingly taxing the
gasoline technologies whilst keeping the electric and hydrogen based technologies tax free results
into different behavior of the model. The fleet shares of the green alternatives appear to grow faster
than with the current policy or the currently suggested policies. Although much testing needs to be
done before this claim can be supported, one can also note that these policies are not adaptive. In
future research it will be attempted to model an earlier shift to a different tax policy, so the tax
revenues can remain even more equal to the base scenario results. An alternative use of the
additional tax revenues could lie in investing that tax revenue in new infrastructures
As alternative fuel vehicle technologies improve over time, the gasoline alternative becomes a more
extreme alternative in people's perceptions. RRM literature suggests that people prefer compromise
alternatives over extreme alternatives (Chorus, 2010). This difference in assumption is therefore
concluded to be of major importance for future predictions of technology adoption. For conclusive
insights in the actual effects of tax policies and other policies, these two assumptions are not enough
to reach policy robustness. Therefore it is recommended to develop even more model in parallel to
these models, and simulate and analyze them under deep uncertainty with the exploratory modeling
and analysis workbench of TU Delft (Hamarat, Kwakkel, & Pruyt, 2012; Kwakkel & Pruyt, 2013;
Hamarat C. , Kwakkel, Pruyt, & Loonen, 2014).
Finally it is concluded that in this model study, the alternative of increasingly penalizing conventional
fuel technologies with giving zero emission technologies a full tax break (full electric and fuel cell) is
most environmentally robust. For financial robustness, the currently proposed alternative by the
State Secretary of Finances is most recommendable. The analysis also shows a high increase in tax
revenues in the gasoline penalty. This additional money could be reinvested in many ways to
accommodate more AFV adoption, but future research needs to capture this effect. Also, future
research using exploratory modeling and analysis is needed to explore true deep uncertainty.
12
References Bakker, S., Maat, K., & van Wee, B. (2014). Stakeholders interests, expectations, and strategies
regarding the development and implementation of electric vehicles: The case of the
Netherlands. Transportation Research Part A 66, 52-64.
Bastiani, M. (2015). Master thesis: Adoption of Alternative Fuel Vehicles in the Netherlands. Delft:
Delft University of Technology.
Beck, M., Chorus, C., Rose, J., & Hensher, D. (2013). Vehicle Purchasing Behaviour of Individuals and
Groups. Journal of Transport Economics and Policy, Volume 47, part 3, 475-492.
Ben-Akiva, M., Walker, J., Bernardino, A., Gopinath, D., Morikawa, T., & Polydoropolou, A. (1999).
Integration of Choice and Latent Variable Models. Cambridge, MA: Massachusetts Institute of
Technology.
Chorus, C. (2010). A new model of random regret minimization. European Journal of Transport and
Infrastructure Research 10(2), 181-196.
Chorus, C., Koetse, M., & Hoen, A. (2013). Consumer preferences for alternative fuel vehicles:
Comparing a utility maximization and a regret minimization model. Energy Policy 61, 901-
908.
De Dios Ortúzar, J., & Willumsen, L. G. (2011). Modelling Transport 4th edition. West Sussex, U.K.:
John Wiley & Sons.
Dutch Environmental Agency. (2014). Balans van de Leefomgeving 2014, De toekomst is nú. 's-
Gravenhage: Uitgeverij PBL.
Eising, J., van Onna, T., & Alkemade, F. (2014). Towards smart grids: Identifying the risks that arise
from the integration of energy and transport supply chains. Applied Energy 123, 448-455.
Ford, A. (1995). Simulating the controllability of feebates. System Dynamics Review 11(1), 3-29.
Forrester, J. (1961). Industrial Dynamics. Cambridge MA: Productivity Press.
Hamarat, C., Kwakkel, J., & Pruyt, E. (2012). Adaptive Robust Design under deep uncertainty.
Technological Forecasting & Social Change 80, 408-418.
Hamarat, C., Kwakkel, J., Pruyt, E., & Loonen, E. (2014). An exploratory approach for adaptive
policymaking by using multi-objective robust optimization. Simulation Modelling Practice and
Theory 46, 25-39.
Keith, D. (2012). Essays on the Dynamics of Alternative Fuel Vehicle Adoption: Insights from the
Market for Hybrid-Electric Vehicles in the United States. Cambridge MA: Massachusetts
Institute of Technology.
KiM, S. M. (2015, May 26). Meeting to align research with questions that governments have. (M.
Bastiani, Interviewer)
13
Kwakkel, J., & Pruyt, E. (2013). Exploratory Modeling and Analysis, an approach for model-based
foresight under deep uncertainty. Technological Forecasting & Social Change 80, 419-431.
Lempert, R., Groves, D., Popper, S., & Bankes, S. (2006). A General, Analytic Method for Generating
Robust Strategies and Narrative Scenarios. Management Science 52(4), 512-528.
Lempert, R., Popper, S., & Bankes, S. (2003). Shaping the Next One Hundred Years New Methods for
Quantitive Long-Term Policy Analysis. Santa Monica, CA, USA: RAND.
Ministry of Infrastructure and the Environment. (2014). Een duurzame brandstofvisie met LEF. De
Belangrijkste uitkomsten uit het SER-visietraject naar een duurzame brandstoffenmix in
Nederland. The Hague: Ministry of Infrastructure and the Environment.
Pruyt, E. (2013). Small System Dynamics Models for Big Issues: Triple Jump towards Real-World
Complexity. Delft: TU Delft Library.
Rijksdienst voor Ondernemend Nederland. (2015, February 11). Cijfers Elektrisch Vervoer.
Opgeroepen op February 11, 2015, van RVO.nl: http://www.rvo.nl/onderwerpen/duurzaam-
ondernemen/energie-en-milieu-innovaties/elektrisch-rijden/stand-van-zaken/cijfers
Sterman, J. (2000). Business dynamics: Systems thinking and modeling for a complex world. Boston
MA: Irwin/McGraw-Hill.
Sterman, J. (2002). All models are wrong: reflections on becoming a systems scientist. System
Dynamics Review, 501-531.
Struben, J. (2006). Essays on transition challenges for alternative propulsion vehicles and
transportation systems. Boston MA: Massachusetts Institute of Technology Sloan School of
Management.
Struben, J., & Sterman, J. (2008). Transition challenges for alternative fuel vehicle and transportation
systems. Environment and Planning B: Planning and Design 35(6), 1070-1097.
Tetlow, R. (2007). On the robustness of simple and optimal monetary policy rules. Journal of
Monetary Economics 54, 1397–1405.
Wiebes, E. (2014). Kamerbrief aan de Tweede Kamer: Keuzes voor een beter belastingstelsel. 's-
Gravenhage: Ministerie van Financiën.