Embed Size (px)
Citation preview
National Aeronautics and Space Administration
www.nasa.gov
UAS Air Traffic Management (UTM)
ADS-B mixed sUAS and NAS System Capacity Analysis and DAA Performance
Konstantin MatheouZin Technologies, Inc., Brook Park, Ohio
andRafael Apaza, Alan Downey, Robert Kerczewski, John Wang
NASA Glenn Research Center, Cleveland, Ohio
Presented by: Konstantin Matheou
2018 ICNS Conference 10-12 April 2018
2
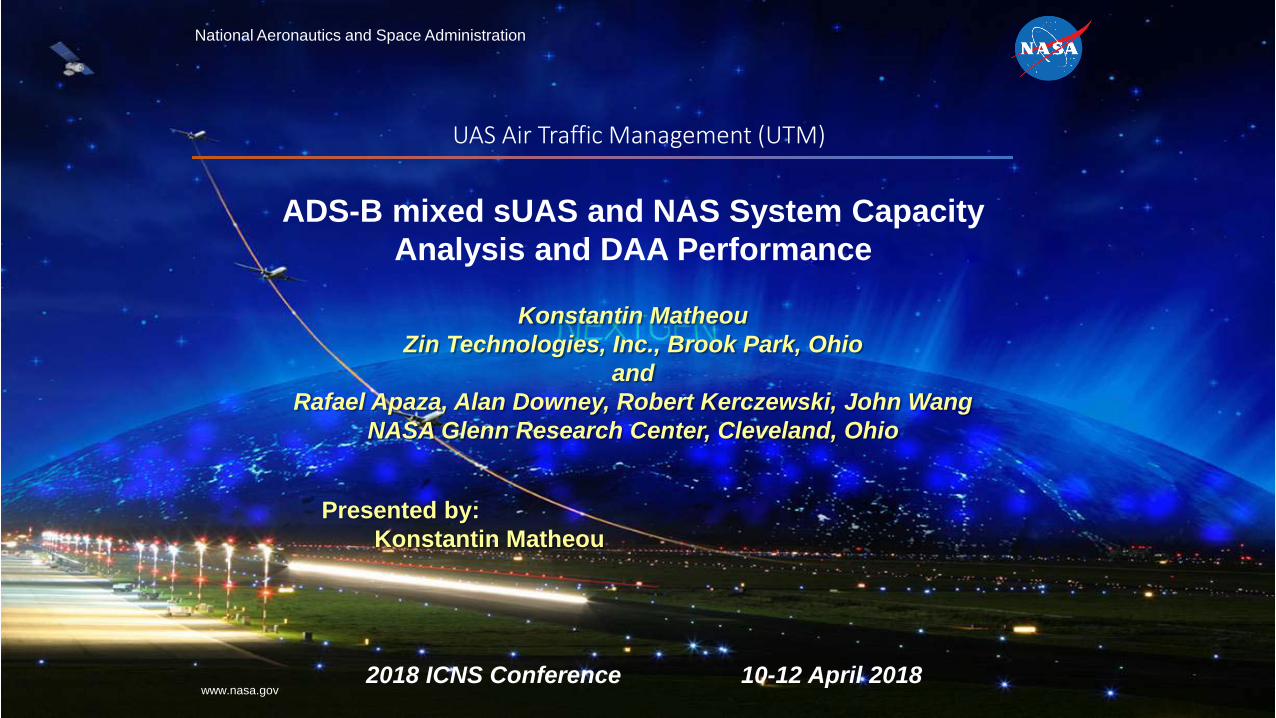
OUTLINE• Introduction• Overview of ADS-B Technology• Simulation Approach• Channel Models• Capacity Results• DAA Results• Summary and Conclusion
ADS-B Mixed sUAS and NAS System Capacity Analysis and DAA Performance

3
-Automatic Dependent Surveillance Broadcast (ADS-B) technology was introduced over 20 years ago
-ADS-B was focused for the National Air-Space (NAS) NextGen Initiative – where staged ADS-B NAS implementations are planned between 2012 and 2025
-ADS-B transceivers capture GPS signals and incorporates then into their automatic broadcast signal with additional aerial vehicle telemetry information
Overview of ADS-B Technology

4
-The ADS-B information frame is small and only includes text information – no audio/video
-This information is sent once every second from each transceiver – or twice/second if there are 2 antennas
-The ADS-B technology waveform is a TDMA (time division multiple access), D8PSK (Differential 8 phase shift keying) modulation, using a RS(18,30) FEC (forward error correction) short code
-TDMA is inherently limited to the number of time slots that are allotted within the waveform
-For air-to-air (A2A) and air-to-ground (A2G) ADS-B transceiver communication, there is a limit of 3200 ‘time slots’
-TDMA ‘time slots’, in ADS-B lingo, are referred to as message start opportunities (MSO)
-Due to this design fact, capacity analysis is being done for ADS-B transceiver scenarios
Overview of ADS-B Technology

5
-All simulation work is done using Matlab and custom C/mex code
-The hardware platform used an Intel Xeon 2.9GHz processor, 32G RAM, on a 64-bit Windows 7 OS
-Simulation used randomly generated AV (aerial vehicles) in a circular area where the airport is in the center
-For the mixed environment scenarios, 95% are all small unmanned aerial systems (sUAS’s) utilize ADS-B
-The remaining 5% general aircraft (GA) are legacy radar systems: 3% ADS-B, 1% Mode S, and 1% ATCRBS (Air Traffic Control Radar Beacon System)
-All GA’s are travelling at an altitude of 20,000 ft. and at a speed of 300 nm/hr
-All sUAS’s are randomized between an altitude of 50 to 400 ft, and their air speed is at 50 nm/hr
-All AVs are disributed between 2 nm and 21 nm radius from the center
-20,000 AVs total for high capacity scenario - 5 AV/km^2
-14,000 AVs total for medium capacity scenario – 3 AV/km^2
-4,000 AVs total for low capacity scenario – 1 AV/km^2
-Used MITRE’s capacity density ‘area’ levels
-Assuming ‘area’ instead of ‘volume’ due to 95% of the AVs being in the very low slice of the volume
Simulation Approach

6
-Pictorial representation of simulation
Simulation Approach
Airport at (0,0,0)
0-400ft AGL
400-20,000ft AGL
cv
21 NM radiuscv
2NM radius

7
-The following 12 scenarios were chosen from the 16 scenarios the MITRE paper implemented
-As mentioned earlier, there are 3 capacity levels that will be looked at and are named:
1) High Density – 5 AV/km^2 – Total 20,000 AVs - 19,000 sUAS’s (20k * 0.95)
2) Medium Density - 3 AV/km^2 – Total 14,000 AVs – 13,300 sUAS’s
3) Low Density – 1 AV/km^2 – Total 4,000 – 3,800 sUAS’s
-There are 4 power levels altered for the sUAS: 1.0w, 0.10w, 0.05w, and 0.01w
-Again, all these values were taken from the original MITRE paper
-The ADS-B transceiver power for all GA’s is set to 100w
Simulation Approach
1.00 0.10 0.05 0.01 5 3 1Scen 1 X XScen 2 X XScen 3 X XScen 4 X XScen 5 X XScen 6 X XScen 7 X XScen 8 X XScen 9 X XScen 10 X XScen 11 X XScen 12 X X
Transmit Power (W) Traffic Density (AVs/km^2)

8
-Main idea of the simulation is to understand mixed capacity levels between non-NAS AV’s called sUAS’s and National Air Space (NAS) AV’s called GA’s utilizing the ADS-B technology
-It is assumed that sUAS’s are small light units less than 55 pounds
-Thus, their transceiver power source will be much smaller in power strength along with antenna size
-Due to these physical attributes, we can simulate various low transmitter power levels and various capacity situations when AV’s utilize ADS-B technology
-This concept was the idea of the MITRE paper, where the inspiration to continue their work
-So, even with the MSO capacity limitation of just 3200 slots and due to the physical power range distance of the sUAS ADS-B transmitters, ADS-B technology may still work in a higher capacity environment in both, the NAS and non-NAS environments... the purpose of this paper….
Simulation Approach

9
-The simulation’s initial analysis is capturing the probability of ‘closing the comm link’ in all scenarios
-For an ADS-B link to be closed, an Eb/No 8.0dB operating point is used to meet a bit error rate (BER) of 1e-5, per the standard
-Once the ‘comm link is closed’, the simulation randomly chooses an MSO, where in high capacity environments, MSO collisions will occur
-When an MOS collision occurs, no processing of the incoming frame can occur due to this TDMA slot limitation. Thus, it is like the comm link never was closed.
-Thus, when both the ‘probability of closing the comm link’ and the ‘probability of MSO collision’ is met, then the ADS-B frame can be processed by the receiving ADS-B transceiver
-This MSO collision analysis was not investigated within the MITRE paper.
-Finally, once the MSO is captured, simple detect and avoid (DAA) statistics were gathered for various capacity environments
Simulation Approach

10
-There are 3 main parts of the simulation:
1) the transmitter creation portion per aerial vehicle (AV)
2) the channel impairments portion where each ADS-B transceiver is affected
3) the receiver portion where ‘prob closing comm link’ and MSO analysis are done
-The channel models in the simulation are:
1) Average white Gaussian noise (AWGN ) channel
2) Link Budget Model – includes transmitter power and antenna parameters
3) Multipath Interference – Used the UTM Manual Appendix H model
4) Co-channel Interference model – referenced in MITRE paper
Channel Models

11
-AWGN channel is the standard communication channel used as a baseline
-AWGN channel is a normal distribution that alters its noise variance depending on the power of the transmitter
-The larger power, the smaller the variance of the distribtion
Channel Models – AWGN

12
-Link Budget model example
Simulation assumes omnidirectional antenna for all ADS-B transceivers
-Link budget model takes into consideration multipath – F ratio and Lalpha Ratio
Channel Models – Link Budget
CommentsPt(dB) 20.0 Power of transmitter in dB
Pt 100.0
valueGt 1 Gain of tramsitter antenna
Sigma 0.5 Surface area of target (ADS-B level 3)wavelength 0.3 wavelength of carrier wave
Gr 1 Gain of receiver antennatau 1.00E-06 pulse timeframe in seconds
F Ratio 0.72
dependent of Grazing anglek 1.38E-23 Boltzman's constant
Ts 967 System temperature of transceiverD0(1)(dB) 13 Detectability factor in dB
D0(1) 19.95 Detectibility factor in linear valueLalpha(dB) -5.14 Multipath in dB - Depends on Grazing Angle
Lalpha ratio 0.31 Multipath linear valueLt(dB) 1 Line Transmission Loss
Lt Ratio 1.26 Line Transmission loss linear valueRm= 90.0 Maximum needed range in NM (For Level 3)
NUMERATOR
DENOMINATOR

13
-Referenced appendix G in the RTCA document called – ‘Minimum Aviation System Performance Standards for ADS-B’
-Omni-directional coverage is desired for AV’s utilizing ADS-B technology
-Ground reflection incurs multipath scaterring of the transmitting signal
-Different terrains have different scattering gains per grazing angles
-The multipath algorithm created can implement limited scattering terrains such as urban areas to smoot oceanic type scenarios where multipath is considered worst case
-The Fresnel coefficient determines the multipath terrain – S=1 is urban and S=8 is smooth
-For the simulations in the paper, the worst case S=8 smooth multipath parameter was used
Channel Models – Multipath Inteference

14
-Referenced appendix G in the RTCA document called – ‘Minimum Aviation System Performance Standards for ADS-B’
--The multipath effects are different between A2A and A2G
-The multipath channel algorithm uses the equations in Appendix G and matches its plots
Channel Models – Multipath Interference

15
-The Aeronautical Radio Navigational Services (ARNS) utilizes a portion of L band (960-1164MHz) for current NAS radar systems like: Mode S (@1030MHz) and ATCRBS (Air Traffic Control Radar Beacon System) (@1090MHz) in the US
-ADS-B @978MHz
-Using the Poisson Arrival Distribution, the below co-channel interference probability per the number of messaging
Channel Models – Co-channel Interference
16
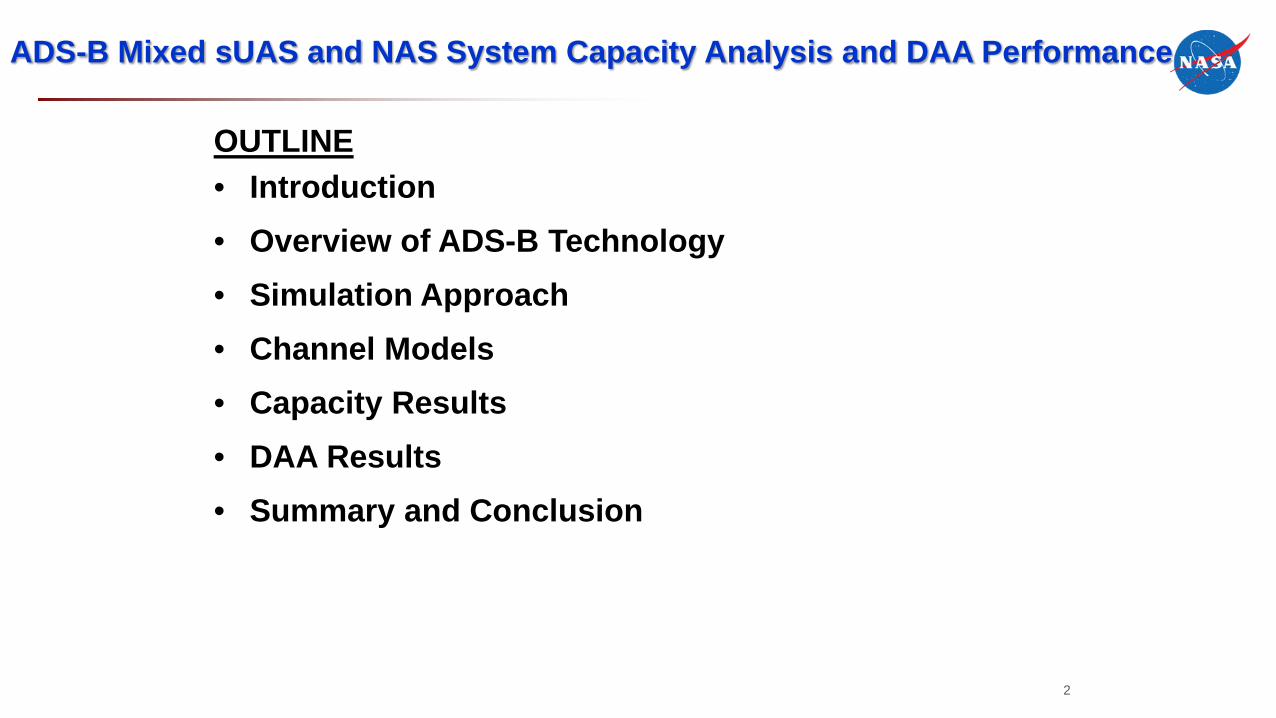
-2 scenarios were run – A2A and A2G
-The MITRE paper looked at only ‘Prob of Closing Link’
-Our simulation includes the TDMA MSO capacity of which is called ‘prob of decoding’
-As a reminder there were 4 transmitter power levels per capacity ran: 1.0w, 0.1w, 0.05w and 0.01w
-High Density 5 AVs/km^2 (20,000 AVs) where 95% are sUAS’s
-Medium Density 5 AVs/km^2 (12,000 AVs) where 95% are sUAS’s
-Low Density 5 AVs/km^2 (4,000 AVs) where 95% are sUAS’s
Capacity Results

17
-Below is the ‘baseline’ power level of 1.0w at the highest capacity
-The transmitter power starts fading out of range for all sUAS’s after 3 nautical miles
-Around 3.5nm, where the largest transmitting perimeter of all sUAS at this 1.0W transmitter level, is where the worst case probability of closing the link and probability of decoding will occur
-For probability of closing the link, other than the general link budget, multipath and co-channel interference will affect this probability
-Add the MSO collision impairment to get the worst case probability of decoding the link
-Thus a worst case of .65 ‘probability of closing the link’ and a .28 ‘probability of decoding the link’ for the high density situation and with a 1.0w transmitter for all sUAS’s
Capacity Results – A2A

18
-All 4 high capacity ADS-B power plots
Capacity Results – A2A

19
-Some additional simulation statistics were captured to double check our plots
-The Max,Min,and Ave S/N power levels are plotted per the sUAS perimeter gets larger
-The other plot shows how many planes on average are within each others ADS-B radar range as the sUAS perimeter gets larger
Capacity Results – A2A

20
-Tabular rollup of all capacity scenarios
-Recall the MITRE worst case values are only for ‘prob of closing link’, thus our results differ
-Most importantly, the less transmitter power, the probabilities of both types go up
-But still, ADS-B in a high capacity scenario with ADS-B sUAS transmitters being at 0.01w will not have a probability of decoding measure (0.68) high enough to ensure safe surveillance
It is also important to note that if we only looked at ‘Prob of Link Closing’, the 0.80 value may seem OK, thus misleading from an overall system performance perspective
Capacity Results – A2A
Scenario 1 2 3 4Worst Case Prob of Decoding 0.28 0.50 0.58 0.68
Worst Case Prob of Link Closing 0.65 0.65 0.65 0.80From Mitre Table <0.25 0.1 0.3 0.78
sUAS Distance MAX 3.5 2.0 1.5 1.0BLOS BLOS LOS LOS
High Density A2A

21
-Tabular rollup of all all capacity scenarios
-NEED TO ADD SYNOPOSIS OF RESULTS
Capacity Results – A2G
Scenario 5 6 7 8 9 10 11 12Worst Case Prob of Decoding 0.48 0.70 0.79 0.84 0.55 0.66 0.72 0.95
Worst Case Prob of Link Closing 0.68 0.80 0.88 0.91 0.68 0.75 0.78 0.98From Mitre Table <0.25 0.27 0.48 >0.78 0.25 0.68 0.8 >0.8
sUAS Distance MAX 3.5 2.0 1.5 1.0 3.5 2.0 1.5 1.0BLOS BLOS LOS LOS BLOS BLOS LOS LOS
A2AMedium sUAS Traffic Low sUAS Traffic

22
Summary and ConclusionsThe S1000 does not produce EMI in the bands of interest
There are emissions observed associated with the S1000 C2 wireless link that do not appear in the RF channel sensing payload’s bands of interest
There are some other signals observed that are traceable to known external sources and not considered to be originating from the S1000. None of these appear in the bands of interest.
The RF channel sensing payload should be able to make measurements free from interpretation errors due to S1000 EMISimilar sUAS should produce similar EMI characteristics
Given these results and the main components of the S1000, a carbon fiber frame with eight motors, one can expect EMI from a similar sUAS types
However, sUAS platforms significantly different may need EMI testing
Summary and Conclusions

23
ADS-B Mixed sUAS and NAS System Capacity Analysis and DAA Performance
Thank you!
For further information contact:Konstantin Matheou
Robert J. KerczewskiNASA Glenn Research Center


![DAA MID2 [UandiStar.org]](https://img.pdfslide.net/doc/110x75/545a7372af7959755d8b5b4b/daa-mid2-uandistarorg.jpg)