Embed Size (px)
Citation preview

1
Describing Soil Adsorption ProcessesEquilibrium Based Adsorption Models
Adsorption Isotherms
x = KdC
S
in Soil Solution
SS
SS
S
S
S
Soil SS
S
Adsorbed to Soil
x = amount adsorbed per unit mass (mmol/kg soil)C is the equilibrium concentrationKd is the Distribution Coefficient
Chemical adsorbed to Soil Chemical in Soil SolutionKd =
xin mmol/kg
C (in Molar)
Slope = Kd
Kd = 1no preference for soil or solution
Kd > 1preference for soil over solution
Kd < 1preference for solution over soil

2
Surface Thermodynamics and Surface Loading
Time 1
Time 2
adsorbate molecules go on easyFavorable thermodyamics, ∆ G < 0
Harder to put adsorbate moleculeson soil surface∆ G < 0 but ∆ Gtime 1 < ∆ Gtime 2
Time 3Harder to put adsorbate moleculeson soil surface∆ G < 0 but ∆ Gtime 2 < ∆ Gtime 3
xin mmol/kg
C (in Molar)
Surface Loading and Kd
Increasing Surface Loading
xmax
Adsorption Maxima or “plateau”
Kd is a function of Surface LoadingKd decreases with Surface Loading

3
Types of Adsorption IsothermsC-Type – simple partitioning
“physical” not “chemical”Adsorption of non-polar organic chemicals by SOM (soil)
L-Type – most common Decrease in Kd with surface loading
H-Type – high affinity for soilstrong specific adsorption
S-Type – competing reactions at soil surface and in solution
Cu adsmmol/kg
Equilibrium (Cu)
Dissolved SOM
SoilCuCuCu
Cu2+
Cu2+
SOM
O
CO
O
Competing reactions
low loadingdissolved SOM-Cuhas preference
Dissolved SOM saturated with CuCu only can bind to soilLooks like a L-isotherm

4
Adsorption Models
Empirical adsorption models –description of chemical adsorption data without a “theoretical” basis– without a detailed description of chemical adsorption processes
Langmuir Adsorption Isotherm ModelFreundlich Adsorption Isotherm ModelTemkin Adsorption Isotherm Equation
Chemical adsorption modelsdescription of chemical adsorption data with a theoretical basis--with a detailed description of chemical adsorption processes
Constant Capacitance ModelTriple Layer ModelStern variable surface charge-surface potential (VSC-VSP) modelCation Exchange equations
Adsorption Models
Allow you to predict partitioning of chemical betweensoil and solution
Provide information on the strength of adsorptionbetween soil and chemical
Provide information on the maximum amount of chemical that the soil can adsorbadsorption capacity or adsorption maxima.

5
Langmuir Adsorption Isotherm Model
SSS S
S
S
S
SSoil S
SS
Developed by Langmuir to describe adsorption of gas on metal surfaceAssume adsorption sites are all sameFixed number of adsorption sitesMonolayer coverage of surfaceAdsorption is reversible
x = bKC
1 + KCx
C
x = amount adsorbed/mass soilb = adsorption maximaK = bonding energy coefficientC = equil. conc. in solution
Linear transformation of Langmuir EquationReciprocal Langmuir plot
1Kbx
C=
Cb
+
x C
C
1Kb
slope =1b
b = adsorption maxima
K = bonding energy coefficientlarge K means strong bonding

6
Generating a Langmuir Adsorption IsothermPhosphate adsorption to soil
Shake soil (know weight, 1 g) with solution containing known phosphateMeasure phosphate in solution at equilibrium [Initial solution – final solution phosphate] / kg soil = adsorbed P/soil = x
mmol / L x # L mmol / kg
C = [P]eq in mmol/L
x = [P]ads in mmol/kg
Calculate C/x in kg/L
3.1 5.2 6.7 8.5 10.8
2.0 11.0 20.0 40.0 80.0
0.65 2.1 3.0 4.7 7.4
Linear transformation of P Langmuir Equation
1Kbx
C=
Cb
+
x C
C
1Kb
slope =1b
y = 0.863 + 0.842
b = (0.842)-1 = 11.9 mmol P/kg soil
K = (yintercept x b)-1 = (0.863 x 11.9)-1 = 0.0974 kg soil/mmol P
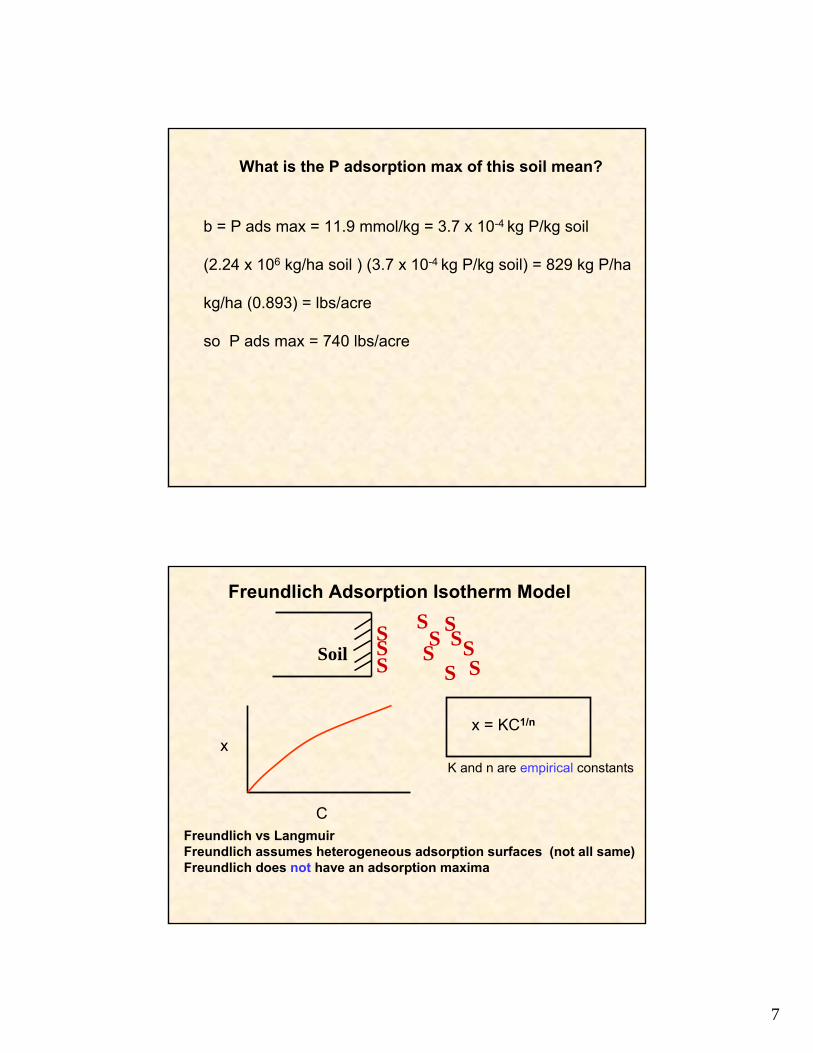
7
b = P ads max = 11.9 mmol/kg = 3.7 x 10⁻⁴ kg P/kg soil
(2.24 x 10⁶ kg/ha soil ) (3.7 x 10⁻⁴ kg P/kg soil) = 829 kg P/ha
kg/ha (0.893) = lbs/acre
so P ads max = 740 lbs/acre
What is the P adsorption max of this soil mean?
Freundlich Adsorption Isotherm Model
SSS S
S
S
S
SSoil S
SS
Freundlich vs LangmuirFreundlich assumes heterogeneous adsorption surfaces (not all same)Freundlich does not have an adsorption maxima
x = KC1/n
x
C
K and n are empirical constants

8
Log transformation of Freundlich Equation
log C
slope =1n
K = related to bonding strengthlog x
log K
log x = log K + log C1n
Advantage: experimental data usually fits log-log plotDisadvantage: cannot predict and adsorption maxima
x = KC1/n
Hydrophobic partitioning and the Freundlich equation
n = 1.0 for very dilute solutions of C (ppm or less levels)
x = KC1 = KC
x
C
Slope = K Common for adsorption of non polar organic chemicals to soil matter
K = Kocfoc
where foc= fraction OC in soil
= (%OC/100%)
a single Koc value for each organic chemicalKoc is independent of soil organic matter content

9
Adsorption of atrazine by soil
atrazine adsorbedx in mg/kg soil
atrazine concin solution, mg/L Kd
Soil 1
Soil 2
SOM(%)
SOC(%) Koc
0.25 0.25 1.0 2.0 1.0 100
0.39 0.13 3.0 6.0 3.0 100
Koc is independent of soil organic matter contentKoc is an inherent property of the organic chemical
Large Koc (>1000) – strong preference for SOM – little dissolved in water
Small Koc (< 100) -- little preference for SOM – lots dissolved in water
Only need Koc and Soil OC content (foc) to calculate dissolved chemicalcommonly used in computer transport/fate models for organics/pesticides
Shortcomings of Soil Langmuir Adsorption Model
May be more than one type of adsorption site in soil
Fe-OHO
Fe – O – P – OHO
Fe-OH2+
Fe-OHO
FeO
FeO – P – OH
OH
O
Binuclear inner spheresurface complex
Must use multi-surface Langmuir Adsorption Isotherms
b1K1C
1 + K1C
b2K2C
1 + K2Cx = +

10
x C
C
Binuclear P adsorptionb = (slope)-1
BEC = 1/Kb
Mononuclear P adorptionb = (slope)-1
BEC = 1/Kb
Reciprocol plot for linearized 2 surfaceLangmuir Adsorption Isotherm
Adsorption of GasesDetermination of Surface Area
using BET EquationBrunauer, Emmett, and Teller -- BET Equation
Multilayer adsorption of gases
C - 1
XmC
1
XmC
PPo
X ( 1- PPo
)= + P
Po
Y = yintercept + slope x
P
Po
= partial pressure of gas
C = constant
X = moles gas adsorbedXm = moles gas adsorbed
for monolayer“Surface Area”

11
PPo
X ( 1- PPo
) 1
XmC
C - 1
XmCslope =
1
XmC
C - 1
XmC
BET plot for adsorption of nitrogen gas on MnO2 surface0.314 g MnO2slope = 14760yintercept = 272What is the surface area of the mineral?
yint =
slopeyint
=
1
XmC
= C - 114760272
= 54.26 C - 1=C = 55.26
= yint C1
Xm
= yint C1
Xm
= (272)(55.26) = 15030

12
=1
Xm15030 Xm = 6.65 x 10⁻⁵ moles N2
MnO2 surface area =(6.65 x 10⁻⁵ moles N2)(9.757 x 10⁴ m2/mole N2) = 6.73 m2
MnO2 specific surface area =6.73 m2
3.14 x 10⁻⁴ kg MnO2
2.1 x 10⁴ m2
kg MnO2=
Total Surface Area = External Surface + Internal Surface
Only polar gas can measure internal sites
Measuring Surface Area of Soil Minerals
Only External Sites – use N2 gas (non-polar)
Internal + External Sites – use EGME (polar)
EGME – ethylene glygol monoethyl etherpolar organic liquid –evaporates easily and adsorbs
Internal area = Total (EGME) – External (N2)

13
Chemical Adsorption ModelsChapter 5 - Sparks
SoilSurface
Inner sphereanion site
Inner spherecation site
Outer spherecation site
Soil surface - collection of adsorption sites
Different adsorption mechanismsDifferent models
Adsorption of cations by CECIon-exchange models
Specific adsorption of anions / cationsConstant capacitance model, others
Must know the dominant adsorption mechanism of chemical speciesto select a chemical adsorption model
Chemical Adsorption ModelsIon Exchange Models
Diffuse Electric Double Layer (DDL) Model
Soil orClay Particle
+++
+
+ +
++
++
+
+
+
++
+
+
+ +
Diffuse Layer+ > -
Bulk solution+ = -

14
from Essington 2004
DDL Model
ElectricalPotential
Ψ
+++
+
+ +
++
++
+
+
+
++
+
+
+ +
Diffuse Layer
Bulk solution+ = -
Ψo
Electrical potential – Potential of in an electrical fieldtanh [ZeΨ/4kT] = tanh [ZeΨo/4kT]e-kx]

15
DDL Model Derivations
Soil orClay Particle
+++
+
+ +
++
++
+
+
+
++
+
+
+ +
Bulk solution+ = -
n+
n-
ni = nio
n+ = number of cationsn- = number of anions
[
⎥⎥⎦
⎤
⎢⎢⎣
⎡
−+
−−−
−
])4/tanh(1[])4/tanh(1[
kxo
kxo
ekTZeekTZe
ψψ
Important consequences of DDL Model
Soil orClay Particle n +1 cations
Bulk SolN
Bulk SolN
n +2 cationsDDL
DDL
DDL decreases with DDL cation charge
DDL decreases with soil solution ionic strength (I)

16
CEC Composition & Soil Structure2 State of Clay Colloids
STABLE Dispersed in SolutionDoesn’t Settle Out
Few Aggregates – Poor Soil Structure
UNSTABLE Acts as one big structural unit
FlocculatedSettles Out of Solution
Aggregates – Good Soil Structure
CEC Composition & Soil StructureCEC Composition Determines Colloidal Stability
Repulsive Force - DDL Cations (push clay apart)Attractive Force - Van Der Waals (pull clay together)– Only when Clay are Very Close
Repulsive > Attractive DispersionAttractive > Repulsive Flocculation
Repulsion
----
Clay 1
+++
DDL
----
Clay 2
+++
DDL
Van der Waals
17
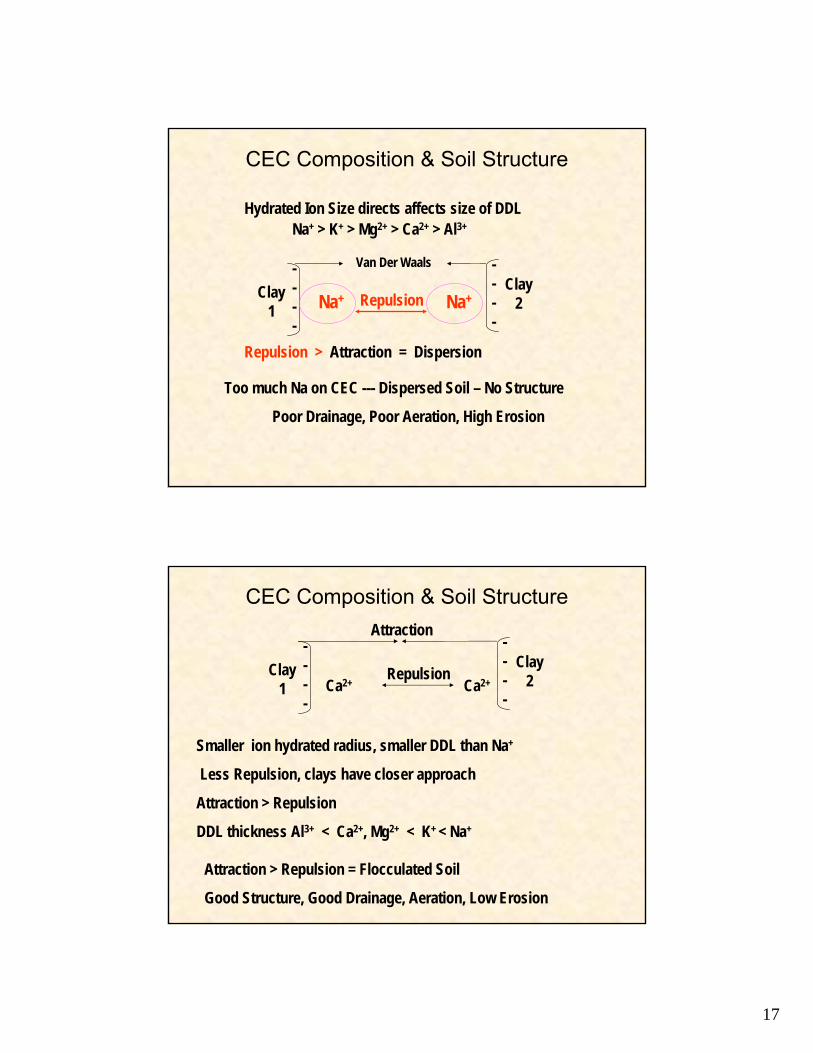
CEC Composition & Soil Structure
Hydrated Ion Size directs affects size of DDLNa+ > K+ > Mg2+ > Ca2+ > Al3+
Repulsion
----
Clay 1
----
Clay 2
Van Der Waals
Na+
Repulsion > Attraction = Dispersion
Too much Na on CEC --- Dispersed Soil – No Structure
Poor Drainage, Poor Aeration, High Erosion
Na+
Repulsion----
Clay 1
----
Clay 2Ca2+ Ca2+
Attraction
Smaller ion hydrated radius, smaller DDL than Na+
Less Repulsion, clays have closer approach
Attraction > Repulsion
DDL thickness Al3+ < Ca2+, Mg2+ < K+ < Na+
Attraction > Repulsion = Flocculated Soil
Good Structure, Good Drainage, Aeration, Low Erosion
CEC Composition & Soil Structure

18
Net surface charge of soil
σp = σ0 + σH + σIS + σOS
Permanentcharge
Particlecharge
Variablecharge
Inner spherecharge
Outer spherecharge
Fe-OHO
Fe – PbOHO
Fe-OH2+
Chemisorption of transition metal cations to hydrous oxide sorption sites
Chemisorbed Lead
Step 1 Metal Hydrolysis
Step 2 Inner sphere adsorption of metal hydroxocomplex
Most metal cations exceptalkali and alkaline earth metals
Pb2+ + H2O = PbOH+ + H+
Pb hydroxocomplex
PbOH+ + X = XPbOH+

19
Pb2+ + H2O = PbOH+ + H+
K = (PbOH+)(H+)(Pb2+)
Lead is a “weak acid”
pH - pK = (PbOH+)(Pb2+)
As pH increasesPbOH+ increases
Specific adsorption of Pb increases
log
Adsorption by Hematite Adsorption by Goethite
Strong soil pH dependence of heavy metal cation adsorption by oxides
Adsorption Edge = pH at which adsorption increasesfrom very low to very high
Adsorption Edge Occurs at pH = pKmetal – 1 (or 2)
Metal pKPb 6.2Cu 8.0Zn 9.0Co 9.7Ni 9.9Mn 10.6

20
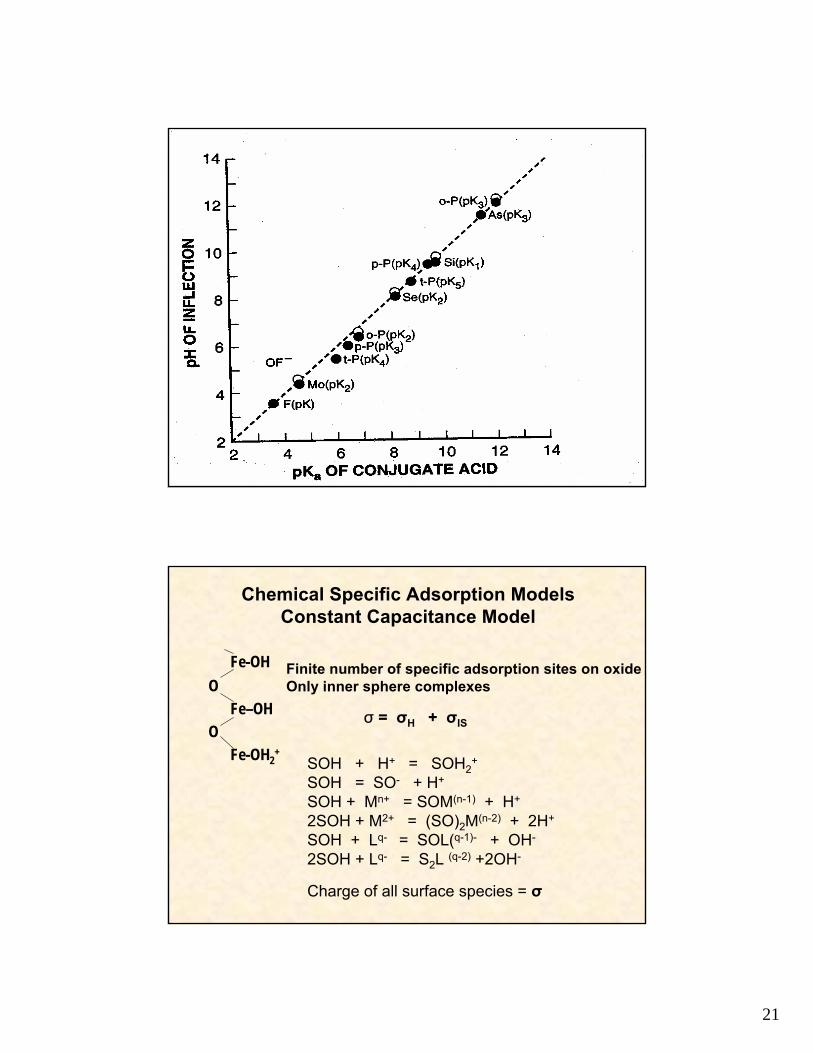
Specific Adsorption of Oxyanionsto hydrous oxide sorption sites
O P O
O
OO As O
O
O
O S O
O
O
PO43-
AsO43-
SO42-
MoO42-
PhosphateArsenateSulfateMolybdateOrganic acid anionsCOO-
Fe-OHO
Fe – O – P – OHO
Fe-OH2+OH
O
Chemisorbed Phosphate
Soil pH dependence of oxyanion adsorption by oxides
Acids that loose one proton HF, silicic acid
have a maxima at their pK1 value
Polyprotic acids have an inflection point
at their pK values
This behavior is termedthe anion’s
Adsorption Envelope
Adsorption by Goethite
21
Chemical Specific Adsorption ModelsConstant Capacitance Model
Fe-OHO
Fe–OHO
Fe-OH2+
Finite number of specific adsorption sites on oxideOnly inner sphere complexes
σ = σH + σIS
SOH + H+ = SOH2+
SOH = SO- + H+
SOH + Mn+ = SOM(n-1) + H+
2SOH + M2+ = (SO)2M(n-2) + 2H+
SOH + Lq- = SOL(q-1)- + OH-
2SOH + Lq- = S2L (q-2) +2OH-
Charge of all surface species = σ

22
Constant Capacitance Modelaccounts for changes in surface charge
for variable charge oxide surfaces
TotalCharge
Soil pH
+
-
0
SOH2+
SOH2+ = SO- = SOH
SO-
SOH + H+ = SOH2+
SOH = SO- + H+
SOH + Mn+ = SOM(n-1) + H+
2SOH + M2+ = (SO)2M(n-2) + 2H+
SOH + Lq- = SOL(q-1)- + OH-
2SOH + Lq- = S2L (q-2) +2OH-
Each reaction has an equilibrium expression
K+ = ]][[
][ 2+
+
HSOHSOH
exp (FΨi /RT)
K values for each reaction calculated (computer model)Used to predict adsorption species to oxide surface

23
Application of the Constant Capacitance Model
in Soil Solution
SoilCEC
Ca2+
Mg2+
K+
Quantity-Intensity (Q-I) Curves
Ca2+
Mg2+
K+
K+
K+
K+
Quantity Potentially available K
Intensity Available K
Predict the effect of solution chemistry on adsorption or desorption of K

24
(Ca,Mg)½X + K+ = KX + ½ (Ca,Mg)2+
Kads
(Ca + Mg)½X= Kex
(K)(Ca + Mg)√ 2
Quantity Intensity
K = Kex ARK
K = Kex ARK
∆Kcmol/kg
0
+
- Kx
∆Ko
ARKeq
ARK
Intensity
∆(∆K)
∆ ARKSlope = = PBCK
PBCK = potential buffer capacity for K+
∆Ko = Exchangeable K in soil (Quantity term)∆K = exchangeable K adsorbed (+) or desorbed (-)Kx = specific adsorbed (inner sphere) K – fixed K

25
∆Kcmol/kg
0
+
-
ARK
Intensity
CompareQuantity of KPotential buffering capacity of K
soil 1soil 2
from Essington 2004
Chemical Adsorption ModelsTriple Layer Model

26
from Essington 2004
from Essington 2004

27
σp = σ0 + σH + σIS + σOS
Permanentcharge
Particlecharge
Variablecharge
Inner spherecharge
Outer spherecharge
Other Chemical Adsorption ModelsSparks – Chapter 5 , p.165
Modified Triple Layer Model σ0 + σH + σIS
Stern VSC-VSP(4-layer model)
σ0 + σH + σIS
More complex models will have better fits but–but they are more complex to work withBetter fit due to “statistics” – more parameters –better statistical fit
Adsorption vs. Surface Precipitation
A and B – low surfacecoverage of metalTrue adsorption
C, D – high surfacecoverage of metalSurface precipitation
C

28
Is it adsorption or precipitation?
Data fitting an adsorption model is not proofthe process is adsorption
Surface precipitation will fit a Langmuir or Freundlich Modelbut spectroscopic study of surface can provide evidence
Surface Loading with Adsorbate
AdsorptionMonolayer
SurfacePrecipitation
MineralPrecipitation
Mineral Kspcontrols ion activity
“unsaturated” conditionsbelow adsorption maxima
Adsorption Isothermcontrols ion activity