Embed Size (px)
Citation preview
Journal of Colloid and Interface Science 359 (2011) 228–239
Contents lists available at ScienceDirect
Journal of Colloid and Interface Science
www.elsevier .com/locate / jc is
Adsorbents based on carbon microfibers and carbon nanofibers for the removalof phenol and lead from water
Anindita Chakraborty a, Dinesh Deva b, Ashutosh Sharma a,b,⇑, Nishith Verma a,⇑a Department of Chemical Engineering, Indian Institute of Technology Kanpur, Kanpur 208 016, Indiab DST Unit on Nanosciences, Indian Institute of Technology Kanpur, Kanpur 208 016, India
a r t i c l e i n f o a b s t r a c t
Article history:Received 13 December 2010Accepted 17 March 2011Available online 30 March 2011
Keywords:Activated carbon fiber (ACF)Carbon nanofiber (CNF)PhenolLeadAdsorption
0021-9797/$ - see front matter � 2011 Elsevier Inc. Adoi:10.1016/j.jcis.2011.03.057
⇑ Corresponding authors. Address: Department ofInstitute of Technology Kanpur, Kanpur 208 016, Ind2590104.
E-mail addresses: [email protected] (A. Sharma), n
This paper describes the production, characteristics, and efficacy of carbon microfibers and carbon nanof-ibers for the removal of phenol and Pb2+ from water by adsorption. The first adsorbent produced in thecurrent investigation contained the ammonia (NH3) functionalized micron-sized activated carbon fibers(ACF). Alternatively, the second adsorbent consisted of a multiscale web of ACF/CNF, which was preparedby growing carbon nanofibers (CNFs) on activated ACFs via catalytic chemical vapor deposition (CVD) andsonication, which was conducted to remove catalytic particles from the CNF tips and open the pores ofthe CNFs. The two adsorbents prepared in the present study, ACF and ACF/CNF, were characterized byseveral analytical techniques, including SEM–EDX and FT-IR. Moreover, the chemical composition, BETsurface area, and pore-size distribution of the materials were determined. The hierarchal web of carbonmicrofibers and nanofibers displayed a greater adsorption capacity for Pb2+ than ACF. Interestingly, theadsorption capacity of ammonia (NH3) functionalized ACFs for phenol was somewhat larger than thatof the multiscale ACF/CNF web. Difference in the adsorption capacity of the adsorbents was attributedto differences in the size of the solutes and their reactivity towards ACF and ACF/CNF. The results indi-cated that ACF-based materials were efficient adsorbents for the removal of inorganic and organic solutesfrom wastewater.
� 2011 Elsevier Inc. All rights reserved.
1. Introduction
Industrial effluents are the primary source of toxic organic com-pounds and heavy metals. Contamination of groundwater by pollu-tants via percolation or run-off through soils and landfills is amajor concern. Thus, the development of adsorbents based on car-bon fibers for the removal of organic solutes and metal ions fromwastewater was the primary focus of the present study. Phenoland lead are common pollutants present in wastewater and wereused as examples of organic and inorganic adsorbates, respectively.
The primary sources of wastewater contaminated with phenolare the industries producing dyes, pesticides, insecticides, explo-sives, plastics, leather, paint, and pharmaceutical products [1,2].Industries responsible for the discharge of lead in wastewater in-clude battery manufacturing, printing, painting, and dying [3,4].
Activated carbons (ACs) prepared from various precursors, suchas bagasse ash, wood, agricultural wastes, and coconut shells, havebeen extensively used for the adsorptive removal of phenol andlead from wastewater [5–12]. Recently, activated carbon fibers
ll rights reserved.
Chemical Engineering, Indiania (N. Verma). Fax: +91 512
[email protected] (N. Verma).
(ACFs), carbon nanotubes (CNTs), carbon nanoparticles, and carbonmicrospheres have been used as adsorbents for the aqueous phaseremoval of phenol and metallic ions, including Pb2+ [13–18]. In ourrecent studies, a phenolic resin precursor based on ACF was pre-pared from non-activated fabrics for the removal of gaseous phasepollutants [19–22]. More recently, we developed a hierarchal webof carbon microfibers and nanofibers, which were effective in theremoval of NOx from air [23], and fluoride and arsenic (V) ions fromwater [24,25]. The multiscale carbon web was prepared by grow-ing CNF on ACF by catalytic chemical vapor deposition (CVD) usingFe or Ni as a catalyst and benzene as a carbon source. The ACF/CNFcomposite consisted of a web of carbon microfibers and carbonnanofibers with hierarchal pore sizes and fiber diameters. UnlikeCNF (or CNT) grown on metal oxides or silica, ACF does not haveto be removed from the final product, and the web can be used di-rectly in adsorptive applications.
In the present study, the surface of ACF was functionalized withNH3, a basic reagent, to enhance the adsorption of phenol, which isa Lewis acid. The results indicated that surface functionalized ACFpossessed a larger adsorption capacity for phenol than ACF/CNFcomposites. Alternatively, the hierarchal web of ACF/CNF displayeda larger adsorption capacity for Pb2+ than ACF. To further improveequilibrium loading, ACF/CNF was sonicated in an acidic mediumto remove Ni particles from the tip of the CNFs. Compared to the

A. Chakraborty et al. / Journal of Colloid and Interface Science 359 (2011) 228–239 229
results obtained under extreme sonication conditions, the textureof CNF was retained after sonication under mild conditions. As aresult, a uniform adsorption of Pb2+ was achieved on the surfaceof the material.
2. Materials and methods
2.1. Adsorbents
2.1.1. ACFThe ACF-based phenolic resin precursor was procured from Ky-
nol Inc., Tokyo (Japan) and was soaked in de-ionized (DI) water for6 h to remove impurities and to enhance the effectiveness of sub-sequent preparation steps (metal impregnation or surface func-tionalization). The spent water was analyzed, and ions, such aschlorides and nitrates, were detected in the solution. Treated ACFsamples were dried in a vacuum oven at 200 �C for 12 h.
2.1.2. Surface functionalization of ACF with NH3
Vacuum dried ACFs were treated with NH3 at elevated temper-ature. Fig. 1a shows a schematic of the set up used for the vaporphase functionalization of ACFs. The same apparatus was also usedto prepare ACF/CNF via calcination, reduction, and CVD, as de-scribed later in the text. ACF (approx. 3 g) was wrapped on an Inco-nel 625 (an alloy of nickel–chromium–molybdenum) perforated,tubular (I.D. = 2.5 cm, O.D. = 2.8 cm, L = 6 cm) reactor. One end ofthe tube was sealed, and the outer surface of the tube was perfo-rated with 0.1-mm holes at center-to-center distances of 0.4 cm.The tube was connected to a nitrogen source and mounted in a ver-tically movable furnace. The temperature of the furnace was con-trolled with a thermostat and a PID controller. Nitrogen was usedas a carrier gas and was bubbled at a constant flow rate of 100 ccper min (measured under standard conditions) through a bubblercontaining 5 M NH3. The temperature of the bubbler was set to40 �C. The vapor phase concentration of NH3 in nitrogen was equalto the saturation vapor pressure of the liquid and was approxi-mately 15% (v/v).
Fig. 1a. Experimental set up used for calcinati
The temperature of the perforated tube-furnace was increasedat the rate of 10 �C/min under a constant flow of nitrogen. The con-tact temperature for functionalization was varied between 400 �Cand 750 �C, and the contact time was set to 1 h. Contact betweenthe vapor phase and the solid phase resulted in the covalentattachment of nitrogenous functional groups on the surface ofACF, as later described in the paper while discussing the FT-IR data.After functionalization, the system was cooled to room tempera-ture by purging with nitrogen.
2.1.3. Preparation of ACF/CNFThe hierarchal web of ACF/CNF was prepared by growing CNF
on ACF by the CVD of benzene in the presence of a Ni catalyst.The details of the synthetic method are described in the literature[24]. In short, the preparation of ACF/CNF was achieved by impreg-nating ACF with nickel nitrate, followed by calcination, reductionby hydrogen, and CVD.
In the wet incipience method, a 0.4 M solution of nickel nitratesalts in acetone was used to impregnate ACF with nickel nitrate. Allthe other solutions, including those for the adsorption study, wereprepared with Milli-Q water, which was obtained from an ultra-pure water purification system (Millipore, Milford, CT). Vacuumdried ACF (approx. 3 g) was wrapped on a perforated inconeltubular reactor (I.D. = 2.5 cm, O.D. = 2.8 cm, L = 6 cm) mounted in-side an inconel shell (I.D. = 4.0 cm, L = 10 cm). The reactor wasequipped with a solution inlet and outlet, and one end of the tubewas sealed. The outer surface of the tube was perforated with0.1-mm holes at center-to-center distances of 0.4 cm. With a peri-staltic pump, the solution in the glass container was continuouslyre-circulated at a constant flow rate through the ACF-wrappedtubular reactor. Impregnation was carried out under a continuousflow for 6 h. Fig. 1b shows a schematic depiction of the experimen-tal set up.
After impregnation, the sample was dried for 6 h in air and anadditional 6 h at 50 �C inside a hot air-oven to remove moisture.Thereafter, the sample was calcined for 1 h in the oven at 300 �Cto convert Ni(NO3)2�6H2O to NiO. The reaction is as follows:
on, reduction, CVD, and functionalization.

Fig. 1b. Experimental set up used for impregnation.
230 A. Chakraborty et al. / Journal of Colloid and Interface Science 359 (2011) 228–239
NiðNO3Þ2 � 6H2OðsÞ ! NiOðsÞ þ 2NO2ðgÞ þ 3=2O2ðgÞ þ 6H2OðgÞ
In a previous study, metals impregnated ACF was prepared forthe catalytic oxidation of volatile organic compounds (VOC) [21].The method of preparation included the impregnation of ACF withthe nitrate solutions of a few metals, including Ni, followed by dry-ing and calcination. The operating conditions were the same asused in the present study. Using the X-ray diffraction (XRD) andtemperature-programmed reduction (TPR) analysis, it was demon-strated that nickel nitrate is converted to nickel oxide duringcalcinations.
After calcination, NiO was reduced to the metallic state by treat-ment at 550 �C under a flow of hydrogen at a rate of 0.16 L/min(measured under standard conditions) for 1 h. The same experi-mental set up used for surface functionalization was employedfor calcination and reduction; however, additional provisions wereapplied to deliver nitrogen and hydrogen gas.
After reduction, nitrogen was bubbled through benzene andpassed through the reactor, which was packed with metal-impreg-nated ACF (Ni-ACF). A Freon refrigeration unit (R-15) was used tocontrol the temperature of the bubbler and the concentration ofbenzene vapor in the carrier gas. Benzene saturated nitrogen waspassed through the reactor at 750 �C for one hour, which resultedin the decomposition of benzene over Ni active sites to carbonand the formation and growth of CNF. Upon completion, the sys-tem was cooled to room temperature by purging the system withnitrogen.
The hierarchal web of ACF/CNF was sonicated in dilute nitricacid to remove Ni from the tips of the CNFs, which improved theaccessibility of the fibers to the solutes. The concentration of acidand the sonication time were varied to optimize the performanceof the adsorbent. Several ACF/CNF samples were not subjected tosonication to determine the effects of the synthetic conditions.The importance of the sonication conditions and the effects of son-ication on the performance of the materials will be discussed laterin the text. All samples were prepared in triplicate, and the coeffi-cient of variation of the intrinsic properties of the materials,including the surface area and elemental composition, was lessthan 5%.
2.2. Adsorption (batch and flow) study
Stock solutions containing 200 ppm (mg/L) of phenol were pre-pared from Milli-Q water and commercially available phenol. Allstandards with lower concentrations than the stock solution wereprepared by diluting the stock solution. Similarly, a stock solutioncontaining 100 ppm of lead nitrate was prepared, and dilutions weremade as required. For the adsorption study, the concentration rangeof phenol and lead were 0–100 ppm and 0–50 ppm, respectively.
In a typical batch adsorption experiment, different amounts ofadsorbent are mixed to a fixed (pre-determined) volume of theaqueous solutions at constant initial concentration levels. Alterna-tively, fixed amounts of the adsorbent may be mixed with a fixedvolume of the aqueous solutions, however, at different initial con-centration levels. The obtained isotherm (the solid phase concen-
trations vs. the final aqueous phase equilibrium concentrations)is unique as long as the temperature is set constant. The latter pro-cedure was adopted in the present study to obtain the equilibriumdata (isotherm), i.e., a fixed amount of the adsorbent equilibratedwith a fixed volume of aqueous solutions of phenol or lead, how-ever, at different initial concentrations.
A fixed amount (�0.1 g) of the adsorbent was placed in 150 mLof aqueous solutions of phenol or lead at different pre-determinedconcentrations. Flasks containing different concentrations of thesolutions were placed in a water bath shaker at a constant temper-ature, and the solutions were periodically collected and analyzed. AVarian UV–Vis spectrophotometer (model: Cary 100) was used todetermine the concentration of phenol, and a METROHM ion chro-matograph (model: IC 861) was used to determine the quantity oflead ions in the aqueous solutions. The measurements were con-ducted until the concentration of the solution remained constant,and the equilibrium concentration was attained. The equilibrationtimes for phenol and lead were approximately 12 and 36 h, respec-tively. The pH of the phenol- and lead solutions was also measuredpre- and post adsorption. The UV–Vis spectrophotometer and ICwere calibrated prior to analysis.
The same apparatus used to impregnate ACF was used in thedynamic (breakthrough) tests, as shown in Fig. 1b. However, thevalve used to re-circulate the solution between the conical flaskand the container was sealed. The solution was continuously deliv-ered to the perforated tubular reactor at a constant flow rate, andspent solution was continuously withdrawn from the conical flask.DI water was initially pumped through the tube. At t = 0+, the inletconcentration was increased incrementally by switching to a solu-tion with a pre-determined concentration of the adsorbate. Theexit concentration increased asymptotically until it was equal tothe inlet concentration. Samples were collected at specific timeintervals, and the entire procedure was repeated at different solu-tion flow rates and inlet concentrations.
3. Surface characterization
ACF and ACF/CNF samples were characterized by several analyt-ical techniques, including BET and pore size distribution (PSD)analysis, scanning electron microscopy (SEM), energy dispersiveX-ray (EDX), CHN elemental analysis, and FTIR spectroscopy.
The adsorption/desorption isotherms and pore volumes of theadsorbents were determined by nitrogen adsorption–desorptionat 77 K with a Quantachrome Autosorb 1C system. Prior to theexperiment, the samples were degassed at 200 �C for 8 h in theoutgassing station of the instrument to remove adsorbed moistureor entrapped gases in the samples. The total surface area and porevolume of the materials were determined from the nitrogenadsorption/desorption multi-point isotherms. The well-know BETequation linearized as: 1/[W(P0/P) � 1] vs. P/P0 was applied in theregion of the P/P0 range between 0.05 and 0.35 in calculating spe-cific surface area. The BET plot is usually linear in this range. More-over, most of the micropores are filled in this range. The total porevolume was measured from the amount of N2 adsorbed at the rel-ative pressure close to unity (0.9994). The surface morphology ofthe samples was examined with a Supra 40 VP Field EmissionSEM from Zeiss. All SEM images were captured with an inlensdetector operating at an accelerating voltage of 10 kV, a filamentcurrent of 2.37 A, and a working distance of 2–4 mm. SEM imagesand EDX mappings of the samples were taken at various locationsthroughout the samples. Variations in the chemical composition(predominantly carbon) were investigated by elemental (CHNO)analysis (Exeter Analytical Inc., model: CE 440). In addition, a Bru-ker Tensor 27 type Fourier transform infrared spectrometer wasused to determine the identity of surface functional groups. A
A. Chakraborty et al. / Journal of Colloid and Interface Science 359 (2011) 228–239 231
DLa TGS detector with a KBr window was employed, and the reso-lution was set to 4 cm�1. The Raman analysis was carried out toestimate the degree of graphitization in the prepared adsorbent.For the analysis, the laser Raman spectra of samples were takenby the confocal Raman instrument (Model: Alpha, Make: Witec,Germany). The data were collected using the Ar-ion laser of wave-length 514 nm as the excitation source and CCD as detector in therange of 800–2000 cm�1 at room temperature in air.
4. Results and discussion
4.1. BET area analysis
The BET area, total pore volume, and PSD of the materials at dif-ferent stages of the preparation process were calculated from theisotherms and are summarized in Table 1.
As shown in Table 1, the BET area and pore volume decreasedafter impregnation. The external surface of ACF was measured tobe �30 m2/g. Considering that the external surface area of ACFwas negligible in comparison to the BET area (�1300 m2/g), thereduction is attributed to the incorporation of nickel nitrate withinthe pores of ACF. In the present study, the PSD analysis was carried
Table 1Surface area and PSD data.
Sample BET (m2/g) Total pore volume (cc/g) Microp
ACF 1375 0.709 0.620NiNO3 impregnated ACF 1041 0.528 0.468Ni-ACF 1260 0.718 0.466ACF/CNF 970 0.537 0.356
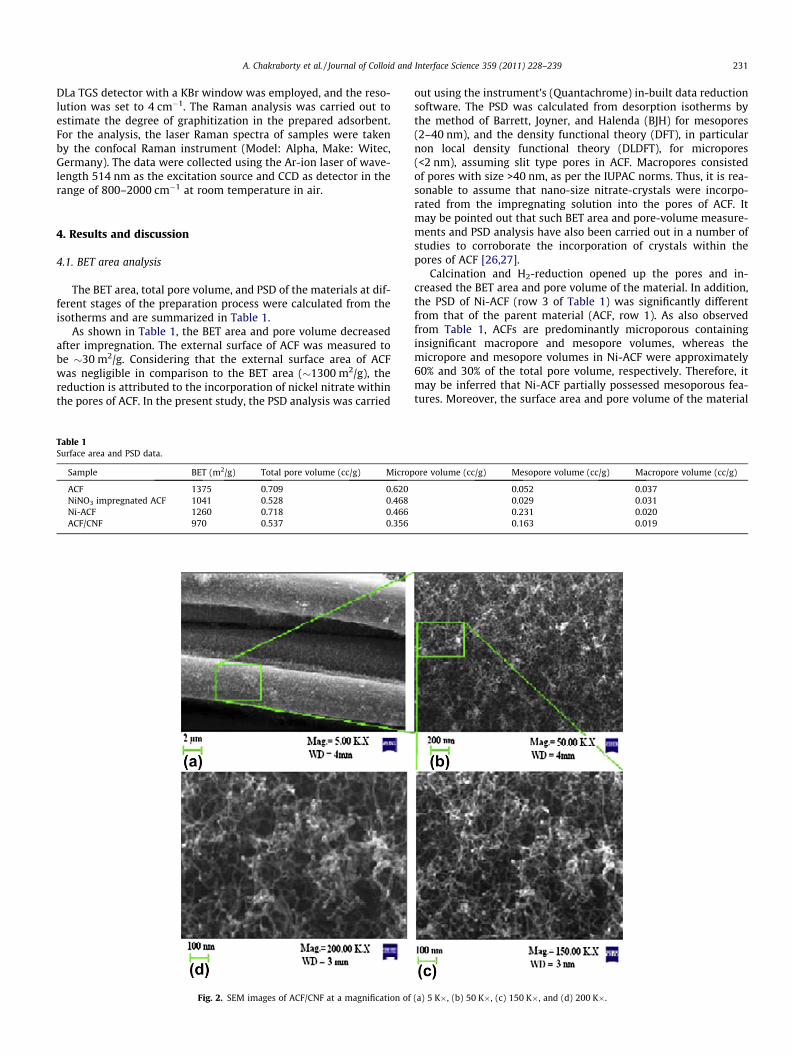
Fig. 2. SEM images of ACF/CNF at a magnification of
out using the instrument’s (Quantachrome) in-built data reductionsoftware. The PSD was calculated from desorption isotherms bythe method of Barrett, Joyner, and Halenda (BJH) for mesopores(2–40 nm), and the density functional theory (DFT), in particularnon local density functional theory (DLDFT), for micropores(<2 nm), assuming slit type pores in ACF. Macropores consistedof pores with size >40 nm, as per the IUPAC norms. Thus, it is rea-sonable to assume that nano-size nitrate-crystals were incorpo-rated from the impregnating solution into the pores of ACF. Itmay be pointed out that such BET area and pore-volume measure-ments and PSD analysis have also been carried out in a number ofstudies to corroborate the incorporation of crystals within thepores of ACF [26,27].
Calcination and H2-reduction opened up the pores and in-creased the BET area and pore volume of the material. In addition,the PSD of Ni-ACF (row 3 of Table 1) was significantly differentfrom that of the parent material (ACF, row 1). As also observedfrom Table 1, ACFs are predominantly microporous containinginsignificant macropore and mesopore volumes, whereas themicropore and mesopore volumes in Ni-ACF were approximately60% and 30% of the total pore volume, respectively. Therefore, itmay be inferred that Ni-ACF partially possessed mesoporous fea-tures. Moreover, the surface area and pore volume of the material
ore volume (cc/g) Mesopore volume (cc/g) Macropore volume (cc/g)
0.052 0.0370.029 0.0310.231 0.0200.163 0.019
(a) 5 K�, (b) 50 K�, (c) 150 K�, and (d) 200 K�.
232 A. Chakraborty et al. / Journal of Colloid and Interface Science 359 (2011) 228–239
decreased after the growth of CNFs on Ni-ACF. A reduction in theBET area of nanoporous materials has been reported in previousstudies [27].
4.2. ACF/CNF morphology and surface elemental analysis
The morphology of ACF and ACF/CNF before and after sonicationwas examined by SEM, and surface elemental analyses were con-ducted by EDX. SEM images and EDX maps were taken from vari-ous locations within the samples. Fig. 2a–d shows representativeSEM images of CNFs grown on ACFs at different magnifications.The regions in Fig. 2a and b are marked, which were magnified intoFig. 2b and c, respectively. As shown in Fig. 2b, the distribution ofCNF on ACF was uniform and dense. Moreover, shiny nickel parti-cles on the tip of the nanofibers, as observed in Fig. 2c, were indic-ative of the growth of CNF by the tip-growth mechanism, by whichthe nickel particles remain attached to the tips of the fibers duringthe growth [28].
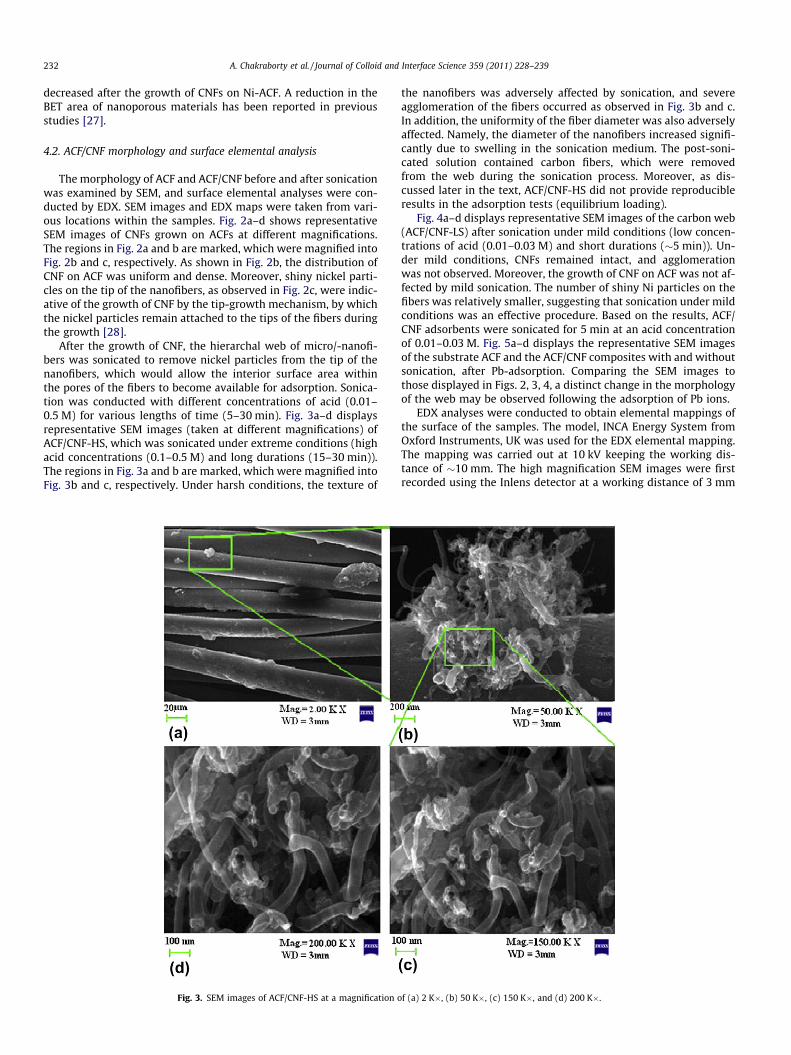
After the growth of CNF, the hierarchal web of micro/-nanofi-bers was sonicated to remove nickel particles from the tip of thenanofibers, which would allow the interior surface area withinthe pores of the fibers to become available for adsorption. Sonica-tion was conducted with different concentrations of acid (0.01–0.5 M) for various lengths of time (5–30 min). Fig. 3a–d displaysrepresentative SEM images (taken at different magnifications) ofACF/CNF-HS, which was sonicated under extreme conditions (highacid concentrations (0.1–0.5 M) and long durations (15–30 min)).The regions in Fig. 3a and b are marked, which were magnified intoFig. 3b and c, respectively. Under harsh conditions, the texture of
Fig. 3. SEM images of ACF/CNF-HS at a magnification o
the nanofibers was adversely affected by sonication, and severeagglomeration of the fibers occurred as observed in Fig. 3b and c.In addition, the uniformity of the fiber diameter was also adverselyaffected. Namely, the diameter of the nanofibers increased signifi-cantly due to swelling in the sonication medium. The post-soni-cated solution contained carbon fibers, which were removedfrom the web during the sonication process. Moreover, as dis-cussed later in the text, ACF/CNF-HS did not provide reproducibleresults in the adsorption tests (equilibrium loading).
Fig. 4a–d displays representative SEM images of the carbon web(ACF/CNF-LS) after sonication under mild conditions (low concen-trations of acid (0.01–0.03 M) and short durations (�5 min)). Un-der mild conditions, CNFs remained intact, and agglomerationwas not observed. Moreover, the growth of CNF on ACF was not af-fected by mild sonication. The number of shiny Ni particles on thefibers was relatively smaller, suggesting that sonication under mildconditions was an effective procedure. Based on the results, ACF/CNF adsorbents were sonicated for 5 min at an acid concentrationof 0.01–0.03 M. Fig. 5a–d displays the representative SEM imagesof the substrate ACF and the ACF/CNF composites with and withoutsonication, after Pb-adsorption. Comparing the SEM images tothose displayed in Figs. 2, 3, 4, a distinct change in the morphologyof the web may be observed following the adsorption of Pb ions.
EDX analyses were conducted to obtain elemental mappings ofthe surface of the samples. The model, INCA Energy System fromOxford Instruments, UK was used for the EDX elemental mapping.The mapping was carried out at 10 kV keeping the working dis-tance of �10 mm. The high magnification SEM images were firstrecorded using the Inlens detector at a working distance of 3 mm
f (a) 2 K�, (b) 50 K�, (c) 150 K�, and (d) 200 K�.
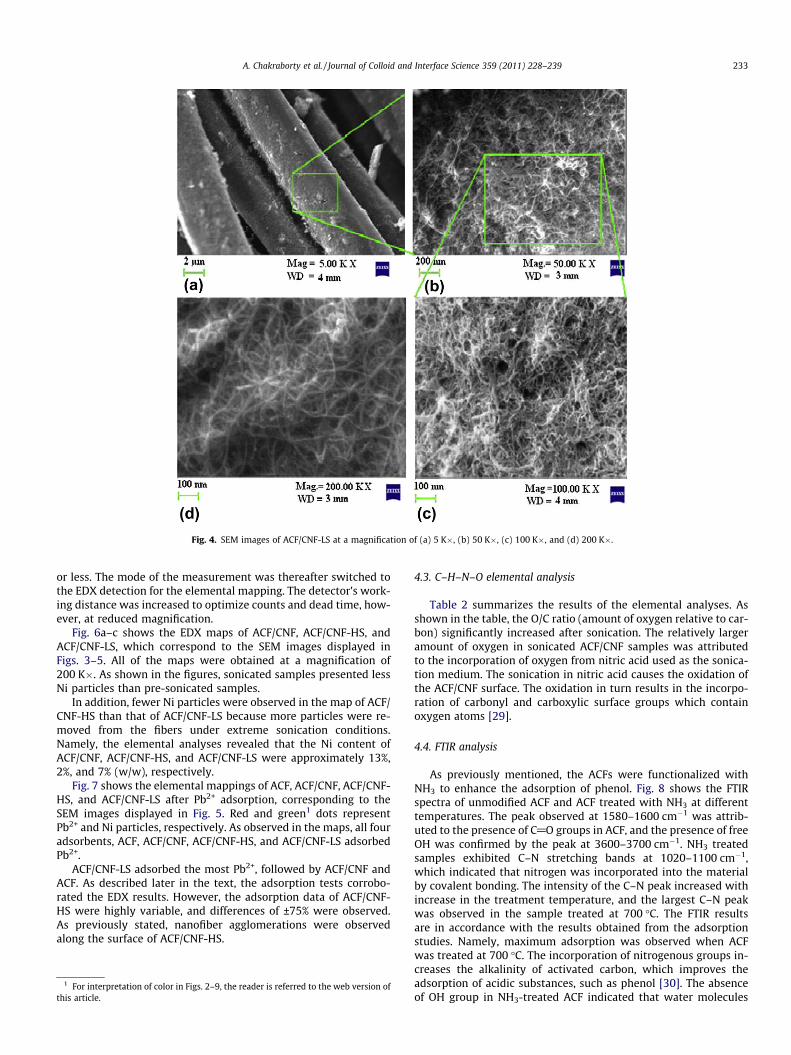
Fig. 4. SEM images of ACF/CNF-LS at a magnification of (a) 5 K�, (b) 50 K�, (c) 100 K�, and (d) 200 K�.
A. Chakraborty et al. / Journal of Colloid and Interface Science 359 (2011) 228–239 233
or less. The mode of the measurement was thereafter switched tothe EDX detection for the elemental mapping. The detector’s work-ing distance was increased to optimize counts and dead time, how-ever, at reduced magnification.
Fig. 6a–c shows the EDX maps of ACF/CNF, ACF/CNF-HS, andACF/CNF-LS, which correspond to the SEM images displayed inFigs. 3–5. All of the maps were obtained at a magnification of200 K�. As shown in the figures, sonicated samples presented lessNi particles than pre-sonicated samples.
In addition, fewer Ni particles were observed in the map of ACF/CNF-HS than that of ACF/CNF-LS because more particles were re-moved from the fibers under extreme sonication conditions.Namely, the elemental analyses revealed that the Ni content ofACF/CNF, ACF/CNF-HS, and ACF/CNF-LS were approximately 13%,2%, and 7% (w/w), respectively.
Fig. 7 shows the elemental mappings of ACF, ACF/CNF, ACF/CNF-HS, and ACF/CNF-LS after Pb2+ adsorption, corresponding to theSEM images displayed in Fig. 5. Red and green1 dots representPb2+ and Ni particles, respectively. As observed in the maps, all fouradsorbents, ACF, ACF/CNF, ACF/CNF-HS, and ACF/CNF-LS adsorbedPb2+.
ACF/CNF-LS adsorbed the most Pb2+, followed by ACF/CNF andACF. As described later in the text, the adsorption tests corrobo-rated the EDX results. However, the adsorption data of ACF/CNF-HS were highly variable, and differences of ±75% were observed.As previously stated, nanofiber agglomerations were observedalong the surface of ACF/CNF-HS.
1 For interpretation of color in Figs. 2–9, the reader is referred to the web version ofthis article.
4.3. C–H–N–O elemental analysis
Table 2 summarizes the results of the elemental analyses. Asshown in the table, the O/C ratio (amount of oxygen relative to car-bon) significantly increased after sonication. The relatively largeramount of oxygen in sonicated ACF/CNF samples was attributedto the incorporation of oxygen from nitric acid used as the sonica-tion medium. The sonication in nitric acid causes the oxidation ofthe ACF/CNF surface. The oxidation in turn results in the incorpo-ration of carbonyl and carboxylic surface groups which containoxygen atoms [29].
4.4. FTIR analysis
As previously mentioned, the ACFs were functionalized withNH3 to enhance the adsorption of phenol. Fig. 8 shows the FTIRspectra of unmodified ACF and ACF treated with NH3 at differenttemperatures. The peak observed at 1580–1600 cm�1 was attrib-uted to the presence of C@O groups in ACF, and the presence of freeOH was confirmed by the peak at 3600–3700 cm�1. NH3 treatedsamples exhibited C–N stretching bands at 1020–1100 cm�1,which indicated that nitrogen was incorporated into the materialby covalent bonding. The intensity of the C–N peak increased withincrease in the treatment temperature, and the largest C–N peakwas observed in the sample treated at 700 �C. The FTIR resultsare in accordance with the results obtained from the adsorptionstudies. Namely, maximum adsorption was observed when ACFwas treated at 700 �C. The incorporation of nitrogenous groups in-creases the alkalinity of activated carbon, which improves theadsorption of acidic substances, such as phenol [30]. The absenceof OH group in NH3-treated ACF indicated that water molecules

Fig. 5. SEM images of (a) ACF, (b) CNF, (c) CNF-HS, and (d) CNF-LS after lead adsorption.
Fig. 6. Elemental mapping of (a) ACF/CNF, (b) ACF/CNF-HS, and (c) ACF/CNF-LS,corresponding to the SEM images displayed in Figs. 2b, 3b, and 4b, respectively.
234 A. Chakraborty et al. / Journal of Colloid and Interface Science 359 (2011) 228–239
were expelled from ACF at elevated temperatures and that nitrog-enous species were incorporated into the material.
4.5. Raman analysis
Fig. 9 describes the Raman spectrum of CNF grown on ACF. Ta-ble 3 lists the corresponding data for the Raman intensities ob-tained from the spectrum. As observed from the spectrum, thefirst peak at 1342.8 cm�1 corresponds to D-Band and is attributedto the disordered phase of carbon, whereas the second peak at1587.3 cm�1 corresponds to G-band and is attributed to the or-dered (graphitic) phase of the material. The ratio Id/Ig reflects theextent of disorder in the carbon-material. The smaller is the ratio,the more highly ordered is the graphitic structure. For the presentmaterial, the ratio is calculated as 2.71, indicating the presence ofdisordered graphite components in ACF/CNF. Furthermore, ACF hasa turbostratic carbon structure and the crystalline size of CNF islarger than that of ACF [25].
4.6. Adsorption isotherms
The concentration of the solute in the solid phase or the soluteloading, q was determined theoretically by calculating the speciesbalance: q = V � (C0 � C)/w, where C0 and C are the concentrationof aqueous phase solutes before and after equilibrium was at-tained, respectively, V is the volume of solution in contact withthe adsorbents, and w is the weight of the adsorbent. The equilib-rium data for both lead ions and phenol were fitted by the Freund-lich isotherm equation q = K � C1/n, where C (mg/L) and q (mg/g)
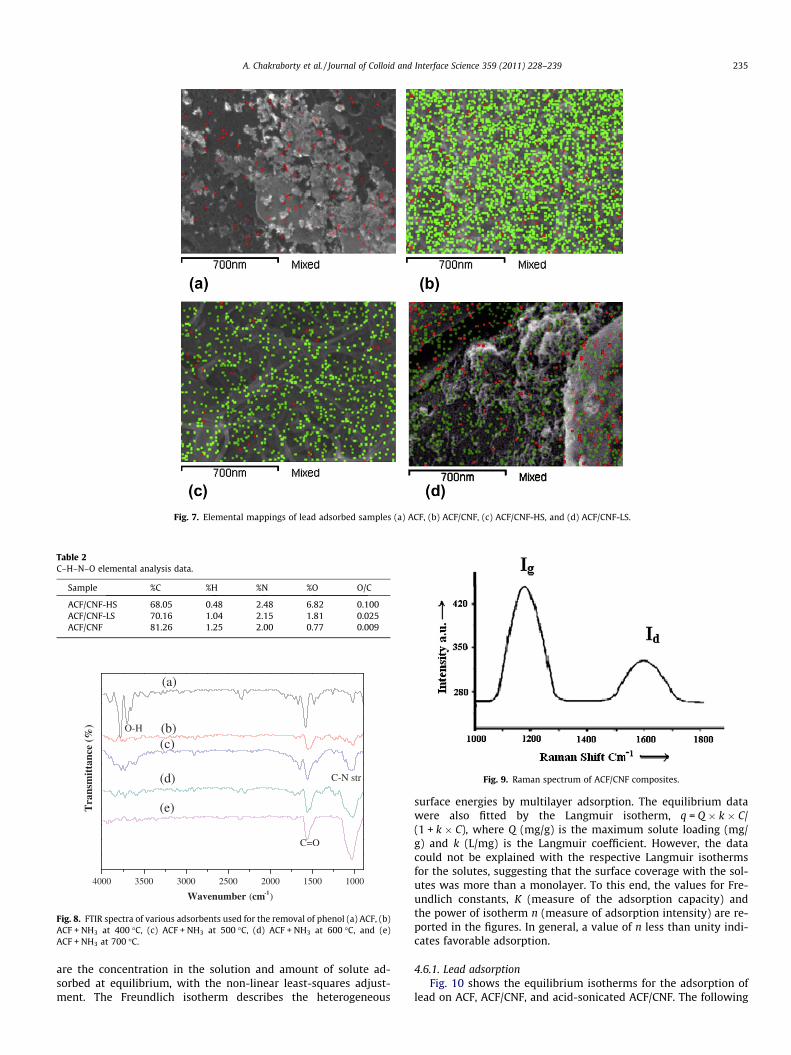
Fig. 7. Elemental mappings of lead adsorbed samples (a) ACF, (b) ACF/CNF, (c) ACF/CNF-HS, and (d) ACF/CNF-LS.
Table 2C–H–N–O elemental analysis data.
Sample %C %H %N %O O/C
ACF/CNF-HS 68.05 0.48 2.48 6.82 0.100ACF/CNF-LS 70.16 1.04 2.15 1.81 0.025ACF/CNF 81.26 1.25 2.00 0.77 0.009
4000 3500 3000 2500 2000 1500 1000
Tra
nsm
itta
nce
(%)
Wavenumber (cm-1)
(a)
(b)(c)
(d)
(e)
C-N str
C=O
O-H
Fig. 8. FTIR spectra of various adsorbents used for the removal of phenol (a) ACF, (b)ACF + NH3 at 400 �C, (c) ACF + NH3 at 500 �C, (d) ACF + NH3 at 600 �C, and (e)ACF + NH3 at 700 �C.
Fig. 9. Raman spectrum of ACF/CNF composites.
A. Chakraborty et al. / Journal of Colloid and Interface Science 359 (2011) 228–239 235
are the concentration in the solution and amount of solute ad-sorbed at equilibrium, with the non-linear least-squares adjust-ment. The Freundlich isotherm describes the heterogeneous
surface energies by multilayer adsorption. The equilibrium datawere also fitted by the Langmuir isotherm, q = Q � k � C/(1 + k � C), where Q (mg/g) is the maximum solute loading (mg/g) and k (L/mg) is the Langmuir coefficient. However, the datacould not be explained with the respective Langmuir isothermsfor the solutes, suggesting that the surface coverage with the sol-utes was more than a monolayer. To this end, the values for Fre-undlich constants, K (measure of the adsorption capacity) andthe power of isotherm n (measure of adsorption intensity) are re-ported in the figures. In general, a value of n less than unity indi-cates favorable adsorption.
4.6.1. Lead adsorptionFig. 10 shows the equilibrium isotherms for the adsorption of
lead on ACF, ACF/CNF, and acid-sonicated ACF/CNF. The following

Table 3The Raman data corresponding to the Raman spectrum of CNF/ACF composites shownin Fig. 9.
Peak Area Center Width Height Structure
1 Id = 10468.9 1342.8 50.6 165.0 Disordered2 Ig = 3859.0 1587.3 58.7 52.3 Graphite
236 A. Chakraborty et al. / Journal of Colloid and Interface Science 359 (2011) 228–239
trend was observed in the adsorption capacity of the adsorbents:sonicated ACF/CNF > ACF/CNF > ACF. Specifically, the maximumadsorption capacity for the hierarchal carbon web was approxi-mately four times greater than that of ACF. Moreover, upon sonica-tion, the adsorption capacity of ACF increased by approximately30% because the acid-sonication resulted in the removal of Ni fromthe hierarchal web, and oxidation by HNO3 increased the cation-exchange capacity of carbon [15]. An increase in the oxygen con-tent was confirmed by C–H–N–O analysis, as previously reportedin Table 2.
Fig. 10. Lead adsorption isotherms at 38 �C (solid lines show Freundlich isotherm, q = KACF, respectively).
Fig. 11. Phenol adsorption isotherms at 38 �C (solid lines show Freundlich isotherm, q = KACF and ACF/CNF, respectively).
4.6.2. Adsorption of phenolFig. 11 represents the equilibrium isotherm for the adsorption
of phenol on ACF, ACF/CNF, and the NH3-treated ACF. Contrary tothe results obtained with Pb2+, the adsorption capacity of ACFwas larger than that of the hierarchal web of ACF/CNF. Namely,the maximum adsorption capacity of ACF for phenol was200 mg/g. In comparison, ACF/CNF possessed an adsorption capac-ity of 150 mg/g. Functionalization of ACF with NH3 increased theadsorption capacity to 275 mg/g, as shown in the figure. The intro-duction of nitrogenous functional groups to the surface of theadsorbent increased the basicity of the material, which enhancedthe adsorption of phenol. An increase in the basicity of a substancedue to the incorporation of nitrogenous surface groups has beenobserved in a previous study [30]. The results of the adsorptiontests also revealed that maximum phenol adsorption was observedon ACF treated with NH3 at 700 �C, which is in accordance with theFTIR results. Namely, the IR spectra of NH3-treated ACF indicatedthat basic functional groups were incorporated into the adsorbent.
� Cn, where K = 11, 7, 4, and n = 0.30, 0.33, and 0.15, for ACF/CNF-LS, ACF/CNF, and
� Cn, where K = 143, 130, 17, and n = 0.16, 0.11 and 0.53, for ammonia treated ACF,
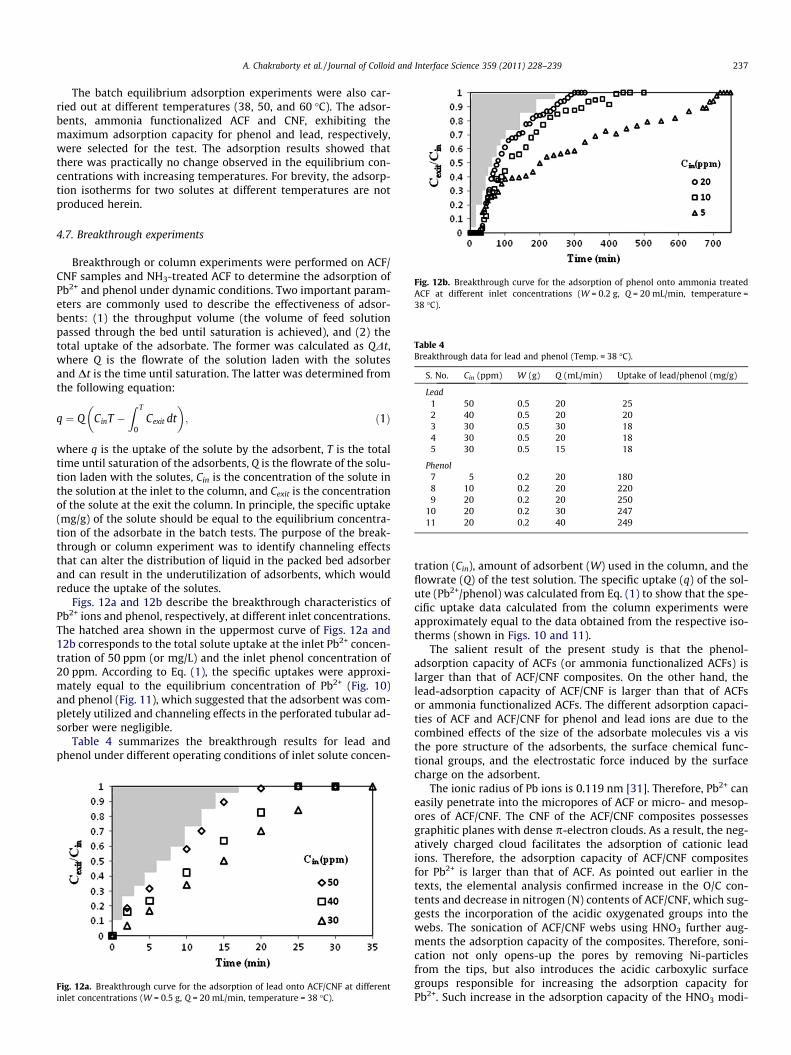
Fig. 12b. Breakthrough curve for the adsorption of phenol onto ammonia treatedACF at different inlet concentrations (W = 0.2 g, Q = 20 mL/min, temperature =38 �C).
Table 4Breakthrough data for lead and phenol (Temp. = 38 �C).
S. No. Cin (ppm) W (g) Q (mL/min) Uptake of lead/phenol (mg/g)
Lead1 50 0.5 20 252 40 0.5 20 203 30 0.5 30 184 30 0.5 20 185 30 0.5 15 18
Phenol7 5 0.2 20 1808 10 0.2 20 2209 20 0.2 20 250
10 20 0.2 30 24711 20 0.2 40 249
A. Chakraborty et al. / Journal of Colloid and Interface Science 359 (2011) 228–239 237
The batch equilibrium adsorption experiments were also car-ried out at different temperatures (38, 50, and 60 �C). The adsor-bents, ammonia functionalized ACF and CNF, exhibiting themaximum adsorption capacity for phenol and lead, respectively,were selected for the test. The adsorption results showed thatthere was practically no change observed in the equilibrium con-centrations with increasing temperatures. For brevity, the adsorp-tion isotherms for two solutes at different temperatures are notproduced herein.
4.7. Breakthrough experiments
Breakthrough or column experiments were performed on ACF/CNF samples and NH3-treated ACF to determine the adsorption ofPb2+ and phenol under dynamic conditions. Two important param-eters are commonly used to describe the effectiveness of adsor-bents: (1) the throughput volume (the volume of feed solutionpassed through the bed until saturation is achieved), and (2) thetotal uptake of the adsorbate. The former was calculated as QDt,where Q is the flowrate of the solution laden with the solutesand Dt is the time until saturation. The latter was determined fromthe following equation:
q ¼ Q CinT �Z T
0Cexit dt
� �; ð1Þ
where q is the uptake of the solute by the adsorbent, T is the totaltime until saturation of the adsorbents, Q is the flowrate of the solu-tion laden with the solutes, Cin is the concentration of the solute inthe solution at the inlet to the column, and Cexit is the concentrationof the solute at the exit the column. In principle, the specific uptake(mg/g) of the solute should be equal to the equilibrium concentra-tion of the adsorbate in the batch tests. The purpose of the break-through or column experiment was to identify channeling effectsthat can alter the distribution of liquid in the packed bed adsorberand can result in the underutilization of adsorbents, which wouldreduce the uptake of the solutes.
Figs. 12a and 12b describe the breakthrough characteristics ofPb2+ ions and phenol, respectively, at different inlet concentrations.The hatched area shown in the uppermost curve of Figs. 12a and12b corresponds to the total solute uptake at the inlet Pb2+ concen-tration of 50 ppm (or mg/L) and the inlet phenol concentration of20 ppm. According to Eq. (1), the specific uptakes were approxi-mately equal to the equilibrium concentration of Pb2+ (Fig. 10)and phenol (Fig. 11), which suggested that the adsorbent was com-pletely utilized and channeling effects in the perforated tubular ad-sorber were negligible.
Table 4 summarizes the breakthrough results for lead andphenol under different operating conditions of inlet solute concen-
Fig. 12a. Breakthrough curve for the adsorption of lead onto ACF/CNF at differentinlet concentrations (W = 0.5 g, Q = 20 mL/min, temperature = 38 �C).
tration (Cin), amount of adsorbent (W) used in the column, and theflowrate (Q) of the test solution. The specific uptake (q) of the sol-ute (Pb2+/phenol) was calculated from Eq. (1) to show that the spe-cific uptake data calculated from the column experiments wereapproximately equal to the data obtained from the respective iso-therms (shown in Figs. 10 and 11).
The salient result of the present study is that the phenol-adsorption capacity of ACFs (or ammonia functionalized ACFs) islarger than that of ACF/CNF composites. On the other hand, thelead-adsorption capacity of ACF/CNF is larger than that of ACFsor ammonia functionalized ACFs. The different adsorption capaci-ties of ACF and ACF/CNF for phenol and lead ions are due to thecombined effects of the size of the adsorbate molecules vis a visthe pore structure of the adsorbents, the surface chemical func-tional groups, and the electrostatic force induced by the surfacecharge on the adsorbent.
The ionic radius of Pb ions is 0.119 nm [31]. Therefore, Pb2+ caneasily penetrate into the micropores of ACF or micro- and mesop-ores of ACF/CNF. The CNF of the ACF/CNF composites possessesgraphitic planes with dense p-electron clouds. As a result, the neg-atively charged cloud facilitates the adsorption of cationic leadions. Therefore, the adsorption capacity of ACF/CNF compositesfor Pb2+ is larger than that of ACF. As pointed out earlier in thetexts, the elemental analysis confirmed increase in the O/C con-tents and decrease in nitrogen (N) contents of ACF/CNF, which sug-gests the incorporation of the acidic oxygenated groups into thewebs. The sonication of ACF/CNF webs using HNO3 further aug-ments the adsorption capacity of the composites. Therefore, soni-cation not only opens-up the pores by removing Ni-particlesfrom the tips, but also introduces the acidic carboxylic surfacegroups responsible for increasing the adsorption capacity forPb2+. Such increase in the adsorption capacity of the HNO3 modi-

Table 5A comparison of the adsorption capacity of ACF and ACF/CNF with the literature data.
Reference Adsorbent Equilibrium concentration (ppm) Loading (mg/g)
LeadPresent study Sonicated ACF/CNF 0–50 0–40[4] Commercial carbon 50 36[7] Granular palm shell activated carbon 50 10[15] CNT 5 1.5[36] Gel type weak acid resin (110-H) 40 510[37] Polymer-supported nanosized hydrous
manganese dioxide100 400
PhenolPresent study NH3 treated ACF 0–30 0–290[9] Mesoporous carbon CMK-3 30 90[10] Carbon cryogel microshperes 30 140[11] Activated carbon fiber 30 50[12] Date-pit activated carbon (DP-AC) 30 45[16] Activated carbons prepared from wood particleboard wastes 0.2 250[18] Coal-reject-derived adsorbents 50 50[38] INDION polymeric resins 720 160
238 A. Chakraborty et al. / Journal of Colloid and Interface Science 359 (2011) 228–239
fied carbonaceous materials CNF and CNT for Pb2+ and Cd2+ ionshave also been confirmed in other investigations [15,29].
With regard to the adsorption of phenol by ACF and ACF/CNF,the phenol molecules can hydrogen bond to form long chains.The typical dimensions of such long chains of hydrogen bondedphenol are reported as 0.67 nm � 0.15 nm � 0.80 nm [16]. Due tothe long chain, the adsorption of phenol molecules into the nanop-ores of CNF by ‘‘sliding’’ between the graphite platelets is inhibited[32]. The rapid uptake of phenol from water by porous carbona-ceous materials, including ACF, having relative larger microporevolume or wider pore size is also observed in other studies [9,18].
The interaction of phenol containing p-electron clouds with thegraphitic planes of CNF is likely to be electrostatic (repulsive) dri-ven, as the latter also contains dense p-electron clouds. Theadsorption of phenol on CNF may occur by physisorption due tothe van der Waals forces. Such forces are also responsible for theadsorption of phenol on the parent material ACF. However, in thecase of CNF, the combined effect of electrostatic interaction andsize of the adsorbate-molecule restricts the adsorption of phenolon CNF, which is lesser than that on ACF.
Re-visiting the discussion of the adsorption of phenol, it wasmentioned that the introduction of nitrogenous functional groupsinto the surface of ACF by functionalization with ammonia resultedin the enhanced adsorption of phenol by ACF. The increase in theadsorption of phenol because of the presence of basic groups suchas cyclic amides and N–H in mesoporous carbon has also been ob-served elsewhere [33].
The solution-pH may also affect adsorption via the surfacecharge induced on the adsorbents. Depending on the pH of thesolution, the surface charge can be positive or negative, therebypossibly affecting the adsorption of a solute by the electrostaticinteractions. In the present study, the pH of water was measuredbetween 6.6 and 6.8. The pH-variation of the solution during theadsorption tests was found to be negligible (<±0.5). It has been re-ported in several studies that the surface charge of carbonaceousmaterials, including carbon nanotubes (CNTs), activated carbons(ACs) and activated carbon fibers (ACFs) is negative at pH > 6[17,34,35]. It may, therefore, be inferred that the adsorption onCNF of the positively charged Pb2+ ions and the phenol with itspi-electron clouds was possibly facilitated and hindered, respec-tively, due to the pH effects. The effects are consistent with theadsorption data of Pb2+ and phenol on ACF/CNF composite, as dis-cussed in the preceding paragraphs.
It is also important to mention that the pH of the test waterused in the present study was measured between 6.6 and 6.8. Inmost cases, pH of ground or potable water is in the vicinity of 7
(usually between 6 and 7.5). Considering that the pH-variation ofthe solution during the adsorption tests for either phenol or leadions was found to be negligible (<±0.5), the results suggest thatthe post treatment of water for pH may not be required usingthe adsorbents prepared in this study.
The removal of Pb2+ and phenol by the proposed adsorbentswas compared to that of the other adsorbents reported in the liter-ature, and the results are presented in Table 5. As shown in the ta-ble, the loading of lead ions is significantly larger on the sonicatedACF/CNF developed in this study than on CNT [15]. The loadingmay be considered to be larger or comparable to that on the acti-vated carbon granules [4,7]. However, the adsorption by the non-carbonaceous adsorbents such as polymeric resins and metal oxideare observed to be significantly larger than that by the carbonbased adsorbents [36,37]. With regard to the adsorption of phenol,the adsorption capacity of NH3 treated ACF is significantly largerthan the other carbonaceous as well as non-carbonaceous adsor-bents, including those derived from low-cost materials reportedin literature [9,10–12,16,18,38].
In general, variation in the solute loading on different adsor-bents is due to different types of material, surface functionalgroups, textural property, and operating conditions, including pH.It is also important to note that the equilibrium solute loadingdetermined under flow conditions truly reflect the performanceof the adsorbents, because mass transfer and hydrodynamic resis-tances are prevalent in such conditions. Considering that theseresistances are usually significant in the granular materials, andthe mal-distribution of flow due to channeling is common inpacked beds of granular or powdered materials, the ACF basedadsorbents are potentially practical candidates as packed bed fab-ric filters for removing contaminant solutes from wastewater.
5. Conclusions
The hierarchal web of carbon micro/nano fibers developed inthe present study was an efficient adsorbent for the removal ofPb2+. Alternatively, micron-sized ACF exhibited a superior adsorp-tion capacity for phenol. Differences in the performance and selec-tivity of the adsorbents were attributed to the structure of theadsorbents and the size of the adsorbates. The surface functionali-zation of ACF by NH3 enhanced the adsorption of phenol due to theincorporation of nitrogenous groups onto the surface of the adsor-bent. Alternatively, the sonication of ACF/CNF under mild condi-tions enhanced the adsorption of Pb2+ while retaining the textureof the nanofibers. Starting from the same material (micron-sized

A. Chakraborty et al. / Journal of Colloid and Interface Science 359 (2011) 228–239 239
carbon fibers), different adsorbents were developed for the re-moval of different types of contaminants (i.e., inorganic heavy me-tal ions and organic phenolic compounds). Thus, ACF can be used ina wide range of applications.
Acknowledgments
The authors would like to thank the Department of Science andTechnology (DST), New Delhi, for research grants and the supportof the Center on Nanosciences at IIT Kanpur.
References
[1] G.J. Hathaway, N.H. Proctor, J.P. Hughes, M.L. Fischman, Proctor and Hughes’Chemical Hazards of the Workplace, third ed., Van Nostrand Reinhold, NewYork, NY, 1991.
[2] H. Herbert, P. Fang, O. Chan, Water Res. 31 (1997) 2229.[3] A. Groffman, S. Peterson, D. Brookins, Water Environ. Technol. 5 (1992) 54.[4] S. Halim, A. Shehata, M. Shahat, Water Res. 37 (7) (2002) 1678.[5] I.I. Salame, T.J. Bandosz, J. Colloid Interface Sci. 264 (2003) 307.[6] S. Mukherjee, S. Kumar, A. Misra, M. Fan, Chem. Eng. J. 129 (2007) 133.[7] G. Issabayeva, M. Aroua, N. Sulaiman, Bioresour. Technol. 97 (2006) 2350.[8] M. Streat, J. Patrick, M. Perez, Water Res. 29 (2) (1995) 467.[9] E. Haquen, V. Talapaneni, J. Jegal, Korean Chem. Soc. 31 (6) (2010) 232.
[10] M.H. El-Naas, S. Al-Zuhair, M. Abu Alhaija, Chem. Eng. J. 162 (2010) 997.[11] P. Girodsa, A. Dufoura, V. Fierrob, Y. Rogaumea, C. Rogaumea, A. Zoulaliana, A.
Celzardc, J. Hazard. Mater. 166 (2009) 491.[12] F. Haghseresht, G.Q. Lu, Energy Fuels 12 (6) (1998).[13] R.-S. Juang, F.-H. Wu, R.-L. Tseng, J. Chem. Eng. Data 41 (1996) 487.[14] C. López, G. Camargo, L. Giraldo, J. Piraján, Ecl. Quím. 32 (3) (2007) 61.[15] Y.-H. Li, S. Wang, J. Wei, X. Zhang, C. Xu, Z. Luan, D. Wu, B. Wei, Chem. Phys.
Lett. 357 (2002) 263.
[16] S. Kim, T. Yamamoto, A. Endo, A. Ohmori, M. Nakaiwa, Micropor. Mesopor.Mater. 96 (2006) 191.
[17] P. Diaz-Flores, F. Lopez, M. Terrones, J. Rangel-Mendez, J. Colloid Interface Sci.334 (2009) 124.
[18] B. Li, Z. Lei, X. Zhang, Z. Huang, Catal. Today 158 (2010) 515.[19] S. Adapa, V. Gaur, N. Verma, Chem. Eng. J. 116 (1) (2006) 25.[20] V. Gaur, R. Asthana, N. Verma, Carbon 44 (2006) 46.[21] V. Gaur, A. Sharma, N. Verma, Carbon 43 (2005) 3041.[22] D. Das, V. Gaur, N. Verma, Carbon 42 (14) (2004) 2949.[23] R. Singhal, A. Sharma, N. Verma, Ind. Eng. Chem. Res. 47 (10) (2008) 3700.[24] A. Gupta, D. Deva, A. Sharma, N. Verma, Ind. Eng. Chem. Res. 48 (21) (2009)
9697.[25] A. Gupta, D. Deva, A. Sharma, N. Verma, Ind. Eng. Chem. Res. 49 (15) (2010)
7074.[26] S. Lim, S. Yoon, Y. Shimizu, H. Jung, I. Mochida, Langmuir 20 (13) (2004) 5559.[27] D. Lozano, O. Castell, D. Cazorla, S. Linares, Carbon 42 (2004) 1233.[28] H.S. Nalwa, Encyclopaedia Nanosci. Nanotechnol. 10 (2003) 11.[29] J. Zhang, H. Zou, Q. Qing, Y. Yang, Q. Li, Z. Liu, X. Guo, Z. Du, J. Phys. Chem. 170
(2003) 3712.[30] J. Przepiorski, J. Hazard. Mater. B 135 (2006) 453.[31] R. Shannon, Acta Crystallogr. A32 (1976) 751.[32] C. Park, E.S. Engel, A. Crowe, T.R. Gilbert, N.M. Rodriguez, Langmuir 16 (2000)
8050.[33] E. Haque, J.W. Jun, S.N. Talapaneni, A. Vinu, S.H. Jhung, J. Mater. Chem. 20
(2010) 1080.[34] R. Leyva-Ramos, M.S. Berber-Mendoza, J. Salazar-Rabago, R.M. Guerrero-
Coronado, J. Mendoza-Barron, Adsorption (2010), doi:10.1007/s10450-010-9313-3.
[35] N.V. Perez-Aguilar, E. Munoz-Sandoval, P.E. Diaz-Flores, J.R. Rangel-Mendez, J.Nanopart Res. 12 (2010) 467.
[36] Q. Su, B. Pan, B. Pan, Q. Zhang, W. Zhang, L. Lv, X. Wang, J. Wu, Q. Zhang, Sci.Total Environ. 407 (2009) 5471.
[37] X. Chun-hua, Y. Cai-ping, Trans. Nonferrous Met. Soc. Chin. 18 (2008) 1290.[38] S.P. Deosarkar, V.G. Pangarkar, Sep. Purif. Technol. 38 (2004) 241.