Embed Size (px)
Citation preview
Adsorption of Surfactants on Colloidal Silica: Effects of Surface Curvature on the Structure of Surface
Aggregates
vorgelegt von Diplom-Ingenieur
Dersy Marileth Lugo Quijada aus Maturín ‒ Venezuela
Von der Fakultät II - Mathematik und Naturwissenschaften der Technischen Universität Berlin
Zur Erlangung des akademischen Grades
Doktor der Ingenieurwissenschaften Dr. Ing.
genehmigte Dissertation
Promotionsausschuss: Vorsitzender: Prof. Dr. R. von Klitzing, TU Berlin Berichter: Prof. Dr. G. H. Findenegg, TU Berlin Berichter: Prof. Dr. R. Schomäcker, TU Berlin Berichter: Dr. J. Oberdisse, Université Montpellier II Tag der wissenschaftlichen Aussprache: 07.04.2010
Berlin 2010
D 83


The difference between a successful person and others is not a lack of
strength, not a lack of knowledge, but rather a lack of will.
Vince Lombardi


This work is dedicated to my family (Juan, Carmen, Argenis, Mary C.,
Argenis E., Kevin and Ernesto), who encouraged me during the performance
of my research.


Acknowledgment
First of all, I would like to thank to God for putting on my way such an encouraging and amazingly incomparable advisor like Prof. Dr. Gerhard H. Findenegg, who always reassured me and gave me important advices and inspiration through my work and in my personal life. Who was always like my father to me in Germany, always helping me to grow in all aspects of life. And for whom I feel a great admiration that I cannot describe with words. I only hope that in the future I could find a boss like you. I would like to express my deep and sincerely gratitude to Dr. Julian Oberdisse from Montpellier University for his constant and friendly support, for his fruitful collaboration in this work and for sharing his knowledge with me every time we met in Germany or in France and most importantly, for opening the door for me to his family (wife and children), who always made me feel like I was in Venezuela during my stay in Montpellier. I am also sincerely grateful to Dr. Sylvain Prévost for his invaluable advice and guidance on the SANS measurements and fitting of the SANS data, and moreover, for his friendship. I also acknowledge Prof. Dr. Reinhard Schomäcker, for being my second supervisor, for his amenable and fruitful discussions about my work and for the advice letters written to the DAAD. I want to thank Prof. Dr. Regine von Klitzing for agreeing to be the “Vorsitzenderin" in the defence of my work and for always giving me a lot of motivation. I would like to express my sincere thanks to the people belonging to the Stranski Laboratory for opening the doors to me and for always being very friendly and for giving me the opportunity to be one member more of this harmonious family. I would like to further address sincere thanks to Guillermo Orts (now in BAM, Berlin), Matthias Karg (now in Melbourne University), Pilar Caamano, Gabi Hedicke, Michaela Dzionara, Ingke Ketelsen, Barbara Paeplow, Jens Meissner and Claudia Oppel for their help in my research work, but also especially for the personal support. Dr. Ralf Schweins from the Institut Laue-Langevin, Dr. Sylvain Prévost from the Helmholtz Zentrum Berlin für Materialien und Energie GmbH and Dr. Alain Lapp from the Laboratoire Léon Brilloiun, for their fruitful help during the SANS measurements. Dr. Dirk Berger from ZELMI (TU Berlin) for his help in the TEM measurements and for the friendly atmosphere in his group. The Technical Chemistry group from TU Berlin is kindly acknowledged for the harmonic and friendly atmosphere that they offered me when I performed the BET measurements. Moreover I would like to further address sincere thanks to

Gabi Vetter, Henriette Nowothnick, Xiao Xie, Kirsten Langfeld, Benjamin Frank, Hary Soerijanto, Benjamin Beck, Melissa Sudartono and Sebastian Arndt for the personal support. I would especially like to thank my adoptive sisters in Germany, Dilek Akcakayiran and Pinar Akcakayiran, for always making me feel at home, for always giving me emotional strength and for always being there to listen to me. Moreover, I am sincerely grateful to Michael Muthig, Yan Zeng, Cagri Üzüm, Bhuvnesh Bharti, Claire Look, Guillermo Orts, Claudia Oppel, Ingo Hoffman, Anina Barth, Susanne Jähnert, Cristina Giordano, Samuel Dodoo, Kornelia Gawlitza, Paul Wafula, Mariel Saez, Marga Garrido and all those friends, which were once in Berlin sharing amenable time with me. Thanks for your friendship, for your support and for always being there when I needed to talk with a very good friend. Luis Colmenares and Yahira Ramirez, thanks for giving me the impulse to come to Germany to do my PhD. studies and for your guidance in personal and professional life. You will be always my friend and my family model. I am always acknowledged to God to allow me to meet both of you. There are no words to express my gratitude to my parents (Carmen Quijada and Argenis Lugo), my sister (Mary Lugo), my brother (Argenis Jr. Lugo), my nephew (Kevin Lisboa) and my brother in law (Ernesto Lara). Thanks for being always there supporting me in my decisions and always giving me the strength to be far away from all of you and to make me feel good every time when I am not motivated. To my best friend, Juan Milano, as you say “we are one, our decisions are only one”. You are my whole world and heart, who has made me the life most easy to understand, who always is giving me emotional strength, motivation and impulse to reach my goals. You have been always there for me, guiding me, understanding me and always giving me very good advices when I am in the wrong way. I do not what I will do if you are not with me. To God for allowing me to enjoy my time during my PhD, for giving me health and for never abandoning me.

Abstract
Adsorbed surfactants can play an important role as a protection layer for the
steric stabilization of colloids and for the preparation of nanostructured
functional surfaces. In many cases highly curved surfaces are involved, and this
surface curvature may have a pronounced influence on the structure and
stability of the adsorbed surfactant layer. In order to better understand these
influences, the work presented in this thesis focuses on the study of self-
assembled structures of three classes of nonionic surfactants and some of their
binary mixtures on silica nanoparticles dispersed in water.
The adsorption of an alkyl ethoxylate surfactant (C12E5), two alkyl maltosides
(β-C10G2 and β-C12G2) and an alkyldimethylamine oxide surfactant (C12DAO),
as well as binary mixtures of C12DAO with β-C10G2 and β-C12G2 onto purpose-
synthesized silica sols of uniform particle size (mean diameter 16, 27 and 42
nm) was studied by small-angle neutron scattering (SANS). The silicas were
prepared by two variants of the Stöber synthesis. Their particle size was
characterized by electron microscopy (TEM), dynamic light scattering (DLS),
and SANS, and the specific surface area was determined by N2 adsorption. It
was found that C12E5 exhibits strongly cooperative adsorption onto the silica
particles with a surface concentration plateau value Γmx similar to that on flat
silica surfaces. Analysis of the SANS profiles of silica sols with adsorbed C12E5
or C12DAO showed that these surfactants do not form a laterally uniform
adsorbed bilayer. Instead, spherical surface micelles are formed on particles of
16 nm. For C12DAO a morphological transition from spherical to oblate
ellipsoidal surface micelles was found as the diameter of the silica particles
increases from 16 nm to 27 and 42 nm. The ellipsoidal surface micelles of
C12DAO have similar dimensions as micelles in the bulk solution. β-C10G2 and
β-C12G2 show very weak adsorption onto silica beads, but their adsorption can
be promoted by C12DAO, when small amounts of β-CnG2 are present. However,
desorption of the surfactants from the particles and formation of mixed micelles
in solution occurs if larger amounts of the maltoside surfactant are added.
i
Zusammenfassung
Die Adsorption von Tensiden an Kolloid-Teilchen kann zu einer sterischen
Stabilisierung der kolloidalen Dispersion führen und ist daher von großer
Bedeutung für die Herstellung nanostrukturierter funktionaler Oberflächen. Stark
gekrümmte Oberflächen spielen in solchen Systemen eine große Rolle und
können einen maßgebenden Einfluss auf Struktur und Stabilität der
adsorbierten Tensidfilme haben. Die vorliegende Doktorarbeit verfolgt das Ziel,
den Einfluss der Oberfächenkrümmung auf die Morpholpgie der adsorbierten
Schicht von nichtionischen Tenside an Silika-Nanoteilchen zu bestimmen.
Die Struktur der Adsorptionsschicht eines Alkylethoxylats (C12E5), der
Alkylmaltoside β-C10G2 und β-C12G2, und des Alkyldimethylaminoxids C12DAO,
sowie von binären Mischungen von C12DAO mit β-C10G2 und β-C12G2 an Silica-
Nanoteilchen wurde mittels Kleinwinkel-Neutronenstreuung (SANS) untersucht.
Die Silica-Nanoteilchen mit Teilchendurchmessern im Bereich von 16 bis 42 nm
wurden nach der Stöber-Methode synthetisiert und mit Elektronenmikroskopie
(TEM), dynamischer Lichtstreuung (DLS) und SANS, sowie durch Stickstoff-
Adsorption charakterisiert. Die Adsorptionsisotherme von C12E5 zeigt einen
stark kooperativen Verlauf mit einem Plateauwert ähnlich wie an atomar glatten
Silica-Oberflächen. Die Analyse der SANS-Streukurven der Dispersionen mit
C12E5 and C12DAO zeigt, dass diese Tenside an den Silika-Teilchen keine
homogene Tensiddoppelschicht, sondern im Falle der kleinsten Silika-Teilchen
(16 nm) kugelförmige Oberflächenmizellen bilden. Im Fall von C12DAO konnte
mit zunehmender Teilchengröße ein morphologischer Übergang von kugel-
förmigen zu oblat ellipsoidalen Oberflächenmizellen nachgewiesen werden, die
eine ähnliche Grösse wie die Mizellen in wässrige Lösung haben. Im Gegensatz
zu C12E5 und C12DAO wurde für β-C10G2 und β-C12G2 keine signifikante
Adsorption an den Silica-Teilchen gefunden. Es konnte aber gezeigt werden,
dass die Adsorption dieser Tenside an Silica-Teilchen durch die Anwesenheit
von C12DAO begünstigt wird (synergetischer Effekt). Erhöhung der
Konzentration von β-C10G2 und β-C12G2 bewirkt jedoch eine Desorption von
C12DAO und die Bildung von Mischmizellen in der Lösung.
ii
Contents
1 Introduction 1 2 Fundamentals
2.1 Surfactants………..…………………………………………………………. 2.1.1 Surfactants in Solution………..……………..………………………….
2.1.2 Micellar Structure and Shape……………………..…………………....
2.1.3 Mixed Surfactant Systems………………………………..……............
2.2 Adsorption of Surfactants ……..….……………………………..………. 2.2.1 Adsorption at the Air/Liquid Interface.……………………..…………..
2.2.1.1 The Gibbs Adsorption Equation…………...…...…...………………
2.2.2 Adsorption at the Solid/Liquid Interface...………………………….….
2.2.2.1 Mechanisms of Surfactant Adsorption ………..…...………………
2.2.2.2 Adsorption Isotherms …………………………………....................
2.3 Structure of the Surface Aggregates…..……………………………......2.4 Scattering Techniques …..……………………………………………......
2.4.1 Dynamic Light Scattering (DLS)…….…………...……………............
2.4.2 Small Angle Neutron Scattering (SANS) …….....……………............
5 5 5
8
11
16 17
18
19
20
21
27 28 29
22
3 Experimental Section 3.1 Chemicals…………...………………………………………………………..3.2 Sample Preparation………………………………………………..............
3.2.1 Synthesis of the Silica Nanoparticles ……...…...……………………..
3.2.2 Characterization of the Silica Nanoparticles ……….....……...………
3.2.3 Surfactant Solutions...………………………………………………......
3.2.4 Surfactant Adsorption on the Silica Nanoparticles…………...………
3.2.5 Adsorption from Surfactant Mixtures on the Silica Nanoparticles.....
3.3 Methods…………….……………………………………………….............. 3.3.1 Nitrogen Adsorption………………… ……...…………………………..
3.3.2 Transmission Electron Microscopy (TEM).…………..………….……
3.3.3 Zeta Potential...…………………….……...……………...……………..
50 50 50 50
51
52
53
54
55 55
57
57
iii
3.3.4 Dynamic Light Scattering (DLS)…………...…………..………………
3.3.5 Surface Tension………………...…………...…………..………………
3.3.6 Small Angle Neutron Scattering (SANS).....…………..………………
57
58
58
4 Surface Aggregate Structure of Nonionic Surfactants on Colloidal Silica Nanoparticles
4.1 Introduction…………………………………………………………………..4.2 Results……………………...………………………………………..............
4.2.1 Characterization of the Silica Particles……………….………………..
4.2.2 Adsorption and Film Thickness of C12E5 on the Silica………….……
4.2.3 Characterization of the Adsorbed Layer by SANS ……….…............
4.2.3.1 Core-Shell Model……………………………………..………………
4.2.3.2 Micelle-Decorated Silica Model…………………………………..…
4.3 Discussion…………………………………………....................................
60 60 62 62
65
67
69
72
75
5 Effect of Nanoparticle Size on the Morphology of Adsorbed Surfactant Layers
5.1 Introduction…………………………………………………………………..5.2 Results and Discussion…………………………………………..............
5.2.1 Characterization of the Silica Particles……………….………………..
5.2.2 SANS Study of adsorbed C12DAO Layer………………..……....……
5.2.3 Geometric Modelling.…….………………………………………..........
5.2.4 Core-Shell Model …………..…….......…………………………………
5.2.5 Micelle-Decorated Silica Model ………………………………………..
5.2.6 Scattering from Index-matched Silica Particles Decorated with
Ellipsoidal Micelles………………………………………………………………..
5.2.7 Influence of the Surfactant Head Group……………………..………..
5.2.8 Influence of the Nanoparticle Size…………...…………………..........
6 Surface Aggregate Structure of Mixtures of Sugar-Based Surfactants with an Amphoteric Surfactant on Silica Beads
6.1 Introduction…………………………………………………………………..6.2 Results and Discussion…………………………………………..............
6.2.1 Characterization of the Silica Particles……………….………………..
79
79 81 81
86
89
90
92
98
101
102
105105 107 107
iv
v
6.2.2 Adsorption of the Binary Surfactant Mixtures at the Air/Liquid
Interface……………………………………………………………………………
6.2.3 Structure of Surfactant Aggregates in Aqueous Solutions……...…..
6.2.3.1 Geometric Modelling ……….………………………..………………
6.2.3.2 Form Factor Models……………………...…………………………..
6.2.4 SANS Study of the Adsorbed Layer of Surfactant Mixtures on the
Surface of Silica Nanoparticles………………………………………………….
6.2.4.1 Geometric Modelling ……….………………………..………………
6.2.4.2 Core-Shell Model….……………………...…………………………..
6.2.4.3 Micelle-Decorated Silica Model……………………………………..
6.2.5 Effect of the Maltoside Surfactants on the Adsorption of C12DAO
on Silica…………………………………………………………………………….
7 Summary and Outlook 8 Appendix
110
114
115
117
120
123
125
127
133
138143
1 Introduction
Surfactants and their mixtures can drastically change the surface properties of
solids and hence they play a key role in many industrial processes such as
dispersion/flocculation, corrosion inhibition, drug delivery, colloidal stabilization,
enhanced oil recovery, and so on. In this context it is of great importance to get
information about the adsorbed amount of surfactant and the structure of the
adsorbed layer, in order to improve or to control the desired conditions for the
performance of modification of surfaces by adsorption of amphiphilic molecules
for a specific technical or biological application. For this reason, many
investigations have been performed during the past decades to study the
thermodynamics and mechanism adsorption of surfactants at the solid/liquid
interface, as well as the molecular organization of the adsorbed surfactants on
solids. However, most studies have been centered on the former aspects,
based on experimental techniques for the determination of adsorption isotherms
and adsorption enthalpies and entropies [1.1]. Pioneering research into
interfacial aggregation with adsorption isotherms [1.2] and the surface force
apparatus, SFA [1.3] has provided quantitative measures of adsorption but little
information on aggregate structures. Modelling of the adsorption mechanisms of
surfactants has traditionally been based on the interpretation of adsorption
isotherms. However, this first level of investigation is not sufficient for a
complete understanding of the surfactant self-assembly structures on solids.
Therefore, direct inspection of adsorbed layer of surfactant molecules at the
solid–liquid interface is needed. Surface aggregates or hemi-micelles had been
proposed as partial surface coverage as early as 1955 in order to explain the
shapes of the adsorption isotherms. Subsequently, hemi-micelles were shown
to be quite common and there was some headway in determining the structure
of these hemi-micelles, particularly their relationship to bulk solution micelles.
Theoretical adsorption isotherms were developed which included hemimicelle
formation either as well-defined micelles [1.4] or as a patchy monolayer or
bilayer [1.5]. Recent efforts to probe these structures on flat surfaces have used
fluorescence decay [1.6], neutron reflection [1.7], ellipsometry [1.8] and atomic
1. Introduction
force microscopy (AFM) [1.9]. These studies have shown that surfactants often
self-assemble on flat hydrophilic surfaces to form structures analogous to those
observed in bulk solution, i.e. spherical or cylindrical surface micelles, as well as
patchy or complete bilayer-type structures. On hydrophobic surfaces surfactants
tend to form monolayers or hemi-micellar aggregates. These studies have
strongly enhanced the knowledge about adsorbed layer morphologies on flat
surfaces. On the other hand, information about the interfacial aggregation of
surfactant molecules on colloidal particles is still limited and not yet well
understood.
An understanding of the structure of surfactant layers at the surface of
nanoparticles in suspensions is of vital importance for the fabrication of nano-
structured functional surfaces, which play an important role as a protection layer
for the steric stabilization of colloidal dispersions for the preparation of paints,
printing inks, agrochemicals, detergents, etc. Non-ionic surfactants are often
more attractive than ionic surfactants in these applications due to their weaker
salt-sensitivity and their larger tendency to preferentially adsorb to hydrophobic
surfaces.
Small-angle neutron scattering (SANS) is the most powerful method to
investigate the nature of adsorbed surfactant layers on colloidal solids, as it
allows to study structural details at a length-scale of 1 nanometer and below. In
addition, it allows to highlight the surfactant layer by matching the colloidal
particles with partial deuteration of the solvent. Unlike scanning force
microscopy techniques, neutron scattering represents a noninvasive technique,
which is of particular importance for detecting soft structures as in the case of
adsorbed surfactant layers. Cummins et al. [1.9] performed pioneering work to
elucidate the morphology of surfactant layers adsorbed on silica particles 20
years ago. They proposed that alkyl polyoxyethylene ether (CnEm) surfactants
adsorb on Ludox HS and TM silica sols as a layer of uniform density. However,
recent work by Despert and Oberdisse [1.10] has indicated that the structure of
the surfactant layer may be more complex than suggested by earlier studies.
This was concluded from the fact that the SANS measurements indicated a
significantly higher surface area of the adsorbed surfactant than the area of a
2
1. Introduction
surfactant bilayer. It was proposed that the surfactant layer is not laterally
uniform but consists of discrete surface micelles. This study was performed with
a technical-grade surfactant (Triton X-100) and a commercial silica dispersion
(Bindzil). In view of the influence of adsorbed surfactant layers on colloidal
particles in many technical fields it was desirable to verify these results and to
find out if they apply to a wider class of surfactants or if they may be artifacts
caused by the use of a technical-grade surfactant and silica.
The aim of the present work is to gain a better understanding of the
morphology of surfactant adsorbed layers on silica nanoparticles of size below
100 nm. In particularly, the applicability of the new micelle-decorated silica
model of Despert and Oberdisse should be tested for different classes of
nonionic surfactants with a low and a high adsorption capacity and to find out to
what extent the structure of the adsorbed layer at the surface of the silica
nanoparticles depends on the size and chemical nature of the surfactant head
group. A longer-term goal of this work is to gain a better understanding of the
effects of surface curvature and the influence of size of the silica nanoparticles
on the nature and relative stability of the surface aggregates of these
surfactants.
A further point of interest in this work was to clarify the nature of mixed
surfactant aggregates formed by two nonionic surfactants of different adsorption
affinity on colloidal silica sols in a concentration regime, i.e. when the amount of
the preferred surfactant is not sufficient to cover the silica particles with a
complete adsorbed bilayer. In this ‘surfactant-deficient’ regime the amount
adsorbed can be controlled simply by adjusting the overall amount of
surfactants in the system. This possibility is of relevance particularly for
surfactant mixtures, where it may allow preparing nanoparticles covered by an
asymmetric surfactant bilayer, such that one surfactant is forming the inner
layer, while the other surfactant forms the outer layer of the adsorbed bilayer. It
is expected that this situation can arise whenever the surfactant of higher
adsorption affinity (component A) is present at an overall amount not sufficient
to form a complete bilayer but only half of a bilayer. It is likely that in such a
case the surfactant of lower adsorption affinity (surfactant B) may be
3
1. Introduction
4
accommodated in the outer layer to complete the bilayer. Such a situation may
indeed prevail in technically relevant situations when surfactant mixtures are
used to stabilize colloidal dispersions.
References of Chapter 1 [1.1] (a) Király, Z.; Börner, R.H.K.; Findenegg G.H. Langmuir 1997, 13, 3308-3315. (b) Király,
Z.; Findenegg G.H. J. Phys. Chem. B 1998, 102, 1203-1211.
[1.2] (a) Gaudin, A.M.; Fuerstenau, D.W. Trans Am. Inst. Min. Metall. Pet. Eng. 1955, 202, 958-
962. (b) Fuerstenau, D.W. J. Phys. Chem. 1956, 60, 981-985.
[1.3] (a) Pashley, R. M.; Israelachvili, J. N. Colloids Surf. 1981, 2, 169-187. (b) Pashley, R. M.;
McGuiggan, P. M.; Horn, R. G.; Ninham, B. W. J. Colloid Interface Sci. 1988,126, 569-578.
[1.4] (a) Gu, T; Zhu, B.-Y. J. Chem. Soc., Faraday Trans. I 1989, 85, 3813-3817. (b) Zhu, B.-Y.;
Gu, T.; Zhao, X., J. Chem. Soc., Faraday Trans. I 1989, 85, 3819-3824.
[1.5] (a) Somasundaran, P.; Fuerstenau, D.W. J. Phys. Chem. 1966, 70, 90-96. (b) Harwell,
J.H.; Hoskins. J.C.; Schechter, R.S.; Wade, W.H. Langmuir 1985, 1, 251-262. (c) Böhmer, M.R.;
Koopal, L.K. Langmuir 1992, 8, 2649-2659.
[1.6] Levitz, P.; Van Damme, H.; Keravis, D. J. Phys. Chem. 1984, 88, 2228-2235.
[1.7] Lee, E. M.; Thomas, R. K.; Cummins, P. G.; Staples, E. J.; Penfold, J.; Rennie, A. R.
Chem. Phys. Lett. 1989, 162, 196−202.
[1.8] Tiberg, F.; Landgren, M. Langmuir, 1993, 9, 927–932.
[1.9] (a) Manne, S.; Cleveland, J. P.; Gaub, H. E.; Stucky, G. D.; Hansma, P. K. Langmuir,
1994, 10, 4409–4413. (b) Manne, S. ; Gaub, H.E. Science, 1995, 270, 1480-1482.
L.K. Langmuir 1992, 8, 2649-2659.
[1.10] (a) Cummins, P. G.; Staples, E.; Penfold, J. J. Phys. Chem., 1990, 94, 3740-3745. (b)
Cummins, P. G.; Penfold, J.; Staples, E. J. Phys. Chem., 1992, 96, 8092-8094. (c) Penfold, J.;
Staples, E.; Tucker, I.; Cummins, P. J. Phys, Chem., 1996, 100, 18133-18137.
[1.11] Despert, G.; Oberdisse, J. Langmuir, 2003, 19, 7604-7610.
2 Fundamentals This chapter provides a brief overview of the general characteristics of the self-
assembly process of surfactants and their binary mixtures in aqueous solutions
as well as at the solid/liquid interface.
2.1 Surfactants The following sections present a brief review of some of the basic concepts
pertaining to the formation of surfactant micelles and their behavior at the
air/liquid and solid/liquid interfaces. As it is known, surfactants are amphiphilic
molecules consisting of a non-polar hydrophobic portion, usually a straight or
branched hydrocarbon chain, which is attached to a polar or ionic portion
(known as hydrophilic), which can be non-ionic, ionic, or zwitterionic [2.1].
2.1.1 Surfactants in solution
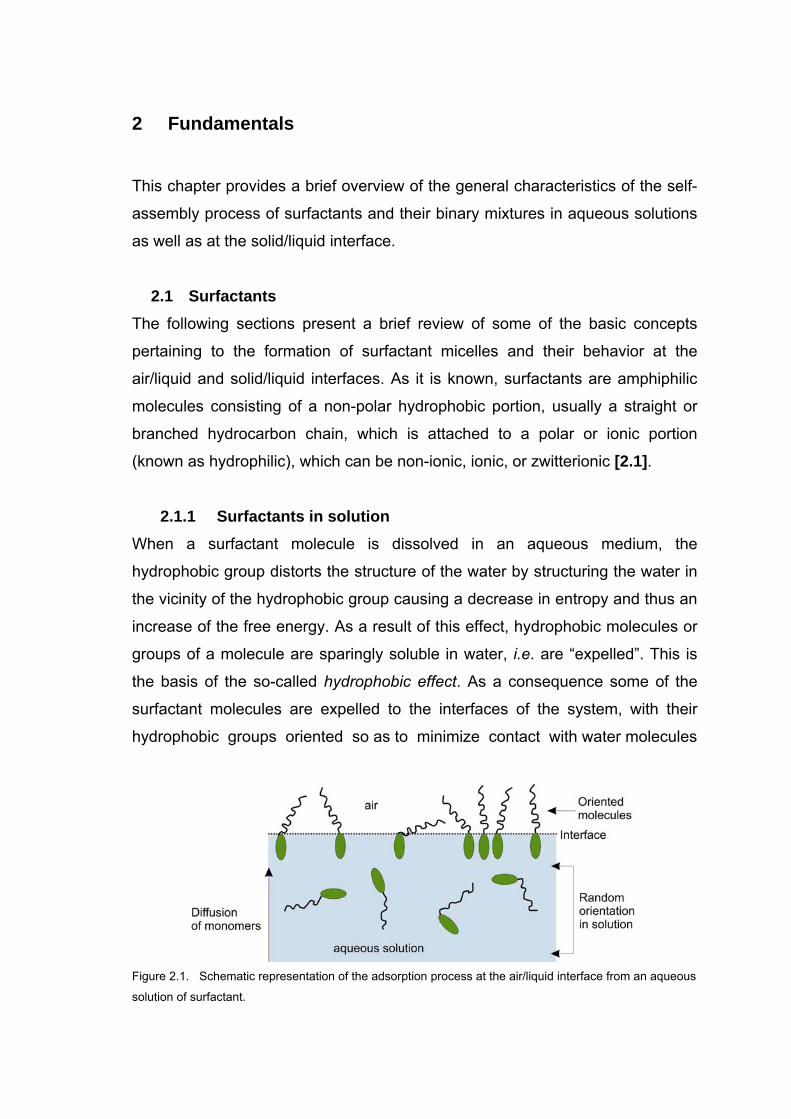
When a surfactant molecule is dissolved in an aqueous medium, the
hydrophobic group distorts the structure of the water by structuring the water in
the vicinity of the hydrophobic group causing a decrease in entropy and thus an
increase of the free energy. As a result of this effect, hydrophobic molecules or
groups of a molecule are sparingly soluble in water, i.e. are “expelled”. This is
the basis of the so-called hydrophobic effect. As a consequence some of the
surfactant molecules are expelled to the interfaces of the system, with their
hydrophobic groups oriented so as to minimize contact with water molecules
Figure 2.1. Schematic representation of the adsorption process at the air/liquid interface from an aqueous
solution of surfactant.
2. Fundamentals
and in this way lowering the system free energy. The surface of the water
becomes covered with a single layer of surfactant molecules with their
hydrophobic groups oriented predominantly toward the air [2.2], as shown in
Figure 2.1. The presence of surfactant at the air/liquid interface results in a
decrease of the surface tension due to the molecules of water close to the
interface will not be as constrained as it would be without the surfactant
molecules. Another mechanism by which the contact of water with the
hydrophobic chains of the surfactant can be avoided is surfactant aggregation.
Specifically, in micellar aggregates the hydrophobic tails are withdrawn from the
contact with water by shielding through the hydrophilic head group (see Fig.
2.2). The micellization phenomenon is predominantly an entropy driven
process, which is the result of the hydrophobic effect of the amphiphilic
molecules, as well as the repulsive interactions between the head groups of
these molecules as they come close to each other in the micelle shell. The
concentration at which micelles start to form is known as the critical micelle
concentration, CMC. .Upon reaching the CMC, any further addition of
surfactants will cause an increase in the number of micelles rather than a
further growth of existing micelles.
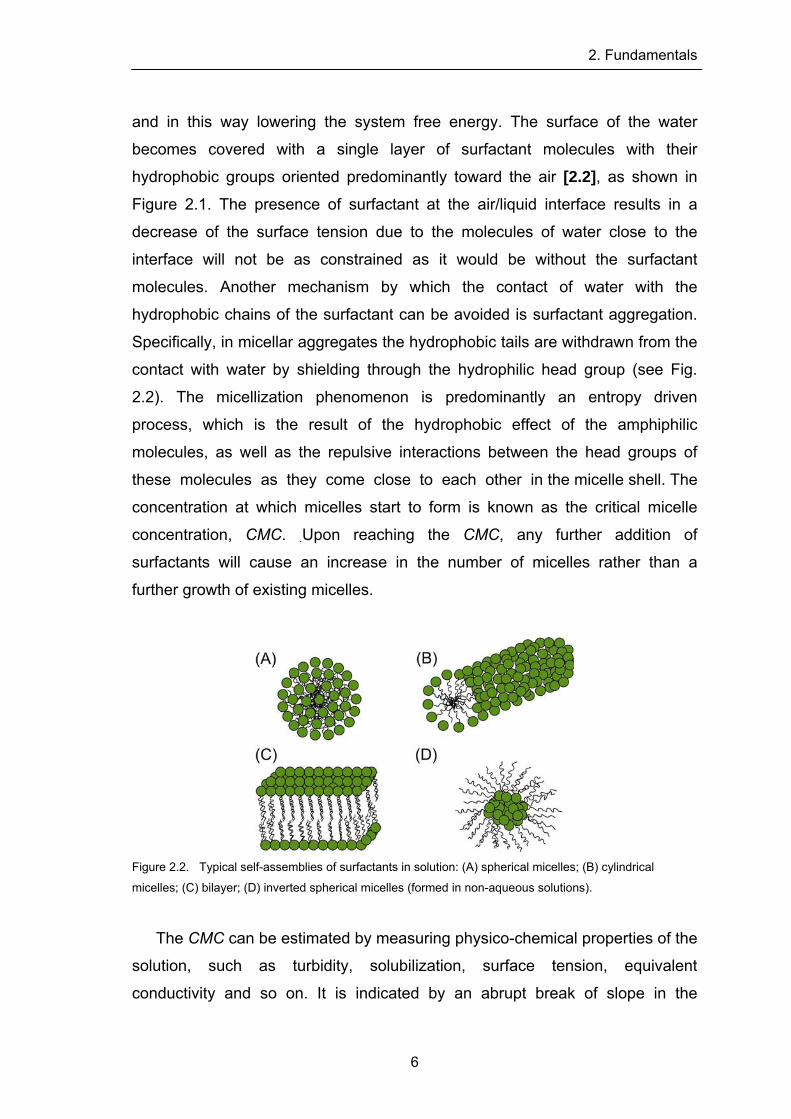
Figure 2.2. Typical self-assemblies of surfactants in solution: (A) spherical micelles; (B) cylindrical
micelles; (C) bilayer; (D) inverted spherical micelles (formed in non-aqueous solutions).
The CMC can be estimated by measuring physico-chemical properties of the
solution, such as turbidity, solubilization, surface tension, equivalent
conductivity and so on. It is indicated by an abrupt break of slope in the
6
2. Fundamentals
measured property as a function of the surfactant concentration. This abrupt
change is interpreted as a significant change in the nature of the solute species,
i.e., the formation of micelles. The most common technique to measure the
CMC is by determining the surface tension γ of the solution in a range of
concentration, which shows a break at the CMC, as is exemplified in Figure 2.3.
The value of the CMC is affected by several factors. In the present context only
those related to the surfactant chemical structure are of relevance: (i) the CMC
decreases strongly with increasing hydrocarbon chain length in a homologous
series of surfactants, due to the increase of the hydrophobic interactions; (ii) the
CMCs of nonionic surfactants is much lower than that of ionic surfactants of the
same alkyl chain length, because the head groups repel each other less; (iii) for
nonionic surfactants, e.g. with oxyethylene head groups (EO), there is a
moderate increase of the CMC as the polar head-group becomes larger, which
is directly related to the increase of the hydrophilicity of the surfactant
molecules; (iv) presence of alkyl chain branching and double bonds, aromatic
groups or some other polar character in the hydrophobic part produce sizeable
changes in the CMC; e.g., a dramatic lowering of the CMC results from
perfluorination of the alkyl chain [2.3].
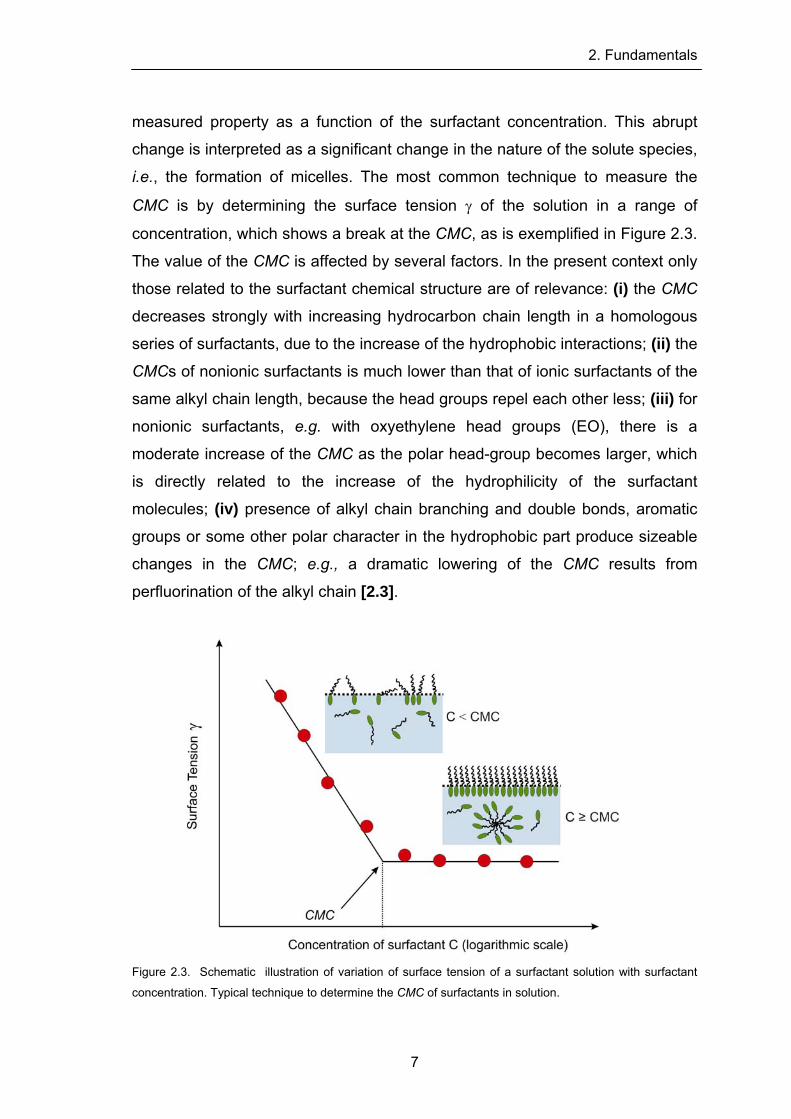
Figure 2.3. Schematic illustration of variation of surface tension of a surfactant solution with surfactant
concentration. Typical technique to determine the CMC of surfactants in solution.
7
2. Fundamentals
Along with the CMC, the main factor determining the properties of surfactant
solutions is the micellar aggregation number n, i.e. the number of surfactant
molecules in a micelle. Several methods have been used to calculate
aggregation numbers of different types of surfactants, such as NMR self-
diffussion coefficients, small-angle neutron scattering, static light scattering, etc.
From geometric considerations, the aggregation numbers n of micelles in
aqueous media should increase with increasing in the length of the hydrophobic
group of the surfactant molecule, and decrease with increase in the cross
sectional area of the hydrophilic group or the volume of the hydrophobic
group V [2.2].
cl
0a
2.1.2 Micellar Structure and Shape The classical picture of micelles formed by simple surfactant systems in
aqueous solution is that of spherical micelles, which was first suggested by
Adam [2.4] and Hartley [2.5]. They proposed that the spherical micelles have a
core of essentially liquid-like hydrocarbon, with a radius approximately equal to
the length of the hydrocarbon chain of the surfactant, surrounded by a shell
containing the hydrophilic head groups along with associated counterions and
water of hydration (see Fig. 2.2A). It is usually assumed that there are no water
molecules included in the micellar core, but it is considered that the aqueous
phase penetrates until to the first few methylene groups of the hydrophobic
chain adjacent to the hydrophilic head, as is supported by Clifford et al. [2.6], and therefore, these methylene groups are often considered in the hydration
sphere. Considering this, it is useful to divide the interior region into an outer
core that may be penetrated by water and an inner core from which water is
excluded. The extent of that water–hydrocarbon contact will be determined by
the surface area occupied by each head group and the radius of the core. It
seems that the relative ratio between the micellar core volume and surface area
must play an important role in controlling the thermodynamics and architecture
of the association process.
Tanford [2.7] and Israelachvili, Mitchell and Ninham [2.8] were the pioneers
of the two most important ideas to answer the question: how the molecular
8
2. Fundamentals
structure of the surfactant controls the shape and size of the resulting
aggregate? Tanford proposed the concept of opposing forces to formulate a
quantitative expression for the standard free energy change on aggregation.
Using this free energy expression and the geometrical relations for aggregates,
he was able to explain why surfactant aggregates form in aqueous solutions,
why they grow, why they do not keep growing but are finite in size, and why
they assume a given shape. Israelachvili, Mitchell, and Ninham proposed the
concept of molecular packing parameter , and demonstrated how the size
and the shape of the aggregates at equilibrium can be predicted from a
combination of molecular packing considerations and general thermodynamic
principles.
cP
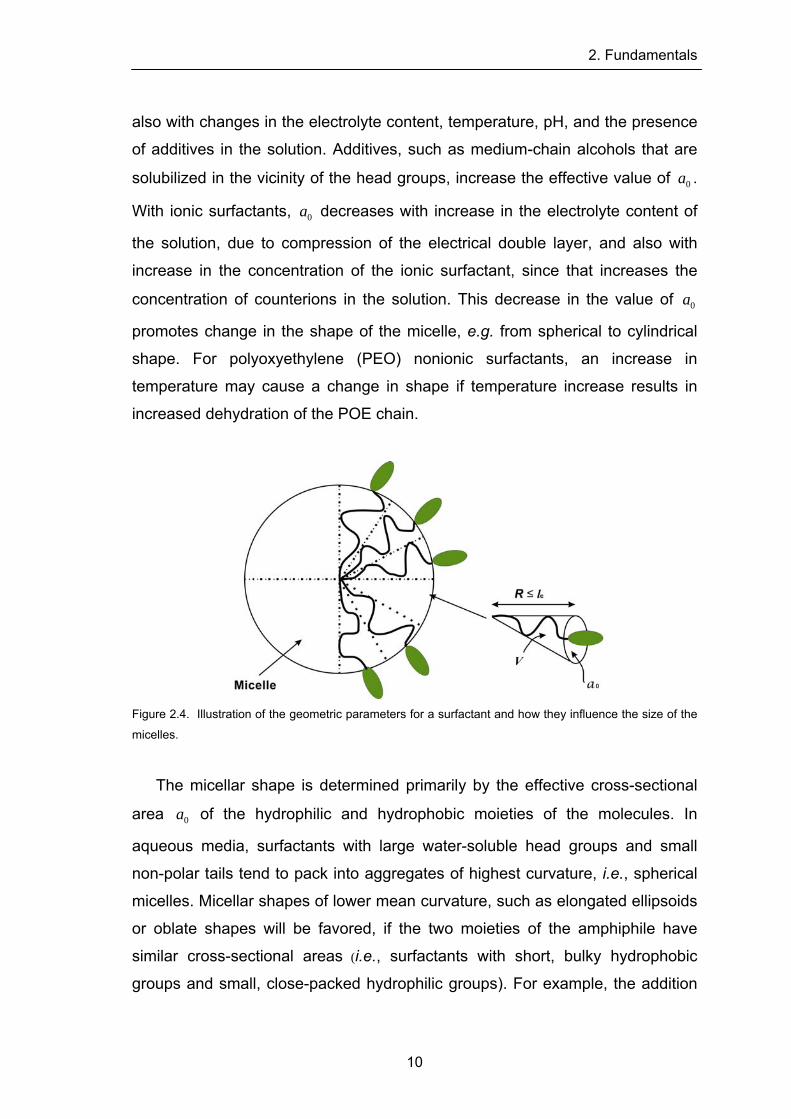
The molecular packing parameter is defined as 0/ alVP cc = , where V and
are the volume and the length of the surfactant tail, respectively, and is
the effective surface area occupied by the surfactant head group at the interface
between the micelle core and shell. Depending on the values of , one can
predict the possible shape of the micelles (see Figure 2.4 and Table 2.1). The
volume V occupied by the hydrocarbon chain can be obtained by using the
expression given by Reiss-Husson and Luzzati [2.9] V
cl 0a
cP
cn9.264.27 += Å3, where
nc is the number of carbon atoms of the chain embedded in the micellar core.
The length for a chain with nc embedded carbon atoms is given by
Å, depending upon the extension of the chain [2.7]. For
saturated, straight chains, may be 80% of the fully extended chain, due to the
gauche chain conformations. Chain segments located at the transition region
from core to shell, for example, cannot assume arbitrary conformations in order
to produce a perfectly ‘‘smooth,’’ homogeneous surface. The micellar surface,
therefore, must be assumed to be somewhat rough or irregular, although the
dynamic nature of the aggregate may obscure any practical effect of such
roughness.
cl
cncl ≤ 265.15.1 +
cl
The value of cannot be easily quantified as in the case V and ,
because varies not only with the structure of the hydrophilic head group, but
0a cl
0a
9
2. Fundamentals
also with changes in the electrolyte content, temperature, pH, and the presence
of additives in the solution. Additives, such as medium-chain alcohols that are
solubilized in the vicinity of the head groups, increase the effective value of .
With ionic surfactants, decreases with increase in the electrolyte content of
the solution, due to compression of the electrical double layer, and also with
increase in the concentration of the ionic surfactant, since that increases the
concentration of counterions in the solution. This decrease in the value of
promotes change in the shape of the micelle, e.g. from spherical to cylindrical
shape. For polyoxyethylene (PEO) nonionic surfactants, an increase in
temperature may cause a change in shape if temperature increase results in
increased dehydration of the POE chain.
0a
0a
0a
Figure 2.4. Illustration of the geometric parameters for a surfactant and how they influence the size of the
micelles.
The micellar shape is determined primarily by the effective cross-sectional
area of the hydrophilic and hydrophobic moieties of the molecules. In
aqueous media, surfactants with large water-soluble head groups and small
non-polar tails tend to pack into aggregates of highest curvature, i.e., spherical
micelles. Micellar shapes of lower mean curvature, such as elongated ellipsoids
or oblate shapes will be favored, if the two moieties of the amphiphile have
similar cross-sectional areas (i.e., surfactants with short, bulky hydrophobic
groups and small, close-packed hydrophilic groups). For example, the addition
0a
10
2. Fundamentals
of salt or of a co-surfactant to a solution of ionic surfactants causes a structural
transition from spherical micelles to cylindrical ones, because the presence of
electrolyte or additives screens the head group charge and make it smaller
[2.10-2.13].
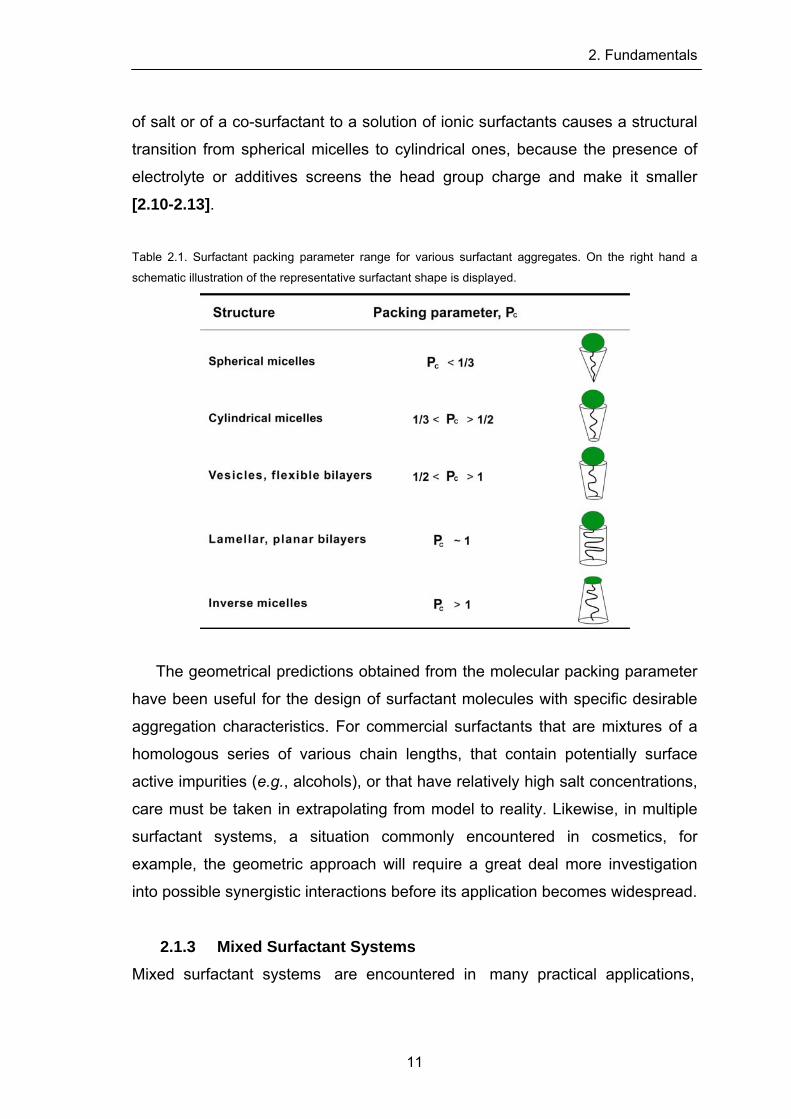
Table 2.1. Surfactant packing parameter range for various surfactant aggregates. On the right hand a
schematic illustration of the representative surfactant shape is displayed.
The geometrical predictions obtained from the molecular packing parameter
have been useful for the design of surfactant molecules with specific desirable
aggregation characteristics. For commercial surfactants that are mixtures of a
homologous series of various chain lengths, that contain potentially surface
active impurities (e.g., alcohols), or that have relatively high salt concentrations,
care must be taken in extrapolating from model to reality. Likewise, in multiple
surfactant systems, a situation commonly encountered in cosmetics, for
example, the geometric approach will require a great deal more investigation
into possible synergistic interactions before its application becomes widespread.
2.1.3 Mixed Surfactant Systems Mixed surfactant systems are encountered in many practical applications,
11
2. Fundamentals
from laundry detergent formulations to industrial and technological systems, due
to economical factors as well as beneficial effects of mixtures over individual
surfactants. The interaction between different surfactants can lead to synergetic
or antagonistic effects, depending on the kinds of surfactants. The most used
pairs of surfactants which show synergism are mixtures of a charged and an
uncharged compound. The phenomenon of synergism in these cases is due to
the interaction between the different head groups. On the other hand,
antagonism can be reached by mixing surfactants with the same kinds of head
groups, but different kinds of chains, one hydrocarbon and the other
perfluorinated, which have a limited solubility in the mixed micelles. This limited
solubility is ascribed mainly to the phobicity between the fluorocarbon and
hydrocarbon chain, as seen in bulk phases. Because of the incompatibility
between these two types of surfactants, the coexistence of two kinds of micelles
(one fluorocarbon-rich and one hydrocarbon-rich) has been suggested [2.14]. On the other hand, it has been reported that polyoxyethylene amphiphiles
bearing fluorinated or hydrocarbon tails rather form mixed micelles [2.15]. A simple method to determine if a surfactant mixture exhibits synergism or
antagonism in mixed micelle formation is to determine the CMC of the mixture.
If the components of a mixture interact favorably, the CMC of the mixture can
be less than either the CMC of each component in the mixed micelle. But in
some cases, the two surfactants interact in such fashion that the CMC of the
mixture (CMC12) is always intermediate in value between those of the two
components of the mixture.
The first thermodynamic treatments of mixed micelle formation were focused
on ideal mixing. Thus, Shinoda [2.16] showed that the CMC’s of binary mixtures
of sodium alkyl carboxylates of different alkyl chain length could be modeled
using a formalism based on Raoult’s law which relates the CMC of the mixture
of any composition to the mean of the values for the individual species. Thus, in
a micelle containing two surfactants mixing ideally, the CMC of the mixture as a
function of the surfactant composition can be described by:
12
2. Fundamentals
2
1
1
1
12
11CMCCMCCMC
αα −+= (2.1)
where CMC1 and CMC2 are the values for the pure surfactants, α1 is the mole
fraction of surfactant 1 in the solution phase on a surfactant only basis (i.e., the
mole fraction of surfactant 2 in the mixture is 1 - α1).
In Shinoda’s work and that of most others, the micelle or surface layer is
treated explicitly as a separate phase with a composition distinct from that of the
bulk. Clint [2.17] extended this approach to include prediction of monomer
activities in the bulk and the micelle composition above the CMC. Rubingh
[2.18], Rosen [2.19], and others [2.20] have treated non-ideal binary mixtures
using the pseudo-phase separation model (PPS), where non-ideality is included
in the form of activity coefficients f of each surfactant in the bulk phase. Thus,
the CMC of non-ideal mixture of surfactants as a function of the surfactant
composition is given by:
22
1
11
1
12
11CMCfCMCfCMCαα −
+= (2.2)
Recently, it has increased the investigation of synergism in quantitative
terms based upon a simple, convenient method for measuring molecular
interactions between surfactants. The molecular interactions between two
surfactants at an interface or in micelles are commonly measured by the so-
called β parameter [2.21], which indicates the nature and strength of those
interactions. β is conveniently obtained from surface (or interfacial) tension or
from CMC data by use of equations (2.3)-(2.6). Equations (2.3) and (2.4) are
used to calculate the interaction at the air/aqueous solution interface (βσ) from
surface tension data [2.21b] (as is shown for the dashed line in Fig. 2.5):
[ ]021121
21
011121
21
)1/()1(ln)1()/ln()(1
CXCXCXCX−−−
=αα
(2.3)
13
2. Fundamentals
21
011121
)1()/ln(
XCXC
−=
αβ σ
(2.4)
where X1 is the mole fraction of surfactant 1 in the total mixed monolayer (on a
) and (2.6) are used to calculate interaction in the micelles (βM)
from
surfactant-only basis); C10, C2
0, and C12 are the molar concentrations in the
solution phase of surfactant 1, surfactant 2, and their mixture, respectively, at
the mole fraction α1 of surfactant 1 (on a surfactant-only basis), required to
produce a given surface tension, γ, value (obtained from γ,-log C plots; see
Figure 2.3).
Eqs. (2.5
CMC data [2.21a]:
[ ]MMMM
MMMM
CXCXCXCX
211212
1
111212
1
)1/()1(ln)1()/ln()(1
−−−=
αα
(2.5)
21
11121
)1()/ln(
M
MMMM
XCXC
−=
αβ (2.6)
where X1M is the mole fraction of surfactant 1 in the total surfactant in the mixed
for X1, which is then substituted
into
micelle (on a surfactant-only basis); C1M, C2
M, and C12M are CMC’s for
surfactant 1, surfactant 2, and their mixture, respectively, at the mole fraction
α1.
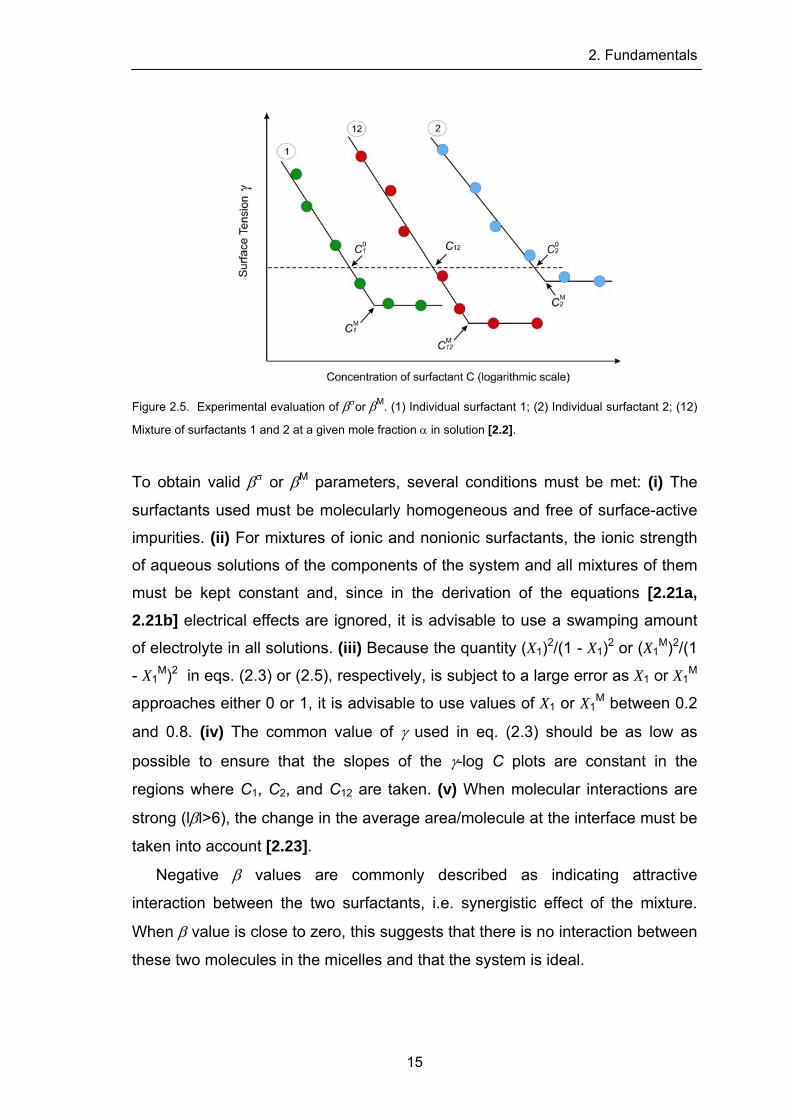
Equation (2.3) (or 2.5) is solved numerically
eq. 2.4 (or 2.6) to calculate βσ or βM. The experimental determination of βσ
and βM is shown in Figure 2.5. It involves determining the surface tension–log
surfactant concentration curves for each of the two individual surfactants in the
system and at least one mixture of them at a fixed value of α. For calculating βσ
(the molecular interaction parameter for mixed monolayer formation at the air/
aqueous solution interface), C10, C2
0, and C12 are needed; for βM, the CMCs,
C1M, C2
M, and C12M are required.
14
2. Fundamentals
Figure 2.5. Experimental evaluation of βσor βM. (1) Individual surfactant 1; (2) Individual surfactant 2; (12)
Mixture of surfactants 1 and 2 at a given mole fraction α in solution [2.2].
To obtain valid βσ or βM parameters, several conditions must be met: (i) The
surfactants used must be molecularly homogeneous and free of surface-active
impurities. (ii) For mixtures of ionic and nonionic surfactants, the ionic strength
of aqueous solutions of the components of the system and all mixtures of them
must be kept constant and, since in the derivation of the equations [2.21a, 2.21b] electrical effects are ignored, it is advisable to use a swamping amount
of electrolyte in all solutions. (iii) Because the quantity (X1)2/(1 - X1)2 or (X1M)2/(1
- X1M)2 in eqs. (2.3) or (2.5), respectively, is subject to a large error as X1 or X1
M
approaches either 0 or 1, it is advisable to use values of X1 or X1M between 0.2
and 0.8. (iv) The common value of γ used in eq. (2.3) should be as low as
possible to ensure that the slopes of the γ-log C plots are constant in the
regions where C1, C2, and C12 are taken. (v) When molecular interactions are
strong (lβl>6), the change in the average area/molecule at the interface must be
taken into account [2.23].
Negative β values are commonly described as indicating attractive
interaction between the two surfactants, i.e. synergistic effect of the mixture.
When β value is close to zero, this suggests that there is no interaction between
these two molecules in the micelles and that the system is ideal.
15
2. Fundamentals
On the other hand, several investigations about the shape of the micelles
formed in mixture systems have been also made. Some authors agree that in
this kind of system mixed micelles are formed, but other authors have proposed
the coexistence of different shape of micelles in solution. Therefore, this subject
is still in study.
2.2 Adsorption of Surfactants A fundamental characteristic of surfactants is their tendency to adsorb at
interfaces in an oriented fashion. In dilute solutions of surface-active agents, the
amount of change in any interfacial phenomenon produced by the adsorption of
surfactant at the interface is a function of the concentration of surfactant
absorbed at the interface. This adsorption process has been studied to
determine (i) the concentration of surfactant at the interface, since this is a
measure of how much of the interface has been covered (and thus changed) by
the surfactant; the performance of the surfactant in many interfacial processes
(e.g., foaming, detergency, emulsification) depends on its concentration at the
interface; (ii) the orientation and packing of the surfactant at the interface, since
this determines how the interface will be affected by the adsorption, that is,
whether it will become more hydrophilic or more hydrophobic; (iii) the rate at
which this adsorption occurs, since this determines the performance in
phenomena such as high-speed wetting or spreading; and (iv) the energy
changes, ΔG, ΔH, and TΔS, in the system, resulting from the adsorption, since
these quantities provide information on the type and mechanism of any
interactions involving the surfactant at the interface, and the maximum
concentration that the surfactant can attain at that interface, i.e., the surface
concentration of surfactant at surface saturation, Γmx.
The surface concentration of a surfactant Γ, known also as surface excess
or adsorption density, is related to the interfacial area occupied by the
surfactant molecule, as will be presented in section 2.2.1.1. For example, the
smaller the effective cross-sectional area of the surfactant at the interface, the
greater its surface excess of adsorption, Therefore, Γ depends on the structural
groupings in the surfactant molecule and its orientation at the interface.
16
2. Fundamentals
Adsorption can occur at any type of interface, although the distinct
characteristics of solid versus liquid interfaces make the analysis of each case
somewhat different. For that reason, the discussion of each situation is best
presented in the context of specific interfaces. In many practical systems, all
four of the principle interfaces may be present, leading to complex situations
that make complete analysis very difficult or impossible.
Two kind of situations of physical adsorption can occur at any interface,
which one can refer as ‘‘positive’’ or ‘‘negative’’ adsorption. The first situation is
met when the interfacial concentration of the adsorbed species is greater than
that in the bulk phase(s), which indicates that the interactions between the
adsorbate species and the adsorbant are favourable.
2.2.1 Adsorption at the air/liquid interface
The most important fluid interface at which surfactant adsorption occurs is the
air/water interface. In this case the surfactant adsorbs with the hydrophilic group
pointing towards the liquid leaving the hydrocarbon group pointing towards the
air. The presence of surfactant at the air/water interface results in a pronounced
decrease of the surface tension γ, as has been previously mentioned in Section
2.1.1 (see Fig. 2.1). The direct determination of the amount of surfactant
adsorbed per unit area of air/liquid interface is not generally possible because of
the difficulty of isolating the interfacial region from the bulk phase(s) for
purposes of analysis when the interfacial region is small, and of measuring the
interfacial area when it is large. Instead, the amount of material adsorbed per
unit area of interface is calculated indirectly from surface tension
measurements. As a result, a plot of surface tension as a function of
(equilibrium) concentration of surfactant in the liquid phases (see Fig. 2.3),
rather than an adsorption isotherm, is generally used to describe adsorption at
this interface. From such a plot the amount of surfactant adsorbed per unit area
of interface, i.e. Γ, can readily be calculated by use of the Gibbs adsorption
equation [2.2].
17
2. Fundamentals
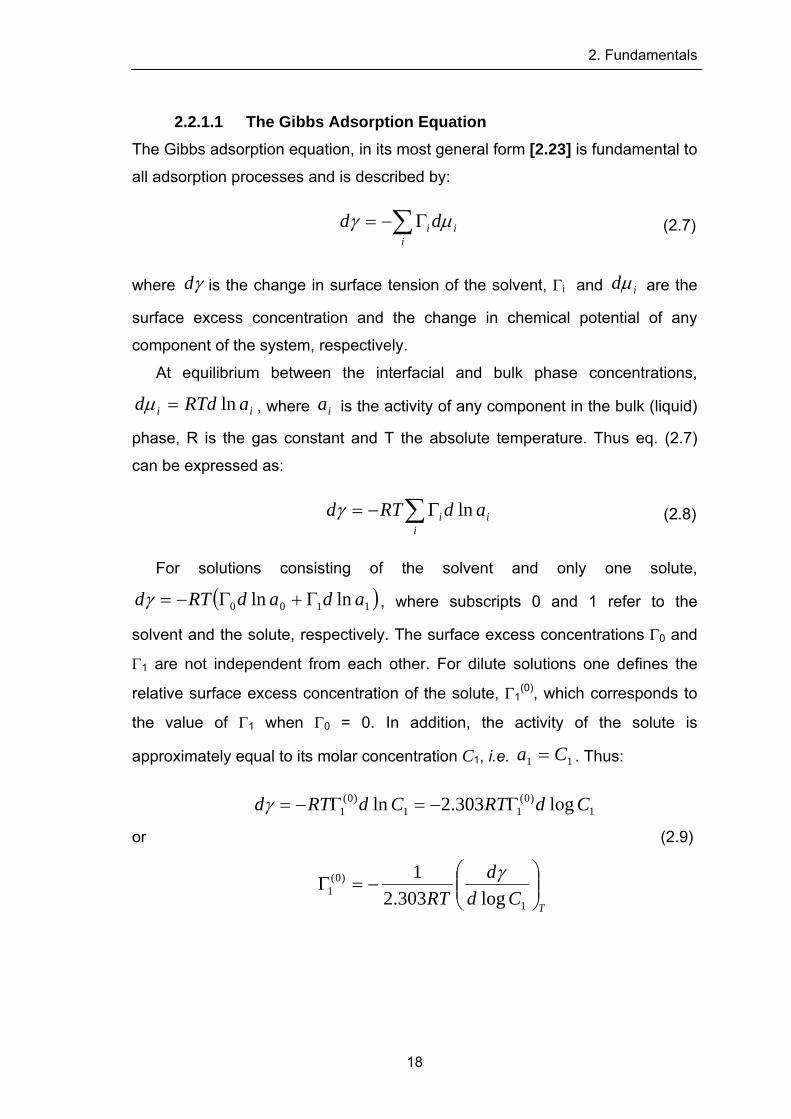
2.2.1.1 The Gibbs Adsorption Equation The Gibbs adsorption equation, in its most general form [2.23] is fundamental to
all adsorption processes and is described by:
∑Γ−=i
ii dd μγ (2.7)
where γd is the change in surface tension of the solvent, Γi and idμ are the
surface excess concentration and the change in chemical potential of any
component of the system, respectively.
At equilibrium between the interfacial and bulk phase concentrations,
ii aRTdd ln=μ , where is the activity of any component in the bulk (liquid)
phase, R is the gas constant and T the absolute temperature. Thus eq. (2.7)
can be expressed as:
ia
∑Γ−=i
ii adRTd lnγ (2.8)
For solutions consisting of the solvent and only one solute,
( 1100 lnln adadRTd Γ+Γ−= )γ , where subscripts 0 and 1 refer to the
solvent and the solute, respectively. The surface excess concentrations Γ0 and
Γ1 are not independent from each other. For dilute solutions one defines the
relative surface excess concentration of the solute, Γ1(0), which corresponds to
the value of Γ1 when Γ0 = 0. In addition, the activity of the solute is
approximately equal to its molar concentration C1, i.e. 11 Ca = . Thus:
1)0(
11)0(
1 log303.2ln CdRTCdRTd Γ−=Γ−=γ
or (2.9)
TCd
dRT ⎟⎟
⎠
⎞⎜⎜⎝
⎛−=Γ
1
)0(1 log303.2
1 γ
18
2. Fundamentals
which is the form in which the Gibbs equation is commonly used for solutions of
nonionic surfactants containing no other materials. When γ is in mN/m; R = 8.31
J mol-1 K-1, then Γ1 is in mmol/m2.
According to eq. (2.9) the surface excess concentration Γ1(0) can be
calculated from the slope of the plot γ νs. log C1. Accordingly, the maximum
surface concentration Γmx is derived from the linear portion of the plot of γ νs.
log C1, just before CMC, as is illustrated in Fig. 2.3.
From the maximum surface excess concentration Γmx, the minimum area per
molecule (in nm2) at the air/liquid interface can be calculated from the relation:
mxAN
AΓ
=1
min,1 (2.10)
where NA is the Avogadro’s number.
For surfactants with a single hydrophilic group, either ionic and nonionic, the
minimum area occupied by a surfactant molecule at the surface appears to be
determined by the area occupied by the hydrated hydrophilic group rather than
by the hydrophobic group. The area per molecule A1,min at the interface
provides information on the degree of packing and the orientation of the
adsorbed surfactant molecule when compared with the dimensions of the
molecule as obtained by use of molecular models.
2.2.2 Adsorption at the solid/liquid interface The adsorption of surfactants onto a solid surface from solution is an important
process in many situations, including those in which we may want to remove
unwanted materials from a system (detergency), change the wetting
characteristics of a surface (waterproofing), or stabilize a finely divided solid
system in a liquid where stability may otherwise be absent (dispersion
stabilization). In these and many other related applications of amphiphilic
materials, the ability of the surface-active molecule to situate itself at the
solid/liquid interface and produce the desired effect is strongly influenced by the
chemical natures of the components of the system (solid, surfactant, and
19
2. Fundamentals
solvent): (i) the nature of the structural groups on the solid surface, whether the
surface contains highly charged sites or essentially non-polar groupings and the
nature of the atoms of which these sites or groupings are constituted; (ii) the
molecular structure of the surfactant being adsorbed, whether it is ionic or
nonionic, and whether the hydrophobic group is long or short, straight or
branched chain, aliphatic or aromatic; and (iii) the environment of the aqueous
phase, its pH, its electrolyte content, the presence of any additives such as
short chain polar solutes (e.g. alcohol), and its temperature. Together these
factors determine the mechanism by which adsorption occurs, and the surface
excess of the surfactant at the interface.
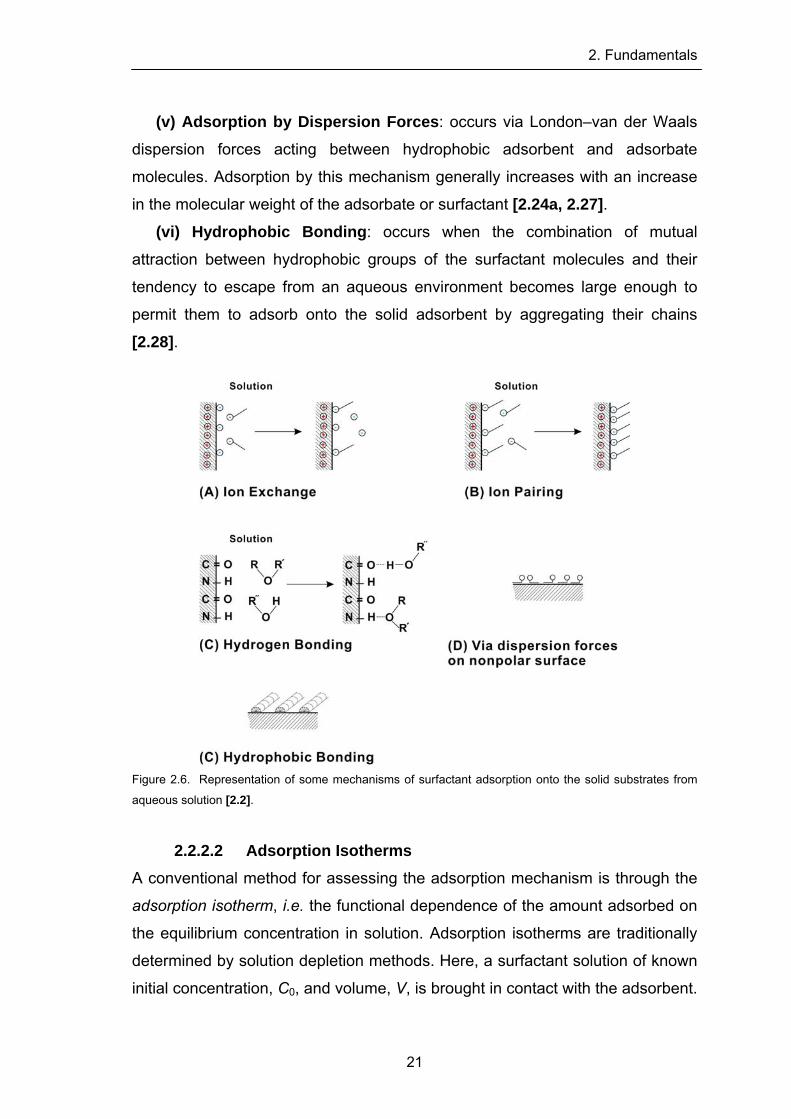
2.2.2.1 Mechanisms of surfactant adsorption In this sub-section some mechanisms by which surface-active molecules may
adsorb onto the solid substrates from aqueous solution are summarized (see
Fig. 2.6):
(i) Ion Exchange: involves replacement of protons or other ions at the
surface by equally charged surfactant ions [2.24]. (ii) Ion Pairing: adsorption of surfactant ions from solution onto oppositely
charged surface sites [2.24a, 2.24c]. (iii) Hydrogen Bonding: hydrogen bond formation between surfactant
species and the solid surface species. Normally this mechanism plays a role for
surfactants containing hydroxyl, phenolic, carboxylic and amine groups in the
head groups. For instance, adsorption of a nonionic surfactant such as
ethoxylated alcohol and sugar-based alkyl glucoside on oxide surfaces has
been proposed to involve hydrogen bonding [2.25]. In this case, the bond
formed between the surfactant functional groups and mineral surfaces should
be stronger than that formed between the mineral and interfacial water
molecules.
(iv) Adsorption by Polarization of π-Electrons: occurs when the
surfactant molecules contain electron-rich aromatic nuclei and the solid
adsorbent has strongly positive sites [2.26].
20
2. Fundamentals
(v) Adsorption by Dispersion Forces: occurs via London–van der Waals
dispersion forces acting between hydrophobic adsorbent and adsorbate
molecules. Adsorption by this mechanism generally increases with an increase
in the molecular weight of the adsorbate or surfactant [2.24a, 2.27]. (vi) Hydrophobic Bonding: occurs when the combination of mutual
attraction between hydrophobic groups of the surfactant molecules and their
tendency to escape from an aqueous environment becomes large enough to
permit them to adsorb onto the solid adsorbent by aggregating their chains [2.28].
Figure 2.6. Representation of some mechanisms of surfactant adsorption onto the solid substrates from
aqueous solution [2.2].
2.2.2.2 Adsorption Isotherms
A conventional method for assessing the adsorption mechanism is through the
adsorption isotherm, i.e. the functional dependence of the amount adsorbed on
the equilibrium concentration in solution. Adsorption isotherms are traditionally
determined by solution depletion methods. Here, a surfactant solution of known
initial concentration, C0, and volume, V, is brought in contact with the adsorbent.
21
2. Fundamentals
The system is then left to attain equilibrium, which normally takes 1-24 h. The
adsorbent are thereafter separated from the bulk solution and the surfactant
concentration is determined, thus giving the equilibrium concentration Ceq. The
adsorbed amount is then obtained from V(C0 - Ceq). This quantity is normally
expressed either per unit mass or per unit surface area of the adsorbent. The
specific surface area of the adsorbent, , can be determined by nitrogen
adsorption through a Brunauer-Emmet-Teller (BET) as will described later.
Hence, the surface excess Γ can be evaluated by the following expression
[2.29]:
sa
s
eq
maVCC )( 0 −=Γ (2.11)
where m is the total mass of the adsorbent.
Adsorption isotherms are generally used to study: (i) the nature of solute-
surface interaction, which can be qualitatively provided by the shape of the
isotherm; (ii) the amount of surfactant adsorbed per unit mass or unit area of
the solid adsorbent, that is, the surface concentration Γ of the surfactant; (iii)
the equilibrium concentration Ceq of surfactant in the liquid phase required to
produce a given surface concentration Γ; (iv) the concentration of surfactant on
the adsorbent at surface saturation Γmx; (v) the rate and extent of adsorption
(i.e., monolayer or multilayer formation); (vi) the geometric orientation of the
adsorbed molecules at the interface; and (vii) the effect of environmental
factors such as temperature, solvent composition, and pH on the adsorption
process and equilibrium.
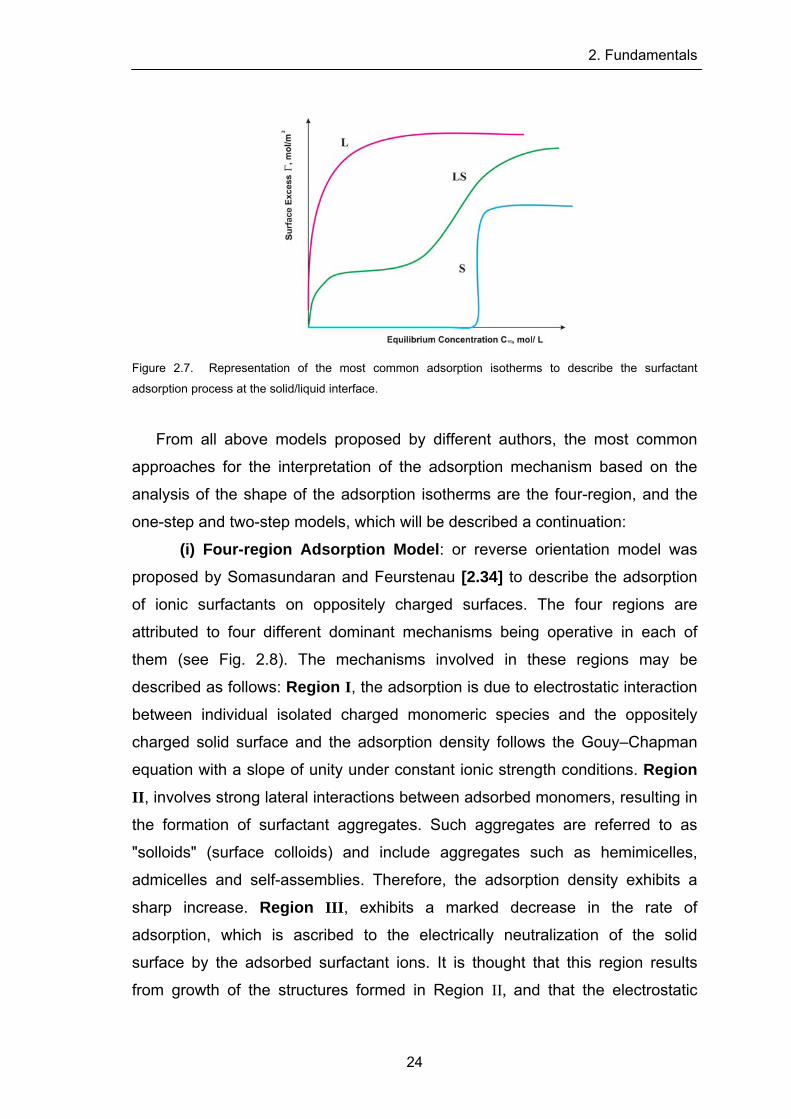
Due to the complex behavior of amphiphilic surfactant molecules at the
solid/liquid interface, several experimental adsorption isotherms of different
shapes have been reported in order to try to understand the adsorption
mechanism of the surfactant molecules on solid surfaces. Basically, adsorption
isotherms can be classified into three types according to their shape: Langmuir
type (L-type), S-type and “double plateau” type (L–S type), as shown in Figure
2.7. While the L-type adsorption can be represented by the simple Langmuir
22
2. Fundamentals
equation [2.30], the mechanisms of S and L–S types are more complex. Some
theoretical models have been developed for the description of the adsorption
isotherms of S and L–S types. These models have been based on the “two-
dimensional condensation” theory [2.31], similar to the “pseudophase
separation model” [2.32], taking into consideration the normal potential energies
as well as the surface heterogeneity. Later approaches considered the two-
dimensional adsorbed structures coexisting with monomers, monolayer and
bilayers at the solid/solution interface in the presence of the “excluded volume”
effect [2.33]. Somasundaran and Feurstenau [2.34] considered that the
electrostatic and hydrophobic lateral interactions are the major driving forces for
the adsorption of ionic surfactants on oppositely charged surfaces, and that the
adsorption mechanism of ionic surfactants on oxide surfaces can be described
by four regions (c.f. Section 2.2.2.1 for details). On the other hand, Johnson and
Nagarajan [2.35] predicted the nanostructure of cationic and nonionic surface
aggregates by comparing the equilibrium free energies for different structures
such as spheres, cylinders, and monolayers covered with hemisphere,
hemicylinder, finite disk and bilayer. This model can predict the solution
concentrations where the surface aggregates transform from one structure to
another. In addition to the above, the thermodynamics of the surface
aggregation at the solid/solution interface in equilibrium with the bulk solution
has been considered by Levitz using the grand partition function [2.36]. Another
set of work applied the self-consistent field lattice (SCFL) theory [2.37] originally
developed by Scheutjens and Fleer [2.37a] for polymer adsorption. These
physical theories of surfactant adsorption relate adsorption to fundamental
molecular parameters of the system. On the other hand, they do not yield
adsorption isotherms in a single functional form Γ = Γ(C). In contrast, the simple
“one-step” and “two-step” models developed by Gu and Zhu [2.38], represent
simple analytical expressions and have been successfully applied for L, S and
L–S type isotherms. In this model, the adsorption process is treated as
reactions between unoccupied sites and surfactant molecules.
23
2. Fundamentals
Figure 2.7. Representation of the most common adsorption isotherms to describe the surfactant
adsorption process at the solid/liquid interface.
From all above models proposed by different authors, the most common
approaches for the interpretation of the adsorption mechanism based on the
analysis of the shape of the adsorption isotherms are the four-region, and the
one-step and two-step models, which will be described a continuation:
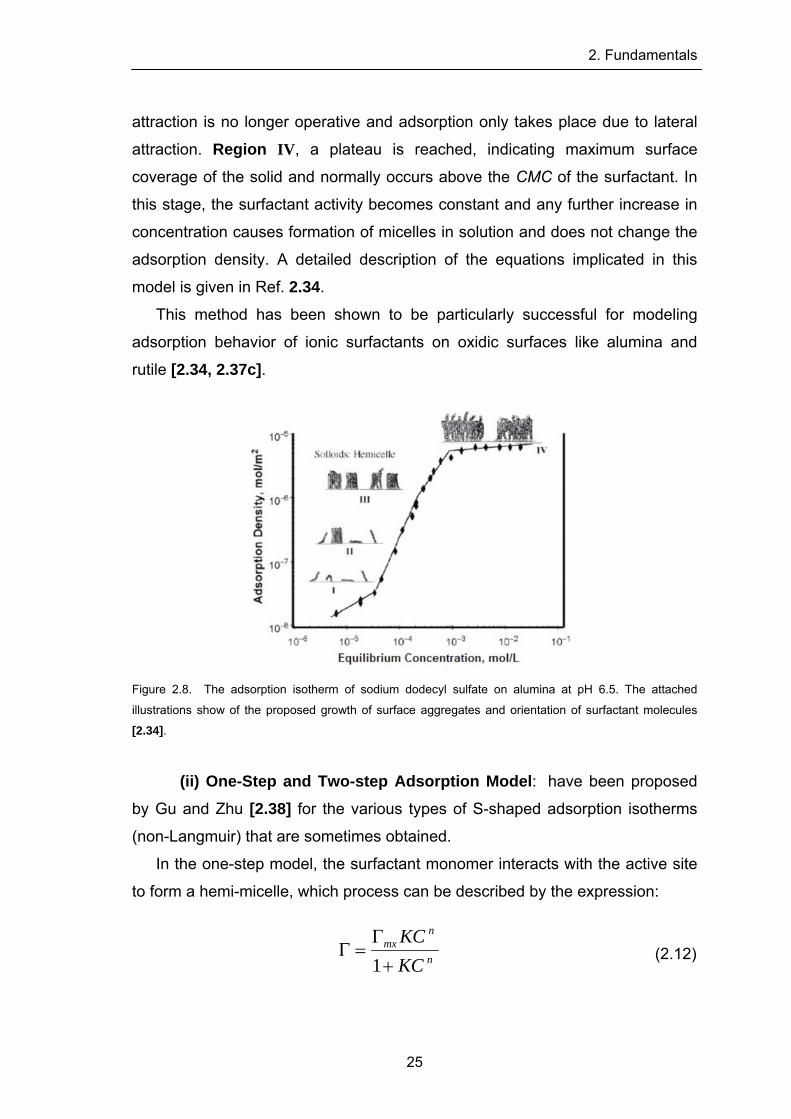
(i) Four-region Adsorption Model: or reverse orientation model was
proposed by Somasundaran and Feurstenau [2.34] to describe the adsorption
of ionic surfactants on oppositely charged surfaces. The four regions are
attributed to four different dominant mechanisms being operative in each of
them (see Fig. 2.8). The mechanisms involved in these regions may be
described as follows: Region I, the adsorption is due to electrostatic interaction
between individual isolated charged monomeric species and the oppositely
charged solid surface and the adsorption density follows the Gouy–Chapman
equation with a slope of unity under constant ionic strength conditions. Region II, involves strong lateral interactions between adsorbed monomers, resulting in
the formation of surfactant aggregates. Such aggregates are referred to as
"solloids" (surface colloids) and include aggregates such as hemimicelles,
admicelles and self-assemblies. Therefore, the adsorption density exhibits a
sharp increase. Region III, exhibits a marked decrease in the rate of
adsorption, which is ascribed to the electrically neutralization of the solid
surface by the adsorbed surfactant ions. It is thought that this region results
from growth of the structures formed in Region II, and that the electrostatic
24
2. Fundamentals
attraction is no longer operative and adsorption only takes place due to lateral
attraction. Region IV, a plateau is reached, indicating maximum surface
coverage of the solid and normally occurs above the CMC of the surfactant. In
this stage, the surfactant activity becomes constant and any further increase in
concentration causes formation of micelles in solution and does not change the
adsorption density. A detailed description of the equations implicated in this
model is given in Ref. 2.34.
This method has been shown to be particularly successful for modeling
adsorption behavior of ionic surfactants on oxidic surfaces like alumina and
rutile [2.34, 2.37c].
Figure 2.8. The adsorption isotherm of sodium dodecyl sulfate on alumina at pH 6.5. The attached
illustrations show of the proposed growth of surface aggregates and orientation of surfactant molecules
[2.34].
(ii) One-Step and Two-step Adsorption Model: have been proposed
by Gu and Zhu [2.38] for the various types of S-shaped adsorption isotherms
(non-Langmuir) that are sometimes obtained.
In the one-step model, the surfactant monomer interacts with the active site
to form a hemi-micelle, which process can be described by the expression:
n
nmx
KCKC
+Γ
=Γ1
(2.12)
25
2. Fundamentals
where Γ is the surface concentration at equilibrium concentration C, Γmx is the
limiting surfactant adsorption at high concentrations, K is the adsorption
constant in the low-affinity region, and n is the average aggregation number of
the surface aggregates.
Equation (2.12) can be transformed to the logarithmic form:
( )[ ] CnKmx loglog/log +=Γ−ΓΓ (2.13)
in order to estimate K and n by plotting log[(Γ/(Γmx - Γ)] versus log C. When
n = 1, equation 2.12 becomes the Langmuir adsorption isotherm in the form
Γ = ΓmxKC/(1+KC), where K = and , in mol/L,
at absolute temperature T, in the vicinity of room temperature and where
is free energy of adsorption at infinite dilution. If surface aggregation
occurs, then n should be greater than 1.
a/1 )/exp(3.55 RTGa oΔ=
oGΔ
The two-step model is a modified one-step model by considering the
adsorption process to occur in two steps. In the first step, the surfactant
molecules are adsorbed as individual molecules or ions at concentrations below
the critical surface aggregation concentration CSAC. And in the second step,
the adsorbed surfactant monomers act as anchors for the formation of
hemimicelle.
The general expression for the two-step model is:
)1(1)/1(
1.21
121
−
−
+++Γ
=Γ n
nmx
CkCkCknCk
(2.14)
where the k1 and k2 are the equilibrium constants for the first and second
reactions, respectively.
Both models have given successful representation of the adsorption of ionic
and nonionic surfactants on silica [2.39].
26
2. Fundamentals
2.3 Structure of the Surface Aggregates Although adsorption isotherms give indirect information about the adsorption
mechanism of amphiphilic molecules, one cannot obtain through them detailed
information about the structure of the surfactant aggregates on solid surfaces,
known as surface aggregates. In the last decades new techniques have been
developed to study these structures formed by the adsorbed surfactants. First,
indications that the adsorbed surfactant aggregates on mineral solids represent
hemi-micelles were based on wettability, electrokinetic and coagulation
experiments, [2.40]. Direct imaging using atomic force microscopy (AFM) at
surfactant concentrations above half of the CMC has recently shown that the
structures of aggregates of nonionic ethoxylated or cationic surfactants on silica
sometimes are similar to morphologies of bulk micelles and that the surface
aggregates may undergo a sphere-to-cylinder transition as the surfactant
concentration increases [2.41]. Although a majority of results from ellipsometry
[2.42], small angle neutron scattering [2.43] and neutron reflectivity [2.44] suggested that nonionic ethoxylated and cationic surfactant aggregates exist in
the form of patchy or fully covered bilayers, a few exceptions [2.45, 2.46] have
been noted using the same techniques. For example, Schulz et al. [2.45] developed a model for micelle-like surface aggregates by analyzing neutron
reflectivity data. Despert and Oberdisse [2.46a] analysed the shape of
adsorbed surface aggregates of Triton X-100 on silica nanoparticles using
small-angle neutron scattering and found that the surface aggregates represent
small micelles.
Small-angle neutron scattering (SANS) and dynamic light scattering (DLS)
have been used in the present work as the most important methods to get a
better understanding of the surface-aggregate structures of single non-ionic
surfactants and binary mixtures of them on silica nanoparticles dispersed in
aqueous solution. The choice of both techniques complies with the length scale
of interest (1-100 nm) and also they can provide structural information without
perturbing the sample. While SANS gives direct information about the size and
shape of the surface aggregates, DLS is an appropriate method to elucidate the
thickness of the surfactant layer at the particles.
27
2. Fundamentals
In the following sections, the scattering techniques used in this work will be
briefly introduced and a detailed description of them will be also given.
2.4 Scattering Techniques The scattering of light, X-rays and neutrons obeys similar laws. We recall
that the scattering arises from fluctuations of electron polarizability for light, the
electron density for X-rays and the scattering length related to the properties of
the nuclei for neutrons.
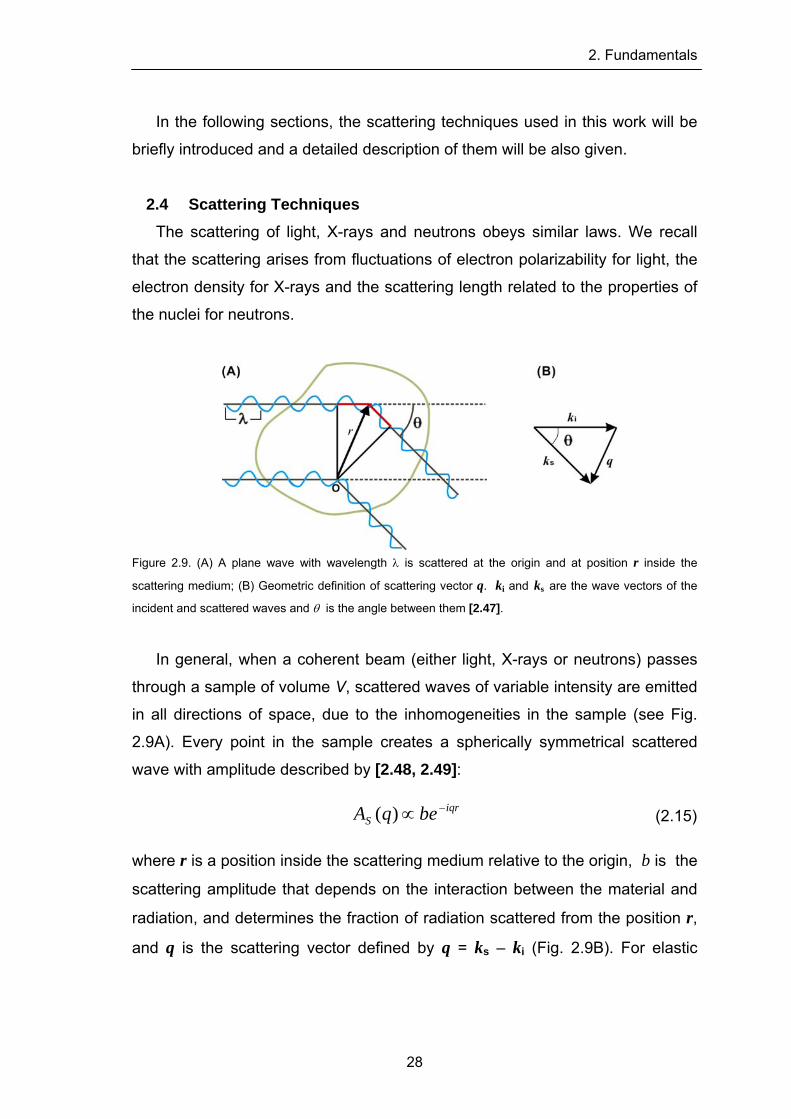
Figure 2.9. (A) A plane wave with wavelength λ is scattered at the origin and at position r inside the
scattering medium; (B) Geometric definition of scattering vector q. ki and ks are the wave vectors of the
incident and scattered waves and θ is the angle between them [2.47].
In general, when a coherent beam (either light, X-rays or neutrons) passes
through a sample of volume V, scattered waves of variable intensity are emitted
in all directions of space, due to the inhomogeneities in the sample (see Fig.
2.9A). Every point in the sample creates a spherically symmetrical scattered
wave with amplitude described by [2.48, 2.49]:
(2.15) iqrS beqA −∝)(
where r is a position inside the scattering medium relative to the origin, b is the
scattering amplitude that depends on the interaction between the material and
radiation, and determines the fraction of radiation scattered from the position r,
and q is the scattering vector defined by q = ks – ki (Fig. 2.9B). For elastic
28
2. Fundamentals
scattering |ks| = |ki| = 2π/λ, where λ the wavelength of the incident beam, and q
is expressed by:
q = |q| = (4π/λ)sin(θ/2) (2.16)
The total amplitude at q is the sum of the waves scattered by all atoms in the
sample.
2.4.1 Dynamic Light Scattering Dynamic Light Scattering, also known as Photon Correlation Spectroscopy or
Quasi-Elastic Light Scattering, can be used to determine the particle size and
the size distribution profile of small particles in suspension or in solution and
can be also used to monitor the kinetics of time-dependent processes, such as
particle aggregation.
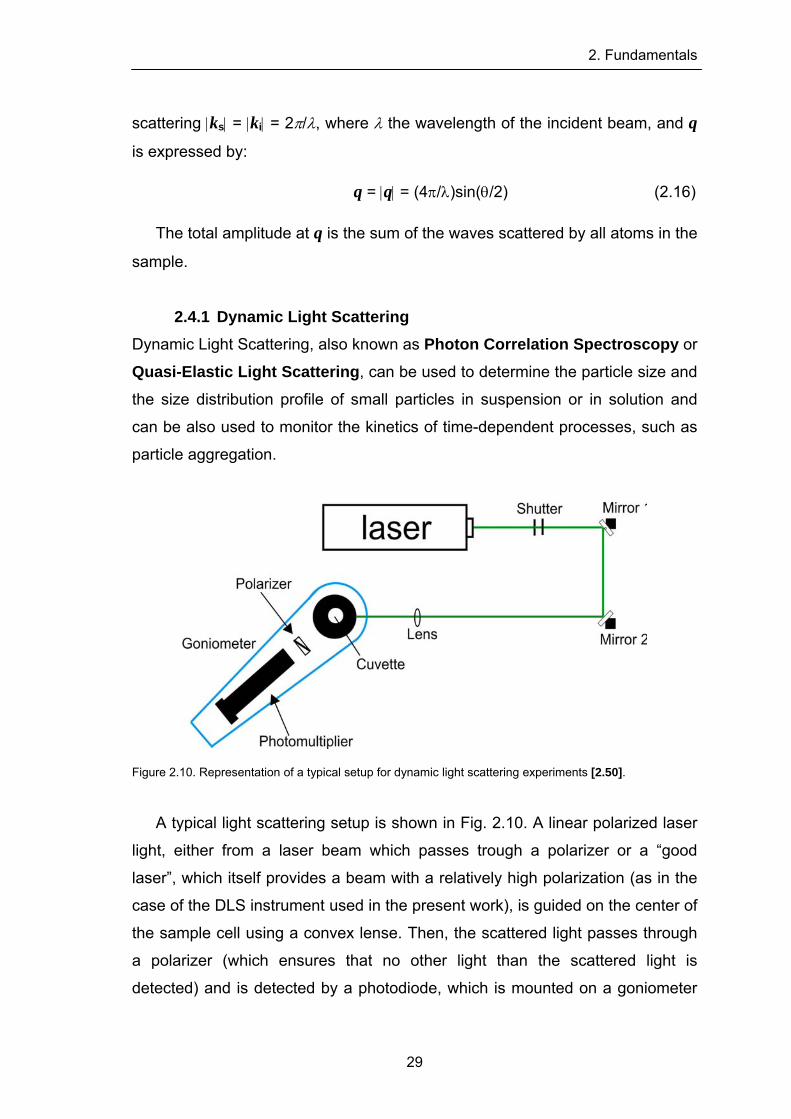
Figure 2.10. Representation of a typical setup for dynamic light scattering experiments [2.50].
A typical light scattering setup is shown in Fig. 2.10. A linear polarized laser
light, either from a laser beam which passes trough a polarizer or a “good
laser”, which itself provides a beam with a relatively high polarization (as in the
case of the DLS instrument used in the present work), is guided on the center of
the sample cell using a convex lense. Then, the scattered light passes through
a polarizer (which ensures that no other light than the scattered light is
detected) and is detected by a photodiode, which is mounted on a goniometer
29
2. Fundamentals
arm. Moreover, pinholes are used to define the optical path and hence the
scattering volume. The sample enviroment in details contains the sample cell
made of optical glass (quartz glass), which is placed in the center of a quartz
vessel. This vessel is filled with toluene, because matches the refractive index
of quartz glass and serves as temperature bath. A PT 100 thermoelement is
placed in the matching bath close to the sample cell in order to measure the
sample temperature [2.50]. As particles diffuse due to thermal motion, the scattered light undergoes
interference effects, and the scattered intensity fluctuates randomly with time.
The information about particle size is contained in the rate of decay of the
intensity fluctuations I(t,q), i.e. rapid diffusion of small particles leads to fast
decay, while slow fluctuations result from the motions of larger particles. With
modern correlator techniques, one can easily record these fluctuations in terms
of the intensity time autocorrelation function g2(τ) with the correlation time τ
[2.51]:
22 )()(
)(gI
tItI ττ
+= (2.17)
The autocorrelation function g2(τ) can be related to the normalized
correlation function of the electric field of the scattered light g1(τ) by the Siegert
relationship:
21
02 )(g)(g τββτ += (2.18)
where β0 is the baseline and β the amplitude of the correlation function, which
has the value one in a perfect experiment.
When one considers a suspension of monodisperse spherical particles, this
correlation function decays exponentially according to the following expression:
(2.19) )exp()(g1 ττ Γ−=
where the relaxation rate Γ is given by:
30
2. Fundamentals
(2.20) Dq 2=Γ
q is the magnitude of the scattering vector and D is the diffusion coefficient. This
relationship shows that the rate of decay depends on the magnitude of the
scattering vector, and thus on the scattering angle.
Real samples with a certain polydispersity have a distribution of particle
sizes and hence in the diffusion coefficients and relaxation rate. Then, g1(τ) can
not be described by a simple exponential function and the distribution function
of relaxation rates G(Γ) has to be considered [2.51]:
(2.21) ∫∞
ΓΓ−Γ=0
1 )exp()()( dGg ττ
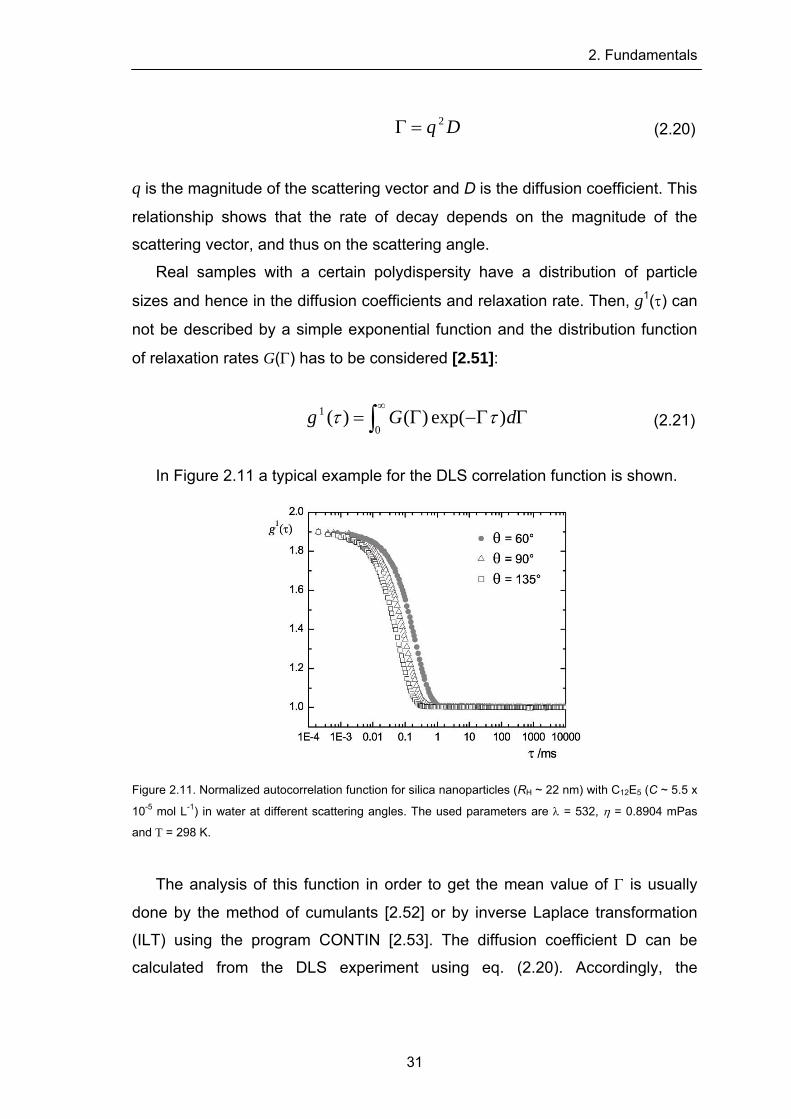
In Figure 2.11 a typical example for the DLS correlation function is shown.
Figure 2.11. Normalized autocorrelation function for silica nanoparticles (RH ~ 22 nm) with C12E5 (C ~ 5.5 x
10-5 mol L-1) in water at different scattering angles. The used parameters are λ = 532, η = 0.8904 mPas
and T = 298 K.
The analysis of this function in order to get the mean value of Γ is usually
done by the method of cumulants [2.52] or by inverse Laplace transformation
(ILT) using the program CONTIN [2.53]. The diffusion coefficient D can be
calculated from the DLS experiment using eq. (2.20). Accordingly, the
31
2. Fundamentals
hydrodynamic radius RH can be derived making use of the Stokes-Einstein
equation:
DkTRH πη6
= (2.22)
with η being the viscosity, k the Boltzmann constant and T the absolute
temperature.
2.4.2 Small-Angle Neutron Scattering While light scattering experiments deal with high wavelengths (typical in the
visible range) the wavelength of thermal neutrons is of the order of atomic
dimensions, i.e. in the range of few Å. This makes neutron scattering well-suited
to study structures on a local length scale in the range of atomic or molecular
distances.
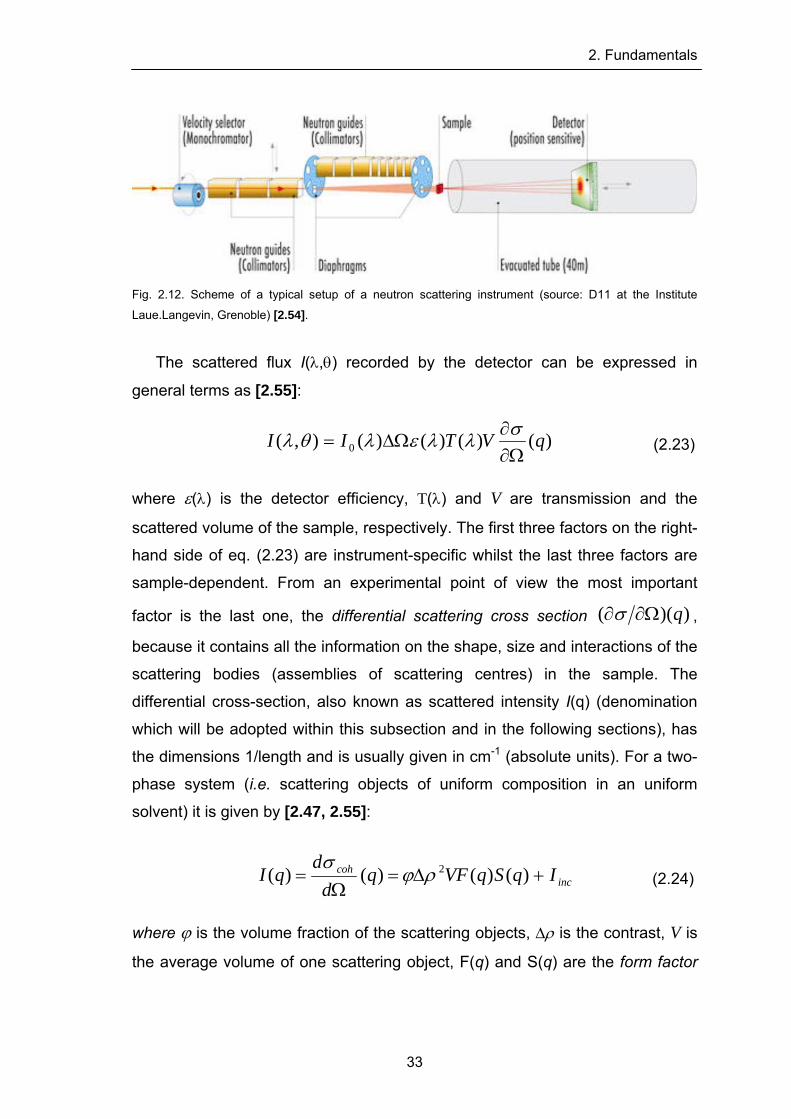
A general schematic representation of the setup of a SANS instrument is
shown in Fig. 2.12, where the basic elements of the instrument include:
monochromator, i.e. velocity selector, collimator, sample and detector.
Neutrons with a desired wavelength (typical in a range of 0.4 nm to 2nm) are
separated from the polychromatic neutron beam, generated by the fission
process, using a velocity selector. The monochromatic neutron beam passes a
collimation system, which has a comparable function as lenses in optical
setups. The collimated radiation of neutrons with flux I0(λ) is incident on the
sample, which is placed as close as possible behind the collimation system.
This incident neutron radiation is transmitted by the sample, adsorbed and
scattered. The flux of neutrons scattered into a solid angle of the detector
element ΔΩ are recorded by a two-dimensional multidetector, which is
positioned at some distance L and scattering angle from the sample. The
detector is mounted in a cylindrical, evacuated tube and can move parallel to
the flight direction of the neutrons to cover a broad range of momentum transfer
q. If the detector is far away from the sample, scattering in a lower angle regime
can be resolved and therefore a lower-q range can be studied.
32
2. Fundamentals
Fig. 2.12. Scheme of a typical setup of a neutron scattering instrument (source: D11 at the Institute
Laue.Langevin, Grenoble) [2.54].
The scattered flux I(λ,θ) recorded by the detector can be expressed in
general terms as [2.55]:
)()()()(),( 0 qVTIIΩ∂∂
ΔΩ=σλλελθλ (2.23)
where ε(λ) is the detector efficiency, T(λ) and V are transmission and the
scattered volume of the sample, respectively. The first three factors on the right-
hand side of eq. (2.23) are instrument-specific whilst the last three factors are
sample-dependent. From an experimental point of view the most important
factor is the last one, the differential scattering cross section ))(( qΩ∂∂σ ,
because it contains all the information on the shape, size and interactions of the
scattering bodies (assemblies of scattering centres) in the sample. The
differential cross-section, also known as scattered intensity I(q) (denomination
which will be adopted within this subsection and in the following sections), has
the dimensions 1/length and is usually given in cm-1 (absolute units). For a two-
phase system (i.e. scattering objects of uniform composition in an uniform
solvent) it is given by [2.47, 2.55]:
inccoh IqSqVFq
dd
qI +Δ=Ω
= )()()()( 2ρϕσ
(2.24)
where ϕ is the volume fraction of the scattering objects, Δρ is the contrast, V is
the average volume of one scattering object, F(q) and S(q) are the form factor
33
2. Fundamentals
and the structure factor, respectively, and Iinc denotes the incoherent scattering
background.
For dilute samples S(q) with volume fractions ϕ not greater than
approximately 1%, S(q) ≈ 1 and can thus be omitted from eq. (2.24). In this
case the scattered intensity after substraction of Iinc is given by:
(2.25) )()( 2 qVFqI ρϕΔ=
In order to simplify the analysis of the scattering profile of the samples
studied in the present work, dilute solutions were used to determine the size
and shape of surface aggregates as well as the shape and size of the silica
nanoparticles and the micelles formed by the surfactants in aqueous solution.
Accordingly, this analysis is based on eq. (2.25), where the inter-particles
interactions are assumed to be negligible, i.e. S(q) = 1. In the following, the
different factors on the right-hand side of eq. (2.25) will be discussed.
The Contrast factor, Δρ
The contrast Δρ is given by the difference in neutron scattering length density
between the suspended or dissolved particles, and the surrounding medium or
matrix, i.e. Δρ = ρparticle - ρsolvent, where the scattering length densities ρ are
usually expressed in units of cm-2.
The value of the scattering length density ρ for each component of the
system can be calculated by the sum of all different coherent neutron scattering
length bi of entities “i” inside the molecular volume V of the referred component:
Vbi∑=ρ (2.26)
A table with the neutron scattering length b of each atomic nuclei is given by
Sears in Ref. 2.56.
For a two-phase system, if Δρ = 0 then from eqs. (2.24) and (2.25) I(q) is
also zero and there is no small-angle scattering. When this condition is met the
scattering particles are said to be at contrast match with the solvent. Since the
34
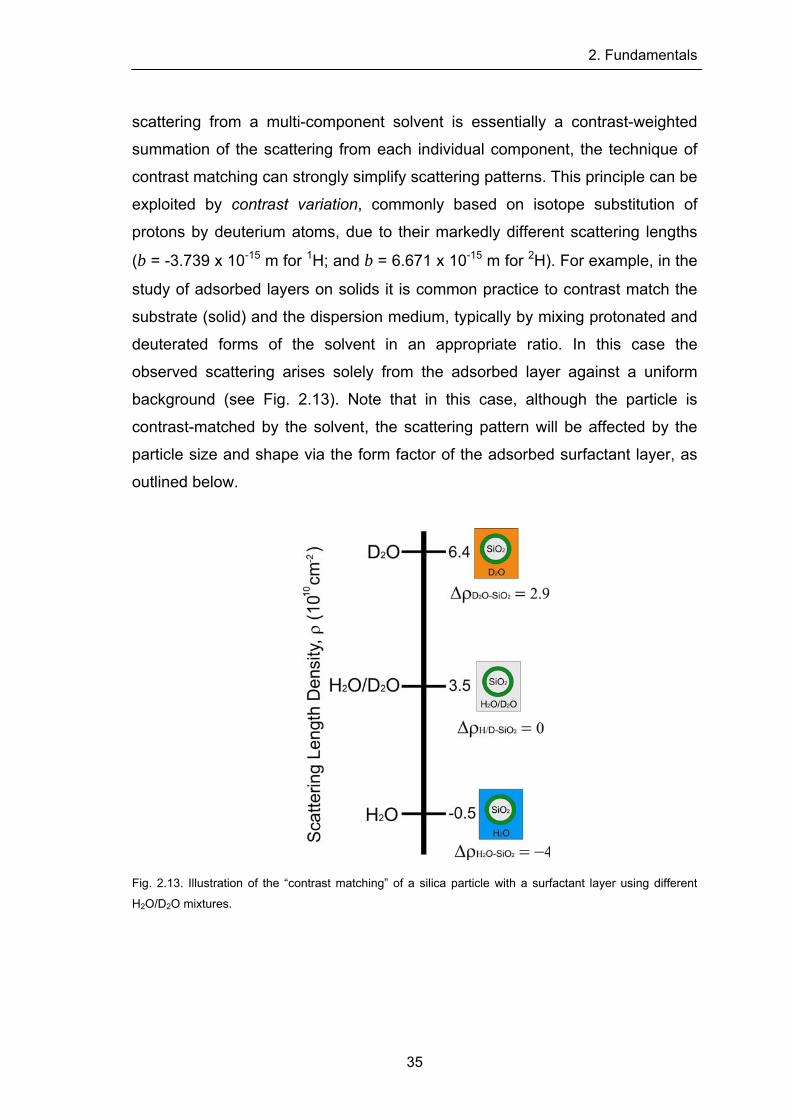
2. Fundamentals
scattering from a multi-component solvent is essentially a contrast-weighted
summation of the scattering from each individual component, the technique of
contrast matching can strongly simplify scattering patterns. This principle can be
exploited by contrast variation, commonly based on isotope substitution of
protons by deuterium atoms, due to their markedly different scattering lengths
(b = -3.739 x 10⁻¹⁵ m for 1H; and b = 6.671 x 10⁻¹⁵ m for 2H). For example, in the
study of adsorbed layers on solids it is common practice to contrast match the
substrate (solid) and the dispersion medium, typically by mixing protonated and
deuterated forms of the solvent in an appropriate ratio. In this case the
observed scattering arises solely from the adsorbed layer against a uniform
background (see Fig. 2.13). Note that in this case, although the particle is
contrast-matched by the solvent, the scattering pattern will be affected by the
particle size and shape via the form factor of the adsorbed surfactant layer, as
outlined below.
Fig. 2.13. Illustration of the “contrast matching” of a silica particle with a surfactant layer using different
H2O/D2O mixtures.
35
2. Fundamentals
Form Factor, F(q) The form factor is a function that describes how I(q) is modulated by
interference effects between radiation scattered from different portions of the
scattering object. As a consequence, F(q) is very dependent on the shape of
the scattering object. F(q) is termed as normalized particle form factor, when its
low-q limit is 1, i.e. F(q) → 1 as q → 0. F(q) can be calculated by Fourier
transformation of the density distribution of the given particle. Below we
introduce the form factor functions used within this work:
(i) Homogeneous Sphere. For monodisperse spheres of radius R, F(q) can be
expressed as [2.57, 2.58]:
2)()( qRfqF = (2.27)
with 3)()cos()sin(3)(
xxxxxf −
=
If the scattering objects are polydisperse in size, and if polydispersity can be
represented by a log-normal distribution with parameters RS and polydispersity
σ [2.39c, 2.46a]:
⎟⎟⎠
⎞⎜⎜⎝
⎛−=
SS R
RRVNRRP 2
2 ln2
1exp2
/),,(σσπ
σ (2.28)
where N/V is the number density of the scattering objects. The form factor
with polydispersity is calculated by integration:
dRRqFRRPqF S ),(),,()( ∫= σ (2.29)
The form factor function for monodisperse spheres as well as for
polydisperse spheres with a log-normal size distribution integrated in eq. (2.25)
is shown as a function of q in Figure 2.14. This figure illustrates that several key
features of spherical and more generally globular objects can be determined by
SANS measurements.
36
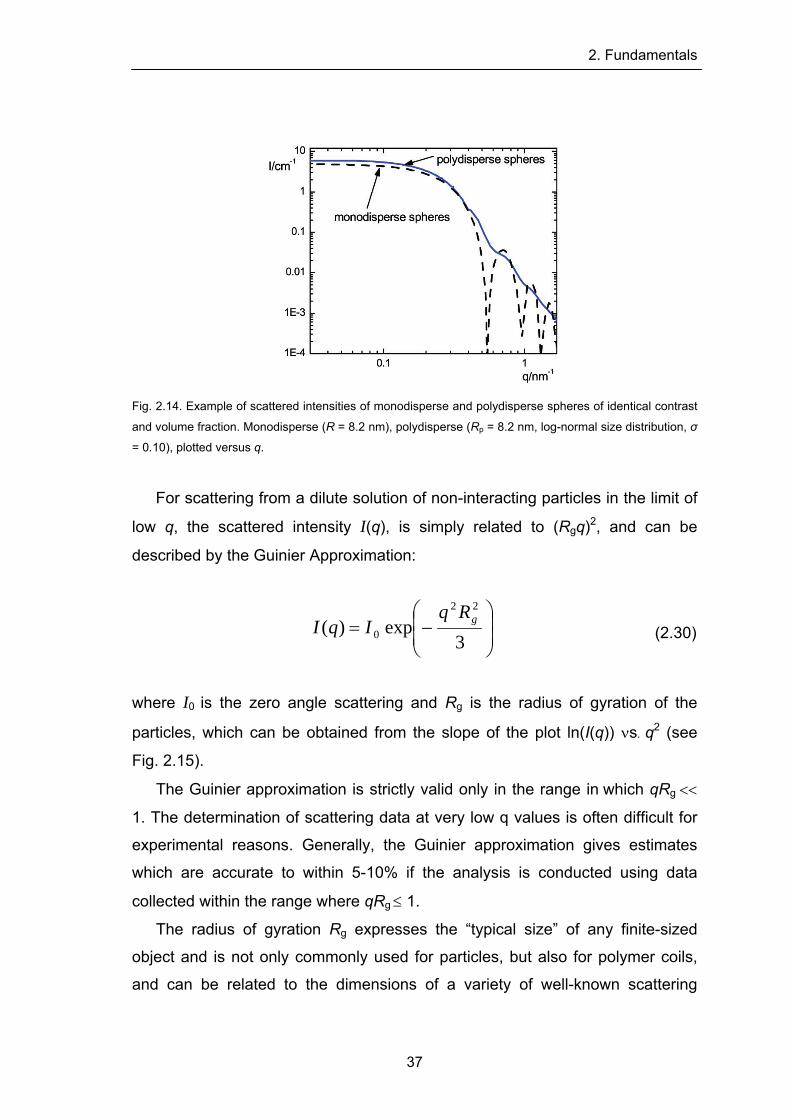
2. Fundamentals
Fig. 2.14. Example of scattered intensities of monodisperse and polydisperse spheres of identical contrast
and volume fraction. Monodisperse (R = 8.2 nm), polydisperse (Rp = 8.2 nm, log-normal size distribution, σ
= 0.10), plotted versus q.
For scattering from a dilute solution of non-interacting particles in the limit of
low q, the scattered intensity I(q), is simply related to (Rgq)2, and can be
described by the Guinier Approximation:
⎟⎟⎠
⎞⎜⎜⎝
⎛−=
3exp)(
22
0gRq
IqI (2.30)
where I0 is the zero angle scattering and Rg is the radius of gyration of the
particles, which can be obtained from the slope of the plot ln(I(q)) νs. q2 (see
Fig. 2.15).
The Guinier approximation is strictly valid only in the range in which qRg <<
1. The determination of scattering data at very low q values is often difficult for
experimental reasons. Generally, the Guinier approximation gives estimates
which are accurate to within 5-10% if the analysis is conducted using data
collected within the range where qRg ≤ 1.
The radius of gyration Rg expresses the “typical size” of any finite-sized
object and is not only commonly used for particles, but also for polymer coils,
and can be related to the dimensions of a variety of well-known scattering
37
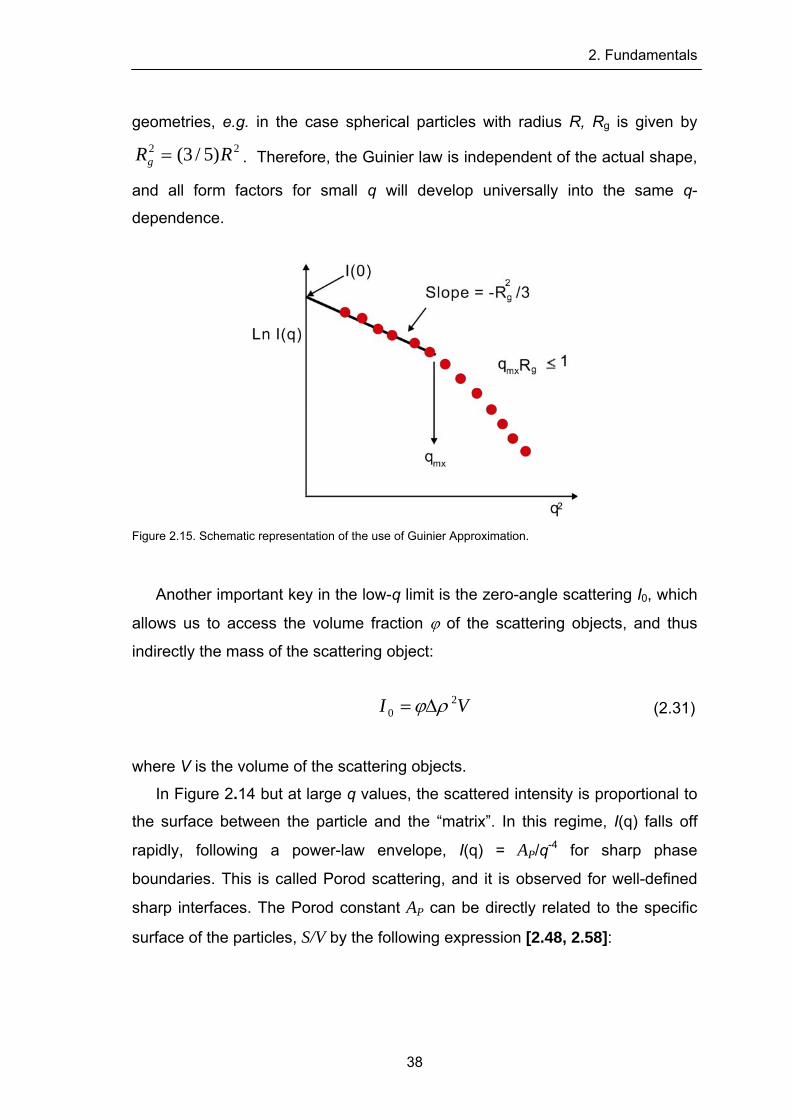
2. Fundamentals
geometries, e.g. in the case spherical particles with radius R, Rg is given by
. Therefore, the Guinier law is independent of the actual shape,
and all form factors for small q will develop universally into the same q-
dependence.
22 )5/3( RRg =
Figure 2.15. Schematic representation of the use of Guinier Approximation.
Another important key in the low-q limit is the zero-angle scattering I0, which
allows us to access the volume fraction ϕ of the scattering objects, and thus
indirectly the mass of the scattering object:
(2.31) VI 20 ρϕΔ=
where V is the volume of the scattering objects.
In Figure 2.14 but at large q values, the scattered intensity is proportional to
the surface between the particle and the “matrix”. In this regime, I(q) falls off
rapidly, following a power-law envelope, I(q) = AP/q-4 for sharp phase
boundaries. This is called Porod scattering, and it is observed for well-defined
sharp interfaces. The Porod constant AP can be directly related to the specific
surface of the particles, S/V by the following expression [2.48, 2.58]:
38
2. Fundamentals
VSAP
22 ρπΔ= (2.32)
In the case of spheres, the specific surface can be easily calculated from the
radius and volume fraction of spheres, S/V = 3ϕ/R, and vice versa. To
summarize, the radius R of monodisperse spheres can be determined from I(q)
in the Guinier regime at low q, and from the Porod decay at high q. If these
numbers agree, one may be quite sure of the spherical nature of the scattering
objects. In contrast if they are in strong disagreement, there are different
possible explanations: deviations from sphericity, or polydispersity, or both. An
example of the scattering profile for polydisperse spheres is also shown in
Figure 2.14. The contribution of different ensemble averages to different parts of
the intensity leads to an increase in the apparent particle volume (given by the
low-angle limit, proportional to ⟨V2⟩/⟨V⟩, where the brackets ⟨ ⟩ denote the
average over the size distribution), but it also affects the Guinier domain (its
square is given by ⟨R8⟩/⟨R6⟩), and the radius deduced from the Porod regime
⟨R3⟩/⟨R2⟩. Moreover, the oscillations of the form factor are almost completely
wiped out by polydispersity [2.58].
2142
6
82 σeR
R
RR SG
== (2.33)
2/5
2
32σeR
R
RR SP == (2.34)
It is important to notice that different assemblies of particles can give very
similar in theory even identical – scattering profiles I(q). For example,
polydisperse spheres and ellipsoids, may yield the same I(q). This is due to the
loss of the phase information of the radiation when measuring its intensity
instead of its amplitude. Fitting of scattering data will therefore never give a
unique solution. One way out of this dilemma is cross-checking with other
techniques, like direct imaging (TEM, etc.). Another way is to concentrate on
39
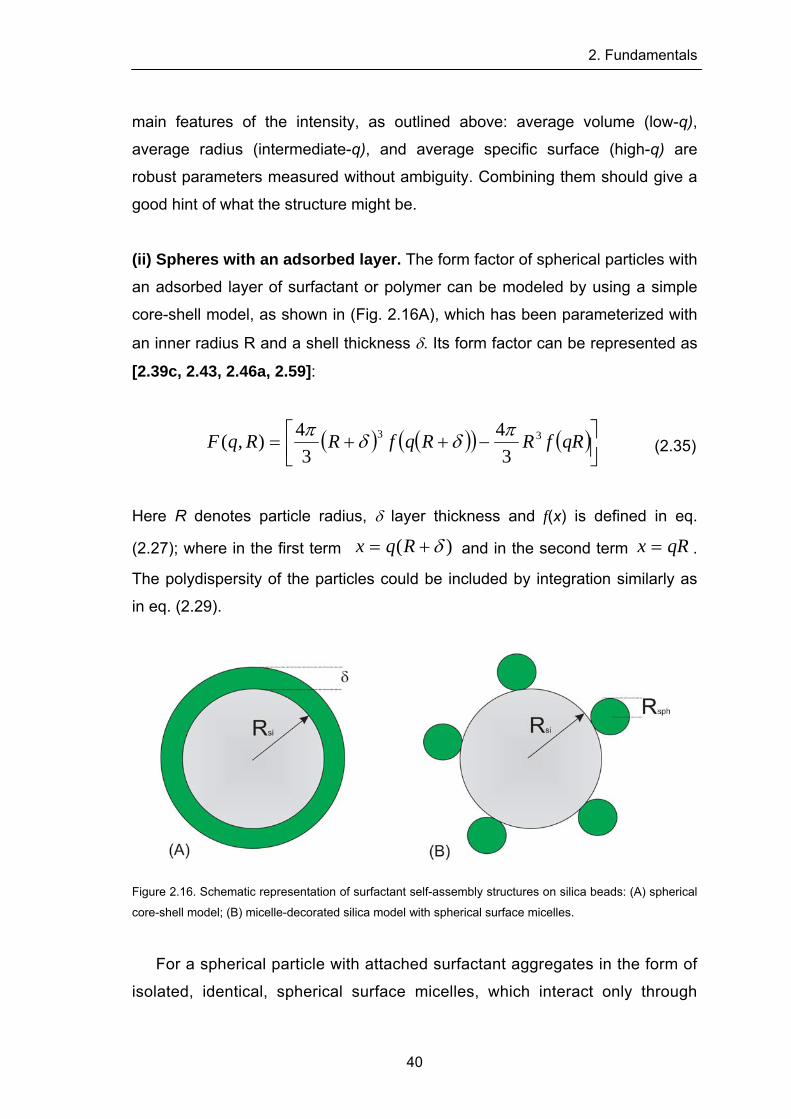
2. Fundamentals
main features of the intensity, as outlined above: average volume (low-q),
average radius (intermediate-q), and average specific surface (high-q) are
robust parameters measured without ambiguity. Combining them should give a
good hint of what the structure might be.
(ii) Spheres with an adsorbed layer. The form factor of spherical particles with
an adsorbed layer of surfactant or polymer can be modeled by using a simple
core-shell model, as shown in (Fig. 2.16A), which has been parameterized with
an inner radius R and a shell thickness δ. Its form factor can be represented as
[2.39c, 2.43, 2.46a, 2.59]:
( ) ( )( ) ( )⎥⎦⎤
⎢⎣⎡ −++= qRfRRqfRRqF 33
34
34),( πδδπ
(2.35)
Here R denotes particle radius, δ layer thickness and f(x) is defined in eq.
(2.27); where in the first term )( δ+= Rqx and in the second term .
The polydispersity of the particles could be included by integration similarly as
in eq. (2.29).
qRx =
Figure 2.16. Schematic representation of surfactant self-assembly structures on silica beads: (A) spherical
core-shell model; (B) micelle-decorated silica model with spherical surface micelles.
For a spherical particle with attached surfactant aggregates in the form of
isolated, identical, spherical surface micelles, which interact only through
40
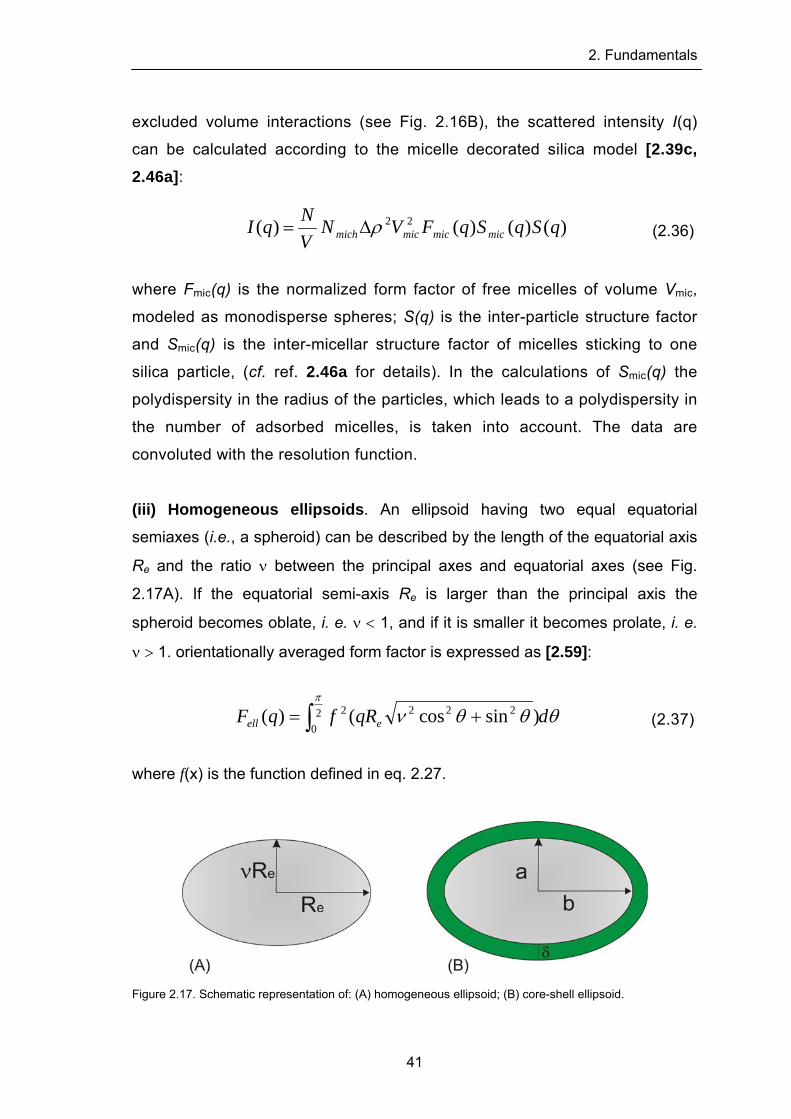
2. Fundamentals
excluded volume interactions (see Fig. 2.16B), the scattered intensity I(q)
can be calculated according to the micelle decorated silica model [2.39c, 2.46a]:
)()()()( 22 qSqSqFVNVNqI micmicmicmich ρΔ= (2.36)
where Fmic(q) is the normalized form factor of free micelles of volume Vmic,
modeled as monodisperse spheres; S(q) is the inter-particle structure factor
and Smic(q) is the inter-micellar structure factor of micelles sticking to one
silica particle, (cf. ref. 2.46a for details). In the calculations of Smic(q) the
polydispersity in the radius of the particles, which leads to a polydispersity in
the number of adsorbed micelles, is taken into account. The data are
convoluted with the resolution function.
(iii) Homogeneous ellipsoids. An ellipsoid having two equal equatorial
semiaxes (i.e., a spheroid) can be described by the length of the equatorial axis
Re and the ratio ν between the principal axes and equatorial axes (see Fig.
2.17A). If the equatorial semi-axis Re is larger than the principal axis the
spheroid becomes oblate, i. e. ν < 1, and if it is smaller it becomes prolate, i. e.
ν > 1. orientationally averaged form factor is expressed as [2.59]:
θθθνπ
dqRfqF eell ∫ += 20
2222 )sincos()( (2.37)
where f(x) is the function defined in eq. 2.27.
Figure 2.17. Schematic representation of: (A) homogeneous ellipsoid; (B) core-shell ellipsoid.
41
2. Fundamentals
(iv) Ellipsoids with an adsorbed layer. For a particle of ellipsoidal shape
having two equal equatorial semiaxes which is coated by a homogeneous layer
of thickness δ, assumed to be the same along the short and long axes (see Fig.
2.17B), the form factor is given by [2.59]:
⎥⎦
⎤⎢⎣
⎡Δ+
⎥⎥⎦
⎤
⎢⎢⎣
⎡Δ= −−
t
ttsolsh
p
ppshp x
xjVxxj
VqF )(3)(3),( ρρμ (2.38)
where μ is a orientation variable related to spatial average of the ellipsoid over
all possible orientations, equal to the cosine of the angle between q and the
direction of the spheroid major axis parameter, and the function j(x), and
parameters xp, xδ Vp, Vt are given by [2.59]:
2)()cos()sin()(
xxxxxj −
= (2.39)
)1( 2222 μμ −+= baqx p (2.40)
)1()()( 2222 μδμδ −+++= baqxt (2.41)
2
34 abV p π= (2.42)
2))((
34 δδπ ++= baVt (2.43)
) Wormlike micelles. The form factor of wormlike micelles with cylindrical
(vcross-section with radius Rcore, Kuhn-length l and contour length L was used in
this work to model the scattering profile of aqueous solutions of the surfactant
pentaethylene glycol monododecyl ether (C12E5). In this model the form factor
for worm-like micelles are approximated by the form factor of the Kholodenko-
worm [2.59], where the scattering length density profile across the worm
egments is described by that of a rod-like micelle:
42
2. Fundamentals
),,,(),,(),,,( gcorecswormcorecore RRqFLlqFLlRqF δ= (2.44)
e contribution of the worm-like conformation of the micelle Fworm (q, l, L) is
th
described by the equation of Kholodenko for worm-like structures given in ref.
2.60. The contribution of the cross-section Fcs is given by:
2)(2),,,( ⎥⎦
⎤⎢⎣
⎡=
core
coregcorecs qR
qRJRRqF δ (2.45)
nd J(x) is the first order Bessel function.
Cylindrical micelles. The form factor of cylindrical micelles with circular
12 12 2
(2.46)
here, for example:
a
(vi) cross-section endcaps (see Fig. 2.18) was used in this work to model the
scattering profile of aqueous solutions of the surfactant mixtures of
dimethyldodecylamine-N-oxide (C DAO) and the alkyl maltoside β-C G . The
scattering from cylindrical micelles with a core (R, L) containing the hydrocarbon
group and a shell ΔR containing the hydrated head group is given by [2.59]:
dxxRLRRqfxLRqfqI solvshellcylshellccylcyl2
1
0
)),2,,(),,,,(()( Δ+Δ+Δ+Δ= −−∫ ρρ
w
2/)2/sin(
1)1(2),,,,(
2
22
qLxqLx
xqRxqRJLRxLRqf shellccyl
−
−Δ=Δ −ρπρ (2.47)
nd J(x) is the first order Bessel function.
tructure Factor in interacting systems, S(q)
s how I(q) is modulated by
a
S
The structure factor is a function that describe
interference effects between radiation scattered by different scattering bodies.
Consequently it is dependent on the degree of local order in the sample and
43
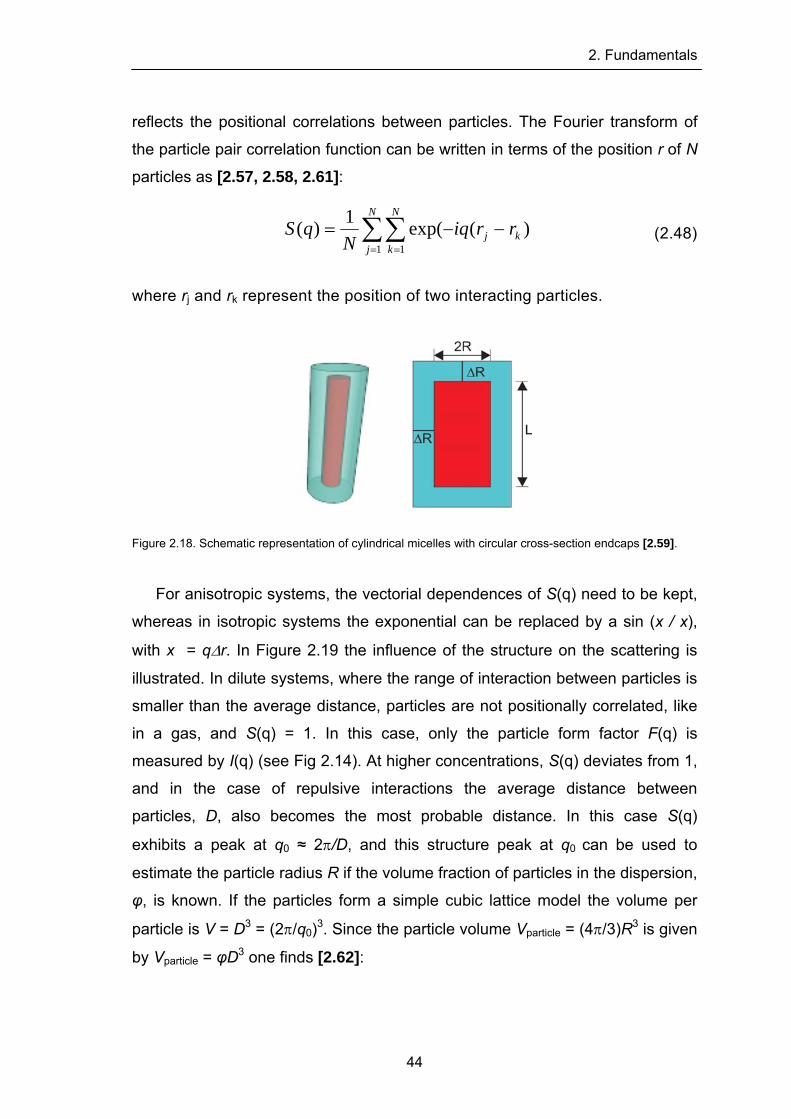
2. Fundamentals
reflects the positional correlations between particles. The Fourier transform of
the particle pair correlation function can be written in terms of the position r of N
particles as [2.57, 2.58, 2.61]:
∑∑= =
−−=N
j
N
kkj rriq
NqS
1 1
)(exp(1)( (2.48)
where rj and rk represent the position of two interacting particles.
Figure 2.18. Schematic representation of cylindrical micelles with circular cross-section endcaps [2.59].
For anisotropic systems, the vectorial dependences of S(q) need to be kept,
whereas in isotropic systems the exponential can be replaced by a sin (x / x),
with x = qΔr. In Figure 2.19 the influence of the structure on the scattering is
illustrated. In dilute systems, where the range of interaction between particles is
smaller than the average distance, particles are not positionally correlated, like
in a gas, and S(q) = 1. In this case, only the particle form factor F(q) is
measured by I(q) (see Fig 2.14). At higher concentrations, S(q) deviates from 1,
and in the case of repulsive interactions the average distance between
particles, D, also becomes the most probable distance. In this case S(q)
exhibits a peak at q0 ≈ 2π/D, and this structure peak at q0 can be used to
estimate the particle radius R if the volume fraction of particles in the dispersion,
φ, is known. If the particles form a simple cubic lattice model the volume per
particle is V = D3 = (2π/q0)3. Since the particle volume Vparticle = (4π/3)R3 is given
by Vparticle = φD3 one finds [2.62]:
44
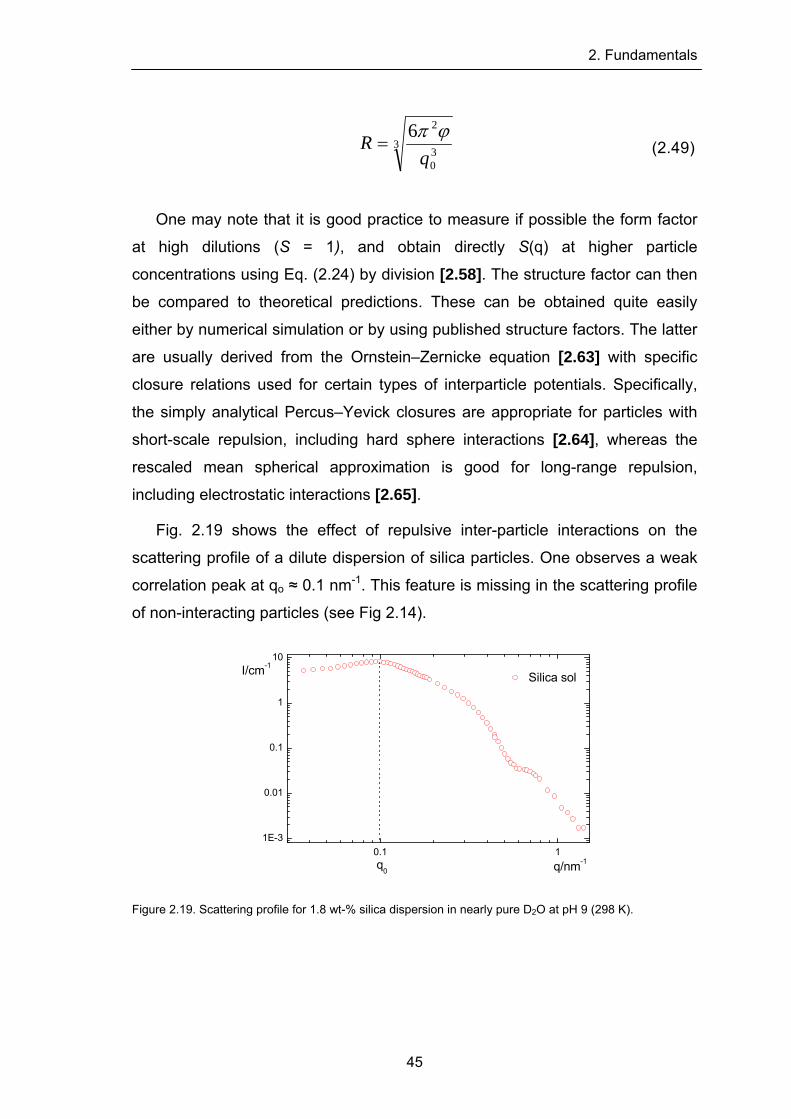
2. Fundamentals
330
26q
R ϕπ= (2.49)
One may note that it is good practice to measure if possible the form factor
at high dilutions (S = 1), and obtain directly S(q) at higher particle
concentrations using Eq. (2.24) by division [2.58]. The structure factor can then
be compared to theoretical predictions. These can be obtained quite easily
either by numerical simulation or by using published structure factors. The latter
are usually derived from the Ornstein–Zernicke equation [2.63] with specific
closure relations used for certain types of interparticle potentials. Specifically,
the simply analytical Percus–Yevick closures are appropriate for particles with
short-scale repulsion, including hard sphere interactions [2.64], whereas the
rescaled mean spherical approximation is good for long-range repulsion,
including electrostatic interactions [2.65].
Fig. 2.19 shows the effect of repulsive inter-particle interactions on the
scattering profile of a dilute dispersion of silica particles. One observes a weak
correlation peak at qo ≈ 0.1 nm-1. This feature is missing in the scattering profile
of non-interacting particles (see Fig 2.14).
0.1 11E-3
0.01
0.1
1
10
q0
I/cm-1
q/nm-1
Silica sol
Figure 2.19. Scattering profile for 1.8 wt-% silica dispersion in nearly pure D2O at pH 9 (298 K).
45
2. Fundamentals
References of Chapter 2 [2.1] Tadros, T. F., Applied Surfactants, 2005, 1st ed., Wiley VCH: UK.
[2.2] Rosen, M.J., Surfactants and Interfacial Phenomena, 2004, 3rd ed., Wiley Interscience,
New York.
[2.3] Lindman, B. in Handbook of Applied Surface and Colloid Chemistry, Vol. 1, 2002, 1st ed.,
ed. K. Holmberg, John Wiley & Sons, LTD, England, chap. 19, pp 421-442.
[2.4] Adam, N. K. J. Phys. Chem. 1925, 29, 87-101.
[2.5] Hartley, G. S., Aqueous Solutions of Paraffin Chain Salts, 1936, Hermann and Cie, Paris.
[2.6] (a) Clifford, J.; Pethica, B. A. Trans. Farady Soc. 1964, 60, 1483-1490. (b) Clifford, J.
Trans. Faraday Soc. 1965, 61, 1276-1282.
[2.7] (a) Tanford, C. J. Phys. Chem. 1972, 76, 3020-3024. (b) Tanford C. J. Phys. Chem. 1974,
78, 2469-2479. (c) Tanford C. Proc. Nat. Acad. Sci USA 1974, 71, 1811-1815.
[2.8] (a) Israelachvili, J. N.; Mitchell, D. J.; and Ninham, B.W., J. Chem. Soc. Faraday Trans. 1
1976, 72, 1525-1568. (b) Israelachvili, J. N.; Mitchell, D. J.; Ninham, B.W. Biochm. Biophys.
Acta 1977, 470, 185-201.
[2.9] Reiss-Husson, F.; Luzzati, V. J. Phys. Chem. 1964, 68, 3504-3511.
[2.10] Ikeda, S.; Hayashi, S.; Imae, T. J. Phys. Chem. 1981, 85, 106-112.
[2.11] Ranganathan, R.; Peric, M.; Medina, R.; Garcia, U.; Bales, B. L. Langmuir 2001, 17,
6765-6770.
[2.12] Zhang, W.; Li, G.; Mu, J.; Shen, Q.; Zheng, L.; Liang, H.; Wu. C. Chinese Science
Bulletin 2000, 45, 1854-1857.
[2.13] Acharya, D. P.; Sato, T.; Kaneko, M.; Singh, Y.; Kunieda, H. J. Phys. Chem. B 2006,
110, 754-760.
[2.14] (a) Funasaki, N. In Mixed surfactant systems, 1993, ed. K. Ogino, M. Abe, Surfactant
Science Series 46; Dekker: New York, chap. 5, pp 145-188. (b) Barthélémy, P.; Tomao, V.;
Selb, J.; Chaudier, Y.; Pucci, B. Langmuir 2002, 18, 2557-2563.
[2.15] (a) Meguro, K.; Muto, Y.; Sakurai, F.; Esumi, K. In Phenomena in mixed surfactant
systems, 1986, ed. J. F. Scamehorn, ACS Symposium Series 311; American Chemical Society:
Washington, DC, chap. 4, pp 61-67. (b) Villeneuve, M.; Nomura, T.; Matsuki, H.; Kaneshina, S.;
Aratono M. J. Colloid Interface Sci. 2001, 234,127-136.
[2.16] Shinoda, K. J. Phys. Chem. 1954, 58, 541-544.
[2.17] Clint, J. H. J. Chem. Soc., Faraday Trans. 1 1975, 71, 1327-1334.
[2.18] Rubingh, D. N. In Solution Chemistry of Surfactants, Vol. 1, 1979, ed. K. L. Mittal,
Plenum: New York, pp 354.
[2.19] Rosen, M. J.; Hua, X. Y. J. Colloid Interface Sci. 1982, 90, 212-219.
[2.20] (a) Nagarajan, R. Langmuir 1985, 1, 331-341. (b) Hall, D. G.; Huddleston, R. W. Colloids
Surf. 1985, 13, 209-219.
[2.21] (a) Rubingh, D. N. in Solution Chemistry of Surfactants, Vol. 1, 1979, 1st ed., ed. K. L.
Mittal, Plenum, New York, pp 337-354. (b) Rosen, M. J.; Hua, X. Y. J. Colloid Interface Sci.
46
2. Fundamentals
1982, 86, 164-172. (c) Hines, J. D.; Thomas, R. K.; Garrett, P. R.; Rennie, G. K.; Penfold J. J.
Phys. Chem. B 1997, 101, 9215-9223. (d) Zhou, Q.; Rosen, M. J. Langmuir 2003, 19, 4555-
4562.
[2.22] Gu, Ben; Rosen, M. J. J. Colloid Interface Sci. 1989, 129, 537-553.
[2.23] Gibbs, J. W., The Collected Works of J. W. Gibbs, Vol. 1, 1928 Longmans, Green,
London, pp. 119.
[2.24] (a) Law, J. P.; Kunze, G. W. Soil Sci. Soc. Am. Proc. 1966, 30, 321-327. (b) Wakamatsu,
T.; D.W. Fuerstenau, In Adsorption from Aqueous Solution, 1968, ed. W. J. Weber, and E.
Matijevic, American Chemical Society, Washington, DC, pp. 161–172. (c) Rupprecht, H.; Liebl,
H. Kolloid Z. Z. Polym. 1972, 250, 719-723.
[2.25] (a) Doren, A.; Vargas, D.; Goldfrab, J. Inst. Min. Metall. Trans., Sect. C 1975, 84, 34-39.
(b) Somasundaran, P.; Snell, E. D.; Xu, Q. J. Colloid Interface Sci. 1991, 144, 165-173. (c)
Zhang, L.; Somasundaran, P.; Maltesh, C., J. Colloid Interface Sci. 1997, 191, 202-208.
[2.26] Snyder, L. R. J. Phys. Chem. 1968, 72, 489-494.
[2.27] (a) Kölbel, H.; Hörig, K. Angew. Chem. 1959, 71, 691-697. (b) Kölbel, H.; Kuhn, P.
Angew. Chem. 1959, 71, 211-215.
[2.28] Dick, S. G.; Fuerstenau, D. W.; Healy, T. W. J. Colloid Interface Sci. 1971, 37, 595-602.
[2.29] Findenegg, G. H. in Theoretical Advancement in Chromatography and related Separation
Techniques, 1992, ed. F. Dondi, G. Guiochon (Hrsg.), Kluwer Academic Publishers, Dordrecht,. [2.30] Langmuir I. J Am Chem Soc 1918, 40, 1361-1403.
[2.31] Cases, J. M.; Mutaftschiev, B. Surf. Sci. 1968, 9, 57-72.
[2.32] Harwell, J. H.; Hoskins, J. C.; Schechter, R. S.; Wade, W. H. Langmuir 1985, 1, 251-262.
[2.33] (a) Łajtat, L.; Narkiewicz-Michałek, J.; Rudziński, W.; Partyka, S. Langmuir 1993, 9, 3174-
3190; (b) Łajtat, L.; Narkiewicz-Michałek, J.; Rudziński, W.; Partyka, S. Langmuir 1994, 10,
3754-3764.
[2.34] Somasundaran, P.; Fuerstenau, D.W. J. Phys. Chem. 1966, 70, 90-96.
[2.35] Johnson, R.A.; Nagarajan R. Colloids Surf, A Physicochem. Eng. Asp. 2000,167, 21–30.
[2.36] Levitz P. Langmuir 1991, 7, 1595-1608.
[2.37] (a) Scheutjens, J.M.H.M.; Fleer G.J. J. Phys. Chem. 1979, 83, 1619-1635. (b) Böhmer,
M.R.; Koopal, L.K. Langmuir 1992, 8, 1594-1602. (c) Koopal, L.K.; Lee, M. L.; Böhmer, M.R. J.
Colloid Interface Sci. 1995, 170, 85-97.
[2.38] (a) Gu, T; Zhu, B.-Y. J. Chem. Soc., Faraday Trans. I 1989, 85, 3813-3817. (b) Gu, T;
Zhu, B.-Y. Colloids and Surfaces 1990, 44, 81-87.
[2.39] (a) Zhu, B.-Y.; Gu, T.; Zhao, X., J. Chem. Soc., Faraday Trans. I 1989, 85, 3819-3824. (b)
Findenegg, G.H.; Eltekov, A.Y. J. of Chromatography A 2007, 1150, 236-240. (c) Lugo, D.;
Oberdisse, J.; Karg, M.; Schweins, R.; Findenegg, G.H. Soft Matter 2009, 5, 2928–2936.
[2.40] Kunjappu, J.T.; Somasundaran P. Colloids Surf 1989, 38, 305–311.
47
2. Fundamentals
[2.41] (a) Manne, S.; Gaub, H.E. Science, 1995, 270, 1480-1482. (b) Grant, L. M.; Tiberg, F.;
Ducker, W. A., J. Phys. Chem. B, 1998, 102, 4288-4294. (c) Warr, G. G. Current Opin. Colloid
Interface Sci. 2000, 5, 88-94. (d) Dong, J.; Mao, G., Langmuir, 2000, 16, 6641-6647.
[2.42] (a) Tiberg, F.; Jönsson, B.; Tang, J.; Lindman, B. Langmuir 1994, 10, 2294-2300. (b)
Tiberg, F. J. Chem. Soc., Faraday Trans. II 1996, 92, 531-538.
[2.43] (a) Cummins, P. G.; Staples, E.; Penfold, J., J. Phys. Chem. 1990, 94, 3740-3745. (b)
Cummins, P. G.; Penfold, J.; Staples, E., J. Phys. Chem. 1992, 96, 8092-8094. (c) Penfold, J.;
Staples, E.; Tucker, I.; Cummins, P. G. J. Phys, Chem. 1996, 100, 18133-18137. (d) Grillo, I.;
Levitz, P.; Zemb, T. Eur. Phys. J. B 1999, 10, 29-34.
[2.44] Thirtle, P.N.; Li, Z.X.; Thomas, R. K.; Rennie A. R.; Satija, S. K.; Sung, L. P. Langmuir
1997,13, 5451–5458.
[2.45] Schulz, J. C.; Warr, G. G.; Hamilton, W. A.; Butler, P. D. J. Phys Chem, B 1999,
103,11057–11063.
[2.46] (a) Despert, G.; Oberdisse, J. Langmuir 2003, 19, 7604–7610. (b) Oberdisse, J. Phys.
Chem. Chem. Phys. 2004, 6, 1557-1561.
[2.47] Bäverbäck, P. Ph.D Thesis 2009, chap. 1, pp. 1-22.
[2.48] Spalla, O. in Neutrons, X-rays and Light: Scattering Methods Applied to Soft Condensed
Matter 2002, 1st ed., ed. P. Lindner and Th. Zemb, Elsevier, Boston, chap. 3, pp. 49-71.
[2.49] Williams, C. E.; May, R. P.; Guinier, A., in X-ray Characterization of Materials 1999, 1st
ed., ed. E. Lifshin, Wiley-VCH, NY, chap. 4, pp. 213-251.
[2.50] Karg, M. Ph.D Thesis 2009, chap. 2, pp. 7-30.
[2.51] Berne, B.J.; Pecora, R., Dynamic Light Scattering 1976, 1st ed., John Wiley & Sons, Inc.,
NY, chap. 2, pp. 10-23.
[2.52] Koppel, D.E. J. Chem Phys. 1972, 57, 4814-4820.
[2.53] (a) Provencher, S. W. Comput. Phys. Commun. 1982, 27, 213-227. (b) Provencher, S. W.
Comput. Phys. Commun. 1982, 27, 229-242.
[2.54] http://www.ill.eu/instruments-support/instruments-groups/instruments/d11/
[2.55] King, S. M.; Griffiths, P. C.; Cosgrove, T., in Applications of Neutron Scattering to Soft
Condensed Matter, Matter 2000, 1st ed., ed. B. J. Gabrys, Gordon and Breach Science
Publishers, Netherlands, chap. 4, pp. 77-105.
[2.56] Sears, V.F. Neutron News, 1992, 3, 29-37.
[2.57] Pusey, N. P. in Neutrons, X-rays and Light: Scattering Methods Applied to Soft
Condensed Matter 2002, 1st ed., ed. P. Lindner and Th. Zemb, Elsevier, Boston, chap. 1, pp. 3-
21.
[2.58] Oberdisse, J.; Pyckhout-Hintzen, W.; Straube, E. in Recent Advances in Polymer
Nanocomposites 2009, 1st ed., ed. Thomas, G.E. Zaikov and S.V. Valsaraj VSP Publications,
chap. 12, pp. 397-438.
48
2. Fundamentals
49
[2.59] Kohlbrecher, J., User Guide for the SASfit software pachage,Paul Scherrer Institute,
Laboratory for neutron scattering, 2009 Edition. Available as pdf (SASfit.pdf) from
http://sans.web.psi.ch/SANSSoft/sasfit.pdf
[2.60] Kholodenko, A. L. Macromolecules 1993, 26, 4179-4183.
[2.61] D’Aguanno, B.; Klein, R. J. Chem. Soc. Faraday Trans. 1991, 87, 379-390.
[2.62] Oberdisse, J.; Hine, P.; Pyckhout-Hintzen, W. Soft Matter 2007, 3, 476-485.
[2.63] Hansen, J.P.; McDonald I.R. In Theory of Simple Liquids 2006, 3rd ed., Academic Press,
London.
[2.64] Percus, J.K.; Yevick, G.J. Phys. Rev. 1958, 110, 1–13.
[2.65] (a) Hayter, J.B.; Penfold, J. Mol. Phys.1981, 42, 109–118. (b) Hansen, J.P.; Hayter, J.B.
Mol. Phys. 1982, 46, 651–656.
3 Experimental Section
3.1 Chemicals The surfactants penta(ethylene glycol) monododecyl ether, C12E5 (Fluka, purity
≥ 98%, density 0.963 g cm-3 at 293 K), decyl-β-maltoside, β-C10G2 (Glycon,
purity > 99.5%, density 1 g cm-3), dodecyl-β-maltoside, β-C12G2 (Glycon, purity
> 99.5%, density 1 g cm-3) and N,N-dimethyldodecylamine-N-oxide, C12DAO
(Fluka, purity ≥ 98%) and the chemicals tetraethyl orthosilicate, TEOS (Fluka,
purity ≥ 99.0%), ammonia (Sigma-Aldrich, A.C.S. reagent, 30-33% in water),
ethanol, C2H5OH (Berkel AHK, purity ≥ 99.9%), and D2O (Euriso-top, 99.9%
isotope purity), were used without further purification. Reagent-grade water was
produced by a Milli-Q 50 filtration system (Millipore, Billerica, USA) reaching a
resistance of 18.2 MΩ, and was additionally passed through a 0.22 µm
membrane to remove micrometer-sized particles. Commercial colloidal silica
suspensions, Ludox SM-30 (30 wt-% in water) and Ludox HS-40 (40 wt-% in
water) were supplied by Sigma-Aldrich. They were dialyzed with reagent-grade
water (2 weeks) and filtered with a 0.8 μm Millipore Steril Filter. The silica
concentration in the purified suspensions was about one half of the original
concentration. The pH was adjusted to 9 by the addition of 0.1 M NaOH in order
to preserve colloidal stability. The colloidal dispersions were stored in a
refrigerator at 280 K before use.
3.2 Sample Preparation 3.2.1 Synthesis of silica nanoparticles
Three samples of monodisperse silica nanoparticles were prepared by two
variants of the Stöber synthesis [3.1]. The preparation of the nanoparticles of
smaller size, denoted as silica I (diameter 16 nm) and silica II (27 nm), was
made by particle growth from Ludox SM-30 and Ludox HS-40 dispersions,
respectively. First a selective growth of Ludox particles was performed in basic
conditions using TEOS as the silica source. 12.0 mL of the Ludox stock
dispersion was added to a mixture of 240 mL ethanol, 60 mL water and 15.2 mL
ammonia (30-33% in water) and was stirred in a PE bottle. 102 μL of TEOS
3. Experimental Section
were then added and stirring was continued for 24 h. After this growth step the
Ludox particles had increased in size while the polydispersity had decreased.
Particle growth was monitored by dynamic light scattering (DLS) and
transmission electron microscopy (TEM). To reach the desired particle diameter
the overgrown Ludox particles were dialyzed against Milli-Q water for 1 week
with daily change of the reagent-grade water. After dialysis the dispersion was
concentrated by a factor 6 by solvent evaporation, using a rotary evaporator
(313 K, 160 mbar), then filtered with a Millipore Steril Filter (0.8 μm), and the pH
was adjusted to pH 9. The samples were stored in a refrigerator at 280 K before
use.
Silica III (diameter 42 nm) was prepared by the classical Stöber synthesis
[3.1], i.e. by condensation of TEOS, starting from a mixture of 100 mL ethanol
and 7.5 mL ammonia at 333 K in a 250 mL three-neck round flask equipped
with a magnetic stirrer and reflux-condenser. After 30 min of equilibration time,
3.0 mL TEOS was added dropwise into the solution under stirring with 100
RPM. The colorless and clear solution became turbid within the first 10 min after
the addition of the silica precursor TEOS indicating nucleation. In this step of
nucleation the stirrer speed was decreased to 50 RPM. The condensation
reaction was allowed to continue for 24 h at 313 K. Afterwards, the colloidal
dispersion was cooled down to room temperature and the excess of ethanol
and ammonia was removed from the resulting suspension in a rotary evaporator
(313 K, 160 mbar) by reducing the volume to 20% of the initial value. The
suspension was dialyzed with reagent-grade water for 1 week, filtered and
stored at pH 9 in a refrigerator at 280 K.
The density and concentration of the resulting dispersions was determined
gravimetrically.
3.2.2 Characterization of the silica nanoparticles
The synthesized silica nanoparticles were characterized by several methods as
will be described in detail in section 3.3. The silica dispersions obtained after
dialysis were diluted to 1 vol.% - 2 vol.% for the characterization by nitrogen
adsorption, transmission electron microscopy (TEM), dynamic light scattering
51
3. Experimental Section
(DLS), zeta potential, and small angle neutron scattering (SANS). For the first
three methods the dilution was made using reagent-grade water. In the case of
the SANS measurements heavy water (D2O) was used in order to achieve a
high scattering contrast. All samples were diluted and their pH was adjusted to
9 in order to minimize complications by particle aggregation and interaction.
3.2.3 Surfactant solutions Properties of aqueous solutions of pure surfactants and binary mixtures of
surfactants were studied to complement the structural studies of adsorbed
surfactant layers on the silica nanoparticles. The following properties were
determined:
(i) Surface tension of binary mixtures was used to determine the CMC as a
function of the surfactant composition.
(ii) SANS was used to characterize the size and shape of mixed micelles of
pure surfactants and surfactant mixtures.
(iii) The adsorption isotherms of surfactants on the silica particles was
determined by the solution depletion method, using surface tension
measurements to determine the surfactant concentration in the supernatant
solution.
Below specific information is given for the samples preparation of the binary
systems.
Mixtures of amineoxide and maltoside surfactants The surfactant systems
C12DAO + β-C10G2
C12DAO + β-C12G2
were studied in order to assess the effect of the tail length of β-alkylmaltoside
and thus their CMC on the mixed micelles formed with dodecyldimethyl amine
oxide. Surface tension measurements were used to determine the CMC as a
function of the surfactant composition. Stock solutions with the binary surfactant
mixture were prepared by adding 25, 50 and 75 weight-% of β-C10G2 or of β-
C12G2 to a 2 vol.-% stock solution of C12DAO. Samples for the surface tension
52
3. Experimental Section
measurements were made by dilution of the stock solution of C12DAO and of
the stock solution of each surfactant mixture over a range concentration from
C/CMC = 0.003 to 4. Solutions were prepared in H2O at pH 9, and equilibrated
overnight using a GFL 3025 test tube rotator, before the measurements (CMC
= 2x10⁻³ M).
Samples for SANS measurements were prepared in two different solvent
contrasts: in pure D2O (scattering length density ρD = 6.34x1010 cm-2) and in a
H2O/D2O mixture (ρHD = 3.54x1010 cm-2); the latter of these corresponds to the
contrast-matching point of the silica nanoparticles (determined experimentally).
1 vol.-% solutions of each binary system (C12DAO:β-C10G2 and C12DAO:β-
C12G2) at five different mass ratios (1:0; 3:1; 1:1; 1:3; 0:1) were prepared by
dilution of stock solutions of 5 vol.-%. These measurements were made in order
to study the size and shape of the mixed micelles in these systems.
3.2.4 Surfactant adsorption on the silica nanoparticles The adsorption isotherm of surfactants on silica nanopartciles was determined
by the solution depletion method, using surface tension measurements to
determine the surfactant concentration in the equilibrated systems. Samples
were prepared with a low concentration silica sol (1-2 vol.-%) at pH 9. Silica
dispersions in normal water were used in surface tension and DLS
measurements to study the adsorption of C12E5 on the silica nanoparticles of 16
nm of particle size. Samples with seven different concentrations of C12E5 in a
C/CMC range from 0.7 to 2.6 were prepared and equilibrated overnight before
the measurements (CMC = 6x10⁻⁵ M, cf. section 4.2.2). SANS measurements
were made with silica sols in a H2O/D2O mixture of a scattering length density
(SLD) which matches that of silica, so that the scattering contrast arises only
from the surfactant. It was found that the match point is attained at a SLD ρ =
3.54x1010 cm-2. Samples of the colloidal sol with different surfactant
concentrations were prepared by adding appropriate amounts of the surfactant
directly to the aqueous dispersion. For C12E5, samples with four different
surface concentrations of the surfactant, corresponding to ¼Γmx, ½Γmx, ¾Γmx
and Γmx were prepared, where Γmx is the plateau value of the surfactant
53
3. Experimental Section
adsorption isotherm as determined by the surface tension measurements (cf.
section 4.2.2) [3.2]. For the surfactants β-C10G2 and β-C12G2, two samples
corresponding to ¾Γmx and Γmx were prepared in an analogous manner.
In the study of the self-assembly of C12DAO on silica beads, dilute silica
dispersions (0.4 to 1.5 vol.-%) of three different particle sizes (16 nm, 27 nm, 42
nm) in the contrast-matching H2O/D2O solvent mixture at pH 9 were prepared
for the SANS measurements. Samples with different adsorbed amounts of
C12DAO ¼Γmx, ½Γmx, ¾Γmx and ⅞Γmx) were prepared. The adsorption isotherm
of C12DAO on Davisil silica gel reported by Pettersson and Rosenholm [3.3]
was used to estimate the amounts of surfactant needed for a given surface
concentration on the silica particles. According to that work, a plateau value Γmx
= 7.5 μmol m-2 is reached at a solution concentrations somewhat above the
CMC (~ 2x10⁻³ M), and the surface concentration at the CMC is about ⅞Γmx.
This value was chosen as the highest surface concentration of the surfactant on
the silica particles, to avoid free micelles in the solution.
3.2.5 Adsorption from surfactant mixtures on the Silica Nanoparticles
The adsorption from mixtures of two nonionic surfactants onto silica sol was
studied in order to clarify the nature of mixed surfactant aggregates formed on
the silica nanoparticles. Specifically, it was aimed to study the regime in which
the amount of the preferred surfactant is not sufficient to cover the silica
particles with a complete adsorbed bilayer. The preparation of these mixed
surfactant systems is described below.
Mixtures of amine-oxide surfactants and maltoside surfactants In this series of experiments, C12DAO was used as the strongly adsorbed
surfactant (component A), and β-C10G2 or β-C12G2 as the weakly adsorbed
surfactant (component B). Samples with a low concentration of silica sol (1.5
vol.-%; silica size 24 nm) were prepared in a H2O/D2O mixture of scattering
length density ρHD = 3.54x1010 cm-2, which matches the silica particles, and at
pH 9 to avoid congruent dissolution of particles and to minimize complications
54
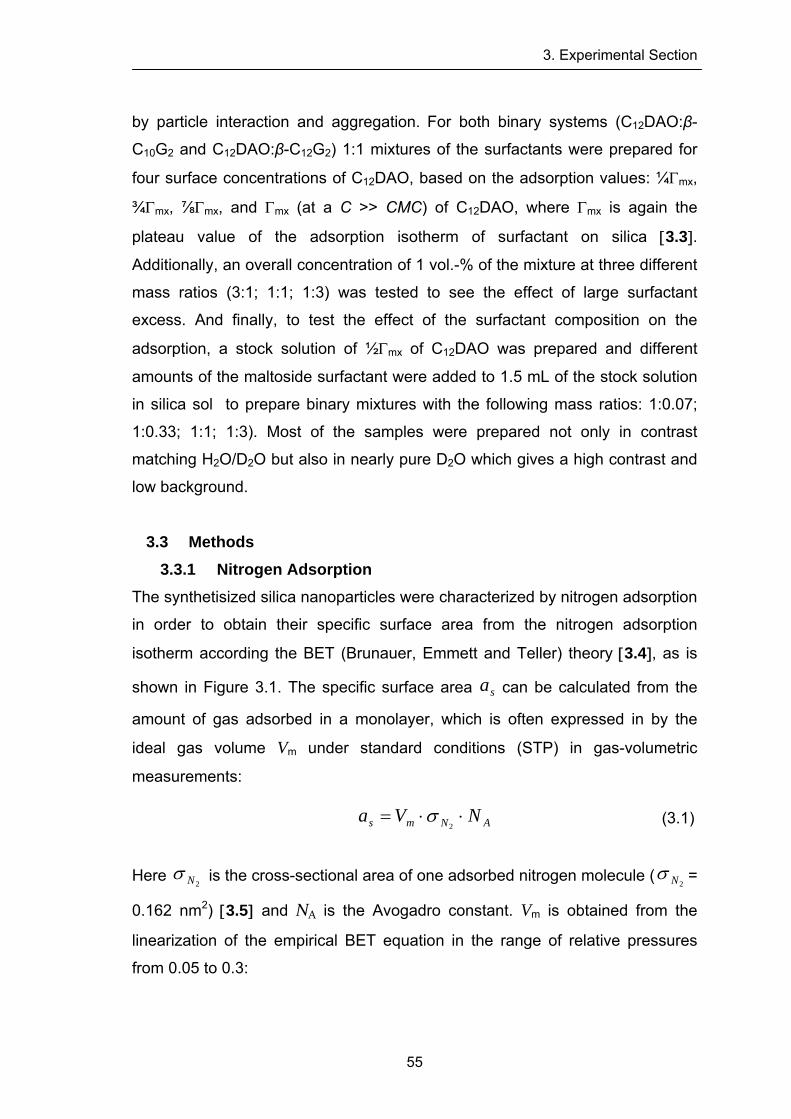
3. Experimental Section
by particle interaction and aggregation. For both binary systems (C12DAO:β-
C10G2 and C12DAO:β-C12G2) 1:1 mixtures of the surfactants were prepared for
four surface concentrations of C12DAO, based on the adsorption values: ¼Γmx,
¾Γmx, ⅞Γmx, and Γmx (at a C >> CMC) of C12DAO, where Γmx is again the
plateau value of the adsorption isotherm of surfactant on silica [3.3].
Additionally, an overall concentration of 1 vol.-% of the mixture at three different
mass ratios (3:1; 1:1; 1:3) was tested to see the effect of large surfactant
excess. And finally, to test the effect of the surfactant composition on the
adsorption, a stock solution of ½Γmx of C12DAO was prepared and different
amounts of the maltoside surfactant were added to 1.5 mL of the stock solution
in silica sol to prepare binary mixtures with the following mass ratios: 1:0.07;
1:0.33; 1:1; 1:3). Most of the samples were prepared not only in contrast
matching H2O/D2O but also in nearly pure D2O which gives a high contrast and
low background.
3.3 Methods 3.3.1 Nitrogen Adsorption
The synthetisized silica nanoparticles were characterized by nitrogen adsorption
in order to obtain their specific surface area from the nitrogen adsorption
isotherm according the BET (Brunauer, Emmett and Teller) theory [3.4], as is
shown in Figure 3.1. The specific surface area can be calculated from the
amount of gas adsorbed in a monolayer, which is often expressed in by the
ideal gas volume Vm under standard conditions (STP) in gas-volumetric
measurements:
sa
ANms NVa ⋅⋅=2
σ (3.1)
Here 2Nσ is the cross-sectional area of one adsorbed nitrogen molecule (
2Nσ =
0.162 nm2) [3.5] and NA is the Avogadro constant. Vm is obtained from the
linearization of the empirical BET equation in the range of relative pressures
from 0.05 to 0.3:
55
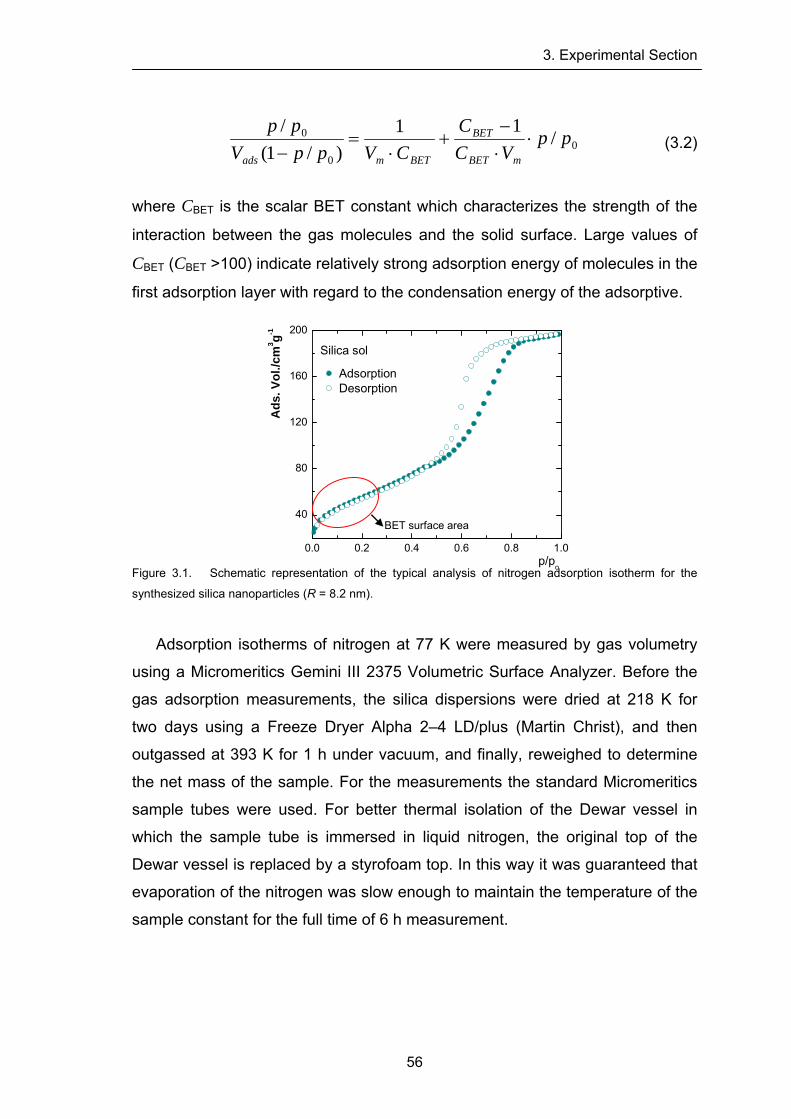
3. Experimental Section
00
0 /11)/1(
/ ppVC
CCVppV
pp
mBET
BET
BETmads
⋅⋅−
+⋅
=− (3.2)
where CBET is the scalar BET constant which characterizes the strength of the
interaction between the gas molecules and the solid surface. Large values of
CBET (CBET >100) indicate relatively strong adsorption energy of molecules in the
first adsorption layer with regard to the condensation energy of the adsorptive.
Figure 3.1. Schematic representation of the typical analysis of nitrogen adsorption isotherm for the
synthesized silica nanoparticles (R = 8.2 nm).
0.0 0.2 0.4 0.6 0.8 1.0
40
80
120
160
200
Silica sol
Ads
. Vol
./cm
3 g-1
p/po
Adsorption Desorption
BET surface area
Adsorption isotherms of nitrogen at 77 K were measured by gas volumetry
using a Micromeritics Gemini III 2375 Volumetric Surface Analyzer. Before the
gas adsorption measurements, the silica dispersions were dried at 218 K for
two days using a Freeze Dryer Alpha 2–4 LD/plus (Martin Christ), and then
outgassed at 393 K for 1 h under vacuum, and finally, reweighed to determine
the net mass of the sample. For the measurements the standard Micromeritics
sample tubes were used. For better thermal isolation of the Dewar vessel in
which the sample tube is immersed in liquid nitrogen, the original top of the
Dewar vessel is replaced by a styrofoam top. In this way it was guaranteed that
evaporation of the nitrogen was slow enough to maintain the temperature of the
sample constant for the full time of 6 h measurement.
56
3. Experimental Section
3.3.2 Transmission Electron Microscopy (TEM) TEM measurements were made at ZELMI at TU Berlin to determine the
morphology and size of the silica nanoparticles. TEM images were taken using
a Tecnai G2 20 S-Twin electronic microscope operating at an accelerating
voltage of 200 kV and an electron source of LaB6. Samples for TEM were first
diluted to a volume fraction less than 1 vol.-% and then prepared by drying a
droplet of the dilute dispersion on a copper grid (coated with a carbon film with a
thickness of 20 nm). TEM images were taken at a minimum of 5 different
locations on the grid, and a total of 220 particles were measured per sample to
ensure good statistics in the determination of the particles size.
3.3.3 Zeta Potential In order to obtain information about the surface charge of the particles zeta
potential measurements were carried out with a Malvern Zeta-Sizer 2000 using
dilute silica particle dispersions at pH 9 and 298 K.
3.3.4 Dynamic Light Scattering (DLS)
Light scattering experiments were performed to determine the hydrodynamic
radius RH of the silica nanoparticles, and to estimate the layer thickness of
adsorbed surfactant on the silica nanoparticles from the difference in RH of the
silica particles in presence and in absence of the surfactant. Dilute silica
dispersions (∼2 vol.-%) were user for DLS measurements in order to avoid
multiple scattering events. The samples were filled in cylindrical quartz cells of
10 mm in diameter (Hellma, Germany). The cells were carefully cleaned and
afterwards rinsed with freshly distilled acetone to remove dust particles.
The setup for the DLS instrument used in this work is shown in subsection
2.4.1 (Figure 2.10). The laser is a frequency doubled Nd:YAG-Laser (Compass
150, Coherent, USA) with a wavelength λ = 532 nm operating in cw mode and
providing a constant output power of 150 mW. All particle size measurements
were performed at 298 K (temperature controlled by a thermostatted toluene
matching bath) and at different scattering angles between 45° and 135°.
Correlation functions were generated using an ALV-5000/E multiple τ digital
57
3. Experimental Section
autocorrelator. The recorded correlation functions were analysed by inverse
Laplace transformation with the FORTRAN program CONTIN [3.6]. Sizes
reported in this study represent the average of 3–5 measurements. No
corrections for the presence of micelles above the CMC were made. The
viscosity of pure water was used in the calculation of RH.
3.3.5 Surface Tension Static surface tension measurements of surfactant solutions were made at
278.3 ± 0.2 K by the Du Noüy ring method [3.7], using a Krüss K11
tensiometer. Prior to the measurements of surfactant solutions, repeated
measurements of the surface tension of pure water were made to ensure
accuracy and reproducibility of the apparatus. The sample vessels (diameter ~
30 mm) which hold the solution under study were cleaned by soaking them in
Milli-Q grade water overnight, then rinsed and cleaned with acetone and again
with Milli-Q grade water. The platinum ring was flame-cleaned prior to use and
when the surfactant solution was changed. The prepared samples (cf. sections
3.2.3 and 3.2.4) were thermostated in the apparatus for at least 30 min before
measurement.
The adsorption isotherm of C12E5 on the silica sol particles was determined
by measuring the surfactant depletion in the supernatant solution after removal
of the silica by centrifugation (4 h at 8500 rpm in a Universal 320R centrifuge).
The equilibrium concentration in the supernatant was determined from its
surface tension, using the γ-log(C) curve of aqueous solutions of C12E5 as a
calibration curve.
3.3.6 Small Angle Neutron Scattering SANS experiments were performed on instrument D11 of the Institut Laue-
Langevin (Grenoble, France), on instrument PAXY of the Laboratoire Léon
Brillouin (CEA de Saclay, France), and on instrument V4 of the Helmholtz
Zentrum Berlin für Materialien und Energie GmbH (Berlin, Germany).
The setup of all instruments is represented by the scheme illustrated in
Figure 2.12 (subsection 2.4.2). In most cases SANS measurements were
58
3. Experimental Section
59
performed covering a range of the scattering vector q from 0.03 to 3 nm-1. The
samples were contained in standard 2-mm path length quartz cells (QS,
Hellma), thermostated to 298 ± 0.1 K. Corrections were made for instrumental
background, electronic noise, transmission, and empty cell.
Data reduction from the D11 instrument was done with the ILL standard
software package according to ref. 3.8 and 3.9. Data treatment from the PAXY
instrument was made using the software provided by LLB [3.10] and the data
recorded from V4 instrument were treated by using the software package
BerSANS [3.11].
References of Chapter 3 [3.1] Stöber, W.; Fink, A.; Bohn, E. J. Colloid Interface Sci. 1968, 26, 62-69.
[3.2] Lugo, D.; Oberdisse, J.; Karg, M.; Schweins, R.; Findenegg, G.H. Soft Matter 2009, 5,
2928–2936.
[3.3] Pettersson, A.; Rosenholm, J. B. Langmuir 2002, 18, 8436-8446.
[3.4] Brunauer, S.; Emmett , P. H.; Teller, E. J. Am. Chem. Soc., 1938, 60, 309-319.
[3.5] Ismail, M. K. I. Langmuir 1992, 8, 360–365.
[3.6] (a) Provencher, S. W. Comput. Phys. Commun.,1982, 27, 213-227. (b) Provencher, S. W.
Comput. Phys. Commun.,1982, 27, 229-242.
[3.7] Du Noüy, P. L. J. Gen. Physiol. 1919, 1, 521. [3.8] Ghosh, R. E.; Egelhaaf S. U.; Rennie, A. R. A Computing Guide for Small-Angle Scattering
Experiments, ILL Report ILL06GH05T, 2006 Edition. Available as pdf (sans_manual.pdf); from
ftp://ftp.ill.fr/pub/cs/sans/sans manual.pdf [3.9] Lindner, P. in Neutrons, X-rays and Light: Scattering Methods Applied to Soft Condensed
Matter, ed. P. Lindner and Th. Zemb, Elsevier, Boston, 1st edn., 2002, ch. 2, pp. 23-48.
[3.10] Brûlet, A.; Lairez, D.; Lapp, A.; Cotton, J.-P. J. Appl. Cryst. 2007, 40, 165-177.
[3.11] (a) Keiderling, U. Physica B 1997, 234, 1111-1113. (b) Keiderling, U. Appl. Phys. A 2002,
74, 1455-1457.
4 Surface Aggregate Structure of Nonionic Surfactants on Colloidal Silica Nanoparticles*
4.1 Introduction
The adsorption of nonionic surfactants at solid surfaces is of interest
because of its importance to a great number of industrial and technological
processes associated with colloidal stability and detergency. Adsorption of
surfactants from aqueous solutions onto flat surfaces [4.1-4.5], colloidal
silica [4.2, 4.6-4.8] and in porous silica [4.9-4.12] has been studied
extensively in the past in view of its practical importance and rich bulk and
interfacial behavior. A common point emerging from these studies is that
adsorption at hydrophilic silica surfaces represents a surface aggregation
process similar to micelle formation in the bulk solution. Surface aggregation
may lead to discrete surface micelles or to fragmented or complete bilayers,
depending on the surfactant composition and relative sizes of the head
groups and the tails of the surfactant. However, information about the
interfacial aggregation of surfactant molecules is still limited and it is not yet
well understood.
Structural information about adsorbed surfactant layers at the interface of
the aqueous phase against flat solid surfaces has been gained mainly by
neutron reflectometry (NR) [4.1, 4.2, 4.4] and atomic force microscopy (AFM)
[4.13-4.17]. Direct evidence about surface aggregate structures of
amphiphiles at flat solid surfaces has been gained by non-contact AFM.
Specifically, it has become clear that many of the aggregate geometries
which exist in bulk solution may also develop at the solid/solution interface,
depending on the hydrophilic or hydrophobic nature of the surface [4.17]. These findings are consistent with calorimetric studies which show that at
hydrophilic surfaces the enthalpy of adsorption of nonionic surfactants in the
*modified from published article in Soft Matter: Lugo, D.; Oberdisse, J.; Karg, M.; Schweins, R.; Findenegg, G.H. Soft
Matter 2009, 5, 2928–2936.
4. Surface Aggregate Structures of Nonionic Surfactants on Silica Nanoparticles
surface-aggregation regime is of similar magnitude as the enthalpy of micelle
formation in the bulk solution [4.18]. NR yields the scattering-length density
profile ρ(z) which comprises information about the laterally averaged
structure of the surfactant layer. In favourable cases, when using partially
deuterated surfactants and different contrast scenarios, information about
the arrangement of the amphiphile molecules in complete (saturated) mono-
or bilayer can be obtained by this method. An attempt to model NR data of
adsorbed surfactant films based on the existence of discrete surfactant
aggregates of well-defined geometry was presented by Schulz et al. [4.19] As a more direct approach to resolve laterally structured surfactant layers by
a non-invasive technique, Steitz et al. [4.20] used grazing-incidence small-
angle neutron scattering (GISANS) to study surfactant films at a hydrophilic
silicon wafer in the regime below saturation coverage. In that study the mean
surface concentration of the chosen nonionic surfactant could be varied over
a wide range simply by varying the sample temperature at a constant bulk
concentration somewhat below the CMC. The GISANS results indicated the
existence of transient surfactant aggregates without a preferred structure at
half-coverage of the surface, indicating that the picture of distinct surface
aggregates of characteristic size and separation that emerges from AFM
studies of saturated surfactant layers cannot be generalized to the situation
below complete surface coverage.
Small-angle neutron scattering (SANS) [4.6, 4.8] and fluorescent probe
techniques [4.9] have been used to characterize the nature of surfactant
layers adsorbed at particulate and colloidal solids in aqueous dispersions. In
their pioneering SANS work Cummins et al. [4.6] studied alkyl
polyoxyethylene ether (CnEm) surfactants on Ludox HS and TM silica sols
and demonstrated the effects of temperature, sol type, surfactant type and
surfactant concentration on the adsorption at the colloidal silica particles.
The adsorbed layer was modeled as a layer of uniform density, and hence
the form factor was that of a sphere plus an outer shell. Later, one of the
present authors [4.8, 4.21] analysed SANS data of a technical-grade
nonionic surfactant (Triton X-100) on silica nanoparticles on the basis of a
61
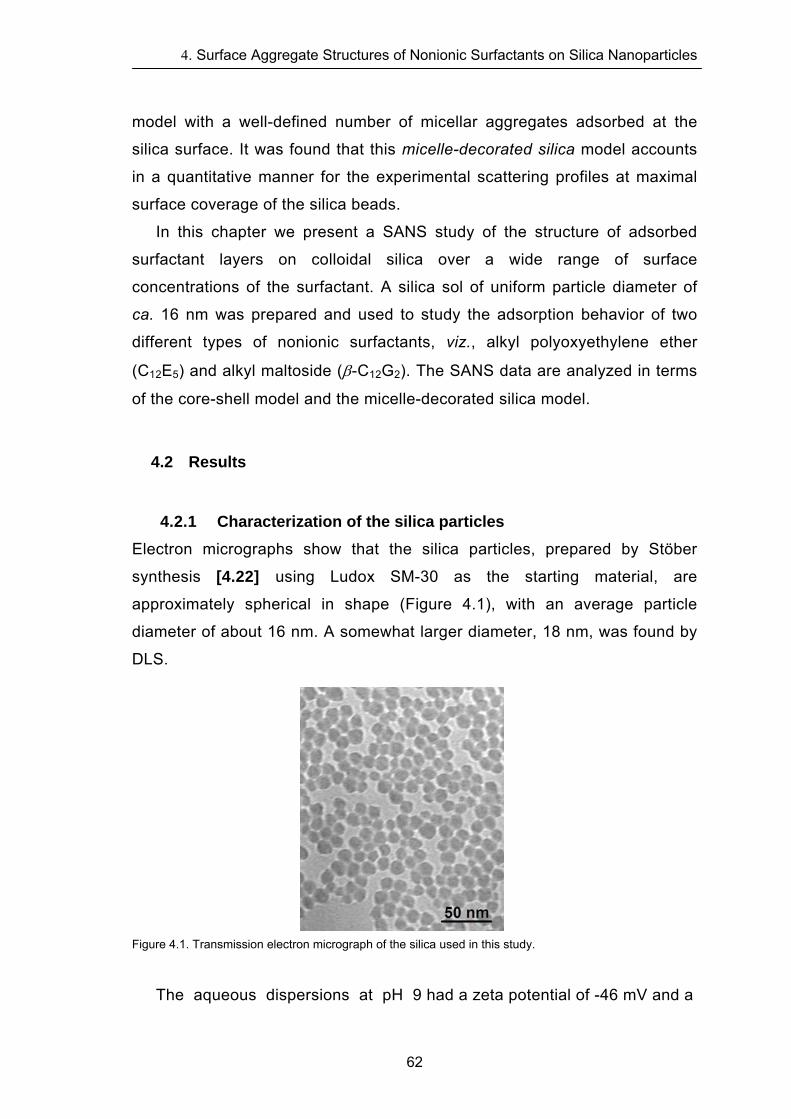
4. Surface Aggregate Structures of Nonionic Surfactants on Silica Nanoparticles
model with a well-defined number of micellar aggregates adsorbed at the
silica surface. It was found that this micelle-decorated silica model accounts
in a quantitative manner for the experimental scattering profiles at maximal
surface coverage of the silica beads.
In this chapter we present a SANS study of the structure of adsorbed
surfactant layers on colloidal silica over a wide range of surface
concentrations of the surfactant. A silica sol of uniform particle diameter of
ca. 16 nm was prepared and used to study the adsorption behavior of two
different types of nonionic surfactants, viz., alkyl polyoxyethylene ether
(C12E5) and alkyl maltoside (β-C12G2). The SANS data are analyzed in terms
of the core-shell model and the micelle-decorated silica model.
4.2 Results
4.2.1 Characterization of the silica particles
Electron micrographs show that the silica particles, prepared by Stöber
synthesis [4.22] using Ludox SM-30 as the starting material, are
approximately spherical in shape (Figure 4.1), with an average particle
diameter of about 16 nm. A somewhat larger diameter, 18 nm, was found by
DLS.
Figure 4.1. Transmission electron micrograph of the silica used in this study.
The aqueous dispersions at pH 9 had a zeta potential of -46 mV and a
62
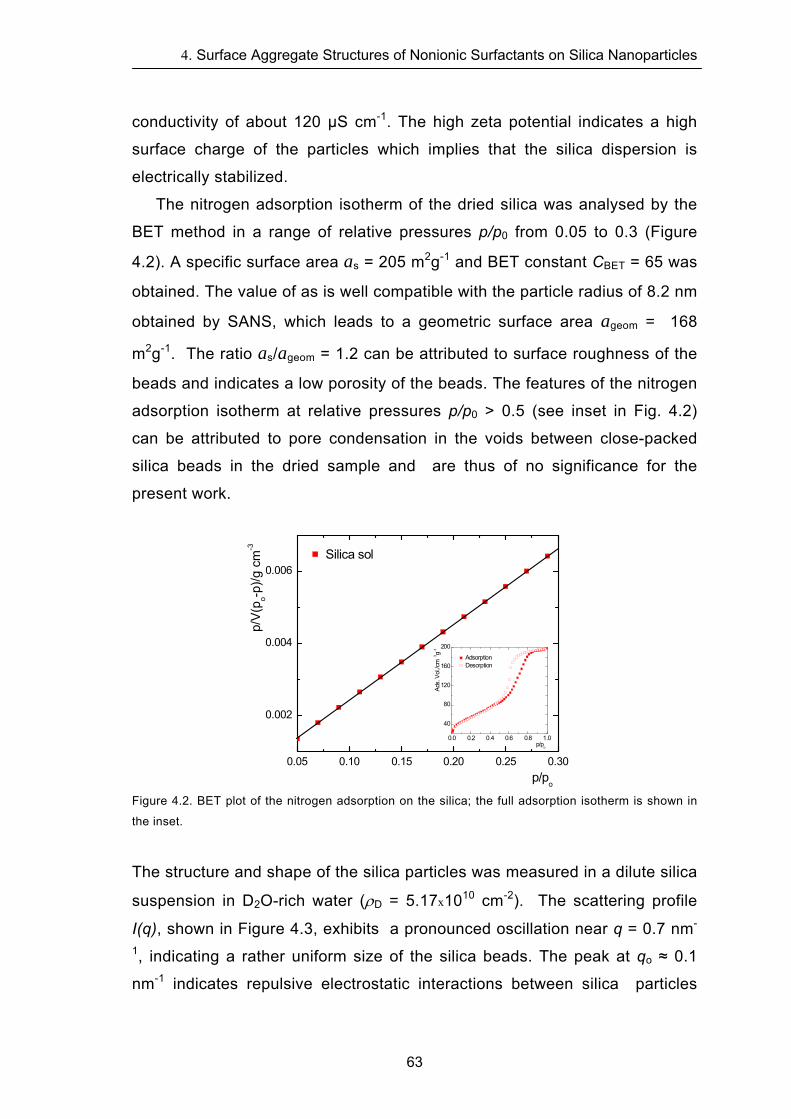
4. Surface Aggregate Structures of Nonionic Surfactants on Silica Nanoparticles
conductivity of about 120 μS cm-1. The high zeta potential indicates a high
surface charge of the particles which implies that the silica dispersion is
electrically stabilized.
The nitrogen adsorption isotherm of the dried silica was analysed by the
BET method in a range of relative pressures p/p0 from 0.05 to 0.3 (Figure
4.2). A specific surface area as = 205 m2g-1 and BET constant CBET = 65 was
obtained. The value of as is well compatible with the particle radius of 8.2 nm
obtained by SANS, which leads to a geometric surface area ageom = 168
m2g-1. The ratio as/ageom = 1.2 can be attributed to surface roughness of the
beads and indicates a low porosity of the beads. The features of the nitrogen
adsorption isotherm at relative pressures p/p0 > 0.5 (see inset in Fig. 4.2)
can be attributed to pore condensation in the voids between close-packed
silica beads in the dried sample and are thus of no significance for the
present work.
0.05 0.10 0.15 0.20 0.25 0.30
0.002
0.004
0.006
0.0 0.2 0.4 0.6 0.8 1.0
40
80
120
160
200
Ads.
Vol.
/cm
3 g-1
p/po
Adsorption Desorption
p/V(
p o-p)/g
cm
-3
p/po
Silica sol
Figure 4.2. BET plot of the nitrogen adsorption on the silica; the full adsorption isotherm is shown in
the inset.
The structure and shape of the silica particles was measured in a dilute silica
suspension in D2O-rich water (ρD = 5.17x1010 cm-2). The scattering profile
I(q), shown in Figure 4.3, exhibits a pronounced oscillation near q = 0.7 nm-
1, indicating a rather uniform size of the silica beads. The peak at qo ≈ 0.1
nm-1 indicates repulsive electrostatic interactions between silica particles
63
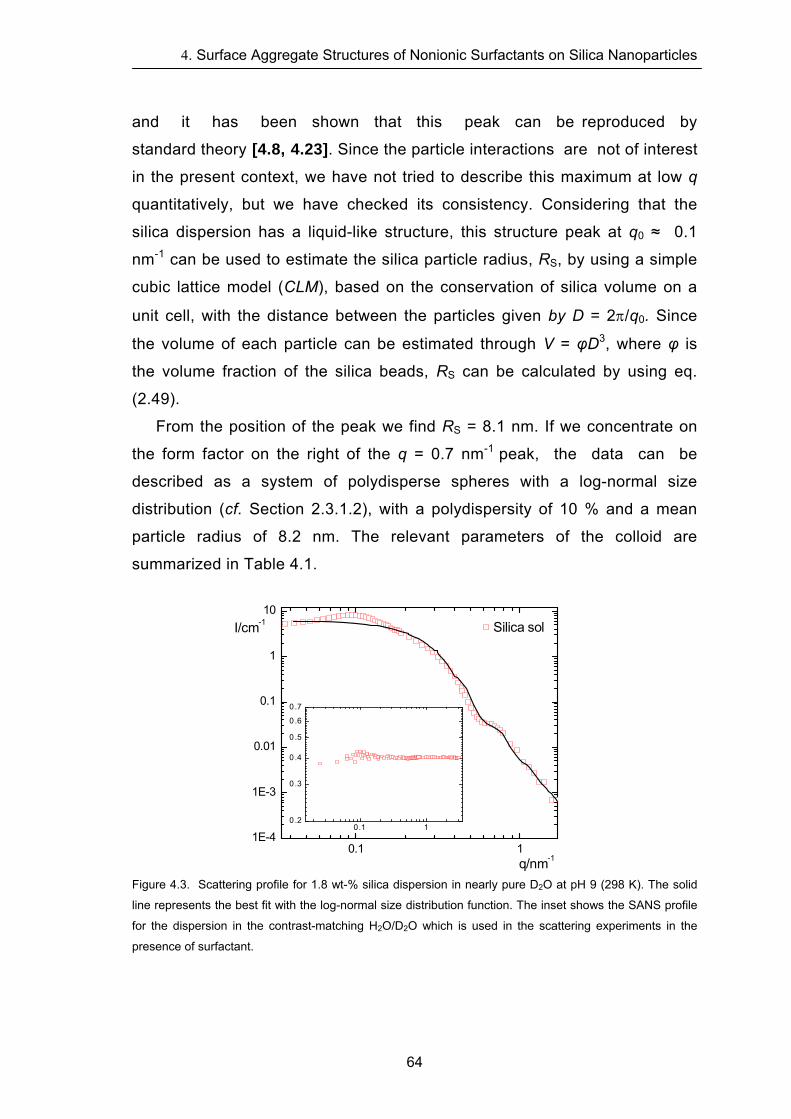
4. Surface Aggregate Structures of Nonionic Surfactants on Silica Nanoparticles
and it has been shown that this peak can be reproduced by
standard theory [4.8, 4.23]. Since the particle interactions are not of interest
in the present context, we have not tried to describe this maximum at low q
quantitatively, but we have checked its consistency. Considering that the
silica dispersion has a liquid-like structure, this structure peak at q0 ≈ 0.1
nm-1 can be used to estimate the silica particle radius, RS, by using a simple
cubic lattice model (CLM), based on the conservation of silica volume on a
unit cell, with the distance between the particles given by D = 2π/q0. Since
the volume of each particle can be estimated through V = φD3, where φ is
the volume fraction of the silica beads, RS can be calculated by using eq.
(2.49).
From the position of the peak we find RS = 8.1 nm. If we concentrate on
the form factor on the right of the q = 0.7 nm-1 peak, the data can be
described as a system of polydisperse spheres with a log-normal size
distribution (cf. Section 2.3.1.2), with a polydispersity of 10 % and a mean
particle radius of 8.2 nm. The relevant parameters of the colloid are
summarized in Table 4.1.
0.1 1
1E-4
1E-3
0.01
0.1
1
10
0.1 10.2
0 .3
0 .4
0 .5
0 .6
0 .7
I/cm-1
q/nm-1
Silica sol
Figure 4.3. Scattering profile for 1.8 wt-% silica dispersion in nearly pure D2O at pH 9 (298 K). The solid
line represents the best fit with the log-normal size distribution function. The inset shows the SANS profile
for the dispersion in the contrast-matching H2O/D2O which is used in the scattering experiments in the
presence of surfactant.
64
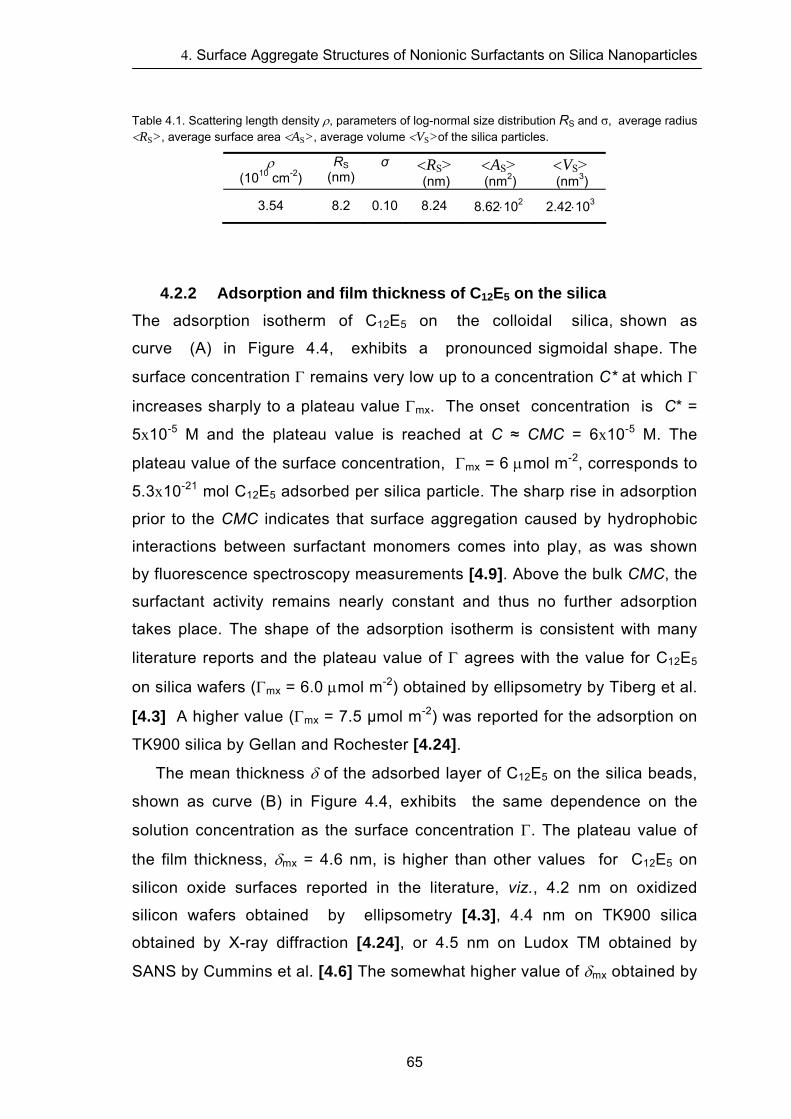
4. Surface Aggregate Structures of Nonionic Surfactants on Silica Nanoparticles
Table 4.1. Scattering length density ρ, parameters of log-normal size distribution RS and σ, average radius <RS>, average surface area <AS>, average volume <VS>of the silica particles.
ρ (1010 cm-2)
RS (nm)
σ <RS> (nm)
<AS> (nm2)
<VS> (nm3)
3.54 8.2 0.10 8.24 8.62⋅102 2.42⋅103
4.2.2 Adsorption and film thickness of C12E5 on the silica
The adsorption isotherm of C12E5 on the colloidal silica, shown as
curve (A) in Figure 4.4, exhibits a pronounced sigmoidal shape. The
surface concentration Γ remains very low up to a concentration C* at which Γ
increases sharply to a plateau value Γmx. The onset concentration is C* =
5x10⁻⁵ M and the plateau value is reached at C ≈ CMC = 6x10⁻⁵ M. The
plateau value of the surface concentration, Γmx = 6 μmol m-2, corresponds to
5.3x10⁻²¹ mol C12E5 adsorbed per silica particle. The sharp rise in adsorption
prior to the CMC indicates that surface aggregation caused by hydrophobic
interactions between surfactant monomers comes into play, as was shown
by fluorescence spectroscopy measurements [4.9]. Above the bulk CMC, the
surfactant activity remains nearly constant and thus no further adsorption
takes place. The shape of the adsorption isotherm is consistent with many
literature reports and the plateau value of Γ agrees with the value for C12E5
on silica wafers (Γmx = 6.0 μmol m-2) obtained by ellipsometry by Tiberg et al.
[4.3] A higher value (Γmx = 7.5 μmol m-2) was reported for the adsorption on
TK900 silica by Gellan and Rochester [4.24].
The mean thickness δ of the adsorbed layer of C12E5 on the silica beads,
shown as curve (B) in Figure 4.4, exhibits the same dependence on the
solution concentration as the surface concentration Γ. The plateau value of
the film thickness, δmx = 4.6 nm, is higher than other values for C12E5 on
silicon oxide surfaces reported in the literature, viz., 4.2 nm on oxidized
silicon wafers obtained by ellipsometry [4.3], 4.4 nm on TK900 silica
obtained by X-ray diffraction [4.24], or 4.5 nm on Ludox TM obtained by
SANS by Cummins et al. [4.6] The somewhat higher value of δmx obtained by
65
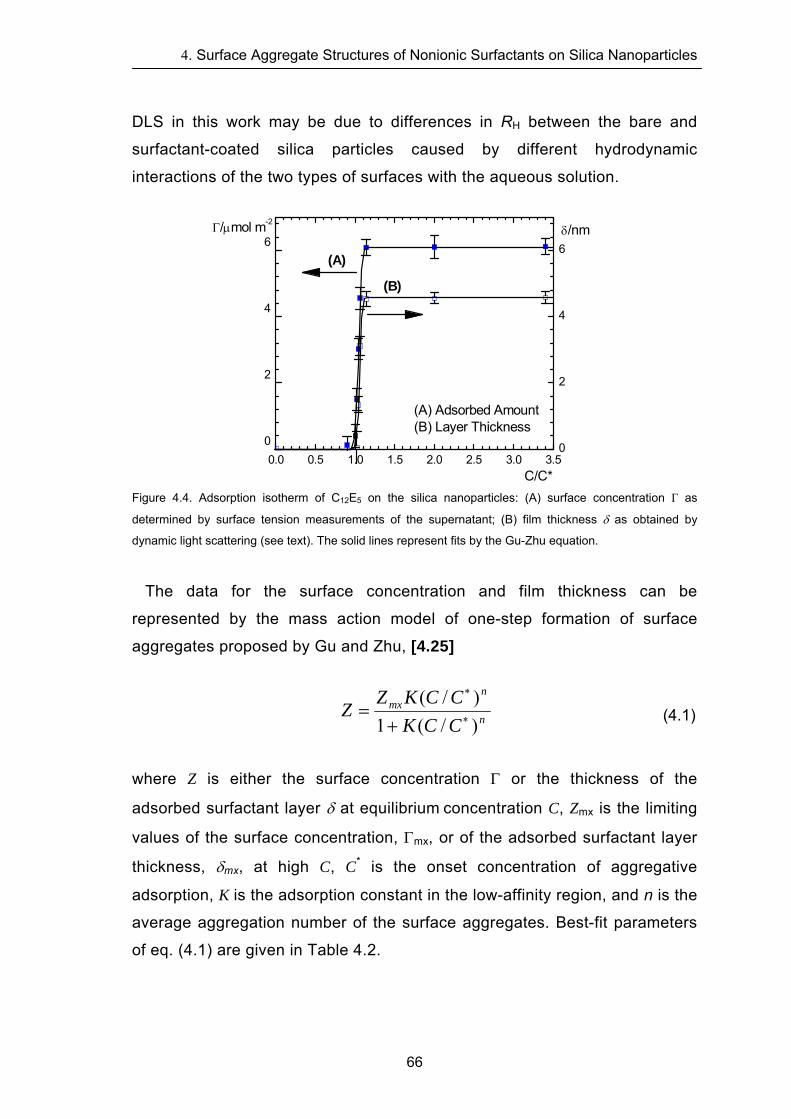
4. Surface Aggregate Structures of Nonionic Surfactants on Silica Nanoparticles
DLS in this work may be due to differences in RH between the bare and
surfactant-coated silica particles caused by different hydrodynamic
interactions of the two types of surfaces with the aqueous solution.
0.0 0.5 1.0 1.0
2
4
6
5 2.0 2.5 3.0 3.50
2
4
6
δ/nm
C/C*
Γ/μmol m-2
(A)
(B)
(A) Adsorbed Amount(B) Layer Thickness
Figure 4.4. Adsorption isotherm of C12E5 on the silica nanoparticles: (A) surface concentration Γ as
determined by surface tension measurements of the supernatant; (B) film thickness δ as obtained by
dynamic light scattering (see text). The solid lines represent fits by the Gu-Zhu equation.
The data for the surface concentration and film thickness can be
represented by the mass action model of one-step formation of surface
aggregates proposed by Gu and Zhu, [4.25]
n
nmx
CCKCCKZ
Z)/(1)/(
∗
∗
+= (4.1)
where Z is either the surface concentration Γ or the thickness of the
adsorbed surfactant layer δ at equilibrium concentration C, Zmx is the limiting
values of the surface concentration, Γmx, or of the adsorbed surfactant layer
thickness, δmx, at high C, C* is the onset concentration of aggregative
adsorption, K is the adsorption constant in the low-affinity region, and n is the
average aggregation number of the surface aggregates. Best-fit parameters
of eq. (4.1) are given in Table 4.2.
66
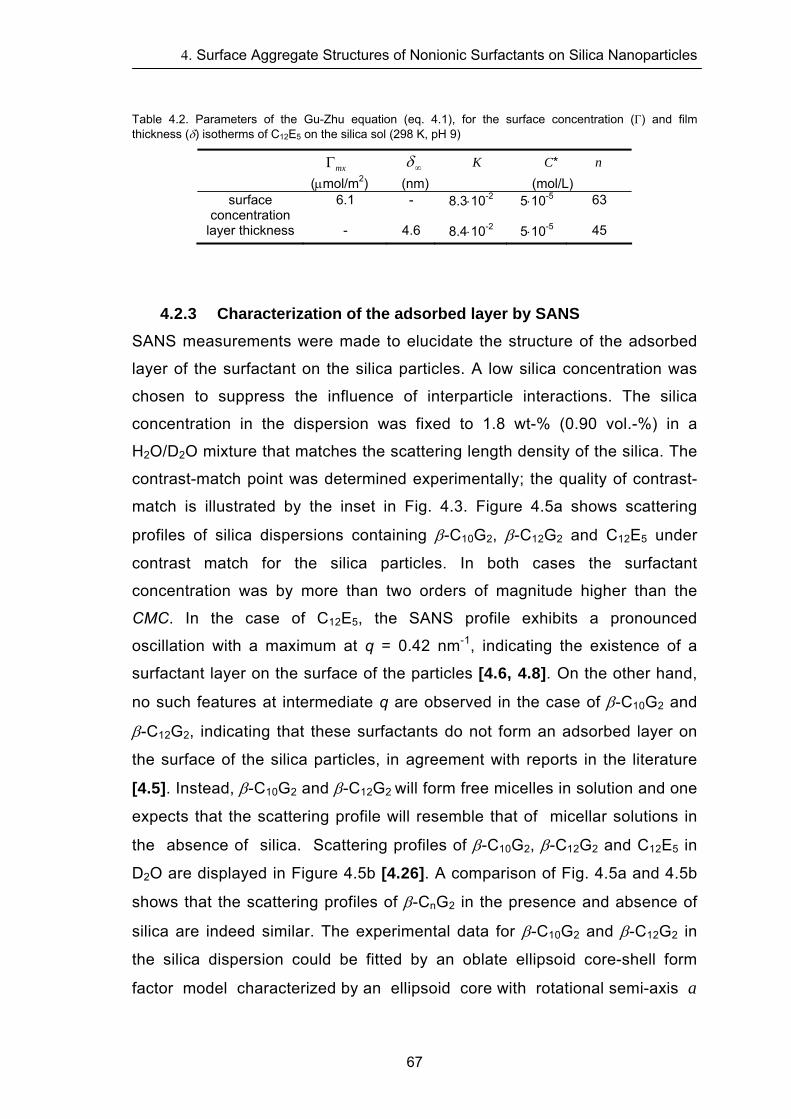
4. Surface Aggregate Structures of Nonionic Surfactants on Silica Nanoparticles
Table 4.2. Parameters of the Gu-Zhu equation (eq. 4.1), for the surface concentration (Γ) and film thickness (δ) isotherms of C12E5 on the silica sol (298 K, pH 9)
mxΓ ∞δ K C* n (μmol/m2) (nm) (mol/L)
surface concentration
6.1 - 8.3⋅10-2 5⋅10-5 63
layer thickness - 4.6 8.4⋅10-2 5⋅10-5 45
4.2.3 Characterization of the adsorbed layer by SANS
SANS measurements were made to elucidate the structure of the adsorbed
layer of the surfactant on the silica particles. A low silica concentration was
chosen to suppress the influence of interparticle interactions. The silica
concentration in the dispersion was fixed to 1.8 wt-% (0.90 vol.-%) in a
H2O/D2O mixture that matches the scattering length density of the silica. The
contrast-match point was determined experimentally; the quality of contrast-
match is illustrated by the inset in Fig. 4.3. Figure 4.5a shows scattering
profiles of silica dispersions containing β-C10G2, β-C12G2 and C12E5 under
contrast match for the silica particles. In both cases the surfactant
concentration was by more than two orders of magnitude higher than the
CMC. In the case of C12E5, the SANS profile exhibits a pronounced
oscillation with a maximum at q = 0.42 nm-1, indicating the existence of a
surfactant layer on the surface of the particles [4.6, 4.8]. On the other hand,
no such features at intermediate q are observed in the case of β-C10G2 and
β-C12G2, indicating that these surfactants do not form an adsorbed layer on
the surface of the silica particles, in agreement with reports in the literature
[4.5]. Instead, β-C10G2 and β-C12G2 will form free micelles in solution and one
expects that the scattering profile will resemble that of micellar solutions in
the absence of silica. Scattering profiles of β-C10G2, β-C12G2 and C12E5 in
D2O are displayed in Figure 4.5b [4.26]. A comparison of Fig. 4.5a and 4.5b
shows that the scattering profiles of β-CnG2 in the presence and absence of
silica are indeed similar. The experimental data for β-C10G2 and β-C12G2 in
the silica dispersion could be fitted by an oblate ellipsoid core-shell form
factor model characterized by an ellipsoid core with rotational semi-axis a
67
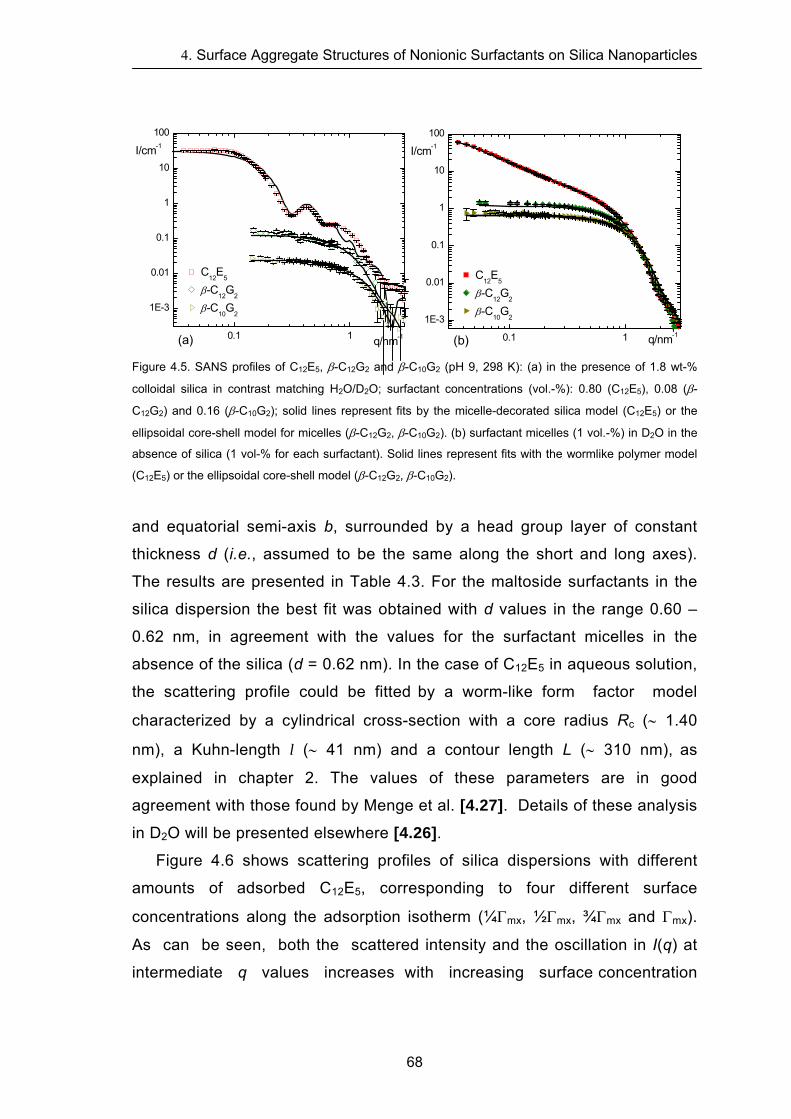
4. Surface Aggregate Structures of Nonionic Surfactants on Silica Nanoparticles
0.1 1
1E-3
0.01
0.1
1
10
100
Figure 4.5. SANS profiles of C12E5, β-C12G2 and β-C10G2 (pH 9, 298 K): (a) in the presence of 1.8 wt-%
colloidal silica in contrast matching H2O/D2O; surfactant concentrations (vol.-%): 0.80 (C12E5), 0.08 (β-
C12G2) and 0.16 (β-C10G2); solid lines represent fits by the micelle-decorated silica model (C12E5) or the
ellipsoidal core-shell model for micelles (β-C12G2, β-C10G2). (b) surfactant micelles (1 vol.-%) in D2O in the
absence of silica (1 vol-% for each surfactant). Solid lines represent fits with the wormlike polymer model
(C12E5) or the ellipsoidal core-shell model (β-C12G2, β-C10G2).
and equatorial semi-axis b, surrounded by a head group layer of constant
thickness d (i.e., assumed to be the same along the short and long axes).
The results are presented in Table 4.3. For the maltoside surfactants in the
silica dispersion the best fit was obtained with d values in the range 0.60 –
0.62 nm, in agreement with the values for the surfactant micelles in the
absence of the silica (d = 0.62 nm). In the case of C12E5 in aqueous solution,
the scattering profile could be fitted by a worm-like form factor model
characterized by a cylindrical cross-section with a core radius Rc (∼ 1.40
nm), a Kuhn-length l (∼ 41 nm) and a contour length L (∼ 310 nm), as
explained in chapter 2. The values of these parameters are in good
agreement with those found by Menge et al. [4.27]. Details of these analysis
in D2O will be presented elsewhere [4.26]. Figure 4.6 shows scattering profiles of silica dispersions with different
amounts of adsorbed C12E5, corresponding to four different surface
concentrations along the adsorption isotherm (¼Γmx, ½Γmx, ¾Γmx and Γmx).
As can be seen, both the scattered intensity and the oscillation in I(q) at
intermediate q values increases with increasing surface concentration
(a)
cm-1
q/nm-1
I/
C12
E5
β-C12
G2
β-C10
G2
0.1 1
1E-3
0.01
0.1
1
10
100
C12
E5
β-C12
G2
β-C10
G2
q/nm-1(b)
I/cm-1
68
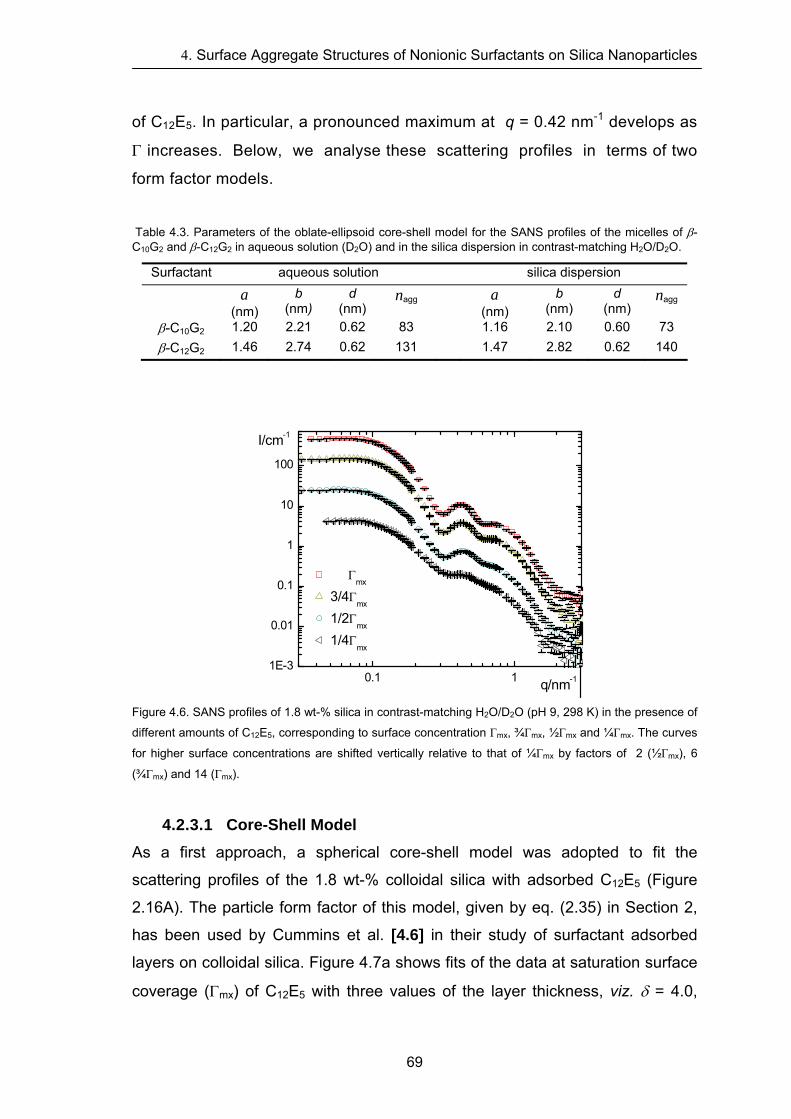
4. Surface Aggregate Structures of Nonionic Surfactants on Silica Nanoparticles
of C12E5. In particular, a pronounced maximum at q = 0.42 nm-1 develops as
Γ increases. Below, we analyse these scattering profiles in terms of two
form factor models.
Table 4.3. Parameters of the oblate-ellipsoid core-shell model for the SANS profiles of the micelles of β-C10G2 and β-C12G2 in aqueous solution (D2O) and in the silica dispersion in contrast-matching H2O/D2O.
Surfactant aqueous solution silica dispersion a
(nm) b
(nm) d
(nm) nagg a
(nm) b
(nm) d
(nm) nagg
β-C10G2 1.20 2.21 0.62 83 1.16 2.10 0.60 73 β-C12G2 1.46 2.74 0.62 131 1.47 2.82 0.62 140
0.11E-3
0.01
0.1
1
10
100
1
Γmx
3/4Γ
mx
1/2Γmx
1/4Γ
mx
I/cm-1
q/nm-1
Figure 4.6. SANS profiles of 1.8 wt-% silica in contrast-matching H2O/D2O (pH 9, 298 K) in the presence of
different amounts of C12E5, corresponding to surface concentration Γmx, ¾Γmx, ½Γmx and ¼Γmx. The curves
for higher surface concentrations are shifted vertically relative to that of ¼Γmx by factors of 2 (½Γmx), 6
(¾Γmx) and 14 (Γmx).
4.2.3.1 Core-Shell Model As a first approach, a spherical core-shell model was adopted to fit the
scattering profiles of the 1.8 wt-% colloidal silica with adsorbed C12E5 (Figure
2.16A). The particle form factor of this model, given by eq. (2.35) in Section 2,
has been used by Cummins et al. [4.6] in their study of surfactant adsorbed
layers on colloidal silica. Figure 4.7a shows fits of the data at saturation surface
coverage (Γmx) of C12E5 with three values of the layer thickness, viz. δ = 4.0,
69
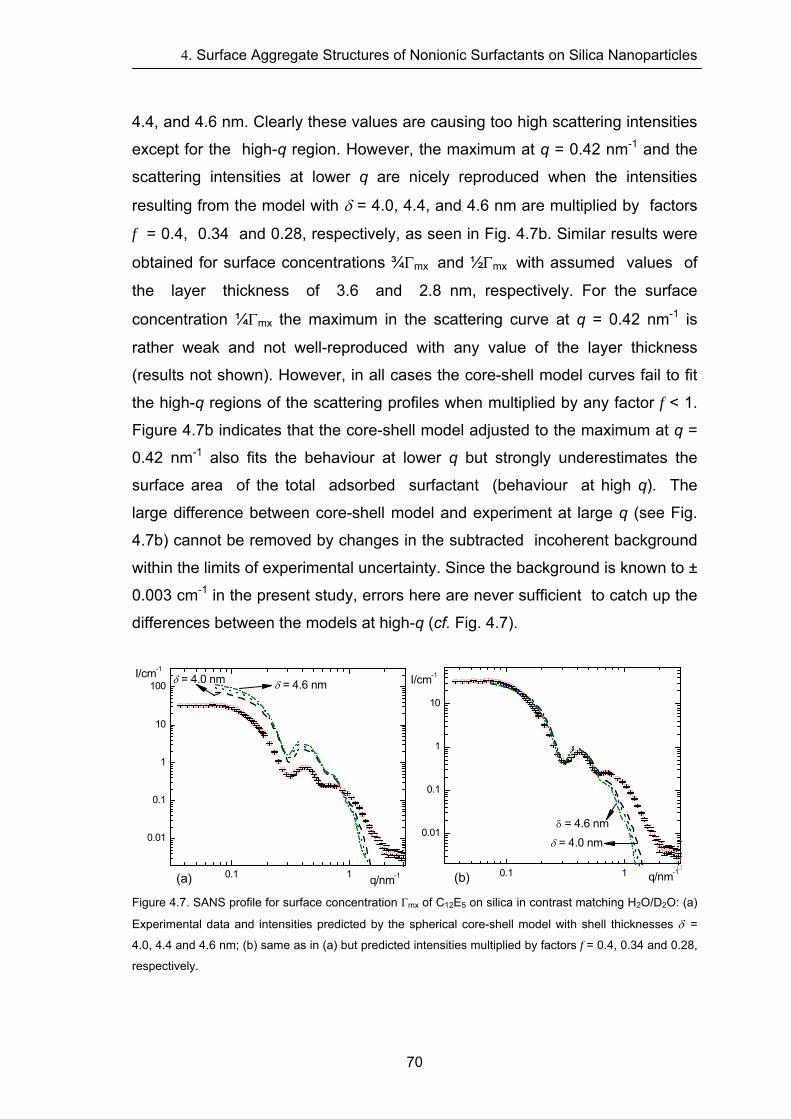
4. Surface Aggregate Structures of Nonionic Surfactants on Silica Nanoparticles
4.4, and 4.6 nm. Clearly these values are causing too high scattering intensities
except for the high-q region. However, the maximum at q = 0.42 nm-1 and the
scattering intensities at lower q are nicely reproduced when the intensities
resulting from the model with δ = 4.0, 4.4, and 4.6 nm are multiplied by factors
f = 0.4, 0.34 and 0.28, respectively, as seen in Fig. 4.7b. Similar results were
obtained for surface concentrations ¾Γmx and ½Γmx with assumed values of
the layer thickness of 3.6 and 2.8 nm, respectively. For the surface
concentration ¼Γmx the maximum in the scattering curve at q = 0.42 nm-1 is
rather weak and not well-reproduced with any value of the layer thickness
(results not shown). However, in all cases the core-shell model curves fail to fit
the high-q regions of the scattering profiles when multiplied by any factor f < 1.
Figure 4.7b indicates that the core-shell model adjusted to the maximum at q =
0.42 nm-1 also fits the behaviour at lower q but strongly underestimates the
surface area of the total adsorbed surfactant (behaviour at high q). The
large difference between core-shell model and experiment at large q (see Fig.
4.7b) cannot be removed by changes in the subtracted incoherent background
within the limits of experimental uncertainty. Since the background is known to ±
0.003 cm-1 in the present study, errors here are never sufficient to catch up the
differences between the models at high-q (cf. Fig. 4.7).
0.1 1
0.01
0.1
1
10
100cm-1
q/nm-1(a)
δ = 4.0 nmI/δ = 4.6 nm
0.1 1
0.01
0.1
1
10
I/cm-1
q/nm-1(b)
δ = 4.0 nmδ = 4.6 nm
Figure 4.7. SANS profile for surface concentration Γmx of C12E5 on silica in contrast matching H2O/D2O: (a)
Experimental data and intensities predicted by the spherical core-shell model with shell thicknesses δ =
4.0, 4.4 and 4.6 nm; (b) same as in (a) but predicted intensities multiplied by factors f = 0.4, 0.34 and 0.28,
respectively.
70
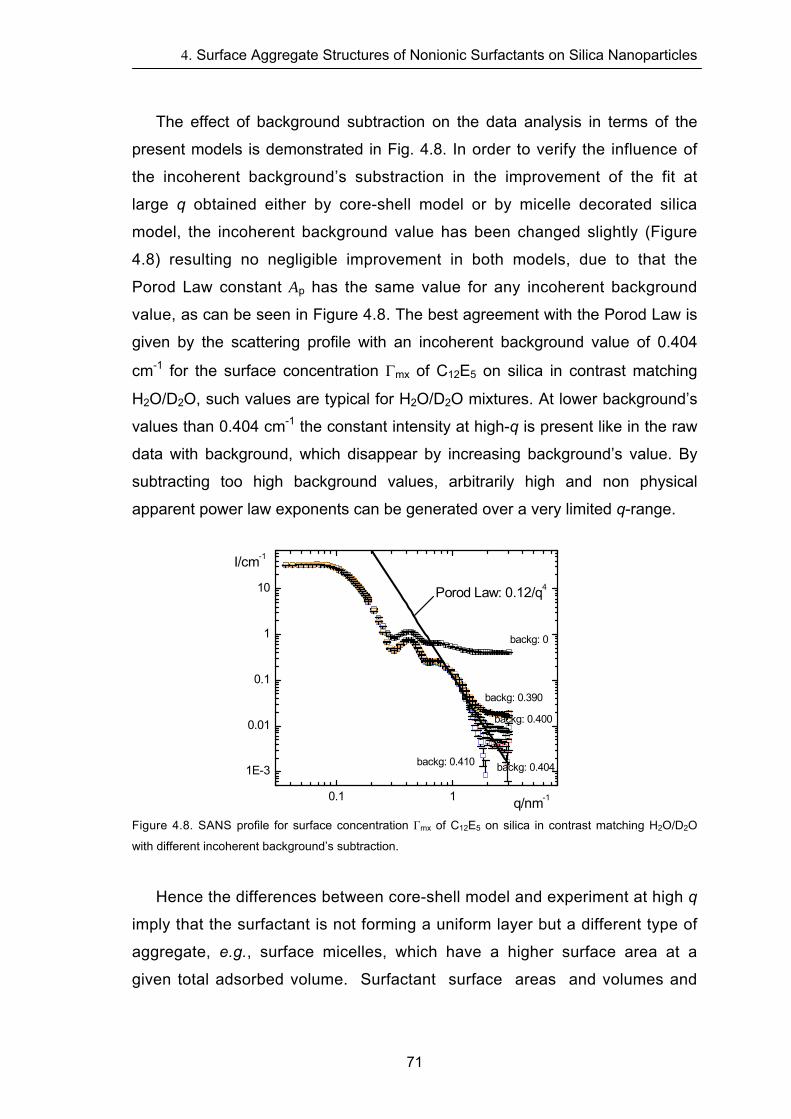
4. Surface Aggregate Structures of Nonionic Surfactants on Silica Nanoparticles
0.1
1E-3
0.01
0.1
1
10
1
backg: 0.410
backg: 0.400
backg: 0.404
backg: 0.390
q/nm-1
backg: 0
Porod Law: 0.12/q4
The effect of background subtraction on the data analysis in terms of the
present models is demonstrated in Fig. 4.8. In order to verify the influence of
the incoherent background’s substraction in the improvement of the fit at
large q obtained either by core-shell model or by micelle decorated silica
model, the incoherent background value has been changed slightly (Figure
4.8) resulting no negligible improvement in both models, due to that the
Porod Law constant Ap has the same value for any incoherent background
value, as can be seen in Figure 4.8. The best agreement with the Porod Law is
given by the scattering profile with an incoherent background value of 0.404
cm-1 for the surface concentration Γmx of C12E5 on silica in contrast matching
H2O/D2O, such values are typical for H2O/D2O mixtures. At lower background’s
values than 0.404 cm-1 the constant intensity at high-q is present like in the raw
data with background, which disappear by increasing background’s value. By
subtracting too high background values, arbitrarily high and non physical
apparent power law exponents can be generated over a very limited q-range.
I/cm-1
Figure 4.8. SANS profile for surface concentration Γmx of C12E5 on silica in contrast matching H2O/D2O
with different incoherent background’s subtraction.
Hence the differences between core-shell model and experiment at high q
imply that the surfactant is not forming a uniform layer but a different type of
aggregate, e.g., surface micelles, which have a higher surface area at a
given total adsorbed volume. Surfactant surface areas and volumes and
71
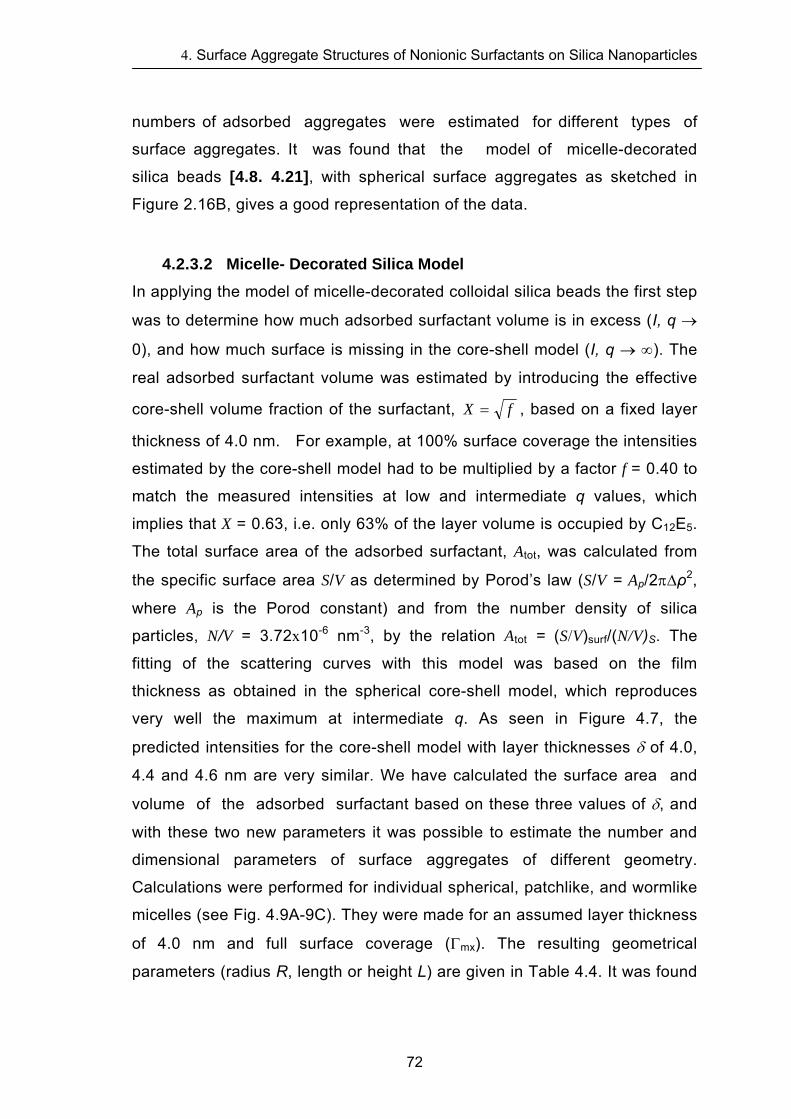
4. Surface Aggregate Structures of Nonionic Surfactants on Silica Nanoparticles
numbers of adsorbed aggregates were estimated for different types of
surface aggregates. It was found that the model of micelle-decorated
silica beads [4.8. 4.21], with spherical surface aggregates as sketched in
Figure 2.16B, gives a good representation of the data.
4.2.3.2 Micelle- Decorated Silica Model
In applying the model of micelle-decorated colloidal silica beads the first step
was to determine how much adsorbed surfactant volume is in excess (I, q →
0), and how much surface is missing in the core-shell model (I, q → ∞). The
real adsorbed surfactant volume was estimated by introducing the effective
core-shell volume fraction of the surfactant, fX = , based on a fixed layer
thickness of 4.0 nm. For example, at 100% surface coverage the intensities
estimated by the core-shell model had to be multiplied by a factor f = 0.40 to
match the measured intensities at low and intermediate q values, which
implies that X = 0.63, i.e. only 63% of the layer volume is occupied by C12E5.
The total surface area of the adsorbed surfactant, Atot, was calculated from
the specific surface area S/V as determined by Porod’s law (S/V = Ap/2πΔρ2,
where Ap is the Porod constant) and from the number density of silica
particles, N/V = 3.72x10⁻⁶ nm-3, by the relation Atot = (S/V)surf/(N/V)S. The
fitting of the scattering curves with this model was based on the film
thickness as obtained in the spherical core-shell model, which reproduces
very well the maximum at intermediate q. As seen in Figure 4.7, the
predicted intensities for the core-shell model with layer thicknesses δ of 4.0,
4.4 and 4.6 nm are very similar. We have calculated the surface area and
volume of the adsorbed surfactant based on these three values of δ, and
with these two new parameters it was possible to estimate the number and
dimensional parameters of surface aggregates of different geometry.
Calculations were performed for individual spherical, patchlike, and wormlike
micelles (see Fig. 4.9A-9C). They were made for an assumed layer thickness
of 4.0 nm and full surface coverage (Γmx). The resulting geometrical
parameters (radius R, length or height L) are given in Table 4.4. It was found
72
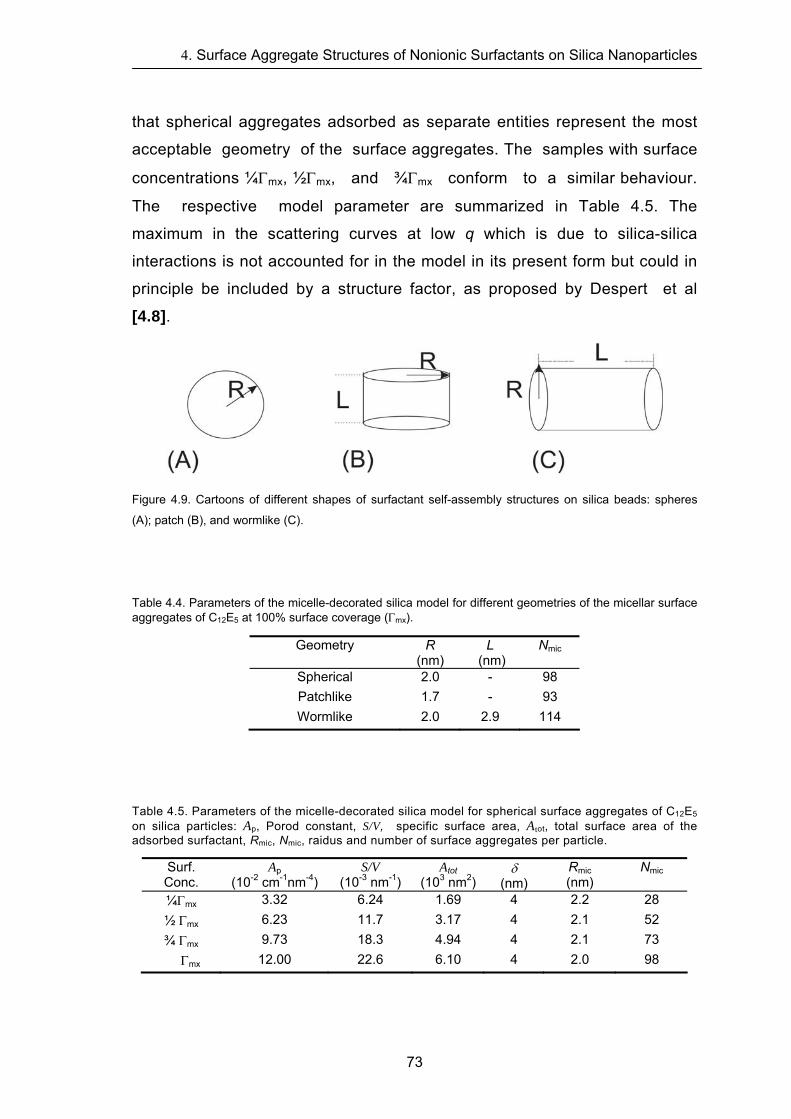
4. Surface Aggregate Structures of Nonionic Surfactants on Silica Nanoparticles
that spherical aggregates adsorbed as separate entities represent the most
acceptable geometry of the surface aggregates. The samples with surface
concentrations ¼Γmx, ½Γmx, and ¾Γmx conform to a similar behaviour.
The respective model parameter are summarized in Table 4.5. The
maximum in the scattering curves at low q which is due to silica-silica
interactions is not accounted for in the model in its present form but could in
principle be included by a structure factor, as proposed by Despert et al
[4.8].
Figure 4.9. Cartoons of different shapes of surfactant self-assembly structures on silica beads: spheres
(A); patch (B), and wormlike (C).
Table 4.4. Parameters of the micelle-decorated silica model for different geometries of the micellar surface aggregates of C12E5 at 100% surface coverage (Γmx).
Geometry R (nm)
L (nm)
Nmic
Spherical 2.0 - 98 Patchlike 1.7 - 93 Wormlike 2.0 2.9 114
Table 4.5. Parameters of the micelle-decorated silica model for spherical surface aggregates of C12E5 on silica particles: Ap, Porod constant, S/V, specific surface area, Atot, total surface area of the adsorbed surfactant, Rmic, Nmic, raidus and number of surface aggregates per particle.
Surf. Conc.
Ap (10-2 cm-1nm-4)
S/V (10-3 nm-1)
Atot (103 nm2)
δ (nm)
Rmic (nm)
Nmic
¼Γmx 3.32 6.24 1.69 4 2.2 28 ½ Γmx 6.23 11.7 3.17 4 2.1 52 ¾ Γmx 9.73 18.3 4.94 4 2.1 73 Γmx 12.00 22.6 6.10 4 2.0 98
73
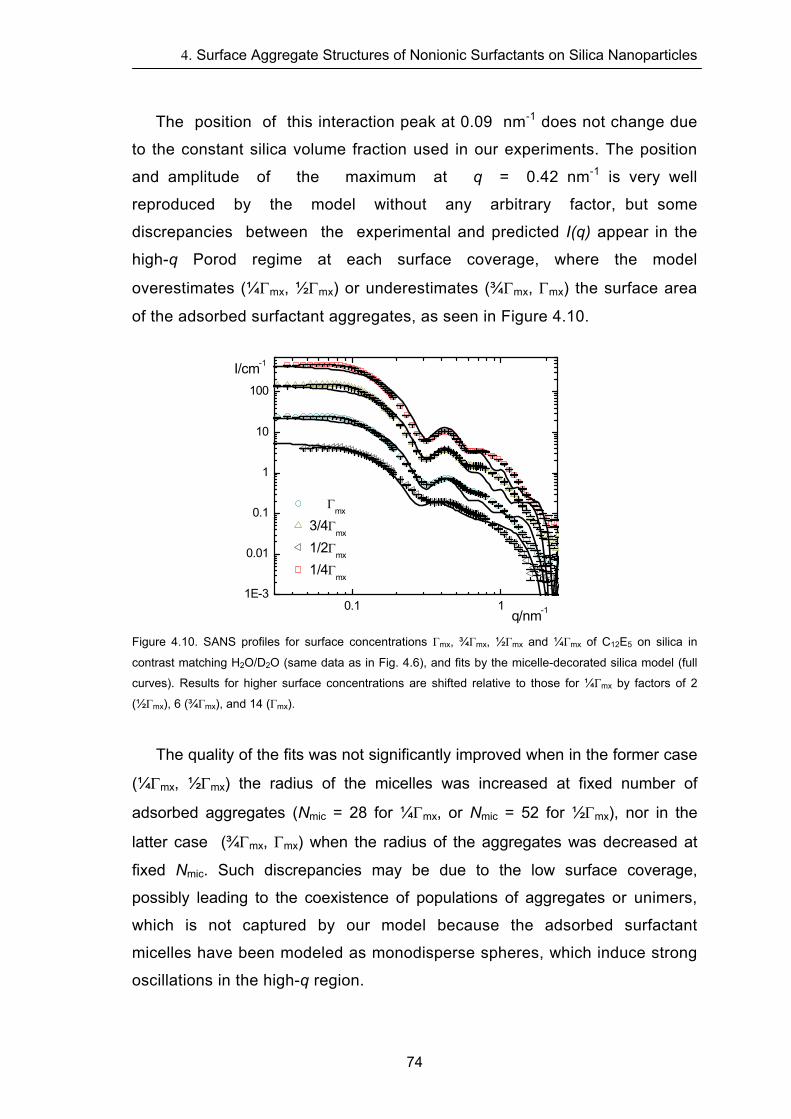
4. Surface Aggregate Structures of Nonionic Surfactants on Silica Nanoparticles
The position of this interaction peak at 0.09 nm-1 does not change due
to the constant silica volume fraction used in our experiments. The position
and amplitude of the maximum at q = 0.42 nm-1 is very well
reproduced by the model without any arbitrary factor, but some
discrepancies between the experimental and predicted I(q) appear in the
high-q Porod regime at each surface coverage, where the model
overestimates (¼Γmx, ½Γmx) or underestimates (¾Γmx, Γmx) the surface area
of the adsorbed surfactant aggregates, as seen in Figure 4.10.
0.11E-3
0.01
0.1
1
10
100
1
Γmx
3/4Γ
mx
1/2Γmx
1/4Γ
mx
I/cm-1
q/nm-1
Figure 4.10. SANS profiles for surface concentrations Γmx, ¾Γmx, ½Γmx and ¼Γmx of C12E5 on silica in
contrast matching H2O/D2O (same data as in Fig. 4.6), and fits by the micelle-decorated silica model (full
curves). Results for higher surface concentrations are shifted relative to those for ¼Γmx by factors of 2
(½Γmx), 6 (¾Γmx), and 14 (Γmx).
The quality of the fits was not significantly improved when in the former case
(¼Γmx, ½Γmx) the radius of the micelles was increased at fixed number of
adsorbed aggregates (Nmic = 28 for ¼Γmx, or Nmic = 52 for ½Γmx), nor in the
latter case (¾Γmx, Γmx) when the radius of the aggregates was decreased at
fixed Nmic. Such discrepancies may be due to the low surface coverage,
possibly leading to the coexistence of populations of aggregates or unimers,
which is not captured by our model because the adsorbed surfactant
micelles have been modeled as monodisperse spheres, which induce strong
oscillations in the high-q region.
74
4. Surface Aggregate Structures of Nonionic Surfactants on Silica Nanoparticles
4.3 Discussion
The present study builds on the early work of Cummins et al. [4.6] who
indicated that the SANS scattering profiles of CnEm surfactants on Ludox
silica could result from surface micelles, and on the first detailed
description of the geometry of such surface micelles by one of the present
authors [4.21]. The experiments were made with the home-made silica
instead of commercial Ludox in order to attain a better control of the mean
particle size, a lower polydispersity and a better colloidal stability of the
samples. The surface chemistry of these samples may be somewhat
different from that of Ludox, but this point is considered not important. A
prominent feature of the scattering profiles of silica with adsorbed C12E5 is
the maximum in I(q) at q = 0.42 nm-1 which can be taken as a measure of the
amount of surfactant forming the adsorbed layer. The analysis of the
scattering profiles has shown, however, that the spherical core-shell model
adjusted to this maximum in I(q) strongly underestimates the surface area of
the adsorbed surfactant as extracted from the high-q regime of the scattering
profiles. This result suggests that the adsorbed surfactant is not forming a
uniform bilayer but a different type of aggregate. On the basis of the micelle-
decorated silica model, assuming spherical micellar surface aggregates, it is
found that the number of adsorbed aggregates Nmic increases as the
concentration of surfactant in the system is increased (Table 4.5 and Fig.
4.10). The model also predicts that the micelle radius Rmic somewhat
decreases as the surfactant loading is increased. However, this predicted
trend is probably not significant due to the limited resolution of the
experimental data. The resulting mean value of Rmic is similar to the cross-
sectional radius of the wormlike micelles of C12E5 formed in aqueous
solutions (R ≈ 2.4 nm) as obtained from Guinier expression for cylindrical
micelles.
For spherical surface aggregates the micelle-decorated silica model
predicts that the number of surface aggregates per silica particle, Nmic, can
be as high as about one hundred (Table 4.5). This large number corresponds
to a dense layer of surface micelles, as can be seen from graphical
75
4. Surface Aggregate Structures of Nonionic Surfactants on Silica Nanoparticles
representations of model results (not shown), or by a simple estimation of the
maximum number of spheres of radius Rmic in contact with a central sphere
of radius RSi. Assuming that the smaller spheres arrange on a hexagonal
lattice at a distance (RS + Rmic) from the centre, then Nmax = (2π/√3)(s
+ 1)2, where s = RS/Rmic. With RS = 8.2 nm and Rmic = 2.0 nm we find Nmax =
94. Hence at the highest surface concentration, the layer geometry
consistent with the scattering data is a dense layer of micelles. Admittedly,
the exact geometry of this layer may differ from the one proposed here, e.g.
the micelles might form bridges and build an undulating bilayer. In this case,
however, high bending energy of the surfactant monolayer, forcing it to
deviate from its preferred globular arrangement, would have to be accounted
for. In summary, the micelle-decorated silica bead model accounts
simultaneously for the high coverage, and the high specific surface area as
measured (model-free) in the high-q range.
The finding that C12E5 is adsorbed in the form of small surface micelles at
the silica beads is remarkable in view of the fact that aggregates of smaller
mean curvature (e.g., wormlike micelles) are favoured in aqueous solutions
and bilayer films are formed in the adsorption onto flat surfaces. We
conjecture that the preference for small surface aggregates is a
consequence of the high surface curvature of the silica nanoparticles which
prevents an effective packing of the surfactant molecules in a bilayer film.
Note that for particles of radius 8 nm and a bilayer thickness of 4 nm the
mean area per molecule at the mid-plane of the bilayer is 50% greater than
the respective area directly at the surface. Accordingly, an effective packing
of the hydrophobic tails is not possible in a bilayer configuration (even if
more molecules are accommodated in the outer layer than in the inner layer).
Instead, small (roughly spherical) aggregates will be favoured, as these
aggregates allow the most effective packing of the hydrophobic tails on small
spherical particles. This argument applies not only to the region of low
surface concentrations but also to the plateau region of the isotherm. Further
work with silica particles of different size and surfactants of different packing
parameters is needed to corroborate these findings.
76
4. Surface Aggregate Structures of Nonionic Surfactants on Silica Nanoparticles
References of Chapter 4 [4.1] McDermott, D. C.; Lu, J. R.; Lee, E. M.; Thomas, R. K.; Rennie, A. R. Langmuir, 1992, 8,
1204-1210.
[4.2] Böhmer, M. R.; Koopal, L. K.; Janssen, R.; Lee, E. M.; Thomas R. K.; Rennie, A. R.
Langmuir, 1992, 8, 2228-2239.
[4.3] (a) Tiberg, F.; Jönsson, B.; Tang J.; Lindman, B. Langmuir, 1994, 10, 2294-2300. (b)
Tiberg, F. J. Chem. Soc., Faraday Trans. II, 1996, 92, 531-538.
[4.4] Howse, J. R.; Steitz, R.; Pannek, M.; Simon, P.; Schubert, D. W.; Findenegg, G. H. Phys.
Chem. Chem. Phys., 2001, 3, 4044-4051.
[4.5] Matsson, M. K.; Kronberg, B.; Claesson, P. M. Langmuir, 2004, 20, 4051-4058.
[4.6] (a) Cummins, P. G.; Staples, E.; Penfold, J. J. Phys. Chem., 1990, 94, 3740-3745. (b)
Cummins, P. G.; Penfold, J.; Staples, E. J. Phys. Chem., 1992, 96, 8092-8094. (c) Penfold, J.;
Staples, E.; Tucker, I.; Cummins, P. J. Phys, Chem., 1996, 100, 18133-18137.
[4.7] Giordano-Palmino, F.; Denoyel, R.; Rouquerol, J. J. Colloid Interface Sci., 1994, 165, 82-
90.
[4.8] Despert, G.; Oberdisse, J. Langmuir, 2003, 19, 7604-7610.
[4.9] (a) Levitz, P.; van Damme, H.; Keravis, D. J. Phys. Chem., 1984, 88, 2228-2235. (b)
Levitz, P.; van Damme, H. J. Phys. Chem., 1986, 90, 1302-1310. (c) Ström, C.; Hansson, P.;
Jönsson, B.; Söderman, O. Langmuir, 2000, 16, 2469-2474.
[4.10] Qiao, Y.; Schönhoff, M.; Findenegg, G. H. Langmuir, 2003, 19, 6160-6167.
[4.11] Findenegg, G. H.; Eltekov, A. Y. J. Chromatogr. A, 2007, 1150, 236-240.
[4.12] Dietsch, O.; Eltekov, A.; Bock, H.; Gubbins, K. E.; Findenegg, G. H. J. Phys. Chem. C,
2007, 111, 16045-16054.
[4.13] Manne, S. ; Gaub, H.E. Science, 1995, 270, 1480-1482.
[4.14] Dong, J.; Mao, G. Langmuir, 2000, 16, 6641-6647.
[4.15] Patrick, H. N.; Warr, G. G.; Manne, S.; Aksay, I. A. Langmuir, 1997, 13, 4349-4356.
[4.16] Grant, L. M.; Tiberg, F.; Ducker, W. A. J. Phys. Chem. B, 1998, 102, 4288-4294.
[4.17] (a) Tiberg, F.; Brinck, J.; Grant, L. M. Current Opin. Colloid Interface Sci., 1999, 4, 411-
419. (b) Warr, G. G. Current Opin. Colloid Interface Sci., 2000, 5, 88-94.
[4.18] (a) Király, Z.; Börner, R. H. K.; Findenegg, G. H. Langmuir, 1997, 13, 3308-3315. (b)
Király, Z.; Findenegg, G. H. Langmuir, 2000, 16, 8842-8849.
[4.19] Schulz, J. C.; Warr, G. G.; Hamilton, W. A.; Butler, P. D. J Phys Chem B, 1999, 103,
11057-11063.
[4.20] Steitz, R.; Müller-Buschbaum, P.; Schemmel, S.; Cubitt, R.; Findenegg, G. H. Europhys.
Lett., 2004, 67, 962-968.
[4.21] Oberdisse, J. Phys. Chem. Chem. Phys., 2004, 6, 1557-1561.
[4.22] Stoeber, W.; Fink, A.; Bohn, E. J. Colloid Interface Sci., 1968, 26, 62-69.
77
4. Surface Aggregate Structures of Nonionic Surfactants on Silica Nanoparticles
78
[4.23] (a) Hayter, J. B.; Penfold, J. Mol. Phys., 1981, 42, 109-118. (b) Hansen, J. P.; Hayter, J.
B. Mol. Phys., 1982, 46, 651-656.
[4.24] Gellan, A.; Rochester, C. H. J. Chem. Soc., Faraday Trans. 1, 1985, 81, 2235-2245.
[4.25] Gu, T.; Zhu, B.-Y. Colloids Surf., 1990, 44, 81-87.
[4.26] Lugo, D.; Prévost, S.; Findenegg, G. H. unpublished work.
[4.27] (a) Menge, U.; Lang, P.; Findenegg, G. H. J. Phys. Chem. B, 1999, 103, 5768-5774. (b)
Menge, U.; Lang, P.; Findenegg, G. H.; Strunz, P. J. Phys. Chem. B 2003, 107, 1316-1320.
5 Effect of Nanoparticle Size on the Morphology of Adsorbed Surfactant Layers*
5.1 Introduction
Surfactants play an important role in many industrial processes involving
colloidal dispersions, as their adsorption onto the particles often leads to
enhanced colloid stability. A structural characterization of this adsorbed layer is
a prerequisite for gaining a better understanding of its mode of operation in
stabilizing or flocculating dispersion. Adsorption isotherms of nonionic
surfactants on hydrophilic (oxide) surfaces commonly exhibit a pronounced
sigmoidal shape, i.e., a low-affinity initial region followed by a region in which
the adsorption increases steeply and reaches a plateau near the critical micelle
concentration (CMC) [5.1]. This behavior suggests that adsorption represents a
surface aggregation similar to micelle formation in solution. Scanning probe
microscopy (AFM) studies at planar surfaces indicated that either laterally
uniform surfactant bilayers or small surface micelles may be formed, depending
on the nature of the surfactant head group and the degree of hydrophilicity of
the solid surface [5.2]. The nature of the surfactant layers adsorbed on colloidal
particles in aqueous dispersions was studied by small-angle neutron scattering
(SANS), which allows to highlight the adsorbed layer against a uniform
scattering background by matching the colloidal particles with a partially
deuterated aqueous solvent [5.3-5.7]. In the earlier of these studies the
adsorbed surfactant was modeled as a laterally uniform layer [5.3, 5.4], but the
existence of discrete micellar aggregates at the surface of the silica particles
(‘micelle-decorated silica beads’) has been reported more recently [5.5-5.7]. Recently we reported that the surfactant penta(ethyleneglycol) monododecyl
ether (C12E5) is adsorbed in the form of individual spherical surface aggregates
on silica nanoparticles of 16 nm diameter [5.7], in agreement with earlier
*modified from published article in J. Phys. Chem. B: Lugo, D.M.; Oberdisse, J.; Lapp, A.; Findenegg, G.H. J. Phys.
Chem. B 2010, 114, 4183-4191.
5. Effect of Nanoparticle Size on the Morphology of Adsorbed Surfactant Layers
findings for the surfactant Triton X-100 on Bindziltype silica particles of similar
size [5.5, 5.6]. This finding is remarkable in view of the fact that C12E5 prefers
aggregates of lower mean curvature, viz., worm-like micelles in aqueous
solutions [5.8, 5.9], and a laterally homogeneous bilayer on planar hydrophilic
silica surfaces [5.2a]. We conjectured that the preference for small surface
micelles is a consequence of the high surface curvature of the silica
nanoparticles, which prevents an effective packing of the hydrophobic tails in an
adsorbed bilayer, whereas a favorable packing of the tails is possible in a
spherical micelle. In order to test this concept and to find out to what extent the
structure of the adsorbed layer at the surface of the silica nanoparticles
depends on the size and chemical nature of the surfactant head group it was of
interest to extend this study to a different class of nonionic surfactants. On the
other hand, it was of interest to study the influence of size of the silica
nanoparticles on the surface aggregate structure of the surfactant.
The present study was performed with dimethyldodecylamine-N-oxide
(C12DAO), an amphoteric surfactant that exists in a zwitterionic (net non-ionic)
form at pH above 7, but in a cationic form at low pH due to a protonation of the
head group. C12DAO has a much smaller head group of less hydrophilic
character than C12E5 [5.10]. Phase diagrams, thermodynamics and self-
assembly structures of aqueous systems of alkyl dimethylamine oxides have
been extensively studied [5.11], and the interaction of alkyl DAO systems with
hydrophilic and hydrophobic surfaces was investigated by adsorption
calorimetry [5.12. 5.13a] and streaming potential measurements [5.13b]. Based
on the adsorption enthalpy results, Pettersson and Rosenholm [5.13a] concluded that the adsorption mechanism at the solution/silica interface of
C12DAO in its nonionic form is different from that in the protonated form, and
they speculated that in the nonionic form C12DAO forms ellipsoidal aggregates;
while in the protonated form C10DAO and C12DAO are likely to form spherical
surface micelles. The conclusion about the formation of spherical surface
micelles by C10DAO on silica was consistent with the sorption enthalpy results
of Király and Findenegg [5.12]. However, in neither of these studies direct
information about the surface aggregate structures was obtained. In the present
80
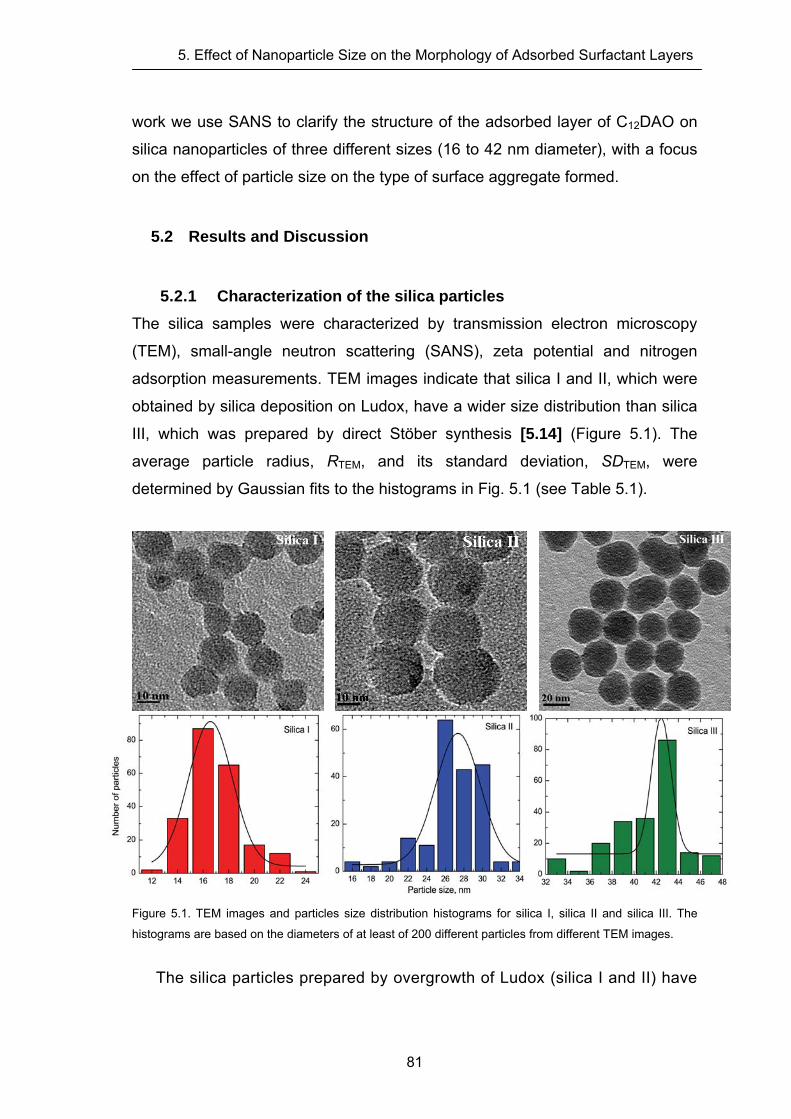
5. Effect of Nanoparticle Size on the Morphology of Adsorbed Surfactant Layers
work we use SANS to clarify the structure of the adsorbed layer of C12DAO on
silica nanoparticles of three different sizes (16 to 42 nm diameter), with a focus
on the effect of particle size on the type of surface aggregate formed.
5.2 Results and Discussion
5.2.1 Characterization of the silica particles
The silica samples were characterized by transmission electron microscopy
(TEM), small-angle neutron scattering (SANS), zeta potential and nitrogen
adsorption measurements. TEM images indicate that silica I and II, which were
obtained by silica deposition on Ludox, have a wider size distribution than silica
III, which was prepared by direct Stöber synthesis [5.14] (Figure 5.1). The
average particle radius, RTEM, and its standard deviation, SDTEM, were
determined by Gaussian fits to the histograms in Fig. 5.1 (see Table 5.1).
Figure 5.1. TEM images and particles size distribution histograms for silica I, silica II and silica III. The
histograms are based on the diameters of at least of 200 different particles from different TEM images.
The silica particles prepared by overgrowth of Ludox (silica I and II) have
81
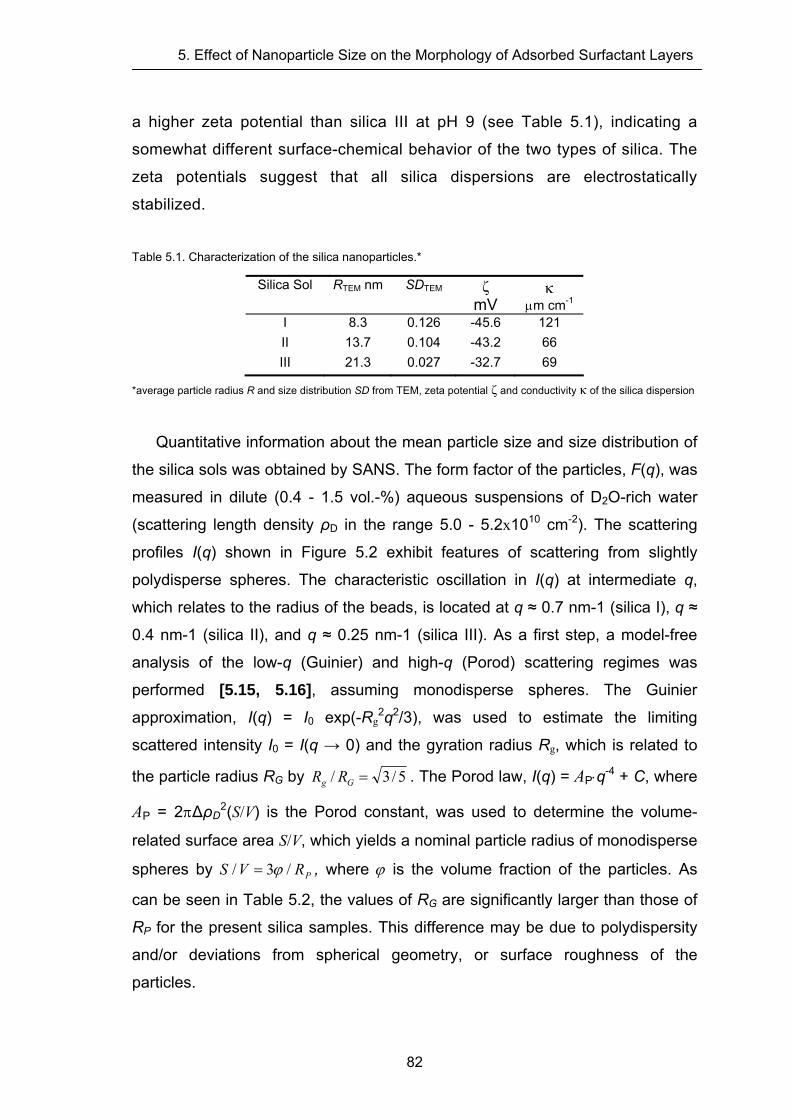
5. Effect of Nanoparticle Size on the Morphology of Adsorbed Surfactant Layers
a higher zeta potential than silica III at pH 9 (see Table 5.1), indicating a
somewhat different surface-chemical behavior of the two types of silica. The
zeta potentials suggest that all silica dispersions are electrostatically
stabilized.
Table 5.1. Characterization of the silica nanoparticles.*
Silica Sol RTEM nm SDTEM ζ mV
κ μm cm-1
I 8.3 0.126 -45.6 121 II 13.7 0.104 -43.2 66 III 21.3 0.027 -32.7 69
*average particle radius R and size distribution SD from TEM, zeta potential ζ and conductivity κ of the silica dispersion
Quantitative information about the mean particle size and size distribution of
the silica sols was obtained by SANS. The form factor of the particles, F(q), was
measured in dilute (0.4 - 1.5 vol.-%) aqueous suspensions of D2O-rich water
(scattering length density ρD in the range 5.0 - 5.2x1010 cm-2). The scattering
profiles I(q) shown in Figure 5.2 exhibit features of scattering from slightly
polydisperse spheres. The characteristic oscillation in I(q) at intermediate q,
which relates to the radius of the beads, is located at q ≈ 0.7 nm-1 (silica I), q ≈
0.4 nm-1 (silica II), and q ≈ 0.25 nm-1 (silica III). As a first step, a model-free
analysis of the low-q (Guinier) and high-q (Porod) scattering regimes was
performed [5.15, 5.16], assuming monodisperse spheres. The Guinier
approximation, I(q) = I0 exp(-Rg2q2/3), was used to estimate the limiting
scattered intensity I0 = I(q → 0) and the gyration radius Rg, which is related to
the particle radius RG by 5/3/ =Gg RR . The Porod law, I(q) = AP⋅q-4 + C, where
AP = 2π∆ρD2(S/V) is the Porod constant, was used to determine the volume-
related surface area S/V, which yields a nominal particle radius of monodisperse
spheres by PRVS /3/ ϕ= , where ϕ is the volume fraction of the particles. As
can be seen in Table 5.2, the values of RG are significantly larger than those of
RP for the present silica samples. This difference may be due to polydispersity
and/or deviations from spherical geometry, or surface roughness of the
particles.
82
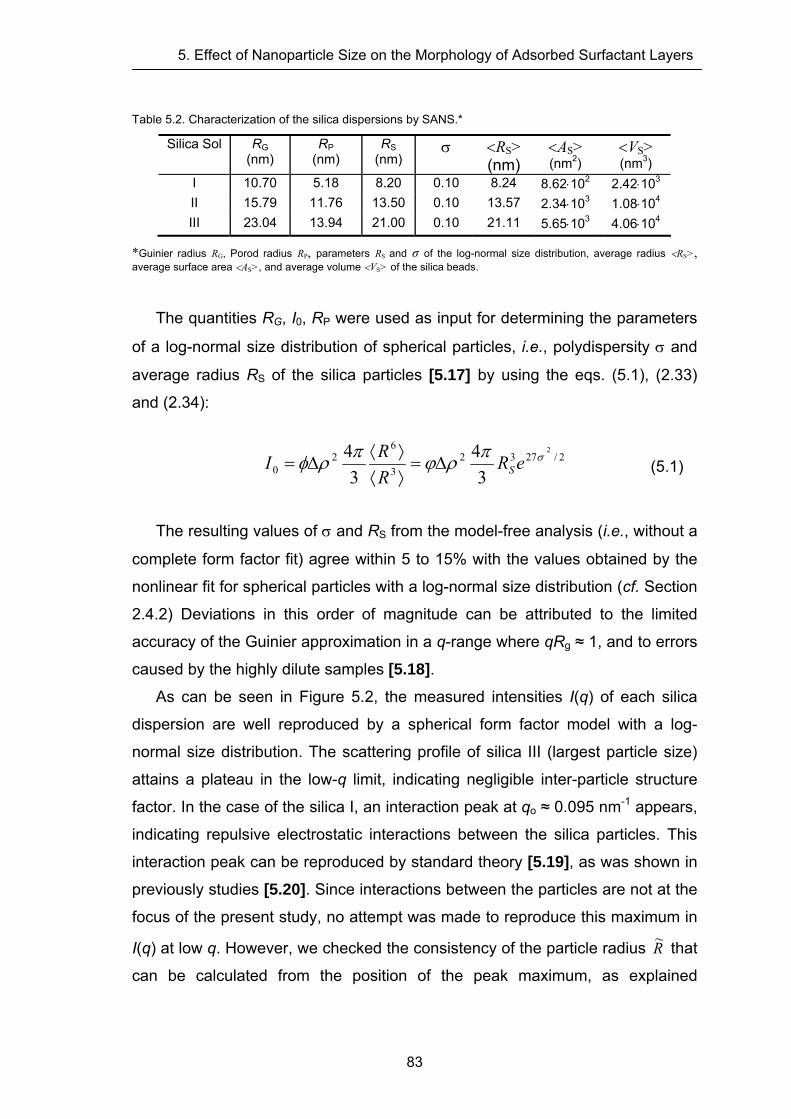
5. Effect of Nanoparticle Size on the Morphology of Adsorbed Surfactant Layers
Table 5.2. Characterization of the silica dispersions by SANS.*
Silica Sol RG (nm)
RP (nm)
RS (nm)
σ <RS> (nm)
<AS> (nm2)
<VS> (nm3)
I 10.70 5.18 8.20 0.10 8.24 8.62⋅102 2.42⋅103 II 15.79 11.76 13.50 0.10 13.57 2.34⋅103 1.08⋅104 III 23.04 13.94 21.00 0.10 21.11 5.65⋅103 4.06⋅104
*Guinier radius RG, Porod radius RP, parameters RS and σ of the log-normal size distribution, average radius <RS>, average surface area <AS>, and average volume <VS> of the silica beads.
The quantities RG, I0, RP were used as input for determining the parameters
of a log-normal size distribution of spherical particles, i.e., polydispersity σ and
average radius RS of the silica particles [5.17] by using the eqs. (5.1), (2.33)
and (2.34):
2/2732
3
62
0
2
34
34 σπρϕπρφ eR
RRI SΔ=⟩⟨⟩⟨
Δ= (5.1)
The resulting values of σ and RS from the model-free analysis (i.e., without a
complete form factor fit) agree within 5 to 15% with the values obtained by the
nonlinear fit for spherical particles with a log-normal size distribution (cf. Section
2.4.2) Deviations in this order of magnitude can be attributed to the limited
accuracy of the Guinier approximation in a q-range where qRg ≈ 1, and to errors
caused by the highly dilute samples [5.18]. As can be seen in Figure 5.2, the measured intensities I(q) of each silica
dispersion are well reproduced by a spherical form factor model with a log-
normal size distribution. The scattering profile of silica III (largest particle size)
attains a plateau in the low-q limit, indicating negligible inter-particle structure
factor. In the case of the silica I, an interaction peak at qo ≈ 0.095 nm-1 appears,
indicating repulsive electrostatic interactions between the silica particles. This
interaction peak can be reproduced by standard theory [5.19], as was shown in
previously studies [5.20]. Since interactions between the particles are not at the
focus of the present study, no attempt was made to reproduce this maximum in
I(q) at low q. However, we checked the consistency of the particle radius R~ that
can be calculated from the position of the peak maximum, as explained
83
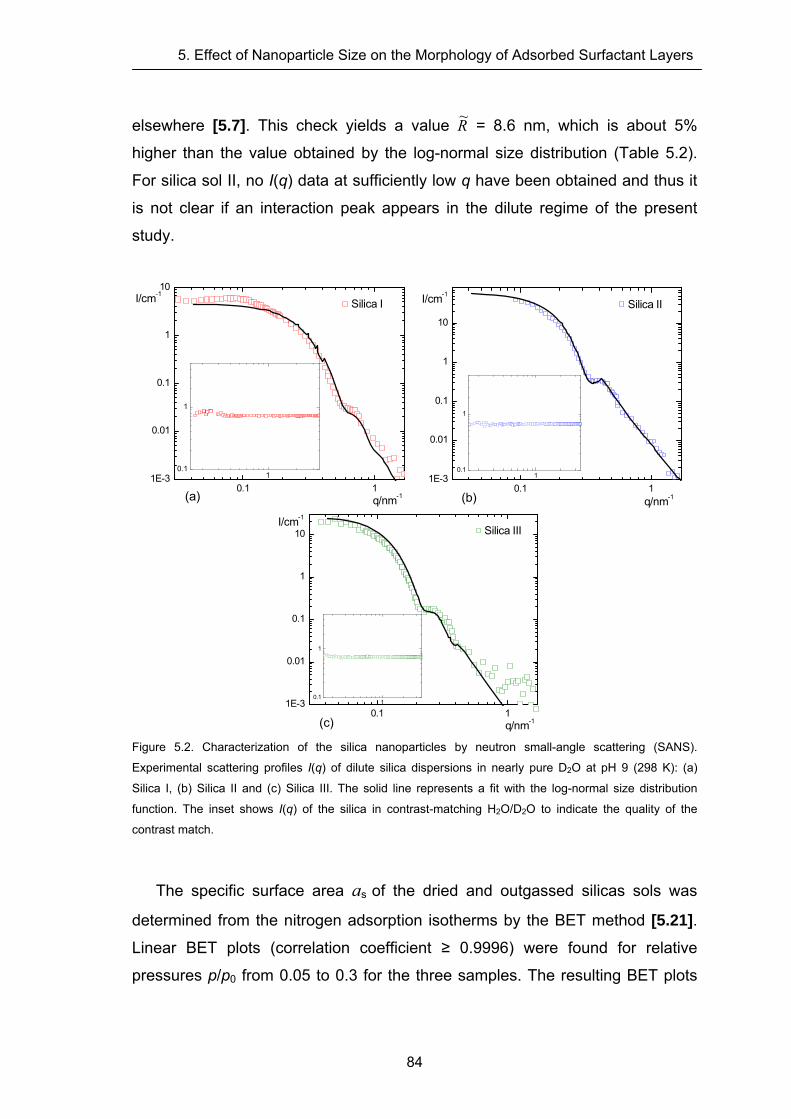
5. Effect of Nanoparticle Size on the Morphology of Adsorbed Surfactant Layers
elsewhere [5.7]. This check yields a value R~ = 8.6 nm, which is about 5%
higher than the value obtained by the log-normal size distribution (Table 5.2).
For silica sol II, no I(q) data at sufficiently low q have been obtained and thus it
is not clear if an interaction peak appears in the dilute regime of the present
study.
0.1 11E-3
0.01
0.1
1
10
(a)
10.1
1
Figure 5.2. Characterization of the silica nanoparticles by neutron small-angle scattering (SANS).
Experimental scattering profiles I(q) of dilute silica dispersions in nearly pure D2O at pH 9 (298 K): (a)
Silica I, (b) Silica II and (c) Silica III. The solid line represents a fit with the log-normal size distribution
function. The inset shows I(q) of the silica in contrast-matching H2O/D2O to indicate the quality of the
contrast match.
I/cm-1
q/nm-1
Silica I
0.1 11E-3
0.01
0.1
1
10
10.1
1
I/cm-1
q/nm-1
Silica II
(b)
0.1 11E-3
0.01
0.1
1
10
(c)
10.1
1
I/cm-1
q/nm-1
Silica III
The specific surface area as of the dried and outgassed silicas sols was
determined from the nitrogen adsorption isotherms by the BET method [5.21]. Linear BET plots (correlation coefficient ≥ 0.9996) were found for relative
pressures p/p0 from 0.05 to 0.3 for the three samples. The resulting BET plots
84
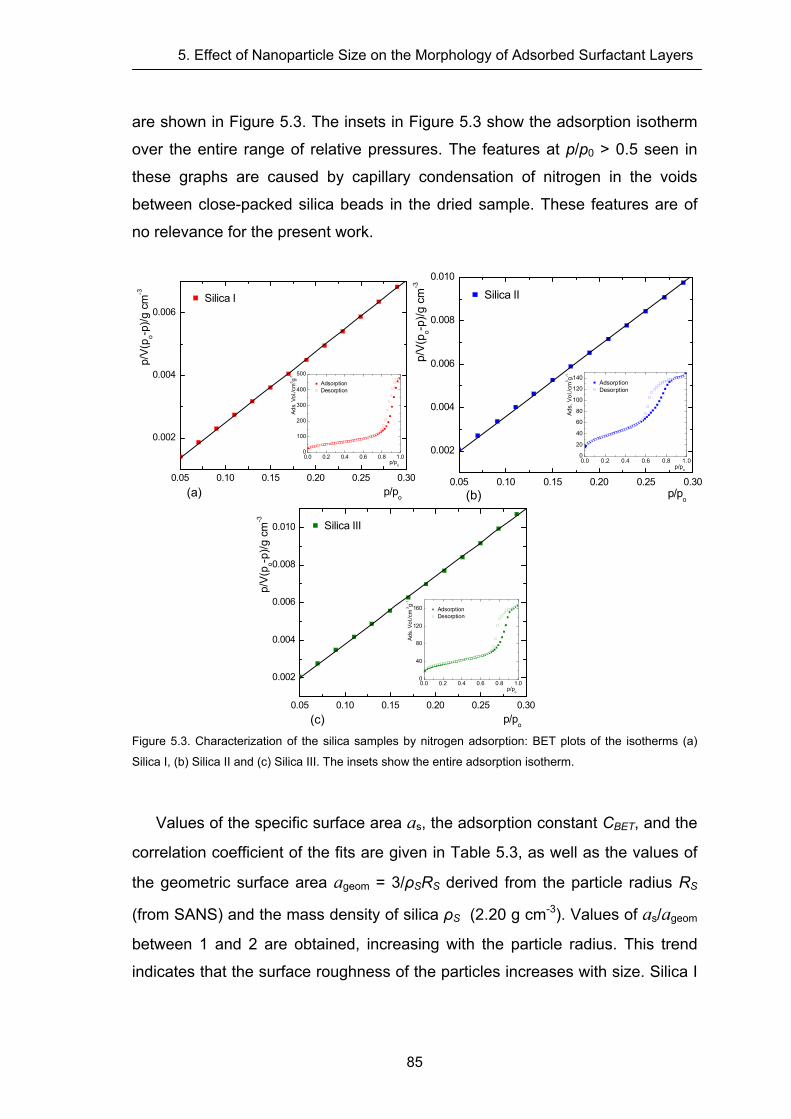
5. Effect of Nanoparticle Size on the Morphology of Adsorbed Surfactant Layers
85
are shown in Figure 5.3. The insets in Figure 5.3 show the adsorption isotherm
over the entire range of relative pressures. The features at p/p0 > 0.5 seen in
these graphs are caused by capillary condensation of nitrogen in the voids
between close-packed silica beads in the dried sample. These features are of
no relevance for the present work.
0.05 0.10 0.15 0.20 0.25 0.30
0.002
0.004
0.006
(a)
0.0 0.2 0.4 0.6 0.8 1.00
100
200
300
400
500
Ads
. Vol
./cm
3 g-1
p/po
Adsorption Desorption
o
p/po
p/V(
p-p
)/g c
m-3 Silica I
0.05 0.10 0.15 0.20 0.25 0.30
0.002
0.004
0.006
0.008
0.010
(b)
0.0 0.2 0.4 0.6 0.8 1.00
20
40
60
80
100
120
140
Ads.
Vol
./cm
3 g-1
p/po
Adsorption Desorption
p/V(
p o-p)/g
cm
-3
p/po
Silica II
0.05 0.10 0.15 0.20 0.25 0.30
0.002
0.004
0.006
0.008
0.010
(c)
0.0 0.2 0.4 0.6 0.8 1.00
40
80
120
160
Ads.
Vol
./cm
3 g-1
p/po
Adsorption Desorption
p/V(
p o-p)/g
cm
-3
p/po
Silica III
Figure 5.3. Characterization of the silica samples by nitrogen adsorption: BET plots of the isotherms (a)
Silica I, (b) Silica II and (c) Silica III. The insets show the entire adsorption isotherm.
Values of the specific surface area as, the adsorption constant CBET, and the
correlation coefficient of the fits are given in Table 5.3, as well as the values of
the geometric surface area ageom = 3/ρSRS derived from the particle radius RS
(from SANS) and the mass density of silica ρS (2.20 g cm-3). Values of as/ageom
between 1 and 2 are obtained, increasing with the particle radius. This trend
indicates that the surface roughness of the particles increases with size. Silica I
5. Effect of Nanoparticle Size on the Morphology of Adsorbed Surfactant Layers
(as/ageom = 1.14) has a very low surface roughness, while the value as/ageom =
1.85 for silica III indicates significant roughness (surface corrugations at a
periodicity l ≈ 1 nm and profile depth d ≈ l). Alternatively, the result for silica III
may be explained by a moderate degree of microporosity.
Table 5.3. Surface characterization of the silicas by nitrogen adsorption.*
Silica Sol as, m2 g-1
CBET Corr. Coeff.
ageom, m2 g-1
as/ageom
I 190 97 0.9997 166 1.14 II 134 70 0.9999 101 1.33 III 120 175 0.9996 65 1.85
*Specific surface area as from the BET analysis; geometrical surface area ageom from the particle radius and mass density of silica.
5.2.2 SANS study of adsorbed C12DAO layer Scattering profiles I(q) for C12DAO in the absence and presence of silica
particles are shown in Figure 5.4. These SANS measurements (and those
presented in the later figures) were made in contrast-matching H2O/D2O, so that
the scattering contrast is solely due to the surfactant. Accordingly, the difference
in the scattering profiles obtained in the absence and presence of silica in Fig.
5.4 must be due to a different organization of the surfactant. As discussed later,
the scattering profile in the absence of silica is indicative of surfactant micelles
of ellipsoidal shape, while the scattering profile in the presence of silica
indicates that the surfactant forms an adsorbed layer on the silica particles.
Figure 5.4 also shows that addition of an electrolyte (0.1 M NaBr) to the silica-
containing system is causing no significant changes of the scattering profile,
indicating that the electrolyte does not affect the adsorption at the silica surface.
The profiles in Fig. 5.4 were obtained with silica II at a surfactant concentration
corresponding to a nearly complete adsorbed layer (⅞Γmx), but analogous
results were found with silica I in the absence and presence of 0.1 M NaBr. The
absence of a salt effect on the adsorption is expected because at the given pH
C12DAO behaves as a nonionic surfactant with negligible degree of protonation
[5.13].
86
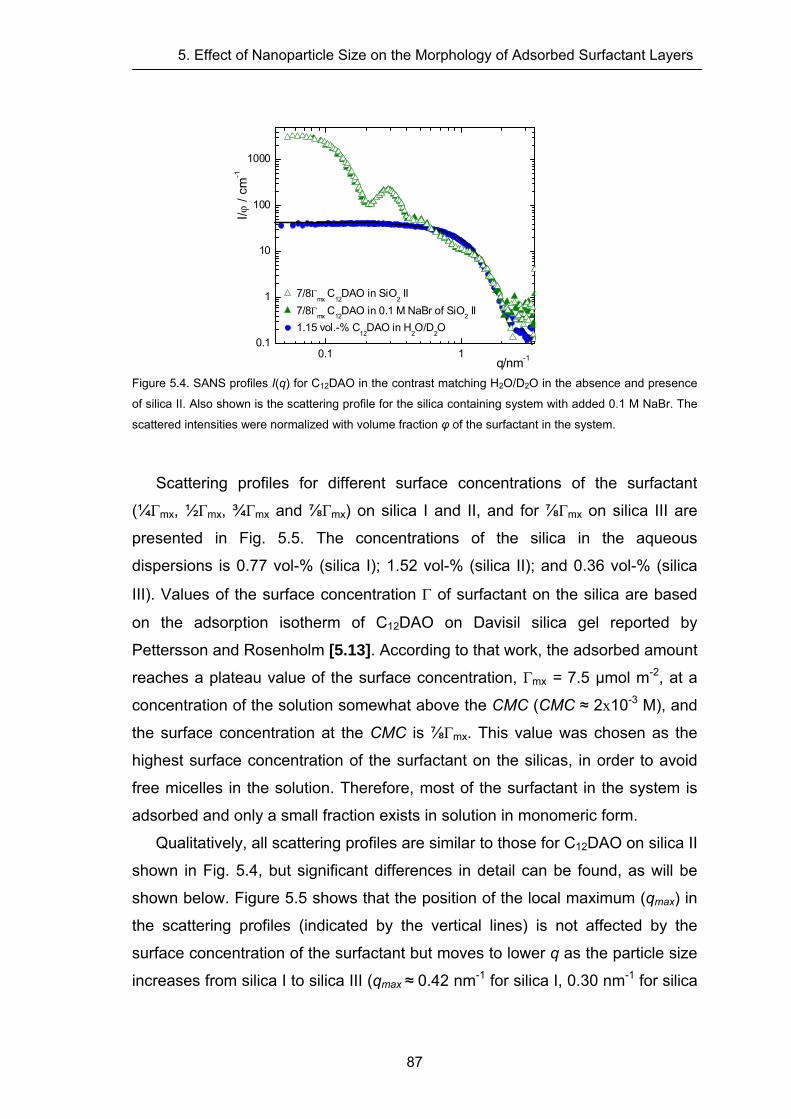
5. Effect of Nanoparticle Size on the Morphology of Adsorbed Surfactant Layers
0.1 10.1
1
10
100
1000
q/nm-1
I/ϕ /
cm-1
7/8Γmx
C12
DAO in SiO2 II
7/8Γmx C12DAO in 0.1 M NaBr of SiO2 II 1.15 vol.-% C
12DAO in H
2O/D
2O
Figure 5.4. SANS profiles I(q) for C12DAO in the contrast matching H2O/D2O in the absence and presence
of silica II. Also shown is the scattering profile for the silica containing system with added 0.1 M NaBr. The
scattered intensities were normalized with volume fraction φ of the surfactant in the system.
Scattering profiles for different surface concentrations of the surfactant
(¼Γmx, ½Γmx, ¾Γmx and ⅞Γmx) on silica I and II, and for ⅞Γmx on silica III are
presented in Fig. 5.5. The concentrations of the silica in the aqueous
dispersions is 0.77 vol-% (silica I); 1.52 vol-% (silica II); and 0.36 vol-% (silica
III). Values of the surface concentration Γ of surfactant on the silica are based
on the adsorption isotherm of C12DAO on Davisil silica gel reported by
Pettersson and Rosenholm [5.13]. According to that work, the adsorbed amount
reaches a plateau value of the surface concentration, Γmx = 7.5 µmol m-2, at a
concentration of the solution somewhat above the CMC (CMC ≈ 2x10⁻³ M), and
the surface concentration at the CMC is ⅞Γmx. This value was chosen as the
highest surface concentration of the surfactant on the silicas, in order to avoid
free micelles in the solution. Therefore, most of the surfactant in the system is
adsorbed and only a small fraction exists in solution in monomeric form.
Qualitatively, all scattering profiles are similar to those for C12DAO on silica II
shown in Fig. 5.4, but significant differences in detail can be found, as will be
shown below. Figure 5.5 shows that the position of the local maximum (qmax) in
the scattering profiles (indicated by the vertical lines) is not affected by the
surface concentration of the surfactant but moves to lower q as the particle size
increases from silica I to silica III (qmax ≈ 0.42 nm-1 for silica I, 0.30 nm-1 for silica
87
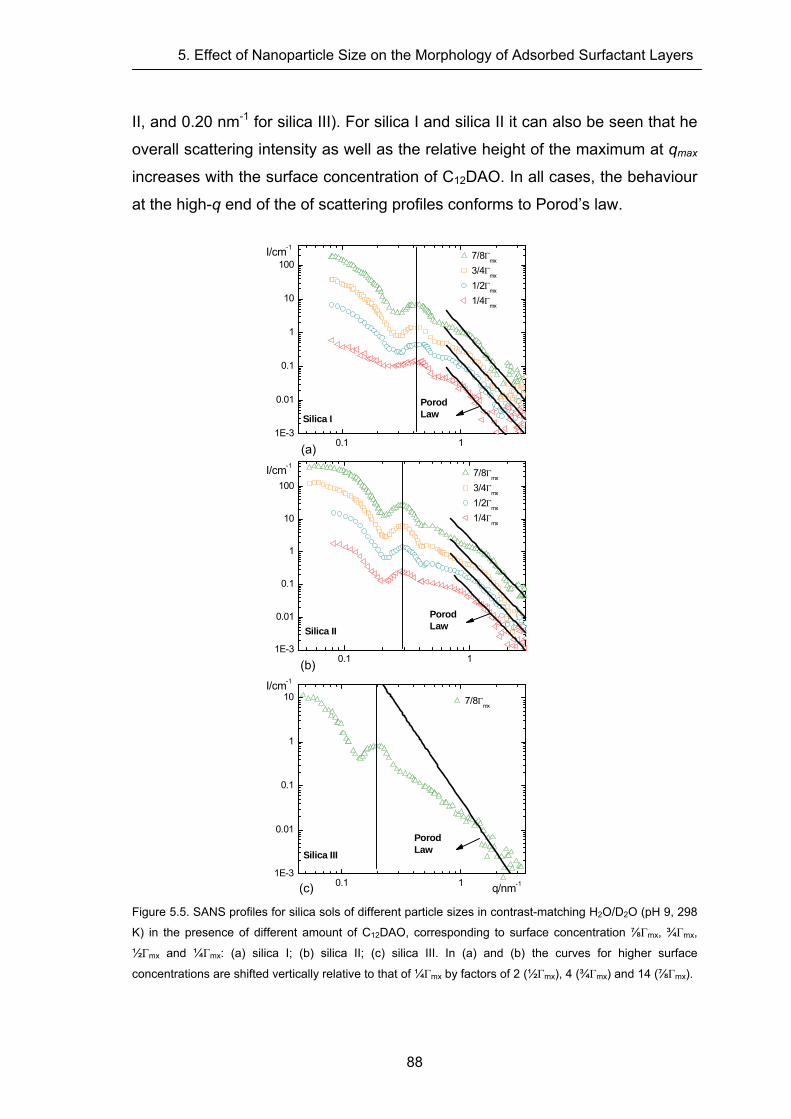
5. Effect of Nanoparticle Size on the Morphology of Adsorbed Surfactant Layers
II, and 0.20 nm-1 for silica III). For silica I and silica II it can also be seen that he
overall scattering intensity as well as the relative height of the maximum at qmax
increases with the surface concentration of C12DAO. In all cases, the behaviour
at the high-q end of the of scattering profiles conforms to Porod’s law.
0.1 11E-3
0.01
0.1
1
10
100I/cm-1
Silica IPorod Law
(a)
7/8Γmx
3/4Γ
mx
1/2Γmx
1/4Γ
mx
0.1 11E-3
0.01
0.1
1
10
Silica III
Porod Law
(c)
I/cm-1
7/8Γmx
q/nm-1
0.1 11E-3
0.01
0.1
1
10
100I/cm-1
Silica II
Porod Law
(b)
7/8Γmx
3/4Γ
mx
1/2Γmx
1/4Γ
mx
Figure 5.5. SANS profiles for silica sols of different particle sizes in contrast-matching H2O/D2O (pH 9, 298
K) in the presence of different amount of C12DAO, corresponding to surface concentration ⅞Γmx, ¾Γmx,
½Γmx and ¼Γmx: (a) silica I; (b) silica II; (c) silica III. In (a) and (b) the curves for higher surface
concentrations are shifted vertically relative to that of ¼Γmx by factors of 2 (½Γmx), 4 (¾Γmx) and 14 (⅞Γmx).
88
5. Effect of Nanoparticle Size on the Morphology of Adsorbed Surfactant Layers
The analysis of the SANS profiles was made in two steps: Initially, simple
geometrical modelling was used to estimate the volume, effective layer
thickness and volume-based surface area of the adsorbed C12DAO. In the
second step, nonlinear least-squares fitting of the scattering data to appropriate
structure factor models was employed in order to extract information about the
size and shape of the surface aggregates.
5.2.3 Geometric Modelling
A model-free analysis of the Guinier and Porod regimes of I(q) in terms of the
dry volume, layer thickness, and volume-based surface area of the adsorbed
surfactant was performed as a basis for simple geometrical models of the
surface aggregates.
The Guinier expression I(q) = I0 exp(-Rg2q2/3) can be used to fit the data in
the low-q region. For example, for silica II (RG = 15.8 nm) we find a radius of
gyration Rg = 17.3 nm at the highest surface concentration (⅞Γmx). In the
contrast-match scenario of our experiment, Rg must have a value between the
silica radius RG and RG + δ, depending on the surfactant density profile.
Assuming for simplicity that Rg is half-way between these two values, a typical
layer thickness of the adsorbed surfactant is δ = 2·(17.3-15.8) = 3 nm. From the
high-q region (Porod regime) we obtain the volume-based surface area S/V of
the surface aggregates, since the concentration of free micelles in solution is
negligible at the chosen surfactant concentrations. The respective value for free
micelles can be derived from the scattering profile of the surfactant in the
absence of silica (Fig. 5.4). One finds that S/V for the free micelles is about 10%
lower than for the surface aggregates. The similar magnitude of the two values
implies similar morphologies of the surfactant aggregates in solution and on the
surface. This excludes adsorbed half-micelles [5.13], which would require
considerably more surface area.
For non-interacting particles, the dry volume of adsorbed C12DAO per silica
bead, Vdry, can be derived from the scattering cross section at zero angle by the
relation , where φ = 0.00891 is the volume fraction of C12DAO in
the dispersion and Δρ= 3.72x10⁻⁴ nm-2 is the scattering contrast between
dryVI 20 ρϕΔ=
89
5. Effect of Nanoparticle Size on the Morphology of Adsorbed Surfactant Layers
surfactant and background. From Vdry and the mean particle radius <RS> (Table
5.2) one can determine the effective layer thickness δ of dry surfactant. Values
of Vdry and δ derived from the SANS data in this way are given in Table 4. They
are compared with values estimated from the adsorption isotherm of Pettersson
[5.13], using the mass densities 0.88 g cm-3 (pure C12DAO) and 2.20 g cm-3
(silica), and the values of the mean surface area per silica particles <AS> (Table
5.2). Reasonable agreement between the two sets of values is found for most
samples, but large deviations appear for the sample with silica III. The results in
Table 5.4 indicate that at surface concentrations up to ½Γmx, the effective layer
thickness δ is significantly smaller than the extended tail length of C12DAO (lc =
1.67 nm) [5.22] while at surface concentrations above ½Γmx, the layer thickness
approaches lc. This suggests the existence of either a monolayer (which is
physically implausible at hydrophilic surfaces) or patches of bilayer [5.23]. Simple geometric modeling based on surface area and volume of adsorbed
surfactant (from the Porod constant and I0, respectively) indicates that these
patches must have dimensions close to micelles. The possibility of discrete
surface micelles as reported recently [5.5, 5.6, 5.7] thus appears plausible. On
the assumption that the volume of such surface micelles is similar to that of
micelles in solution, the number of surface micelles Nmic can be estimated by
dividing the dry volume of adsorbed surfactant by the volume of a free micelles.
Values of Nmic obtained in this way are given in Table 5.4.
5.2.4 Core-Shell Model
The spherical core-shell model [5.3, 5.7, 5.24] was adopted to see if the
scattering profiles are consistent with a laterally homogeneous surfactant layer.
Three different values of the layer thickness (1.6, 3.2, and 4.0 nm) were tested
in the modeling of the data for high surface concentrations of C12DAO: The first
value corresponds to the effective thickness, δeff, as obtained for high surface
concentrations from the simple geometric analysis (Table 5.4); the second value
is the expected bilayer thickness, i.e. twice the monolayer thickness, and the
third value represents the mean thickness of a bilayer of C12E5 at the surface of
silica I [5.7]. A fit of the data for the surface concentration ⅞Γmx on silica II with
90
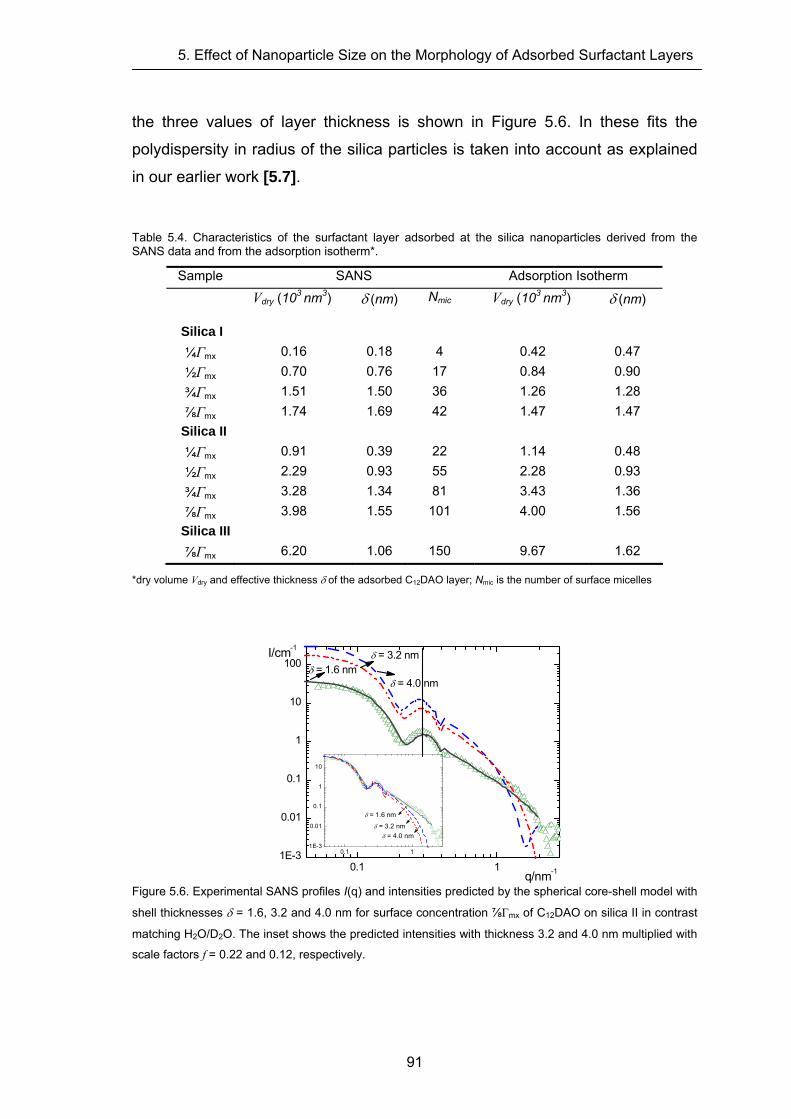
5. Effect of Nanoparticle Size on the Morphology of Adsorbed Surfactant Layers
the three values of layer thickness is shown in Figure 5.6. In these fits the
polydispersity in radius of the silica particles is taken into account as explained
in our earlier work [5.7].
Table 5.4. Characteristics of the surfactant layer adsorbed at the silica nanoparticles derived from the SANS data and from the adsorption isotherm*.
Sample SANS Adsorption Isotherm
Vdry (103 nm3)
δ (nm)
Nmic
Vdry (103 nm3)
δ (nm)
Silica I
¼Γmx 0.16 0.18 4 0.42 0.47 ½Γmx 0.70 0.76 17 0.84 0.90 ¾Γmx 1.51 1.50 36 1.26 1.28 ⅞Γmx 1.74 1.69 42 1.47 1.47
Silica II ¼Γmx 0.91 0.39 22 1.14 0.48 ½Γmx 2.29 0.93 55 2.28 0.93 ¾Γmx 3.28 1.34 81 3.43 1.36 ⅞Γmx 3.98 1.55 101 4.00 1.56
Silica III ⅞Γmx 6.20 1.06 150 9.67 1.62
*dry volume Vdry and effective thickness δ of the adsorbed C12DAO layer; Nmic is the number of surface micelles
0.1 11E-3
0.01
0.1
1
10
100
0.1 11E-3
0.01
0.1
1
10
δ = 3.2 nm
δ = 1.6 nm
δ = 4.0 nm
q/nm-1
I/cm-1δ = 3.2 nm
δ = 1.6 nm δ = 4.0 nm
Figure 5.6. Experimental SANS profiles I(q) and intensities predicted by the spherical core-shell model with
shell thicknesses δ = 1.6, 3.2 and 4.0 nm for surface concentration ⅞Γmx of C12DAO on silica II in contrast
matching H2O/D2O. The inset shows the predicted intensities with thickness 3.2 and 4.0 nm multiplied with
scale factors f = 0.22 and 0.12, respectively.
91
5. Effect of Nanoparticle Size on the Morphology of Adsorbed Surfactant Layers
The fits based on the expected layer thickness δ (3.2 nm) or a greater
thickness (4.0 nm) exhibit similar features as noted in the preceding studies with
the surfactants Triton X-100 [5.5] and C12E5 [5.7]: The model gives a good fit to
the scattering data in the low-q regime including the maximum at intermediate
q, if the theoretical intensities are multiplied by a scale factor f = 0.22 (δ = 3.2
nm) or f = 0.12 (δ = 4.0 nm) (cf. inset Fig. 5.6). As the scattered intensity is
proportional to the surfactant volume on each bead, this implies that the core-
shell model with such a film thickness considerably overestimates the adsorbed
surfactant volume. On the other hand, a fit with the layer thickness δeff = 1.6 nm
reproduces all features of I(q) without any scale factor f, except for the shoulder
at q ≈ 1.0 nm-1, causing some underestimate of the specific surface area of
adsorbed surfactant. In addition, the maximum in I(q) appears at somewhat too
high q, indicating that the real value of the average layer thickness should be
greater than 1.6 nm. The agreement with the experimental data for the film
thickness 1.6 nm is of course related to the fact that in this case the volume of
adsorbed surfactant is conserved. However, although the core-shell model with
a layer thickness 1.6 nm gives a good representation of the scattered
intensities, the result is unrealistic because this value of δ corresponds to only
about half the thickness expected for a bilayer of C12DAO at the solid/solution
interface. Results similar to those shown in Fig. 5.6 were also obtained for lower
surface concentrations of C12DAO on silica II and for the adsorption of C12DAO
on silica I.
The shortcomings of the core-shell model suggest that the adsorbed
surfactant does not form a laterally uniform layer but smaller surface
aggregates, such as spherical or ellipsoidal surface micelles, which have a
higher surface area at a given total adsorbed volume. Accordingly, models of
silica particles decorated with such small surface micelles were applied to the
present data, as described below.
5.2.5 Micelle-Decorated Silica Model
In previous publications [5.5-5.7] we have developed and applied a form factor
model for objects made of small spherical micelles adsorbed on an indexed-
92
5. Effect of Nanoparticle Size on the Morphology of Adsorbed Surfactant Layers
matched silica bead. Parameters of the model are the radius of the silica bead
RS, the radius of spherical surface micelles Rmic, and number of surface
micelles Nmic per silica particle, as well as a polydispersity parameter.
Polydispersity of the silica bead is accounted for by performing the calculation
for silica radii drawn from a distribution function, and averaging. For a given
silica bead of radius RS, the micelle centers are supposed to sit on a spherical
shell of radius RS + Rmic. The excluded volume of the spherical micelles is
determined by their radius Rmic, which also acts as a lateral interaction
parameter for spheres. It is assumed that the number density of spheres in the
layer is independent of bead radius and that Nmic corresponds to the number of
micelles on a bead of average radius. The algorithm consists of the following
steps: (i) positioning the micelles in a random manner on the shell, possibly
allowing for lateral reorganization following a Monte Carlo motion; (ii) calculation
of the micelle-micelle structure factor using the Debye formula; (iii) calculation of
the scattered intensity in absolute units; and (iv) convolution with the resolution
function of the spectrometer.
In order to check if a model of spherical micelles is consistent with the data,
their radius and number was estimated directly from the scattering curves. The
micellar radius must be approximately half the thickness of the layer, and Nmic
and Rmic are related by volume conservation to the amount of adsorbed
surfactant as determined either by the adsorption isotherm or by the low-q fit of
the core-shell model with factor f. Similarly, the amount of surface produced by
Nmic spheres of radius Rmic must match the volume-related surface area
determined from Porod’s law. This constrains the model considerably, and
parameters can only be varied in a narrow range.
Fitting of the scattered intensities with this model and the estimation of the
real adsorbed surfactant volume, Vtot, was based on the results of the core-shell
model for the layer thicknesses δ = 3.2 and 4.0 nm. The real adsorbed
surfactant volume was determined by introducing the effective volume fraction
of surfactant in the shell, X (i.e., fraction of the layer volume occupied by the
surfactant), which is related to the scale factor f by fX = . For example, for
silica II at the surface concentration ⅞Γmx, the scale factor f = 0.22 introduced
93
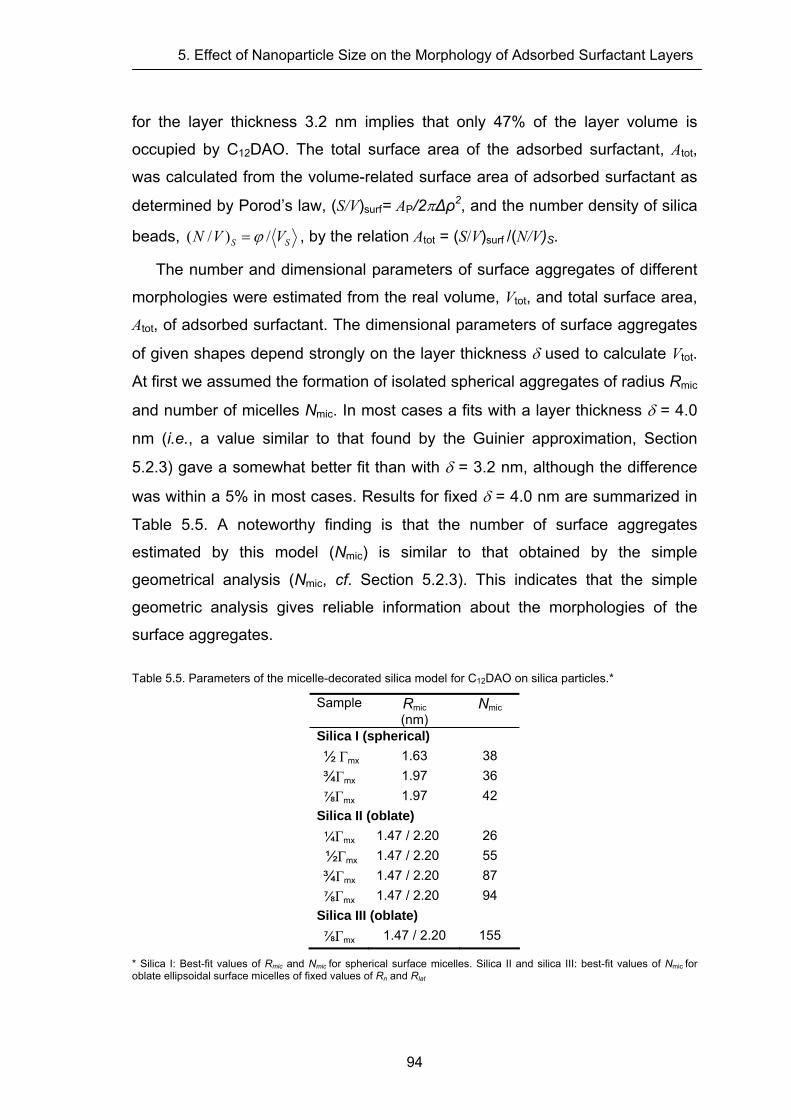
5. Effect of Nanoparticle Size on the Morphology of Adsorbed Surfactant Layers
for the layer thickness 3.2 nm implies that only 47% of the layer volume is
occupied by C12DAO. The total surface area of the adsorbed surfactant, Atot,
was calculated from the volume-related surface area of adsorbed surfactant as
determined by Porod’s law, (S/V)surf= AP/2π∆ρ2, and the number density of silica
beads, SS VVN /)/( ϕ= , by the relation Atot = (S/V)surf /(N/V)S.
The number and dimensional parameters of surface aggregates of different
morphologies were estimated from the real volume, Vtot, and total surface area,
Atot, of adsorbed surfactant. The dimensional parameters of surface aggregates
of given shapes depend strongly on the layer thickness δ used to calculate Vtot.
At first we assumed the formation of isolated spherical aggregates of radius Rmic
and number of micelles Nmic. In most cases a fits with a layer thickness δ = 4.0
nm (i.e., a value similar to that found by the Guinier approximation, Section
5.2.3) gave a somewhat better fit than with δ = 3.2 nm, although the difference
was within a 5% in most cases. Results for fixed δ = 4.0 nm are summarized in
Table 5.5. A noteworthy finding is that the number of surface aggregates
estimated by this model (Nmic) is similar to that obtained by the simple
geometrical analysis (Nmic, cf. Section 5.2.3). This indicates that the simple
geometric analysis gives reliable information about the morphologies of the
surface aggregates.
Table 5.5. Parameters of the micelle-decorated silica model for C12DAO on silica particles.*
Sample Rmic (nm)
Nmic
Silica I (spherical) ½ Γmx 1.63 38 ¾Γmx 1.97 36 ⅞Γmx 1.97 42
Silica II (oblate) ¼Γmx 1.47 / 2.20 26 ½Γmx 1.47 / 2.20 55 ¾Γmx 1.47 / 2.20 87 ⅞Γmx 1.47 / 2.20 94
Silica III (oblate) ⅞Γmx 1.47 / 2.20 155
* Silica I: Best-fit values of Rmic and Nmic for spherical surface micelles. Silica II and silica III: best-fit values of Nmic for oblate ellipsoidal surface micelles of fixed values of Rn and Rlat
94
5. Effect of Nanoparticle Size on the Morphology of Adsorbed Surfactant Layers
C12DAO on silica I. Figure 5.7 shows the scattering data for C12DAO on
silica I at the surface concentrations ¾Γmx and ⅞Γmx, and fits with the micelle-
decorated silica model. In this case, a good fit of the scattering profile was
obtained by assuming that C12DAO is adsorbed in form of isolated spherical
surface micelles of radius Rmic = 2.0 nm. The good representation of the data in
the high-q region supports the conjectured uniform size of the surface
aggregates, and the fit of the data at intermediate q indicates that the increasing
amplitude of the maximum at qmax can be explained by an increasing number of
surface aggregates as the surface concentration is increased (cf. Table 5.5).
Some deviations between the experimental and predicted I(q) appear in the q
regime just below qmax, where the model somewhat overestimates the total
volume of the adsorbed surfactant aggregates (see Fig. 5.5). The strong
increase of I(q) at the lower end of the experimental q range is a hint of a
maximum in I(q) at lower q, which was not captured because measurements at
smaller angles were not performed for this silica. Such a maximum indicates
repulsive interaction between the silica beads coated with small surface
aggregates of C12DAO. The quality of the fit of the low-q region could not be
improved by decreasing Nmic, the number of surface micelles, at fixed radius
Rmic = 2.0 nm (cf. Table 5.5), since this implies a decrease in the surfactant
volume fraction in the layer and thus lowers the amplitude of the maximum at
qmax, which is inconsistent with the experimental I(q). Similarly, no better fit was
found when Rmic was increased at a fixed value of Nmic.
C12DAO on silica II and III. The scattering data for C12DAO on silica II and
III were also analysed in terms of the model of spherical surface aggregates.
However, for these silicas reasonable fits with spherical surface micelles could
be obtained only by adopting unrealistic values of the micelle radius Rmic.
Specifically, with silica II a surface micelle radius Rmic = 0.85 nm was obtained
for low surface concentrations (¼Γmx, and ¼Γmx) and an even lower value (Rmic
= 0.66 nm) for higher surface concentrations (¾Γmx, and ⅞Γmx). These values of
Rmic are physically unrealistic as they are less than half the length of an
extended surfactant molecule. For this reason, model calculations similar to
those described above were also made for surface aggregates of different
95
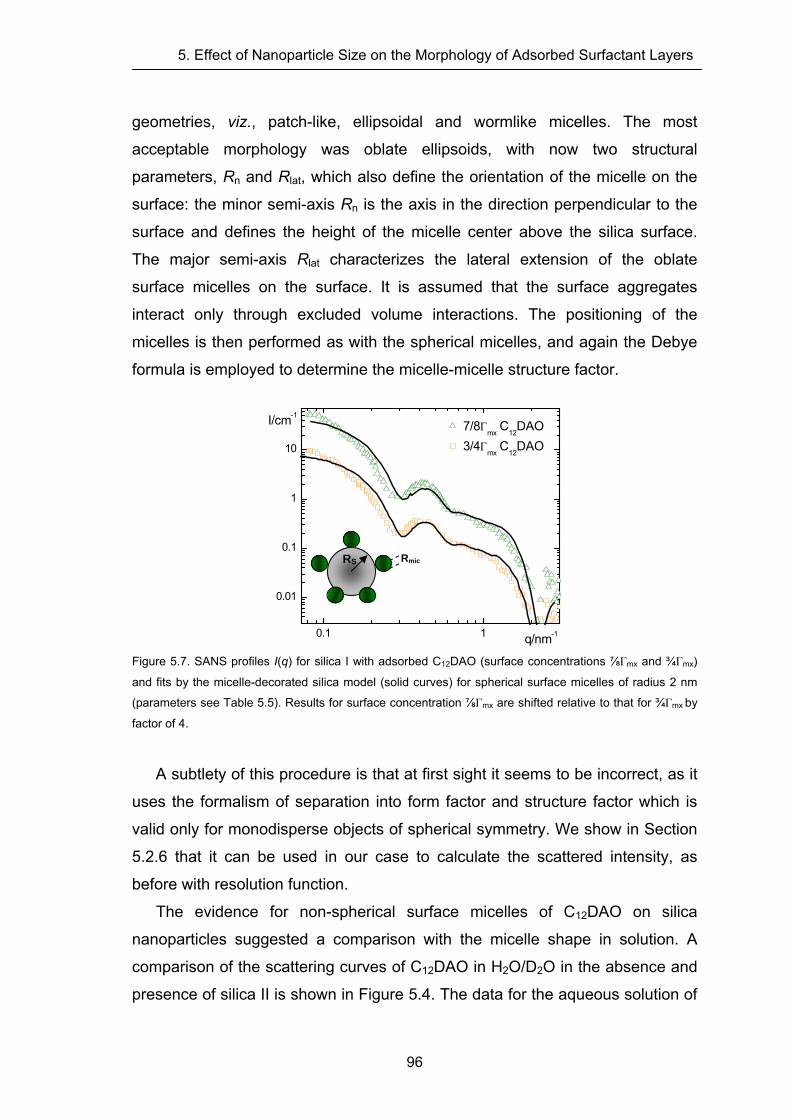
5. Effect of Nanoparticle Size on the Morphology of Adsorbed Surfactant Layers
geometries, viz., patch-like, ellipsoidal and wormlike micelles. The most
acceptable morphology was oblate ellipsoids, with now two structural
parameters, Rn and Rlat, which also define the orientation of the micelle on the
surface: the minor semi-axis Rn is the axis in the direction perpendicular to the
surface and defines the height of the micelle center above the silica surface.
The major semi-axis Rlat characterizes the lateral extension of the oblate
surface micelles on the surface. It is assumed that the surface aggregates
interact only through excluded volume interactions. The positioning of the
micelles is then performed as with the spherical micelles, and again the Debye
formula is employed to determine the micelle-micelle structure factor.
0.1
0.01
0.1
1
10
1
I/cm-1
q/nm-1
7/8Γmx
C12
DAO 3/4Γ
mx C
12DAO
Figure 5.7. SANS profiles I(q) for silica I with adsorbed C12DAO (surface concentrations ⅞Γmx and ¾Γmx)
and fits by the micelle-decorated silica model (solid curves) for spherical surface micelles of radius 2 nm
(parameters see Table 5.5). Results for surface concentration ⅞Γmx are shifted relative to that for ¾Γmx by
factor of 4.
A subtlety of this procedure is that at first sight it seems to be incorrect, as it
uses the formalism of separation into form factor and structure factor which is
valid only for monodisperse objects of spherical symmetry. We show in Section
5.2.6 that it can be used in our case to calculate the scattered intensity, as
before with resolution function.
The evidence for non-spherical surface micelles of C12DAO on silica
nanoparticles suggested a comparison with the micelle shape in solution. A
comparison of the scattering curves of C12DAO in H2O/D2O in the absence and
presence of silica II is shown in Figure 5.4. The data for the aqueous solution of
RmicRSRS
96
5. Effect of Nanoparticle Size on the Morphology of Adsorbed Surfactant Layers
C12DAO can be represented by a model of oblate ellipsoids, with a =1.41 nm
and b = 2.15 nm (where a is the rotational semi-axis and b the equatorial semi-
axis of the ellipsoid core). The model of oblate micelles fits the data at high q
somewhat better than the prolate ellipsoidal model (fit not shown), as indicated
by the lower residual, which was ~1.2 for the oblate ellipsoid, but ~1.6 for the
prolate ellipsoid. Figure 5.4 also shows that the scattering curves of C12DAO in
the absence and presence of the silica overlap in the high-q region, indicating
that the shape of the micelles in solution and at the surface is similar.
Accordingly, the parameters Rn and Rlat of the surface micelle model were set to
1.5 nm and 2.2 nm, respectively, for all surface concentrations and the number
of micelles, Nmic was taken as the only adjustable parameter. Fits for C12DAO
on silica II and silica III are shown in Figure 5.8. The good fit of the data in the
entire q range supports the chosen model of isolated oblate surface micelles.
Furthermore, the values of Nmic derived from the fits (Table 5.5) are similar to
those found in the simple geometric analysis (Table 5.4).
To gain a better understanding of the way in which the calculated scattering
function is influenced by the structural parameters Rn and Rlat we have varied
them in a systematic manner, keeping one of them (and Nmic) fixed and varying
the value of the other in a range from 0.5 to 3.5 nm, as shown in Figure 5.9 for
the scattering profile of ⅞Γmx of C12DAO on silica II. Figure 5.9a shows the
effect of a variation of Rn, at fixed Rlat = 2.2 nm and Nmic = 94. As can be seen,
Rn is directly related to the size of the ellipsoidal aggregates because
decreasing its value to 0.5 nm or increasing its value to 3.5 nm causes a shift of
qmax to higher or lower values. Rlat is related to the ordering of the micelles on
the surface. This is indicated in Fig. 5.9b by the fact that a decrease of Rlat from
2.2 to 0.5 nm causes a deformation of the size of the surface aggregates as
their shell is no longer well defined. By increasing Rlat to 3.5 nm a strong
oscillation appears at q ≈ 1.3 nm-1, indicating intermicellar repulsion between
the adsorbed surface aggregates (see also Figs. 6 and 7 in ref. 5.6).
97
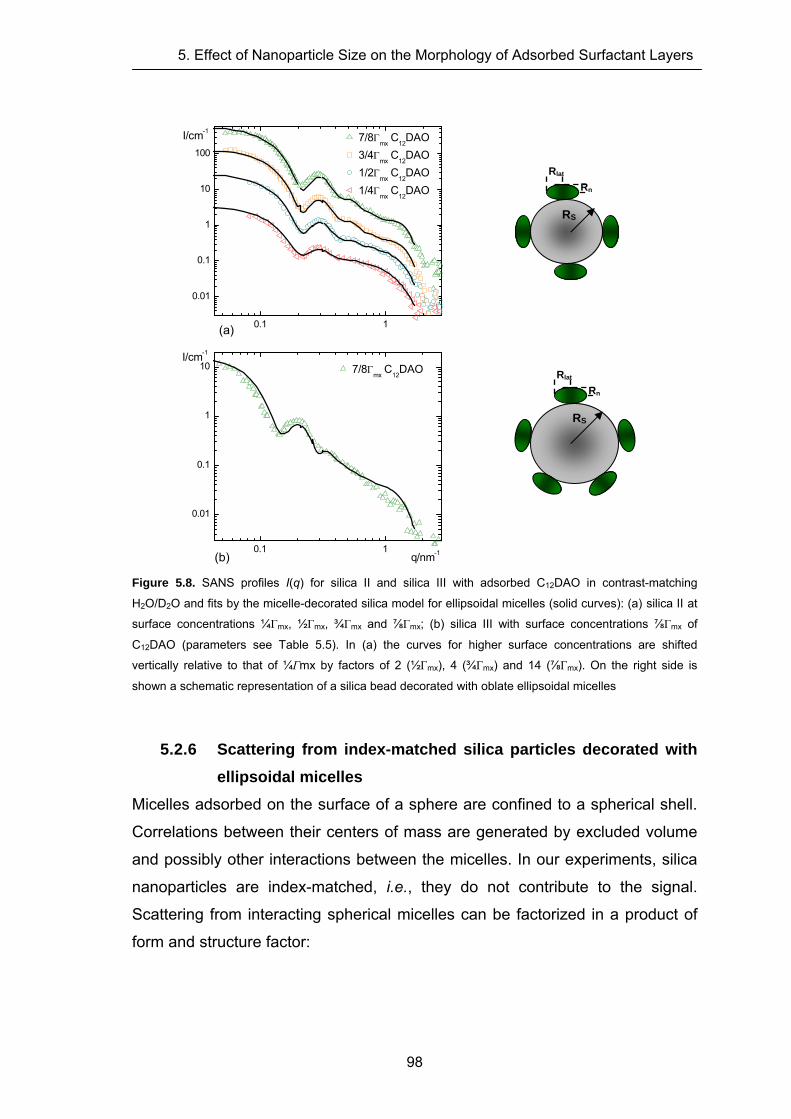
5. Effect of Nanoparticle Size on the Morphology of Adsorbed Surfactant Layers
Rn
RS
Rlat
Rn
RS
Rlat
0.1 1
0.01
0.1
1
10I/cm-1
q/nm-1(b)
7/8Γmx
C12
DAO
0.1 1
0.01
0.1
1
10
100
I/cm-1
(a)
7/8Γmx
C12
DAO 3/4Γ
mx C
12DAO
1/2Γmx
C12
DAO 1/4Γ
mx C
12DAO
Figure 5.8. SANS profiles I(q) for silica II and silica III with adsorbed C12DAO in contrast-matching
H2O/D2O and fits by the micelle-decorated silica model for ellipsoidal micelles (solid curves): (a) silica II at surface concentrations ¼Γmx, ½Γmx, ¾Γmx and ⅞Γmx; (b) silica III with surface concentrations ⅞Γmx of
C12DAO (parameters see Table 5.5). In (a) the curves for higher surface concentrations are shifted
vertically relative to that of ¼Γmx by factors of 2 (½Γmx), 4 (¾Γmx) and 14 (⅞Γmx). On the right side is
shown a schematic representation of a silica bead decorated with oblate ellipsoidal micelles
5.2.6 Scattering from index-matched silica particles decorated with ellipsoidal micelles
Micelles adsorbed on the surface of a sphere are confined to a spherical shell.
Correlations between their centers of mass are generated by excluded volume
and possibly other interactions between the micelles. In our experiments, silica
nanoparticles are index-matched, i.e., they do not contribute to the signal.
Scattering from interacting spherical micelles can be factorized in a product of
form and structure factor:
98
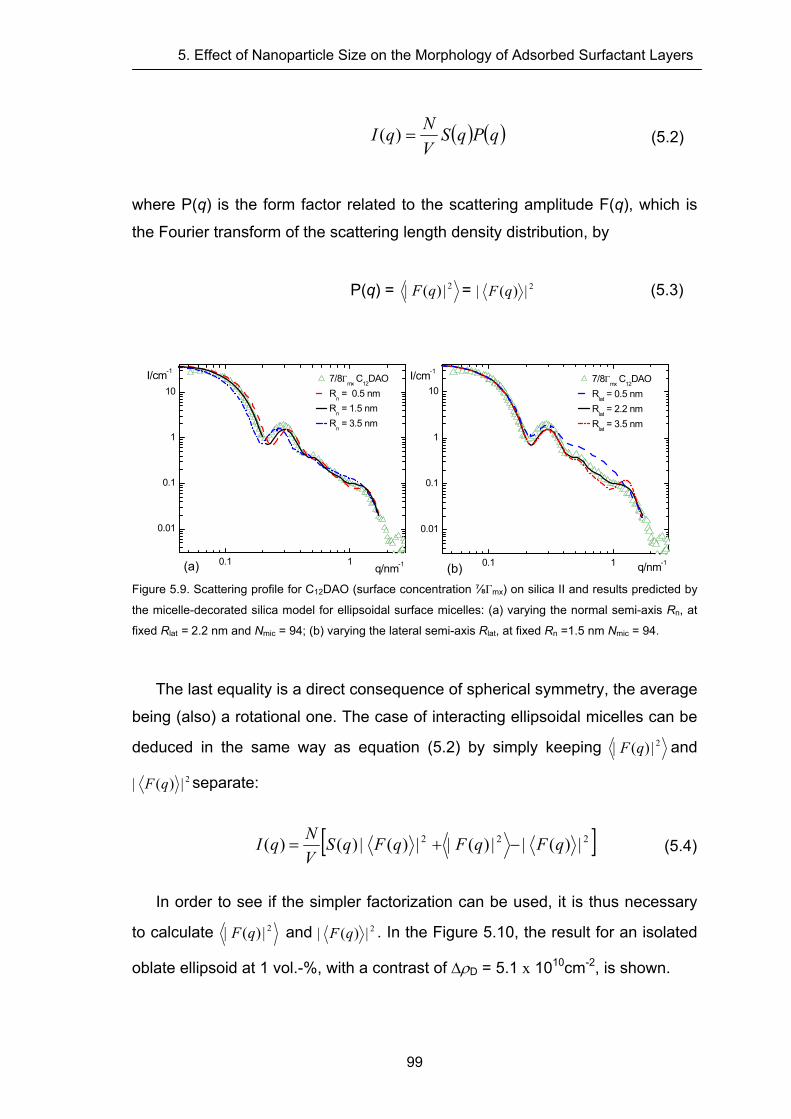
5. Effect of Nanoparticle Size on the Morphology of Adsorbed Surfactant Layers
( ) ( )qPqSVNqI =)( (5.2)
where P(q) is the form factor related to the scattering amplitude F(q), which is
the Fourier transform of the scattering length density distribution, by
P(q) = 2)( || qF = 2)( || qF (5.3)
0.1 1
0.01
0.1
1
10I/cm-1
q/nm-1(a)
7/8Γmx
C12
DAO R
n = 0.5 nm
Rn = 1.5 nm
Rn = 3.5 nm
0.1 1
0.01
0.1
1
10I/cm-1
q/nm-1(b)
7/8Γmx
C12
DAO R
lat = 0.5 nm
Rlat = 2.2 nm
Rlat = 3.5 nm
Figure 5.9. Scattering profile for C12DAO (surface concentration ⅞Γmx) on silica II and results predicted by
the micelle-decorated silica model for ellipsoidal surface micelles: (a) varying the normal semi-axis Rn, at
fixed Rlat = 2.2 nm and Nmic = 94; (b) varying the lateral semi-axis Rlat, at fixed Rn =1.5 nm Nmic = 94.
The last equality is a direct consequence of spherical symmetry, the average
being (also) a rotational one. The case of interacting ellipsoidal micelles can be
deduced in the same way as equation (5.2) by simply keeping 2)( || qF and
2)( || qF separate:
[ ]222 )()()()()( ||−||+||= qFqFqFqSVNqI (5.4)
In order to see if the simpler factorization can be used, it is thus necessary
to calculate 2)( || qF and 2)( || qF . In the Figure 5.10, the result for an isolated
oblate ellipsoid at 1 vol.-%, with a contrast of ΔρD = 5.1 x 1010cm-2, is shown.
99
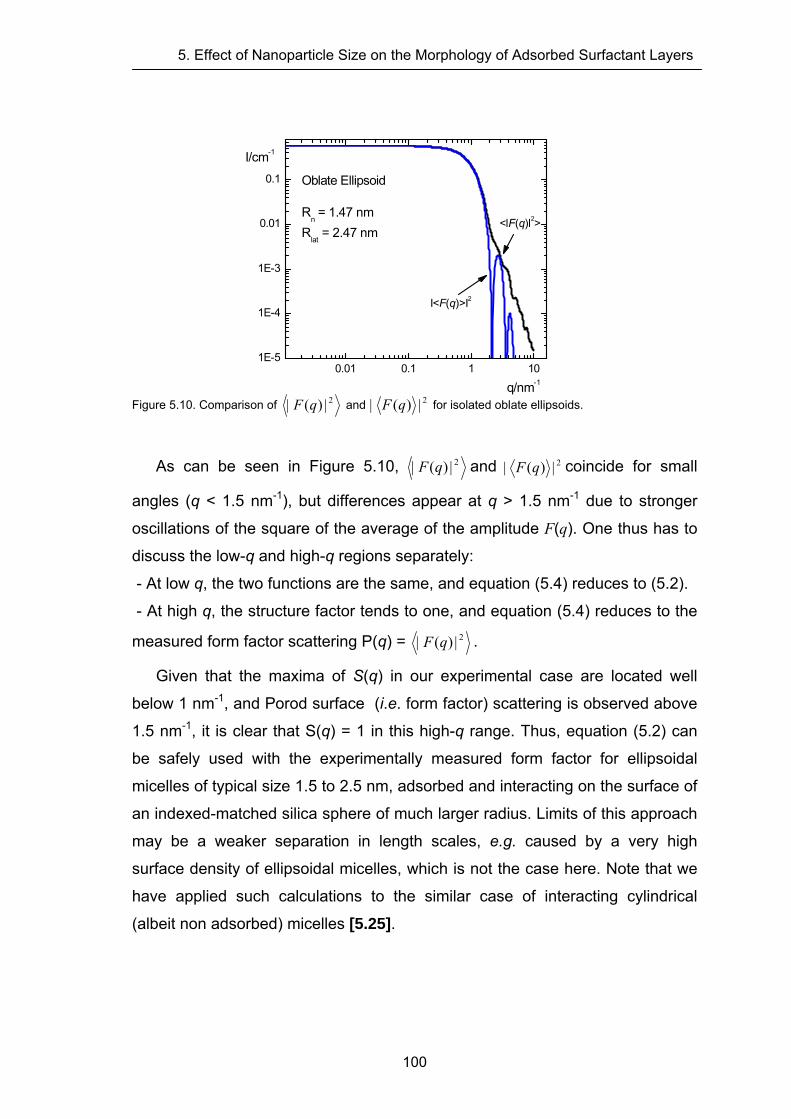
5. Effect of Nanoparticle Size on the Morphology of Adsorbed Surfactant Layers
Figure 5.10. Comparison of 2)( || qF and 2)( || qF for isolated oblate ellipsoids.
0.01 0.1 1 101E-5
1E-4
1E-3
0.01
0.1
q/nm-1
I/cm-1
I<F(q)>I2
<lF(q)l2>
Oblate Ellipsoid
Rn = 1.47 nm
Rlat
= 2.47 nm
As can be seen in Figure 5.10, 2)( || qF and 2)( || qF coincide for small
angles (q < 1.5 nm-1), but differences appear at q > 1.5 nm-1 due to stronger
oscillations of the square of the average of the amplitude F(q). One thus has to
discuss the low-q and high-q regions separately:
- At low q, the two functions are the same, and equation (5.4) reduces to (5.2).
- At high q, the structure factor tends to one, and equation (5.4) reduces to the
measured form factor scattering P(q) = 2)( || qF .
Given that the maxima of S(q) in our experimental case are located well
below 1 nm-1, and Porod surface (i.e. form factor) scattering is observed above
1.5 nm-1, it is clear that S(q) = 1 in this high-q range. Thus, equation (5.2) can
be safely used with the experimentally measured form factor for ellipsoidal
micelles of typical size 1.5 to 2.5 nm, adsorbed and interacting on the surface of
an indexed-matched silica sphere of much larger radius. Limits of this approach
may be a weaker separation in length scales, e.g. caused by a very high
surface density of ellipsoidal micelles, which is not the case here. Note that we
have applied such calculations to the similar case of interacting cylindrical
(albeit non adsorbed) micelles [5.25].
100
5. Effect of Nanoparticle Size on the Morphology of Adsorbed Surfactant Layers
5.2.7 Influence of the surfactant head group Aggregate structures of surfactants in solution can often be predicted on the
basis of the critical packing parameter , which expresses the preferred
interface curvature of the aggregate in terms of molecular parameters alkyl
chain volume V, the alkyl chain length and the head group area [5.26].
C12DAO in its cationic form at low pH is expected to have a higher effective
head group area than in its nonionic form at high pH where the absence of
electrostatic head group repulsion allows a closer packing of the head groups.
Hence it should be possible to study the effect of head group size on the shape
of surface aggregates simply by changing pH. However, this is not possible in
the present case because pH has to be fixed near pH 9 to prevent flocculation
of the silica dispersion. We have checked that added electrolyte has no effect
on the morphology of the adsorbed layer of C12DAO (Figure 5.4) under the
experimental conditions, as expected for nonionic surfactants. It would be of
interest to study the effect of electrolyte on the surfactant aggregates in the
cationic form of the surfactant, but again this is not possible at the given pH of
the system.
0/ alV c
cl 0a
In our earlier study [5.7], spherical surface aggregates were observed for
the surfactant C12E5 on silica I, in line with the large head-group size of this
molecule. Since C12DAO has a much smaller head group than C12E5, one
expects that surface aggregates of smaller curvature are preferred for this
surfactant. This conjectured behavior is indeed found for C12DAO on silica II
and III, where we find oblate-shaped surface aggregates. On the other hand,
spherical surface aggregates of C12DAO are found on silica I, and they have
similar dimensions as those of C12E5 on silica I. These findings suggest that the
head group size (or packing parameter) of the surfactant is not the dominating
factor for the shape of surface aggregates on the silica particles. However, the
nature of the surfactant head group may have a pronounced influence on the
number of surface aggregates per particle (Nmic). This is suggested by a
comparison of the results for C12DAO on silica I with the earlier results for C12E5
on the same silica [5.7]. For instance, at a surface concentrations ¾Γmx we find
Nmic = 36 for C12DAO (Table 5.4), but Nmic = 72 for C12E5 [5.7]. The larger
101
5. Effect of Nanoparticle Size on the Morphology of Adsorbed Surfactant Layers
number for C12E5 may be attributed to its ability to form more than one strong
hydrogen bond to surface silanol groups. However, other factors may also affect
the number of surface aggregates, as is suggested by the fact that rather small
numbers of surface aggregates (Nmic up to 15) were found in the study of Triton
X-100 (a technical-grade alkylphenyl polyoxyethylene surfactant) on a
commercial silica sol (Bindzil B30). Since Triton X-100 is similar to C12E5 and
the mean particle size of Bindzil B30 (RS = 7.7 nm) is similar to that of silica I,
the large difference in Nmic between these two systems is not clear.
5.2.8 Influence of the nanoparticle size An interesting finding of this study is the morphological transition from spherical
to ellipsoidal shape of the surface aggregates. This transition must be caused
by some property of the silica particles, either their surface chemistry or surface
roughness, or the particle size. Since silica I and silica II were prepared by the
same method, their surface properties are similar, as indicated by the similar
zeta potentials (Table 5.1) and surface roughness (as/ageom in Table 5.3) of
these two samples, when compared to silica III. Because the transition in
surface aggregate shape occurs from silica I to silica II, we may conclude that it
is not induced by changes in surface properties but by the increase in particle
size. In the preceeding study we conjectured that the formation of spherical
surface aggregates of C12E5 on silica I was caused by the high surface
curvature of the silica nanoparticles, which prevents an effective packing of the
hydrophobic tails of the molecules in a bilayer configuration. This argument may
be generalized by noting that the formation of surface aggregates at
concentrations below the CMC depends on favorable interactions of the
surfactant heads with the solid surface, and that the morphology of the surface
aggregates will be determined by a balance of amphiphile-amphiphile (A-A) and
amphiphile-surface (A-S) interactions. At weakly convex surfaces (large silica
particles), micellar aggregates of relatively low mean curvature can have
favourable A-S interactions without significant changes in aggregate structure,
i.e. without sacrificing A-A interaction energy. This appears to be the situation
for the oblate-shaped surface micelles of C12DAO on silica II and silica III. On
102
5. Effect of Nanoparticle Size on the Morphology of Adsorbed Surfactant Layers
the other hand, at highly convex surfaces (small silica particles), optimization of
the A-A and A-S interactions may favor smaller surface aggregates, if that leads
to a larger number of surface contacts per unit area of the solid particle – even
at the cost of a higher A-A bending energy. This seems to the situation for
C12DAO on silica I. The transition from spherical to oblate shape of the surface
aggregates can then be seen as a relaxation from a strained to an unstrained
curvature of the surface aggregates, since oblate micelles represent the favored
aggregate shape of C12DAO in the bulk solution. The present work suggests
that this morphological transition occurs at a particle radius RS ≈ 10-12 nm, i.e.
Rmic/RS ≈ 0.2. To our knowledge, no theoretical model for this morphological
transition exists in the literature, but such a model would be most valuable for
gaining a better understanding of this phenomenon.
References of Chapter 5 [5.1] Dietsch, O.; Eltekov, A.; Bock, H.; Gubbins, K.E.; Findenegg, G.H. J. Phys. Chem. C
2007, 111, 16045-16054.
[5.2] (a) Grant, L.M.; Tiberg, F.; Ducker, W.A. J. Phys. Chem. B 1998, 102, 4288–4294. (b)
Grant, L. M.; Ederth, T.; Tiberg, F. Langmuir 2000, 16, 2285-2291. (c) Blom, A.; Duval, F. P.;
Kovács, L.; Warr, G. G.; Almgren, M.; Kadi, M.; Zana, R. Langmuir 2004, 20, 1291–1297.
[5.3] (a) Cummins, P.G.; Staples, E.; Penfold, J. J. Phys. Chem. 1990, 94, 3740-3745. (b)
Cummins, P.G.; Staples, E.; Penfold, J. J. Phys. Chem. 1991, 95, 5902-5905. (c) Cummins,
P.G.; Penfold, J.; Staples, E. J. Phys. Chem. 1992, 96, 8092–8094.
[5.4] Penfold, J.; Staples, E.; Tucker, I.; Cummins, P.G. J. Phys. Chem. 1996, 100, 18133–
18137.
[5.5] Despert, G.; Oberdisse, J. Langmuir 2003, 19, 7604-7610.
[5.6] Oberdisse, J. Phys. Chem. Chem. Phys. 2004, 6, 1557-1561.
[5.7] Lugo, D.; Oberdisse, J.; Karg, M.; Schweins, R.; Findenegg, G.H. Soft Matter 2009, 5,
2928–2936.
[5.8] Li, X.; Lin, Z.; Cai, J.; Scriven; L.A. Davis, H,T J. Phys. Chem. 1995, 99, 10865-10878.
[5.9] Menge, U.; Lang, P.; Findenegg, G.H.; Strunz, P. J. Phys. Chem. B 2003, 107, 1316-1320.
[5.10] Sterpone, F.; Marchetti, G.; Pierleoni, C.; Marchi, M. J. Phys. Chem. B 2006, 110, 11504-
11510.
[5.11] (a) Chernik, G. G.; Sokolova, E. P. J. Colloid Interface Sci. 1991, 141, 409-414. (b)
Benjamin, L. J. Phys. Chem. 1964, 68, 3575-3581. (c) Kresheck, G. C. J. Am. Chem. Soc.
103
5. Effect of Nanoparticle Size on the Morphology of Adsorbed Surfactant Layers
104
1998, 120, 10964-10969. (d) Timmins, P. A.; Hauk, J.; Wacker, T.; Welte, W. Febs Letters
1991, 280, 115-120. (e) Timmins, P. A.; Leonhard, M.; Weltzien, H. U.; Wacker, T.; Welte, W.
Febs Letters 1988, 238, 361-368. (f) Barlow, D. J.; Lawrence, M. J.; Zuberi, T.; Zuberi, S.
Langmuir 2000, 16, 10398-10403.
[5.12] Király, Z.; Findenegg, G. H. Langmuir 2000, 16, 8842-8849.
[5.13] (a) Pettersson, A.; Rosenholm, J. B. Langmuir 2002, 18, 8436-8446. (b) Pettersson, A.;
Rosenholm, J. B. Langmuir 2002, 18, 8447-8454.
[5.14] Stöber, W.; Fink, A.; Bohn, E. J. Colloid Interface Sci. 1968, 26, 62-69.
[5.15] Pusey, P.N. in Neutrons, X-rays and Light: Scattering Methods Applied to Soft
Condensed Matter, 2002, 1st edn. ed. P. Lindner and Th. Zemb, Elsevier, Boston, chap. 1 pp.
3-21.
[5.16] Brûlet, A.; Lairez, D.; Lapp, A.; Cotton, J.-P. J. Appl. Cryst. 2007, 40, 165-177; Lindner,
P. in Neutrons, X rays and Light: Scattering Methods Applied to Soft Condensed Matter 2002,
1st ed., ed. P. Lindner and Th. Zemb, Boston, chap. 2, pp 23-48.
[5.17] Oberdisse, J.; Deme, B. Macromolecules 2002, 35, 4397-4405.
[5.18] Milano-Brusco, J.; Prévost, S.; Lugo, D.; Gradzielski, M.; Schomäcker, R. New J. Chem.
2009, 33, 1726–1735.
[5.19] Hansen, J.-P.; Hayter, J. B. Mol. Phys. 1982, 46, 651-656; Hayter, J. B.; Penfold, J. Mol.
Phys. 1981, 42, 109-118.
[5.20] Oberdisse, J.; Hine, P.; Pyckhout-Hintzen, W. Soft Matter 2007, 3, 476-485.
[5.21] Lowell, S.; Shields, J.E.; Thomas, M.A.; Thommes, M. Characterization of Porous Solids
and Powders: Surface Area, Pore Size and Density, 2004, Kluwer Academic Publishers,
Dordrecht.
[5.22] Tanford, C. J. Phys. Chem. 1972, 76, 3020-3024.
[5.23] Holmberg, K.; Jönsson, B.; Kronberg, B.; Lindman, B. Surfactants and Polymers in
Aqueous Solution 2003, 2nd ed., John Wiley & Sons.
[5.24] Pusey, P.N. in Neutrons, X-rays and Light: Scattering Methods applied to Soft
Condensed Matter 2000, ed. B.J. Gabrys, Gordon and Breach Science Publishers, Netherlands,
1st ed., chap. 4, pp. 77-102.
[5.25] Oberdisse, J.; Regev, O.; Porte, G. Journal of Physical Chemistry B 1998, 102, 1102-
1108.
[5.26] Israelachvili, J.N.; Mitchell, D.J.; Ninham, B.W. J. Chem. Soc. Faraday Trans. 2 1976, 72,
1525-1568.
6 Surface Aggregate Structure of Mixtures of Sugar-Based Surfactants with an Amphoteric Surfactant on Silica Beads
6.1 Introduction
The adsorption of surfactants at solid-liquid interfaces plays a crucial role in
many important industrial processes. Most of these applications involve use of
surfactant mixtures, since in many cases mixtures provide a synergistic
enhancement in both surface and bulk properties compared to the individual
surfactants. This behaviour is observed when there are favourable interactions
between the two types of surfactants. On the other hand, this also makes it
possible to control the behaviour of surfactants at interfaces and utilize them
more efficiently by varying the composition of such mixtures. Towards this
purpose it becomes helpful to understand the adsorption and solution behaviour
of surfactant mixtures.
The interpretation of the behaviour of surfactant mixtures in solution and at
the solid-liquid interface has been focused in thermodynamic models [6.1], in
terms of synergistic and antagonistic effects [6.2], and in studies of the
adsorption mechanism which may be looked upon either as the formation of
adsorbed mixed surfactant aggregates as in the bulk or as an adsolubilization
effect [6.3]. However, many aspects of surfactant mixing are not well
understood at a molecular level. This has stimulated a resurgence of interest in
recent years and has resulted in the application of new experimental techniques
to study the structure of adsorbed monolayers of ionic/nonionic and
nonionic/nonionic surfactant mixtures at the air-solution interface, such as
neutron reflectivity [6.4], optical probes such as second harmonic generation
(SHG) [6.5], sum frequency spectroscopy (SFS) [6.6], and atomic force
microscopy (AFM) [6.7], to augment more classical techniques, such as surface
tension measurements. More recently, these structural studies have been
extended to surfactant mixtures at the hydrophilic solid-solution interface, in
particular, to study the adsorption of cationic/nonionic and anionic/nonionic
mixtures on hydrophilic solid surface by neutron reflectivity [6.8]. Brinck and
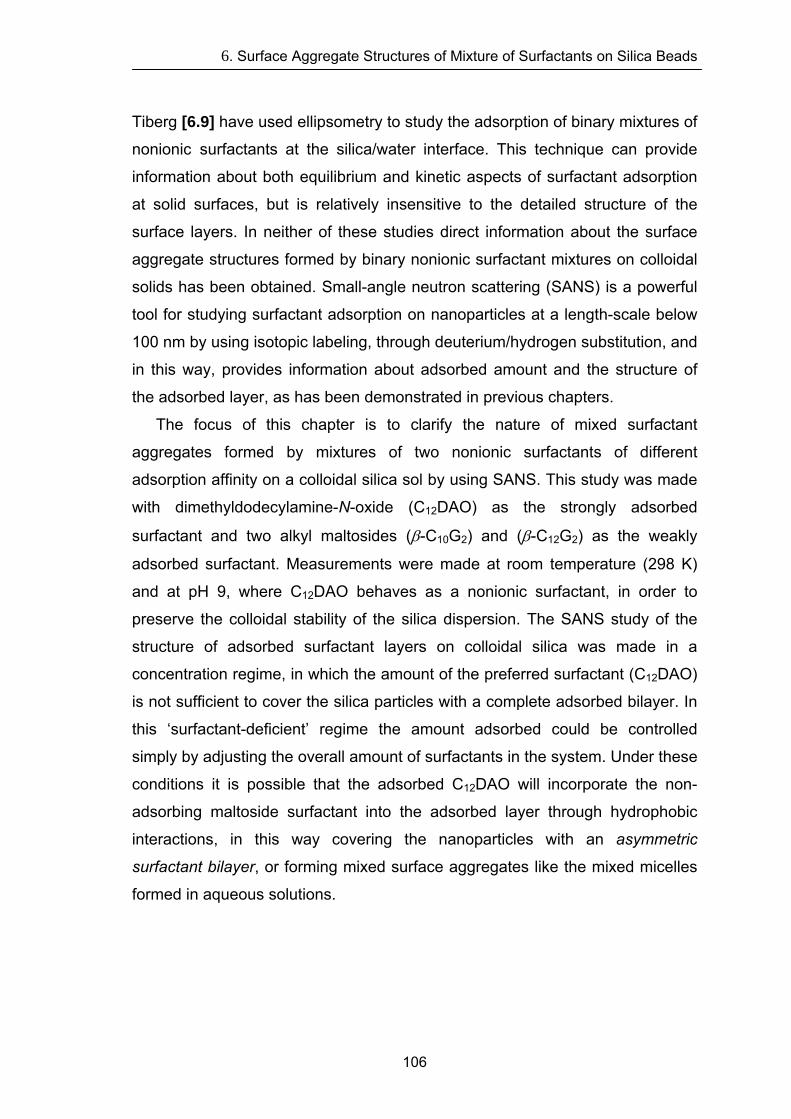
6. Surface Aggregate Structures of Mixture of Surfactants on Silica Beads
Tiberg [6.9] have used ellipsometry to study the adsorption of binary mixtures of
nonionic surfactants at the silica/water interface. This technique can provide
information about both equilibrium and kinetic aspects of surfactant adsorption
at solid surfaces, but is relatively insensitive to the detailed structure of the
surface layers. In neither of these studies direct information about the surface
aggregate structures formed by binary nonionic surfactant mixtures on colloidal
solids has been obtained. Small-angle neutron scattering (SANS) is a powerful
tool for studying surfactant adsorption on nanoparticles at a length-scale below
100 nm by using isotopic labeling, through deuterium/hydrogen substitution, and
in this way, provides information about adsorbed amount and the structure of
the adsorbed layer, as has been demonstrated in previous chapters.
The focus of this chapter is to clarify the nature of mixed surfactant
aggregates formed by mixtures of two nonionic surfactants of different
adsorption affinity on a colloidal silica sol by using SANS. This study was made
with dimethyldodecylamine-N-oxide (C12DAO) as the strongly adsorbed
surfactant and two alkyl maltosides (β-C10G2) and (β-C12G2) as the weakly
adsorbed surfactant. Measurements were made at room temperature (298 K)
and at pH 9, where C12DAO behaves as a nonionic surfactant, in order to
preserve the colloidal stability of the silica dispersion. The SANS study of the
structure of adsorbed surfactant layers on colloidal silica was made in a
concentration regime, in which the amount of the preferred surfactant (C12DAO)
is not sufficient to cover the silica particles with a complete adsorbed bilayer. In
this ‘surfactant-deficient’ regime the amount adsorbed could be controlled
simply by adjusting the overall amount of surfactants in the system. Under these
conditions it is possible that the adsorbed C12DAO will incorporate the non-
adsorbing maltoside surfactant into the adsorbed layer through hydrophobic
interactions, in this way covering the nanoparticles with an asymmetric
surfactant bilayer, or forming mixed surface aggregates like the mixed micelles
formed in aqueous solutions.
106
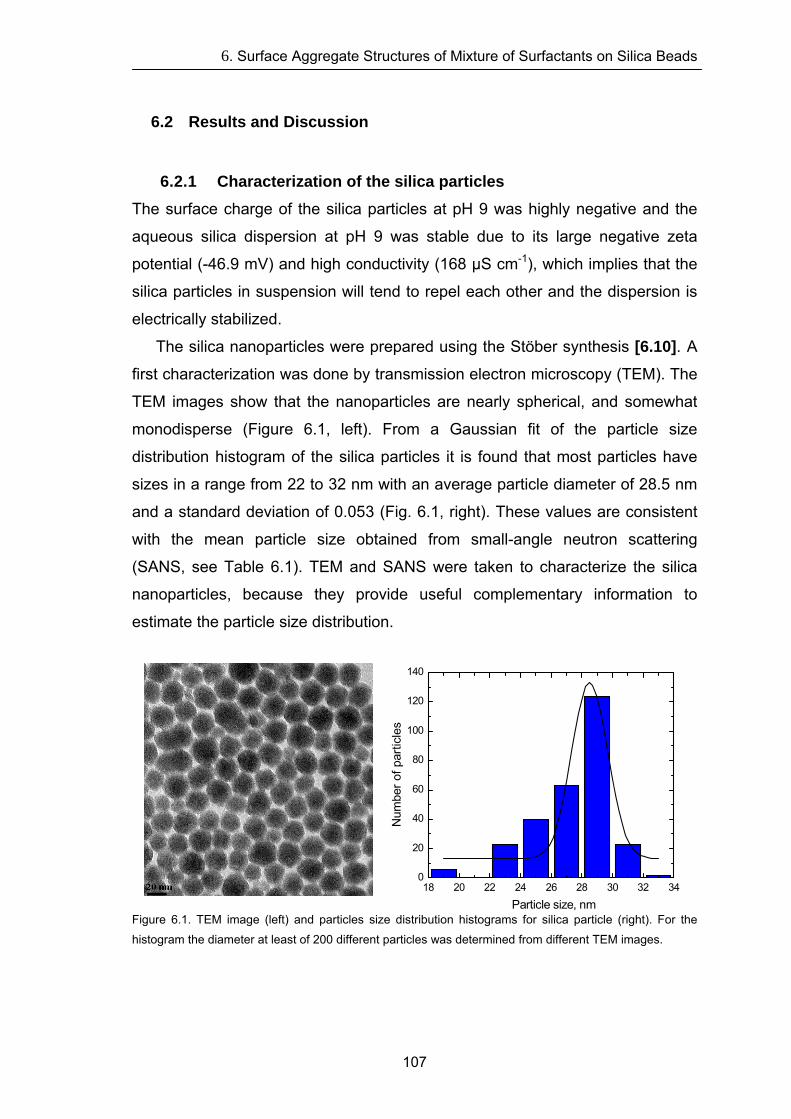
6. Surface Aggregate Structures of Mixture of Surfactants on Silica Beads
107
6.2 Results and Discussion
6.2.1 Characterization of the silica particles
The surface charge of the silica particles at pH 9 was highly negative and the
aqueous silica dispersion at pH 9 was stable due to its large negative zeta
potential (-46.9 mV) and high conductivity (168 μS cm-1), which implies that the
silica particles in suspension will tend to repel each other and the dispersion is
electrically stabilized.
The silica nanoparticles were prepared using the Stöber synthesis [6.10]. A
first characterization was done by transmission electron microscopy (TEM). The
TEM images show that the nanoparticles are nearly spherical, and somewhat
monodisperse (Figure 6.1, left). From a Gaussian fit of the particle size
distribution histogram of the silica particles it is found that most particles have
sizes in a range from 22 to 32 nm with an average particle diameter of 28.5 nm
and a standard deviation of 0.053 (Fig. 6.1, right). These values are consistent
with the mean particle size obtained from small-angle neutron scattering
(SANS, see Table 6.1). TEM and SANS were taken to characterize the silica
nanoparticles, because they provide useful complementary information to
estimate the particle size distribution.
18 20 22 24 26 28 30 32 340
20
40
60
80
100
120
140
Num
ber o
f par
ticle
s
Particle size, nm
Figure 6.1. TEM image (left) and particles size distribution histograms for silica particle (right). For the
histogram the diameter at least of 200 different particles was determined from different TEM images.
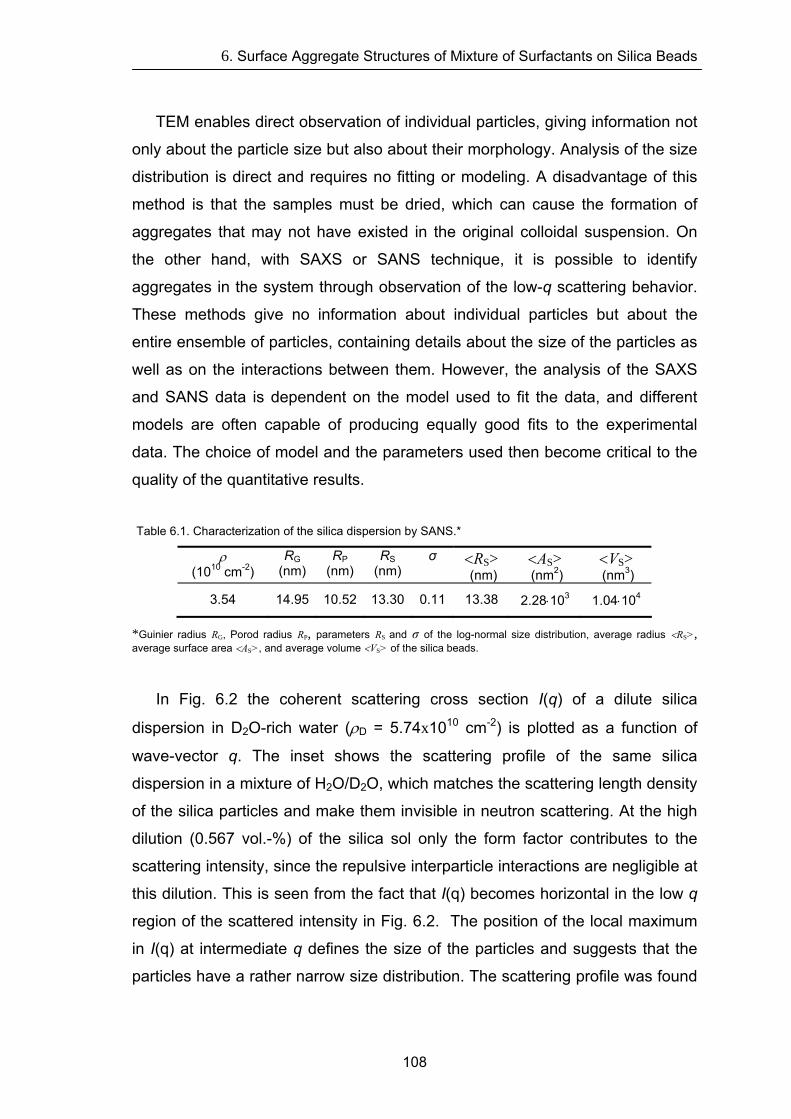
6. Surface Aggregate Structures of Mixture of Surfactants on Silica Beads
TEM enables direct observation of individual particles, giving information not
only about the particle size but also about their morphology. Analysis of the size
distribution is direct and requires no fitting or modeling. A disadvantage of this
method is that the samples must be dried, which can cause the formation of
aggregates that may not have existed in the original colloidal suspension. On
the other hand, with SAXS or SANS technique, it is possible to identify
aggregates in the system through observation of the low-q scattering behavior.
These methods give no information about individual particles but about the
entire ensemble of particles, containing details about the size of the particles as
well as on the interactions between them. However, the analysis of the SAXS
and SANS data is dependent on the model used to fit the data, and different
models are often capable of producing equally good fits to the experimental
data. The choice of model and the parameters used then become critical to the
quality of the quantitative results.
Table 6.1. Characterization of the silica dispersion by SANS.*
ρ (1010 cm-2)
RG (nm)
RP (nm)
RS (nm)
σ <RS> (nm)
<AS> (nm2)
<VS> (nm3)
3.54 14.95 10.52 13.30 0.11 13.38 2.28⋅103 1.04⋅104
*Guinier radius RG, Porod radius RP, parameters RS and σ of the log-normal size distribution, average radius <RS>, average surface area <AS>, and average volume <VS> of the silica beads.
In Fig. 6.2 the coherent scattering cross section I(q) of a dilute silica
dispersion in D2O-rich water (ρD = 5.74x1010 cm-2) is plotted as a function of
wave-vector q. The inset shows the scattering profile of the same silica
dispersion in a mixture of H2O/D2O, which matches the scattering length density
of the silica particles and make them invisible in neutron scattering. At the high
dilution (0.567 vol.-%) of the silica sol only the form factor contributes to the
scattering intensity, since the repulsive interparticle interactions are negligible at
this dilution. This is seen from the fact that I(q) becomes horizontal in the low q
region of the scattered intensity in Fig. 6.2. The position of the local maximum
in I(q) at intermediate q defines the size of the particles and suggests that the
particles have a rather narrow size distribution. The scattering profile was found
108
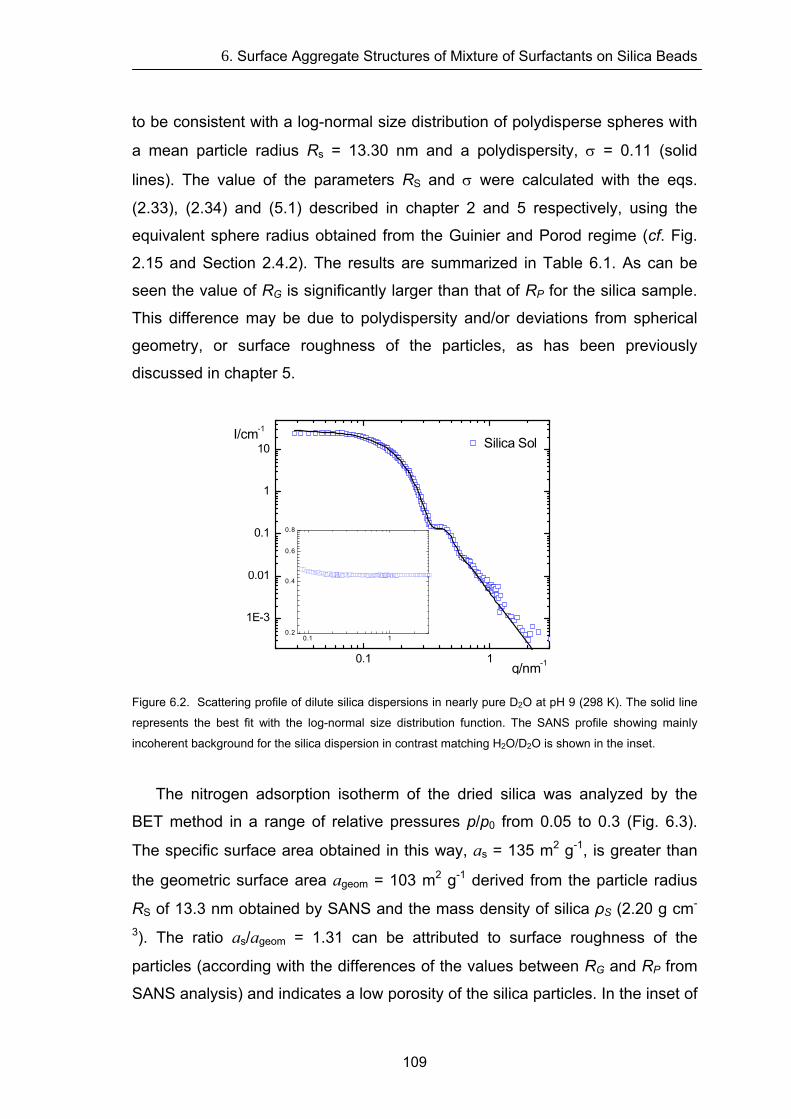
6. Surface Aggregate Structures of Mixture of Surfactants on Silica Beads
to be consistent with a log-normal size distribution of polydisperse spheres with
a mean particle radius Rs = 13.30 nm and a polydispersity, σ = 0.11 (solid
lines). The value of the parameters RS and σ were calculated with the eqs.
(2.33), (2.34) and (5.1) described in chapter 2 and 5 respectively, using the
equivalent sphere radius obtained from the Guinier and Porod regime (cf. Fig.
2.15 and Section 2.4.2). The results are summarized in Table 6.1. As can be
seen the value of RG is significantly larger than that of RP for the silica sample.
This difference may be due to polydispersity and/or deviations from spherical
geometry, or surface roughness of the particles, as has been previously
discussed in chapter 5.
0.1
1E-3
0.01
0.1
1
10
1
0.1 10.2
0.4
0.6
0.8
I/cm-1
q/nm-1
Silica Sol
Figure 6.2. Scattering profile of dilute silica dispersions in nearly pure D2O at pH 9 (298 K). The solid line
represents the best fit with the log-normal size distribution function. The SANS profile showing mainly
incoherent background for the silica dispersion in contrast matching H2O/D2O is shown in the inset.
The nitrogen adsorption isotherm of the dried silica was analyzed by the
BET method in a range of relative pressures p/p0 from 0.05 to 0.3 (Fig. 6.3).
The specific surface area obtained in this way, as = 135 m2 g-1, is greater than
the geometric surface area ageom = 103 m2 g-1 derived from the particle radius
RS of 13.3 nm obtained by SANS and the mass density of silica ρS (2.20 g cm-
3). The ratio as/ageom = 1.31 can be attributed to surface roughness of the
particles (according with the differences of the values between RG and RP from
SANS analysis) and indicates a low porosity of the silica particles. In the inset of
109
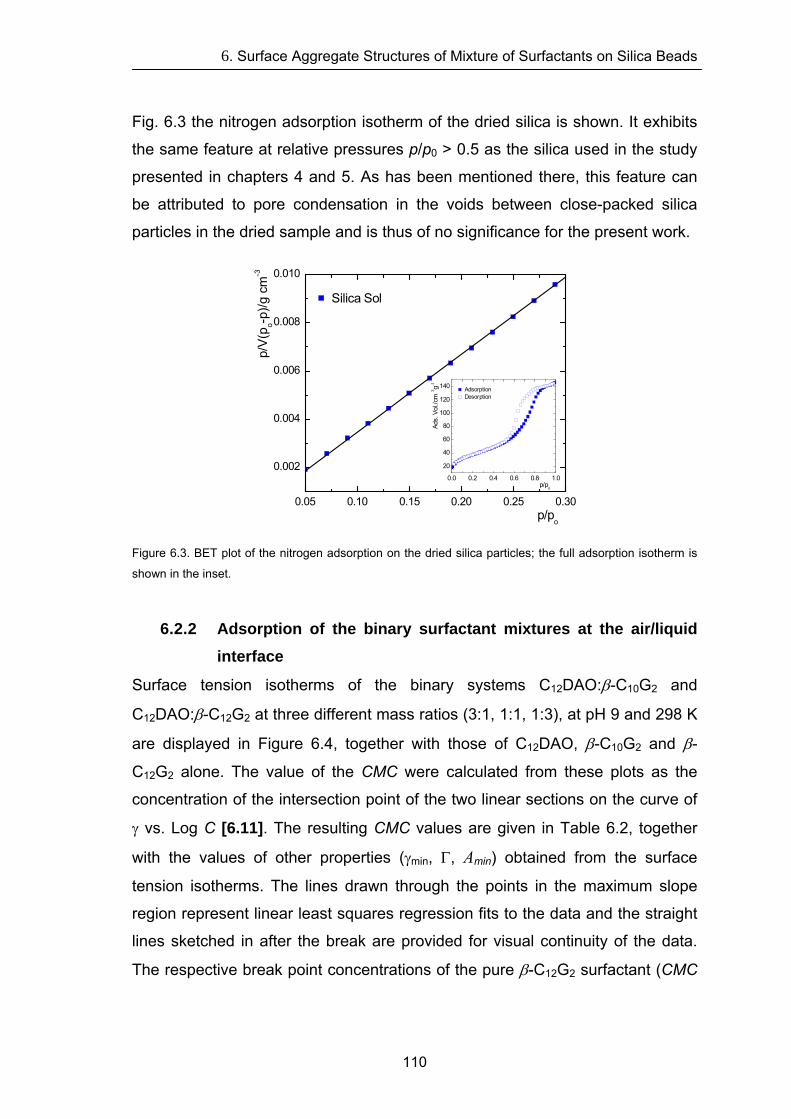
6. Surface Aggregate Structures of Mixture of Surfactants on Silica Beads
Fig. 6.3 the nitrogen adsorption isotherm of the dried silica is shown. It exhibits
the same feature at relative pressures p/p0 > 0.5 as the silica used in the study
presented in chapters 4 and 5. As has been mentioned there, this feature can
be attributed to pore condensation in the voids between close-packed silica
particles in the dried sample and is thus of no significance for the present work.
0.05 0.10 0.
0.002
0.004
0.006
0.008
0.010
15 0.20 0.25 0.30
0.0 0.2 0.4 0.6 0.8 1.0
20
40
60
80
100
120
140
p/po
Ads.
Vol
./cm
3 g-1
Adsorption Desorption
p/po
p/
V(p o-p
)/g c
m-3
Silica Sol
Figure 6.3. BET plot of the nitrogen adsorption on the dried silica particles; the full adsorption isotherm is
shown in the inset.
6.2.2 Adsorption of the binary surfactant mixtures at the air/liquid
interface
Surface tension isotherms of the binary systems C12DAO:β-C10G2 and
C12DAO:β-C12G2 at three different mass ratios (3:1, 1:1, 1:3), at pH 9 and 298 K
are displayed in Figure 6.4, together with those of C12DAO, β-C10G2 and β-
C12G2 alone. The value of the CMC were calculated from these plots as the
concentration of the intersection point of the two linear sections on the curve of
γ vs. Log C [6.11]. The resulting CMC values are given in Table 6.2, together
with the values of other properties (γmin, Γ, Amin) obtained from the surface
tension isotherms. The lines drawn through the points in the maximum slope
region represent linear least squares regression fits to the data and the straight
lines sketched in after the break are provided for visual continuity of the data.
The respective break point concentrations of the pure β-C12G2 surfactant (CMC
110
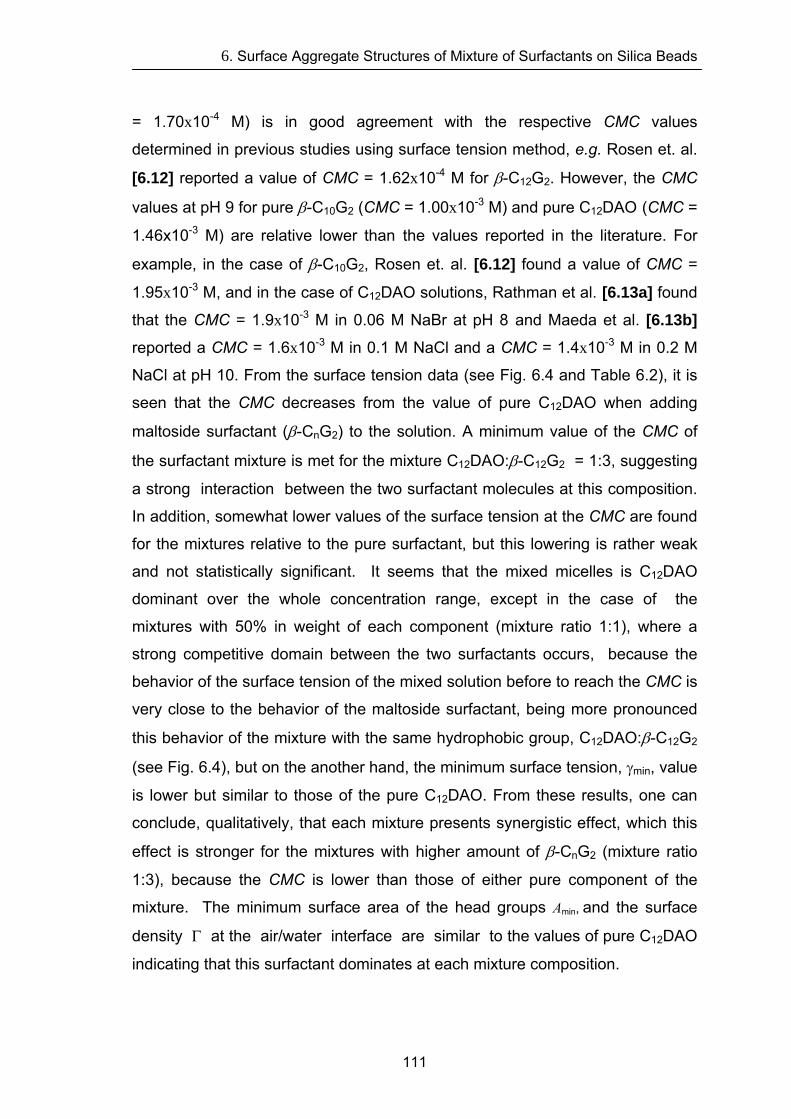
6. Surface Aggregate Structures of Mixture of Surfactants on Silica Beads
= 1.70x10⁻⁴ M) is in good agreement with the respective CMC values
determined in previous studies using surface tension method, e.g. Rosen et. al.
[6.12] reported a value of CMC = 1.62x10⁻⁴ M for β-C12G2. However, the CMC
values at pH 9 for pure β-C10G2 (CMC = 1.00x10⁻³ M) and pure C12DAO (CMC =
1.46x10⁻³ M) are relative lower than the values reported in the literature. For
example, in the case of β-C10G2, Rosen et. al. [6.12] found a value of CMC =
1.95x10⁻³ M, and in the case of C12DAO solutions, Rathman et al. [6.13a] found
that the CMC = 1.9x10⁻³ M in 0.06 M NaBr at pH 8 and Maeda et al. [6.13b] reported a CMC = 1.6x10⁻³ M in 0.1 M NaCl and a CMC = 1.4x10⁻³ M in 0.2 M
NaCl at pH 10. From the surface tension data (see Fig. 6.4 and Table 6.2), it is
seen that the CMC decreases from the value of pure C12DAO when adding
maltoside surfactant (β-CnG2) to the solution. A minimum value of the CMC of
the surfactant mixture is met for the mixture C12DAO:β-C12G2 = 1:3, suggesting
a strong interaction between the two surfactant molecules at this composition.
In addition, somewhat lower values of the surface tension at the CMC are found
for the mixtures relative to the pure surfactant, but this lowering is rather weak
and not statistically significant. It seems that the mixed micelles is C12DAO
dominant over the whole concentration range, except in the case of the
mixtures with 50% in weight of each component (mixture ratio 1:1), where a
strong competitive domain between the two surfactants occurs, because the
behavior of the surface tension of the mixed solution before to reach the CMC is
very close to the behavior of the maltoside surfactant, being more pronounced
this behavior of the mixture with the same hydrophobic group, C12DAO:β-C12G2
(see Fig. 6.4), but on the another hand, the minimum surface tension, γmin, value
is lower but similar to those of the pure C12DAO. From these results, one can
conclude, qualitatively, that each mixture presents synergistic effect, which this
effect is stronger for the mixtures with higher amount of β-CnG2 (mixture ratio
1:3), because the CMC is lower than those of either pure component of the
mixture. The minimum surface area of the head groups Amin, and the surface
density Γ at the air/water interface are similar to the values of pure C12DAO
indicating that this surfactant dominates at each mixture composition.
111
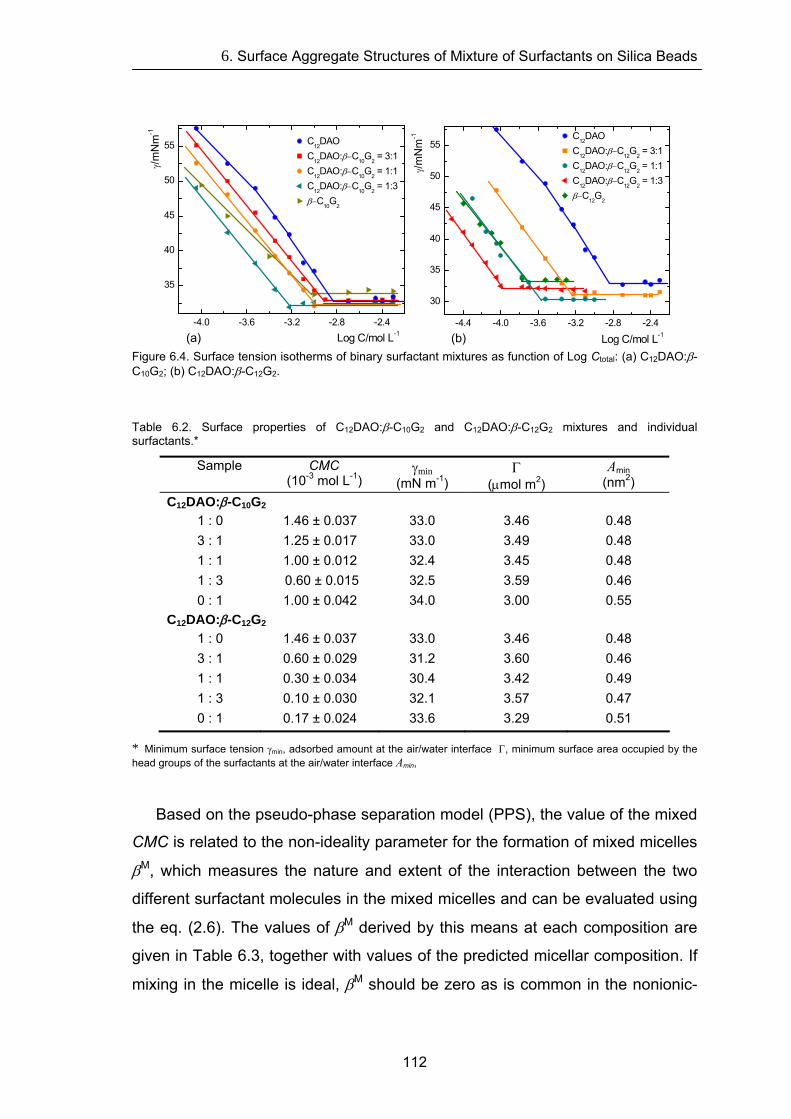
6. Surface Aggregate Structures of Mixture of Surfactants on Silica Beads
-4.4 -4.0 -3.6 -3.2 -2.8 -2.4
30
35
40
45
50
55
(b)
γ/mN
m-1
Log C/mol L-1
C12
DAO C
12DAO:β−C
12G
2 = 3:1
C12
DAO:β−C12
G2 = 1:1
C12
DAO:β−C12
G2 = 1:3
β−C12G2
-4.0 -3.6 -3.2 -2.8 -2.4
35
40
45
50
55
Log C/mol L-1(a)
γ/mN
m-1
C12
DAO C
12DAO:β−C
10G
2 = 3:1
C12
DAO:β−C10
G2 = 1:1
C12
DAO:β−C10
G2 = 1:3
β−C10
G2
Figure 6.4. Surface tension isotherms of binary surfactant mixtures as function of Log Ctotal: (a) C12DAO:β-C10G2; (b) C12DAO:β-C12G2.
Table 6.2. Surface properties of C12DAO:β-C10G2 and C12DAO:β-C12G2 mixtures and individual surfactants.*
Sample CMC (10-3 mol L-1)
γmin (mN m-1)
Γ (μmol m2)
Amin (nm2)
C12DAO:β-C10G2 1 : 0 1.46 ± 0.037 33.0 3.46 0.48 3 : 1 1.25 ± 0.017 33.0 3.49 0.48 1 : 1 1.00 ± 0.012 32.4 3.45 0.48 1 : 3 0.60 ± 0.015 32.5 3.59 0.46 0 : 1 1.00 ± 0.042 34.0 3.00 0.55
C12DAO:β-C12G2 1 : 0 1.46 ± 0.037 33.0 3.46 0.48 3 : 1 0.60 ± 0.029 31.2 3.60 0.46 1 : 1 0.30 ± 0.034 30.4 3.42 0.49 1 : 3 0.10 ± 0.030 32.1 3.57 0.47 0 : 1 0.17 ± 0.024 33.6 3.29 0.51
* Minimum surface tension γmin, adsorbed amount at the air/water interface Γ, minimum surface area occupied by the head groups of the surfactants at the air/water interface Amin,
Based on the pseudo-phase separation model (PPS), the value of the mixed
CMC is related to the non-ideality parameter for the formation of mixed micelles
βM, which measures the nature and extent of the interaction between the two
different surfactant molecules in the mixed micelles and can be evaluated using
the eq. (2.6). The values of βM derived by this means at each composition are
given in Table 6.3, together with values of the predicted micellar composition. If
mixing in the micelle is ideal, βM should be zero as is common in the nonionic-
112
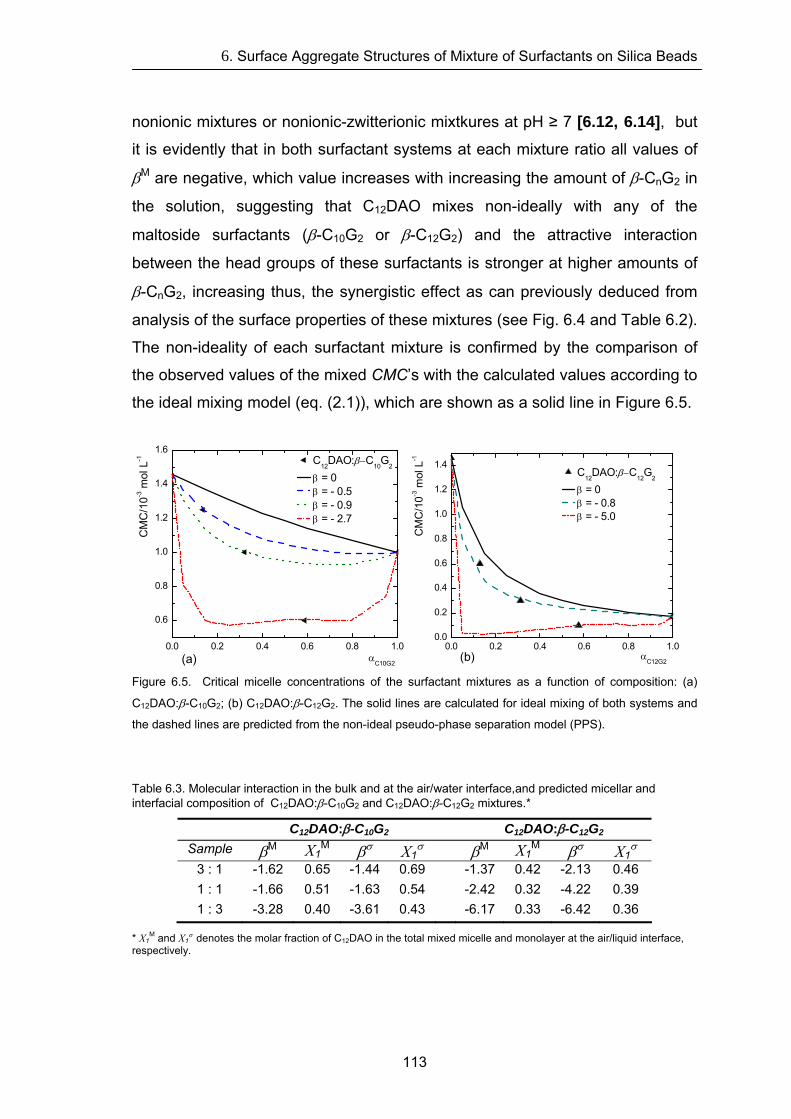
6. Surface Aggregate Structures of Mixture of Surfactants on Silica Beads
nonionic mixtures or nonionic-zwitterionic mixtkures at pH ≥ 7 [6.12, 6.14], but
it is evidently that in both surfactant systems at each mixture ratio all values of
βM are negative, which value increases with increasing the amount of β-CnG2 in
the solution, suggesting that C12DAO mixes non-ideally with any of the
maltoside surfactants (β-C10G2 or β-C12G2) and the attractive interaction
between the head groups of these surfactants is stronger at higher amounts of
β-CnG2, increasing thus, the synergistic effect as can previously deduced from
analysis of the surface properties of these mixtures (see Fig. 6.4 and Table 6.2).
The non-ideality of each surfactant mixture is confirmed by the comparison of
the observed values of the mixed CMC’s with the calculated values according to
the ideal mixing model (eq. (2.1)), which are shown as a solid line in Figure 6.5.
0.0 0.2 0.4 0.6 0.8 1.0
0.6
0.8
1.0
1.2
1.4
1.6
(a)
CM
C/1
0-3 m
ol L
-1 C12
DAO:β−C10
G2
β = 0 β = - 0.5 β = - 0.9 β = - 2.7
αC10G2
0.0 0.2 0.4 0.6 0.8 1.00.0
0.2
0.4
0.6
0.8
1.0
1.2
1.4 C
12DAO:β−C
12G
2
(b) αC12G2
β = 0 β = - 0.8 β = - 5.0
CM
C/1
0-3 m
ol L
-1
Figure 6.5. Critical micelle concentrations of the surfactant mixtures as a function of composition: (a)
C12DAO:β-C10G2; (b) C12DAO:β-C12G2. The solid lines are calculated for ideal mixing of both systems and
the dashed lines are predicted from the non-ideal pseudo-phase separation model (PPS).
Table 6.3. Molecular interaction in the bulk and at the air/water interface,and predicted micellar and interfacial composition of C12DAO:β-C10G2 and C12DAO:β-C12G2 mixtures.*
C12DAO:β-C10G2 C12DAO:β-C12G2 Sample βM X1
M βσ X1σ βM X1
M βσ X1σ
3 : 1 -1.62 0.65 -1.44 0.69 -1.37 0.42 -2.13 0.46 1 : 1 -1.66 0.51 -1.63 0.54 -2.42 0.32 -4.22 0.39 1 : 3 -3.28 0.40 -3.61 0.43 -6.17 0.33 -6.42 0.36
* X1M and X1
σ denotes the molar fraction of C12DAO in the total mixed micelle and monolayer at the air/liquid interface, respectively.
113
6. Surface Aggregate Structures of Mixture of Surfactants on Silica Beads
The non-ideality mixing of the C12DAO:β-C10G2 and C12DAO:β-C12G2
mixtures suggests that the degree of protonation of C12DAO is somehow
affected by addying maltoside surfactant to the solution, resulting in a lowering
of the pH of the system. The βM range value from -1.6 to -2.5 of mixtures at
ratios 3:1 and 1:1 is of the same order as those found by Matsson et al. [6.3c],
in the study of the adsorption of mixtures of C12DAO:β-C12G2 at the air/liquid
interface and on silicon wafers at neutral pH. They suggest that at natural pH (~
7), C12DAO is present both as nonionic and as cationic species, where the
major part in bulk is nonionic and the degree of ionization decreases from 0.11
at low concentrations (pH 5.8) to 0.008 at CMC (pH 7). Suddenly, the molecular
interaction parameter βM increases drastically at higher amounts of β-CnG2
being more evident this behavior in the mixture with the same hydrocarbon
group, indicating that C12DAO behaves like a cationic surfactant because the
value of βM = -6 is even stronger that the values of cationic-nonionic mixtures
[6.12] being comparable with those values for strong electrostatic interactions
presented in anionic-nonionic systems [6.14]. In Table 6.3 is also shown the molecular interaction parameters for mixed
adsorption film formation at the air/water interface βσ, which was calculated by
eq. (2.4). In general, the values of βσ and of βM of each surfactant mixture are
similar, indicating same magnitude of interaction on the monolayer as in the
mixed micelles, except for C12DAO:β-C12G2 mixtures at ratios 3.1 and 1:1,
where the values of βσ are somewhat larger than those of βM. This effect may
be due to the greater difficulty of incorporating the hydrophobic group in the
interior of a convex micelle than at the planar air/aqueous solution interface,
being this effect stronger for the micelles with same chain length.
6.2.3 Structure of Surfactant Aggregates in Aqueous Solutions
SANS data on mixed micelles of C12DAO:β-C10G2 and C12DAO:β-C12G2
mixtures and on the individual components were obtained in a H2O/D2O solvent
mixture of a scattering length density equal to that of the silica (ρHD = 3.54x10¹⁰
cm-2) at pH 9 and at 298 K. Most of the SANS curves show a horizontal regime
114
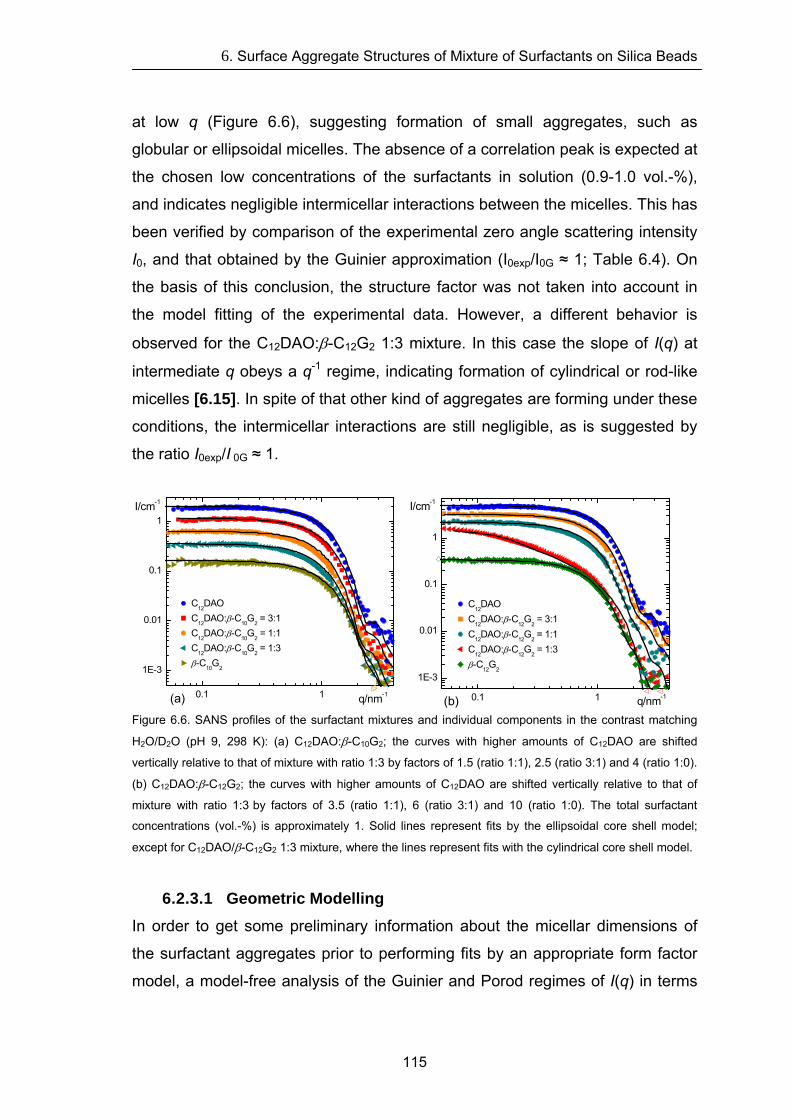
6. Surface Aggregate Structures of Mixture of Surfactants on Silica Beads
115
at low q (Figure 6.6), suggesting formation of small aggregates, such as
globular or ellipsoidal micelles. The absence of a correlation peak is expected at
the chosen low concentrations of the surfactants in solution (0.9-1.0 vol.-%),
and indicates negligible intermicellar interactions between the micelles. This has
been verified by comparison of the experimental zero angle scattering intensity
I0, and that obtained by the Guinier approximation (I0exp/I0G ≈ 1; Table 6.4). On
the basis of this conclusion, the structure factor was not taken into account in
the model fitting of the experimental data. However, a different behavior is
observed for the C12DAO:β-C12G2 1:3 mixture. In this case the slope of I(q) at
intermediate q obeys a q-1 regime, indicating formation of cylindrical or rod-like
micelles [6.15]. In spite of that other kind of aggregates are forming under these
conditions, the intermicellar interactions are still negligible, as is suggested by
the ratio I0exp/I 0G ≈ 1.
0.1 1
1E-3
0.0
0.
1
1
1
q/nm-1
C12
DAO C12DAO:β-C10G2 = 3:1 C
12DAO:β-C
10G
2 = 1:1
C12
DAO:β-C10
G2 = 1:3
β-C10G2
(a)
m-1
0.1 1
1E-3
0.01
0.1
1
I/c
(b)
C12
DAO C
12DAO:β-C
12G
2 = 3:1
C12
DAO:β-C12
G2 = 1:1
C12
DAO:β-C12
G2 = 1:3
β-C12
G2
I/cm-1
q/nm-1
Figure 6.6. SANS profiles of the surfactant mixtures and individual components in the contrast matching
H2O/D2O (pH 9, 298 K): (a) C12DAO:β-C10G2; the curves with higher amounts of C12DAO are shifted
vertically relative to that of mixture with ratio 1:3 by factors of 1.5 (ratio 1:1), 2.5 (ratio 3:1) and 4 (ratio 1:0).
(b) C12DAO:β-C12G2; the curves with higher amounts of C12DAO are shifted vertically relative to that of
mixture with ratio 1:3 by factors of 3.5 (ratio 1:1), 6 (ratio 3:1) and 10 (ratio 1:0). The total surfactant
concentrations (vol.-%) is approximately 1. Solid lines represent fits by the ellipsoidal core shell model;
except for C12DAO/β-C12G2 1:3 mixture, where the lines represent fits with the cylindrical core shell model.
6.2.3.1 Geometric Modelling In order to get some preliminary information about the micellar dimensions of
the surfactant aggregates prior to performing fits by an appropriate form factor
model, a model-free analysis of the Guinier and Porod regimes of I(q) in terms
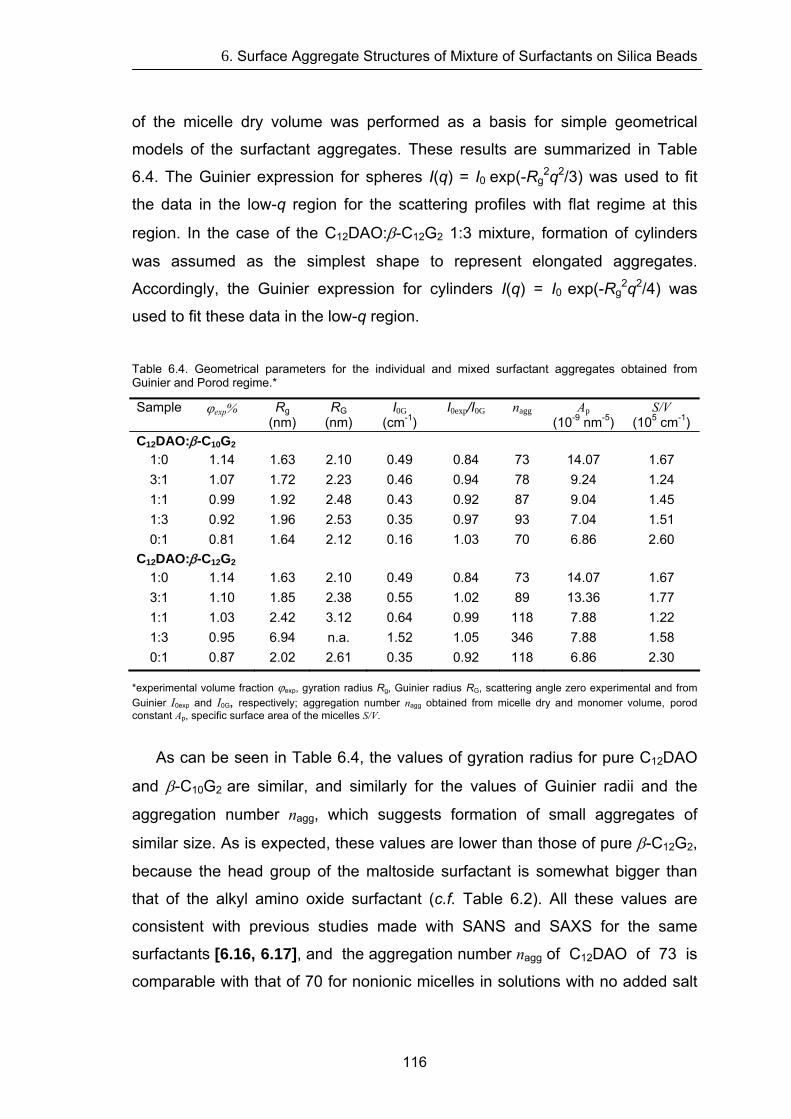
6. Surface Aggregate Structures of Mixture of Surfactants on Silica Beads
of the micelle dry volume was performed as a basis for simple geometrical
models of the surfactant aggregates. These results are summarized in Table
6.4. The Guinier expression for spheres I(q) = I0 exp(-Rg2q2/3) was used to fit
the data in the low-q region for the scattering profiles with flat regime at this
region. In the case of the C12DAO:β-C12G2 1:3 mixture, formation of cylinders
was assumed as the simplest shape to represent elongated aggregates.
Accordingly, the Guinier expression for cylinders I(q) = I0 exp(-Rg2q2/4) was
used to fit these data in the low-q region.
Table 6.4. Geometrical parameters for the individual and mixed surfactant aggregates obtained from Guinier and Porod regime.*
Sample ϕexp%
Rg (nm)
RG (nm)
I0G (cm-1)
I0exp/I0G nagg
Ap (10-9 nm-5)
S/V (105 cm-1)
C12DAO:β-C10G2 1:0 1.14 1.63 2.10 0.49 0.84 73 14.07 1.67 3:1 1.07 1.72 2.23 0.46 0.94 78 9.24 1.24 1:1 0.99 1.92 2.48 0.43 0.92 87 9.04 1.45 1:3 0.92 1.96 2.53 0.35 0.97 93 7.04 1.51 0:1 0.81 1.64 2.12 0.16 1.03 70 6.86 2.60
C12DAO:β-C12G2 1:0 1.14 1.63 2.10 0.49 0.84 73 14.07 1.67 3:1 1.10 1.85 2.38 0.55 1.02 89 13.36 1.77 1:1 1.03 2.42 3.12 0.64 0.99 118 7.88 1.22 1:3 0.95 6.94 n.a. 1.52 1.05 346 7.88 1.58 0:1 0.87 2.02 2.61 0.35 0.92 118 6.86 2.30
*experimental volume fraction ϕexp, gyration radius Rg, Guinier radius RG, scattering angle zero experimental and from Guinier I0exp and I0G, respectively; aggregation number nagg obtained from micelle dry and monomer volume, porod constant Ap, specific surface area of the micelles S/V.
As can be seen in Table 6.4, the values of gyration radius for pure C12DAO
and β-C10G2 are similar, and similarly for the values of Guinier radii and the
aggregation number nagg, which suggests formation of small aggregates of
similar size. As is expected, these values are lower than those of pure β-C12G2,
because the head group of the maltoside surfactant is somewhat bigger than
that of the alkyl amino oxide surfactant (c.f. Table 6.2). All these values are
consistent with previous studies made with SANS and SAXS for the same
surfactants [6.16, 6.17], and the aggregation number nagg of C12DAO of 73 is
comparable with that of 70 for nonionic micelles in solutions with no added salt
116
6. Surface Aggregate Structures of Mixture of Surfactants on Silica Beads
[6.18], indicating that the degree of ionization αM of the C12DAO solutions is
zero, i.e. C12DAO is in a non-ionized state in the micelles. Adding maltoside
surfactant (β-C10G2 or β-C12G2) to the C12DAO solution, a weak increase of the
size of the micelles occurs, which is reflected in the nagg values. This increase of
size and nagg is most pronounced at the higher concentrations of β-C12G2 in the
system (c.f. Table 6.4 and Fig. 6.6), suggesting a transition from small
aggregates formed with small amount of β-C12G2 to elongated (cylindrical or
rod-like) mixed micelles.
From the high-q region (Porod regime) one can obtain information about the
volume-based surface area S/V of the surfactant aggregates. This value may be
compared with the S/V values of the mixed surfactants adsorbed on the silica
nanoparticles, if formation of surface aggregates on the silica beads occurs.
6.2.3.2 Form Factor Models SANS data from pure surfactants and their mixtures have been analyzed in
terms of the existence of only one type of micellar aggregate present in the
solution, in agreement with studies of pure maltoside surfactants (β-C10G2 and
β-C12G2) [6.16, 6.19] and C12DAO solutions at pH values higher than 7 [6.20,
6.21]. In order to choose the best micelle model for representing the SANS data for
the samples with a flat regime at low q region (except C12DAO:β-C12G2 1:3
mixture), we have first fitted the data by using the simplest spherical model
assuming monodisperse or polydisperse spherical micelles containing dried and
hydrated shell. In all cases a good representation of the measured SANS data
requires core radii greater than the fully extended length of a surfactant tail,
which implies an unphysical hole at the center of the micelle or that the
hydrated head groups are pulled into the micelle interior. Another shortcoming
of this model is that the accurate between the experimental and the fitted
volume fraction of total surfactant in the solution, as well as the experimental
(obtained from micelle dry and monomer volume) and the theoretical
aggregation number (results not shown) is greater than 31%, which accurate
should be less than 10%. Because of those shortcomings the spherical model
117
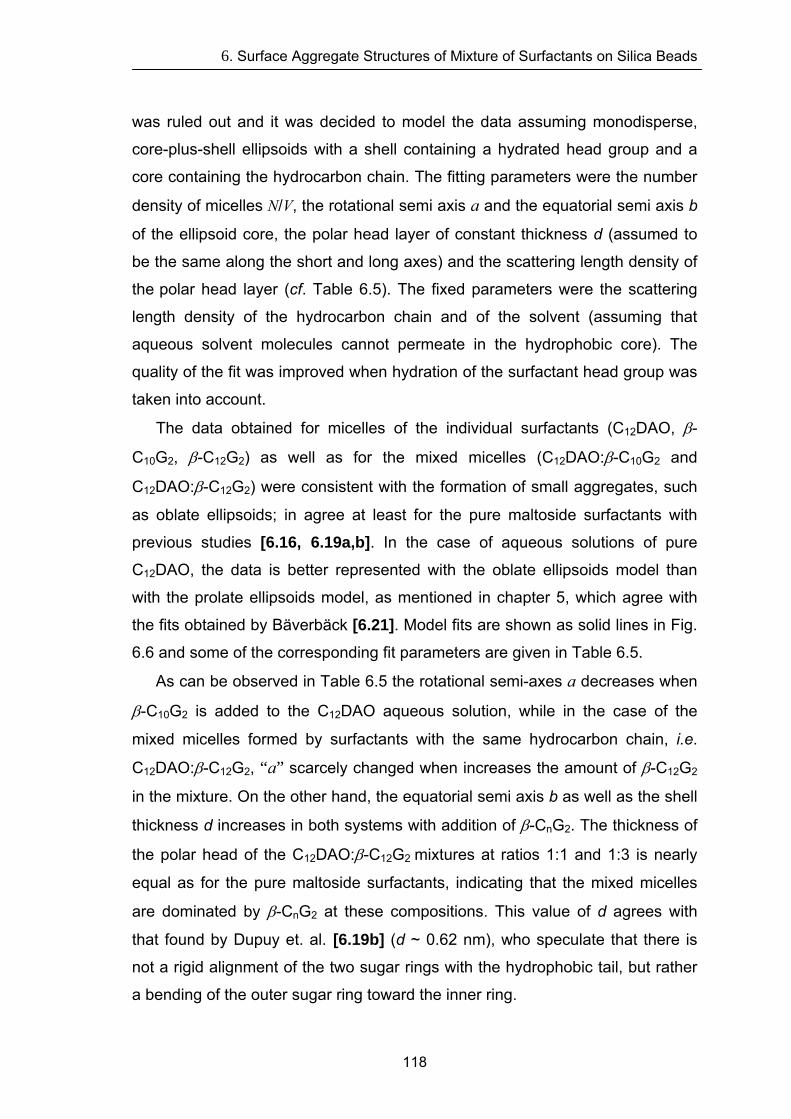
6. Surface Aggregate Structures of Mixture of Surfactants on Silica Beads
was ruled out and it was decided to model the data assuming monodisperse,
core-plus-shell ellipsoids with a shell containing a hydrated head group and a
core containing the hydrocarbon chain. The fitting parameters were the number
density of micelles N/V, the rotational semi axis a and the equatorial semi axis b
of the ellipsoid core, the polar head layer of constant thickness d (assumed to
be the same along the short and long axes) and the scattering length density of
the polar head layer (cf. Table 6.5). The fixed parameters were the scattering
length density of the hydrocarbon chain and of the solvent (assuming that
aqueous solvent molecules cannot permeate in the hydrophobic core). The
quality of the fit was improved when hydration of the surfactant head group was
taken into account.
The data obtained for micelles of the individual surfactants (C12DAO, β-
C10G2, β-C12G2) as well as for the mixed micelles (C12DAO:β-C10G2 and
C12DAO:β-C12G2) were consistent with the formation of small aggregates, such
as oblate ellipsoids; in agree at least for the pure maltoside surfactants with
previous studies [6.16, 6.19a,b]. In the case of aqueous solutions of pure
C12DAO, the data is better represented with the oblate ellipsoids model than
with the prolate ellipsoids model, as mentioned in chapter 5, which agree with
the fits obtained by Bäverbäck [6.21]. Model fits are shown as solid lines in Fig.
6.6 and some of the corresponding fit parameters are given in Table 6.5.
As can be observed in Table 6.5 the rotational semi-axes a decreases when
β-C10G2 is added to the C12DAO aqueous solution, while in the case of the
mixed micelles formed by surfactants with the same hydrocarbon chain, i.e.
C12DAO:β-C12G2, “a” scarcely changed when increases the amount of β-C12G2
in the mixture. On the other hand, the equatorial semi axis b as well as the shell
thickness d increases in both systems with addition of β-CnG2. The thickness of
the polar head of the C12DAO:β-C12G2 mixtures at ratios 1:1 and 1:3 is nearly
equal as for the pure maltoside surfactants, indicating that the mixed micelles
are dominated by β-CnG2 at these compositions. This value of d agrees with
that found by Dupuy et. al. [6.19b] (d ~ 0.62 nm), who speculate that there is
not a rigid alignment of the two sugar rings with the hydrophobic tail, but rather
a bending of the outer sugar ring toward the inner ring.
118
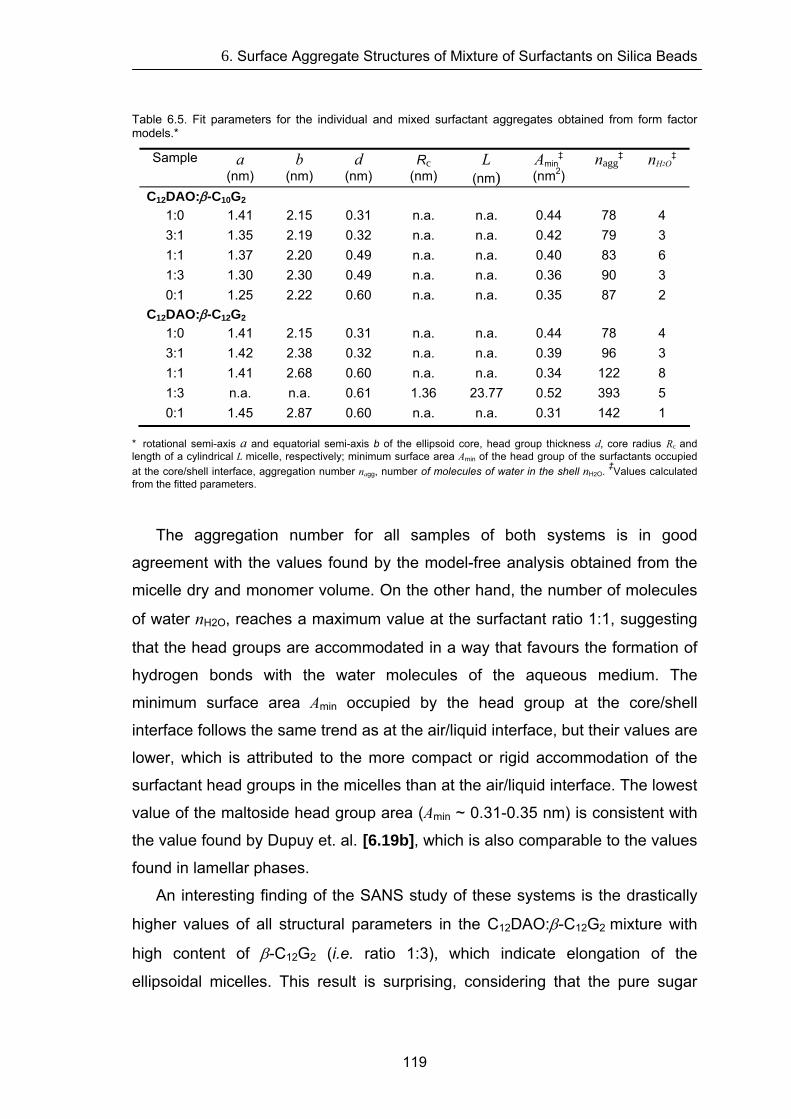
6. Surface Aggregate Structures of Mixture of Surfactants on Silica Beads
Table 6.5. Fit parameters for the individual and mixed surfactant aggregates obtained from form factor models.*
Sample a (nm)
b (nm)
d (nm)
Rc (nm)
L (nm)
Amin‡
(nm2) nagg
‡
nH2O‡
C12DAO:β-C10G2
1:0 1.41 2.15 0.31 n.a. n.a. 0.44 78 4 3:1 1.35 2.19 0.32 n.a. n.a. 0.42 79 3 1:1 1.37 2.20 0.49 n.a. n.a. 0.40 83 6 1:3 1.30 2.30 0.49 n.a. n.a. 0.36 90 3 0:1 1.25 2.22 0.60 n.a. n.a. 0.35 87 2
C12DAO:β-C12G2 1:0 1.41 2.15 0.31 n.a. n.a. 0.44 78 4 3:1 1.42 2.38 0.32 n.a. n.a. 0.39 96 3 1:1 1.41 2.68 0.60 n.a. n.a. 0.34 122 8 1:3 n.a. n.a. 0.61 1.36 23.77 0.52 393 5 0:1 1.45 2.87 0.60 n.a. n.a. 0.31 142 1
* rotational semi-axis a and equatorial semi-axis b of the ellipsoid core, head group thickness d, core radius Rc and length of a cylindrical L micelle, respectively; minimum surface area Amin of the head group of the surfactants occupied at the core/shell interface, aggregation number nagg, number of molecules of water in the shell nH2O. ‡Values calculated from the fitted parameters.
The aggregation number for all samples of both systems is in good
agreement with the values found by the model-free analysis obtained from the
micelle dry and monomer volume. On the other hand, the number of molecules
of water nH2O, reaches a maximum value at the surfactant ratio 1:1, suggesting
that the head groups are accommodated in a way that favours the formation of
hydrogen bonds with the water molecules of the aqueous medium. The
minimum surface area Amin occupied by the head group at the core/shell
interface follows the same trend as at the air/liquid interface, but their values are
lower, which is attributed to the more compact or rigid accommodation of the
surfactant head groups in the micelles than at the air/liquid interface. The lowest
value of the maltoside head group area (Amin ~ 0.31-0.35 nm) is consistent with
the value found by Dupuy et. al. [6.19b], which is also comparable to the values
found in lamellar phases.
An interesting finding of the SANS study of these systems is the drastically
higher values of all structural parameters in the C12DAO:β-C12G2 mixture with
high content of β-C12G2 (i.e. ratio 1:3), which indicate elongation of the
ellipsoidal micelles. This result is surprising, considering that the pure sugar
119
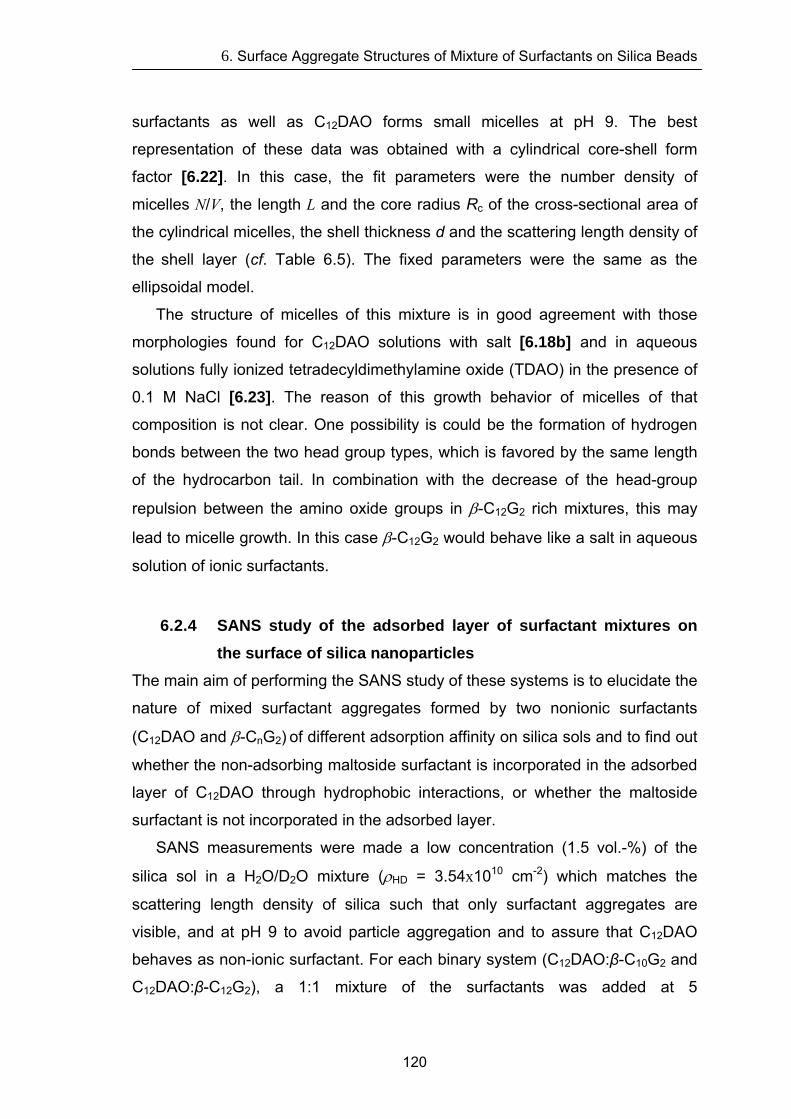
6. Surface Aggregate Structures of Mixture of Surfactants on Silica Beads
surfactants as well as C12DAO forms small micelles at pH 9. The best
representation of these data was obtained with a cylindrical core-shell form
factor [6.22]. In this case, the fit parameters were the number density of
micelles N/V, the length L and the core radius Rc of the cross-sectional area of
the cylindrical micelles, the shell thickness d and the scattering length density of
the shell layer (cf. Table 6.5). The fixed parameters were the same as the
ellipsoidal model.
The structure of micelles of this mixture is in good agreement with those
morphologies found for C12DAO solutions with salt [6.18b] and in aqueous
solutions fully ionized tetradecyldimethylamine oxide (TDAO) in the presence of
0.1 M NaCl [6.23]. The reason of this growth behavior of micelles of that
composition is not clear. One possibility is could be the formation of hydrogen
bonds between the two head group types, which is favored by the same length
of the hydrocarbon tail. In combination with the decrease of the head-group
repulsion between the amino oxide groups in β-C12G2 rich mixtures, this may
lead to micelle growth. In this case β-C12G2 would behave like a salt in aqueous
solution of ionic surfactants.
6.2.4 SANS study of the adsorbed layer of surfactant mixtures on
the surface of silica nanoparticles The main aim of performing the SANS study of these systems is to elucidate the
nature of mixed surfactant aggregates formed by two nonionic surfactants
(C12DAO and β-CnG2) of different adsorption affinity on silica sols and to find out
whether the non-adsorbing maltoside surfactant is incorporated in the adsorbed
layer of C12DAO through hydrophobic interactions, or whether the maltoside
surfactant is not incorporated in the adsorbed layer.
SANS measurements were made a low concentration (1.5 vol.-%) of the
silica sol in a H2O/D2O mixture (ρHD = 3.54x1010 cm-2) which matches the
scattering length density of silica such that only surfactant aggregates are
visible, and at pH 9 to avoid particle aggregation and to assure that C12DAO
behaves as non-ionic surfactant. For each binary system (C12DAO:β-C10G2 and
C12DAO:β-C12G2), a 1:1 mixture of the surfactants was added at 5
120
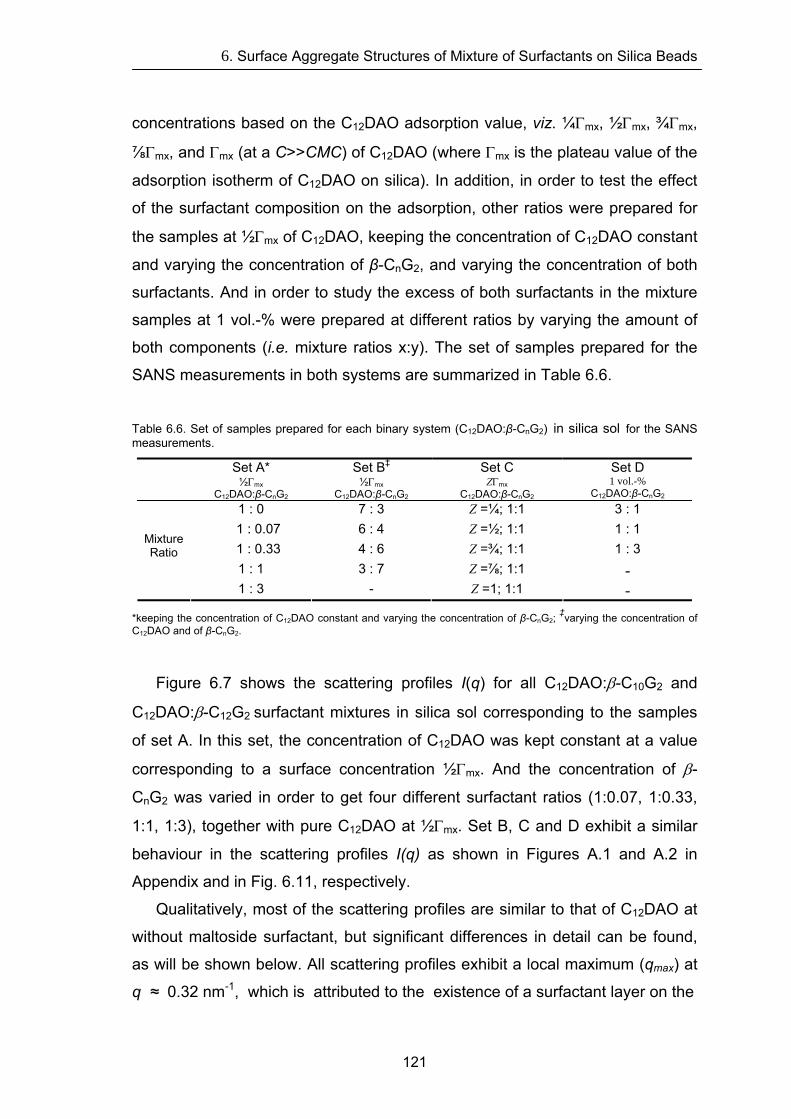
6. Surface Aggregate Structures of Mixture of Surfactants on Silica Beads
concentrations based on the C12DAO adsorption value, viz. ¼Γmx, ½Γmx, ¾Γmx,
⅞Γmx, and Γmx (at a C>>CMC) of C12DAO (where Γmx is the plateau value of the
adsorption isotherm of C12DAO on silica). In addition, in order to test the effect
of the surfactant composition on the adsorption, other ratios were prepared for
the samples at ½Γmx of C12DAO, keeping the concentration of C12DAO constant
and varying the concentration of β-CnG2, and varying the concentration of both
surfactants. And in order to study the excess of both surfactants in the mixture
samples at 1 vol.-% were prepared at different ratios by varying the amount of
both components (i.e. mixture ratios x:y). The set of samples prepared for the
SANS measurements in both systems are summarized in Table 6.6.
Table 6.6. Set of samples prepared for each binary system (C12DAO:β-CnG2) in silica sol for the SANS measurements.
Set A* ½Γmx
C12DAO:β-CnG2
Set B‡ ½Γmx
C12DAO:β-CnG2
Set C ZΓmx
C12DAO:β-CnG2
Set D 1 vol.-%
C12DAO:β-CnG2 1 : 0 7 : 3 Z =¼; 1:1 3 : 1
1 : 0.07 6 : 4 Z =½; 1:1 1 : 1 1 : 0.33 4 : 6 Z =¾; 1:1 1 : 3
1 : 1 3 : 7 Z =⅞; 1:1 -
Mixture Ratio
1 : 3 - Z =1; 1:1 - *keeping the concentration of C12DAO constant and varying the concentration of β-CnG2;
‡varying the concentration of C12DAO and of β-CnG2.
Figure 6.7 shows the scattering profiles I(q) for all C12DAO:β-C10G2 and
C12DAO:β-C12G2 surfactant mixtures in silica sol corresponding to the samples
of set A. In this set, the concentration of C12DAO was kept constant at a value
corresponding to a surface concentration ½Γmx. And the concentration of β-
CnG2 was varied in order to get four different surfactant ratios (1:0.07, 1:0.33,
1:1, 1:3), together with pure C12DAO at ½Γmx. Set B, C and D exhibit a similar
behaviour in the scattering profiles I(q) as shown in Figures A.1 and A.2 in
Appendix and in Fig. 6.11, respectively.
Qualitatively, most of the scattering profiles are similar to that of C12DAO at
without maltoside surfactant, but significant differences in detail can be found,
as will be shown below. All scattering profiles exhibit a local maximum (qmax) at
q ≈ 0.32 nm-1, which is attributed to the existence of a surfactant layer on the
121
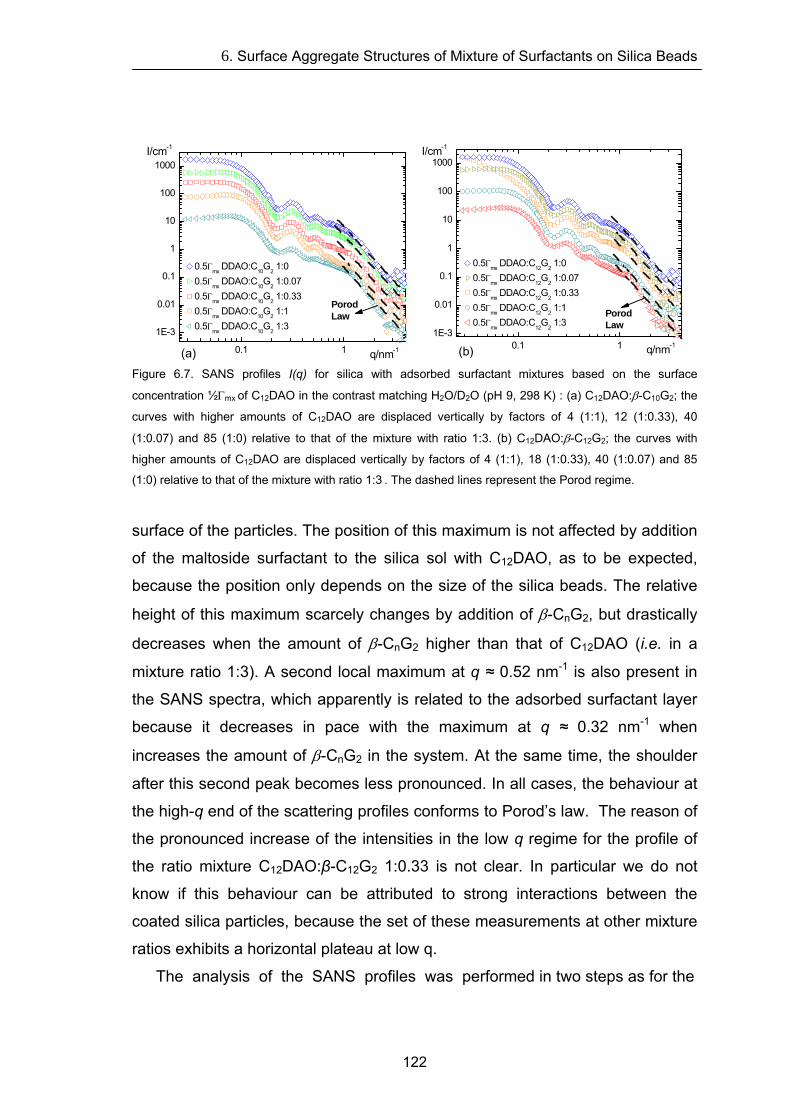
6. Surface Aggregate Structures of Mixture of Surfactants on Silica Beads
122
0.1 1
1E-3
01
0.1
1
10
100
1000
0.
q/nm-1
Porod Law
0.5Γmx
DDAO:C10
G2 1:0
0.5Γmx
DDAO:C10
G2 1:0.07
0.5Γmx DDAO:C10G2 1:0.33 0.5Γ
mx DDAO:C
10G
2 1:1
0.5Γmx
DDAO:C10
G2 1:3
(a)
I/cm -1
0.1 11E-3
0.01
0.1
1
10
100
1000I/cm-1
(b)
0.5Γmx DDAO:C12G2 1:0 0.5Γ
mx DDAO:C
12G
2 1:0.07
0.5Γmx DDAO:C12G2 1:0.33
Porod Law
0.5Γmx
DDAO:C12
G2 1:1 0.5Γ
mx DDAO:C
12G
2 1:3
q/nm-1
Figure 6.7. SANS profiles I(q) for silica with adsorbed surfactant mixtures based on the surface
concentration ½Γmx of C12DAO in the contrast matching H2O/D2O (pH 9, 298 K) : (a) C12DAO:β-C10G2; the
curves with higher amounts of C12DAO are displaced vertically by factors of 4 (1:1), 12 (1:0.33), 40
(1:0.07) and 85 (1:0) relative to that of the mixture with ratio 1:3. (b) C12DAO:β-C12G2; the curves with
higher amounts of C12DAO are displaced vertically by factors of 4 (1:1), 18 (1:0.33), 40 (1:0.07) and 85
(1:0) relative to that of the mixture with ratio 1:3 . The dashed lines represent the Porod regime.
surface of the particles. The position of this maximum is not affected by addition
of the maltoside surfactant to the silica sol with C12DAO, as to be expected,
because the position only depends on the size of the silica beads. The relative
height of this maximum scarcely changes by addition of β-CnG2, but drastically
decreases when the amount of β-CnG2 higher than that of C12DAO (i.e. in a
mixture ratio 1:3). A second local maximum at q ≈ 0.52 nm-1 is also present in
the SANS spectra, which apparently is related to the adsorbed surfactant layer
because it decreases in pace with the maximum at q ≈ 0.32 nm-1 when
increases the amount of β-CnG2 in the system. At the same time, the shoulder
after this second peak becomes less pronounced. In all cases, the behaviour at
the high-q end of the scattering profiles conforms to Porod’s law. The reason of
the pronounced increase of the intensities in the low q regime for the profile of
the ratio mixture C12DAO:β-C12G2 1:0.33 is not clear. In particular we do not
know if this behaviour can be attributed to strong interactions between the
coated silica particles, because the set of these measurements at other mixture
ratios exhibits a horizontal plateau at low q.
The analysis of the SANS profiles was performed in two steps as for the
6. Surface Aggregate Structures of Mixture of Surfactants on Silica Beads
data in chapter 5: First, a simple geometrical modelling was used to estimate
the volume, effective layer thickness and volume-based surface area of the
adsorbed surfactant mixtures. In the second step, nonlinear least-squares fitting
of the scattering data to appropriate form factor models was employed in order
to extract more detailed information about the size and shape of the surface
aggregates.
6.2.4.1 Geometric Modelling The model-free analysis was based on the Guinier and Porod regimes of I(q) in
terms of the dry volume, effective layer thickness, and volume-based surface
area of the adsorbed surfactant mixtures as described in chapter 5. This
analysis was made on the basis for simple geometrical models of the surface
aggregates.
The Guinier expression for spheres, I(q) = I0 exp(-Rg2q2/3), was used to fit
the data in the low-q region. In order to reduce the effect of interparticle
interactions on the determination of the apparent gyration radius Rg, data in the
q range from 0.058 to 0.173 nm-1 were used. The effective layer thickness δeff of
the adsorbed surfactants can be estimated from the silica radius RG and the
apparent gyration radius Rg in presence of the surfactant mixture, which was
obtained from the Guinier approximation. For example, we find a radius of
gyration Rg = 16.18 nm for the surfactant mixture C12DAO:β-C12G2 1:1 at ½Γmx
of C12DAO in the silica sol (RG = 14.95 nm). In the contrast-match scenario of
our experiment, Rg must have a value between the silica radius RG and RG +
δeff, depending on the surfactant density profile. Assuming for simplicity that Rg
is half-way between these two values, a typical layer thickness of the adsorbed
surfactant is δeff = 2·(16.18-14.95) = 2.5 nm. This value is somewhat lower than
the values found in the study of the adsorption of pure C12DAO on silica
nanoparticles (see chapter 5) [6.24]. From the high-q region (Porod regime) we obtain the volume-based surface
area S/V of the surface aggregates, since the concentration of free mixed
micelles in solution is negligible at the chosen surfactant concentrations. The
respective value for free mixed micelles can be derived from the scattering
123
6. Surface Aggregate Structures of Mixture of Surfactants on Silica Beads
profile of the surfactant in the absence of silica (Fig. 6.6). For example, for the
surfactant mixture C12DAO:β-C12G2 1:1 at ½Γmx of C12DAO in the silica sol, S/V
= 1.37x105 cm-1. When comparing this value with that found for C12DAO:β-
C12G2 1:1 in the H2O/D2O mixture in absence of silica (S/V = 1.22x105 cm-1), one
finds that S/V for the free mixed micelles is about 11% lower than for the surface
aggregates. The similar magnitude of the two values implies similar
morphologies of the surfactant aggregates in solution and on the surface,
indicating that somehow the maltoside surfactant is incorporated in the
adsorbed layer of C12DAO. This excludes adsorbed half-micelles, which would
require considerably more surface area.
The structural parameters of the surfactant adsorbed layer of both surfactant
mixtures, based on the surface concentration of ½Γmx of C12DAO in the silica sol
(obtained from Guinier and Porod regime), are summarized in Table 6.7. Also
shown in the Table are values of dry volume of adsorbed surfactants per silica
bead, Vdry, which is derived from the scattering cross section at zero angle I0
(see eq. (2.31)) and the number of surface micelles adsorbed on the silica
beads Nmic, which can be estimated by dividing the dry volume of adsorbed
surfactant by the volume of a free mixed micelles, on the assumption that the
surface micelles adsorbed on the silica beads are similar to micelles in solution,
as has been demonstrated in the Porod regime.
Reasonable agreement between the sets δeff values for C12DAO:β-C12G2
mixtures is found for most mixture ratios, but large deviations appear for
C12DAO:β-C10G2 mixtures. The results in Table 6.7 indicate that for most
mixture ratios the effective layer thickness δeff is significantly smaller than the
extended tail length of C12DAO (lc = 1.67 nm) or β-C10G2 (lc = 1.42 nm) [6.25]. However, for both surfactant systems at mass ratio 1:0.33, where the amount of
C12DAO is three times higher than that of the maltoside surfactant, significantly
higher values of the gyration radius Rg and effective layer thickness δeff than for
other mass ratios are observed. This behavior is more pronounced in the
system with β-C12G2, where the two surfactants have the same hydrocarbon
group. In this case the value of Rg could be affected by the drastic increase of
the scattered intensities I(q) at the low-q region, which behaviour is not clear
124
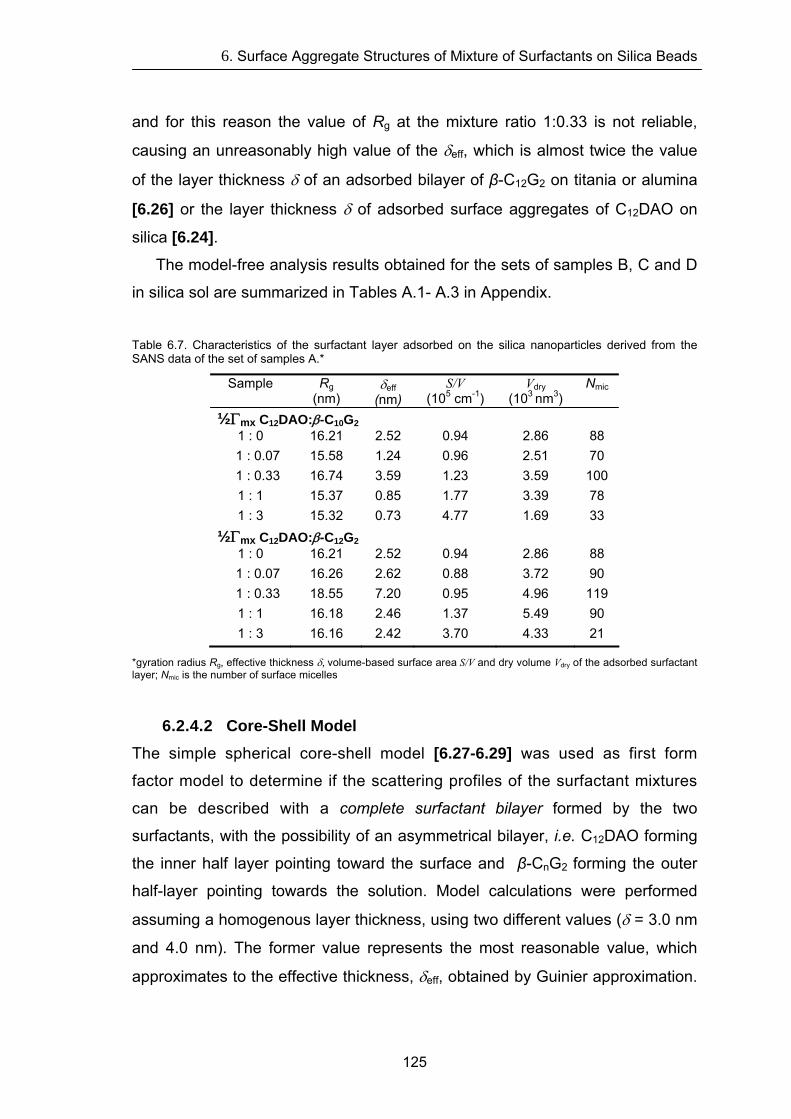
6. Surface Aggregate Structures of Mixture of Surfactants on Silica Beads
and for this reason the value of Rg at the mixture ratio 1:0.33 is not reliable,
causing an unreasonably high value of the δeff, which is almost twice the value
of the layer thickness δ of an adsorbed bilayer of β-C12G2 on titania or alumina
[6.26] or the layer thickness δ of adsorbed surface aggregates of C12DAO on
silica [6.24]. The model-free analysis results obtained for the sets of samples B, C and D
in silica sol are summarized in Tables A.1- A.3 in Appendix.
Table 6.7. Characteristics of the surfactant layer adsorbed on the silica nanoparticles derived from the SANS data of the set of samples A.*
Sample Rg (nm)
δeff (nm)
S/V (105 cm-1)
Vdry (103 nm3)
Nmic
½Γmx C12DAO:β-C10G2 1 : 0 16.21 2.52 0.94 2.86 88
1 : 0.07 15.58 1.24 0.96 2.51 70 1 : 0.33 16.74 3.59 1.23 3.59 100
1 : 1 15.37 0.85 1.77 3.39 78 1 : 3 15.32 0.73 4.77 1.69 33
½Γmx C12DAO:β-C12G2 1 : 0 16.21 2.52 0.94 2.86 88
1 : 0.07 16.26 2.62 0.88 3.72 90 1 : 0.33 18.55 7.20 0.95 4.96 119
1 : 1 16.18 2.46 1.37 5.49 90 1 : 3 16.16 2.42 3.70 4.33 21
*gyration radius Rg, effective thickness δ, volume-based surface area S/V and dry volume Vdry of the adsorbed surfactant layer; Nmic is the number of surface micelles
6.2.4.2 Core-Shell Model The simple spherical core-shell model [6.27-6.29] was used as first form
factor model to determine if the scattering profiles of the surfactant mixtures
can be described with a complete surfactant bilayer formed by the two
surfactants, with the possibility of an asymmetrical bilayer, i.e. C12DAO forming
the inner half layer pointing toward the surface and β-CnG2 forming the outer
half-layer pointing towards the solution. Model calculations were performed
assuming a homogenous layer thickness, using two different values (δ = 3.0 nm
and 4.0 nm). The former value represents the most reasonable value, which
approximates to the effective thickness, δeff, obtained by Guinier approximation.
125
6. Surface Aggregate Structures of Mixture of Surfactants on Silica Beads
The latter value was chosen because is due to that in previous studies of
adsorption of C12DAO [6.24] or β-CnG2 [6.26, 6.30] on hydrophilic surfaces
have suggested formation of surface aggregates and a bilayer with a layer
thickness of 4.0 nm.
The fit obtained with this model and the assumed layer thicknesses of 3.0
nm and 4.0 nm exhibits a similar behavior as was found previously for the
adsorption C12DAO, C12E5 and TX-100 on silica beads [6.24, 6.29, 6.31]. This is
shown in Fig. 6.8 for the surfactant mixture C12DAO:β-C12G2 1:1 at ½Γmx of
C12DAO in the silica sol. This model underestimates the total adsorbed surface
area of the C12DAO:β-C12G2 mixture, as indicated by the deviations at high
wave vectors q between the predicted and experimental intensities. A good
representation of the data was found in the q range 0.04 < q < 0.22 nm-1 when
the calculated intensities obtained for a layer thickness of 4.0 nm were
multiplied by a factor f = 0.50 (cf. inset Fig. 6.8). However, it is evident that the
local maximum at q ≈ 0.32 nm-1 is displaced to lower q values, indicating that
the real layer thickness of the adsorbed surfactant should be less than 4.0 nm.
The intensities predicted with the effective layer thickness of 3.0 nm give a
better approximation of the data at low-q and at the local maximum at q ≈ 0.32
nm-1, without any arbitrary factor f, but still the predicted intensities are
displaced to lower q. It appears that the real layer thickness of the adsorbed
surfactant should be in the range of 2.5 < q < 3.0 nm. Similar results were
obtained for the other mass ratios for both systems and for the other sets of
samples described in Table 6.6 (results not shown).
The discrepancies observed for the core-shell model in the high-q region
these results indicate that the adsorbed surfactant does not form a uniform
layer, but rather forms smaller surface aggregates, which have a higher surface
area at a given total adsorbed volume. With this supposition two possibilities
can be met: (i) that the adsorption is dominated by C12DAO and the maltoside
surfactant is not co-adsorbed in the surface aggregates or (ii) that there is
formation of mixed surface aggregates are formed, like those in solution (see
Section 6.2.3). However, the preliminary result from the core-shell model is in
disagreement with the explanation suggested Matsson et. al. [6.3c] on the
126
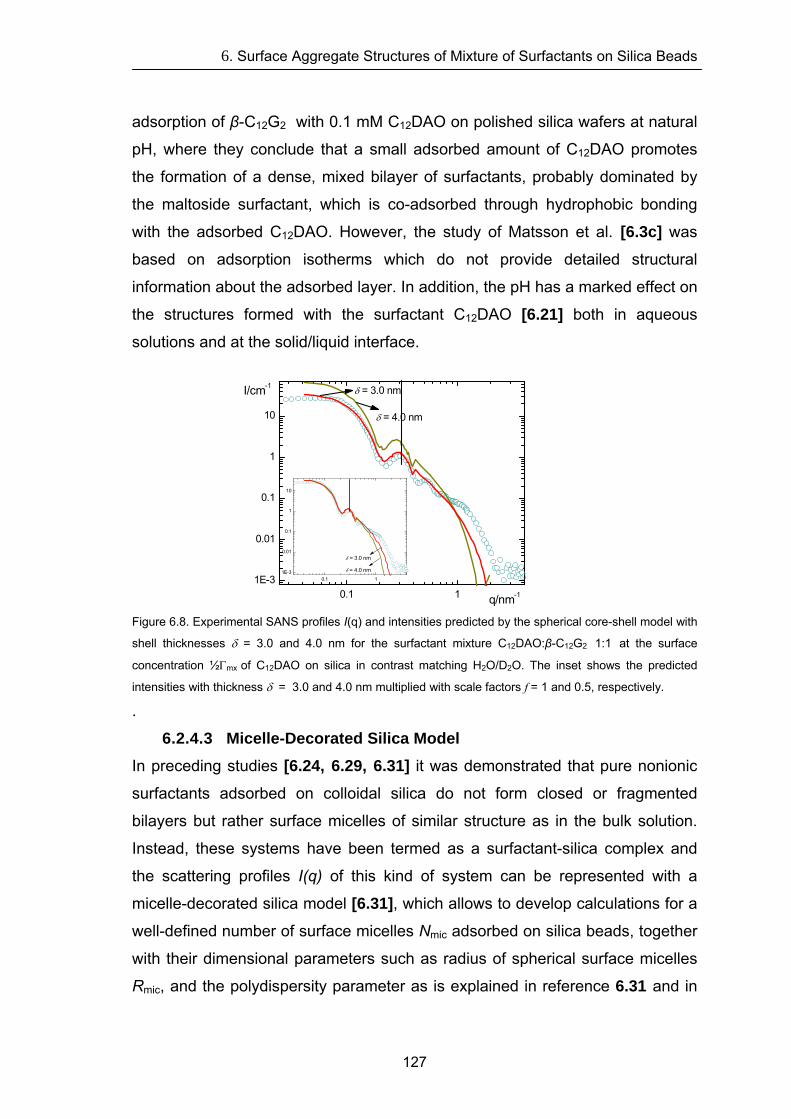
6. Surface Aggregate Structures of Mixture of Surfactants on Silica Beads
adsorption of β-C12G2 with 0.1 mM C12DAO on polished silica wafers at natural
pH, where they conclude that a small adsorbed amount of C12DAO promotes
the formation of a dense, mixed bilayer of surfactants, probably dominated by
the maltoside surfactant, which is co-adsorbed through hydrophobic bonding
with the adsorbed C12DAO. However, the study of Matsson et al. [6.3c] was
based on adsorption isotherms which do not provide detailed structural
information about the adsorbed layer. In addition, the pH has a marked effect on
the structures formed with the surfactant C12DAO [6.21] both in aqueous
solutions and at the solid/liquid interface.
0.1 11E-3
0.01
0.1
1
10
0.1 11E-3
0.01
0.1
1
10
δ = 3.0 nm
δ = 4.0 nm
δ = 3.0 nm
δ = 4.0 nm
I/cm-1
q/nm-1
Figure 6.8. Experimental SANS profiles I(q) and intensities predicted by the spherical core-shell model with
shell thicknesses δ = 3.0 and 4.0 nm for the surfactant mixture C12DAO:β-C12G2 1:1 at the surface
concentration ½Γmx of C12DAO on silica in contrast matching H2O/D2O. The inset shows the predicted
intensities with thickness δ = 3.0 and 4.0 nm multiplied with scale factors f = 1 and 0.5, respectively.
.
6.2.4.3 Micelle-Decorated Silica Model In preceding studies [6.24, 6.29, 6.31] it was demonstrated that pure nonionic
surfactants adsorbed on colloidal silica do not form closed or fragmented
bilayers but rather surface micelles of similar structure as in the bulk solution.
Instead, these systems have been termed as a surfactant-silica complex and
the scattering profiles I(q) of this kind of system can be represented with a
micelle-decorated silica model [6.31], which allows to develop calculations for a
well-defined number of surface micelles Nmic adsorbed on silica beads, together
with their dimensional parameters such as radius of spherical surface micelles
Rmic, and the polydispersity parameter as is explained in reference 6.31 and in
127
6. Surface Aggregate Structures of Mixture of Surfactants on Silica Beads
chapter 5 of this Thesis. Here we apply this model to the case of layers formed
by surfactant mixtures.
By employing this model, we follow the procedure described in chapter 4
and 5. The fitting of the scattered intensities with this model and the estimation
of the real adsorbed surfactant volume, Vtot, was based on the layer
thicknesses: δ = 3.0 and 4.0 nm. The real adsorbed surfactant volume was
calculated by introducing the effective volume fraction of surfactant in the shell,
X (i.e. fraction of the layer volume really occupied by the surfactant), which is
directly related to factor f, used to rescale the theoretical intensities obtained by
the core-shell model to the experimental intensities, by the expression:
fX = . For example, for the surfactant mixture C12DAO:β-C12G2 1:1 at ½Γmx
of C12DAO in the silica sol with a fixed layer thickness of 4.0 nm, f = 0.50, which
indicates that only 71% of the layer volume is occupied by the surfactant
mixture C12DAO:β-C12G2, on the assumption that β-C12G2 is incorporated into
the adsorbed C12DAO layer. A similar value of X was found for the surfactant
system ½Γmx C12DAO:β-C10G2 1:1 (c.f. Table A.4 - A.7 in Appendix). By
comparing the values of X of these two binary systems with that of pure C12DAO
at the surface concentration ½Γmx (where X = 41%) we find that the effective
volume fraction of surfactant in the shell X is strongly increased when adding β-
CnG2 to pure C12DAO. This finding suggests that β-CnG2 contributes to the
formation of surface micelles by co-adsorption in the adsorbed C12DAO layer.
The total surface area of the adsorbed surfactant, Atot, was calculated from the
specific surface area of the adsorbed surfactant, S/V as determined by Porod’s
law (S/V = Ap/2πΔρ2) and the number density of silica beads, SS VVN /)/( ϕ= ,
by the relation Atot = (S/V)surf /(N/V)S.
The total volume, Vtot, and surface area, Atot, of the adsorbed surfactant were
then used to estimate the number and dimensional parameters of surface
aggregates assuming different morphologies. As first approximation, we
assumed the formation of isolated spherical surface aggregates with a radius
Rmic and number of micelles Nmic. However, for both surfactant systems at each
mass ratio a good representation of the measured SANS data with spherical
128
6. Surface Aggregate Structures of Mixture of Surfactants on Silica Beads
surface micelles requires unrealistic values of the micelle radius Rmic and of the
number of adsorbed surface micelles Nmic (≥ 900). The physically unrealistic
values of Rmic obtained assuming layer thicknesses δ = 3.0 or 4.0 nm are similar
with a difference within 10% in most cases. In general, on the assumption of a
fixed layer thickness δ = 4.0 nm, the value of Rmic for ½Γmx of pure C12DAO in
silica sol is around 1.0 nm (i.e., less than the length of an extended surfactant
molecule) and decreases with increasing amount of β-CnG2,. For example, for
the ½Γmx C12DAO:β-C12G2 1:3 mixture (i.e. 75% of β-CnG2 in the mixture), Rmic ≈
0.5 nm, i.e., less than the half of the length of an extended surfactant molecule.
This feature is more pronounced in the mixtures with β-C10G2. Similar results
are obtained for the sets of samples B, C and D in silica sol (results not shown).
For this reason, model calculations similar to those described above were
also made for surface aggregates of different geometries, viz., patch-like,
ellipsoidal and wormlike micelles. A satisfactory representation of the results
was possible with the model of oblate surface micelles (like the surface
aggregate structure of pure C12DAO on silica of similar particle size, as
described in chapter 5 and reference 6.24). The model involves two structural
parameters, Rn and Rlat, which also define the orientation of the micelle on the
surface (c.f. chapter 5 for more details).
This finding agrees with the analysis obtained from Porod regime in Section
6.2.4.1, where were compared the value of the specific surface area of the
adsorbed surfactant, S/V, in presence and in absence of the silica for each
mixture ratio based on ½Γmx C12DAO (c.f. Table 6.4 and 6.7). A comparison of
the scattering curves of C12DAO:β-C10G2 and C12DAO:β-C12G2 mixtures at the
ratio 1:1 in H2O/D2O in the absence and presence of silica is shown in Figure
6.9. The scattering curves of C12DAO:β-CnG2 1:1 mixtures in the absence and
presence of the silica nearly coincide in the high-q region, suggesting that the
surface area S/V and the shape of the mixed surface micelles are not altered in
presence of silica nanoparticles.
The data for the aqueous solution of C12DAO:β-C10G2 and C12DAO:β-C12G2
mixture at the ratio 1:1 can be represented by a model of oblate ellipsoids, with
a =1.37 and 1.41 nm and b = 2.20 and 2.68 nm, respectively (c.f. Table 6.5).
129
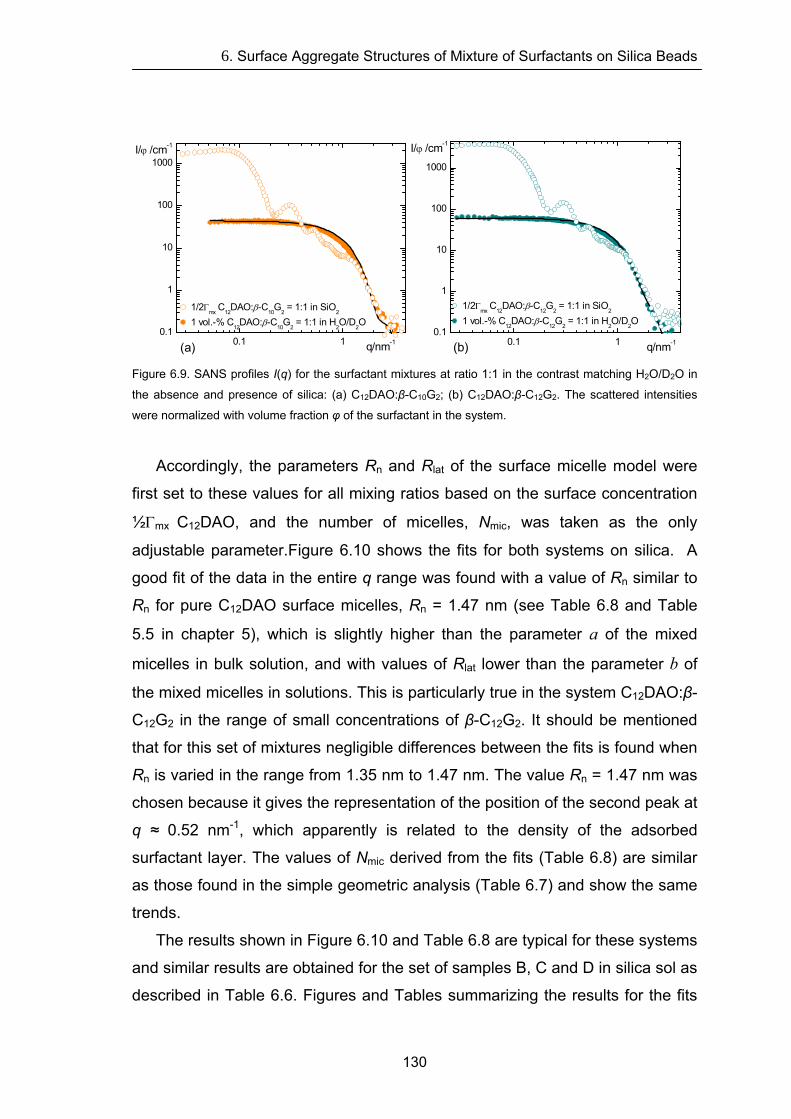
6. Surface Aggregate Structures of Mixture of Surfactants on Silica Beads
130
0.1 10.1
1
10
0
1000
10
(a)
1/2Γmx
C12
DAO:β-C10
G2 = 1:1 in SiO
2
1 vol.-% C12
DAO:β-C10
G2 = 1:1 in H
2O/D
2O
/cI/ϕ -1
q/nm-1 0.1 10.1
1
10
100
1000
m I/ϕ /cm-1
(b)
1/2Γmx C12DAO:β-C12G2 = 1:1 in SiO2 1 vol.-% C12DAO:β-C12G2 = 1:1 in H2O/D2O
q/nm-1
Figure 6.9. SANS profiles I(q) for the surfactant mixtures at ratio 1:1 in the contrast matching H2O/D2O in
the absence and presence of silica: (a) C12DAO:β-C10G2; (b) C12DAO:β-C12G2. The scattered intensities
were normalized with volume fraction φ of the surfactant in the system.
Accordingly, the parameters Rn and Rlat of the surface micelle model were
first set to these values for all mixing ratios based on the surface concentration
½Γmx C12DAO, and the number of micelles, Nmic, was taken as the only
adjustable parameter.Figure 6.10 shows the fits for both systems on silica. A
good fit of the data in the entire q range was found with a value of Rn similar to
Rn for pure C12DAO surface micelles, Rn = 1.47 nm (see Table 6.8 and Table
5.5 in chapter 5), which is slightly higher than the parameter a of the mixed
micelles in bulk solution, and with values of Rlat lower than the parameter b of
the mixed micelles in solutions. This is particularly true in the system C12DAO:β-
C12G2 in the range of small concentrations of β-C12G2. It should be mentioned
that for this set of mixtures negligible differences between the fits is found when
Rn is varied in the range from 1.35 nm to 1.47 nm. The value Rn = 1.47 nm was
chosen because it gives the representation of the position of the second peak at
q ≈ 0.52 nm-1, which apparently is related to the density of the adsorbed
surfactant layer. The values of Nmic derived from the fits (Table 6.8) are similar
as those found in the simple geometric analysis (Table 6.7) and show the same
trends.
The results shown in Figure 6.10 and Table 6.8 are typical for these systems
and similar results are obtained for the set of samples B, C and D in silica sol as
described in Table 6.6. Figures and Tables summarizing the results for the fits
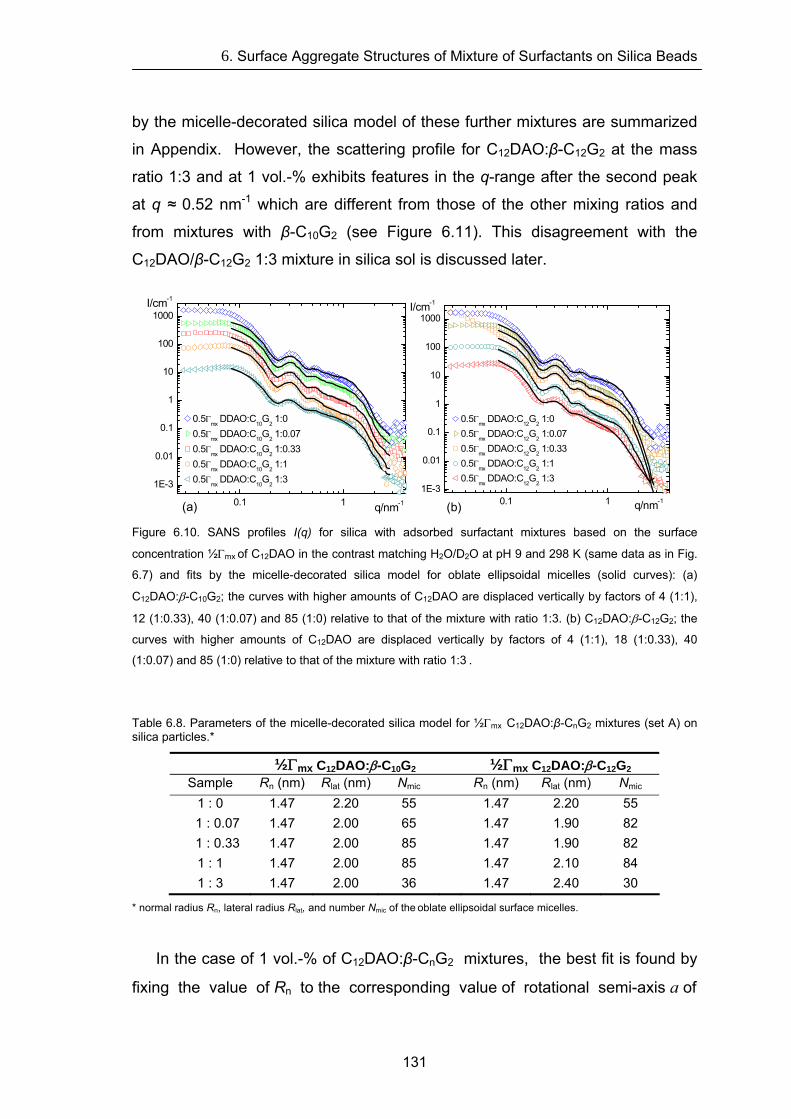
6. Surface Aggregate Structures of Mixture of Surfactants on Silica Beads
by the micelle-decorated silica model of these further mixtures are summarized
in Appendix. However, the scattering profile for C12DAO:β-C12G2 at the mass
ratio 1:3 and at 1 vol.-% exhibits features in the q-range after the second peak
at q ≈ 0.52 nm-1 which are different from those of the other mixing ratios and
from mixtures with β-C10G2 (see Figure 6.11). This disagreement with the
C12DAO/β-C12G2 1:3 mixture in silica sol is discussed later.
0.1 1
1 -3
01
0.1
1
10
00
1 000
E
0.
1
q/nm-1
0.5Γmx
DDAO:C10
G2 1:0
0.5Γmx DDAO:C10G2 1:0.07 0.5Γmx DDAO:C10G2 1:0.33 0.5Γmx DDAO:C10G2 1:1 0.5Γ
mx DDAO:C
10G
2 1:3
(a)
I/cm-1
0.1 11E-3
0.01
0.1
1
10
100
1000I/cm-1
(b)
0.5Γmx DDAO:C12G2 1:0 0.5Γ
mx DDAO:C
12G
2 1:0.07
0.5Γmx DDAO:C12G2 1:0.33 0.5Γ
mx DDAO:C
12G
2 1:1
0.5Γmx
DDAO:C12
G2 1:3
q/nm-1
Figure 6.10. SANS profiles I(q) for silica with adsorbed surfactant mixtures based on the surface
concentration ½Γmx of C12DAO in the contrast matching H2O/D2O at pH 9 and 298 K (same data as in Fig.
6.7) and fits by the micelle-decorated silica model for oblate ellipsoidal micelles (solid curves): (a)
C12DAO:β-C10G2; the curves with higher amounts of C12DAO are displaced vertically by factors of 4 (1:1),
12 (1:0.33), 40 (1:0.07) and 85 (1:0) relative to that of the mixture with ratio 1:3. (b) C12DAO:β-C12G2; the
curves with higher amounts of C12DAO are displaced vertically by factors of 4 (1:1), 18 (1:0.33), 40
(1:0.07) and 85 (1:0) relative to that of the mixture with ratio 1:3 .
Table 6.8. Parameters of the micelle-decorated silica model for ½Γmx C12DAO:β-CnG2 mixtures (set A) on silica particles.*
½Γmx C12DAO:β-C10G2 ½Γmx C12DAO:β-C12G2 Sample Rn (nm) Rlat (nm) Nmic Rn (nm) Rlat (nm) Nmic
1 : 0 1.47 2.20 55 1.47 2.20 55 1 : 0.07 1.47 2.00 65 1.47 1.90 82 1 : 0.33 1.47 2.00 85 1.47 1.90 82
1 : 1 1.47 2.00 85 1.47 2.10 84 1 : 3 1.47 2.00 36 1.47 2.40 30
* normal radius Rn, lateral radius Rlat, and number Nmic of the oblate ellipsoidal surface micelles.
In the case of 1 vol.-% of C12DAO:β-CnG2 mixtures, the best fit is found by
fixing the value of Rn to the corresponding value of rotational semi-axis a of
131
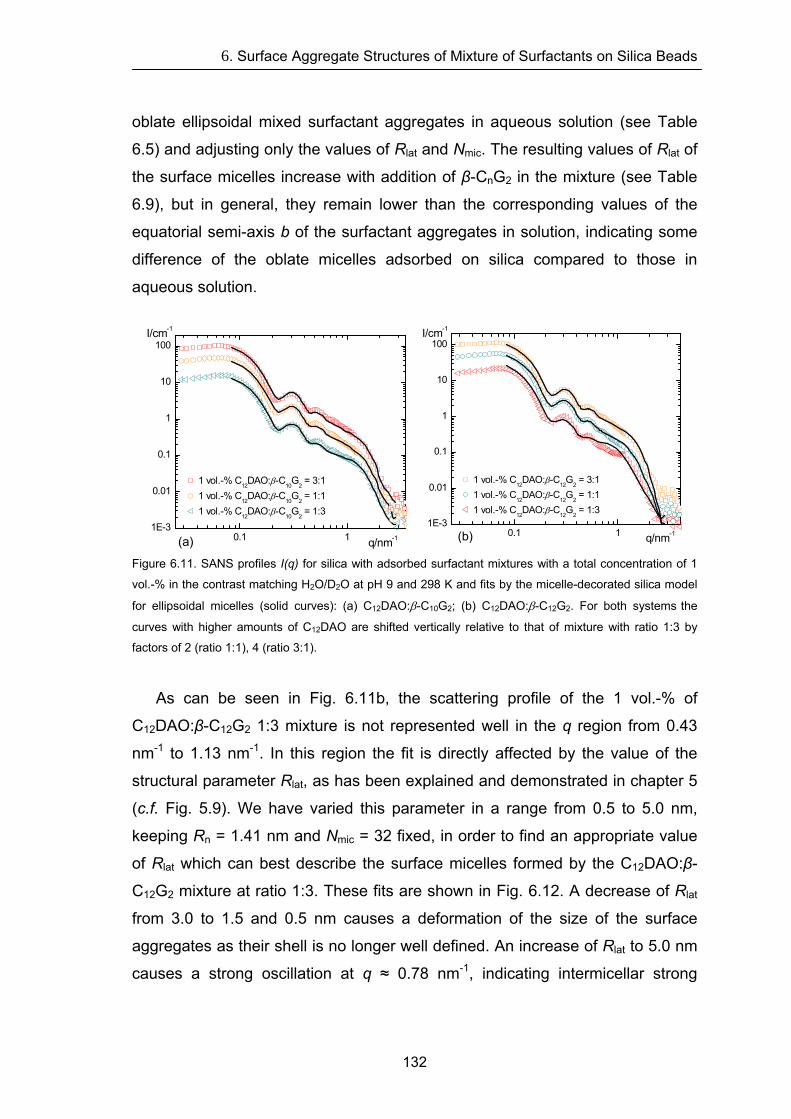
6. Surface Aggregate Structures of Mixture of Surfactants on Silica Beads
132
oblate ellipsoidal mixed surfactant aggregates in aqueous solution (see Table
6.5) and adjusting only the values of Rlat and Nmic. The resulting values of Rlat of
the surface micelles increase with addition of β-CnG2 in the mixture (see Table
6.9), but in general, they remain lower than the corresponding values of the
equatorial semi-axis b of the surfactant aggregates in solution, indicating some
difference of the oblate micelles adsorbed on silica compared to those in
aqueous solution.
0.1 11E-3
0
1
1
10
100
.01
0.
q/nm-1(a)
I/cm-1
1 vol.-% C12
DAO:β-C10
G2 = 3:1
1 vol.-% C12
DAO:β-C10
G2 = 1:1
1 vol.-% C12
DAO:β-C10
G2 = 1:3
0.1 11E-3
0.01
0.1
1
10
100
(b) q/nm-1
1 vol.-% C12DAO:β-C12G2 = 3:1 1 vol.-% C
12DAO:β-C
12G
2 = 1:1
1 vol.-% C12DAO:β-C12G2 = 1:3
I/cm-1
Figure 6.11. SANS profiles I(q) for silica with adsorbed surfactant mixtures with a total concentration of 1
vol.-% in the contrast matching H2O/D2O at pH 9 and 298 K and fits by the micelle-decorated silica model
for ellipsoidal micelles (solid curves): (a) C12DAO:β-C10G2; (b) C12DAO:β-C12G2. For both systems the
curves with higher amounts of C12DAO are shifted vertically relative to that of mixture with ratio 1:3 by
factors of 2 (ratio 1:1), 4 (ratio 3:1).
As can be seen in Fig. 6.11b, the scattering profile of the 1 vol.-% of
C12DAO:β-C12G2 1:3 mixture is not represented well in the q region from 0.43
nm-1 to 1.13 nm-1. In this region the fit is directly affected by the value of the
structural parameter Rlat, as has been explained and demonstrated in chapter 5
(c.f. Fig. 5.9). We have varied this parameter in a range from 0.5 to 5.0 nm,
keeping Rn = 1.41 nm and Nmic = 32 fixed, in order to find an appropriate value
of Rlat which can best describe the surface micelles formed by the C12DAO:β-
C12G2 mixture at ratio 1:3. These fits are shown in Fig. 6.12. A decrease of Rlat
from 3.0 to 1.5 and 0.5 nm causes a deformation of the size of the surface
aggregates as their shell is no longer well defined. An increase of Rlat to 5.0 nm
causes a strong oscillation at q ≈ 0.78 nm-1, indicating intermicellar strong
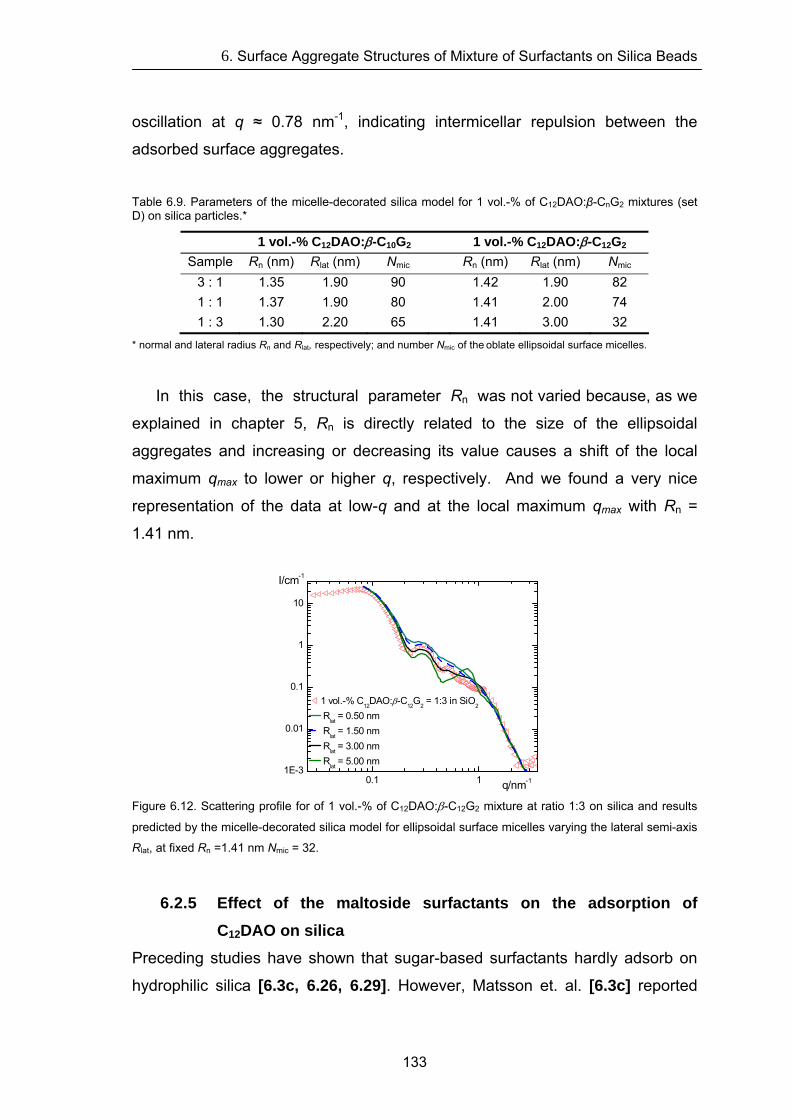
6. Surface Aggregate Structures of Mixture of Surfactants on Silica Beads
oscillation at q ≈ 0.78 nm-1, indicating intermicellar repulsion between the
adsorbed surface aggregates.
Table 6.9. Parameters of the micelle-decorated silica model for 1 vol.-% of C12DAO:β-CnG2 mixtures (set D) on silica particles.*
1 vol.-% C12DAO:β-C10G2 1 vol.-% C12DAO:β-C12G2 Sample Rn (nm) Rlat (nm) Nmic Rn (nm) Rlat (nm) Nmic
3 : 1 1.35 1.90 90 1.42 1.90 82 1 : 1 1.37 1.90 80 1.41 2.00 74 1 : 3 1.30 2.20 65 1.41 3.00 32
* normal and lateral radius Rn and Rlat, respectively; and number Nmic of the oblate ellipsoidal surface micelles.
In this case, the structural parameter Rn was not varied because, as we
explained in chapter 5, Rn is directly related to the size of the ellipsoidal
aggregates and increasing or decreasing its value causes a shift of the local
maximum qmax to lower or higher q, respectively. And we found a very nice
representation of the data at low-q and at the local maximum qmax with Rn =
1.41 nm.
0.11E-3
0.01
0.1
1
10
1
1 vol.-% C12DAO:β-C12G2 = 1:3 in SiO2
Rlat = 0.50 nm R
lat = 1.50 nm
Rlat = 3.00 nm Rlat = 5.00 nm
I/cm-1
q/nm-1
Figure 6.12. Scattering profile for of 1 vol.-% of C12DAO:β-C12G2 mixture at ratio 1:3 on silica and results
predicted by the micelle-decorated silica model for ellipsoidal surface micelles varying the lateral semi-axis
Rlat, at fixed Rn =1.41 nm Nmic = 32.
6.2.5 Effect of the maltoside surfactants on the adsorption of
C12DAO on silica Preceding studies have shown that sugar-based surfactants hardly adsorb on
hydrophilic silica [6.3c, 6.26, 6.29]. However, Matsson et. al. [6.3c] reported
133
6. Surface Aggregate Structures of Mixture of Surfactants on Silica Beads
that adsorption of β-CnGm surfactants on silica can be promoted by addition of a
second surfactant, leading to a partial or complete coating of the silica. Our
SANS study confirms that C12DAO can induce adsorption of β-CnG2 on silica
through the formation of mixed surface micelles of similar structure and similar
or smaller dimensions as those found in aqueous solution. As is seen in Fig.
6.10, the scattering profile of silica sol with C12DAO at a surface concentration
of ½Γmx is not modified qualitatively by addition of β-CnG2, which may suggest
that the maltoside surfactant is not incorporated into the adsorbed surface
micelle of C12DAO and remains in bulk. However, the quantitative structural
information extracted from the fits indicates that additions of small amounts of β-
CnG2 to the silica sol with ½Γmx of C12DAO causes an increase of the number of
adsorbed ellipsoidal surface micelles by co-adsorption of β-CnG2 into the
adsorbed surface micelles of C12DAO, presumably due to through hydrophobic
interactions. Presumably the integration of β-CnG2 in the ellipsoidal surface
aggregates of C12DAO make these surface micelles more stable by reducing
the steric repulsion between the head groups of the amino oxide surfactant thus
causing a decrease of their effective head group size. However, with increasing
the amount of β-CnG2 in the mixture the lateral radius Rlat of the surface micelles
increases. This behaviour is more pronounced in the mixtures with β-C12G2 than
with β-C10G2, and the number of mixed surface micelles decreases drastically
when the amount of β-CnG2 is three times that of C12DAO. Tentatively, we
explain this trend by decreasing strength of adsorption of the surface micelles
when the number of maltoside head group is gradually increased, so that mixed
micelles in solution become more favourable than mixed surface micelles.
Presumably the reason for this behavior is the stronger hydrophilicily of the
maltoside head group compared to the amino oxide group [6.32], so that mixed
micelles with high mass ratio of β-CnG2, prefer the hydrogen bond formation to
water molecules rather than to the silica surface.
In the case of the mixture of 1 vol.-% of C12DAO:β-C12G2 1:3 in silica sol, it
seems that the surface aggregates have a different morphology than at lower
mass ratios of β-C12G2. This change is hinted by the behaviour in the q range
from 0.43 nm-1 to 1.13 nm-1 of the scattering profile, see Fig. 6.11), where we
134
6. Surface Aggregate Structures of Mixture of Surfactants on Silica Beads
could not get a good representation of the data with the oblate ellipsoids surface
micelles model. It has also been demonstrated in the previous section that the
problem to model this kind of morphology is not related to lateral interactions
between the surface micelles. We think that at this high concentration of the
surfactant mixture (1 vol.-%) and high contents of β-C12G2 (mass ratio 1:3),
larger surface micelles are formed on the silica nanoparticles, possibly in form
of cylindrical aggregates. We conjecture that cylindrical surface aggregates are
formed, because mixed cylindrical micelles instead of oblate ellipsoidal micelles
are formed in aqueous solutions (see Section 6.2.3.1 and 6.2.3.2). However,
the driving force for this morphological transition from ellipsoidal to cylindrical
shape of the surface aggregates at that composition is not clear. Further work
such as rheological investigations are needed to clarify the reason of the growth
of these surface micelles when the content of β-C12G2 in the mixtures increases
at an overall surfactant concentration of 1 vol.-% References of Chapter 6 [6.1] (a) Nagarajan, R. Langmuir 1985, 1, 331-341. (b) Hall, D. G.; Huddleston, R. W. Colloids
Surf. 1985, 13, 209-219. (c) Shiloach, A.; Blankschtein, D. Langmuir, 1998, 14, 7166-7182. (d)
Bergström, M.; Eriksson, J. C. Langmuir, 2000, 16, 7173-7181.
[6.2] (a) Zhang, L.; Somasundaran P. J. Colloid Interface Sci., 2006, 302, 20–24. (b) Zhang, L.;
Zhang, R.; Somasundaran P. J. Colloid Interface Sci., 2006, 302, 25–31.
[6.3] (a) Harwell, J. H.; Roberts, B. L.; Scamehorn, J. F. Colloids Surf. A, 1988, 32, 1-17. (b)
Somasundaran, P.; Fu, E.; Xu, Q. Langmuir 1992, 8, 1065-1069. (c) Matsson, M. K.; Kronberg,
B.; Claesson, P. M. Langmuir 2005, 21, 2766-2772.
[6.4] Lu, J. R.; Thomas, R. K.; Penfold, J. Adv. Colloid Interface Sci. 2000, 84, 143-304.
[6.5] Bain, C. D.; Davies, P. B.; Ward, R. N. Langmuir 1994, 10, 2060-2063.
[6.6] (a) McKenna, C. E.; Knock, M. M.; Bain, C.D. Langmuir 2000, 16, 5853-5855. (b) Watry,
M.R.; Brown, M.G.; Richmond, G.L. Appl. Spectrosc. 2001, 55, 321A-340A.
[6.7] (a) Manne, S.; Gaub, H.E. Science, 1995, 270, 1480-1482. (b) Patrick, H. N.; Warr, G. S.;
Manne, S.; Aksay, I. A. Langmuir 1997, 13, 4349-4356. (c) Ducker, W. A.; Wanless, E. J.
Langmuir 1999, 15, 160-168.
[6.8] (a) Penfold, J.; Staples, E.J.; Tucker, I.; Thompson, L.J. Langmuir 1997, 13, 6638-6643.
(b) Penfold, J.; Tucker, I.; Thomas, R. K. Langmuir 2005, 21, 6330-6336.
[6.9] Brinck, J.; Tiberg, F. Langmuir 1996, 12, 5042-5047.
135
6. Surface Aggregate Structures of Mixture of Surfactants on Silica Beads
[6.10] Stöber, W.; Fink, A.; Bohn, E. J. Colloid Interface Sci. 1968, 26, 62-69.
[6.11] Phillips, J. N. Trans. Faraday Soc. 1955, 51, 561-569.
[6.12] Rosen, M. J.; Sulthana, S. B. J. Colloid Interface Sci. 2001, 239, 528–534.
[6.13] (a) Rathman, J. F.; Christian, S. D. Langmuir 1990, 6, 391-395. (b) Maeda, H.; Muroi, S.;
Ishii, M.; Kakehashia, R.; Kaimoto, H.; Nakahara, T.; Motomura, K. J. Colloid Interface Sci.
1995, 175, 497–505.
[6.14] Hines, J. D.; Thomas, R. K.; Garrett, P. R.; Rennie, G. K.; Penfold, J. J. Phys. Chem. B
1997, 101, 9215-9223.
[6.15] Porte, G. in Neutrons, X-rays and Light: Scattering Methods Applied to Soft Condensed
Matter, 2002, 1st edn. ed. P. Lindner and Th. Zemb, Elsevier, Boston, chap. 12 pp. 299-315.
[6.16] Lipfert, J.; Columbus, L.; Chu, V. B.; Lesley, S. A.; Doniach S. J. Phys. Chem. B 2007,
111, 12427-12438.
[6.17] Thiyagarajan, P.; Tiede, D. M. J. Phys. Chem., 1994, 98, 10343-10351.
[6.18] (a) Herrmann K. W. J. Phys. Chem. 1962, 66, 295-300. (b) Garamus, V.; Kameyama,
K.; Kakehashi, Rie; Maeda, H. Colloid & Polymer Science 1999, 277, 868-874.
[6.19] (a) Cecutti, C.; Focher, B.; Perly, B.; Zemb, T. Langmuir 1991, 7, 2580-2585. (b) Dupuy,
C.; Auvray, X.; Petipas, C. Langmuir 1997, 13, 3965-3967. (c) Bäverbäck, P.; Oliveira, C. L. P.;
Garamus, V. M.; Vargas, I.; Claesson, P. M.; Pedersen, J. S. Langmuir 2009, 25, 7296-7303.
[6.20] Majhi, P. R.; Dubin, P. L.; Feng, X.; Guo, X.; Leermakers, F. A. M.; Tribet C. J. Phys.
Chem. B, 2004, 108, 5980-5988
[6.21] Bäverbäck, P. Ph.D Thesis 2009, chap. 4, pp. 39-58.
[6.22] Kohlbrecher, J., User Guide for the SASfit software pachage,Paul Scherrer Institute,
Laboratory for neutron scattering, 2009 Edition. Available as pdf (SASfit.pdf) from
http://sans.web.psi.ch/SANSSoft/sasfit.pdf
[6.23] Garamus, V. M.; Pedersen, J. S.; Maeda, H.; Schurtenberger, P. Langmuir, 2003, 19,
3656–3665.
[6.24] Lugo, D.; Oberdisse, J.; Lapp, A.; Findenegg, G.H. J. Phys. Chem. B 2010, accepted.
[6.25] Tanford, C. J. Phys. Chem. 1972, 76, 3020-3024.
[6.26] Zhang, L.; Somasundaran, P.; Maltesh, C. J. Colloid Interface Sci., 1997, 191, 202-208.
[6.27] (a) Cummins, P.G.; Staples, E.; Penfold, J. J. Phys. Chem. 1990, 94, 3740-3745. (b)
Cummins, P.G.; Staples, E.; Penfold, J. J. Phys. Chem. 1991, 95, 5902-5905. (c) Cummins,
P.G.; Penfold, J.; Staples, E. J. Phys. Chem. 1992, 96, 8092–8094.
[6.28] Pusey, P.N. in Neutrons, X-rays and Light: Scattering Methods applied to Soft
Condensed Matter 2000, ed. B.J. Gabrys, Gordon and Breach Science Publishers, Netherlands,
1st ed., chap. 4, pp. 77-102.
[6.29] Lugo, D.; Oberdisse, J.; Karg, M.; Schweins, R.; Findenegg, G.H. Soft Matter 2009, 5,
2928–2936.
136

6. Surface Aggregate Structures of Mixture of Surfactants on Silica Beads
137
[6.30] Matsson, M.K.; Kronberg, B.; Claesson, P.M. Langmuir, 2004, 20, 4051-4058.
[6.31] (a) Despert, G.; Oberdisse, J. Langmuir 2003, 19, 7604-7610. (b) Oberdisse, J. Phys.
Chem. Chem. Phys. 2004, 6, 1557-1561.
[6.32] Zana, R. J. Phys. Chem. B 1999, 103, 9117-9125.
7 Summary and Outlook
The main motivation of this work was find out if the replacement of a flat
surface by a highly curved surface has an effect on the adsorption and on the
structure of the adsorbed surfactant layers. Such an effect seems likely when
the curvature of the solid surface comes close to the spontaneous curvature of
surfactant films. An understanding of the structure of surfactant layers on this
kind of surface, i.e. colloidal particles, is of vital importance for the fabrication of
nano-structured functional surfaces. Specifically, adsorbed surfactant films play
an important role as a protection layer for the steric stabilization of colloidal
dispersions for the preparation of paints, printing inks, agrochemicals, etc. A
further point of interest in this work was to gain a better understanding of the
effect of surfactant on the stability of the colloidal dispersion in a surfactant
deficient regime, when the amount of surfactant is not enough to attain
saturation adsorption.
For this reason, in the present work we have studied the adsorption of three
different classes of nonionic surfactants on silica nanoparticles suspended in
aqueous solutions (silica sols). The surfactants studied were sugar-based
surfactants (CnGm), specifically decyl-β-maltoside (β-C10G2) and dodecyl-β-
maltoside (β-C12G2); the alkylethoxylate surfactant pentaethylene glycol
monododecyl ether (C12E5); and the amine oxide surfactant
dodecyldimethylamine N-oxide (C12DAO), an amphoteric surfactant that
behaves like a cationic surfactant at low pH and as a nonionic surfactant at pH
above 7. The choice of the two first classes of surfactants was motivated mainly
by their opposite adsorption behavior on hydrophilic silica. The choice of the
third one was based on its zwitterionic nature. Silica nanoparticles were used in
view of their widespread industrial applications in different fields, such as
catalysis, electronics, health care, ceramics and so on. The studies were made
with the home-made silica instead of commercial Ludox in order to attain a
better control of the mean particle size, a lower polydispersity and a better
colloidal stability of the samples. Therefore, the silica nanoparticles were
synthesized by two variants of the Stöber synthesis. The preparation of
7. Summary and Outlook
nanoparticles of smaller size (diameter 16 to 28 nm) was made by particle
growth from Ludox SM-30 and Ludox HS-40 dispersions. The larger particles (~
40 nm) were prepared by the classical Stöber synthesis.
The study of the self-assembly structures of the nonionic surfactants on
colloidal silica was divided into three sections:
1. Surface aggregate structure of nonionic surfactants on small silica
nanoparticles.
2. Effect of nanoparticle size on the morphology of adsorbed surfactant
layers.
3. Aggregate structure of mixtures of sugar-based surfactants with an
amphoteric surfactant in the aqueous phase and on silica beads.
The structural characterization and analysis of the adsorbed surfactant layer
was made by using small-angle neutron scattering (SANS), which allows to
study structural details at a length-scale of 1 nanometer and below without
perturbing the sample.
1. Surface aggregate structure of nonionic surfactants on small silica
nanoparticles
The structure of the adsorbed layer of nonionic surfactants on the surface of
silica particles of ca. 16 nm of diameter was studied by a combination of
different methods. SANS scattering profiles from dilute dispersions of this
silica in contrast-matching H2O/D2O solvent mixture containing a
concentration of surfactant two orders of magnitude higher than the CMC
show that the maltoside surfactants β-C10G2 amd β-C12G2 interacts very
weakly with the silica particles and the scattering profiles resemble those of
free micelles which have an oblate ellipsoidal shape. This result conforms
with earlier findings of low adsorption levels of sugar surfactants at
macroscopic silica surfaces [7.1, 7.2], and shows that the adsorption of these
surfactants is not enhanced by strong surface curvature. On the other hand,
the alkyl ethoxylate surfactant C12E5 exhibits strong cooperative adsorption
onto the silica particles with a surface concentration plateau value Γmx similar
139
7. Summary and Outlook
to that on flat silica surfaces. The SANS profiles from the dilute dispersion in
contrast-matching H2O/D2O exhibit a local maximum at intermediate q
values, which is a signature of an adsorbed layer on the surface of the
particles and becomes more pronounced with increasing surface
concentration of the surfactant. A core-shell model corresponding to a
uniform surfactant layer at the surface of the silica particles accounts well for
the increase in film thickness with increasing surface concentration, but this
model underestimates the surface area of the adsorbed surfactant as
extracted from the high-q regime of the scattering spectra. The SANS
spectra can be represented very well by the model of micelle-decorated silica
beads on the assumption that C12E5 is adsorbed as individual surface
aggregates of spherical geometry. This result supports a report of the
literature in which oblate ellipsoidal micelles were found for Triton X-100 on
silica nanoparticles [7.3]. The present study shows that an increase of the
surface concentration of the surfactant leads to an increasing number of
surface aggregates, up to a close packing of spherical surface micelles. The
preference of such small surface aggregates is attributed to the high surface
curvature of the silica nanoparticles which prevents an effective packing of
the hydrophobic chains in a bilayer configuration.
2. Effect of nanoparticle size on the morphology of adsorbed surfactant
layers
SANS has been used to study the shape of surface aggregates of C12DAO
formed at the surface of spherical silica nanoparticles with diameters from 16 to
42 nm. In agreement with the results for C12E5 it was found that C12DAO does
not form a laterally uniform adsorbed layer on the surface of the silica
nanoparticles, but rather they form small surface aggregates. The study
presented evidence for a morphological transition of the surface micelles as a
function of the particle size of the silica nanoparticles. Spherical surface
aggregates are formed on particles of 16 nm, but oblate ellipsoidal surface
micelles on silica particles of 27 and 42 nm diameter. As in the case of C12E5
the formation of spherical surface micelles of C12DAO on the surface of the
140
7. Summary and Outlook
smallest silica particles is attributed to the high surface curvature of the
nanoparticles which prevents an effective packing of the molecules in a bilayer
structure. As the surface curvature of the silica particles decreases with
increasing particle size, surface aggregates of lower mean curvature, such as
oblate ellipsoids, are favored. The dimensions of the ellipsoidal surface
aggregates are similar to those of C12DAO micelles in the aqueous solutions.
From a comparison of the present results with those of the preceding studies it
was concluded that the shape of the surface aggregates (spherical or
ellipsoidal) is not determined by the size of surfactants head group. However,
for spherical surface micelles it appears that the nature of the head group can
have a strong influence on the maximum number of surface aggregates per
particle. Specifically, the maximal number of surface micelles of C12DAO is
much smaller than for C12E5 at the same silica, presumably due to its less
hydrophilic character. Further systematic work is needed to clarify the role of
surfactant head group – surface interactions on the type of surface aggregates
and the maximum number of aggregates on the silica particles.
Work presented in Sections 1 and 2 has presented that the micelle-
decorated silica model provides a reliable and versatile basis for determining
size and shape and the number of surface aggregates of amphiphiles on
spherical nanoparticles from SANS scattering data. The results obtained on the
basis of this form-factor model are consistent with those derived by a simple
geometric analysis of the Guinier and Porod regimes of the SANS data.
3. Aggregate structure of mixtures of sugar-based surfactants with an
amphoteric surfactant in the aqueous phase and on silica beads
In this section the binary surfactant systems of C12DAO:β-C10G2 and C12DAO:β-
C12G2 have been studied in aqueous solutions in absence and presence of
silica nanoparticles with diameters of 27 nm. For both surfactant systems
synergistic effects were found in mixed adsorbed monolayers at the air/liquid
and in mixed micelles in the aqueous phase. In agreement with the two
previous sections it was found that the surfactant mixtures do not cover the
silica nanoparticles with a laterally uniform bilayer, but rather form discrete and
141
7. Summary and Outlook
142
mixed surface micelles with similar dimension and structure to those formed in
the aqueous solution, i.e. oblate ellipsoids with a minor semi-axis Rn and a
major semi-axis Rlat. Co-adsorption of the maltoside surfactant is presumably
induced by the adsorbed C12DAO, which provides hydrophobic anchoring sites
for maltoside surfactant. Co-adsorption of the maltoside surfactants is reflected
by the increase of the number of surface micelles when small amounts of this
surfactant are added. However, further addition of the maltoside surfactant
causes a drastical decrease of the number of surface aggregates, which is
interpreted as a desorption of C12DAO from the surface and its integration into
the micelles of the maltoside in the aqueous medium. Such process is expected
if the mixed micelles in the bulk solution are energetically more favourable than
the mixed surface micelles. The observed synergistic effect in the formation of
the mixed micelles in solution is consistent with this interpretation.
Another interesting finding of this study was the existence of morphological
transition from ellipsoidal to larger surface micelles at high content of the
maltoside surfactant in the mixtures with the same hydrocarbon groups when
the total concentration of the mixture is higher than the CMC of the surfactant
mixture. The reason of this morphological transition of the surface aggregates
could not be fully resolved in the present work. Therefore, further investigation
of this mixture in silica sol with high content of the maltoside surfactant and at
concentrations higher than the CMC of the mixture is needed to discover the
details of this process.
References of Chapter 7 [7.1] (a) Király, Z.; Börner, R.H.K.; Findenegg G.H. Langmuir 1997, 13, 3308-3315. (b) Király,
Z.; Findenegg G.H. Langmuir, 2000, 16, 8842-8849.
[7.2] Zhang, L.; Somasundaran, P.; Maltesh, C. J. Colloid Interface Sci., 1997, 191, 202-208.
[7.3] Despert, G.; Oberdisse, J. Langmuir 2003, 19, 7604-7610.
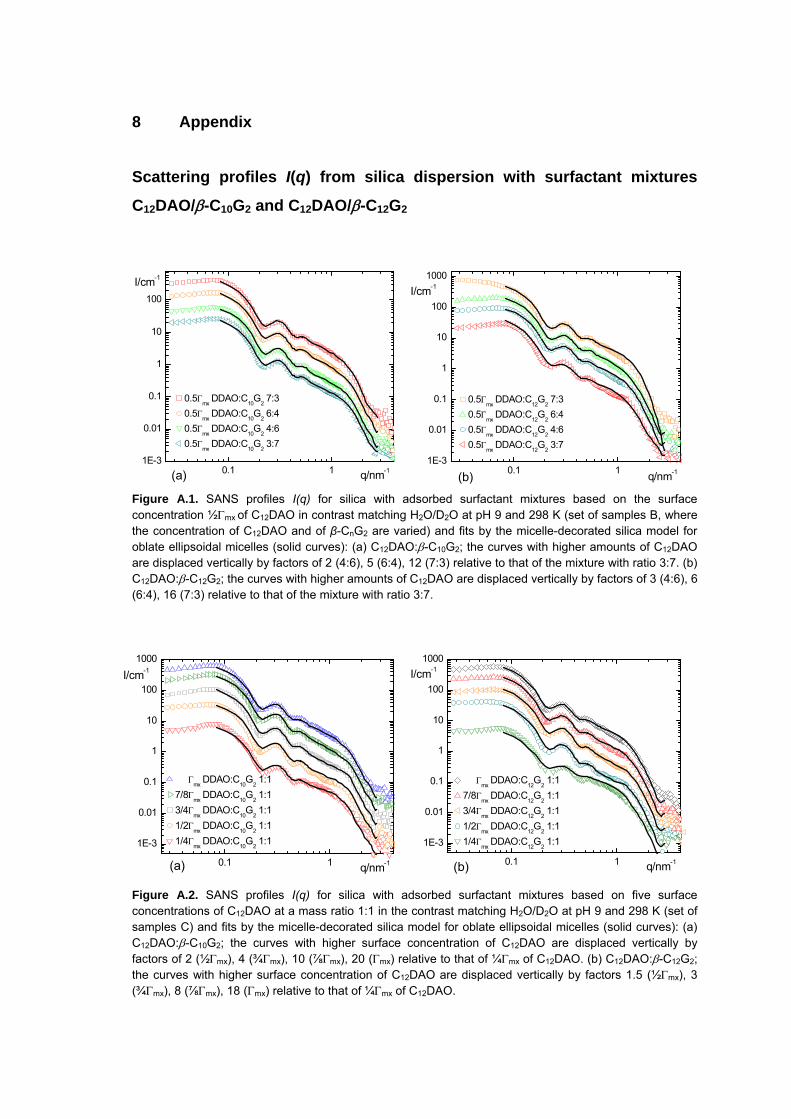
8 Appendix
Scattering profiles I(q) from silica dispersion with surfactant mixtures
C12DAO/β-C10G2 and C12DAO/β-C12G2
0.1 11E-3
0.01
0.1
1
10
100
0.5Γmx DDAO:C10G2 7:3 0.5Γmx DDAO:C10G2 6:4 0.5Γ
mx DDAO:C
10G
2 4:6
0.5Γmx
DDAO:C10
G2 3:7
(a)
cm-1
q/nm-1 0.1 11E-3
0.01
0.1
1
10
100
1000I/
0.5Γmx
DDAO:C12
G2 7:3
0.5Γmx
DDAO:C12
G2 6:4
0.5Γmx
DDAO:C12
G2 4:6
0.5Γmx DDAO:C12G2 3:7
(b) q/nm-1
I/cm-1
Figure A.1. SANS profiles I(q) for silica with adsorbed surfactant mixtures based on the surface concentration ½Γmx of C12DAO in contrast matching H2O/D2O at pH 9 and 298 K (set of samples B, where the concentration of C12DAO and of β-CnG2 are varied) and fits by the micelle-decorated silica model for oblate ellipsoidal micelles (solid curves): (a) C12DAO:β-C10G2; the curves with higher amounts of C12DAO are displaced vertically by factors of 2 (4:6), 5 (6:4), 12 (7:3) relative to that of the mixture with ratio 3:7. (b) C12DAO:β-C12G2; the curves with higher amounts of C12DAO are displaced vertically by factors of 3 (4:6), 6 (6:4), 16 (7:3) relative to that of the mixture with ratio 3:7.
0.1 1
1E-3
0.01
0.1
1
10
100
1000
Γmx
DDAO:C10
G2 1:1
7/8Γmx
DDAO:C10
G2 1:1
3/4Γmx
DDAO:C10
G2 1:1
1/2Γmx
DDAO:C10
G2 1:1
1/4Γmx
DDAO:C10
G2 1:1
(a)
I/c
m-1
q/nm-1 0.1 1
1E-3
0.01
0.1
1
10
100
1000
Γmx
DDAO:C12
G2 1:1
7/8Γmx
DDAO:C12
G2 1:1
3/4Γmx
DDAO:C12
G2 1:1
1/2Γmx
DDAO:C12
G2 1:1
1/4Γmx
DDAO:C12
G2 1:1
(b) q/nm-1
I/cm-1
Figure A.2. SANS profiles I(q) for silica with adsorbed surfactant mixtures based on five surface concentrations of C12DAO at a mass ratio 1:1 in the contrast matching H2O/D2O at pH 9 and 298 K (set of samples C) and fits by the micelle-decorated silica model for oblate ellipsoidal micelles (solid curves): (a) C12DAO:β-C10G2; the curves with higher surface concentration of C12DAO are displaced vertically by factors of 2 (½Γmx), 4 (¾Γmx), 10 (⅞Γmx), 20 (Γmx) relative to that of ¼Γmx of C12DAO. (b) C12DAO:β-C12G2; the curves with higher surface concentration of C12DAO are displaced vertically by factors 1.5 (½Γmx), 3 (¾Γmx), 8 (⅞Γmx), 18 (Γmx) relative to that of ¼Γmx of C12DAO.
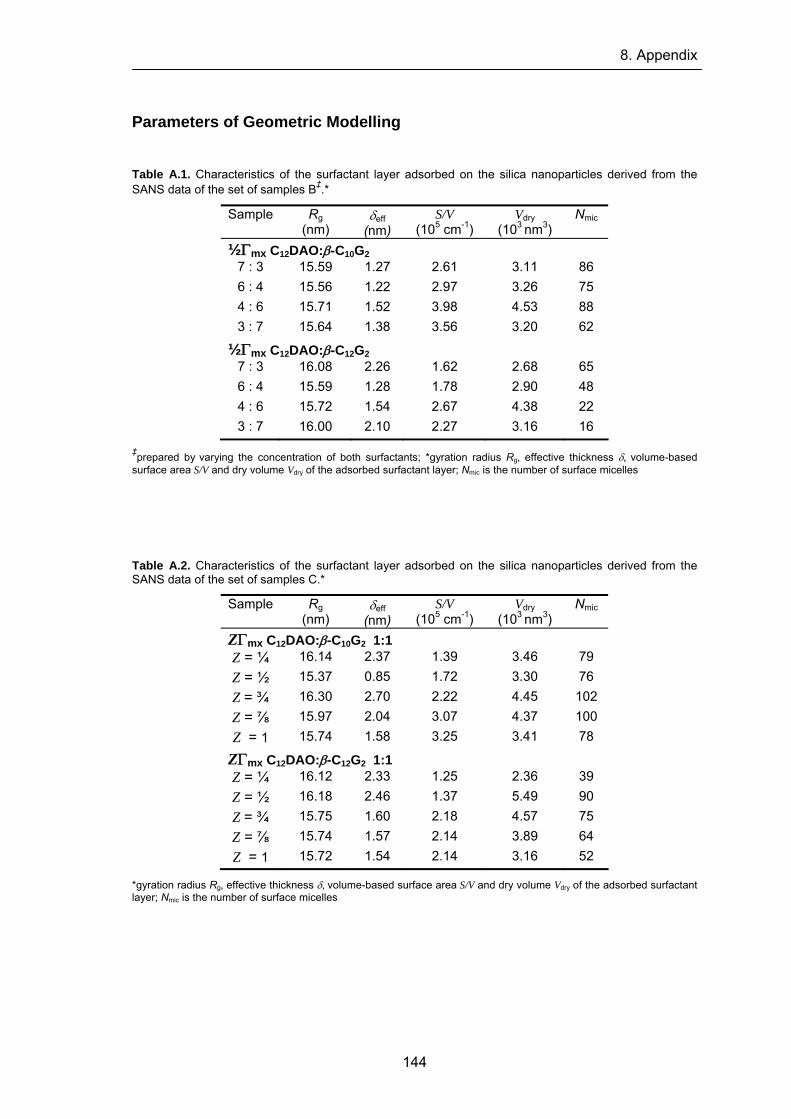
8. Appendix
Parameters of Geometric Modelling
Table A.1. Characteristics of the surfactant layer adsorbed on the silica nanoparticles derived from the SANS data of the set of samples B‡.*
Sample Rg (nm)
δeff (nm)
S/V (105 cm-1)
Vdry (103 nm3)
Nmic
½Γmx C12DAO:β-C10G2 7 : 3 15.59 1.27 2.61 3.11 86 6 : 4 15.56 1.22 2.97 3.26 75 4 : 6 15.71 1.52 3.98 4.53 88 3 : 7 15.64 1.38 3.56 3.20 62
½Γmx C12DAO:β-C12G2 7 : 3 16.08 2.26 1.62 2.68 65 6 : 4 15.59 1.28 1.78 2.90 48 4 : 6 15.72 1.54 2.67 4.38 22 3 : 7 16.00 2.10 2.27 3.16 16
‡prepared by varying the concentration of both surfactants; *gyration radius Rg, effective thickness δ, volume-based surface area S/V and dry volume Vdry of the adsorbed surfactant layer; Nmic is the number of surface micelles
Table A.2. Characteristics of the surfactant layer adsorbed on the silica nanoparticles derived from the SANS data of the set of samples C.*
Sample Rg (nm)
δeff (nm)
S/V (105 cm-1)
Vdry (103 nm3)
Nmic
ZΓmx C12DAO:β-C10G2 1:1 Z = ¼ 16.14 2.37 1.39 3.46 79 Z = ½ 15.37 0.85 1.72 3.30 76 Z = ¾ 16.30 2.70 2.22 4.45 102 Z = ⅞ 15.97 2.04 3.07 4.37 100 Z = 1 15.74 1.58 3.25 3.41 78
ZΓmx C12DAO:β-C12G2 1:1 Z = ¼ 16.12 2.33 1.25 2.36 39 Z = ½ 16.18 2.46 1.37 5.49 90 Z = ¾ 15.75 1.60 2.18 4.57 75 Z = ⅞ 15.74 1.57 2.14 3.89 64 Z = 1 15.72 1.54 2.14 3.16 52
*gyration radius Rg, effective thickness δ, volume-based surface area S/V and dry volume Vdry of the adsorbed surfactant layer; Nmic is the number of surface micelles
144
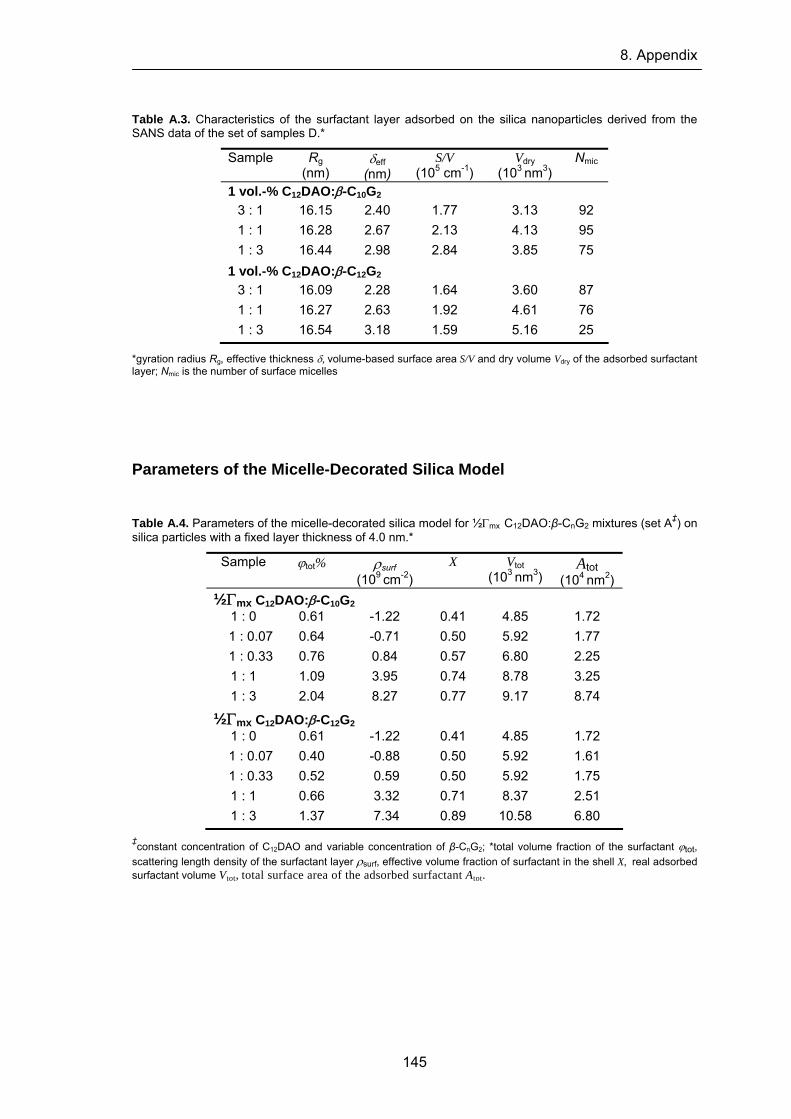
8. Appendix
Table A.3. Characteristics of the surfactant layer adsorbed on the silica nanoparticles derived from the SANS data of the set of samples D.*
Sample Rg (nm)
δeff (nm)
S/V (105 cm-1)
Vdry (103 nm3)
Nmic
1 vol.-% C12DAO:β-C10G2 3 : 1 16.15 2.40 1.77 3.13 92 1 : 1 16.28 2.67 2.13 4.13 95 1 : 3 16.44 2.98 2.84 3.85 75
1 vol.-% C12DAO:β-C12G2 3 : 1 16.09 2.28 1.64 3.60 87 1 : 1 16.27 2.63 1.92 4.61 76 1 : 3 16.54 3.18 1.59 5.16 25
*gyration radius Rg, effective thickness δ, volume-based surface area S/V and dry volume Vdry of the adsorbed surfactant layer; Nmic is the number of surface micelles
Parameters of the Micelle-Decorated Silica Model Table A.4. Parameters of the micelle-decorated silica model for ½Γmx C12DAO:β-CnG2 mixtures (set A‡) on silica particles with a fixed layer thickness of 4.0 nm.*
Sample ϕtot%
ρsurf (109 cm-2)
X
Vtot (103 nm3)
Atot (104 nm2)
½Γmx C12DAO:β-C10G2 1 : 0 0.61 -1.22 0.41 4.85 1.72
1 : 0.07 0.64 -0.71 0.50 5.92 1.77 1 : 0.33 0.76 0.84 0.57 6.80 2.25
1 : 1 1.09 3.95 0.74 8.78 3.25 1 : 3 2.04 8.27 0.77 9.17 8.74
½Γmx C12DAO:β-C12G2 1 : 0 0.61 -1.22 0.41 4.85 1.72
1 : 0.07 0.40 -0.88 0.50 5.92 1.61 1 : 0.33 0.52 0.59 0.50 5.92 1.75
1 : 1 0.66 3.32 0.71 8.37 2.51 1 : 3 1.37 7.34 0.89 10.58 6.80
‡constant concentration of C12DAO and variable concentration of β-CnG2; *total volume fraction of the surfactant ϕtot, scattering length density of the surfactant layer ρsurf, effective volume fraction of surfactant in the shell X, real adsorbed surfactant volume Vtot, total surface area of the adsorbed surfactant Atot.
145
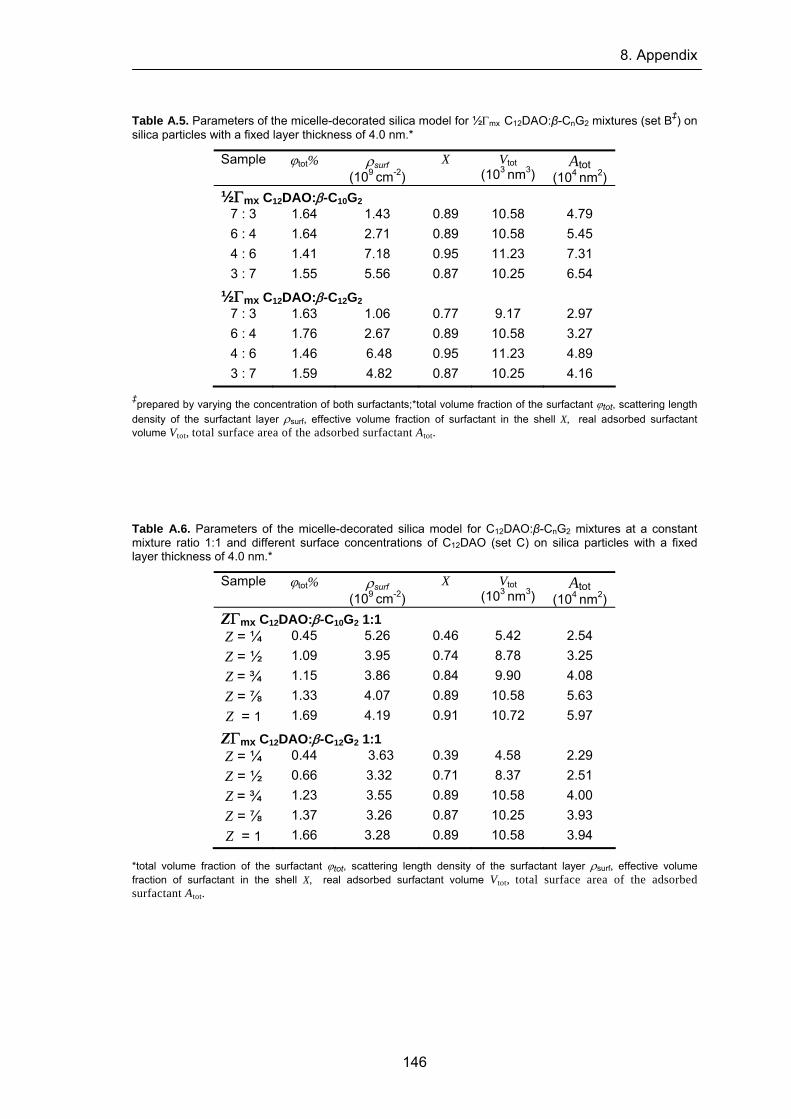
8. Appendix
Table A.5. Parameters of the micelle-decorated silica model for ½Γmx C12DAO:β-CnG2 mixtures (set B‡) on silica particles with a fixed layer thickness of 4.0 nm.*
Sample ϕtot%
ρsurf (109 cm-2)
X
Vtot (103 nm3)
Atot (104 nm2)
½Γmx C12DAO:β-C10G2 7 : 3 1.64 1.43 0.89 10.58 4.79 6 : 4 1.64 2.71 0.89 10.58 5.45 4 : 6 1.41 7.18 0.95 11.23 7.31 3 : 7 1.55 5.56 0.87 10.25 6.54
½Γmx C12DAO:β-C12G2 7 : 3 1.63 1.06 0.77 9.17 2.97 6 : 4 1.76 2.67 0.89 10.58 3.27 4 : 6 1.46 6.48 0.95 11.23 4.89 3 : 7 1.59 4.82 0.87 10.25 4.16
‡prepared by varying the concentration of both surfactants;*total volume fraction of the surfactant ϕtot, scattering length density of the surfactant layer ρsurf, effective volume fraction of surfactant in the shell X, real adsorbed surfactant volume Vtot, total surface area of the adsorbed surfactant Atot. Table A.6. Parameters of the micelle-decorated silica model for C12DAO:β-CnG2 mixtures at a constant mixture ratio 1:1 and different surface concentrations of C12DAO (set C) on silica particles with a fixed layer thickness of 4.0 nm.*
Sample ϕtot%
ρsurf (109 cm-2)
X
Vtot (103 nm3)
Atot (104 nm2)
ZΓmx C12DAO:β-C10G2 1:1 Z = ¼ 0.45 5.26 0.46 5.42 2.54 Z = ½ 1.09 3.95 0.74 8.78 3.25 Z = ¾ 1.15 3.86 0.84 9.90 4.08 Z = ⅞ 1.33 4.07 0.89 10.58 5.63 Z = 1 1.69 4.19 0.91 10.72 5.97
ZΓmx C12DAO:β-C12G2 1:1 Z = ¼ 0.44 3.63 0.39 4.58 2.29 Z = ½ 0.66 3.32 0.71 8.37 2.51 Z = ¾ 1.23 3.55 0.89 10.58 4.00 Z = ⅞ 1.37 3.26 0.87 10.25 3.93 Z = 1 1.66 3.28 0.89 10.58 3.94
*total volume fraction of the surfactant ϕtot, scattering length density of the surfactant layer ρsurf, effective volume fraction of surfactant in the shell X, real adsorbed surfactant volume Vtot, total surface area of the adsorbed surfactant Atot.
146
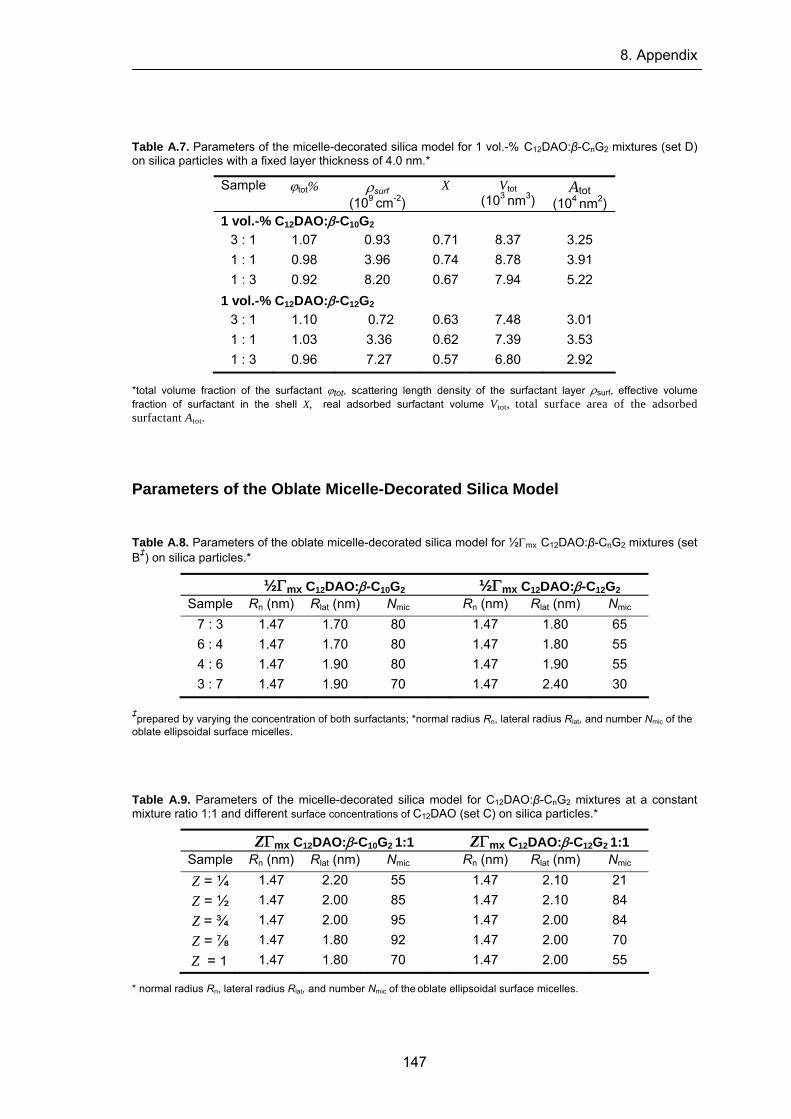
8. Appendix
147
Table A.7. Parameters of the micelle-decorated silica model for 1 vol.-% C12DAO:β-CnG2 mixtures (set D) on silica particles with a fixed layer thickness of 4.0 nm.*
Sample ϕtot%
ρsurf (109 cm-2)
X
Vtot (103 nm3)
Atot (104 nm2)
1 vol.-% C12DAO:β-C10G2 3 : 1 1.07 0.93 0.71 8.37 3.25 1 : 1 0.98 3.96 0.74 8.78 3.91 1 : 3 0.92 8.20 0.67 7.94 5.22
1 vol.-% C12DAO:β-C12G2 3 : 1 1.10 0.72 0.63 7.48 3.01 1 : 1 1.03 3.36 0.62 7.39 3.53 1 : 3 0.96 7.27 0.57 6.80 2.92
*total volume fraction of the surfactant ϕtot, scattering length density of the surfactant layer ρsurf, effective volume fraction of surfactant in the shell X, real adsorbed surfactant volume Vtot, total surface area of the adsorbed surfactant Atot. Parameters of the Oblate Micelle-Decorated Silica Model
Table A.8. Parameters of the oblate micelle-decorated silica model for ½Γmx C12DAO:β-CnG2 mixtures (set B‡) on silica particles.*
½Γmx C12DAO:β-C10G2 ½Γmx C12DAO:β-C12G2 Sample Rn (nm) Rlat (nm) Nmic Rn (nm) Rlat (nm) Nmic
7 : 3 1.47 1.70 80 1.47 1.80 65 6 : 4 1.47 1.70 80 1.47 1.80 55 4 : 6 1.47 1.90 80 1.47 1.90 55 3 : 7 1.47 1.90 70 1.47 2.40 30
‡prepared by varying the concentration of both surfactants; *normal radius Rn, lateral radius Rlat, and number Nmic of the
oblate ellipsoidal surface micelles. Table A.9. Parameters of the micelle-decorated silica model for C12DAO:β-CnG2 mixtures at a constant mixture ratio 1:1 and different surface concentrations of C12DAO (set C) on silica particles.*
ZΓmx C12DAO:β-C10G2 1:1 ZΓmx C12DAO:β-C12G2 1:1 Sample Rn (nm) Rlat (nm) Nmic Rn (nm) Rlat (nm) Nmic Z = ¼ 1.47 2.20 55 1.47 2.10 21 Z = ½ 1.47 2.00 85 1.47 2.10 84 Z = ¾ 1.47 2.00 95 1.47 2.00 84 Z = ⅞ 1.47 1.80 92 1.47 2.00 70
Z = 1 1.47 1.80 70 1.47 2.00 55
* normal radius Rn, lateral radius Rlat, and number Nmic of the oblate ellipsoidal surface micelles.