Embed Size (px)
Citation preview
7/27/2019 Adsorptive characterization of porous solids Error analysis guides the way.pdf
http://slidepdf.com/reader/full/adsorptive-characterization-of-porous-solids-error-analysis-guides-the-waypdf 1/17
Adsorptive characterization of porous solids: Error analysis guides
the way
Martijn F. De Lange a,b,⇑, Thijs J.H. Vlugt b, Jorge Gascon a, Freek Kapteijn a,⇑
a Catalysis Engineering, Chemical Engineering Department, Delft University of Technology, Julianalaan 136, 2628 BL Delft, The Netherlandsb Process & Energy Laboratory, Delft University of Technology, Leeghwaterstraat 39, 2628 CB Delft, The Netherlands
a r t i c l e i n f o
Article history:
Received 3 February 2014
Received in revised form 11 August 2014
Accepted 22 August 2014
Available online 3 September 2014
Keywords:
Surface area
Texture characterization
Brunauer–Emmet–Teller
Guidelines
Error analysis
a b s t r a c t
Adsorptive characterization using nitrogen at 77 K is one of the most widely used techniques to assess
textural properties of porous solids, such as pore volume, specific surface area and pore size distributions.
Based on a thorough error analysis the influence of experimental uncertainties on the accuracy of volu-
metric nitrogen adsorption isotherms and derived properties using the most popular methods is analyzed
in detail, comprising the pore volume and specific surface area determined using the method posed by
Brunauer, Emmet and Teller (BET) and the pore size distribution according to the method developed
by Barrett, Joyner and Halenda (BJH). Based on series of isotherms measurements with different sorbents
(MOFs, zeolite, activated carbon and alumina) and on examples from literature (MIL-101), the extensive
error analysis shows that these methods may yield highly inaccurate or even statistically irrelevant (BJH)
results. To improve the meaningfulness of derived properties and to minimize statistical uncertainties,
practical recommendations and guidelines are proposed for experimental operation variables and data
analysis.
2014 Elsevier Inc. All rights reserved.
1. Introduction
Adsorptive characterization using probe gas molecules is one of
the most widely used techniques to assess textural properties of
porous solids [1]. The most commonly used adsorbate for this pur-
pose is nitrogen, recommended by IUPAC for porous materials with
a specific surface area, S , larger than 5 m2 g1 [2,3]. From measur-
ing adsorption of N2 at its normal boiling point, information about
the total pore volume, specific surface area and pore size distribu-
tion can be derived [4]. This characteristic information is vital for
application of porous materials in heterogeneous catalysis and
adsorptive separation or storage, amongst others. In spite of the
importance of this technique, in general, little or no attention ispaid to the accuracy and relevance of the obtained quantitative
characteristics reported in literature.
In this work, uncertainties in nitrogen adsorption isotherms and
derived textural properties using the most commonly applied pro-
tocols are thoroughly analyzed. An indication of the uncertainty in
these quantities is a requirement to draw sound conclusions about
material(s) under investigation (and to avoid possible ‘statistical
errors’). Furthermore, the results obtained with these methods
are prone to misinterpretation. As it will be demonstrated, not
adhering to underlying assumptions, definitions and guidelines,
might lead to erroneous results and/or large uncertainties in
obtained values (‘human errors’). The detailed analysis is based
on five notably different materials. Model adsorbents have deliber-
ately not been chosen, but instead a selection of widely different
porous materials often reported in literature is made.
Two materials selected are metal–organic frameworks (MOFs),
porous crystalline materials that have gained increasing interest
in the past decade because of unprecedented topological richness
and comprising large specific surface areas and pore volumes.The combination of organic and inorganic building blocks offers
an almost infinite number of combinations, resulting in enormous
variation in pore size, shape, and structure. These materials have
found application in adsorptive separation [5–7], storage [8],
encapsulation [9] and catalysis [10]. MIL-101(Cr) [11] is among
the most famous structures, it contains both meso- and microp-
ores, and displays high stability and interesting properties [12–
17]. Second MOF is the fully microporous UiO-66 [18], which also
gained significant attention because of excellent stability and
interesting properties [19–22]. Sigma-1, a microporous zeolite
and member of the DDR structural topology, known for its high
separation performance in membrane and adsorptive processes,
http://dx.doi.org/10.1016/j.micromeso.2014.08.048
1387-1811/ 2014 Elsevier Inc. All rights reserved.
⇑ Corresponding authors. Address: Catalysis Engineering, Chemical Engineering
Department, Delft University of Technology, Julianalaan 136, 2628 BL Delft, The
Netherlands (M.F. De Lange).
E-mail addresses: [email protected] (M.F. De Lange), [email protected]
(F. Kapteijn).
Microporous and Mesoporous Materials 200 (2014) 199–215
Contents lists available at ScienceDirect
Microporous and Mesoporous Materials
j o u r n a l h o m e p a g e : w w w . e l s e v i e r . c o m / l o c a t e / m i c r o m e s o
7/27/2019 Adsorptive characterization of porous solids Error analysis guides the way.pdf
http://slidepdf.com/reader/full/adsorptive-characterization-of-porous-solids-error-analysis-guides-the-waypdf 2/17
incorporates aluminium into the framework, making the material
also suitable for catalysis [23–25]. c-Alumina is chosen as repre-
sentative for mesoporous metal-oxide supports, which are usedfrequently in heterogeneous catalysis [26–28]. From the group of
activated carbons, widely used for gas separation and storage
[29,30] and water purification [31], the commercially available
Norit RB2, frequently also used as reference carbon material, is
selected [32].
As the nitrogen adsorption isotherm forms the basis of the tex-
ture characterization, firstly the accuracy and reproducibility of the
adsorption isotherm measurements on these materials is assessed.
From these isotherms the pore volume is determined, simply
derived from the amount of N2 adsorbed inside the pores of the
material, and assuming that the density therein is that of liquid
nitrogen, as it is seen most often in literature [4].
The most popular method to determine the specific surface area
of a porous solid, despite profound criticism on underlyingassumptions [33], is the one put forward by Brunauer, Emmett
and Teller in 1938 (‘BET-method’) [34], a multi-layer extension of
Langmuir’s monolayer description of adsorption [35]. Although
the underlying assumptions of the BET-method suggest that this
method cannot be used for microporous materials, Rouquerol
et al. demonstrated its applicability, albeit that the physical mean-
ing of the resulting surface area is weaker than for mesoporous
materials [33]. Furthermore, Walton and Snurr have shown that
BET areas determined for microporous MOFs can correspond well
to geometrically accessible surface areas, as calculated by molecu-
lar simulations [36]. The method relies on curve-fitting the BET-
equation on a specific part of the adsorption isotherm. The absolute
value of the obtained surface area is, even for a material that
behaves very much BET-like, dependent on which part of the iso-
therm is used [37]. It will be shown that for the materials under
investigation the fitting strategy applied (number of data points,
part of the isotherm and fitting method) strongly influences the
value obtained for the BET area. Furthermore, not only the absolutevalue for BET area but also its uncertainty is investigated as func-
tion of fitting strategy.
The most commonly applied method to determine the pore size
distribution for mesopore containing materials is the one devel-
oped by Barrett, Joyner and Halenda in 1951 (‘BJH-method’) [38].
This method is based on the Kelvin equation and modified to
include multilayer adsorption. In this work it is investigated how
the uncertainty in a measured isothermpropagates in the pore size
distribution, something not published in prior literature.
List of symbols
Latin Acs cross-sectional area (m2)C dimensionless BET parameter (–)D diameter (m)
E adsorption energy (kJ mol1
)I intercept (g mlSTP
1 )K Langmuir equilibrium constant (bar1)M N 2 molar mass of nitrogen (g mol1)N number (–)N A Avogadro’s constant (mol1) p pressure (bar) p/ po relative pressure (–)q adsorbed amount (mlSTP g1)R universal gas constant (J mol1 K1)r radius (m)R 2 coefficient of determination (–)res residual (a)S specific surface area (m2 g1)s slope (g mlSTP
1 )
SS sum of squares (varies)T temperature (K)t thickness of adsorbed layer (m)t Student t -distribution (–)V volume (m3)V p specific pore volume (ml g1)V l liquid molar volume (m3 mol1)w weight (g)
Greekq density (g ml1)r standard deviation or uncertaintya,b
r 2 variancec
Subscript ads adsorbedBET Brunauer, Emmett and Teller (method)cell sample cellD.O.F. degree(s) of freedomK Kelvinm monolayerman manifoldnbp normal boiling point p Poreres residual(s)sample sample of (porous) materialsat at saturationSTP standard temperature and pressured
Superscript liq liquid phaseS Studentizedvap vapour phaseNotes: a Same units as the property it is related to;
b Standard deviation if based solely on measured values,else uncertainty;c Squared units of the property it is related to;d 273.15 K and 1 bar
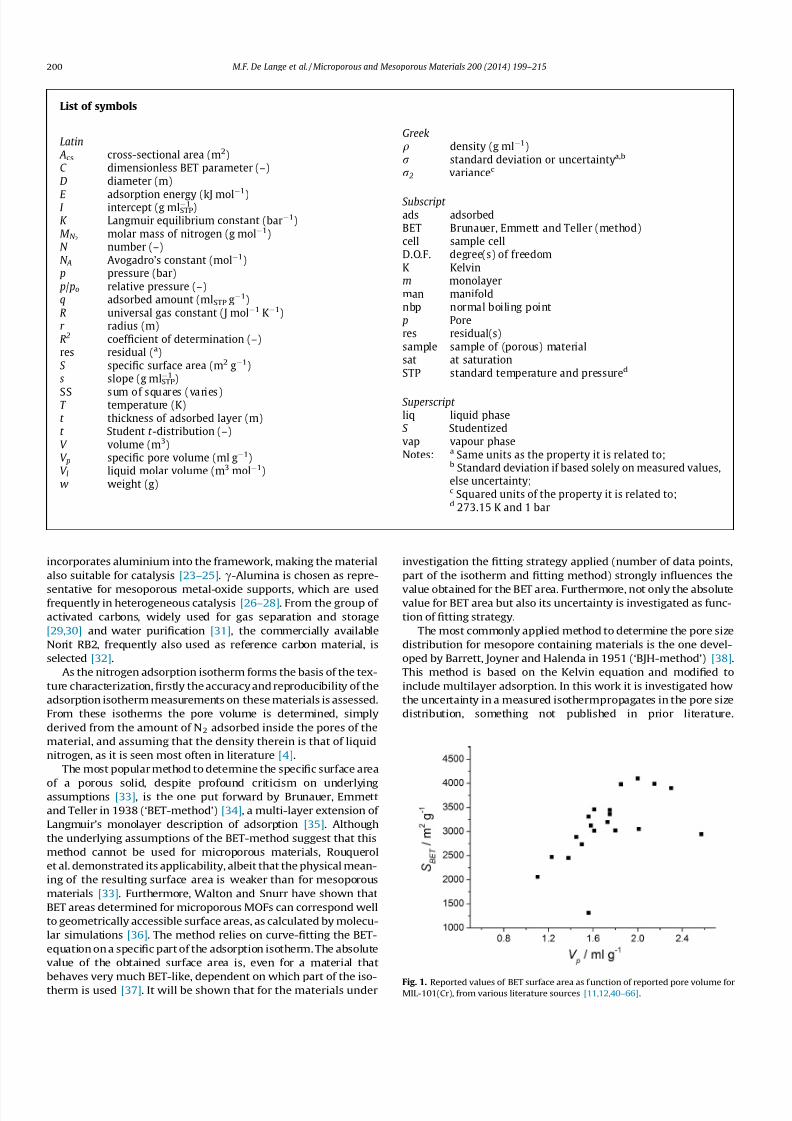
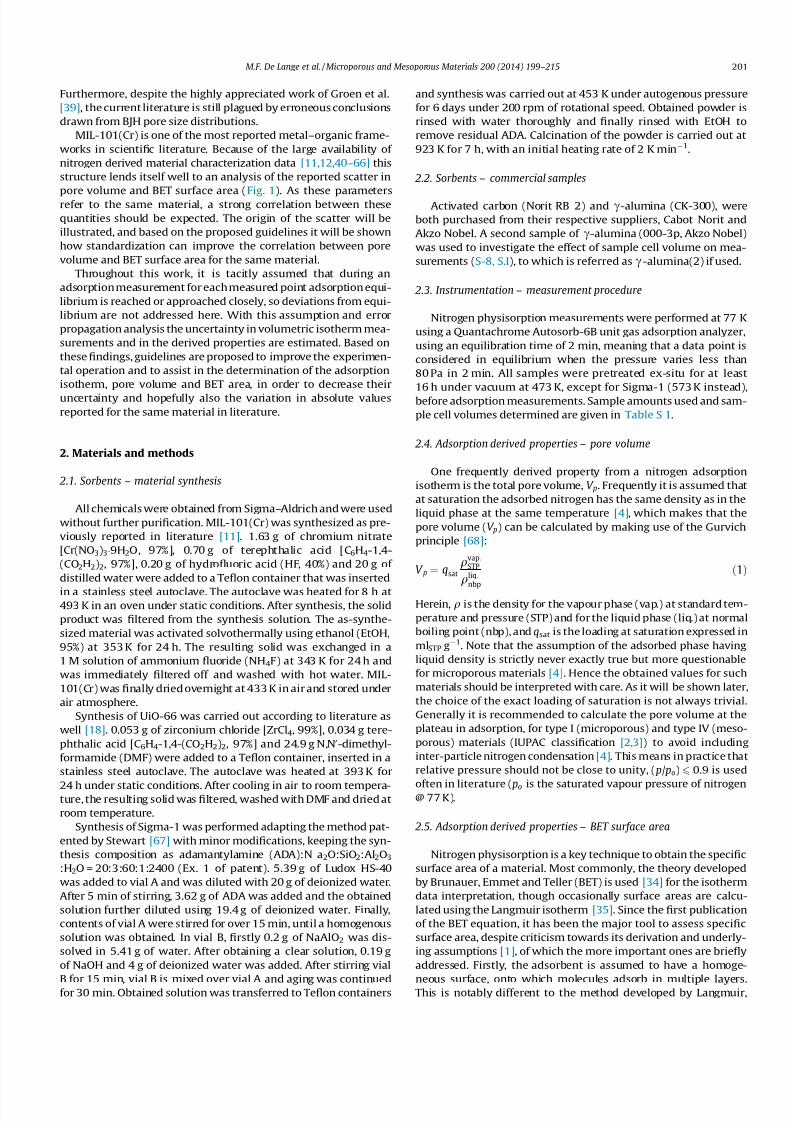
Fig. 1. Reported values of BET surface area as function of reported pore volume forMIL-101(Cr), from various literature sources [11,12,40–66].
200 M.F. De Lange et al. / Microporous and Mesoporous Materials 200 (2014) 199–215
7/27/2019 Adsorptive characterization of porous solids Error analysis guides the way.pdf
http://slidepdf.com/reader/full/adsorptive-characterization-of-porous-solids-error-analysis-guides-the-waypdf 3/17
Furthermore, despite the highly appreciated work of Groen et al.
[39], the current literature is still plagued by erroneous conclusions
drawn from BJH pore size distributions.
MIL-101(Cr) is one of the most reported metal–organic frame-
works in scientific literature. Because of the large availability of
nitrogen derived material characterization data [11,12,40–66] this
structure lends itself well to an analysis of the reported scatter in
pore volume and BET surface area (Fig. 1). As these parameters
refer to the same material, a strong correlation between these
quantities should be expected. The origin of the scatter will be
illustrated, and based on the proposed guidelines it will be shown
how standardization can improve the correlation between pore
volume and BET surface area for the same material.
Throughout this work, it is tacitly assumed that during an
adsorption measurement for each measured point adsorption equi-
librium is reached or approached closely, so deviations from equi-
librium are not addressed here. With this assumption and error
propagation analysis the uncertainty in volumetric isotherm mea-
surements and in the derived properties are estimated. Based on
these findings, guidelines are proposed to improve the experimen-
tal operation and to assist in the determination of the adsorption
isotherm, pore volume and BET area, in order to decrease their
uncertainty and hopefully also the variation in absolute values
reported for the same material in literature.
2. Materials and methods
2.1. Sorbents – material synthesis
All chemicals were obtained from Sigma–Aldrich and were used
without further purification. MIL-101(Cr) was synthesized as pre-
viously reported in literature [11]. 1.63 g of chromium nitrate
[Cr(NO3)39H2O, 97%], 0.70 g of terephthalic acid [C6H4-1,4-
(CO2H2)2, 97%], 0.20 g of hydrofluoric acid (HF, 40%) and 20 g of
distilled water were added to a Teflon container that was inserted
in a stainless steel autoclave. The autoclave was heated for 8 h at493 K in an oven under static conditions. After synthesis, the solid
product was filtered from the synthesis solution. The as-synthe-
sized material was activated solvothermally using ethanol (EtOH,
95%) at 353 K for 24 h. The resulting solid was exchanged in a
1 M solution of ammonium fluoride (NH4F) at 343 K for 24 h and
was immediately filtered off and washed with hot water. MIL-
101(Cr) was finally dried overnight at 433 K in air and stored under
air atmosphere.
Synthesis of UiO-66 was carried out according to literature as
well [18]. 0.053 g of zirconium chloride [ZrCl4, 99%], 0.034 g tere-
phthalic acid [C6H4-1,4-(CO2H2)2, 97%] and 24.9 g N,N0-dimethyl-
formamide (DMF) were added to a Teflon container, inserted in a
stainless steel autoclave. The autoclave was heated at 393 K for
24 h under static conditions. After cooling in air to room tempera-ture, the resulting solid was filtered, washed with DMF and dried at
room temperature.
Synthesis of Sigma-1 was performed adapting the method pat-
ented by Stewart [67] with minor modifications, keeping the syn-
thesis composition as adamantylamine (ADA):N a2O:SiO2:Al2O3
:H2O = 20:3:60:1:2400 (Ex. 1 of patent). 5.39 g of Ludox HS-40
was added to vial A and was diluted with 20 g of deionized water.
After 5 min of stirring, 3.62 g of ADA was added and the obtained
solution further diluted using 19.4 g of deionized water. Finally,
contents of vial A were stirred for over 15 min, until a homogenous
solution was obtained. In vial B, firstly 0.2 g of NaAlO2 was dis-
solved in 5.41 g of water. After obtaining a clear solution, 0.19 g
of NaOH and 4 g of deionized water was added. After stirring vial
B for 15 min, vial B is mixed over vial A and aging was continuedfor 30 min. Obtained solution was transferred to Teflon containers
and synthesis was carried out at 453 K under autogenous pressure
for 6 days under 200 rpm of rotational speed. Obtained powder is
rinsed with water thoroughly and finally rinsed with EtOH to
remove residual ADA. Calcination of the powder is carried out at
923 K for 7 h, with an initial heating rate of 2 K min1.
2.2. Sorbents – commercial samples
Activated carbon (Norit RB 2) and c-alumina (CK-300), were
both purchased from their respective suppliers, Cabot Norit and
Akzo Nobel. A second sample of c-alumina (000-3p, Akzo Nobel)
was used to investigate the effect of sample cell volume on mea-
surements (S-8, S.I), to which is referred as c-alumina(2) if used.
2.3. Instrumentation – measurement procedure
Nitrogen physisorption measurements were performed at 77 K
using a Quantachrome Autosorb-6B unit gas adsorption analyzer,
using an equilibration time of 2 min, meaning that a data point is
considered in equilibrium when the pressure varies less than
80 Pa in 2 min. All samples were pretreated ex-situ for at least
16 h under vacuum at 473 K, except for Sigma-1 (573 K instead),
before adsorption measurements. Sample amounts used and sam-
ple cell volumes determined are given in Table S 1.
2.4. Adsorption derived properties – pore volume
One frequently derived property from a nitrogen adsorption
isotherm is the total pore volume, V p. Frequently it is assumed that
at saturation the adsorbed nitrogen has the same density as in the
liquid phase at the same temperature [4], which makes that the
pore volume (V p) can be calculated by making use of the Gurvich
principle [68]:
V p ¼ qsatqvap:STP
qliq:nbp
ð1Þ
Herein, q is the density for the vapour phase (vap.) at standard tem-
perature and pressure (STP) and for the liquid phase (liq.) at normal
boiling point (nbp), and qsat is the loading at saturation expressed in
mlSTP g1. Note that the assumption of the adsorbed phase having
liquid density is strictly never exactly true but more questionable
for microporous materials [4]. Hence the obtained values for such
materials should be interpreted with care. As it will be shown later,
the choice of the exact loading of saturation is not always trivial.
Generally it is recommended to calculate the pore volume at the
plateau in adsorption, for type I (microporous) and type IV (meso-
porous) materials (IUPAC classification [2,3]) to avoid including
inter-particle nitrogen condensation [4]. This means in practice that
relative pressure should not be close to unity, ( p/ po) 6 0.9 is used
often in literature ( po is the saturated vapour pressure of nitrogen@ 77 K).
2.5. Adsorption derived properties – BET surface area
Nitrogen physisorption is a key technique to obtain the specific
surface area of a material. Most commonly, the theory developed
by Brunauer, Emmet and Teller (BET) is used [34] for the isotherm
data interpretation, though occasionally surface areas are calcu-
lated using the Langmuir isotherm [35]. Since the first publication
of the BET equation, it has been the major tool to assess specific
surface area, despite criticism towards its derivation and underly-
ing assumptions [1], of which the more important ones are briefly
addressed. Firstly, the adsorbent is assumed to have a homoge-
neous surface, onto which molecules adsorb in multiple layers.This is notably different to the method developed by Langmuir,
M.F. De Lange et al. / Microporous and Mesoporous Materials 200 (2014) 199–215 201
7/27/2019 Adsorptive characterization of porous solids Error analysis guides the way.pdf
http://slidepdf.com/reader/full/adsorptive-characterization-of-porous-solids-error-analysis-guides-the-waypdf 4/17
which is limited to a single layer of adsorbate molecules on a sur-
face [35]. Secondly, to the second layer and onwards, molecules
can be adsorbed before complete filling of the lower layers. There
is an infinite amount of layers when ( p/ po) reaches unity. Thirdly,
there are no lateral interactions between molecules located in
the same layer, making the ‘molar adsorption energy’ within one
layer constant. For the second and further layers the ‘molar adsorp-
tion energy’ is assumed to be equal (E 2
), and differs from that for
the first layer (E 1). These assumptions give rise to the well-known
BET relation, that can be formulated as [34]:
q ¼ qm
C p po
1 p
poþ C p
po
n o 1 p
po
n o0@
1A ð2Þ
Here qm is the BET monolayer capacity and C the dimensionless BET
parameter, calculated as the ratio between the adsorption constants
of the first and second and further layers, often approximated by
[37]:
C exp E 1 E 2
RT
ð3Þ
Note that negative values of C are physically meaningless. The
specific surface area can be calculated after the monolayer capac-
ity, qm, has been determined, via [34]:
S BET ¼qmqvap:STP N A ACSM N2
ð4Þ
Here qvapSTP is the density of nitrogen vapour at standard temperature
and pressure (STP), N A is Avogadro’s constant, M N2 is nitrogen’s
molar mass and ACS is the cross-sectional area of a nitrogen mole-
cule. The current standard value of the latter is 0.162 nm2 [69],
derived from the density of liquid nitrogen assuming a hexagonally
closed packed system. Historically this value has varied between
0.13 and 0.20 nm2 [70]. One could directly obtain both C and qm from
nonlinear fitting the BET equation to adsorption data directly. How-ever, it is common practice to obtain these parameters from a line-
arized form of the BET equation:
p po
q 1 p po
¼ 1
Cqm
þ
C 1
Cqm
p
po
¼ I þ s
p
po
ð5Þ
The left-hand side of Eq. (5) is plotted versus relative pressure.
The intercept (I ) and slope (s) can be obtained using a simple linear
least squares fitting routine. From these two parameters, the BET
C -parameter and monolayer capacity, qm, can be back-calculated
via:
qm ¼ 1
I þ s ; C ¼ I þ s
I ð6Þ
As mentioned above, intercept I should have a positive value.
Furthermore, the linearization does not hold for the entire pressure
range. Originally, based on their own experimental results,
Brunauer et al. indicated that Eq. (5) should only be applied for
0.05 < ( p/ po) < 0.35, as outside these boundaries the left-hand side
of Eq. (5) was found to strongly deviate from linearity [34]. No
physical phenomena were mentioned as reason for these limita-
tions. Later, IUPAC recommended the use of a slightly narrower
pressure window, 0.05 < ( p/ po) < 0.30 [2,3]. The linear fitting
method may be preferred over directly fitting C and qm because
of visual tractability and simplicity of fitting, not because of pro-
found physical insights or statistical benefits. Regarding the latter,
the error distribution is changed by linearization [71], similarly as
in the determination of (bio)catalytic reaction kinetic parameters(Hougen–Watson, Lineweaver–Burk approach) [72–74].
The extent to which the BET parameters vary as function of the
pressure range and the degrees of freedom used for fitting is calcu-
lated for the materials under investigation, including the variation
of uncertainty in the BET parameter values.
2.6. Adsorption derived properties – BJH pore size distribution
The pore size distribution is calculated based on the methoddeveloped by Barrett, Joyner and Halenda (BJH) [38]. Herein it is
assumed that the total amount adsorbed in a pore of a material
is based upon two separate consequent contributions. Firstly, the
pores contain a surface on which layers of adsorbate molecules
can be formed, consistent of a certain thickness. The thickness of
this layer on the pore surface increases with increasing ( p/ po). Sec-
ondly, there is an inner capillary radius in this pore of which the
volume is filled by condensation of the adsorbate and no longer
by prolonged layer formation. For a given adsorbate species, the
relative pressure at which this volume condensation occurs, is
determined by the size of this capillary radius, and can be calcu-
lated with the Kelvinequation (r K ). The thickness of adsorbate mol-
ecules attached to a pore surface (t ) was originally estimated for
different relative pressures based on experiments by Shull [75]but can currently be calculated with a variety of equations, includ-
ing those of De Boer [76] and Harkins–Jura [77,78]. Here the latter
is applied, as it is used in the accompanying software of the
adsorption equipment. For a given relative pressure thus, the vol-
ume of adsorbate present inside a porous material is the sum of
(i) the amount of adsorbate present in all pores that are already
fully filled via condensation, for which the pore radius must be
smaller than or equal to the Kelvin radius for the given relative
pressure (r i 6 r K ( p/ po)), and (ii) the amount of adsorbate that is
present in the layers of certain thickness on the walls of the pores
for which the radius larger than the Kelvin radius (r i > r K ( p/ po)).
Summing up over all pore sizes present in the material, this can
be written as:
q p
po
k
qvap:STPqliq:nbp
¼Xki¼1
DV p;i r i 6 r K p
po
k
þXni¼kþ1
DS it i r i > r K p
po
k
ð7Þ
Here q is the amount adsorbed (in mlSTP g1) as function of rela-
tive pressure, DV p,i are the incremental pore volumes that are
already completely filled, associated with radii r i, DS i are the
incremental pore surface areas that belong to pore radii, r i, that
are not yet completely filled and only contain layers of adsorbate
molecules, t i the layer thicknesses thereof and r K the Kelvin radius
for a given relative pressure. Furthermore, the kth pore size is the
largest pore filled completely via condensation (for given ( p/ po))
and the nth pore size is the largest present. As q is given in vol-ume of N2 vapour at standard temperature and pressure (STP), this
requires conversion to liquid phase at measurement conditions, as
has been done for the calculation of the total pore volume (Eq.
(1)). To be able to apply Eq. (7) to determine the pore size distri-
bution, calculations should be started for a measured point at sat-
uration (adsorption plateau in type IV isotherms) [2,3] and an
adjacent data point at lower relative pressure. It is thus tacitly
assumed (see Eq. (7)) that the difference in loading between these
two points is only caused by depletion of the completely filled
largest pore. Subsequently, from the difference in loading, one
can determine the incremental pore volume (DV p) for the largest
pore in the adsorbent. The radius of this pore follows directly from
the relative pressure, as it is the sum the thickness ( t ) and Kelvin
radius (r K ). The difference in loading between the second and thirdpoint is not only assumed to originate from a smaller pore but
202 M.F. De Lange et al. / Microporous and Mesoporous Materials 200 (2014) 199–215
7/27/2019 Adsorptive characterization of porous solids Error analysis guides the way.pdf
http://slidepdf.com/reader/full/adsorptive-characterization-of-porous-solids-error-analysis-guides-the-waypdf 5/17
also from the surface of the larger one, of which in the previous
step the size was determined. Thus starting from saturation, the
distribution of pore sizes can be recursively calculated following
the desorption branch, for which it was derived. It is also feasible
to apply this approach to the adsorption branch, although this is
not advised based on the underlying assumptions of the model.
A frequently observed phenomenon for many desorption hystere-
sis branches is that they are not extended below a certain critical
( p/ po) [4]. This lower limit is only dependent on temperature and
used adsorbate, and thus independent of the material under
investigation. For nitrogen adsorption at 77 K, this limit is at
( p/ po) = 0.42 [4]. In general one should not make use of the
isotherm below ( p/ po) = 0.42, when determining a BJH-pore size
distribution [4]. This in turn means that the BJH-pore size distri-
bution is limited to D pP 3.4 nm and thus should strictly not be
applied to the microporous region. In this work, the BJH pore size
distribution was calculated as described in this section and subse-
quently the uncertainty in the pore size distribution was analyzed,
details of which can be found in the Supporting information (S-3).
2.7. Uncertainty analysis
To assess the uncertainty in measured nitrogen adsorption iso-
therms, the theory of propagation of uncertainties is applied (see,
e.g. Taylor [79]). For independent random errors, the variance
can be formulated as:
r2 y ¼X @ y
@ xi
2r2 xi
ð8Þ
Here y is a variable calculated from i measured variables xi, andr y is
the uncertainty in this variable y, clearly a function of theuncertain-
ties in x i, r xi. Applying Eq. (8) consecutively on all calculated vari-
ables, will ultimately lead to the variance in the adsorbed amount
as a function of relative pressure (calculation details are given in
S-2), from which the absolute uncertainty (square root of variance)
and consequently the absolute confidence interval can be calcu-
lated. All confidence intervals in this work are calculated for a95% confidence level.
Assuming no uncertainties in the determination of density, the
variance in pore volume can be related directly to the variance in
the measured isotherm (adsorbed amount) via:
r2V p ¼ r2qsat
qvap:STP
qliq:nbp
!2ð9Þ
The variance in the adsorbed amount of nitrogen is also
required to determine the uncertainty in the BJH-pore size distri-
bution (details given in S-3). The uncertainty in BET surface area
is directly determined from the fitting procedure (See S-4). The
number of degrees of freedom used (i.e. the difference between
the number of data points and the number of model parameters
to be estimated) is important for the data fitting. Obviously, inorder to have a meaningful fitting, one should, at least, have one
degree of freedom (N D.O.F.). As the BET-equation contains two
parameters, either C and qm or I and S, depending on the applied
approach, at least three data points are needed for a fit. 95% Confi-
dence intervals in measured temperatures (±0.1 K), pressures
(±0.1% of measurement range), weighted amounts (±0.1 mg) and
manifold volume (±5%), as reported by respective suppliers, are
used in the error analysis.
3. Results and discussion
3.1. Uncertainty in adsorption measurements
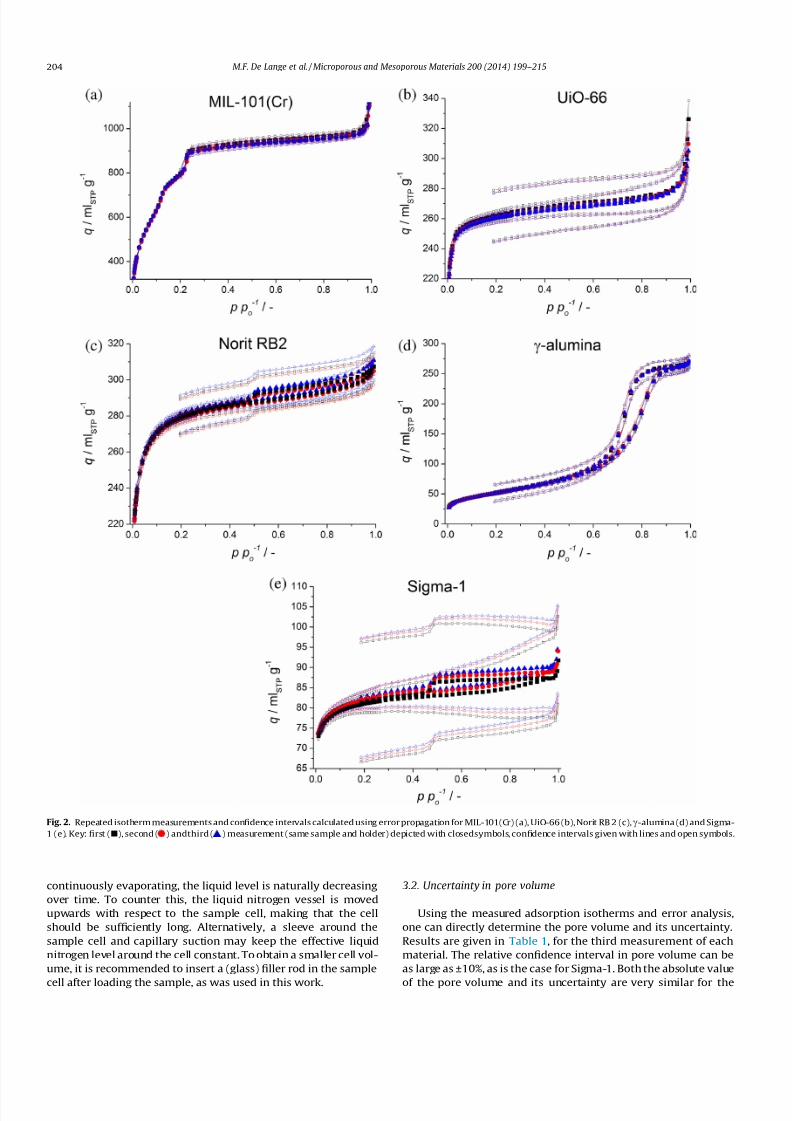
To properly assess the uncertainties in variables derived fromphysisorption measurements, e.g. pore volume and surface area,
nitrogen adsorption isotherms were determined in threefold by
repeating the measurement with the same sample in the same
sample holder and identical pre-treatment protocol, and subjected
to a detailed error propagation analysis. Results are shown in Fig. 2.
Uncertainties in relative pressure ( x-axis) are insignificant, except
for the lowest relative pressures, and therefore not depicted.
Clearly for each material under investigation, the three isotherms
and their confidence intervals are very similar, showing very good
reproducibility of the measurement procedure. This reproducibil-
ity is also shown by the fact that for all investigated materials none
of the isotherms is outside of the confidence interval of the other
two. A closer investigation of this confidence interval clearly shows
the cumulative nature of the propagation of uncertainties, see Eq.
S-2.14. For each additional measured point, the interval widens
slightly. At low relative pressures, the confidence intervals are
insignificant. At relative pressures above 0.3, the growing confi-
dence intervals become clearly visible and are the largest for the
last point measured during desorption. The calculated absolute
confidence interval is generally below ±10 mlSTP g1 for adsorption
and below ±20 mlSTP g1 for desorption (see Fig. S 1). A detailed
analysis of the different contributions to the overall uncertainty
shows that an increase in accuracy of the adsorbed amount can
be realized by increasing the accuracy of the pressure sensor used,
a more accurate calibration of the manifold volume (see S-6) or by
optimizing the ratio of manifold volume and sample volume. To
determine this optimal ratio, the uncertainty in pore volume is
determined as function of (V man/V cell), using a representative Lang-
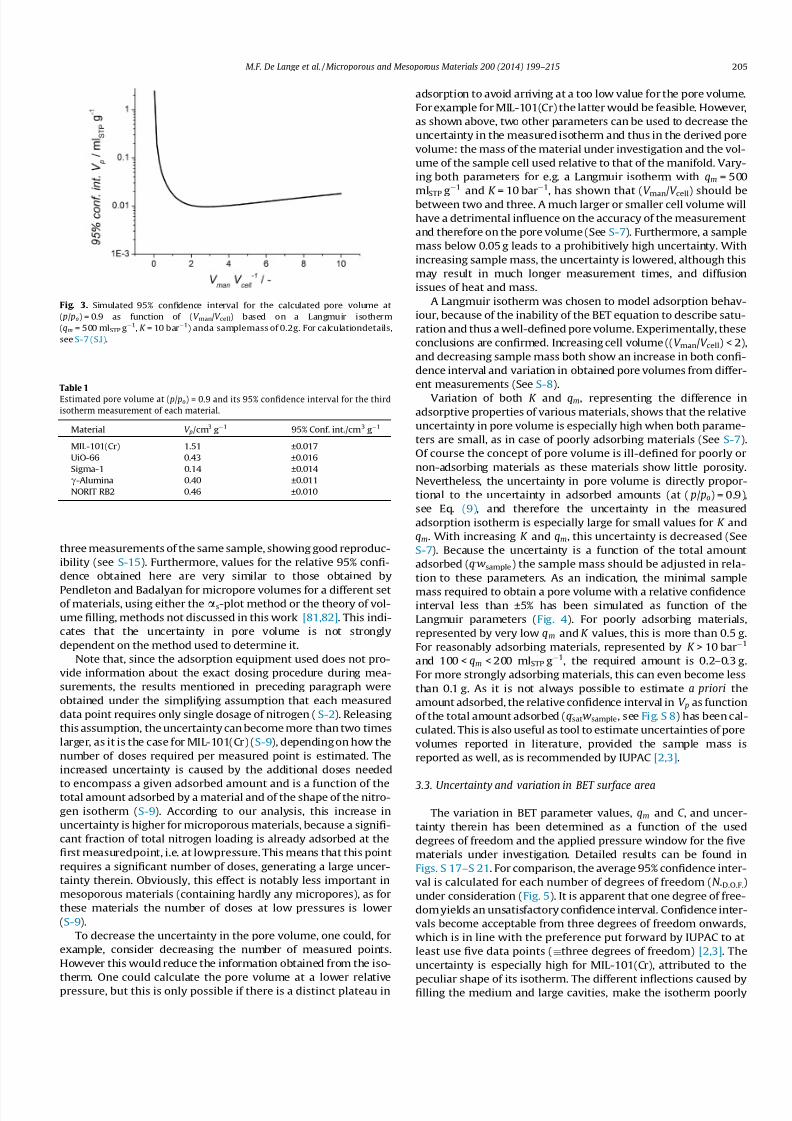
muir-Type isotherm (qm = 500 mlSTP g1, K = 10 bar1). Results, as
depicted in Fig. 3, show that preferably (V man/V cell) is between 2
and 3 (see S-7 for calculation details). As pressure sensors often
have an accuracy, which is a percentage of the full range, an
increase in adsorption measurement accuracy might be best real-
ized by using multiple pressure sensors with different pressure
ranges, although it might be rather difficult to retrofit this in
already existing adsorption equipment.
In the preceding discussion, sample mass and cell volume have
been fixed purposely to investigate reproducibility of the measure-ment procedure. Separate efforts have been conducted to envisage
the influence of these two variables experimentally (S-8). Firstly,
decreasing sample mass and increasing cell volume both cause a
widening in the confidence interval (see Fig. S 10). More interest-
ingly, an artificially increased desorption hysteresis can be
observed when the cell volume is increased, becoming more
noticeable for lower sample masses (see Fig. S 11). For the smallest
cell volume (V cell 10 ml) under investigation, the closure of the
hysteresis loop at ( p/ po) 0.42 can be observed, where for the larg-
est cell (V cell 35 ml) the hysteresis loop is not yet closed at
( p/ po) 0.2, suggesting unphysical desorption behaviour. This is
because both a larger cell volume and lower sample mass make
that pressure in the cell volume varies less during measurements
of the different data points. The pressure of the cell volume is mon-itored to determine whether a measured point has approached
equilibrium sufficiently. So, when variation in pressure during
measurements decreases, sensitivity towards equilibrium is lost
and, especially for measured points with significant ad- or desorp-
tion, a deviating trend can be observed (see S-8).
Importantly, the absolute volume of the sample cell thus deter-
mines whether an erroneous hysteresis between ad- and desorp-
tion occurs. Clearly, a small sample cell (V cell 10 ml) is desired.
However, minimization of this cell is not unconstrained. Obviously,
the cell should have a finite inner diameter to be able to load the
actual sample. Furthermore, and less trivial, the cell length cannot
be shortened, because of liquid nitrogen level control. Keeping the
liquid nitrogen level constant is crucial, as minor deviations of this
level have a significant influence on adsorption measurements, ashas been shown by Pendleton and Badalyan [80] As nitrogen is
M.F. De Lange et al. / Microporous and Mesoporous Materials 200 (2014) 199–215 203
7/27/2019 Adsorptive characterization of porous solids Error analysis guides the way.pdf
http://slidepdf.com/reader/full/adsorptive-characterization-of-porous-solids-error-analysis-guides-the-waypdf 6/17
continuously evaporating, the liquid level is naturally decreasing
over time. To counter this, the liquid nitrogen vessel is moved
upwards with respect to the sample cell, making that the cell
should be sufficiently long. Alternatively, a sleeve around the
sample cell and capillary suction may keep the effective liquid
nitrogen level around the cell constant. To obtain a smaller cell vol-
ume, it is recommended to insert a (glass) filler rod in the sample
cell after loading the sample, as was used in this work.
3.2. Uncertainty in pore volume
Using the measured adsorption isotherms and error analysis,
one can directly determine the pore volume and its uncertainty.
Results are given in Table 1, for the third measurement of each
material. The relative confidence interval in pore volume can be
as large as ±10%, as is the case for Sigma-1. Both the absolute value
of the pore volume and its uncertainty are very similar for the
Fig. 2. Repeated isotherm measurements and confidence intervals calculated using error propagation for MIL-101(Cr) (a), UiO-66 (b), Norit RB 2 (c),c-alumina (d) and Sigma-
1 (e). Key: first (j), second ( ) andthird ( ) measurement (same sample and holder) depicted with closedsymbols, confidence intervals given with lines and open symbols.
204 M.F. De Lange et al. / Microporous and Mesoporous Materials 200 (2014) 199–215
7/27/2019 Adsorptive characterization of porous solids Error analysis guides the way.pdf
http://slidepdf.com/reader/full/adsorptive-characterization-of-porous-solids-error-analysis-guides-the-waypdf 7/17
three measurements of the same sample, showing good reproduc-
ibility (see S-15). Furthermore, values for the relative 95% confi-
dence obtained here are very similar to those obtained by
Pendleton and Badalyan for micropore volumes for a different setof materials, using either the as-plot method or the theory of vol-
ume filling, methods not discussed in this work [81,82]. This indi-
cates that the uncertainty in pore volume is not strongly
dependent on the method used to determine it.
Note that, since the adsorption equipment used does not pro-
vide information about the exact dosing procedure during mea-
surements, the results mentioned in preceding paragraph were
obtained under the simplifying assumption that each measured
data point requires only single dosage of nitrogen (S-2). Releasing
this assumption, the uncertainty can become more than two times
larger, as it is the case for MIL-101(Cr) (S-9), depending on how the
number of doses required per measured point is estimated. The
increased uncertainty is caused by the additional doses needed
to encompass a given adsorbed amount and is a function of thetotal amount adsorbed by a material and of the shape of the nitro-
gen isotherm (S-9). According to our analysis, this increase in
uncertainty is higher for microporous materials, because a signifi-
cant fraction of total nitrogen loading is already adsorbed at the
first measuredpoint, i.e. at lowpressure. This means that this point
requires a significant number of doses, generating a large uncer-
tainty therein. Obviously, this effect is notably less important in
mesoporous materials (containing hardly any micropores), as for
these materials the number of doses at low pressures is lower
(S-9).
To decrease the uncertainty in the pore volume, one could, for
example, consider decreasing the number of measured points.
However this would reduce the information obtained from the iso-
therm. One could calculate the pore volume at a lower relativepressure, but this is only possible if there is a distinct plateau in
adsorption to avoid arriving at a too low value for the pore volume.
For example for MIL-101(Cr) the latter would be feasible. However,
as shown above, two other parameters can be used to decrease the
uncertainty in the measured isotherm and thus in the derived pore
volume: the mass of the material under investigation and the vol-
ume of the sample cell used relative to that of the manifold. Vary-
ing both parameters for e.g. a Langmuir isotherm with qm = 500
mlSTP
g1 and K
= 10 bar1, has shown that (V man
/V cell
) should be
between two and three. A much larger or smaller cell volume will
have a detrimental influence on the accuracy of the measurement
and therefore on the pore volume (See S-7). Furthermore, a sample
mass below 0.05 g leads to a prohibitively high uncertainty. With
increasing sample mass, the uncertainty is lowered, although this
may result in much longer measurement times, and diffusion
issues of heat and mass.
A Langmuir isotherm was chosen to model adsorption behav-
iour, because of the inability of the BET equation to describe satu-
ration and thus a well-defined pore volume. Experimentally, these
conclusions are confirmed. Increasing cell volume ((V man/V cell) < 2),
and decreasing sample mass both show an increase in both confi-
dence interval and variation in obtained pore volumes from differ-
ent measurements (See S-8).
Variation of both K and qm, representing the difference in
adsorptive properties of various materials, shows that the relative
uncertainty in pore volume is especially high when both parame-
ters are small, as in case of poorly adsorbing materials (See S-7).
Of course the concept of pore volume is ill-defined for poorly or
non-adsorbing materials as these materials show little porosity.
Nevertheless, the uncertainty in pore volume is directly propor-
tional to the uncertainty in adsorbed amounts (at ( p/ po) = 0.9),
see Eq. (9), and therefore the uncertainty in the measured
adsorption isotherm is especially large for small values for K and
qm. With increasing K and qm, this uncertainty is decreased (See
S-7). Because the uncertainty is a function of the total amount
adsorbed (q.wsample) the sample mass should be adjusted in rela-
tion to these parameters. As an indication, the minimal sample
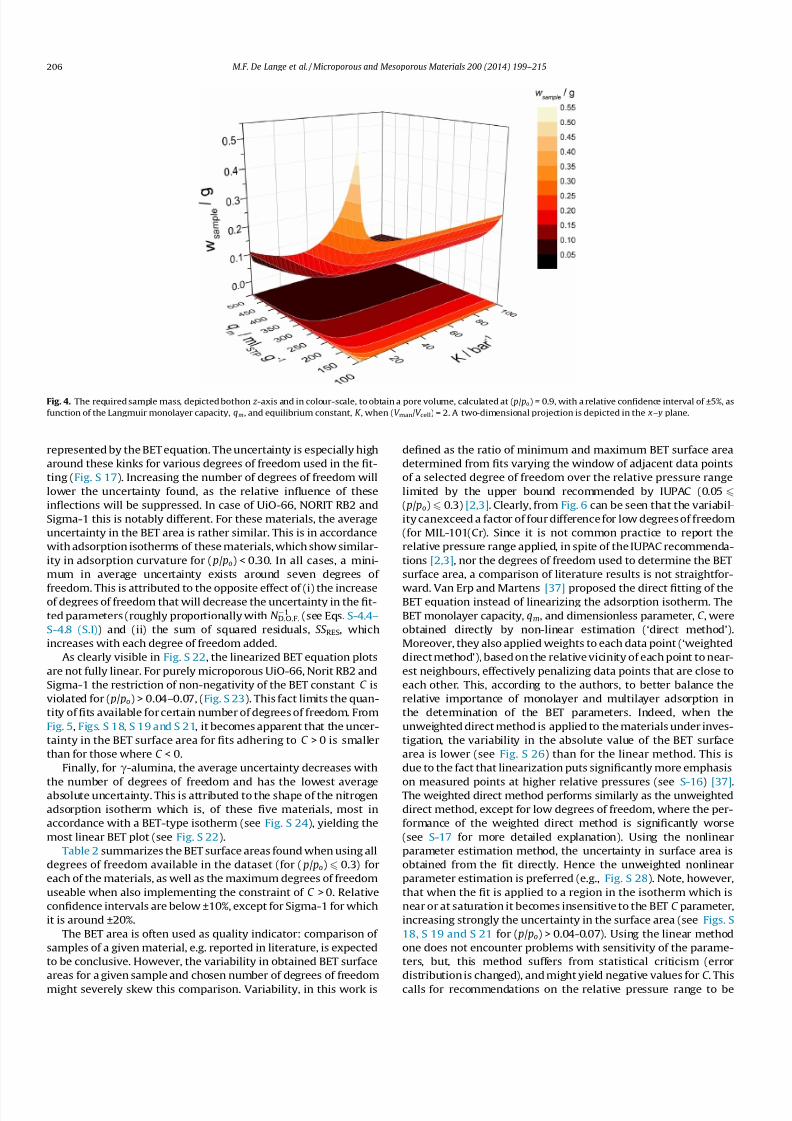
mass required to obtain a pore volume with a relative confidenceinterval less than ±5% has been simulated as function of the
Langmuir parameters (Fig. 4). For poorly adsorbing materials,
represented by very low qm and K values, this is more than 0.5 g.
For reasonably adsorbing materials, represented by K > 10 bar1
and 100 < qm < 200 mlSTP g1, the required amount is 0.2–0.3 g.
For more strongly adsorbing materials, this can even become less
than 0.1 g. As it is not always possible to estimate a priori the
amount adsorbed, the relative confidence interval in V p as function
of the total amount adsorbed (qsat. wsample, see Fig. S 8) has been cal-
culated. This is also useful as tool to estimate uncertainties of pore
volumes reported in literature, provided the sample mass is
reported as well, as is recommended by IUPAC [2,3].
3.3. Uncertainty and variation in BET surface area
The variation in BET parameter values, qm and C , and uncer-
tainty therein has been determined as a function of the used
degrees of freedom and the applied pressure window for the five
materials under investigation. Detailed results can be found in
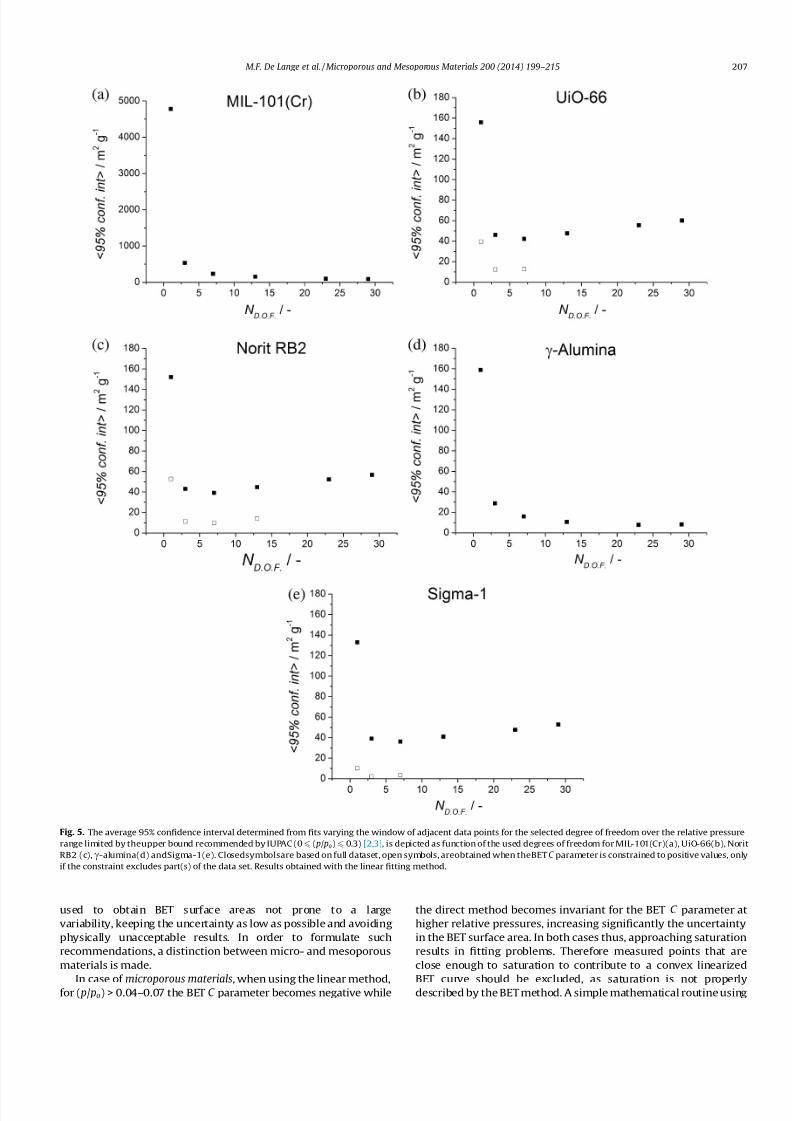
Figs. S 17–S 21. For comparison, the average 95% confidence inter-
val is calculated for each number of degrees of freedom (N .D.O.F.)
under consideration (Fig. 5). It is apparent that one degree of free-
dom yields an unsatisfactory confidence interval. Confidence inter-
vals become acceptable from three degrees of freedom onwards,
which is in line with the preference put forward by IUPAC to at
least use five data points (three degrees of freedom) [2,3]. The
uncertainty is especially high for MIL-101(Cr), attributed to the
peculiar shape of its isotherm. The different inflections caused byfilling the medium and large cavities, make the isotherm poorly
Fig. 3. Simulated 95% confidence interval for the calculated pore volume at
( p/ po) = 0.9 as function of (V man/V cell) based on a Langmuir isotherm
(qm = 500 mlSTP g1, K = 10 bar1) anda samplemass of 0.2g. For calculationdetails,
see S-7 (S.I).
Table 1
Estimated pore volume at ( p/ po) = 0.9 and its 95% confidence interval for the third
isotherm measurement of each material.
Material V p/cm3 g1 95% Conf. int./cm3 g1
MIL-101(Cr) 1.51 ±0.017
UiO-66 0.43 ±0.016
Sigma-1 0.14 ±0.014
c-Alumina 0.40 ±0.011
NORIT RB2 0.46 ±0.010
M.F. De Lange et al. / Microporous and Mesoporous Materials 200 (2014) 199–215 205
7/27/2019 Adsorptive characterization of porous solids Error analysis guides the way.pdf
http://slidepdf.com/reader/full/adsorptive-characterization-of-porous-solids-error-analysis-guides-the-waypdf 8/17
represented by the BET equation. The uncertainty is especially high
around these kinks for various degrees of freedom used in the fit-
ting (Fig. S 17). Increasing the number of degrees of freedom will
lower the uncertainty found, as the relative influence of these
inflections will be suppressed. In case of UiO-66, NORIT RB2 and
Sigma-1 this is notably different. For these materials, the average
uncertainty in the BET area is rather similar. This is in accordance
with adsorption isotherms of these materials, which show similar-
ity in adsorption curvature for ( p/ po) < 0.30. In all cases, a mini-
mum in average uncertainty exists around seven degrees of
freedom. This is attributed to the opposite effect of (i) the increaseof degrees of freedom that will decrease the uncertainty in the fit-
ted parameters (roughly proportionally with N D.O.F.1 (see Eqs. S-4.4–
S-4.8 (S.I)) and (ii) the sum of squared residuals, SS RES, which
increases with each degree of freedom added.
As clearly visible in Fig. S 22, the linearized BET equation plots
are not fully linear. For purely microporous UiO-66, Norit RB2 and
Sigma-1 the restriction of non-negativity of the BET constant C is
violated for ( p/ po) > 0.04–0.07, (Fig. S 23). This fact limits the quan-
tity of fits available for certain number of degrees of freedom. From
Fig. 5, Figs. S 18, S 19 and S 21, it becomes apparent that the uncer-
tainty in the BET surface area for fits adhering to C > 0 is smaller
than for those where C < 0.
Finally, for c-alumina, the average uncertainty decreases with
the number of degrees of freedom and has the lowest averageabsolute uncertainty. This is attributed to the shape of the nitrogen
adsorption isotherm which is, of these five materials, most in
accordance with a BET-type isotherm (see Fig. S 24), yielding the
most linear BET plot (see Fig. S 22).
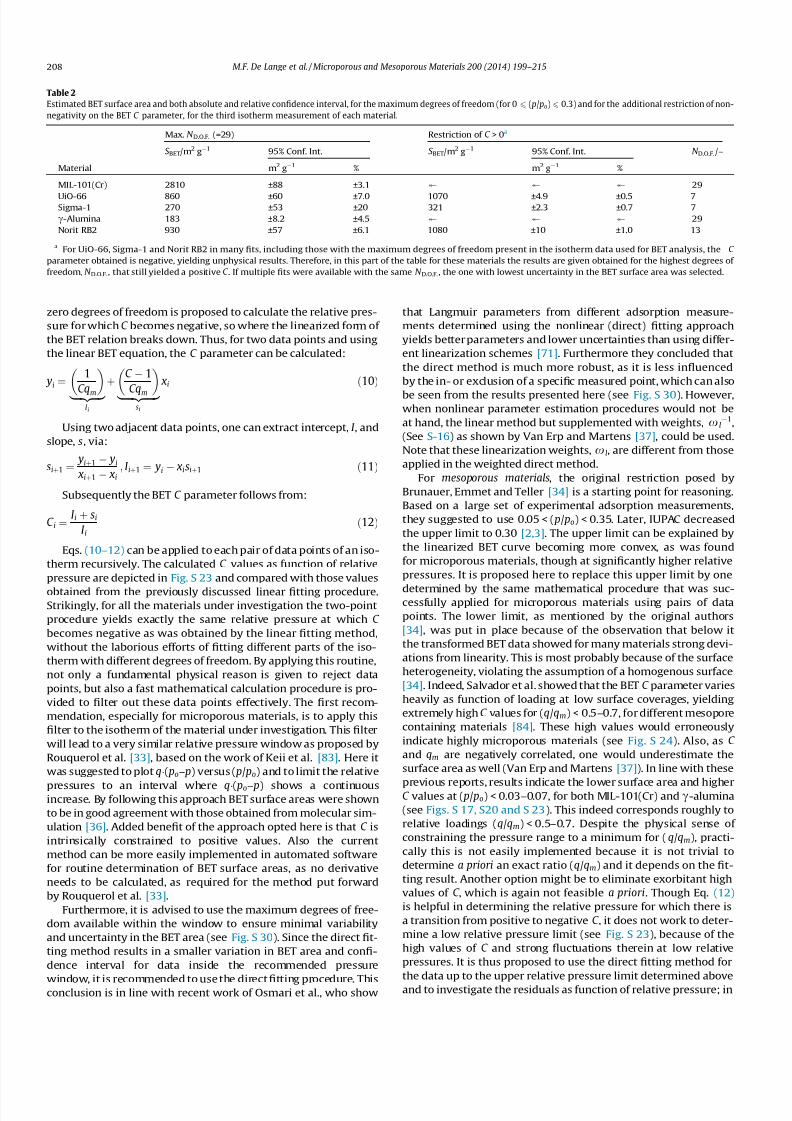
Table 2 summarizes the BET surface areas found when using all
degrees of freedom available in the dataset (for ( p/ po) 6 0.3) for
each of the materials, as well as the maximum degrees of freedom
useable when also implementing the constraint of C > 0. Relative
confidence intervals are below ±10%, except for Sigma-1 for which
it is around ±20%.
The BET area is often used as quality indicator: comparison of
samples of a given material, e.g. reported in literature, is expected
to be conclusive. However, the variability in obtained BET surface
areas for a given sample and chosen number of degrees of freedom
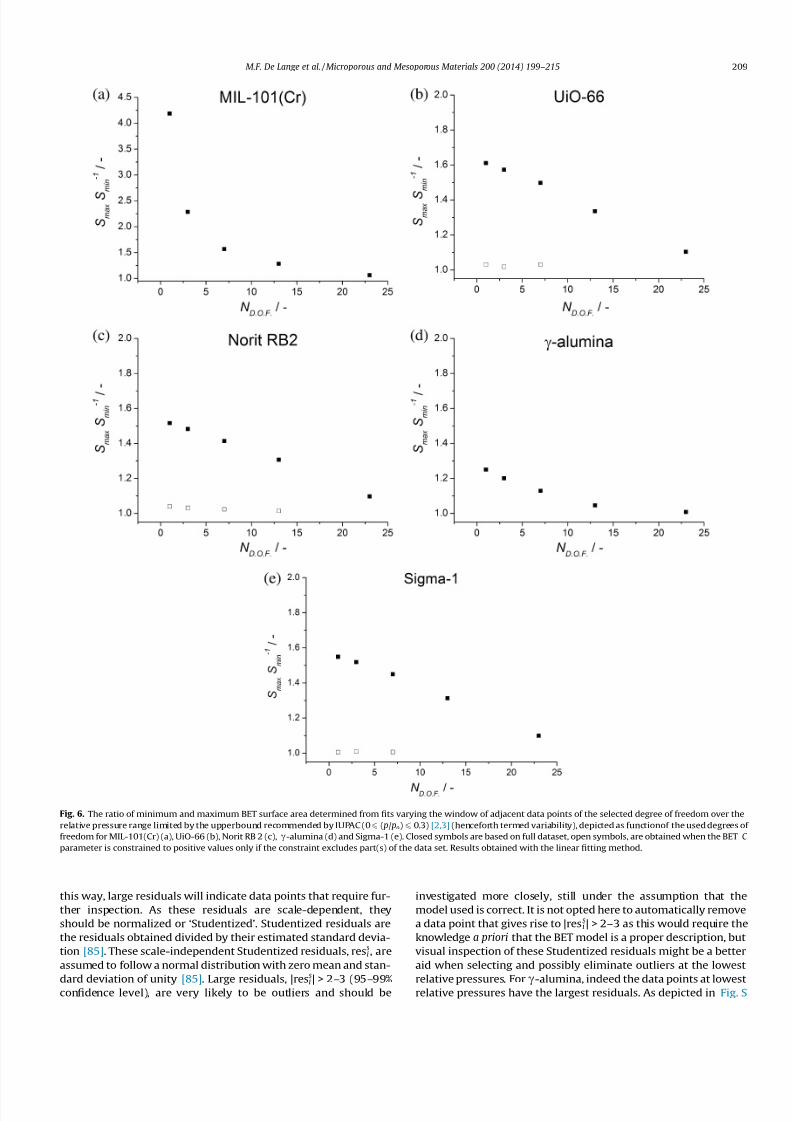
might severely skew this comparison. Variability, in this work is
defined as the ratio of minimum and maximum BET surface area
determined from fits varying the window of adjacent data points
of a selected degree of freedom over the relative pressure range
limited by the upper bound recommended by IUPAC (0.05 6
( p/ po) 6 0.3) [2,3]. Clearly, from Fig. 6 can be seen that the variabil-
ity canexceed a factor of four difference for low degrees of freedom
(for MIL-101(Cr). Since it is not common practice to report the
relative pressure range applied, in spite of the IUPAC recommenda-
tions [2,3], nor the degrees of freedom used to determine the BET
surface area, a comparison of literature results is not straightfor-
ward. Van Erp and Martens [37] proposed the direct fitting of theBET equation instead of linearizing the adsorption isotherm. The
BET monolayer capacity, qm, and dimensionless parameter, C , were
obtained directly by non-linear estimation (‘direct method’).
Moreover, they also applied weights to each data point (‘weighted
direct method’), based on the relative vicinity of each point to near-
est neighbours, effectively penalizing data points that are close to
each other. This, according to the authors, to better balance the
relative importance of monolayer and multilayer adsorption in
the determination of the BET parameters. Indeed, when the
unweighted direct method is applied to the materials under inves-
tigation, the variability in the absolute value of the BET surface
area is lower (see Fig. S 26) than for the linear method. This is
due to the fact that linearization puts significantly more emphasis
on measured points at higher relative pressures (see S-16) [37].The weighted direct method performs similarly as the unweighted
direct method, except for low degrees of freedom, where the per-
formance of the weighted direct method is significantly worse
(see S-17 for more detailed explanation). Using the nonlinear
parameter estimation method, the uncertainty in surface area is
obtained from the fit directly. Hence the unweighted nonlinear
parameter estimation is preferred (e.g., Fig. S 28). Note, however,
that when the fit is applied to a region in the isotherm which is
near or at saturation it becomes insensitive to the BET C parameter,
increasing strongly the uncertainty in the surface area (see Figs. S
18, S 19 and S 21 for ( p/ po) > 0.04-0.07). Using the linear method
one does not encounter problems with sensitivity of the parame-
ters, but, this method suffers from statistical criticism (error
distribution is changed), and might yield negative values for C . This
calls for recommendations on the relative pressure range to be
Fig. 4. The required sample mass, depicted bothon z -axis and in colour-scale, to obtain a pore volume, calculated at ( p/ po) = 0.9, with a relative confidence interval of ±5%, as
function of the Langmuir monolayer capacity, qm, and equilibrium constant, K , when (V man/V cell) = 2. A two-dimensional projection is depicted in the x– y plane.
206 M.F. De Lange et al. / Microporous and Mesoporous Materials 200 (2014) 199–215
7/27/2019 Adsorptive characterization of porous solids Error analysis guides the way.pdf
http://slidepdf.com/reader/full/adsorptive-characterization-of-porous-solids-error-analysis-guides-the-waypdf 9/17
used to obtain BET surface areas not prone to a large
variability, keeping the uncertainty as low as possible and avoiding
physically unacceptable results. In order to formulate such
recommendations, a distinction between micro- and mesoporous
materials is made.
In case of microporous materials, when using the linear method,for ( p/ po) > 0.04–0.07 the BET C parameter becomes negative while
the direct method becomes invariant for the BET C parameter at
higher relative pressures, increasing significantly the uncertainty
in the BET surface area. In both cases thus, approaching saturation
results in fitting problems. Therefore measured points that are
close enough to saturation to contribute to a convex linearized
BET curve should be excluded, as saturation is not properlydescribed by the BET method. A simple mathematical routine using
Fig. 5. The average 95% confidence interval determined from fits varying the window of adjacent data points for the selected degree of freedom over the relative pressure
range limited by theupper bound recommended by IUPAC (0 6 ( p/ po) 6 0.3) [2,3], is depicted as function of the used degrees of freedom for MIL-101(Cr)(a), UiO-66(b), Norit
RB2 (c),c-alumina(d) andSigma-1(e). Closedsymbolsare based on full dataset, open symbols, areobtained when theBET C parameter is constrained to positive values, only
if the constraint excludes part(s) of the data set. Results obtained with the linear fitting method.
M.F. De Lange et al. / Microporous and Mesoporous Materials 200 (2014) 199–215 207
7/27/2019 Adsorptive characterization of porous solids Error analysis guides the way.pdf
http://slidepdf.com/reader/full/adsorptive-characterization-of-porous-solids-error-analysis-guides-the-waypdf 10/17
zero degrees of freedom is proposed to calculate the relative pres-
sure for which C becomes negative, so where the linearized form of
the BET relation breaks down. Thus, for two data points and using
the linear BET equation, the C parameter can be calculated:
yi ¼ 1
Cqm |fflfflfflffl{zfflfflfflffl} I i
þ C 1
Cqm |fflfflfflfflffl ffl{zfflfflfflfflffl ffl} si
xi ð10Þ
Using two adjacent data points, one can extract intercept, I , and
slope, s, via:
siþ1 ¼ yiþ1 yi xiþ1 xi
; I iþ1 ¼ yi xisiþ1 ð11Þ
Subsequently the BET C parameter follows from:
C i ¼I i þ siI i
ð12Þ
Eqs. (10–12) can be applied to each pair of data points of an iso-
therm recursively. The calculated C values as function of relative
pressure are depicted in Fig. S 23 and compared with those values
obtained from the previously discussed linear fitting procedure.Strikingly, for all the materials under investigation the two-point
procedure yields exactly the same relative pressure at which C
becomes negative as was obtained by the linear fitting method,
without the laborious efforts of fitting different parts of the iso-
therm with different degrees of freedom. By applying this routine,
not only a fundamental physical reason is given to reject data
points, but also a fast mathematical calculation procedure is pro-
vided to filter out these data points effectively. The first recom-
mendation, especially for microporous materials, is to apply this
filter to the isotherm of the material under investigation. This filter
will lead to a very similar relative pressure window as proposed by
Rouquerol et al. [33], based on the work of Keii et al. [83]. Here it
was suggested to plot q( po– p) versus ( p/ po) and to limit the relative
pressures to an interval where q( po– p) shows a continuousincrease. By following this approach BET surface areas were shown
to be in good agreement with those obtained from molecular sim-
ulation [36]. Added benefit of the approach opted here is that C is
intrinsically constrained to positive values. Also the current
method can be more easily implemented in automated software
for routine determination of BET surface areas, as no derivative
needs to be calculated, as required for the method put forward
by Rouquerol et al. [33].
Furthermore, it is advised to use the maximum degrees of free-
dom available within the window to ensure minimal variability
and uncertainty in the BET area (see Fig. S 30). Since the direct fit-
ting method results in a smaller variation in BET area and confi-
dence interval for data inside the recommended pressure
window, it is recommended to use the direct fitting procedure. Thisconclusion is in line with recent work of Osmari et al., who show
that Langmuir parameters from different adsorption measure-
ments determined using the nonlinear (direct) fitting approach
yields better parameters and lower uncertainties than using differ-
ent linearization schemes [71]. Furthermore they concluded that
the direct method is much more robust, as it is less influenced
by the in- or exclusion of a specific measured point, which can also
be seen from the results presented here (see Fig. S 30). However,when nonlinear parameter estimation procedures would not be
at hand, the linear method but supplemented with weights, x l1,
(See S-16) as shown by Van Erp and Martens [37], could be used.
Note that these linearization weights, x l, are different from those
applied in the weighted direct method.
For mesoporous materials, the original restriction posed by
Brunauer, Emmet and Teller [34] is a starting point for reasoning.
Based on a large set of experimental adsorption measurements,
they suggested to use 0.05 < ( p/ po) < 0.35. Later, IUPAC decreased
the upper limit to 0.30 [2,3]. The upper limit can be explained by
the linearized BET curve becoming more convex, as was found
for microporous materials, though at significantly higher relative
pressures. It is proposed here to replace this upper limit by one
determined by the same mathematical procedure that was suc-cessfully applied for microporous materials using pairs of data
points. The lower limit, as mentioned by the original authors
[34], was put in place because of the observation that below it
the transformed BET data showed for many materials strong devi-
ations from linearity. This is most probably because of the surface
heterogeneity, violating the assumption of a homogenous surface
[34]. Indeed, Salvador et al. showed that the BET C parameter varies
heavily as function of loading at low surface coverages, yielding
extremely high C values for (q/qm) < 0.5–0.7, for different mesopore
containing materials [84]. These high values would erroneously
indicate highly microporous materials (see Fig. S 24). Also, as C
and qm are negatively correlated, one would underestimate the
surface area as well (Van Erp and Martens [37]). In line with these
previous reports, results indicate the lower surface area and higherC values at ( p/ po) < 0.03–0.07, for both MIL-101(Cr) and c-alumina
(see Figs. S 17, S20 and S 23). This indeed corresponds roughly to
relative loadings (q/qm) < 0.5–0.7. Despite the physical sense of
constraining the pressure range to a minimum for (q/qm), practi-
cally this is not easily implemented because it is not trivial to
determine a priori an exact ratio (q/qm) and it depends on the fit-
ting result. Another option might be to eliminate exorbitant high
values of C , which is again not feasible a priori. Though Eq. (12)
is helpful in determining the relative pressure for which there is
a transition from positive to negative C , it does not work to deter-
mine a low relative pressure limit (see Fig. S 23), because of the
high values of C and strong fluctuations therein at low relative
pressures. It is thus proposed to use the direct fitting method for
the data up to the upper relative pressure limit determined above
and to investigate the residuals as function of relative pressure; in
Table 2
Estimated BET surface area and both absolute and relative confidence interval, for the maximum degrees of freedom (for 0 6 ( p/ po) 6 0.3) and for the additional restriction of non-
negativity on the BET C parameter, for the third isotherm measurement of each material.
Max. N D.O.F. (=29) Restriction of C > 0a
S BET/m2 g1 95% Conf. Int. S BET/m2 g1 95% Conf. Int. N D.O.F./–
Material m2 g1 % m2 g1 %
MIL-101(Cr) 2810 ±88 ±3.1 29
UiO-66 860 ±60 ±7.0 1070 ±4.9 ±0.5 7Sigma-1 270 ±53 ±20 321 ±2.3 ±0.7 7
c-Alumina 183 ±8.2 ±4.5 29
Norit RB2 930 ±57 ±6.1 1080 ±10 ±1.0 13
a For UiO-66, Sigma-1 and Norit RB2 in many fits, including those with the maximum degrees of freedom present in the isotherm data used for BET analysis, the C
parameter obtained is negative, yielding unphysical results. Therefore, in this part of the table for these materials the results are given obtained for the highest degrees of
freedom, N D.O.F., that still yielded a positive C . If multiple fits were available with the same N D.O.F., the one with lowest uncertainty in the BET surface area was selected.
208 M.F. De Lange et al. / Microporous and Mesoporous Materials 200 (2014) 199–215
7/27/2019 Adsorptive characterization of porous solids Error analysis guides the way.pdf
http://slidepdf.com/reader/full/adsorptive-characterization-of-porous-solids-error-analysis-guides-the-waypdf 11/17
this way, large residuals will indicate data points that require fur-
ther inspection. As these residuals are scale-dependent, they
should be normalized or ‘Studentized’. Studentized residuals are
the residuals obtained divided by their estimated standard devia-
tion [85]. These scale-independent Studentized residuals, resis, are
assumed to follow a normal distribution with zero mean and stan-
dard deviation of unity [85]. Large residuals, |resi
s
| > 2–3 (95–99%confidence level), are very likely to be outliers and should be
investigated more closely, still under the assumption that the
model used is correct. It is not opted here to automatically remove
a data point that gives rise to |resis| > 2–3 as this would require the
knowledge a priori that the BET model is a proper description, but
visual inspection of these Studentized residuals might be a better
aid when selecting and possibly eliminate outliers at the lowest
relative pressures. For c-alumina, indeed the data points at lowestrelative pressures have the largest residuals. As depicted in Fig. S
Fig. 6. The ratio of minimum and maximum BET surface area determined from fits varying the window of adjacent data points of the selected degree of freedom over the
relative pressure range limited by the upperbound recommended by IUPAC (0 6 ( p/ po) 6 0.3) [2,3] (henceforth termed variability), depicted as functionof the used degrees of
freedom for MIL-101(Cr) (a), UiO-66 (b), Norit RB 2 (c), c-alumina (d) and Sigma-1 (e). Closed symbols are based on full dataset, open symbols, are obtained when the BET C
parameter is constrained to positive values only if the constraint excludes part(s) of the data set. Results obtained with the linear fitting method.
M.F. De Lange et al. / Microporous and Mesoporous Materials 200 (2014) 199–215 209
7/27/2019 Adsorptive characterization of porous solids Error analysis guides the way.pdf
http://slidepdf.com/reader/full/adsorptive-characterization-of-porous-solids-error-analysis-guides-the-waypdf 12/17
31, the Studentized residuals are significantly larger at low relative
pressures, indicating inaccurate description of adsorption by the
BET equation in this region. Removing these data points increases
the quality of the fit substantially and reduces the confidence
interval of the estimated surface area (see Fig. S 31). The fit
becomes impeccable for (q/qm) > 0.9 where indeed ( p/ po) > 0.05.
This is supported by the seemingly randomly distributed Studen-
tized residuals and the strong correspondence between the mea-
sured isotherm and fitted curve (see Fig. S 31). Furthermore this
can be concluded from the normal probability plots accompanying
the fits (see Fig. S 32). With the decreasing confidence interval the
value of surface area increases gradually, as shown in Fig. S 33.
Note that initially the Studentized residuals do not necessarily
decrease significantly, as they are renormalized each time a mea-
sured point is eliminated. Obtaining residuals without any tailing
at low relative pressures, starts occurring at ( p/ po) > 0.05 for c-alu-
mina, when (q/qm)P 0.9, putting most emphasis on multilayer for-
mation during the fitting procedure, the essence of the BET theory.
For MIL-101(Cr) the story is completely different. Because of the
distinct kinks in the adsorption isotherm, the BET equation will
inherently yield a poor description of the adsorption behaviour.
This is reflected in the Studentized residuals (Fig. S 34). Thus there
is no statistical incentive to remove particularly the data at lowrel-
ative pressures. If one were to, despite previous statistical argu-
ments, eliminate points of largest residuals in an iterative
fashion, one would need to remove almost the entire dataset
(18 data points) to yield some sort of randomly distributed resid-
uals (see Figs. S 34 and S 35). The obtained fit parameter values for
the latter do not represent the isotherm for MIL-101(Cr) any better
than those obtained without any exclusion of data points and even
have a higher uncertainty (see Table S 6). This corresponds with
the notion that the linearized BET curve does not show a significant
linear section (see Fig. S 22). From both a statistical and physical
point of view thus, for materials deviating strongly in adsorption
behaviour from the BET formulation as was exemplified for MIL-
101(Cr), one should be very careful with the removal of data
points.One might opt to consider using the experimentally found
uncertainties from adsorption measurements as weights for the
determination of the BET surface area, as was previously recom-
mended by Pendleton and Badalyan [80]. The use of this approach
however, is strongly discouraged. As uncertainties are cumulative,
the highest weights are given to the first data points. This in turn
means that highest importance is given to the data at lowest rela-
tive pressures, putting strong emphasis on the region where sur-
face heterogeneity might significantly interfere. As a result the
obtained C parameter will be artificially increased and the BET sur-
face area decreased. Indeed Pendleton and Badalyan obtained, for a
BET-like reference sample even, lower specific surface areas than
for their unweighted case, both based on the linear fitting method
[80]. Because the linear fitting method puts, compared to the directmethod, more emphasis on high relative pressure data, as has been
shown by Van Erp and Martens [37], the undesirable influence of
including experimental uncertainties as weights is likely to be even
larger for the direct method.
Lastly, the above discussion on the BET surface area determina-
tion is based on the third isotherm measurement of each of the
materials. For the various fitting strategies investigated the differ-
ences in specific surface area and 95% confidence interval deter-
mined from all three consecutive measurements on the same
sample are minor (See S-15), indicating the reproducibility of the
BET surface area determination procedure. Furthermore, based on
these repeated measurements, a ‘lack-of-fit’ test can be performed
to quantify how well the BET-model can be fitted to describe
adsorption behaviour, in a similar fashion as for the estimation of kinetic reaction parameters from repeated experiments [26]. This
test (See S-18) indicates that the proposed fitting strategy signifi-
cantly improves the quality of the fit for the materials under
investigation.
3.4. Textural characterization in literature – the case of MIL-101
As mentioned in the introduction, the large number of publica-
tions on MIL-101 calls for an investigation of the variation in
reported pore volumes and surface areas [11,12,40–66]. Fig. 1
showed the scatter in BET surface area as function of the pore vol-
umes reported in literature, whereas a clear correlation is expected
between these parameters. Less than half of the cited papers indi-
cated the relative pressure used for the pore volume determination
and more than half of these used a relative pressure very close to
unity. At high relative pressures (( p/ po) > 0.9) condensation of
nitrogen in inter-particle spaces may occur, and this contribution
should clearly not be included in the pore volume. The extent of
this depends on the particle size of the material. Therefore the pore
volumes from the isotherm data available in literature are recalcu-
lated at a fixed relative pressure, ( p/ po) 0.4. This might be an
unusual low relative pressure, but the MIL-101 structure should
already be saturated at this pressure, and the uncertainty in pore
volume is lower (see Fig. 2). Furthermore, the adsorption isotherms
all overlap once rescaled with their pore volume (Fig. S 37), except
for one or two samples with purposely defect-induced mesoporos-
ity. Comparing this recalculated pore volume with the originally
reported value (see Fig. S 36), shows that the literature value is sig-
nificantly higher in most cases. This is not caused by the low rela-
tive pressure chosen, since the pore volume at this relative
pressure is at most 5% lower than the one calculated at the more
often used ( p/ po) 0.9 for the majority of cases (Fig. S 37). Clearly,
care must be taken when drawing conclusions based on reported
pore volumes in literature. When it comes to the BET surface area,
for less than one third of the values reported in literature the range
of relative pressures or degrees of freedom used for its determina-
tion were stated. Furthermore, BET areas were frequently reportedwith up to six significant digits, suggesting an accuracy that, in
view of the findings in this work, is highly exaggerated (see
Table 2). For the cited literature sources the BET surface area is
redetermined using the linear, direct and weighted direct method.
In all cases the maximum degrees of freedom available for ( p/
po) < 0.3 were used. This because, due to the particular shape of
MIL-101, there is no clear statistically valid reason to eliminate
data points, as discussed above. Moreover, using the maximum
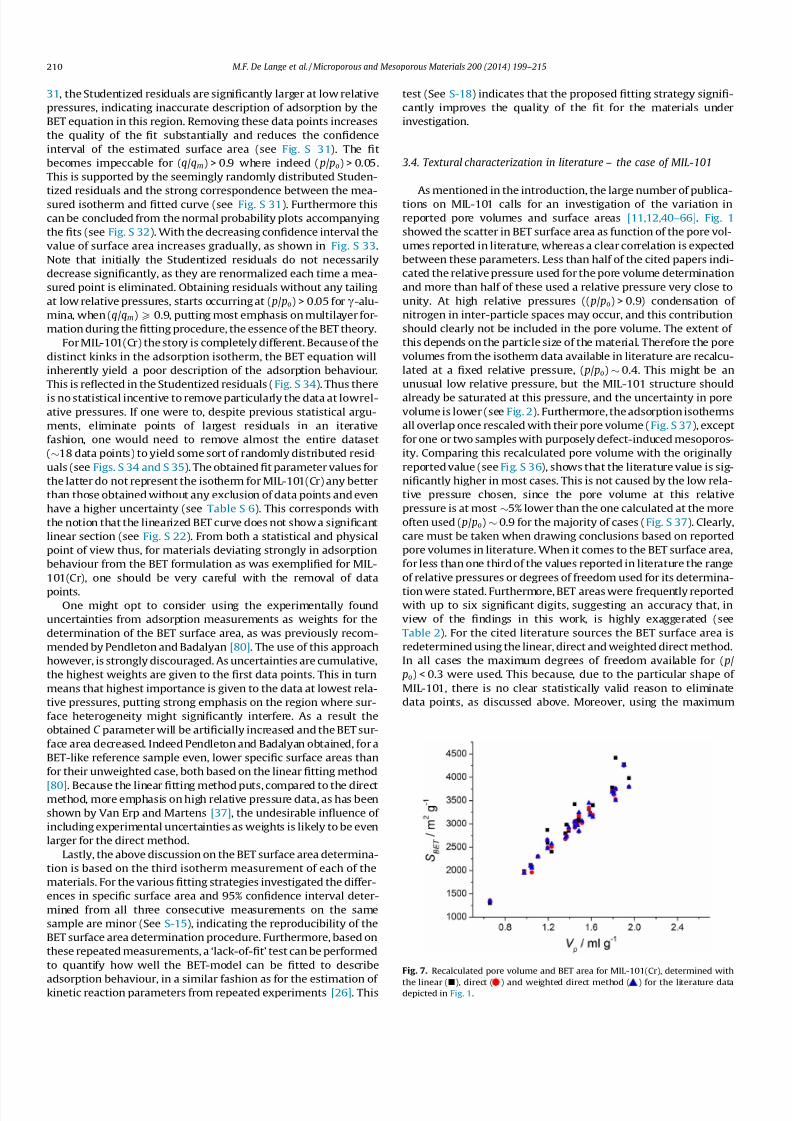
Fig. 7. Recalculated pore volume and BET area for MIL-101(Cr), determined with
the linear (j), direct ( ) and weighted direct method ( ) for the literature datadepicted in Fig. 1.
210 M.F. De Lange et al. / Microporous and Mesoporous Materials 200 (2014) 199–215
7/27/2019 Adsorptive characterization of porous solids Error analysis guides the way.pdf
http://slidepdf.com/reader/full/adsorptive-characterization-of-porous-solids-error-analysis-guides-the-waypdf 13/17
degrees of freedom will decrease uncertainty. Comparison of the
original and recalculated BET areas, Fig. S 38, shows again that lit-
erature values are exaggerated, albeit less pronounced than it was
the case for the pore volume. Depicting the recalculated surface
area as a function of the recalculated pore volume (Fig. 7) gives a
significantly stronger correlation than for the values reported in lit-
erature (Fig. 1). This example clearly shows the necessity of stan-
dardizing conditions for the determination of pore volume and
surface area. Furthermore, applying the direct fitting method
shows the highest correlation between surface area and pore vol-
ume (R2 of 0.96), and the least variability in BET surface area.
The weighted direct (R2 of 0.95) and linear method (R2 of 0.93) per-
form slightly worse. Hence to decrease variability of surface area
between different samples of the same compound, one should ide-
ally use the direct fitting method (nonlinear parameter
estimation).
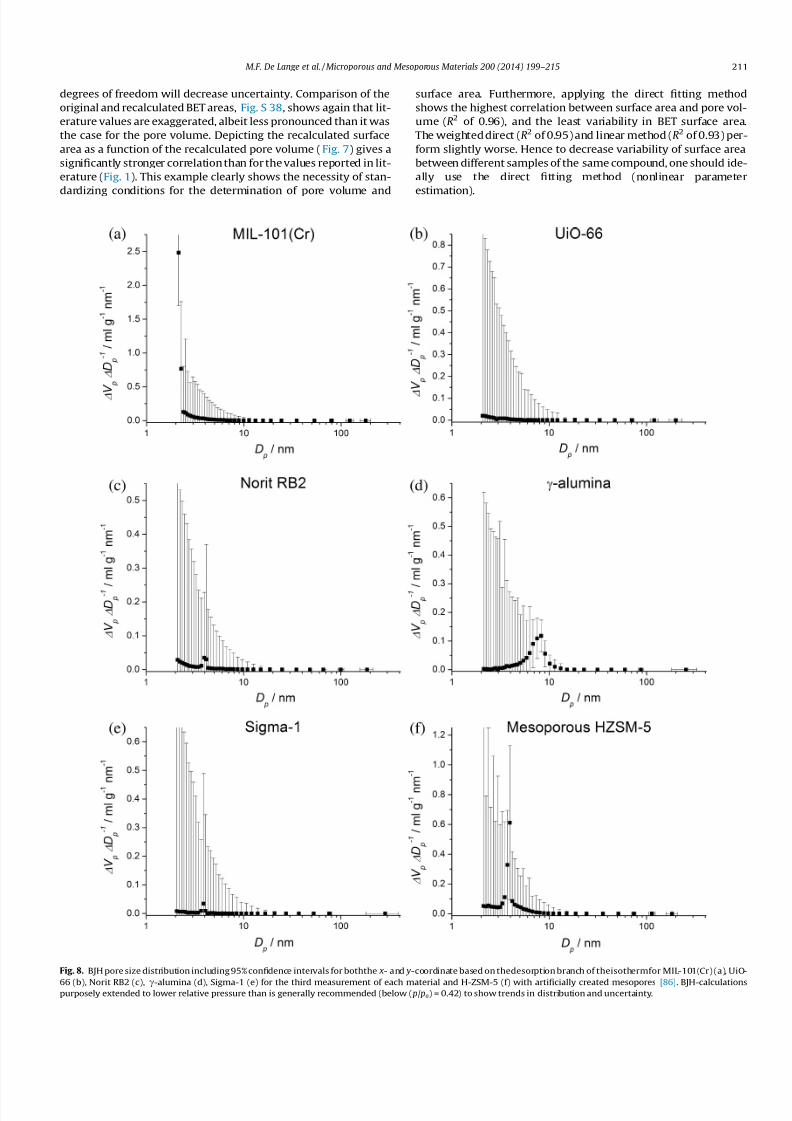
Fig. 8. BJH pore size distribution including 95% confidence intervals for boththe x- and y-coordinate based on thedesorption branch of theisothermfor MIL-101(Cr) (a), UiO-
66 (b), Norit RB2 (c), c-alumina (d), Sigma-1 (e) for the third measurement of each material and H-ZSM-5 (f) with artificially created mesopores [86]. BJH-calculationspurposely extended to lower relative pressure than is generally recommended (below ( p/ po) = 0.42) to show trends in distribution and uncertainty.
M.F. De Lange et al. / Microporous and Mesoporous Materials 200 (2014) 199–215 211
7/27/2019 Adsorptive characterization of porous solids Error analysis guides the way.pdf
http://slidepdf.com/reader/full/adsorptive-characterization-of-porous-solids-error-analysis-guides-the-waypdf 14/17
3.5. Uncertainty in BJH-pore size distribution
In Fig. 8, pore size distributions and their 95% confidence
intervals are given for the materials under investigation. As first
conclusion, the uncertainty in pore diameter ( x-axis) is negligibly
small for D p < 50 nm. Above this pore size, the confidence intervals
become significant, showing that indeed the BJH-method is not
suitable for macroporous materials. This is easily rationalized when
considering that relative pressures corresponding with larger pore
diameters are close to unity. The uncertainty in pore diameter is
roughly proportional to |ln1( p/ po)|, see Eqs. S-3.4–S-3.5 (S.I), and
thus greatly amplified at these relative pressures. Secondly, the
confidence interval for incremental pore volume per pore diameter
(DV p/DD p) is highest at smallest pore diameters. This is due to the
recursive nature of the BJH-calculation, which has its starting point
at high relative pressure, and thus large pore diameter, and ends at
smallest pore diameters. From Eq. S-3.15 (S.I), it becomes apparent
that the uncertainty for a given incremental pore volume is largely
influenced by the sum of uncertainties in surface areas of the pores
larger than the pore size for the data pointunder investigation. This
uncertainty is expressed in the pore volume and surface area asso-
ciated with this pore size, and cumulatively propagates towards
smaller pore diameters. As this accumulation will only become
apparent when pore volume and surface area are of significant
magnitude, removing from the calculation pores for which
D p > 200 nm will not generate an observable reduction in uncer-
tainty for smaller pore sizes. Even for the microporous materials
under investigation, UiO-66, Norit-RB2 and Sigma-1, that show
hardly or no mesopore volume, the uncertainty is significant.
Indeed, the BJH-method is not suited for the microporous region,
but these results are included to show that, also for low pore vol-
umes, the uncertainty is significant. In general the magnitude of
this uncertainty mitigates firm quantitative conclusions drawn
from pore size distributions. Even for the mesopore-containing
materials under investigation, the 95% confidence interval becomes
prohibitively large especially for small pore sizes. This occurs
already for D p > 3.4 nm, indicating also from the error analysis
perspective that the BJH-method, based on the desorption branch,
should not be used for ( p/ po) < 0.42. If one would desire to make
conclusions based on the pore size distribution quantitatively,
one would need to severely decrease the uncertainty therein.
This might be accomplished by increasing the sample amount and
by measuring significantly less points in the adsorption branch.
Furthermore, both Sigma-1 and Norit-RB2 show a small peak in
the pore size distribution around 3.8 nm, which is, as explained by
Groen et al. [39], due to the so called tensile strength effect (TSE). To
elaborate on this in particular, a sample of mesoporous zeolite H-
ZSM-5 showing distinct type-H2 hysteresis behaviour (IUPAC
classification) [2,3], obtained via desilication has been included
[86]. This because the TSE is particularly visible for this type of
hysteresis [4]. The forced closure of the desorption branch near
( p/ po) = 0.42 indicates the occurrence of this tensile strength effect
(TSE), and does not point to a well-defined mesopore size. The BJH
model applied to the adsorption branch demonstrates this (see
Fig. S 39), as the TSE phenomenon is absent. The TSE leads often
to misinterpretation of the pore size distribution: the peak
observed at around 4 nm in de BJH from the desorption branch
(Fig. 8), does not reflect the exact porous properties of the material,
but primarily the nature of the adsorptive N2. Still publications in
highly respected journals appear where the contribution of
the TSE is erroneously attributed to the presence of real pores
[87,88].
Because of the smaller uncertainty in the adsorbed quantities in
the adsorption branch, uncertainty in the pore volume is generally
smaller for similar pore sizes. Uncertainties become increasingly
large when D p < 2 nm, the border to the microporous region. Again
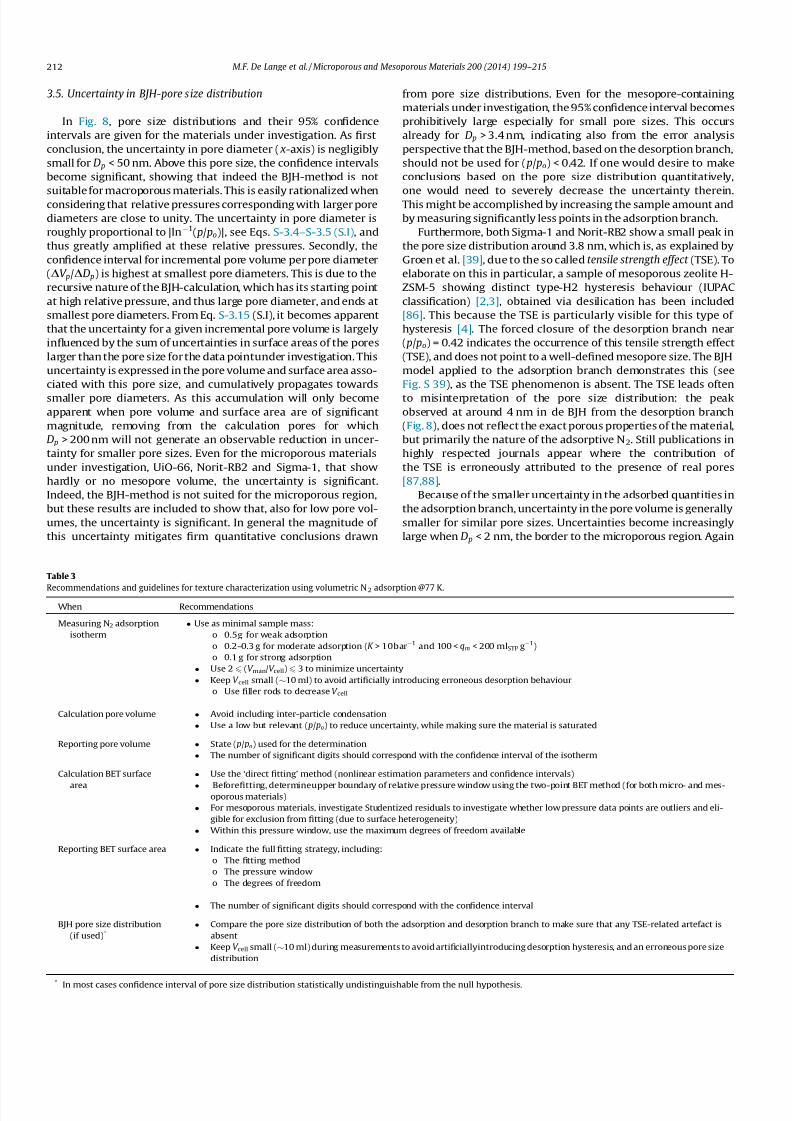
Table 3
Recommendations and guidelines for texture characterization using volumetric N 2 adsorption @77 K.
When Recommendations
Measuring N2 adsorption
isotherm
Use as minimal sample mass:
o 0.5g for weak adsorption
o 0.2–0.3 g for moderate adsorption (K > 10bar1 and 100 < qm < 200 mlSTP g1)
o 0.1 g for strong adsorption
Use 2 6 (V man/V cell) 6 3 to minimize uncertainty
Keep V cell small (10 ml) to avoid artificially introducing erroneous desorption behaviour
o Use filler rods to decrease V cell
Calculation pore volume Avoid including inter-particle condensation
Use a low but relevant ( p/ po) to reduce uncertainty, while making sure the material is saturated
Reporting pore volume State ( p/ po) used for the determination
The number of significant digits should correspond with the confidence interval of the isotherm
Calculation BET surface
area
Use the ‘direct fitting’ method (nonlinear estimation parameters and confidence intervals)
Beforefitting, determineupper boundary of relative pressure window using the two-point BET method (for both micro- and mes-oporous materials)
For mesoporous materials, investigate Studentized residuals to investigate whether low pressure data points are outliers and eli-
gible for exclusion from fitting (due to surface heterogeneity)
Within this pressure window, use the maximum degrees of freedom available
Reporting BET surface area Indicate the full fitting strategy, including:
o The fitting method
o The pressure window
o The degrees of freedom
The number of significant digits should correspond with the confidence interval
BJH pore size distribution
(if used)* Compare the pore size distribution of both the adsorption and desorption branch to make sure that any TSE-related artefact is
absent
Keep V cell small (10 ml) during measurements to avoid artificiallyintroducing desorption hysteresis, and an erroneous pore size
distribution
*In most cases confidence interval of pore size distribution statistically undistinguishable from the null hypothesis.
212 M.F. De Lange et al. / Microporous and Mesoporous Materials 200 (2014) 199–215

7/27/2019 Adsorptive characterization of porous solids Error analysis guides the way.pdf
http://slidepdf.com/reader/full/adsorptive-characterization-of-porous-solids-error-analysis-guides-the-waypdf 15/17
the cumulative nature of the BJH-method is demonstrated. Note
that it is strictly not advocated here to apply the BJH-method to
the adsorption branch of an isotherm, unless it is used to verify
the existence of a tensile strength effect related artefact.
As noted before, desorption hysteresis can be artificially
increased by decreasing sample mass and by increasing sample cell
volume. This artefact has a significant effect on the BJH pore size
distribution, when based on the desorption branch (see Fig. S
14). With increasing sample cell volume and decreasing sample
mass, a strong increase in scatter of the pore size distribution is
created. More importantly, the contribution of smaller mesopores
is erroneously enhanced. This adverse effect can increase the vol-
ume contribution of pores with 3.4 nm 6 D p 6 6 nm up to 5 times
(S-8, S.I). As an overall conclusion of the error analysis the BJH
analysis yield statistically insignificant quantitative information.
At most a qualitative impression of a pore size distribution is
obtained.
3.6. Recommendations for adsorptive characterization
To optimize the N2 adsorption methodology for the character-
ization of porous materials and to improve the data analysis, the
findings of the error analysis are summarized below in detail and
have resulted in recommendations and guidelines collected in
Table 3.
Regarding uncertainty in adsorption measurements:
Uncertainty propagates cumulatively, and is lowest for the first
point of the adsorption branch and highest for the last point
measured in the desorption branch. The 95% confidence interval
in the adsorption isotherms found are below ±10 mlSTP g1 for
adsorption and below ±20 mlSTP g1 for desorption.
Uncertainty can be decreased by increasing the accuracy of the
pressure measurements, the calibration of the manifold volume,
by optimizing ratio of manifold and cell volume and by increas-
ing sample mass.
A large sample cell volume and/or small sample mass can arti-ficially and erroneously enlarge or introduce hysteresis between
ad- and desorption because of reduced sensitivity to determine
equilibration.
For the determination of pore volume:
The relative confidence interval in pore volume can be as large
as ±10% (( p/ po) = 0.9, Sigma-1), for the measurements per-
formed. To reduce the relative confidence interval in pore vol-
ume (( p/ po) = 0.9) to below ±5%, one should use:
o More than 0.5 g for weakly adsorbing materials (low qm
and K ).
o Around 0.2–0.3 g for moderately adsorbing materials
(K > 10 bar1 and 100 < qm < 200 mlSTP g1).
o Less than 0.1 g for strongly adsorbing materials.
For microporous materials, it is recommended to determine the
pore volume at relative pressures lower than 0.9. This decreases
the uncertainty in pore volume without influencing signifi-
cantly the absolute value found and automatically ignores
inter-particle condensation.
The relative uncertainty in pore volume is lowest when
(V man/V cell) is between 2 and 3.
When it comes to determination of BET area:
The obtained BET surface area and confidence interval are
strongly dependent on applied fitting strategy:
o The difference in maximum and minimum estimated BET
surface areas from a single isotherm (‘variability’) is lim-
ited to 20–40% if more than ten degrees of freedom are
used. If less degrees are used this can increase up to
400%.
o Variability is lowest for the ‘direct method’ (nonlinear
parameter estimation) and highest for the ‘linear method’,
attributed to the higher emphasis on points close to satu-
ration for the latter.
o To obtain a small uncertainty in BET surface area, one
should at least use three degrees of freedom (at least 5
data points) regardless of fitting strategy.
o The confidence intervals of the BET parameters from the
‘direct method’ are generally slightly smaller than those
obtained from the ‘linear method’.
Because of the strong influence of fitting strategy on BET surface
area and uncertainty therein it is strongly recommended to
report the pressure window, degrees of freedom and fitting
method applied alongside the obtained BET surface area.
For microporous materials, it is proposed to exclude data points
close to saturation, as the BET equation is unfit to describe
saturation.
o By not adhering to this, one might obtain:
j Negative values for the BET C parameter when apply-
ing the ‘linear method’ and thus unphysical results.
j Strongly enlarged uncertainties because of insensi-
tivity towards C when using the ‘direct method’.
j Lower values for the BET surface area for both fitting
methods.
o By adhering to this, one would obtain:
j A significant reduction in uncertainty in obtained
parameters.
j A significant reduction in variability.
The contrived two-point BET method is a useful tool to deter-
mine a priori the upper relative pressure boundary of the BET
window (close to saturation), an alternative to the method
reported by Rouquerol et al. [33]).
For mesoporous materials, it is recommended to replace the
upper boundary of the relative pressure window (( p/ po) 6 0.35
as posed by Brunauer et al. [34], o r ( p/ po) 6 0.30 by IUPAC
[2,3]) with the relative pressure where the C parameter calcu-
lated with the two-point method becomes negative.
No method was obtained to a priori exclude data for the lowrel-
ative pressure range where surface heterogeneity may interfere
strongly for mesoporous materials especially.
o Here it is suggested to use Studentized residuals, resis. Pro-vided the model isotherm is correct, data points become
eligible for possible exclusion when |resis| > 2–3.
3.7. Uncertainty in BJH-pore size distribution
The magnitude of the 95% confidence found for BJH-pore size
distributions severely impedes drawing quantitative
conclusions.
The artificially increased or introduced desorption hysteresis by
unfit experimental operation (low sample weight and large
sample volume) has a detrimental effect on the desorption
branch based BJH pore size analysis.
M.F. De Lange et al. / Microporous and Mesoporous Materials 200 (2014) 199–215 213
7/27/2019 Adsorptive characterization of porous solids Error analysis guides the way.pdf
http://slidepdf.com/reader/full/adsorptive-characterization-of-porous-solids-error-analysis-guides-the-waypdf 16/17
Still the tensile-strength-effect (TSE) related artefact in desorp-
tion-branch related pore-size distributions is often overlooked,
yielding erroneous conclusions on seemingly inherent material
properties.
o By comparing the pore-size distribution of the ad- and
desorption branch one can easily spot the presence of this
artefact.
Regarding interpretation and reporting of results human influences
have a strong impact, as exemplified by the case of MIL-101(Cr).
Less than half of the cited papers indicate the relative pressure
used for the pore volume determination for MIL-101 and of
those that did, more than half erroneously overlooked inter-
particle condensation and overestimated the pore volume
significantly.
Less than one third of reported BET surface areas in literature
were accompanied by the relative pressure window and/or
degrees of freedom used for their determination.
BET areas are reported with a highly exaggerated number of
insignificant digits.
Depicting the recalculated surface area as function of the recal-
culated pore volume gives a significantly better correlation
between both than was the case for the values reported in liter-
ature, and clearly underlines the potential of standardizing con-
ditions for the determination of pore volume and surface area.
Finally, it is realized that the use of nitrogen for this type of adsorp-
tive characterization is under discussion and argon adsorption at
liquid argon temperature (87 K) may be preferred as it is slightly
smaller and has no quadrupole moment unlike nitrogen [89,90].
However the costs of liquid argon are higher and nitrogen is still
deeply penetrated in daily texture characterization, making that
the presented analysis is nevertheless of high relevance.
4. Conclusions
In this contribution the influence of uncertainty in adsorptive
characterization of porous solids, with special emphasis on the
adsorption isotherm measurements and on the determination of
pore volume, BET area and pore size distribution has been studied.
Uncertainty in adsorption measurements can be decreased not only
by increasing measuring accuracy or sample mass, but also by
optimizing the ratio of manifold and cell volume (optimum at
V man/V cell is 2–3). Further, a large sample cell volume and/or small
sample mass can artificially and erroneously enlarge or even intro-
duce artificially apparent hysteresis between ad- and desorption.
To reduce the relative uncertainty in the determination of pore
volume for microporous materials it is beneficial to determine the
pore volume at relative pressures lower than 0.9. When it comes todetermination of BET area, obtained surface areas and confidence
intervals are strongly dependent on applied fitting strategy. To
obtain a small uncertainty in BET surface area, one should at least
use three degrees of freedom (at least 5 data points) and apply the
direct (nonlinear) fitting method. Excluding data points close to
saturation, results in reduction in uncertainty and variability. The
contrived two-point BET method is a useful tool to determine a
priori the upper relative pressure boundary of the BET window.
For mesoporous materials, it is recommended to use the same
upper boundary. No method was obtained to a priori exclude data
for the low relative pressure range where surface heterogeneity
may interfere strongly but it is suggested to use Studentized
residuals for to help locate this boundary.
The magnitude of the 95% confidence limits for BJH-pore sizedistributions severely impedes drawing quantitative conclusions.
The artificially increased desorption hysteresis by unfit experimen-
tation has a detrimental effect on the desorption branch based BJH
pore size analysis. Regarding interpretation and reporting of
results human influences have a strong impact, as exemplified by
the case of MIL-101(Cr ). For pore volumes and especially BET sur-
face areas reported in literature, often the relative pressure (win-
dow) used and determination strategy are not reported or plainly
wrong. Using the guidelines posed in this work for the determina-
tion of both parameters, a significantly better correlation between
both was obtained than was the case for the original values
reported in literature.
Notes
The authors declare no competing financial interest.
Acknowledgments
Financial support from the Advanced Dutch Energy Materials
(ADEM) program of the Dutch Ministry of Economic Affairs,
Agriculture and Innovation is gratefully acknowledged. Canan
Gücüyener is gratefully acknowledged for the synthesis of Sigma-1.
Appendix A. Supplementary data
Supplementary data associated with this article can be found, in
the online version, at http://dx.doi.org/10.1016/j.micromeso.2014.
08.048.
References
[1] F. Rouquerol, J. Rouquerol, K. Sing, Adsorption by Powders & Porous Solids,
Academic Press, London, 1999.
[2] K. Sing, D. Everett, R. Haul, L. Moscou, R. Pierotti, J. Rouquerol, T.
Siemieniewska, Pure Appl. Chem. 54 (1982) 2201.
[3] R. Pierotti, J. Rouquerol, Pure Appl. Chem. 57 (1985) 603–619.
[4] F. Schüth, K.S.W. Sing, J. Weitkamp, Handbook of Porous Solids, Wiley-VCH,
2002.
[5] J.-R. Li, R.J. Kuppler, H.-C. Zhou, Chem. Soc. Rev. 38 (2009) 1477–1504 .
[6] S. Couck, J.F.M. Denayer, G.V. Baron, T. Rémy, J. Gascon, F. Kapteijn, J. Am.
Chem. Soc. 131 (2009) 6326–6327.
[7] C. Gücüyener, J. van den Bergh, J. Gascon, F. Kapteijn, J. Am. Chem. Soc. 132
(2010) 17704–17706.
[8] L.J. Murray, M. Dinca, J.R. Long, Chem. Soc. Rev. 38 (2009) 1294–1314.
[9] J. Juan-Alcaniz, J. Gascon, F. Kapteijn, J. Mater. Chem. 22 (2012) 10102–10118.
[10] J. Gascon, U. Aktay, M.D. Hernandez-Alonso, G.P.M. van Klink, F. Kapteijn, J.
Catal. 261 (2009) 75–87.
[11] G. Férey, C. Mellot-Draznieks, C. Serre, F. Millange, J. Dutour, S. Surblé, I.
Margiolaki, Science 309 (2005) 2040–2042.
[12] G. Akiyama, R. Matsuda, H. Sato, A. Hori, M. Takata, S. Kitagawa, Microporous
Mesoporous Mater. 157 (2012) 89–93.
[13] J. Juan-Alcañiz, E.V. Ramos-Fernandez, U. Lafont, J. Gascon, F. Kapteijn, J. Catal.
269 (2010) 229–241.
[14] E.V. Ramos-Fernandez, C. Pieters, B. van der Linden, J. Juan-Alcaniz, P. Serra-
Crespo, M.W.G.M. Verhoeven, H. Niemantsverdriet, J. Gascon, F. Kapteijn, J.
Catal. 289 (2012) 42–52.[15] S.N. Klyamkin, E.A. Berdonosova, E.V. Kogan, K.A. Kovalenko, D.N. Dybtsev, V.P.
Fedin, Chem. Asian J. 6 (2011) 1854–1859.
[16] D. Jiang, L.L. Keenan, A.D. Burrows, K.J. Edler, Chem. Commun. 48 (2012)
12053–12055.
[17] C.-X. Yang, X.-P. Yan, Anal. Chem. 83 (2011) 7144–7150.
[18] J.H. Cavka, S. Jakobsen, U. Olsbye, N. Guillou, C. Lamberti, S. Bordiga, K.P.
Lillerud, J. Am. Chem. Soc. 130 (2008) 13850–13851.
[19] H. Wu, T. Yildirim, W. Zhou, J. Phys. Chem. Lett. 4 (2013) 925–930 .
[20] S. Chavan, J.G. Vitillo, D. Gianolio, O. Zavorotynska, B. Civalleri, S. Jakobsen,
M.H. Nilsen, L. Valenzano, C. Lamberti, K.P. Lillerud, S. Bordiga, Phys. Chem.
Chem. Phys. 14 (2012) 1614–1626.
[21] A.D. Wiersum, E. Soubeyrand-Lenoir, Q. Yang, B. Moulin, V. Guillerm, M.B.
Yahia,S. Bourrelly, A. Vimont, S. Miller, C. Vagner, M. Daturi, G. Clet, C. Serre, G.
Maurin, P.L. Llewellyn, Chem. Asian J. 6 (2011) 3270–3280.
[22] F. Vermoortele, B. Bueken, G. Le Bars, B. Van de Voorde, M. Vandichel, K.
Houthoofd, A. Vimont, M. Daturi, M. Waroquier, V. Van Speybroeck, J. Am.
Chem. Soc. 135 (2013) 11465–11468.
[23] Y. Iwase, Y. Sakamoto, A. Shiga, A. Miyaji, K. Motokura, T.-R. Koyama, T. Baba, J.
Phys. Chem. C 116 (2012) 5182–5196.[24] H.-Y. Jeon, C.-H. Shin, H.J. Jung, S.B. Hong, Appl. Catal. A 305 (2006) 70–78.
214 M.F. De Lange et al. / Microporous and Mesoporous Materials 200 (2014) 199–215
7/27/2019 Adsorptive characterization of porous solids Error analysis guides the way.pdf
http://slidepdf.com/reader/full/adsorptive-characterization-of-porous-solids-error-analysis-guides-the-waypdf 17/17
[25] Y. Kumita, J. Gascon, E. Stavitski, J.A. Moulijn, F. Kapteijn, Appl. Catal. A 391
(2011) 234–243.
[26] F. Kapteijn,H.L. Bredt, E. Homburg, J.C. Mol, Ind. Eng. Chem. Prod. Res. Develop.
20 (1981) 457–466.
[27] F. Kapteijn, L. Singoredjo, N.J. Dekker, J.A. Moulijn, Ind. Eng. Chem. Res. 32
(1993) 445–452.
[28] L. Zhou, Y. Guo, Q. Zhang, M. Yagi, J. Hatakeyama, H. Li, J. Chen, M. Sakurai, H.
Kameyama, Appl. Catal. A 347 (2008) 200–207.
[29] S. Sircar, T. Golden, M. Rao, Carbon 34 (1996) 1–12 .
[30] D. Lozano-Castello, J. Alcaniz-Monge, D. Cazorla-Amoros, A. Linares-Solano, W.
Zhu, F. Kapteijn, J. Moulijn, Carbon 43 (2005) 1643–1651.[31] C.Y. Yin, M.K. Aroua, W.M.A.W. Daud, Sep. Purif. Technol. 52 (2007) 403–415.
[32] A.R. Millward, O.M. Yaghi, J. Am. Chem. Soc. 127 (2005) 17998–17999 .
[33] J. Rouquerol, P. Llewellyn, F. Rouquerol, Is the BET equation applicable to
microporous adsorbents?, in: F.R.-R.J.R. P.L. Llewellyn, N. Seaton (Eds.) Studies
in Surface Science and Catalysis, Elsevier, 2007, pp. 49–56.
[34] S. Brunauer, P.H. Emmett, E. Teller, J. Am. Chem. Soc. 60 (1938) 309–319.
[35] I. Langmuir, J. Am. Chem. Soc. 38 (1916) 2221–2295.
[36] K.S. Walton, R.Q. Snurr, J. Am. Chem. Soc. 129 (2007) 8552–8556.
[37] T.S. Van Erp, J.A. Martens, Microporous Mesoporous Mater. 145 (2011) 188–
193.
[38] E.P. Barrett, L.G. Joyner, P.P. Halenda, J. Am. Chem. Soc. 73 (1951) 373–380 .
[39] J.C. Groen, L.A. Peffer, Microporous Mesoporous Mater. 60 (2003) 1–17.
[40] P. Trens, H. Belarbi, C. Shepherd, P. Gonzalez, N.A. Ramsahye, U.H. Lee, Y.K. Seo,
J.S. Chang, J. Phys. Chem. C 116 (2012) 25824–25831.
[41] X. Liu, H. Zhou, Y. Zhang, Y. Liu, A. Yuan, Chin. J. Chem. 30 (2012) 2563–2566 .
[42] K. Munusamy, G. Sethia, D.V. Patil, P.B. Somayajulu, Chem. Eng. J. 195–196
(2012) 359–368.
[43] I. Senkovska, E. Barea, J.A.R. Navarro, S. Kaskel, Microporous Mesoporous
Mater. 156 (2012) 115–120.
[44] S.N. Kim, S.T. Yang, J. Kim, J.E. Park, W.S. Ahn, CrystEngComm 14 (2012) 4142–
4147.
[45] M. Anbia, V. Hoseini, Chem. Eng. J. 191 (2012) 326–330.
[46] M. Anbia, V. Hoseini, J. Nat. Gas Chem. 21 (2012) 339–343.
[47] L. Bromberg, Y. Diao, H. Wu, S.A. Speakman, T.A. Hatton, Chem. Mater. 24
(2012) 1664–1675.
[48] H.B.T. Jeazet, C. Staudt, C. Janiak, Chem. Commun. 48 (2012) 2140–2142 .
[49] Z. Saedi, S. Tangestaninejad, M. Moghadam, V. Mirkhani, I. Mohammadpoor-
Baltork, Catal. Commun. 17 (2012) 18–22.
[50] J. Ehrenmann, S.K. Henninger, C. Janiak, Eur. J. Inorg. Chem. 2011 (2011) 471–
474.
[51] Z. Zhao, X. Li, S. Huang, Q. Xia, Z. Li, Ind. Eng. Chem. Res. 50 (2011) 2254–2261.
[52] Z. Zhao, X. Li, Z. Li, Chem. Eng. J. 173 (2011) 150–157 .
[53] Z. Zhang, S. Huang, S. Xian, H. Xi, Z. Li, Energy Fuels 25 (2011) 835–842.
[54] C.Y. Huang, M. Song, Z.Y. Gu, H.F. Wang, X.P. Yan, Environ. Sci. Technol. 45
(2011) 4490–4496.
[55] J. Shi, Z. Zhao, Q. Xia, Y. Li, Z. Li, J. Chem. Eng. Data 56 (2011) 3419–3425.
[56] P.B. Somayajulu Rallapalli, M.C. Raj, D.V. Patil, K.P. Prasanth, R.S. Somani, H.C.Bajaj, Int. J. Energy Res. 37 (2013) 746–753.
[57] K. Yang, Q. Sun, F. Xue, D. Lin, J. Hazard. Mater. 195 (2011) 124–131.
[58] D. Jiang, A.D. Burrows, K.J. Edler, CrystEngComm 13 (2011) 6916–6919.
[59] N.A. Khan, J.W. Jun, S.H. Jhung, Eur. J. Inorg. Chem. (2010) 1043–1048.
[60] N. Klein, A. Henschel, S. Kaskel, Microporous Mesoporous Mater. 129 (2010)
238–242.
[61] J. Yang, Q. Zhao, J. Li, J. Dong,Microporous Mesoporous Mater. 130 (2010) 174–
179.
[62] T.K. Trung, N.A. Ramsahye, P. Trens, N. Tanchoux, C. Serre, F. Fajula, G. Férey,
Microporous Mesoporous Mater. 134 (2010) 134–140.
[63] P. Küsgens, M. Rose, I. Senkovska, H. Fröde, A. Henschel, S. Siegle, S. Kaskel,
Microporous Mesoporous Mater. 120 (2009) 325–330.
[64] J.S. Lee, S.H. Jhung, J.W. Yoon, Y.K. Hwang, J.S. Chang, J. Ind. Eng. Chem. 15
(2009) 674–676.
[65] S.H. Jhung, J.H. Lee, J.W. Yoon, C. Serre, G. Férey, J.S. Chang, Adv. Mater. 19(2007) 121–124.
[66] X.X. Huang, L.G. Qiu, W. Zhang, Y.P. Yuan, X. Jiang, A.J. Xie, Y.H. Shen, J.F. Zhu,
CrystEngComm 14 (2012) 1613–1617.
[67] A. Stewart, Zeolite sigma-1, in: United Kingdom Patent Application, 1988.
[68] S.J. Gregg, K.S.W. Sing, Adsorption, Surface Area and Porosity, Academic Press,
London, 1982.
[69] P.H. Emmett, S. Brunauer, J. Am. Chem. Soc. 59 (1937) 1553–1564 .
[70] A.L. McClellan, H.F. Harnsberger, J. Colloid Interface Sci. 23 (1967) 577–599 .
[71] T. Osmari, R. Gallon, M. Schwaab, E. Barbosa-Coutinho, J. Severo, J. Pinto,
Adsorpt. Sci. Technol. 31 (2013) 433–458.
[72] H. Lineweaver, D. Burk, J. Am. Chem. Soc. 56 (1934) 658–666.
[73] O.A. Hougen, K.M. Watson, Chemical Process Principles, Wiley, New York,
1947.
[74] G.F. Froment, K.B. Bischoff, Chemical Reactor Analysis and Design, 2nd ed.,
Wiley, New York, 1991.
[75] C.G. Shull, J. Am. Chem. Soc. 70 (1948) 1405–1410.
[76] J.H. de Boer, B.C. Lippens, B.G. Linsen, J.C.P. Broekhoff, A. van den Heuvel, T.J.
Osinga, J. Colloid Interface Sci. 21 (1966) 405–414.
[77] W.D. Harkins, G. Jura, J. Chem. Phys. 11 (1943) 431–432.
[78] M. Kruk, M. Jaroniec, A. Sayari, Langmuir 13 (1997) 6267–6273.
[79] J.R. Taylor, An Introduction to Error Analysis, 2nd ed., University Science Books,
1997.
[80] A. Badalyan, P. Pendleton, Langmuir 19 (2003) 7919–7928.
[81] P. Pendleton, A. Badalyan, Colloids Surf. A 300 (2007) 253–258.
[82] A. Badalyan, P. Pendleton, J. Colloid Interface Sci. 326 (2008) 1–7 .
[83] T. Keii, T. Takagi, S. Kanetaka, Anal. Chem. 33 (1961) 1965 .
[84] F. Salvador, C. Sánchez-Jiménez, M.J. Sánchez-Montero, A. Salvador, A review
of the application of the BET equation to experimental data: the C parameter,
in: B.M.J.R. F. Rodriguez-Reinoso, K. Unger (Eds.) Studies in Surface Science and
Catalysis, Elsevier, 2002, pp. 379–386.
[85] R.D. Cook, S. Weisberg, Residuals and Influence in Regression, Chapman and
Hall, New York, 1982.
[86] S. Sartipi, K. Parashar, M. Makkee, J. Gascon, F. Kapteijn, Catal. Sci. Technol. 3
(2013) 572–575.
[87] L.G. Qiu, T. Xu, Z.Q. Li, W. Wang, Y. Wu, X. Jiang, X.Y. Tian, L.D. Zhang, Angew.
Chem. Int. Ed. 47 (2008) 9487–9491.
[88] L. Li, S. Xiang, S. Cao, J. Zhang, G. Ouyang, L. Chen, C.-Y. Su, Nat. Commun. 4(2013) 1774.
[89] M. Thommes, Chem.-Ing.-Tech. 82 (2010) 1059–1073.
[90] J. Silvestre-Albero, A. Silvestre-Albero, F. Rodríguez-Reinoso, M. Thommes,
Carbon 50 (2012) 3128–3133.
M.F. De Lange et al. / Microporous and Mesoporous Materials 200 (2014) 199–215 215