Embed Size (px)
Citation preview

ORIGINAL PAPER
Adsorptive removal of cationic and anionic dyes from aqueoussolution by utilizing almond shell as bioadsorbent
Rim Ben Arfi1 • Sarra Karoui1 • Karine Mougin2 • Achraf Ghorbal1,3
Received: 23 January 2017 / Accepted: 7 August 2017 / Published online: 21 August 2017
� Springer International Publishing AG 2017
Abstract Almond shell is a food waste that is utilized as
bioadsorbent for the uptake of Eriochrome Black T (EBT)
and Malachite Green (MG) dyes from aqueous solutions.
The biomaterial was characterized by specific surface area
(BET), scanning electron microscopy, Fourier transform
infrared spectroscopy (FTIR), thermogravimetric analysis,
and X-ray diffraction. The effects of the initial pH of
solutions, particle size, adsorbent dosage, initial dye con-
centration, contact time, and temperature on the EBT and
MG adsorption were studied using batch contact mode at
22 �C. Rapid sorption dynamics following a second-order
kinetic model were shown by kinetic studies. The adsorp-
tion equilibrium data were fitted well to the Freundlich
isotherm for EBT and MG as anionic and cationic dyes,
respectively. The adsorption of pollutants was exothermic
(DH0 = -1.7 kJ mol-1 for EBT and -32 kJ mol-1 for
MG). The reaction was accompanied by a decrease in
entropy (DS0\ 0 for EBT and MG). Negative values of
DG0 showed the spontaneity of the MG adsorption process.
However, positive values of DG0 showed that the EBT
uptake by almond shell is not a spontaneous reaction. The
results indicate that almond shell is a promising alternative
for the biosorption of anionic (EBT) and cationic (MG)
dyes from aqueous solutions.
Keywords Almond shell � Eriochrome Black T �Malachite Green � Adsorption � Kinetics � Thermodynamics
Introduction
During the past decades, dyes have substantially ravaged
aquatic environments and human health. Indeed, approxi-
mately 15% of the total dyestuff (over 7 9 105 tons is pro-
duced worldwide annually) is lost during the dyeing process
in different textile industries and comes out with their waste
water (Dutta et al. 2014). Therefore, effective removal of
hazardous dyes from polluted water has become a critical
point to be resolved. A number of techniques have been
adopted to remove dyes, such as chemical precipitation,
aerobic and anaerobic microbial degradation, ion exchange,
membrane separation, electrochemical treatment, floccula-
tion, reverse osmosis, and adsorption (Li et al. 2015b, 2016).
In comparison with other techniques, adsorption could be
considered as an effective, attractive, and promising process
owing to its ease of operation, simplicity, suitability to treat
concentrated dye wastes, selectivity, wide-ranging avail-
ability, and inexpensive nature (Li et al. 2015a).
In recent years, many adsorbents prepared on the basis of
agriculturalwastes andby-products suchas sugarcane bagasse
(Zhang et al. 2011), Luffa cylindrica fibers (Kesraoui et al.
2016), pineapple leaf (Rahmat et al. 2016), or sunflower seed
hull (Hameed 2008) have been reported and applied for the
removal of ionic and nonionic dye molecules from water.
In recent papers, the utilization of agricultural by-
products as bioadsorbents was widely discussed in terms of
Electronic supplementary material The online version of thisarticle (doi:10.1007/s41207-017-0032-y) contains supplementarymaterial, which is available to authorized users.
& Achraf Ghorbal
1 Research Unit UR11ES80, National Engineering School of
Gabes, University of Gabes, Gabes, Tunisia
2 Institute of Materials Science of Mulhouse, CNRS - UMR
7361, Mulhouse, France
3 Higher Institute of Applied Sciences and Technology of
Gabes, University of Gabes, Rue Omar ibn el Khattab,
6072 Gabes, Tunisia
123
Euro-Mediterr J Environ Integr (2017) 2:20
DOI 10.1007/s41207-017-0032-y

capacity of pollutant uptake, isotherm, and kinetic models
and thermodynamic aspects, revealing that the solution pH,
the nature of the dye, and the chemical composition of
adsorbents greatly affect the adsorption phenomenon
(Modenes et al. 2015).
Regarding the great diversity of cheap, environmentally
benign, and abundant agricultural by-products, other effi-
cacious bioadsorbents could be considered as interesting for
the uptake of hazardous pollutants from aqueous solutions.
So, even if agricultural wastes have no remarkable industrial
and commercial use, almond shell could be regarded as a
potential low-cost bioadsorbent (Maaloul et al. 2017). As per
the literature survey and to the best of our knowledge, not
enough work has been reported on the application of almond
shells as biosorbents in the uptake of anionic [Eriochrome
Black T (EBT)] and cationic [Malachite Green (MG)] dyes
(Senturk et al. 2010; Calero et al. 2013; Deniz 2013).
EBT and MG were chosen as model dyes because both
are hazardous, carcinogenic, and toxic. Indeed, it is well
known that EBT (sodium 1-[1-hydroxynaphthylazo]-6-ni-
tro-2-naphthol-4-sulfonate) is a typical mono-azo anionic
dye. EBT is widely used in the textile, paper, printing,
food, and pharmaceutical industries, as well as in research
laboratories. In addition, MG (4-{[4-(dimethy-
lamino)phenyl](phenyl)methylidene}-N,N-dimethylcyclo-
hexa-2,5-dien-1-iminium chloride) is one of the most
commonly used dyes for silk, paper, cotton, and leather
dyeing as well as for the production of paints, varnishes,
and printing inks. It is therefore of prime importance to
eliminate such toxic pollutants from industrial effluents
before they are discharged into the aquatic environment
(Gautam et al. 2015).
The purpose of this study was to evaluate the likelihood
of using milled Tunisian almond shell (TAS) as a low-cost
adsorbent of hazardous dyes. The selected dyes are com-
mon pollutants in the environment, but nevertheless they
are less studied compared to other dyes such as Methylene
Blue (Chairunnisa et al. 2016; Saghanejhad Tehrani and
Zare-Dorabei 2016) and Red Congo dyes (Dawood and Sen
2012; Mota et al. 2015). The physicochemical properties
and the composition of the prepared bioadsorbents were
studied with the help of characterization methods. In
addition, the adsorption isotherms, kinetics, and thermo-
dynamic parameters for the removal of EBT and MG dyes
by milled almond shells are also discussed.
Experimental
Materials
All solvents utilized in this work were of analytical grade
and commercially available. EBT and MG were purchased
from Panreac AppliChem and Loba Chemicals, respec-
tively, and used without additional purification. Chemical
structures and characteristics of EBT and MG are sum-
marized in Table 1. For the adsorption experiments, stock
solutions of dyes were prepared by dissolving appropriate
quantities of EBT and MG in 1000 mL of distilled water.
The working solutions were freshly prepared by diluting
stock solutions (1000 mg L-1). The pH of solutions was
adjusted to the desired values by adding either 0.1 M HCl
and/or NaOH.
Preparation of the bioadsorbent
Almond shells were supplied by a local farmer and origi-
nated from almond trees (Prunus dulcis) cultivated in the
region of Sfax (Tunisia). TAS were washed thoroughly
with running tap water, rinsed with distilled water, and then
crushed into small pieces. Crushed TAS were then air-dried
at room temperature (ca. 22 �C) for 24 h followed by an
oven drying at 55 �C until constant weight. They were then
milled in a Retsch SM100 mill (Retsch GmbH, Germany).
The TAS powder was sieved to obtain various size frac-
tions of less than 100, 100–200, 200–315, 315–400,
400–500, and greater than 500 lm using wire sieves with
aperture sizes of 0.1, 0.2, 0.315, 0.4, and 0.5 mm, respec-
tively. Biosorbents were stocked in a desiccator for further
use without any additional chemical or physical
modifications.
Analysis
Dye concentration was calculated using a PG T60 UV–Vis
spectrophotometer (PG Instruments Ltd., UK) at the max-
imum wavelength of each dye (529 nm for EBT and
616 nm for MG) based on the linear calibration curve
obtained by plotting absorbance toward EBT or MG con-
centration over the desired concentration range. The pH of
the solutions was measured by an Orion Star A211 pH
meter (Thermo Fisher Scientific, USA). The infrared
spectra were obtained by a Spectrum Two (PerkinElmer,
USA) spectrophotometer using a pyroelectric deuterated
glycine sulfate (DTGS) detector. An attenuated total
reflection (ATR) attachment with a diamond crystal was
used. Measurements were performed in the
450–4000 cm-1 wavenumber range with a resolution of
2 cm-1.
The chemical composition of TAS was determined
according to the methods of the Technical Association of
Pulp and Paper Industry (TAPPI). The amount of holo-
cellulose (cellulose ? hemicelluloses) of the TAS powder
was determined according to the titration method (TAPPI
T19m-54). The a-cellulose was separated from the holo-
cellulose by an alkali extraction using the TAPPI standard
20 Page 2 of 13 Euro-Mediterr J Environ Integr (2017) 2:20
123

method T203 om-88. The amount of lignin in the TAS
powder was quantified by reaction with sulfuric acid
according to the TAPPI T222 om-88 standard method.
Measurements were performed in triplicate.
Surface morphology observations of the bioadsorbents
were performed using scanning electron microscopy
(SEM) employing an XL30 device (Philips Co., Nether-
lands) operated at a 15-kV accelerating potential. X-ray
diffraction (XRD) measurements were performed on an
X’Pert Pro X-ray diffractometer (PANalytical, Nether-
lands). The diffracted intensity of the Cu Ka radiation
(k = 0.154 nm, 45 kV, 40 mA) was evaluated in the
10–60� 2h range. The BET surface areas of biosorbents
were evaluated using an ASAP 2420 (Micrometrics
Instrument Corp., USA) surface area analyzer where the
utilized gaseous adsorbate was N2. Thermogravimetric
(TG) and derivative thermogravimetric (DTG) curves of
TAS were obtained by using a thermogravimetric analyzer
(TGA/DSC3?, Mettler Toledo, USA) under the following
experimental conditions: initial temperature 30 �C, final
temperature 900 �C, heating rate 10 �C min-1, and nitro-
gen flow rate 100 mL min-1.
The pHzpc of the bioadsorbent was obtained by the
powder addition method (Chan et al. 2016).
A 0.01 M NaCl solution was prepared, then the initial
pH was adjusted in the 2–12 range by adding either 0.1 N
HCl and/or NaOH. Fifty-milliliter aliquots of he prepared
0.01 M NaCl solutions were taken in 250-mL Erlenmeyer
flasks. Then, 0.2 g of the bioadsorbent was suspended in
each solution. The suspensions were left for 24 h, and the
final pH was then evaluated (Banerjee et al. 2016). The
point of zero charge (pHzpc) is the point where the
DpH (= pHfinal - pHinitial) is zero (Leng et al. 2015).
Batch biosorption experiments
The adsorption study of EBT and MG on the TAS powder
was performed by the batch equilibrium method. A prede-
termined amount of TAS (0.1 g) was suspended in 50 mL of
various concentrations of the biosorbent in a stoppered
100-mL flask and maintained under isothermal conditions at
320 rpm. Initial concentrations of TAS in the experimental
environment were adjusted to the desired values in the
0.1–12 g L-1 range. The adsorption study was performed at
22, 30, and 40 �C. The resultant solution was then cen-
trifuged (Z 32 HK, HERMLE Labortechnik, Germany) at
10,000 rpm for 5 min to extract the TAS powder from the
liquid phase. The concentration of EBT and MG in the
solution was evaluated spectrophotometrically at 529 and
616 nm, respectively, after an equilibrium time of 300 min.
The percentage of EBT and MG dyes removed was
computed using the Eq. 1:
Dye removal %ð Þ ¼ 100� C0 � Ceð Þ=C0: ð1Þ
The amount of dye uptake qe (mg dye per gram of
biosorbent) by the TAS was estimated by Eq. 2:
Table 1 Chemical structures
and some properties of EBT and
MG dyes used in this study
Dyestuff Eriochrome Black T (EBT) Malachite Green (MG)
IUPAC nameSodium 1-[1-Hydroxynaphthylazo]-6-nitro-2-naphthol-4-sulfonate
4-[(4-Dimethylaminophenyl)-phenyl-methyl]- N,N-dimethyl-aniline
C.I. number 14645 42000
Appearance Dark red/brown powder Green crystalline powder
Empirical formula C20H12N3NaO7S C23H25ClN2
Molecular weight (g mol−1) 461.38 364.91
Charges in aqueous solution Negative Positive
Molecular structure
λmax (nm) 529 616
Euro-Mediterr J Environ Integr (2017) 2:20 Page 3 of 13 20
123

qe ¼ C0 � Ceð ÞV=W ; ð2Þ
where C0 and Ce are respectively initial and equilibrium
dye concentration (mg L-1), V is the volume of the solu-
tion added (L), and W is the amount of almond shell
powder (g).
In experiments of batch kinetic biosorption, a predeter-
mined amount (0.5 g) of the bioadsorbent and 250 mL dye
solution (100 mg L-1) were placed in a stoppered 500-mL
conical flask and maintained at 22 ± 2 �C and under an
agitation rate of 320 rpm. At different time intervals, the
solution was separated from the bioadsorbent and con-
centrations of EBT and MG were determined spectropho-
tometrically at 529 and 616 nm, respectively. The amount
of the biosorbed dye, qt (mg g-1) at time t on the TAS, was
computed by Eq. 2 (Bhatt et al. 2012). All experiments
were carried out at least two times and mean values were
considered for the purpose of evaluation.
Error analysis
The validity of each model was analyzed by the coefficient
of determination (R2) and the Person’s Chi-square test (v2)(Eq. 3) as well as the normalized standard deviation Dq(Eq. 4):
v2 ¼ qe;exp � qe;cal� �2
=qe;cal ð3Þ
Dq %ð Þ ¼ 100
ffiffiffiffiffiffiffiffiffiffiffiffiffiffiffiffiffiffiffiffiffiffiffiffiffiffiffiffiffiffiffiffiffiffiffiffiffiffiffiffiffiffiffiffiffiffiffiffiffiffiffiffiffiffiffiffiffiffiffiffiffiffiffiffiffiffiffiffiffiffiffiffiXðqe;exp � qe;calÞ=qe;exp� �2
=ðN � 1Þq
;
ð4Þ
where qe,exp is the experimental value of biosorption
capacity (mg g-1), qe,cal is the calculated biosorption
capacity (mg g-1), and n is the number of measurements.
The best suitable model can be determined when the R2
value is equal to or near 1, whereas the Chi-square test (v2)and the normalized standard deviation (Dq) are as small as
possible.
Results and discussion
Characterization of the bioadsorbent
The functional groups responsible for the adsorption of
EBT and MG on the cell surfaces of adsorbent are studied
by FTIR spectrophotometry. The FTIR spectra of TAS,
EBT-loaded TAS, and MG-loaded TAS are shown in
Fig. 1. The spectrum of TAS before the dye sorption pro-
cesses (Fig. 1a) contains a series of peaks associated with
functional groups in the TAS lignocellulosic structure. A
characteristic broad band of stretching vibrations of C–H
and O–H groups in the 3650–3000 cm-1 range shows the
principal functional groups found in lignocellulosic mate-
rials. The FTIR spectrum of TAS shows a characteristic
peak at 1731 cm-1 from the C=O stretching of methyl ester
and carboxylate groups in pectin. This peak could be also
associated with the ester linkage of the lignin and hemi-
cellulose carboxylic group or hemicellulose acetyl and
uronic ester groups (Xiao et al. 2015). Peaks in the
wavenumber range from 1240 to 1450 cm-1 could be
attributed to TAS surface structures containing C–O–H, C–
O, and C–H bonds that are associated with carboxylic acids
(Modenes et al. 2015). In the ‘‘fingerprint’’ region, absor-
bance bands are assigned to the lignin at 2850 cm-1 cor-
responding to the C–H stretching vibration and in the range
1615–1500 cm-1 originating from aromatic skeletal
vibration. The double peak at 2920 and 2852 cm-1 could
be attributed, respectively, to the symmetric and asym-
metric C–H stretching vibrations in methyl and methylene
of aliphatic chains. The peaks at 3270, 2902, and 710 cm-1
may be related to the existence of cellulose Ib (monoclinic
crystalline structure of cellulose) in the TAS material.
These results were in good agreement with the chemical
composition of the TAS powder. The major components of
TAS were lignin (30.1 ± 0.5 wt%) and a-cellulose(29.9 ± 0.7 wt%). Hemicellulose was another major
component (25.1 ± 0.7 wt%).
Even if it is difficult to identify in which adsorption sites
the EBT and MG dyes were linked to the TAS particle
surfaces, a signature of dye adsorptions may be related to
the modification of peak bands through spectra after the
biosorption. Peak bands in ATR-FTIR spectra of TAS
before and after the adsorption of dyes are comparatively
different, suggesting that the bonding of pollutants mole-
cules to TAS particle surfaces may be at the origin of a
slight alteration of peak bands (Modenes et al. 2015). The
TAS FTIR spectrum differed from those obtained for the
Fig. 1 FTIR spectra of a TAS powder, b EBT-loaded TAS, and c
MG-loaded TAS
20 Page 4 of 13 Euro-Mediterr J Environ Integr (2017) 2:20
123

EBT and MG dye sorption (Fig. 1b, c), principally at the
1733–782 cm-1 range, identifying some altered peak
bands at 1733, 1660–1580, 1508, 1340–1315, 1107, and
782 cm-1.
The textural characteristics of adsorbents, such as the
pore volume and the surface area, play a key role in the
biosorption process of pollutant molecules. The BET sur-
face area characterization showed that the bioadsorbent has
a specific surface area of about 1.65 m2 g-1. In addition,
for the porosity measurement, the Barrett–Joyner–Halenda
(BJH) pore size distribution was deduced from the N2
isotherm which indicated that about 30% of pores fall into
the macroporous category (greater than 50 nm). The TAS
characterization showed that the average pore diameter and
pore volume were equal to 34.3 nm and 0.0086 cm3 g-1,
respectively. The large number of macropores with a sig-
nificant volume of pores facilitates the removal of an
important amount of EBT and MG molecules from the
aqueous solution (Banerjee et al. 2016).
The X-ray diffractogram (Fig. 1Sa in supplemental
material) of TAS powder clearly shows peaks generally
attributed to cellulosic materials at 2h equal to 16�, 22�,and 34� after reflections on the (101), (002), and (040)
planes, respectively (Banerjee et al. 2016). The broad and
diffuse appearance of the peaks suggests the amorphous
nature of the sample. Figures 1Sb and 1Sc in the supple-
mental material represent diffraction peaks after EBT and
MG uptake. It could be observed that the intensity of peaks
becomes slightly weaker which may be due to surface
adsorption of EBT and MG onto TAS particles. However,
no change in the position of peaks was noted which sug-
gests that no phase transformation was observed after EBT
and MG dye adsorption (Banerjee et al. 2016).
The degradation pattern and thermal stability of the TAS
were studied by thermogravimetric analysis (TGA). Ther-
mogravimetric (TG) and derivative thermogravimetric
(DTG) curves of TAS are shown in Fig. 2S (attached in
supplemental material). The initial weight loss
(60–120 �C) was ascribed to the desorption of water
molecules from TAS particles. The weight loss in the ini-
tial steps was about 8%. The second weight loss (31%)
between 210 and 330 �C could be attributed to the
depolymerization of hemicelluloses, the cleavage of gly-
cosidic linkages of cellulose, and the decomposition of
some portions of lignin. The weight loss (41%) between
330 and 400 �C was ascribed to the deterioration of cel-
lulose and lignin. As a result of the complexity of lignin’s
structure, its degradation took place above 400 �C (Ali
et al. 2016).
Surface morphologies of native and dye-loaded TAS
were investigated by SEM. The SEM images of TAS,
EBT-loaded TAS, and MG-loaded TAS are shown in
Fig. 2a–d, respectively. Figure 2a and b reveal the porous
characteristics and surface texture of TAS particles. It is
apparent in the micrographs that the bioadsorbent is porous
and a few well-developed cavernous porous structures were
easily seen. These deep large sized pores most likely play a
major role in the accommodation of dye molecules from
liquid phase to solid surface. Figures 2c and d show that
the change in textural properties of TAS after EBT and MG
adsorption, respectively, is due to the accumulation of dyes
onto the bioadsorbent surface indicating that the adsorption
phenomena occurred.
The evaluation of the pHzpc of the bioadsorbent gives an
idea about the electrical neutrality of the material at a
specific pH value. In this work, the pHzpc of TAS particles
was found to be 5.3 (Fig. 3).
Effect of particle size
The biosorption of EBT and MG dyes was studied at six
various particle sizes, greater than 500, 500–400, 400–315,
315–200, 200–100, and less than 100 lm. The dye uptake
at the aforementioned particle sizes was 24.98, 25.89,
25.76, 26.80, 27.06, and 30.68% for EBT and 75.74, 85.32,
88.91, 92.10, 93.86, and 96.73% for MG, respectively.
The results in Fig. 4 show that for both dye solutions,
the decrease in TAS particle size increases the dye
removal. It could be easily deduced that the decrease of the
TAS particle size leads to a better accessibility to pores and
a larger exposed surface area. Indeed, the number of dif-
fusion paths is increased as a consequence of exposed
channels on the particle surface. Consequently, the ability
of molecules to penetrate internal pores of TAS particles is
very high and the number of adsorption sites is increased,
thus resulting in the improvement of the dye uptake from
solutions (Ali et al. 2016). All further experiments were
carried out with TAS particle size less than 100 lm as
these showed sufficient adsorption capacity.
Effect of almond shell powder dosage
The effect of the TAS concentration on dye uptake was
studied for 11 adsorbent dosages in the 0.1–12 g L-1
range. Figure 5a shows that the adsorbed MG concentra-
tion increased from 46 to 97 mg L-1 while the quantity of
the adsorbed dye per unit mass diminished from 464 to
8 mg g-1 by increasing the concentration of the bioad-
sorbent from 0.1 to 12 g L-1. The same tendency was also
noticed for the EBT dye as shown in Fig. 5b. Indeed, it has
previously been reported that an increase in the biosorbent
concentration leads to an increase in the number of avail-
able sorption sites and therefore results in an increase of
biosorbed dye concentration (Lin et al. 2009). However,
TAS particle aggregation could result from a high biosor-
bent concentration. Such biomass aggregation may imply a
Euro-Mediterr J Environ Integr (2017) 2:20 Page 5 of 13 20
123

decrease in the total surface area of the bioadsorbent and an
increase in the diffusional path length, thus causing a
decrease in the quantity of a dye removed per unit weight
of TAS (Ozer et al. 2005). Therefore, taking the elimina-
tion efficiency of EBT and MG dyes and economy into
consideration at the same time, a dosage of 2 g L-1 was
selected for further studies.
Effect of pH
The pH is one of the parameters that greatly affect both
aqueous chemistry and surface active sites of the bioad-
sorbents. The removal of EBT and MG dyes at various pH
is depicted in Fig. 6. The influence of the aqueous
environment pH on the bioadsorption was studied by
changing the pH in the 2–11 range.
The pHzpc of TAS is about 5.3 as observed from the Fig. 3.
At pH higher than pHzpc the bioadsorbent surface has a
negative charge and at lower pH it has a positive charge. As
seen in Fig. 6, the EBT uptake capacity at higher pH was
lower than that at lower pH, which could be interpreted as
being due to the surface charge of the TAS. Below the pHzpc,
the TAS surface (mainly oxygen-containing groups linked to
the H?) is positively charged and anionic EBT dye adsorp-
tion occurs easily (Leng et al. 2015). On the contrary, when
the TAS surface is negatively charged at pH[ pHzpc, the
electrostatic repulsion between negatively EBT species and
negatively charged TAS is increased, and this results in a
decrease of the anionic dye biosorption (Attallah et al. 2016).
Fig. 2 SEM images of a,b TAS powder, c EBT-loaded
TAS, and d MG-loaded TAS
Fig. 3 pHzpc determination curve
Fig. 4 Effect of TAS particle size on EBT and MG adsorption
20 Page 6 of 13 Euro-Mediterr J Environ Integr (2017) 2:20
123

In theory, considering the electrostatic interaction
between the dye and the adsorbent, the maximum adsorp-
tion efficiency for MG should be obtained at around the pH
value of 6. However, a consistent amount of MG uptake
(around 48.5 mg g-1) was observed over the whole pH
range from 4 to 11. Thus, one can say that the adsorption
process of MG was not mainly controlled by the electro-
static interaction, suggesting existence of p–p stacking
interaction and/or hydrophobic interactions between the
triarylmethane dye and the lignocellulosic material. In
addition, low pH values (pH\ 4) were disadvantageous
for MG uptake by TAS, which could be attributed to the
competition between the excess of H? ions and the cationic
dye for binding sites (Attallah et al. 2016).
Effect of initial dye concentration
Figure 7 shows that the quantity of MG and EBT adsorbed
increased (from 12 to 95 mg g-1 and from 5 to 31 mg g-1,
respectively) with the increase of the initial dye concen-
tration (25–200 mg L-1). This occurred because, at higher
initial concentrations, the concentration gradient between
the bulk solution and the bioadsorbent surface is higher,
thus promoting external mass transfer. In parallel, at high
values of the initial dye concentration, internal mass
transfer is promoted. A similar tendency was reported by
Pavan et al. (2014).
Effect of contact time
The effect of the contact time on EBT and MG adsorption
by TAS at pH 4.8 ± 0.2, temperature of 22 �C, and
bioadsorbent dosage of 2 g L-1 is given in Fig. 8. This
result indicates that the biosorption efficiency for all initial
EBT and MG concentrations in the 25–200 mg L-1 range
increases and then becomes constant (at equilibrium) as a
function of the contact time. Indeed, it is possible to
observe in Fig. 8, that for all dye solutions (EBT and MG)
more than 96% of saturation was achieved within 15 min,
while only 3% was adsorbed until 300 min. This occurred
Fig. 5 Effect of the biosorbent dosage on the biosorption of a MG
and b EBT by TAS
Fig. 6 Effect of solution pH on the biosorption of EBT and MG by
TAS
Fig. 7 Effect of the EBT and MG dye concentration on the
biosorption capacity (qe) using TAS
Euro-Mediterr J Environ Integr (2017) 2:20 Page 7 of 13 20
123

because, at the initial adsorption stages, TAS has a large
available surface area, compared with the concentration of
dyes, favoring a high biosorption rate. However, after ini-
tial adsorption stages (after 15 min) a competition occurred
between dye molecules for the adsorption sites on the
surface of TAS, resulting in a decrease in the adsorption
rate (Santos and Boaventura 2016).
Biosorption kinetics
To identify the mechanism of bioadsorption, the removal
rate, and the control of the steps involved in the process,
two kinetic models (the pseudo-first and pseudo-second
order) can be adopted. The pseudo-first-order kinetic model
(Lagergren 1898) is given by Eq. 5:
ln qe � qtð Þ ¼ ln qe � k1t; ð5Þ
where k1 is the pseudo-first-order rate constant (min-1).
The k1 and qe,cal parameters can be determined from the
slope and intersection of the lines of ln(qe - qt) versus t.
The pseudo-second-order kinetic model (Ho and McKay
1999) is given by Eq. 6:
t=qt ¼ 1=k2q2e þ t=qe; ð6Þ
where k2 is the pseudo-second-order rate constant
(g mg-1 min-1). Similarly to the pseudo-first-order kinetic
model, the k2 and qe,cal parameters were deduced from the
linear and angular coefficients of the equations formed by
regressing t/qt versus t, respectively. These values are
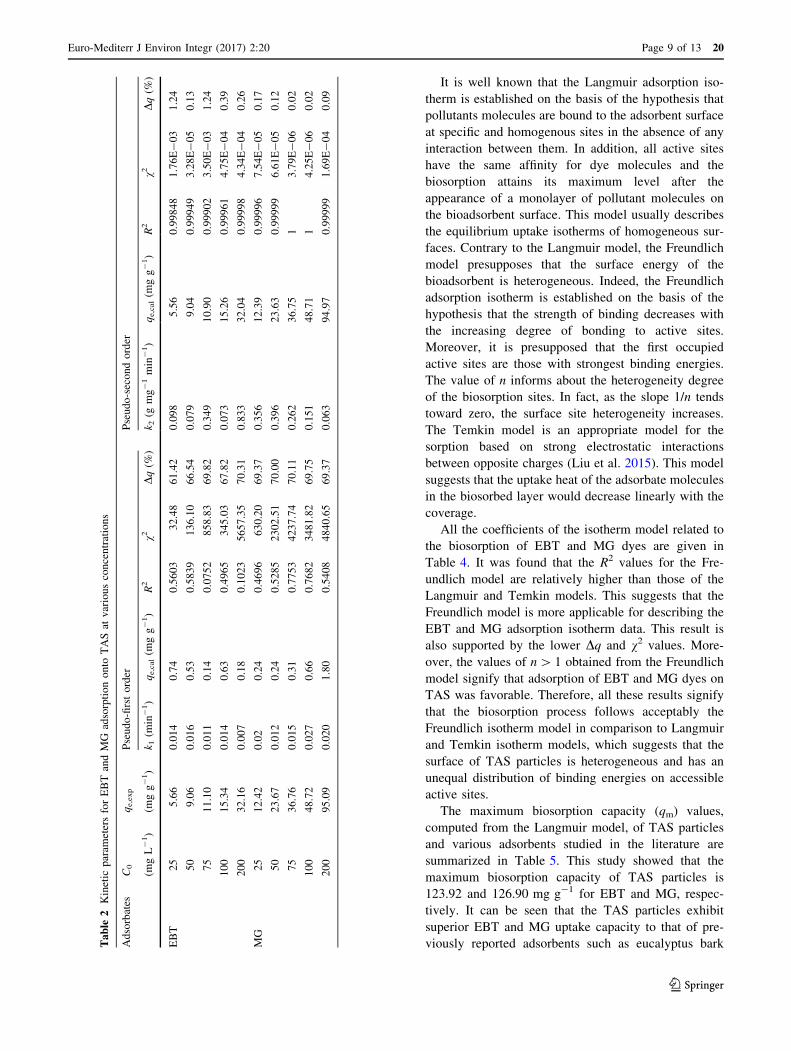
summarized in Table 2.
The linear fits of the kinetics results (Table 2) reflect
that the pseudo-second-order model exhibits higher R2 and
lower Dq and v2 values, compared to the pseudo-first-order
model. In addition, equilibrium adsorption capacities
computed on the basis the pseudo-second-order model are
in agreement with the experimental data for both dyes. This
proves that bioadsorption kinetics are well described by the
pseudo-second-order model and are dependent on the
quantity of the dye taken up by the bioadsorbent and the
amount adsorbed at equilibrium.
In this work, the intraparticle mass transfer diffusion
model (Weber and Morris 1963) was investigated.
qt ¼ kidt0:5 þ Ci; ð7Þ
where i is the number of the linear piecewise function, kid(mg g-1 min-1/2) is the intraparticle diffusion rate con-
stant, and Ci (mg g-1) is the intercept related to the
boundary layer thickness.
If the data of the entire adsorption process fits well with
the intraparticle diffusion (i is only equal to 1) and C is
zero, the intraparticle diffusion is the unique limiting step;
otherwise, the larger the intercept, the greater the contri-
bution of the film diffusion in the rate controlling. As
shown in Fig. 3S (in supplemental material), the whole
EBT and MG adsorption processes show two linear sec-
tions in a curve, suggesting multiple steps take place during
the bioadsorption process. The piecewise fitting parameters
of the intraparticle diffusion are listed in Table 3. The
values of Ci for each linear portion are not zero, showing
that intraparticle diffusion participates in EBT and MG dye
biosorption, but is not the sole rate-controlling step. Indeed,
film diffusion may also be involved in the biosorption
process. At the beginning of biosorption (the first segment
in Fig. 3S), film diffusion drives the mass transfer of dyes
from the bulk solution to the external surface of TAS
particles. In the second stage (the second segment in
Fig. 3S) of the biosorption process, equilibrium is reached
and the intraparticle diffusion fades out the biosorption of
dyes molecules (Leng et al. 2015).
Biosorption isotherms
Isotherm studies may give an idea about the way that
adsorbates interact with bioadsorbents, which is the main
element for designing a desired environment of adsorption.
Three well-known models were utilized in this work so as
to describe the adsorption process, namely Freundlich
(Eq. 8) (Freundlich 1906), Langmuir (Eq. 9) (Langmuir
1918), and Temkin (Eq. 10) (Temkin and Pyzhev 1940)
isotherm models:
ln qe ¼ ln kF þ1
nlnCe ð8Þ
1=qe ¼ 1=qm þ 1=kLqmCe ð9Þqe ¼ kT lnCe þ kT ln f ; ð10Þ
where qm (mg g-1) is the theoretical maximum adsorption
capacity; kL, kF, and kT are the adsorption constants of
Langmuir, Freundlich, and Temkin models, respectively;
n and f are the Freundlich linearity index and the Temkin
isotherm constant, respectively.Fig. 8 Effect of contact time on biosorption of EBT and MG by TAS
20 Page 8 of 13 Euro-Mediterr J Environ Integr (2017) 2:20
123
It is well known that the Langmuir adsorption iso-
therm is established on the basis of the hypothesis that
pollutants molecules are bound to the adsorbent surface
at specific and homogenous sites in the absence of any
interaction between them. In addition, all active sites
have the same affinity for dye molecules and the
biosorption attains its maximum level after the
appearance of a monolayer of pollutant molecules on
the bioadsorbent surface. This model usually describes
the equilibrium uptake isotherms of homogeneous sur-
faces. Contrary to the Langmuir model, the Freundlich
model presupposes that the surface energy of the
bioadsorbent is heterogeneous. Indeed, the Freundlich
adsorption isotherm is established on the basis of the
hypothesis that the strength of binding decreases with
the increasing degree of bonding to active sites.
Moreover, it is presupposed that the first occupied
active sites are those with strongest binding energies.
The value of n informs about the heterogeneity degree
of the biosorption sites. In fact, as the slope 1/n tends
toward zero, the surface site heterogeneity increases.
The Temkin model is an appropriate model for the
sorption based on strong electrostatic interactions
between opposite charges (Liu et al. 2015). This model
suggests that the uptake heat of the adsorbate molecules
in the biosorbed layer would decrease linearly with the
coverage.
All the coefficients of the isotherm model related to
the biosorption of EBT and MG dyes are given in
Table 4. It was found that the R2 values for the Fre-
undlich model are relatively higher than those of the
Langmuir and Temkin models. This suggests that the
Freundlich model is more applicable for describing the
EBT and MG adsorption isotherm data. This result is
also supported by the lower Dq and v2 values. More-
over, the values of n[ 1 obtained from the Freundlich
model signify that adsorption of EBT and MG dyes on
TAS was favorable. Therefore, all these results signify
that the biosorption process follows acceptably the
Freundlich isotherm model in comparison to Langmuir
and Temkin isotherm models, which suggests that the
surface of TAS particles is heterogeneous and has an
unequal distribution of binding energies on accessible
active sites.
The maximum biosorption capacity (qm) values,
computed from the Langmuir model, of TAS particles
and various adsorbents studied in the literature are
summarized in Table 5. This study showed that the
maximum biosorption capacity of TAS particles is
123.92 and 126.90 mg g-1 for EBT and MG, respec-
tively. It can be seen that the TAS particles exhibit
superior EBT and MG uptake capacity to that of pre-
viously reported adsorbents such as eucalyptus barkTable
2Kinetic
param
etersforEBTandMG
adsorptiononto
TASat
variousconcentrations
Adsorbates
C0
qe,exp
Pseudo-firstorder
Pseudo-secondorder
(mgL-1)
(mgg-1)
k 1(m
in-1)
qe,cal(m
gg-1)
R2
v2Dq(%
)k 2
(gmg-1min
-1)
qe,cal(m
gg-1)
R2
v2Dq(%
)
EBT
25
5.66
0.014
0.74
0.5603
32.48
61.42
0.098
5.56
0.99848
1.76E-03
1.24
50
9.06
0.016
0.53
0.5839
136.10
66.54
0.079
9.04
0.99949
3.28E-05
0.13
75
11.10
0.011
0.14
0.0752
858.83
69.82
0.349
10.90
0.99902
3.50E-03
1.24
100
15.34
0.014
0.63
0.4965
345.03
67.82
0.073
15.26
0.99961
4.75E-04
0.39
200
32.16
0.007
0.18
0.1023
5657.35
70.31
0.833
32.04
0.99998
4.34E-04
0.26
MG
25
12.42
0.02
0.24
0.4696
630.20
69.37
0.356
12.39
0.99996
7.54E-05
0.17
50
23.67
0.012
0.24
0.5285
2302.51
70.00
0.396
23.63
0.99999
6.61E-05
0.12
75
36.76
0.015
0.31
0.7753
4237.74
70.11
0.262
36.75
13.79E-06
0.02
100
48.72
0.027
0.66
0.7682
3481.82
69.75
0.151
48.71
14.25E-06
0.02
200
95.09
0.020
1.80
0.5408
4840.65
69.37
0.063
94.97
0.99999
1.69E-04
0.09
Euro-Mediterr J Environ Integr (2017) 2:20 Page 9 of 13 20
123

(Dave et al. 2011), magnetite/pectin nanoparticles (Attallah
et al. 2016), Avena sativa (oat) hull (Banerjee et al. 2016),
and magnetic litchi pericarps (Zheng et al. 2015). Thus,
these results show that TAS, which is a readily available
and cheap by-product, can be utilized as a potential
adsorbent to reduce the concentration of EBT and MG dyes
from contaminated water.
Biosorption thermodynamics
Data were recorded at three temperatures: from 22 to
40 �C. A decrease of the amount of EBT and MG dyes
adsorbed onto TAS was observed with increasing temper-
ature. This study shows that thermodynamic parameters
including the changes in free energy (DG0), enthalpy
(DH0), and entropy (DS0) are pertinent parameters for the
description of the thermodynamic behavior of the uptake of
EBT and MG onto TAS.
For such equilibrium reactions, KD, the distribution
constant, is given by (Barka et al. 2013)
KD ¼ qe=Ce: ð11Þ
The Gibbs free energy is
DG0 ¼ �RT lnKD; ð12Þ
where R is the universal gas constant (8.314 J mol K-1)
and T is solution temperature in kelvin.
The enthalpy (DH0) and entropy (DS0) of biosorption
were estimated from the slope and intercept of the plot of
lnKD versus 1/T, respectively.
lnKD ¼ �DG0=RT ¼ �DH0=RT þ DS0=RT : ð13Þ
The distribution coefficient, KD of both dye systems
decreased with elevating temperature, showing that the
substantivity of EBT and MG dyes on TAS is highly
dependent on temperature. High temperatures enhanced the
solubility of pollutants in bulk solution much more than
adsorbent particles (Chan et al. 2016). As shown in
Table 6, the negative enthalpy value (DH0) indicates that
the dye biosorption on TAS is exothermic. The typical
value for physisorption usually lies below 80 kJ mol-1,
which agrees with values obtained for adsorption of EBT
and MG onto TAS. In addition, the negative entropy value
(DS0) reveals that the molecules of EBT and MG dyes in
the adsorbed phase of TAS have lower randomness than
pollutants molecules in bulk solution. The free energy
changes (DG0) are negative for MG, showing that the
biosorption process is possible and spontaneous. In con-
trast, positive values of DG0 were obtained in this work for
EBT with raising temperature. The positive DG0 shows that
Table 3 Various calculated parameters of intraparticle diffusion model for various initial dye concentrations
Adsorbates C0 qe,exp Intraparticle diffusion
(mg L-1) (mg g-1) k1d (mg g-1 min-1/2) C1 (mg g-1) R12 k2d (mg g-1 min-1/2) C2 (mg g-1) R2
2
EBT 25 5.66 0.075 4.89 0.994 0.027 5.10 0.258
50 9.06 0.104 8.44 0.631 0.036 8.43 0.343
75 11.10 0.332 9.60 0.657 -0.016 11.12 0.058
100 15.34 0.040 14.83 0.946 0.029 14.77 0.515
200 32.16 0.296 31.09 0.691 -0.002 32.07 –
MG 25 12.42 0.272 11.55 0.901 0.005 12.29 0.108
50 23.67 0.288 22.66 0.987 0.010 23.48 0.218
75 36.76 0.182 35.98 0.938 0.016 36.51 0.808
100 48.72 0.517 47.03 0.704 0.015 48.44 0.738
200 95.09 0.980 90.71 0.940 0.027 94.41 0.136
Table 4 Isotherm parameters for EBT and MG adsorption onto TAS
Isotherm Parameter EBT MG
qe,exp (mg g-1) 15.34 48.72
Langmuir qm (mg g-1) 123.92 126.90
kL (L mg-1) 0.002 0.291
R2 0.8284 0.9730
v2 0.035 0.539
Dq (%) 3.35 7.84
Freundlich kF (L mg-1) 0.490 30.343
n 1.191 1.997
R2 0.9981 0.9999
v2 0.012 0.001
Dq (%) 1.98 0.30
Temkin f 0.0506 0.7259
kT 15.245 51.200
R2 0.9376 0.9986
v2 0.274 46.012
Dq (%) 9.77 43.01
20 Page 10 of 13 Euro-Mediterr J Environ Integr (2017) 2:20
123

the biosorption of EBT by TAS is a thermodynamically
reversible, non-spontaneous, or unfavorable reaction. The
increase in EBT and MG free energy values with the
temperature augmentation suggested that the dye uptake
was less favorable with increasing temperature.
Conclusion
TAS was identified as a suitable bioadsorbent for EBT and
MG uptake in batch experiments. The batch study param-
eters, pH of solution, bioadsorbent particle size and dosage,
contact time, initial dye concentration, and temperature
were found to influence the uptake process. The pH
experiments indicated that the major uptake takes place in
the pH range 2–5 for EBT and 4–11 for MG. The
adsorption rate was fast within 15 min and reached uptake
equilibrium for both dyes. The adsorption kinetics and
isotherm studies showed that uptake processes for both
dyes are well fitted to pseudo-second-order kinetics and the
Freundlich isotherm model. Thermodynamic studies con-
firmed that the uptake process was exothermic (DH0\ 0
for EBT and MG). The biosorption of both dyes was
accompanied by a decrease in the entropy due to the
orderly arrangement of the dye molecules on the TAS
surface. In addition, the negative values of DG0 proved the
spontaneity of the MG uptake process. However, positive
values of DG0 showed that the uptake of the EBT dye by
TAS is not a spontaneous reaction. Moreover, the
biosorption process may be realized at ambient tempera-
tures (ca. 22 �C) with best results.
Taking into consideration all the results obtained in this
work, we concluded that the Tunisian almond shells may
be used as alternatives to expensive adsorbents used for the
removal of toxic dyes such as EBT and MG.
Acknowledgements The authors would like to thank the Higher
Institute of Applied Sciences and Technology of Gabes for the
financial support through the ISSATG Students program for innova-
tion. The authors would like to thank Professor Abdessattar Aloui,
Manel Hamdi (MSc student), and Haifa Chouki (MSc student) for
their technical support.
Compliance with ethical standards
Conflict of interest On behalf of all authors, the corresponding
author states that there is no conflict of interest.
References
Ali RM, Hamad HA, Hussein MM, Malash GF (2016) Potential of
using green adsorbent of heavy metal removal from aqueous
solutions: adsorption kinetics, isotherm, thermodynamic,
Table 5 Maximum adsorption
capacities of EBT and MG on
various adsorbents
Dye Sorbent qm (mg g-1) References
EBT Eucalyptus bark 52.37 Dave et al. (2011)
Scolymus hispanicus L. 120.42 Barka et al. (2013)
Magnetite/pectin nanoparticles 103.41 Attallah et al. (2016)
Magnetite/silica/pectin nanoparticles 80.15 Attallah et al. (2016)
Nteje clay 16.26 Elijah and Nwabanne (2014)
Tunisian almond shell 123.92 This study
MG Walnut shell 90.8 Dahri et al. (2014)
Avena sativa (oat) hull 51.42 Banerjee et al. (2016)
Polydopamine–chitosan nanoparticles 60.97 Wang et al. (2016)
Rattan sawdust 62.71 Hameed and El-Khaiary (2008)
Magnetic litchi pericarps 70.42 Zheng et al. (2015)
Tunisian almond shell 126.90 This study
Table 6 Thermodynamic
parameters for the adsorption of
EBT and MG on TAS at
different temperatures
Dye T (�C) KD DG0 (kJ mol-1) DH0 (kJ mol-1) DS0 (J mol-1 K-1)
EBT 22 0.221 3.70 -1.71 -0.02
30 0.220 3.81
40 0.213 4.03
MG 22 2.949 -7.24 -32.04 -0.08
30 2.385 -6.01
40 2.187 -5.69
Euro-Mediterr J Environ Integr (2017) 2:20 Page 11 of 13 20
123

mechanism and economic analysis. Ecol Eng 91:317–332.
doi:10.1016/j.ecoleng.2016.03.015
Attallah OA, Al-Ghobashy MA, Nebsen M, Salem MY (2016)
Removal of cationic and anionic dyes from aqueous solution
with magnetite/pectin and magnetite/silica/pectin hybrid
nanocomposites: kinetic, isotherm and mechanism analysis.
RSC Adv 6:11461–11480. doi:10.1039/C5RA23452B
Banerjee S, Sharma GC, Gautam RK et al (2016) Removal of
Malachite Green, a hazardous dye from aqueous solutions using
Avena sativa (oat) hull as a potential adsorbent. J Mol Liq
213:162–172. doi:10.1016/j.molliq.2015.11.011
Barka N, Ouzaouit K, Abdennouri M, El M (2013) Dried prickly pear
cactus (Opuntia ficus indica) cladodes as a low-cost and eco-
friendly biosorbent for dyes removal from aqueous solutions.
J Taiwan Inst Chem Eng 44:52–60. doi:10.1016/j.jtice.2012.09.
007
Bhatt AS, Sakaria PL, Vasudevan M et al (2012) Adsorption of an
anionic dye from aqueous medium by organoclays: equilibrium
modeling, kinetic and thermodynamic exploration. RSC Adv
2:8663. doi:10.1039/c2ra20347b
Calero M, Blazquez G, Ronda A et al (2013) Biosorption of Cu in a
packed bed column by almond shell: optimization of process
variables. Desalin Water Treat 51:1954–1965. doi:10.1080/
19443994.2012.715167
Chairunnisa Siswanta D, Suratman A, Tanaka S (2016) Shirasu
balloons and polydopamine-modified Shirasu balloons for
adsorption of methylene blue. Water Air Soil Pollut 227:412.
doi:10.1007/s11270-016-2898-8
Chan SL, Tan YP, Abdullah AH, Ong ST (2016) Equilibrium, kinetic
and thermodynamic studies of a new potential biosorbent for the
removal of Basic Blue 3 and Congo Red dyes: pineapple
(Ananas comosus) plant stem. J Taiwan Inst Chem Eng
61:306–315. doi:10.1016/j.jtice.2016.01.010
Dahri MK, Kooh MRR, Lim LBL (2014) Water remediation using
low cost adsorbent walnut shell for removal of malachite green:
equilibrium, kinetics, thermodynamic and regeneration studies.
J Environ Chem Eng 2:1434–1444. doi:10.1016/j.jece.2014.07.
008
Dave PN, Kaur S, Khosla E (2011) Removal of Eriochrome black-T
by adsorption on to eucalyptus bark using green technology.
Indian J Chem Technol 18:53–60
Dawood S, Sen TK (2012) Removal of anionic dye Congo red from
aqueous solution by raw pine and acid-treated pine cone powder
as adsorbent: equilibrium, thermodynamic, kinetics, mechanism
and process design. Water Res 46:1933–1946. doi:10.1016/j.
watres.2012.01.009
Deniz F (2013) Dye removal by almond shell residues: studies on
biosorption performance and process design. Mater Sci Eng C
33:2821–2826. doi:10.1016/j.msec.2013.03.009
Dutta R, Nagarjuna TV, Mandavgane SA, Ekhe JD (2014) Ultrafast
removal of cationic dye using agrowaste-derived mesoporous
adsorbent. Ind Eng Chem Res 53:18558–18567. doi:10.1021/
ie5030003
Elijah OC, Nwabanne JT (2014) Adsorption studies on the removal of
Eriochrome black-T from aqueous solution using Nteje clay.
SOP Trans Appl Chem 1:14–25. doi:10.15764/STAC.2014.
02003
Freundlich HMF (1906) Uber die adsorption in losungen. Zeitschrift
fur Phys Chemie 57:385–470
Gautam RK, Rawat V, Banerjee S et al (2015) Synthesis of bimetallic
Fe-Zn nanoparticles and its application towards adsorptive
removal of carcinogenic dye malachite green and Congo red in
water. J Mol Liq 212:227–236. doi:10.1016/j.molliq.2015.09.
006
Hameed BH (2008) Equilibrium and kinetic studies of methyl violet
sorption by agricultural waste. J Hazard Mater 154:204–212.
doi:10.1016/j.jhazmat.2007.10.010
Hameed BH, El-Khaiary MI (2008) Malachite green adsorption by
rattan sawdust: isotherm, kinetic and mechanism modeling.
J Hazard Mater 159:574–579. doi:10.1016/j.jhazmat.2008.02.
054
Ho YS, McKay G (1999) Pseudo-second order model for sorption
processes. Process Biochem 34:451–465. doi:10.1016/S0032-
9592(98)00112-5
Kesraoui A, Moussa A, Ben Ali G, Seffen M (2016) Biosorption of
alpacide blue from aqueous solution by lignocellulosic biomass:
Luffa cylindrica fibers. Environ Sci Pollut Res 23:15832–15840.
doi:10.1007/s11356-015-5262-4
Lagergren S (1898) Zur theorie der sogenannten adsorption gel ster
stoffe. K Sven Vetenskapsakad Handl 24:1–39
Langmuir I (1918) The adsorption of gases on plane surfaces of glass,
mica and platinum. J Am Chem Soc 40:1361–1403. doi:10.1021/
ja02242a004
Leng L, Yuan X, Zeng G et al (2015) Surface characterization of rice
husk bio-char produced by liquefaction and application for
cationic dye (Malachite green) adsorption. Fuel 155:77–85.
doi:10.1016/j.fuel.2015.04.019
Li J, Huang Y, Liu Z et al (2015a) Chemical activation of boron
nitride fibers for improved cationic dye removal performance.
J Mater Chem A 3:8185–8193. doi:10.1039/C5TA00601E
Li Q, Tang X, Sun Y et al (2015b) Removal of Rhodamine B from
wastewater by modified Volvariella volvacea: batch and column
study. RSC Adv 5:25337–25347. doi:10.1039/C4RA17319H
Li Y, Meas A, Shan S et al (2016) Production and optimization of
bamboo hydrochars for adsorption of Congo red and 2-naphthol.
Bioresour Technol 207:379–386. doi:10.1016/j.biortech.2016.
02.012
Lin K, Pan J, Chen Y et al (2009) Study the adsorption of phenol from
aqueous solution on hydroxyapatite nanopowders. J Hazard
Mater 161:231–240. doi:10.1016/j.jhazmat.2008.03.076
Liu K, Li H, Wang Y et al (2015) Adsorption and removal of
rhodamine B from aqueous solution by tannic acid functional-
ized graphene. Colloids Surf A Physicochem Eng Aspect
477:35–41. doi:10.1016/j.colsurfa.2015.03.048
Maaloul N, Oulego P, Rendueles M et al (2017) Novel biosorbents
from almond shells: characterization and adsorption properties
modeling for Cu(II) ions from aqueous solutions. J Environ
Chem Eng 5:2944–2954. doi:10.1016/j.jece.2017.05.037
Modenes AN, Espinoza-Quinones FR, Geraldi CAQ et al (2015)
Assessment of the banana pseudostem as a low-cost biosorbent
for the removal of reactive blue 5G dye. Environ Technol
36:2892–2902. doi:10.1080/09593330.2015.1051591
Mota TR, Kato CG, Peralta RA et al (2015) Decolourization of Congo
Red by Ganoderma lucidum laccase: evaluation of degradation
products and toxicity. Water Air Soil Pollut 226:351–361.
doi:10.1007/s11270-015-2612-2
Ozer A, Akkaya G, Turabik M (2005) The biosorption of Acid Red
337 and Acid Blue 324 on Enteromorpha prolifera: the
application of nonlinear regression analysis to dye biosorption.
Chem Eng J 112:181–190. doi:10.1016/j.cej.2005.07.007
Pavan FA, Camacho ES, Lima EC et al (2014) Formosa papaya seed
powder (FPSP): preparation, characterization and application as
an alternative adsorbent for the removal of crystal violet from
aqueous phase. J Environ Chem Eng 2:230–238. doi:10.1016/j.
jece.2013.12.017
Rahmat NA, Ali AA, Salmiati et al (2016) Removal of remazol
brilliant blue R from aqueous solution by adsorption using
pineapple leaf powder and lime peel powder. Water Air Soil
Pollut. doi:10.1007/s11270-016-2807-1
20 Page 12 of 13 Euro-Mediterr J Environ Integr (2017) 2:20
123

Saghanejhad Tehrani M, Zare-Dorabei R (2016) Highly efficient
simultaneous ultrasonic-assisted adsorption of methylene blue
and rhodamine B onto metal organic framework MIL-68(Al):
central composite design optimization. RSC Adv
6:27416–27425. doi:10.1039/C5RA28052D
Santos SCR, Boaventura RAR (2016) Adsorption of cationic and
anionic azo dyes on sepiolite clay: equilibrium and kinetic
studies in batch mode. J Environ Chem Eng 4:1473–1483.
doi:10.1016/j.jece.2016.02.009
Senturk HB, Ozdes D, Duran C (2010) Biosorption of Rhodamine 6G
from aqueous solutions onto almond shell (Prunus dulcis) as a
low cost biosorbent. Desalination 252:81–87. doi:10.1016/j.
desal.2009.10.021
Temkin MJ, Pyzhev V (1940) Recent modifications to Langmuir
isotherms. Acta Physicochim URSS 12:217–225
Wang Y, Zhang Y, Hou C, Liu M (2016) Mussel-inspired synthesis of
magnetic polydopamine–chitosan nanoparticles as biosorbent for
dyes and metals removal. J Taiwan Inst Chem Eng 61:292–298.
doi:10.1016/j.jtice.2016.01.008
Weber W, Morris J (1963) Kinetics of adsorption on carbon from
solution. J Sanit Eng Div 89:31–60
Xiao S, Gao R, Lu Y et al (2015) Fabrication and characterization of
nanofibrillated cellulose and its aerogels from natural pine
needles. Carbohydr Polym 119:202–209. doi:10.1016/j.carbpol.
2014.11.041
Zhang Z, Moghaddam L, O’Hara IM, Doherty WOS (2011) Congo
Red adsorption by ball-milled sugarcane bagasse. Chem Eng J
178:122–128. doi:10.1016/j.cej.2011.10.024
Zheng H, Qi J, Jiang R et al (2015) Adsorption of malachite green by
magnetic litchi pericarps: a response surface methodology
investigation. J Environ Manage 162:232–239. doi:10.1016/j.
jenvman.2015.07.057
Euro-Mediterr J Environ Integr (2017) 2:20 Page 13 of 13 20
123

![Original Fluorinated Surfactants Potentially Non ... · parts. Surfactants are valuable compounds, being either cationic, anionic, amphoteric or non-ionic.[1] Among them, fluorinated](https://img.pdfslide.net/doc/110x75/607812e7a9f25a2f437a93b5/original-fluorinated-surfactants-potentially-non-parts-surfactants-are-valuable.jpg)
![Guest Host Frameworks of the Anionic Metal Complex [Fe(ox ...sevovlab/articles/JMP_CGD_2012.pdfGuest−Host Frameworks of the Anionic Metal Complex [Fe(ox) 3]3‑ and Cationic Bipyridinium-Based](https://img.pdfslide.net/doc/110x75/5e6041d842557d77132e6b89/guest-host-frameworks-of-the-anionic-metal-complex-feox-sevovlabarticlesjmpcgd2012pdf.jpg)


![ISTANBUL TECHNICAL UNIVERSITY INSTITUTE OF SCIENCE …yusuf/theses/gokhan_acik_MSc.pdf · polymerization with anionic insertion [14], activated monomer [14, 15], cationic [16- 20],](https://img.pdfslide.net/doc/110x75/5cada45b88c993ab638b52cb/istanbul-technical-university-institute-of-science-yusufthesesgokhanacikmscpdf.jpg)


![Cationic dye (MB) removal using polymer inclusion membrane ... · anionic and cationic dyes, from aqueous solutions by emulsion liquid membrane [10-12]. Removal of anionic reactive](https://img.pdfslide.net/doc/110x75/5fcce24a22f59e61c930be37/cationic-dye-mb-removal-using-polymer-inclusion-membrane-anionic-and-cationic.jpg)