Embed Size (px)
Citation preview
1
Adult participation in sport Analysis of the Taking Part Survey
Helen Jones, Peter Millward (Knight, Kavanagh and Page) and Babatunde Buraimo (University Of Central Lancashire) August 2011

Department for Culture, Media and Sport Adult participation in culture and sport
2
Our aim is to improve the quality of life for all through cultural and sporting activities, support the pursuit of excellence, and champion the tourism, creative and leisure industries.
3
Contents
Executive summary ............................................................................................................ 4
Introduction ......................................................................................................................... 6
1. Participation in sport ....................................................................................................... 8
2. Participation in sport, by sex ......................................................................................... 13
3. Participation in sport, by age ........................................................................................ 19
4. Participation in sport, by ethnicity ................................................................................. 22
5. Participation in sport, by household type ...................................................................... 25
6. Participation in sport, by economic and social indicators .............................................. 28
7. Participation in sport, multivariate analysis ................................................................... 32
8. Participation in sport, 2005/06 to 2008/09 ..................................................................... 36
Appendix 1: Sport clusters based Williams’ (2010) cluster analysis of culture and sport activities ............................................................................................................................ 45
4
Executive summary
The Taking Part survey is commissioned by the Department for Culture, Media and Sport (DCMS) in partnership with four non-departmental public bodies (Arts Council England, English Heritage, Sport England, and the Museums, Libraries and Archives Council). The survey covers both adults and children in England and collects a wide range of data about engagement and non-engagement in culture, leisure and sport. This report gives a detailed overview of adult engagement in sport. It uses 2005/06, 2006/07, 2007/08 and 2008/09 Taking Part data. The 2008/09 statistics are based on over 14,000 interviews of adults aged 16+ years, while the time series data draws on more than 92,000 interviews over the 2005/06 to 2008/09 period. Key findings The decision to participate in sport is affected by a wide range of demographic and socio-economic factors The likelihood of an individual taking part in sport is affected by many factors, the most obvious being age, sex, economic circumstances, ethnicity, health, life stage, available time and other responsibilities. Less obvious influences include, peer group participation, participation as a child and location (i.e. where people live relative to available facilities). Most people have participated in culture or sport in the last year
In 2008/09, 92.7% of people had actively or passively engaged in the arts, visited an
archive, gallery, museum, public library, heritage site or played sport. While less than 1% of people have done all these things in the past 12 months, 80.8%
have participated in two of these activities, 64.3% in three, 45.6% in four, 26.1% in five and 9.1% in six activities.
While men and women are equally likely to walk for health and recreational purposes, men are more likely to cycle or to take part in sport Participation in sport is also higher among younger people, those with a car, students and
those in higher income bands. People in managerial positions tend to take part in sport more frequently than those in
other socio-economic groups and people in full-time employment are more than twice as likely to cycle for health and recreation as retired people.
The most popular sports vary by sex Three of the top five sports for both men and women are swimming, health and fitness
and cycling. However, female participation is heavily concentrated in swimming and health
5
and fitness, while male participation is more widely spread across a range of different activities.
Time, expense and health problems are the most commonly cited reason for not participating in culture and sport In 2008/09, 7.3% of people had not taken part in any cultural activities in the past year or
sporting activities in the past 4 weeks.
While non-participation does not vary by sex, it does by other demographic and socio-economic factors Those most likely not to participate in any cultural or sporting activities are aged 75+,
BME, lone pensioners, local authority tenants, people with no-qualifications, those in semi-routine or routine occupations, people who are permanently or temporarily sick, disabled or injured and people who are earning less than £10,000 p.a.
Although there have been some changes, since 2005/06, sports participation rates have remained relatively stable While the proportion of people doing sport has not changed overall, between 2005/06 and
2008/09, the proportion of men cycling increased (from 12.7% to 14.4%), as did the proportion of women running (from 3.5% to 4.8%).
People who participated in sport as a child are more likely to participate as an adult The analysis shows that the majority of adults who play sport also played sport as
children.
6
Introduction
The Taking Part survey is commissioned by the Department for Culture, Media and Sport (DCMS) in partnership with four non-departmental public bodies (Arts Council England, English Heritage, Sport England, and the Museums, Libraries and Archives Council). The survey covers both adults and children in England and collects a wide range of data about engagement and non-engagement in culture, leisure and sport. Taking Part is the key evidence source for DCMS, providing reliable national estimates of participation and supporting the Department’s aim of improving the quality of life for everyone by providing people with the chance to get involved in a variety of these opportunities. Taking Part is a continuous face-to-face survey with adults aged 16 and over living in private households in England. It conducted on behalf of DCMS by TNS-BMRB. The survey has been run since mid-July 2005. A child interview was added to the survey in January 2006, interviewing a randomly selected child in those households containing at least one child aged 11-15. This is also a continuous face-to-face survey. In 2008/09, the child survey was broadened to include children aged 5-10. Interviews with children aged 11-15 are carried out directly, for those aged 5-10 an interview is conducted with the adult respondent. In 2008/09, over adult 14,000 interviews were conducted. The majority of the statistics presented in the report draw on the 2008/09 dataset. While the statistics presented are largely descriptive they are supplemented by findings from two comprehensive regression analyses covering sport and culture. Full findings from these analyses are published separately on the DCMS website1. The time series analysis draws on more than 92,000 interviews over the 2005/06 to 2008/09 period. Further information on Taking Part (including methodology and definitions) can be found in the appendices to this report. Report structure The report outlines participation in sport by adults aged 16 and over. Where possible, comparisons have been made by age, sex, ethnicity, illness and household characteristics.
Results are discussed in relation to the overall population, by sex, ethnic group, age group, household type and economic and social indicators, which comprise tenure, car ownership, academic attainment, socio-economic classification, employment status and income.
1 http://www.culture.gov.uk/what_we_do/research_and_statistics/6602.aspx
7
Taking Part asks respondents about the extent to which they walk, cycle and participate in sport in the four weeks prior to interview. The questionnaire covers 65 different sports. These are listed in the accompanying technical appendices. The report was written, and is based on analysis by Helen Jones and Peter Millward (Knight, Kavanagh and Page2) and Babatunde Buraimo (University Of Central Lancashire). It complements Taking Part data previously released by DCMS3. The responsible statistician at DCMS for this publication is [email protected]
2 http://www.kkp.co.uk/ 3 http://www.culture.gov.uk/what_we_do/research_and_statistics/7184.aspx#3
8
1. Participation in sport
Key findings
In the four weeks prior to interview, 68.0% of people walked for health and recreation,
10.3% cycled for health and recreation and 53.3% played sport. The two most popular two sports among adults were swimming and health and fitness
activities (e.g. going to the gym). Among the 46.8% of adults who do not take part in any sport, time, expense and health
are the main reasons given for not participating.
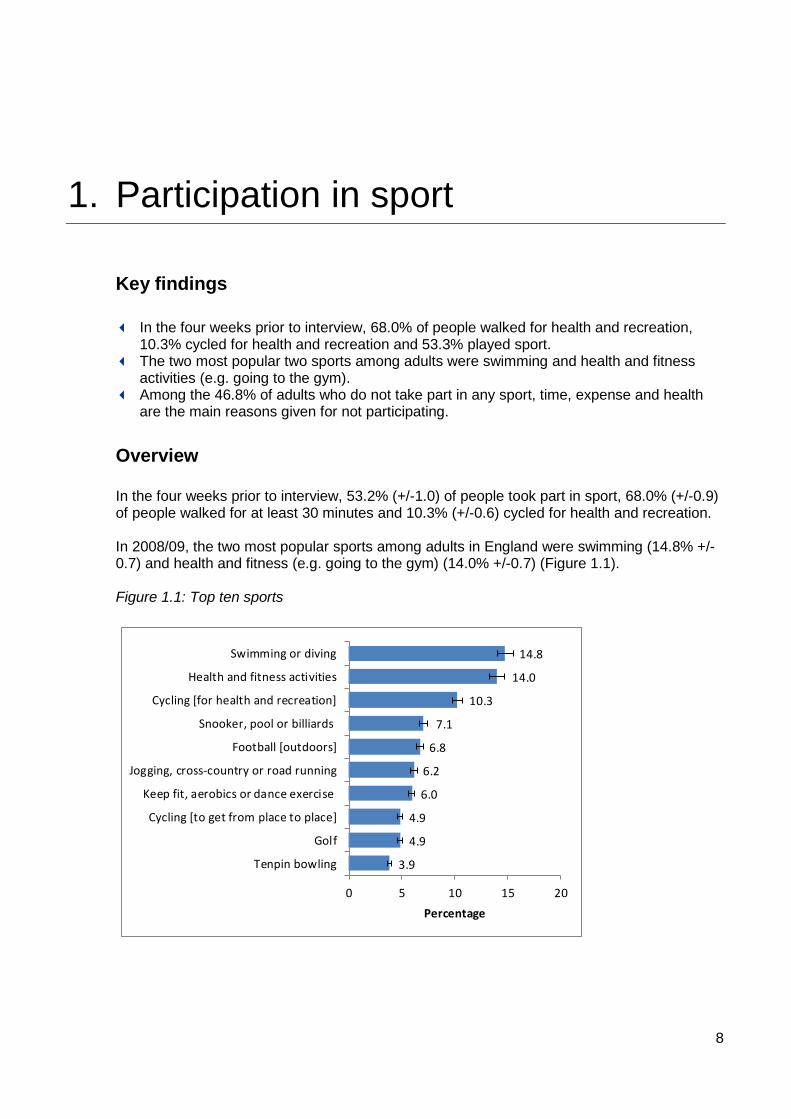
Overview In the four weeks prior to interview, 53.2% (+/-1.0) of people took part in sport, 68.0% (+/-0.9) of people walked for at least 30 minutes and 10.3% (+/-0.6) cycled for health and recreation. In 2008/09, the two most popular sports among adults in England were swimming (14.8% +/-0.7) and health and fitness (e.g. going to the gym) (14.0% +/-0.7) (Figure 1.1). Figure 1.1: Top ten sports
3.9
4.9
4.9
6.0
6.2
6.8
7.1
10.3
14.0
14.8
0 5 10 15 20
Tenpin bowling
Golf
Cycling [to get from place to place]
Keep fit, aerobics or dance exercise
Jogging, cross-country or road running
Football [outdoors]
Snooker, pool or billiards
Cycling [for health and recreation]
Health and fitness activities
Swimming or diving
Percentage
9
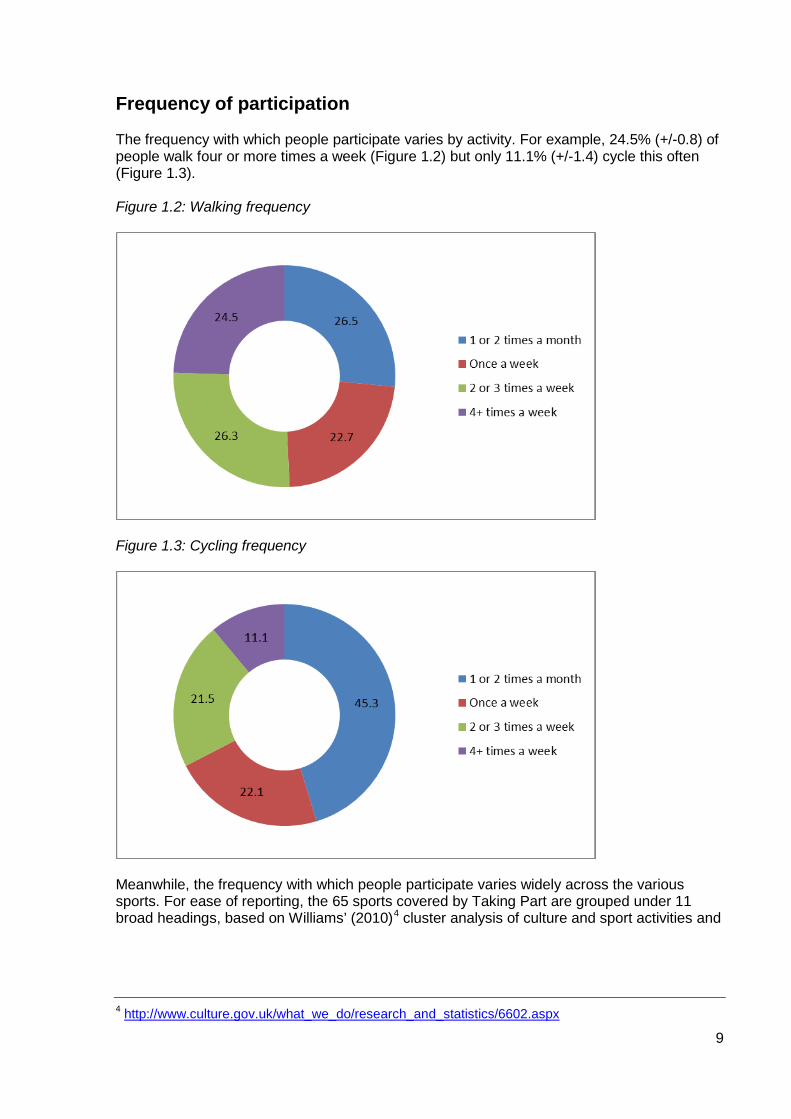
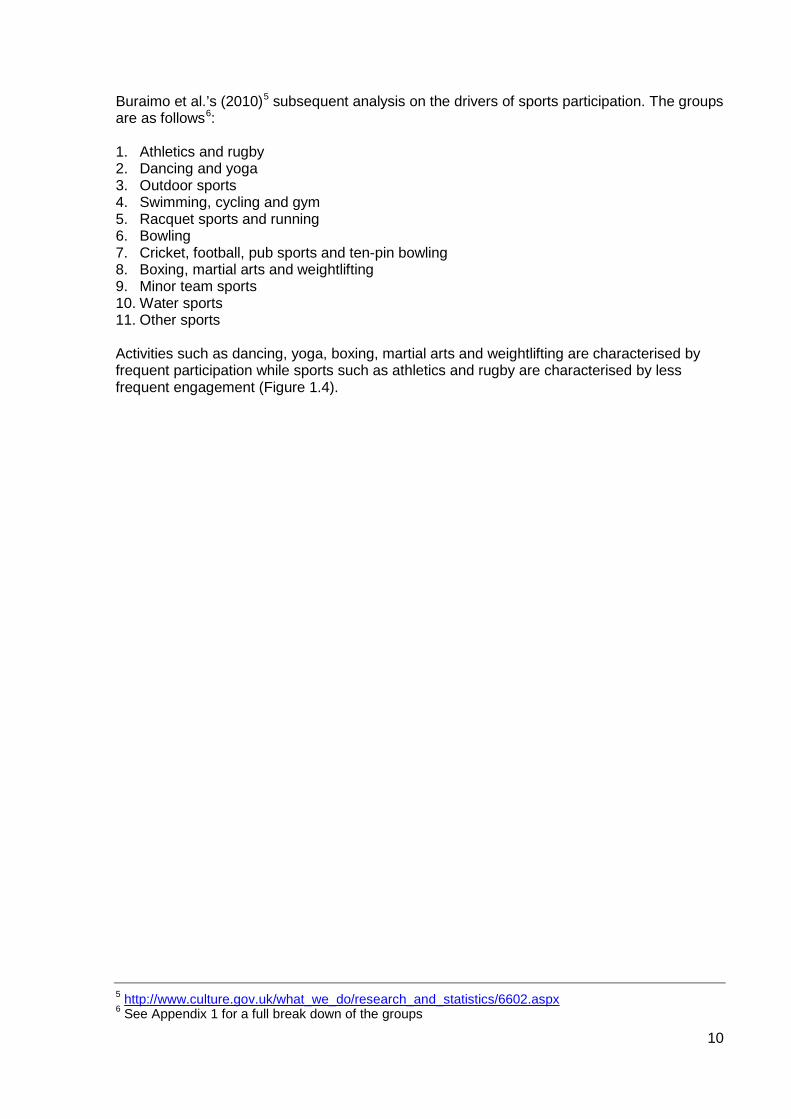
Frequency of participation The frequency with which people participate varies by activity. For example, 24.5% (+/-0.8) of people walk four or more times a week (Figure 1.2) but only 11.1% (+/-1.4) cycle this often (Figure 1.3). Figure 1.2: Walking frequency
Figure 1.3: Cycling frequency
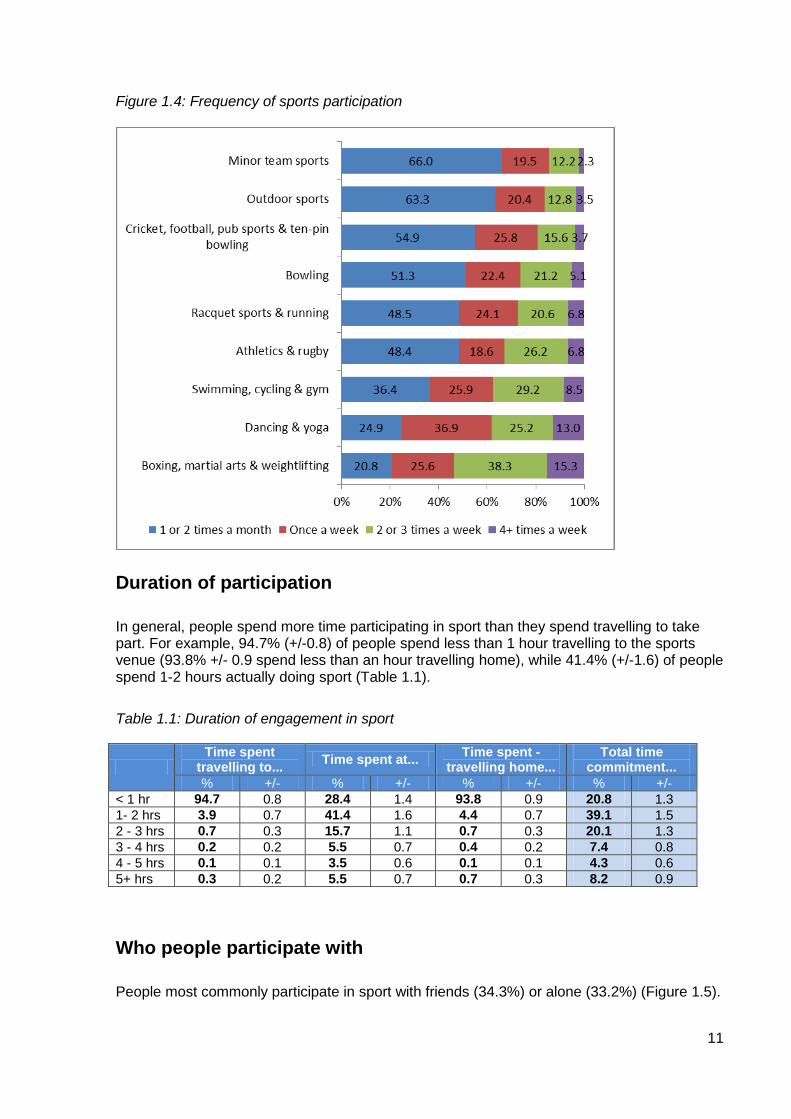
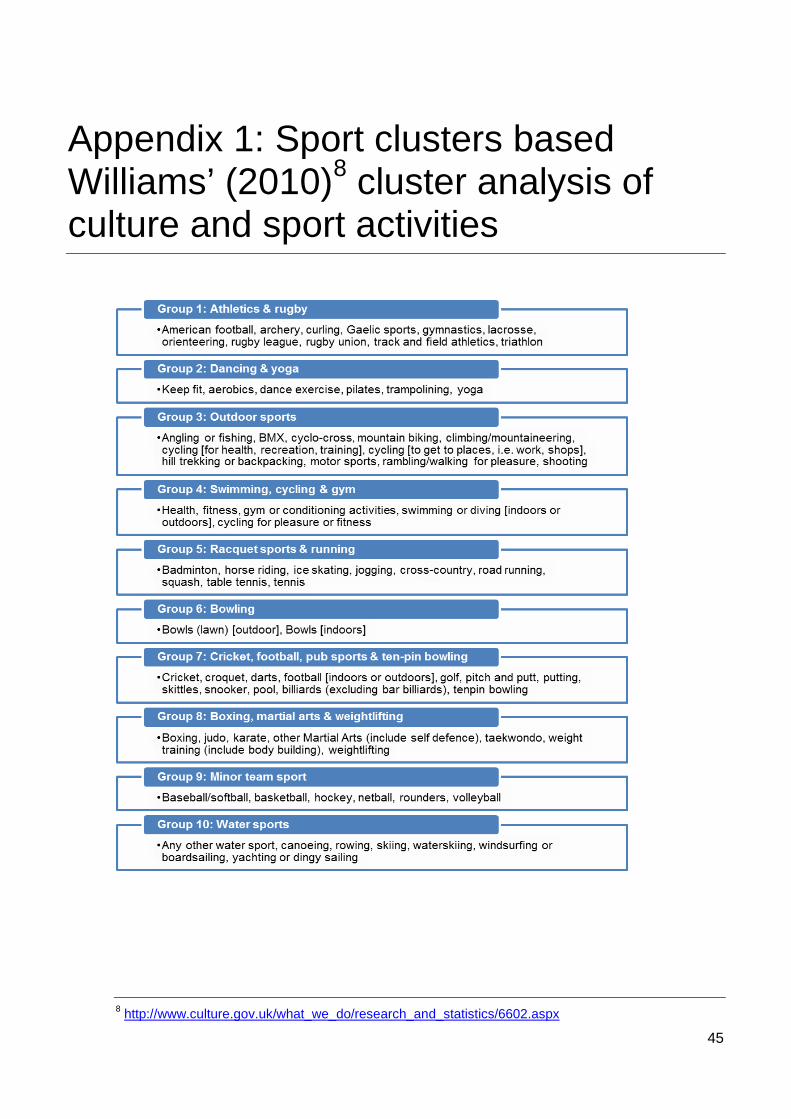
Meanwhile, the frequency with which people participate varies widely across the various sports. For ease of reporting, the 65 sports covered by Taking Part are grouped under 11 broad headings, based on Williams’ (2010)4 cluster analysis of culture and sport activities and
4 http://www.culture.gov.uk/what_we_do/research_and_statistics/6602.aspx
10
Buraimo et al.’s (2010)5 subsequent analysis on the drivers of sports participation. The groups are as follows6: 1. Athletics and rugby 2. Dancing and yoga 3. Outdoor sports 4. Swimming, cycling and gym 5. Racquet sports and running 6. Bowling 7. Cricket, football, pub sports and ten-pin bowling 8. Boxing, martial arts and weightlifting 9. Minor team sports 10. Water sports 11. Other sports Activities such as dancing, yoga, boxing, martial arts and weightlifting are characterised by frequent participation while sports such as athletics and rugby are characterised by less frequent engagement (Figure 1.4).
5 http://www.culture.gov.uk/what_we_do/research_and_statistics/6602.aspx 6 See Appendix 1 for a full break down of the groups
11
Figure 1.4: Frequency of sports participation
Duration of participation
In general, people spend more time participating in sport than they spend travelling to take part. For example, 94.7% (+/-0.8) of people spend less than 1 hour travelling to the sports venue (93.8% +/- 0.9 spend less than an hour travelling home), while 41.4% (+/-1.6) of people spend 1-2 hours actually doing sport (Table 1.1).
Table 1.1: Duration of engagement in sport
Time spent
travelling to... Time spent at... Time spent - travelling home...
Total time commitment...
% +/- % +/- % +/- % +/- < 1 hr 94.7 0.8 28.4 1.4 93.8 0.9 20.8 1.3 1- 2 hrs 3.9 0.7 41.4 1.6 4.4 0.7 39.1 1.5 2 - 3 hrs 0.7 0.3 15.7 1.1 0.7 0.3 20.1 1.3 3 - 4 hrs 0.2 0.2 5.5 0.7 0.4 0.2 7.4 0.8 4 - 5 hrs 0.1 0.1 3.5 0.6 0.1 0.1 4.3 0.6 5+ hrs 0.3 0.2 5.5 0.7 0.7 0.3 8.2 0.9
Who people participate with
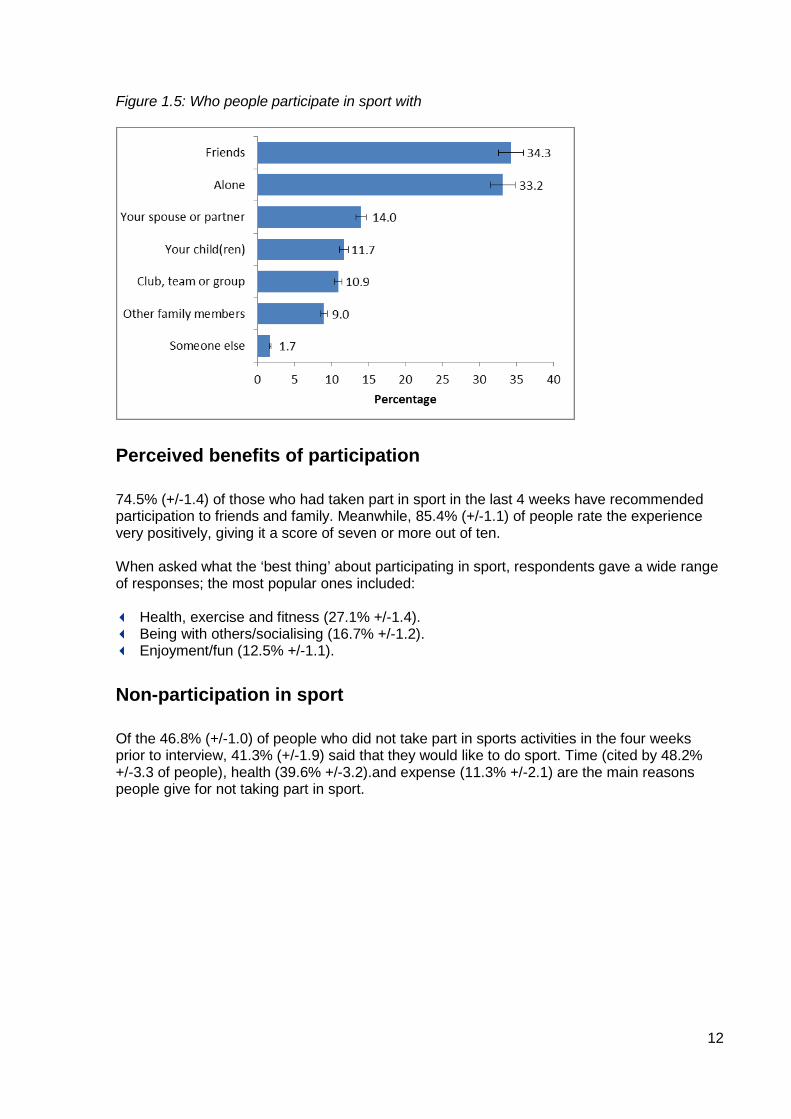
People most commonly participate in sport with friends (34.3%) or alone (33.2%) (Figure 1.5).
12
Figure 1.5: Who people participate in sport with
Perceived benefits of participation
74.5% (+/-1.4) of those who had taken part in sport in the last 4 weeks have recommended participation to friends and family. Meanwhile, 85.4% (+/-1.1) of people rate the experience very positively, giving it a score of seven or more out of ten. When asked what the ‘best thing’ about participating in sport, respondents gave a wide range of responses; the most popular ones included: Health, exercise and fitness (27.1% +/-1.4). Being with others/socialising (16.7% +/-1.2). Enjoyment/fun (12.5% +/-1.1).
Non-participation in sport
Of the 46.8% (+/-1.0) of people who did not take part in sports activities in the four weeks prior to interview, 41.3% (+/-1.9) said that they would like to do sport. Time (cited by 48.2% +/-3.3 of people), health (39.6% +/-3.2).and expense (11.3% +/-2.1) are the main reasons people give for not taking part in sport.
13
2. Participation in sport, by sex
Key findings
Men and women are equally likely to walk for health or recreational purposes. However,
men are more likely than women to cycle for health or recreation and to take part in sport. Three of the top five sports for men and women are the same: swimming, health and
fitness and cycling, but female participation is heavily concentrated in two activities (swimming and health and fitness) while male participation is more widely spread across a range of activities.
Women are more likely than men to do sport with their spouse or partner, their children or other family members while men are more likely to participate with friends.
The top three perceived benefits of participating in sport are the same for both men and women: health, exercise and fitness, being with others/socialising and enjoyment/fun.
Overview
Based on participation in the past four weeks, men (68.7% +/-1.3) and women (67.3% +/-1.2) are equally likely to walk for health or recreational purposes. However, men (14.4% +/-1.0) are more likely than women (6.4% +/-0.6) to cycle for health or recreational purposes. Men (60.8 % +/-1.5) are also more likely than women (46.0% +/-1.3) to take part in sport more generally. The top five sports for both men and women include swimming, cycling and health and fitness. Women are more likely than men to do aerobics and go jogging; while men are more likely to play football or snooker. While in overall terms men are more likely than women to participate in sport, this pattern varies by individual sports. For example, men (14.4% +/-1.0) are around twice as likely as women (6.4% +/-0.6) to cycle while women (16.5% +/-0.9) are more likely than men (13.0% +/-1.0) to swim.
Women’s participation is heavily concentrated in two activities (swimming and health and fitness) while men’s participation is more widely spread across a range of activities (Table 2.1).
14
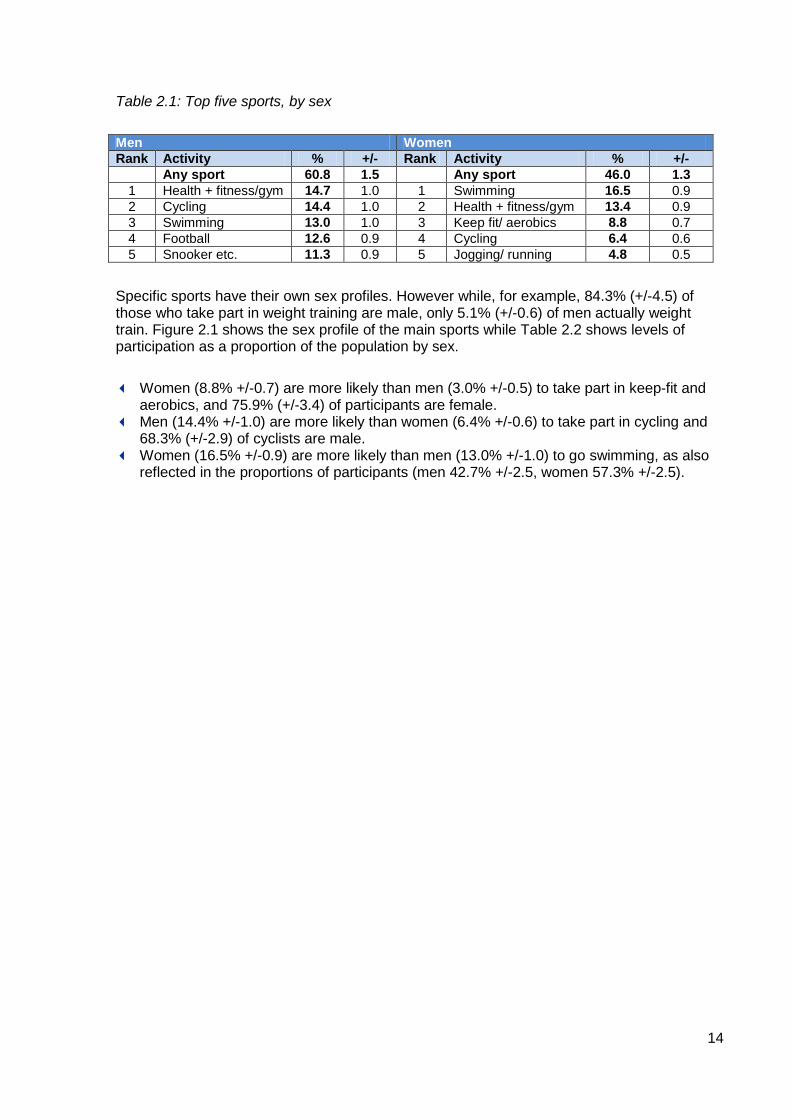
Table 2.1: Top five sports, by sex
Men Women Rank Activity % +/- Rank Activity % +/-
Any sport 60.8 1.5 Any sport 46.0 1.3 1 Health + fitness/gym 14.7 1.0 1 Swimming 16.5 0.9 2 Cycling 14.4 1.0 2 Health + fitness/gym 13.4 0.9 3 Swimming 13.0 1.0 3 Keep fit/ aerobics 8.8 0.7 4 Football 12.6 0.9 4 Cycling 6.4 0.6 5 Snooker etc. 11.3 0.9 5 Jogging/ running 4.8 0.5
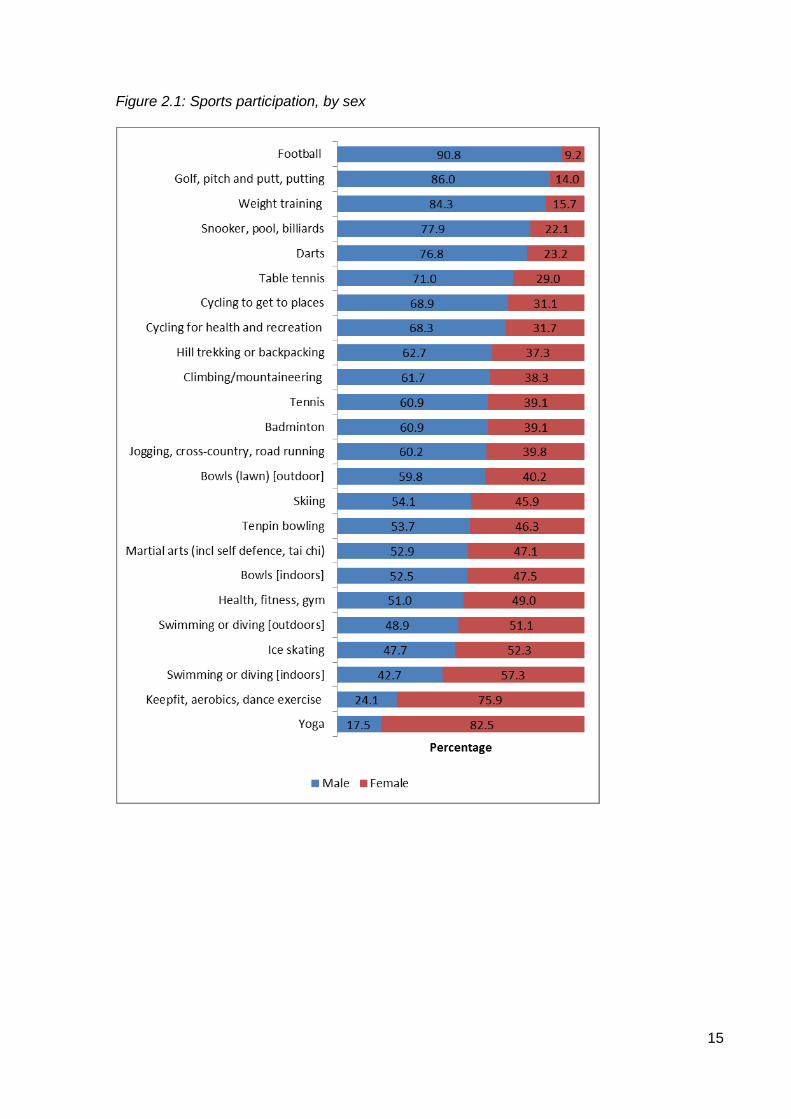
Specific sports have their own sex profiles. However while, for example, 84.3% (+/-4.5) of those who take part in weight training are male, only 5.1% (+/-0.6) of men actually weight train. Figure 2.1 shows the sex profile of the main sports while Table 2.2 shows levels of participation as a proportion of the population by sex.
Women (8.8% +/-0.7) are more likely than men (3.0% +/-0.5) to take part in keep-fit and
aerobics, and 75.9% (+/-3.4) of participants are female. Men (14.4% +/-1.0) are more likely than women (6.4% +/-0.6) to take part in cycling and
68.3% (+/-2.9) of cyclists are male. Women (16.5% +/-0.9) are more likely than men (13.0% +/-1.0) to go swimming, as also
reflected in the proportions of participants (men 42.7% +/-2.5, women 57.3% +/-2.5).
15
Figure 2.1: Sports participation, by sex
16
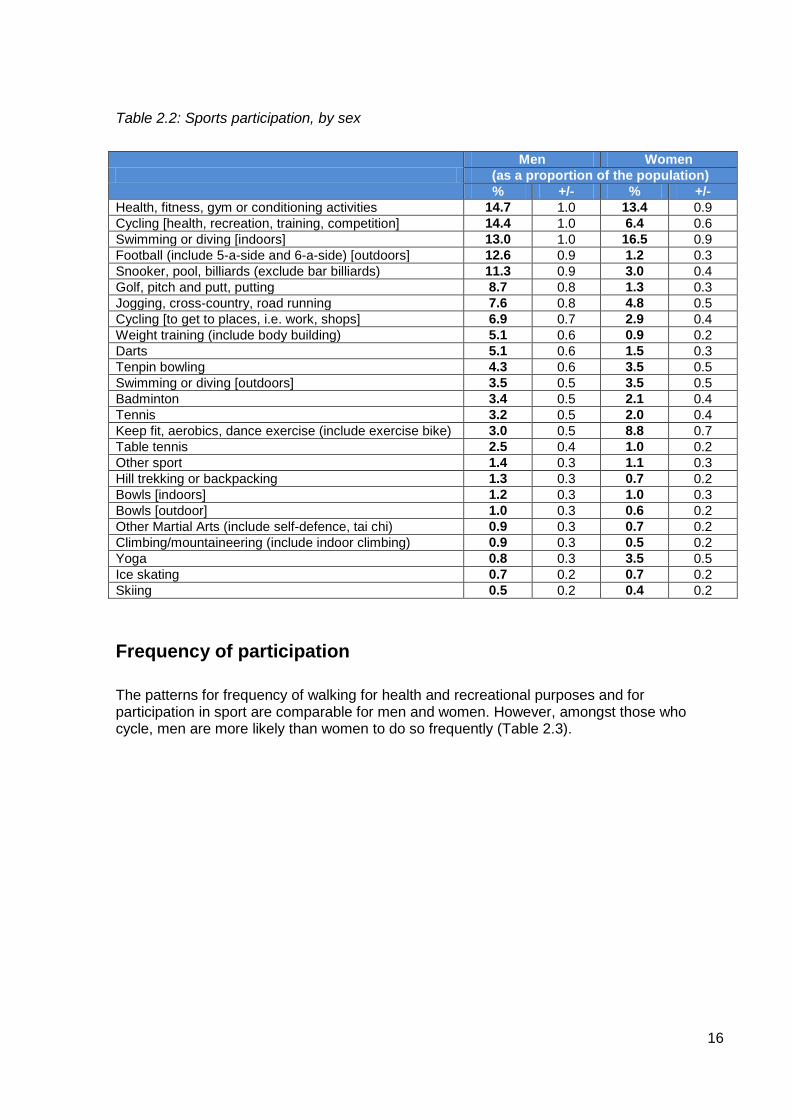
Table 2.2: Sports participation, by sex
Men Women
(as a proportion of the population) % +/- % +/-
Health, fitness, gym or conditioning activities 14.7 1.0 13.4 0.9 Cycling [health, recreation, training, competition] 14.4 1.0 6.4 0.6 Swimming or diving [indoors] 13.0 1.0 16.5 0.9 Football (include 5-a-side and 6-a-side) [outdoors] 12.6 0.9 1.2 0.3 Snooker, pool, billiards (exclude bar billiards) 11.3 0.9 3.0 0.4 Golf, pitch and putt, putting 8.7 0.8 1.3 0.3 Jogging, cross-country, road running 7.6 0.8 4.8 0.5 Cycling [to get to places, i.e. work, shops] 6.9 0.7 2.9 0.4 Weight training (include body building) 5.1 0.6 0.9 0.2 Darts 5.1 0.6 1.5 0.3 Tenpin bowling 4.3 0.6 3.5 0.5 Swimming or diving [outdoors] 3.5 0.5 3.5 0.5 Badminton 3.4 0.5 2.1 0.4 Tennis 3.2 0.5 2.0 0.4 Keep fit, aerobics, dance exercise (include exercise bike) 3.0 0.5 8.8 0.7 Table tennis 2.5 0.4 1.0 0.2 Other sport 1.4 0.3 1.1 0.3 Hill trekking or backpacking 1.3 0.3 0.7 0.2 Bowls [indoors] 1.2 0.3 1.0 0.3 Bowls [outdoor] 1.0 0.3 0.6 0.2 Other Martial Arts (include self-defence, tai chi) 0.9 0.3 0.7 0.2 Climbing/mountaineering (include indoor climbing) 0.9 0.3 0.5 0.2 Yoga 0.8 0.3 3.5 0.5 Ice skating 0.7 0.2 0.7 0.2 Skiing 0.5 0.2 0.4 0.2
Frequency of participation
The patterns for frequency of walking for health and recreational purposes and for participation in sport are comparable for men and women. However, amongst those who cycle, men are more likely than women to do so frequently (Table 2.3).
17
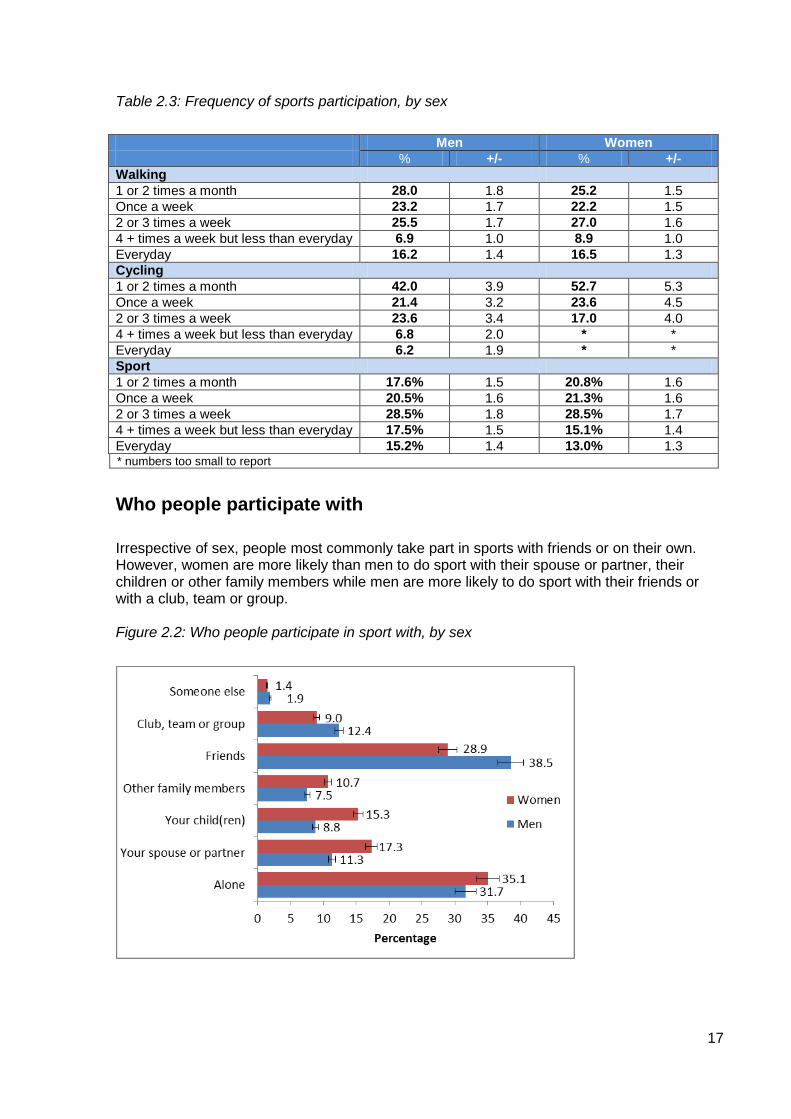
Table 2.3: Frequency of sports participation, by sex
Men Women % +/- % +/- Walking 1 or 2 times a month 28.0 1.8 25.2 1.5 Once a week 23.2 1.7 22.2 1.5 2 or 3 times a week 25.5 1.7 27.0 1.6 4 + times a week but less than everyday 6.9 1.0 8.9 1.0 Everyday 16.2 1.4 16.5 1.3 Cycling 1 or 2 times a month 42.0 3.9 52.7 5.3 Once a week 21.4 3.2 23.6 4.5 2 or 3 times a week 23.6 3.4 17.0 4.0 4 + times a week but less than everyday 6.8 2.0 * * Everyday 6.2 1.9 * * Sport 1 or 2 times a month 17.6% 1.5 20.8% 1.6 Once a week 20.5% 1.6 21.3% 1.6 2 or 3 times a week 28.5% 1.8 28.5% 1.7 4 + times a week but less than everyday 17.5% 1.5 15.1% 1.4 Everyday 15.2% 1.4 13.0% 1.3 * numbers too small to report
Who people participate with
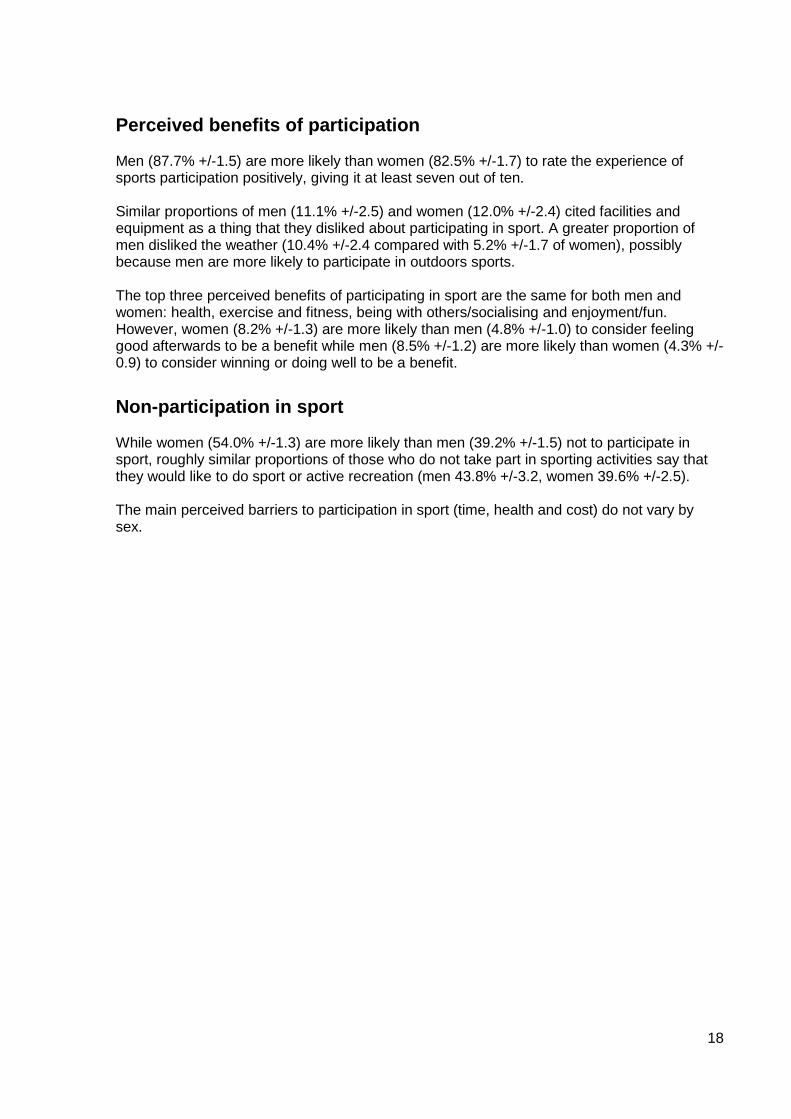
Irrespective of sex, people most commonly take part in sports with friends or on their own. However, women are more likely than men to do sport with their spouse or partner, their children or other family members while men are more likely to do sport with their friends or with a club, team or group. Figure 2.2: Who people participate in sport with, by sex
18
Perceived benefits of participation Men (87.7% +/-1.5) are more likely than women (82.5% +/-1.7) to rate the experience of sports participation positively, giving it at least seven out of ten. Similar proportions of men (11.1% +/-2.5) and women (12.0% +/-2.4) cited facilities and equipment as a thing that they disliked about participating in sport. A greater proportion of men disliked the weather (10.4% +/-2.4 compared with 5.2% +/-1.7 of women), possibly because men are more likely to participate in outdoors sports. The top three perceived benefits of participating in sport are the same for both men and women: health, exercise and fitness, being with others/socialising and enjoyment/fun. However, women (8.2% +/-1.3) are more likely than men (4.8% +/-1.0) to consider feeling good afterwards to be a benefit while men (8.5% +/-1.2) are more likely than women (4.3% +/-0.9) to consider winning or doing well to be a benefit.
Non-participation in sport While women (54.0% +/-1.3) are more likely than men (39.2% +/-1.5) not to participate in sport, roughly similar proportions of those who do not take part in sporting activities say that they would like to do sport or active recreation (men 43.8% +/-3.2, women 39.6% +/-2.5). The main perceived barriers to participation in sport (time, health and cost) do not vary by sex.
19
3. Participation in sport, by age
Key findings
Not surprisingly, sport participation end to be lower among older people and higher among younger people.
The proportion of people walking for health and recreation is relatively high across all age groups, ranging from 37.5% of those aged 75+ to 73.9% of those aged 25-44.
Sport and active recreation is more commonly undertaken by those in the younger age groups. For example, 73.7% of 16-24 year olds had done sport in the 4 weeks prior to interview compared with 16.7% of those aged 75+.
The most popular sports also vary by age group. For example, golf is a top ten activity for all age groups except 16-24 year olds.
Overview
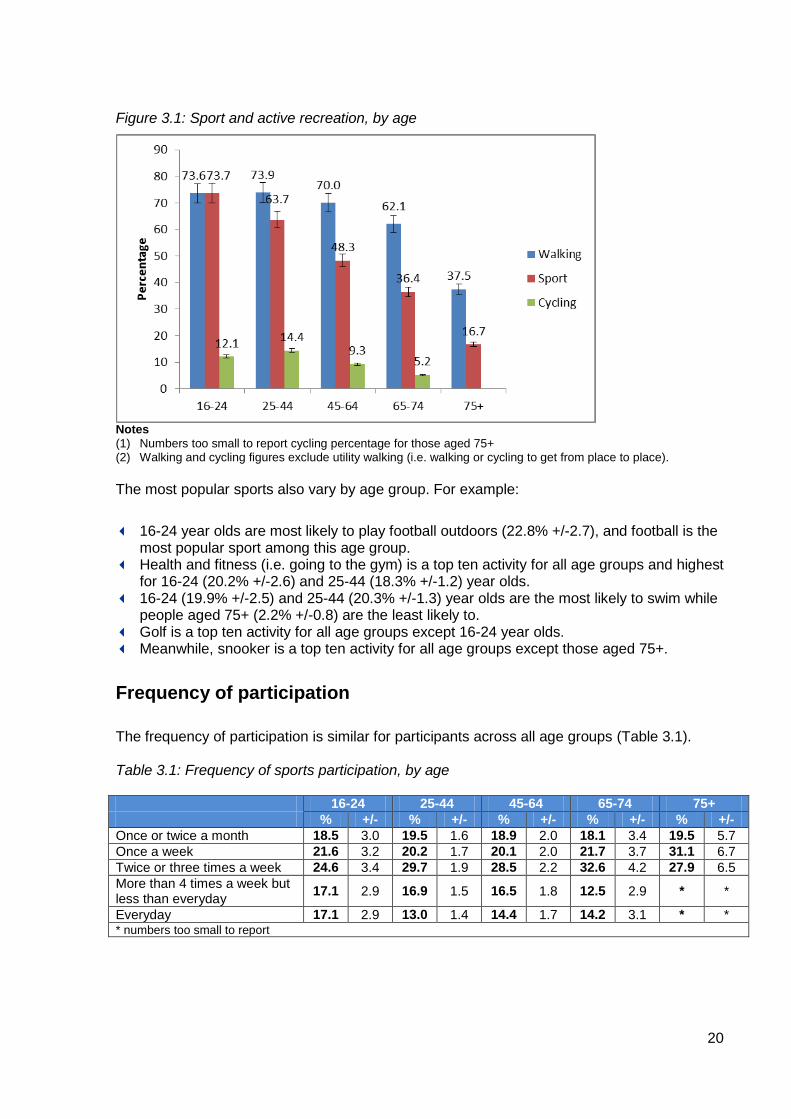
In general and not surprisingly, younger people are more likely to take part in sport and active recreation. For example, 73.7% (+/-2.7) of 16-24 year olds had done sport in the 4 weeks prior to interview compared with 16.7% (+/-2.0) of those aged 75+. Meanwhile, cycling for health and health and recreation is slightly higher among those aged 25-44 (14.4%) compared with the other age groups (ranging from 5.2% of 65-74 year olds to 12.1% of 16-24 year olds) (Figure 3.1).
20
Figure 3.1: Sport and active recreation, by age
Notes (1) Numbers too small to report cycling percentage for those aged 75+ (2) Walking and cycling figures exclude utility walking (i.e. walking or cycling to get from place to place).
The most popular sports also vary by age group. For example:
16-24 year olds are most likely to play football outdoors (22.8% +/-2.7), and football is the
most popular sport among this age group. Health and fitness (i.e. going to the gym) is a top ten activity for all age groups and highest
for 16-24 (20.2% +/-2.6) and 25-44 (18.3% +/-1.2) year olds. 16-24 (19.9% +/-2.5) and 25-44 (20.3% +/-1.3) year olds are the most likely to swim while
people aged 75+ (2.2% +/-0.8) are the least likely to. Golf is a top ten activity for all age groups except 16-24 year olds. Meanwhile, snooker is a top ten activity for all age groups except those aged 75+.
Frequency of participation
The frequency of participation is similar for participants across all age groups (Table 3.1). Table 3.1: Frequency of sports participation, by age 16-24 25-44 45-64 65-74 75+ % +/- % +/- % +/- % +/- % +/- Once or twice a month 18.5 3.0 19.5 1.6 18.9 2.0 18.1 3.4 19.5 5.7 Once a week 21.6 3.2 20.2 1.7 20.1 2.0 21.7 3.7 31.1 6.7 Twice or three times a week 24.6 3.4 29.7 1.9 28.5 2.2 32.6 4.2 27.9 6.5 More than 4 times a week but less than everyday 17.1 2.9 16.9 1.5 16.5 1.8 12.5 2.9 * *
Everyday 17.1 2.9 13.0 1.4 14.4 1.7 14.2 3.1 * * * numbers too small to report
21
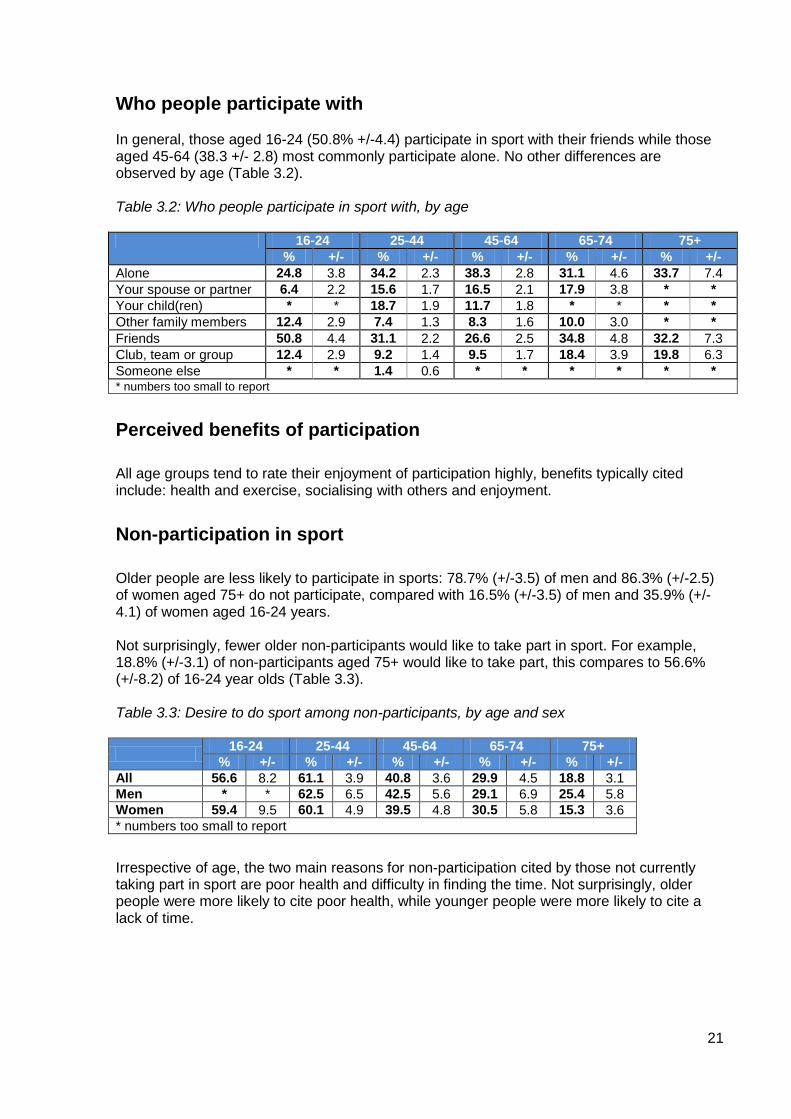
Who people participate with In general, those aged 16-24 (50.8% +/-4.4) participate in sport with their friends while those aged 45-64 (38.3 +/- 2.8) most commonly participate alone. No other differences are observed by age (Table 3.2). Table 3.2: Who people participate in sport with, by age 16-24 25-44 45-64 65-74 75+
% +/- % +/- % +/- % +/- % +/- Alone 24.8 3.8 34.2 2.3 38.3 2.8 31.1 4.6 33.7 7.4 Your spouse or partner 6.4 2.2 15.6 1.7 16.5 2.1 17.9 3.8 * * Your child(ren) * * 18.7 1.9 11.7 1.8 * * * * Other family members 12.4 2.9 7.4 1.3 8.3 1.6 10.0 3.0 * * Friends 50.8 4.4 31.1 2.2 26.6 2.5 34.8 4.8 32.2 7.3 Club, team or group 12.4 2.9 9.2 1.4 9.5 1.7 18.4 3.9 19.8 6.3 Someone else * * 1.4 0.6 * * * * * * * numbers too small to report
Perceived benefits of participation
All age groups tend to rate their enjoyment of participation highly, benefits typically cited include: health and exercise, socialising with others and enjoyment.
Non-participation in sport
Older people are less likely to participate in sports: 78.7% (+/-3.5) of men and 86.3% (+/-2.5) of women aged 75+ do not participate, compared with 16.5% (+/-3.5) of men and 35.9% (+/-4.1) of women aged 16-24 years. Not surprisingly, fewer older non-participants would like to take part in sport. For example, 18.8% (+/-3.1) of non-participants aged 75+ would like to take part, this compares to 56.6% (+/-8.2) of 16-24 year olds (Table 3.3).
Table 3.3: Desire to do sport among non-participants, by age and sex 16-24 25-44 45-64 65-74 75+
% +/- % +/- % +/- % +/- % +/- All 56.6 8.2 61.1 3.9 40.8 3.6 29.9 4.5 18.8 3.1 Men * * 62.5 6.5 42.5 5.6 29.1 6.9 25.4 5.8 Women 59.4 9.5 60.1 4.9 39.5 4.8 30.5 5.8 15.3 3.6 * numbers too small to report
Irrespective of age, the two main reasons for non-participation cited by those not currently taking part in sport are poor health and difficulty in finding the time. Not surprisingly, older people were more likely to cite poor health, while younger people were more likely to cite a lack of time.
22
4. Participation in sport, by ethnicity
Key findings
While white people are more likely than BME people to cycle for health and recreation, there are no differences between the groups in relation to walking or taking part in sport more generally.
BME people are almost twice as likely as white people to play football. BME people are more likely to participate in sport alone while white people are more likely
to participate with their children or a group, club or team.
Overview White people (10.7% +/-0.6) are more likely than BME people (6.5% +/-1.5) to cycle for health and recreation but are equally likely to walk for health and recreation purposes (68.3% +/-0.8 of white people and 65.1% +/-2.8 of BME people) and play sport more generally (53.6% +/-1.1 of white people and 50.3% +/-3.5 of BME people took part in sport in the four weeks prior to interview). The top five sports for white and BME people include swimming, cycling, football and health and fitness. While four of the top five sports are the same for both groups, the percentages differ and there is some variation in their rank order position. For example, BME people are more likely to play football (10.3% +/-1.8 compared with 6.4% +/-0.5 of white people) while white people are more likely to cycle (10.7% +/-0.6 compared with 6.5% +/-1.5 of BME people). The participation rates for swimming are also noticeably higher for white people (15.2% +/-0.7) compared to BME people (10.7% +/-1.8) (Table 4.1).
Table 4.1: Top five sports, by ethnicity White BME Rank Activity % +/- Rank Activity % +/-
1 Swimming 15.2 0.7 1 Health + fitness/gym 16.2 2.2 2 Health + fitness/gym 13.8 0.7 2 Swimming 10.7 1.8 3 Cycling 10.7 0.6 3 Football 10.3 1.8 4 Snooker etc. 7.2 0.5 4 Keep fit/aerobics 7.6 1.6 5 Football 6.4 0.5 5 Cycling 6.5 1.5
Participation rates in the other sports do not vary much. However, BME people are more likely than white people to play cricket (3.2% +/-1.1 compared with 1.2% +/-0.2) and basketball (2.9% +/-1.0 compared with 0.8% +/-0.2).
23
Frequency of participation The frequency of participation does not vary much by ethnicity.
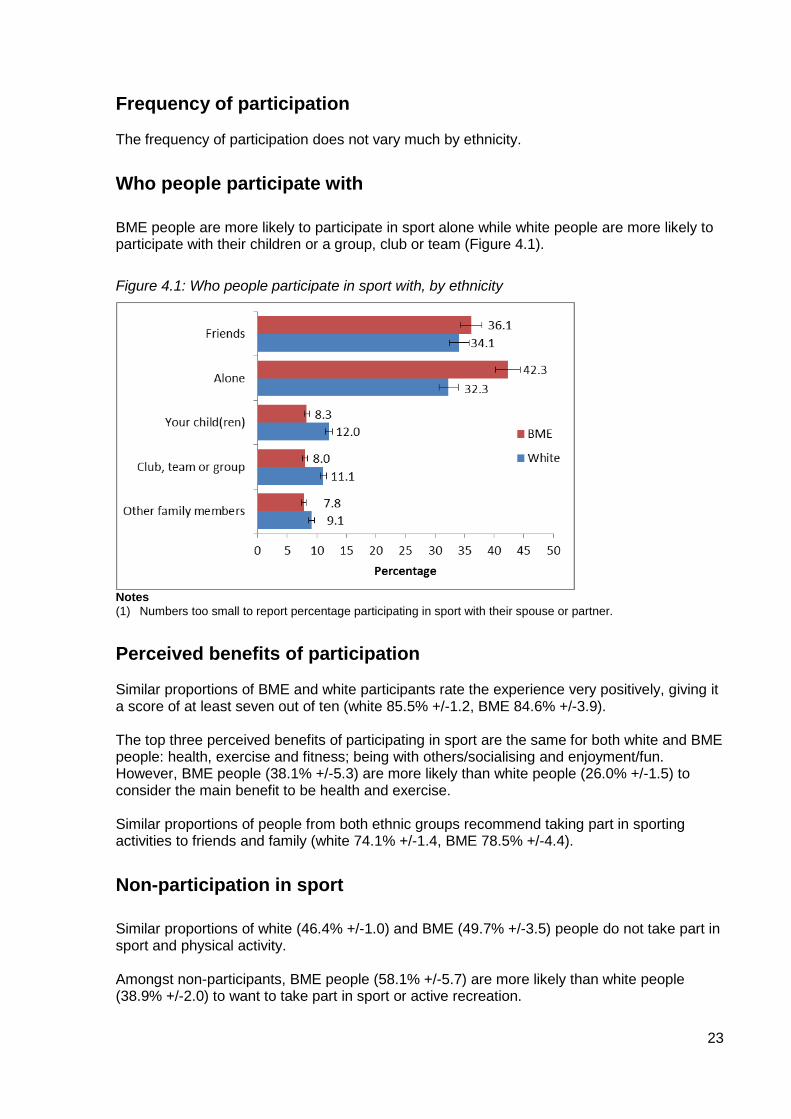
Who people participate with
BME people are more likely to participate in sport alone while white people are more likely to participate with their children or a group, club or team (Figure 4.1).
Figure 4.1: Who people participate in sport with, by ethnicity
Notes (1) Numbers too small to report percentage participating in sport with their spouse or partner.
Perceived benefits of participation Similar proportions of BME and white participants rate the experience very positively, giving it a score of at least seven out of ten (white 85.5% +/-1.2, BME 84.6% +/-3.9). The top three perceived benefits of participating in sport are the same for both white and BME people: health, exercise and fitness; being with others/socialising and enjoyment/fun. However, BME people (38.1% +/-5.3) are more likely than white people (26.0% +/-1.5) to consider the main benefit to be health and exercise. Similar proportions of people from both ethnic groups recommend taking part in sporting activities to friends and family (white 74.1% +/-1.4, BME 78.5% +/-4.4).
Non-participation in sport
Similar proportions of white (46.4% +/-1.0) and BME (49.7% +/-3.5) people do not take part in sport and physical activity. Amongst non-participants, BME people (58.1% +/-5.7) are more likely than white people (38.9% +/-2.0) to want to take part in sport or active recreation.
24
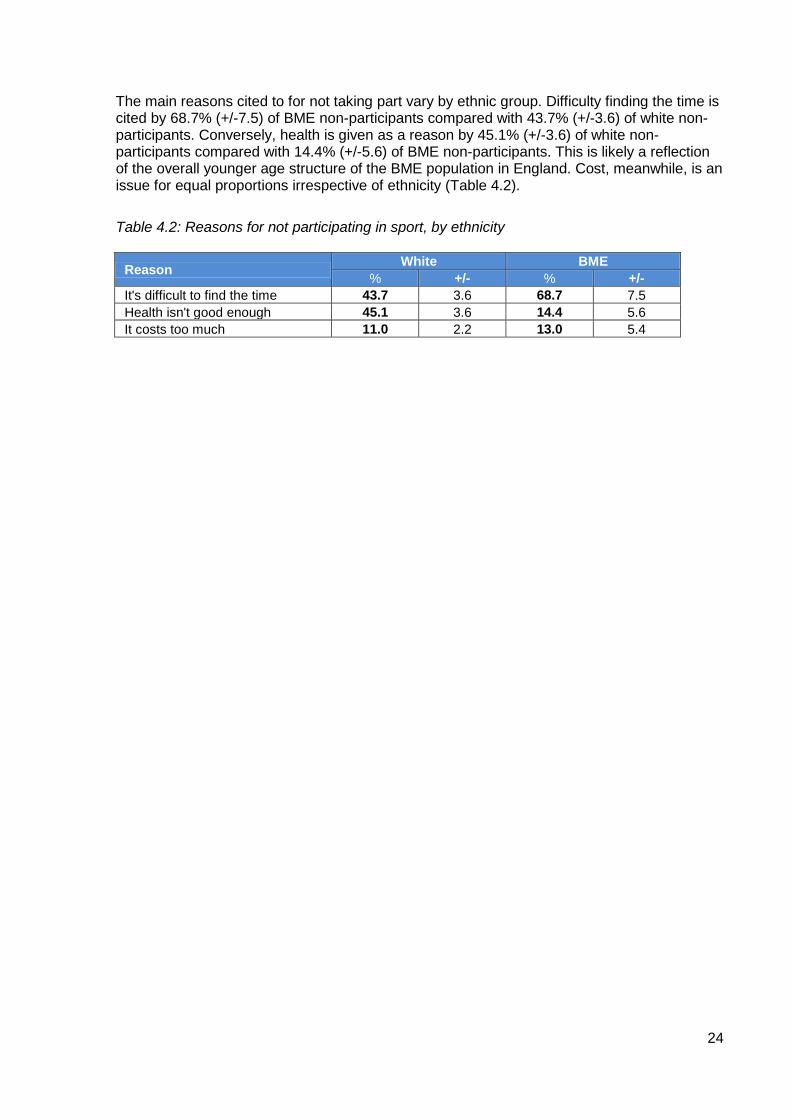
The main reasons cited to for not taking part vary by ethnic group. Difficulty finding the time is cited by 68.7% (+/-7.5) of BME non-participants compared with 43.7% (+/-3.6) of white non-participants. Conversely, health is given as a reason by 45.1% (+/-3.6) of white non-participants compared with 14.4% (+/-5.6) of BME non-participants. This is likely a reflection of the overall younger age structure of the BME population in England. Cost, meanwhile, is an issue for equal proportions irrespective of ethnicity (Table 4.2).
Table 4.2: Reasons for not participating in sport, by ethnicity
Reason White BME % +/- % +/-
It's difficult to find the time 43.7 3.6 68.7 7.5 Health isn't good enough 45.1 3.6 14.4 5.6 It costs too much 11.0 2.2 13.0 5.4
25
5. Participation in sport, by household type
Key findings
Participation in sport and recreation varies by household type. Health and fitness is the most popular type of sports activity across all household types
without children. Among households with children, swimming is the most popular sport.
Overview
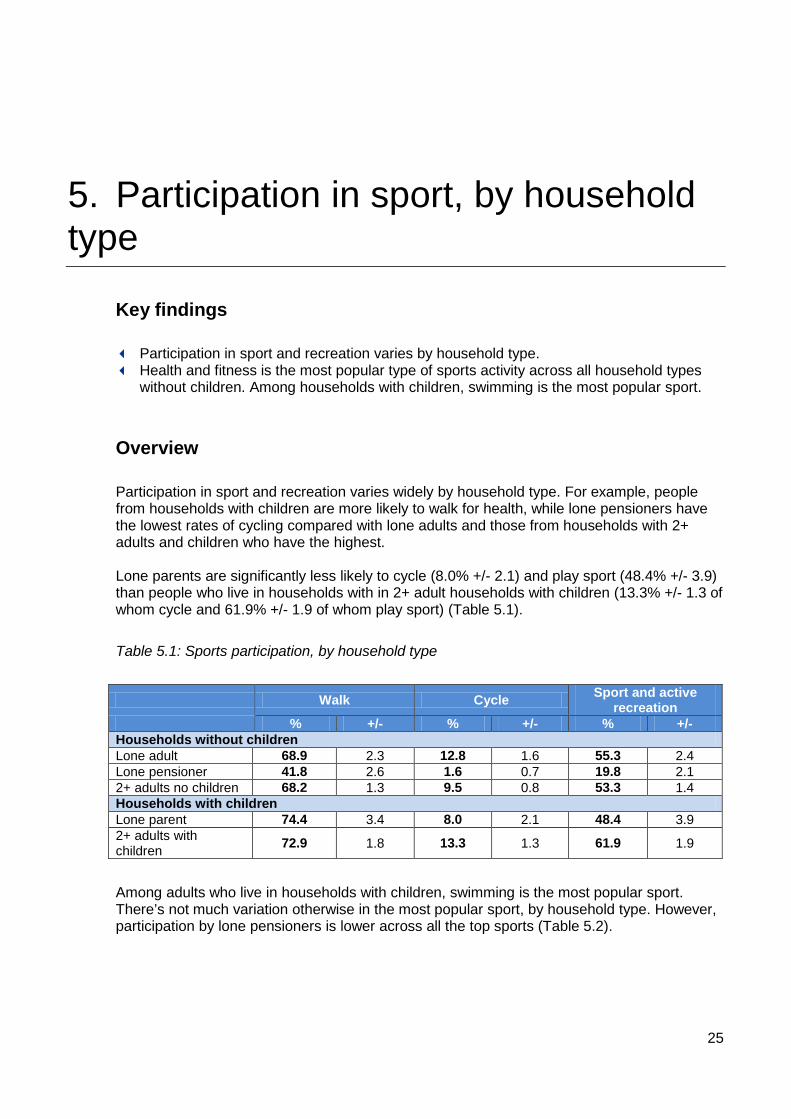
Participation in sport and recreation varies widely by household type. For example, people from households with children are more likely to walk for health, while lone pensioners have the lowest rates of cycling compared with lone adults and those from households with 2+ adults and children who have the highest. Lone parents are significantly less likely to cycle (8.0% +/- 2.1) and play sport (48.4% +/- 3.9) than people who live in households with in 2+ adult households with children (13.3% +/- 1.3 of whom cycle and 61.9% +/- 1.9 of whom play sport) (Table 5.1).
Table 5.1: Sports participation, by household type
Walk Cycle Sport and active
recreation % +/- % +/- % +/-
Households without children Lone adult 68.9 2.3 12.8 1.6 55.3 2.4 Lone pensioner 41.8 2.6 1.6 0.7 19.8 2.1 2+ adults no children 68.2 1.3 9.5 0.8 53.3 1.4 Households with children Lone parent 74.4 3.4 8.0 2.1 48.4 3.9 2+ adults with children 72.9 1.8 13.3 1.3 61.9 1.9
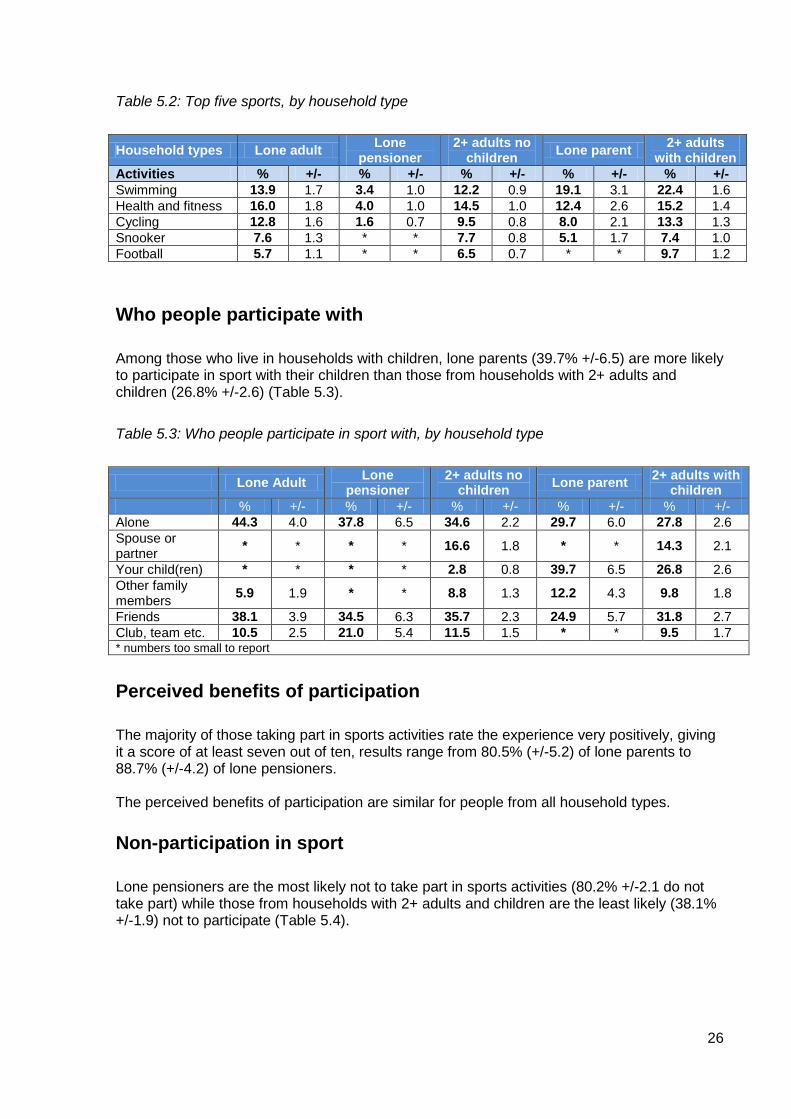
Among adults who live in households with children, swimming is the most popular sport. There’s not much variation otherwise in the most popular sport, by household type. However, participation by lone pensioners is lower across all the top sports (Table 5.2).
26
Table 5.2: Top five sports, by household type
Household types Lone adult Lone
pensioner 2+ adults no
children Lone parent 2+ adults with children
Activities % +/- % +/- % +/- % +/- % +/- Swimming 13.9 1.7 3.4 1.0 12.2 0.9 19.1 3.1 22.4 1.6 Health and fitness 16.0 1.8 4.0 1.0 14.5 1.0 12.4 2.6 15.2 1.4 Cycling 12.8 1.6 1.6 0.7 9.5 0.8 8.0 2.1 13.3 1.3 Snooker 7.6 1.3 * * 7.7 0.8 5.1 1.7 7.4 1.0 Football 5.7 1.1 * * 6.5 0.7 * * 9.7 1.2
Who people participate with
Among those who live in households with children, lone parents (39.7% +/-6.5) are more likely to participate in sport with their children than those from households with 2+ adults and children (26.8% +/-2.6) (Table 5.3).
Table 5.3: Who people participate in sport with, by household type
Lone Adult Lone
pensioner 2+ adults no
children Lone parent 2+ adults with children
% +/- % +/- % +/- % +/- % +/- Alone 44.3 4.0 37.8 6.5 34.6 2.2 29.7 6.0 27.8 2.6 Spouse or partner * * * * 16.6 1.8 * * 14.3 2.1
Your child(ren) * * * * 2.8 0.8 39.7 6.5 26.8 2.6 Other family members 5.9 1.9 * * 8.8 1.3 12.2 4.3 9.8 1.8
Friends 38.1 3.9 34.5 6.3 35.7 2.3 24.9 5.7 31.8 2.7 Club, team etc. 10.5 2.5 21.0 5.4 11.5 1.5 * * 9.5 1.7 * numbers too small to report
Perceived benefits of participation
The majority of those taking part in sports activities rate the experience very positively, giving it a score of at least seven out of ten, results range from 80.5% (+/-5.2) of lone parents to 88.7% (+/-4.2) of lone pensioners. The perceived benefits of participation are similar for people from all household types. Non-participation in sport
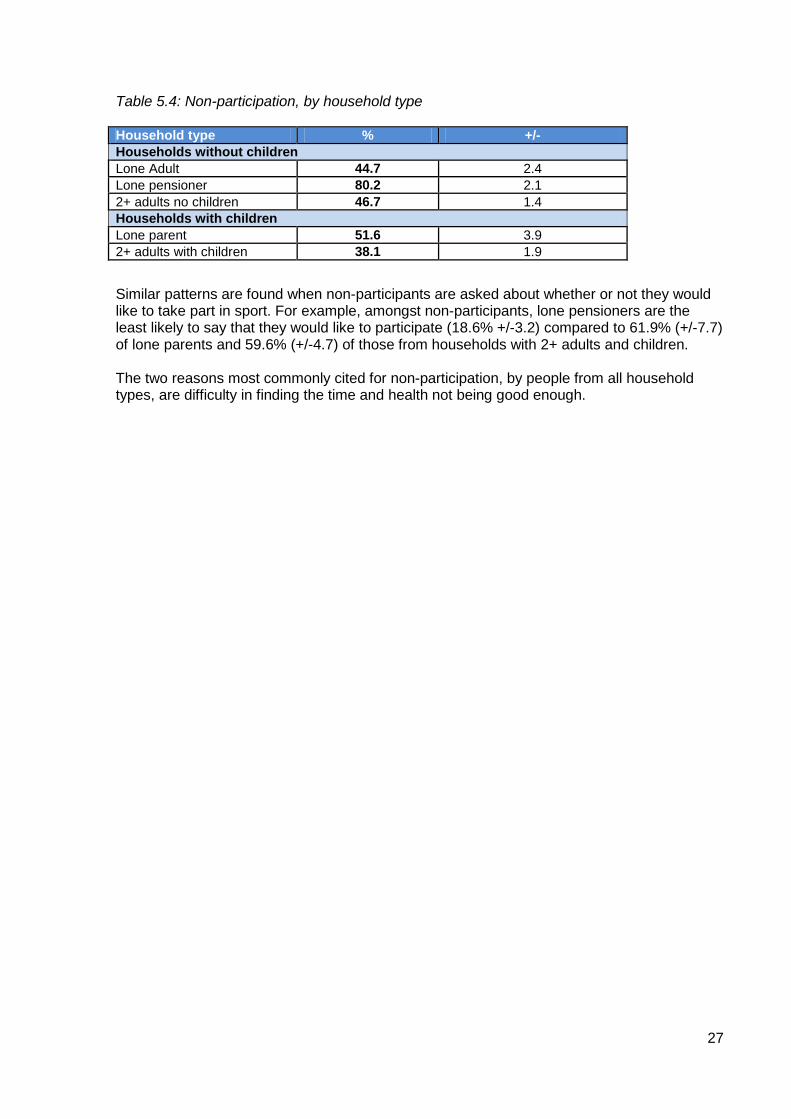
Lone pensioners are the most likely not to take part in sports activities (80.2% +/-2.1 do not take part) while those from households with 2+ adults and children are the least likely (38.1% +/-1.9) not to participate (Table 5.4).
27
Table 5.4: Non-participation, by household type Household type % +/- Households without children Lone Adult 44.7 2.4 Lone pensioner 80.2 2.1 2+ adults no children 46.7 1.4 Households with children Lone parent 51.6 3.9 2+ adults with children 38.1 1.9
Similar patterns are found when non-participants are asked about whether or not they would like to take part in sport. For example, amongst non-participants, lone pensioners are the least likely to say that they would like to participate (18.6% +/-3.2) compared to 61.9% (+/-7.7) of lone parents and 59.6% (+/-4.7) of those from households with 2+ adults and children. The two reasons most commonly cited for non-participation, by people from all household types, are difficulty in finding the time and health not being good enough.
28
6. Participation in sport, by economic and social indicators
Key findings
Participation in sport, walking and cycling for health varies widely by tenure, employment
and socio-economic status. Among those who live in privately rented accommodation, health and fitness is the most
popular sport. Across all the other types of tenure, swimming is the most popular sport. People with access to a car have higher rates of walking and cycling for health and
recreation and sports participation than those without access to a car.
Tenure
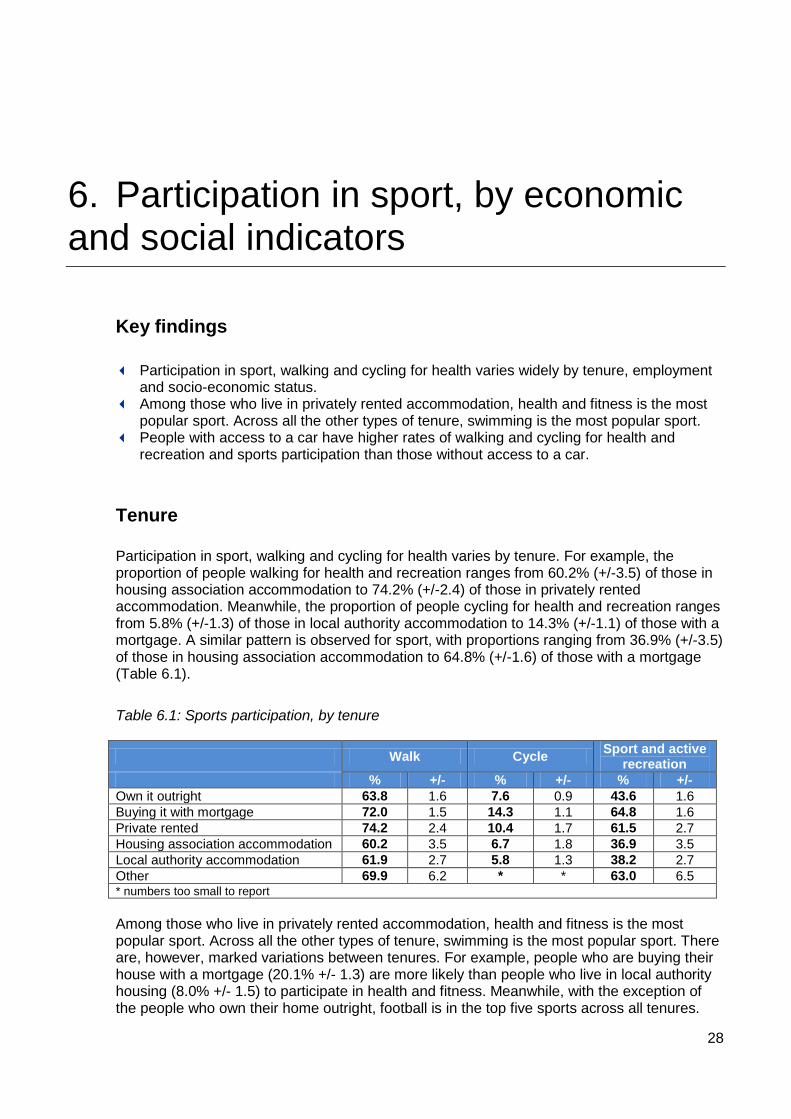
Participation in sport, walking and cycling for health varies by tenure. For example, the proportion of people walking for health and recreation ranges from 60.2% (+/-3.5) of those in housing association accommodation to 74.2% (+/-2.4) of those in privately rented accommodation. Meanwhile, the proportion of people cycling for health and recreation ranges from 5.8% (+/-1.3) of those in local authority accommodation to 14.3% (+/-1.1) of those with a mortgage. A similar pattern is observed for sport, with proportions ranging from 36.9% (+/-3.5) of those in housing association accommodation to 64.8% (+/-1.6) of those with a mortgage (Table 6.1).
Table 6.1: Sports participation, by tenure
Walk Cycle Sport and active recreation
% +/- % +/- % +/- Own it outright 63.8 1.6 7.6 0.9 43.6 1.6 Buying it with mortgage 72.0 1.5 14.3 1.1 64.8 1.6 Private rented 74.2 2.4 10.4 1.7 61.5 2.7 Housing association accommodation 60.2 3.5 6.7 1.8 36.9 3.5 Local authority accommodation 61.9 2.7 5.8 1.3 38.2 2.7 Other 69.9 6.2 * * 63.0 6.5 * numbers too small to report Among those who live in privately rented accommodation, health and fitness is the most popular sport. Across all the other types of tenure, swimming is the most popular sport. There are, however, marked variations between tenures. For example, people who are buying their house with a mortgage (20.1% +/- 1.3) are more likely than people who live in local authority housing (8.0% +/- 1.5) to participate in health and fitness. Meanwhile, with the exception of the people who own their home outright, football is in the top five sports across all tenures.
29
This is probably because people who own their own home are more likely to be older, and paying football is more common among younger people.
Those living in housing association (63.1% +/-3.5) and local authority (61.8% +/-2.7) housing are the most likely not to take part in sport and active recreation. Among non-participants, people who are own their homes outright (31.9% +/-3.0) and those living in local authority housing (35.1% +/-4.5) are the least likely to say that they want to take part in sports. Conversely, those buying homes with a mortgage (53.8% +/-4.2) or privately renting (53.7% +/-6.1) are the most likely to say they want to take up sport.
Access to a car
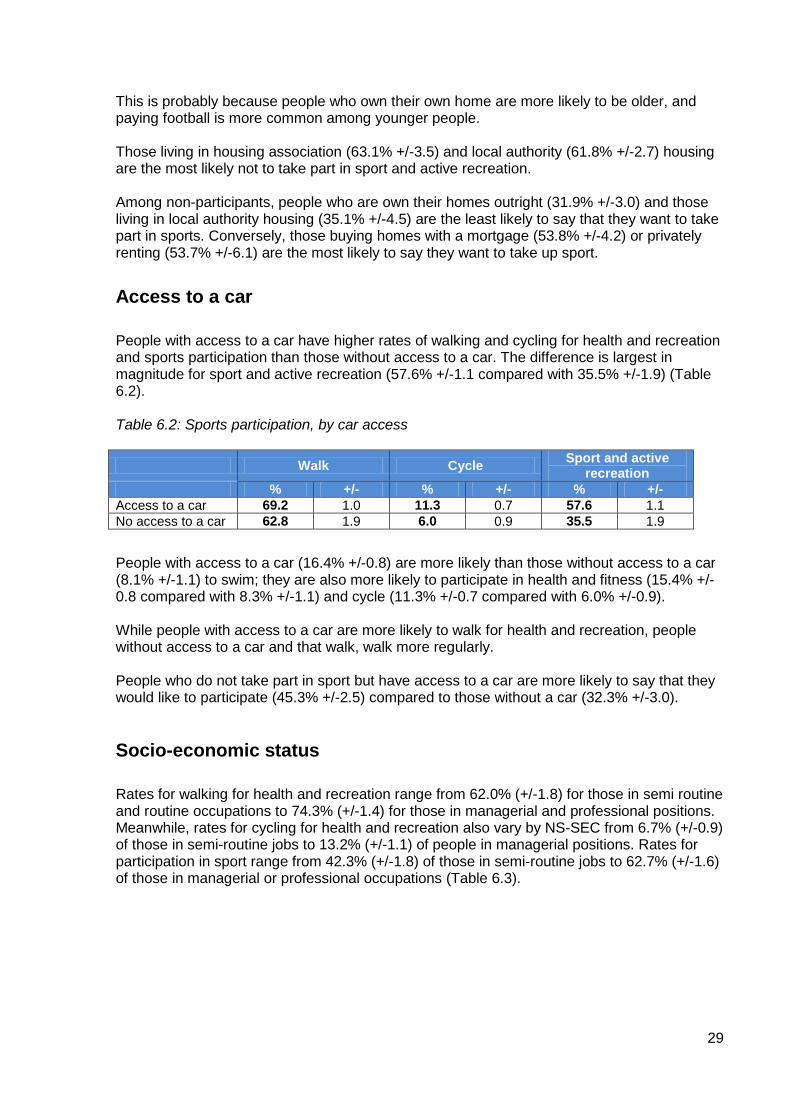
People with access to a car have higher rates of walking and cycling for health and recreation and sports participation than those without access to a car. The difference is largest in magnitude for sport and active recreation (57.6% +/-1.1 compared with 35.5% +/-1.9) (Table 6.2). Table 6.2: Sports participation, by car access
Walk Cycle Sport and active recreation
% +/- % +/- % +/- Access to a car 69.2 1.0 11.3 0.7 57.6 1.1 No access to a car 62.8 1.9 6.0 0.9 35.5 1.9
People with access to a car (16.4% +/-0.8) are more likely than those without access to a car (8.1% +/-1.1) to swim; they are also more likely to participate in health and fitness (15.4% +/-0.8 compared with 8.3% +/-1.1) and cycle (11.3% +/-0.7 compared with 6.0% +/-0.9). While people with access to a car are more likely to walk for health and recreation, people without access to a car and that walk, walk more regularly. People who do not take part in sport but have access to a car are more likely to say that they would like to participate (45.3% +/-2.5) compared to those without a car (32.3% +/-3.0). Socio-economic status
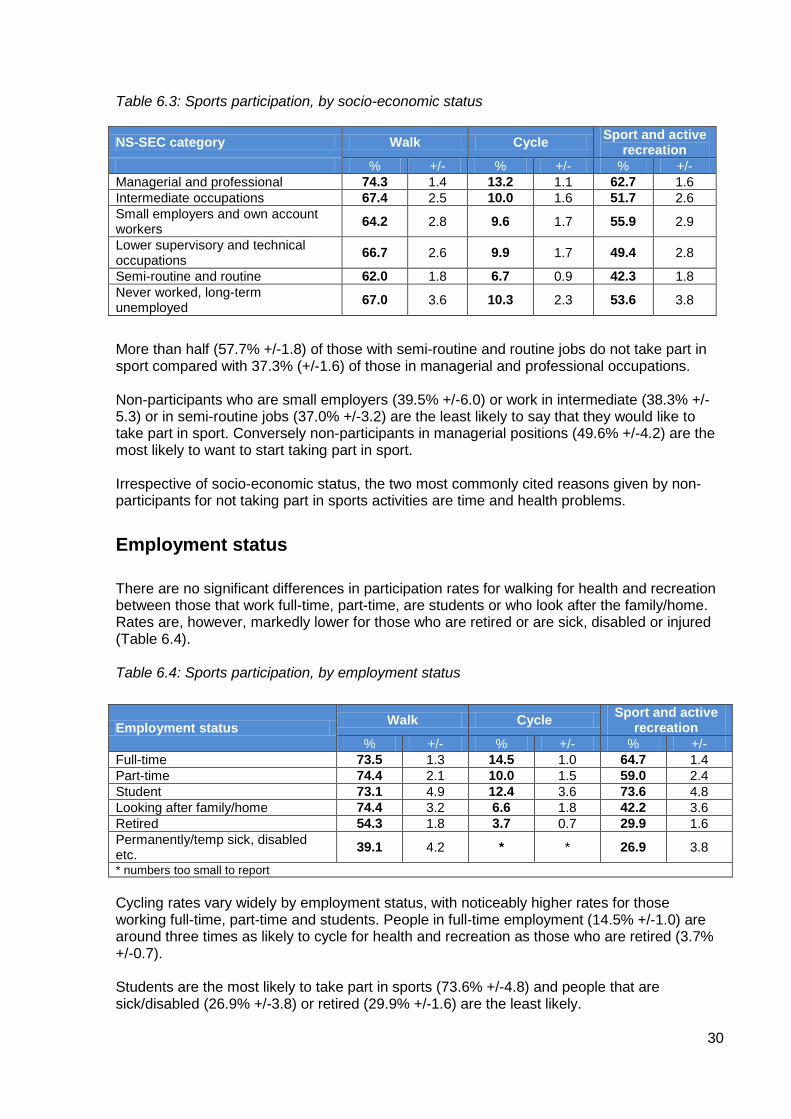
Rates for walking for health and recreation range from 62.0% (+/-1.8) for those in semi routine and routine occupations to 74.3% (+/-1.4) for those in managerial and professional positions. Meanwhile, rates for cycling for health and recreation also vary by NS-SEC from 6.7% (+/-0.9) of those in semi-routine jobs to 13.2% (+/-1.1) of people in managerial positions. Rates for participation in sport range from 42.3% (+/-1.8) of those in semi-routine jobs to 62.7% (+/-1.6) of those in managerial or professional occupations (Table 6.3).
30
Table 6.3: Sports participation, by socio-economic status NS-SEC category Walk Cycle Sport and active
recreation % +/- % +/- % +/-
Managerial and professional 74.3 1.4 13.2 1.1 62.7 1.6 Intermediate occupations 67.4 2.5 10.0 1.6 51.7 2.6 Small employers and own account workers 64.2 2.8 9.6 1.7 55.9 2.9
Lower supervisory and technical occupations 66.7 2.6 9.9 1.7 49.4 2.8
Semi-routine and routine 62.0 1.8 6.7 0.9 42.3 1.8 Never worked, long-term unemployed 67.0 3.6 10.3 2.3 53.6 3.8
More than half (57.7% +/-1.8) of those with semi-routine and routine jobs do not take part in sport compared with 37.3% (+/-1.6) of those in managerial and professional occupations. Non-participants who are small employers (39.5% +/-6.0) or work in intermediate (38.3% +/-5.3) or in semi-routine jobs (37.0% +/-3.2) are the least likely to say that they would like to take part in sport. Conversely non-participants in managerial positions (49.6% +/-4.2) are the most likely to want to start taking part in sport. Irrespective of socio-economic status, the two most commonly cited reasons given by non-participants for not taking part in sports activities are time and health problems.
Employment status
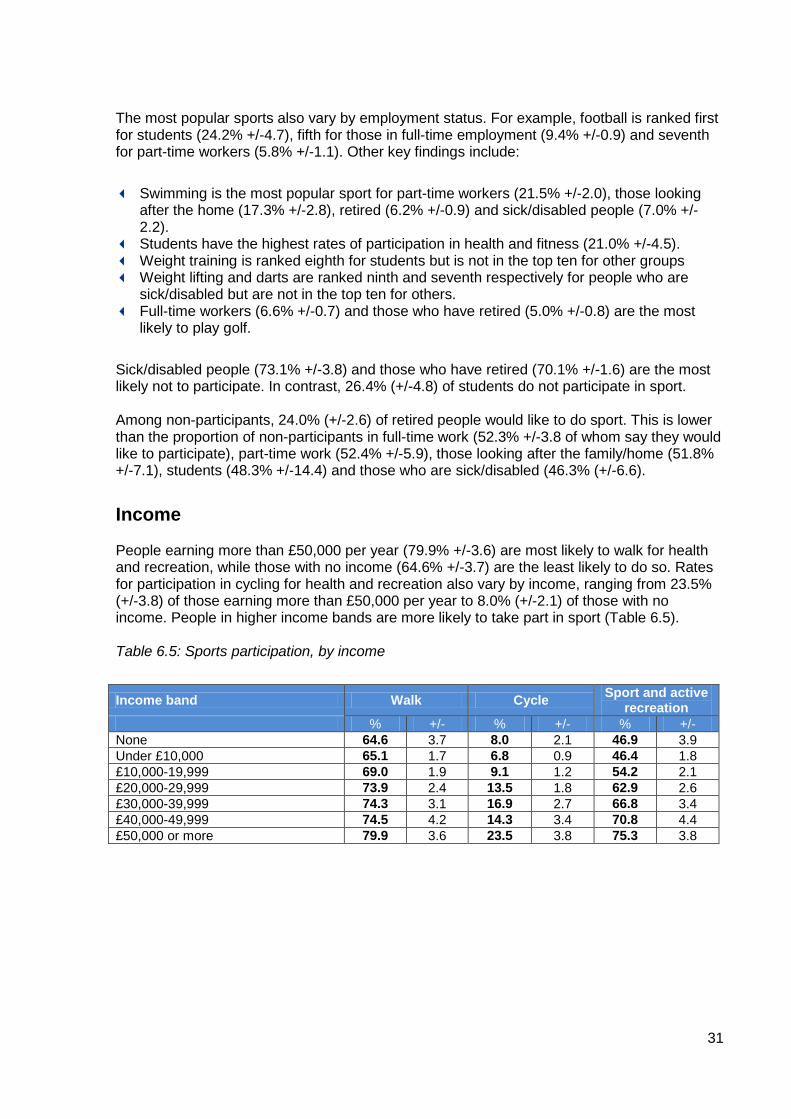
There are no significant differences in participation rates for walking for health and recreation between those that work full-time, part-time, are students or who look after the family/home. Rates are, however, markedly lower for those who are retired or are sick, disabled or injured (Table 6.4). Table 6.4: Sports participation, by employment status
Employment status Walk Cycle Sport and active recreation
% +/- % +/- % +/- Full-time 73.5 1.3 14.5 1.0 64.7 1.4 Part-time 74.4 2.1 10.0 1.5 59.0 2.4 Student 73.1 4.9 12.4 3.6 73.6 4.8 Looking after family/home 74.4 3.2 6.6 1.8 42.2 3.6 Retired 54.3 1.8 3.7 0.7 29.9 1.6 Permanently/temp sick, disabled etc. 39.1 4.2 * * 26.9 3.8
* numbers too small to report Cycling rates vary widely by employment status, with noticeably higher rates for those working full-time, part-time and students. People in full-time employment (14.5% +/-1.0) are around three times as likely to cycle for health and recreation as those who are retired (3.7% +/-0.7). Students are the most likely to take part in sports (73.6% +/-4.8) and people that are sick/disabled (26.9% +/-3.8) or retired (29.9% +/-1.6) are the least likely.
31
The most popular sports also vary by employment status. For example, football is ranked first for students (24.2% +/-4.7), fifth for those in full-time employment (9.4% +/-0.9) and seventh for part-time workers (5.8% +/-1.1). Other key findings include:
Swimming is the most popular sport for part-time workers (21.5% +/-2.0), those looking
after the home (17.3% +/-2.8), retired (6.2% +/-0.9) and sick/disabled people (7.0% +/-2.2).
Students have the highest rates of participation in health and fitness (21.0% +/-4.5). Weight training is ranked eighth for students but is not in the top ten for other groups Weight lifting and darts are ranked ninth and seventh respectively for people who are
sick/disabled but are not in the top ten for others. Full-time workers (6.6% +/-0.7) and those who have retired (5.0% +/-0.8) are the most
likely to play golf.
Sick/disabled people (73.1% +/-3.8) and those who have retired (70.1% +/-1.6) are the most likely not to participate. In contrast, 26.4% (+/-4.8) of students do not participate in sport. Among non-participants, 24.0% (+/-2.6) of retired people would like to do sport. This is lower than the proportion of non-participants in full-time work (52.3% +/-3.8 of whom say they would like to participate), part-time work (52.4% +/-5.9), those looking after the family/home (51.8% +/-7.1), students (48.3% +/-14.4) and those who are sick/disabled (46.3% (+/-6.6).
Income People earning more than £50,000 per year (79.9% +/-3.6) are most likely to walk for health and recreation, while those with no income (64.6% +/-3.7) are the least likely to do so. Rates for participation in cycling for health and recreation also vary by income, ranging from 23.5% (+/-3.8) of those earning more than £50,000 per year to 8.0% (+/-2.1) of those with no income. People in higher income bands are more likely to take part in sport (Table 6.5). Table 6.5: Sports participation, by income
Income band Walk Cycle Sport and active
recreation % +/- % +/- % +/-
None 64.6 3.7 8.0 2.1 46.9 3.9 Under £10,000 65.1 1.7 6.8 0.9 46.4 1.8 £10,000-19,999 69.0 1.9 9.1 1.2 54.2 2.1 £20,000-29,999 73.9 2.4 13.5 1.8 62.9 2.6 £30,000-39,999 74.3 3.1 16.9 2.7 66.8 3.4 £40,000-49,999 74.5 4.2 14.3 3.4 70.8 4.4 £50,000 or more 79.9 3.6 23.5 3.8 75.3 3.8
32
7. Participation in sport, multivariate analysis
In addition to the descriptive analysis, provided above, regression analysis was conducted using the 2008/09 Taking Part data. A brief overview of the findings is provided below. The more detailed paper, Participation, engagement and intensity of sports participants: Analysis of the Taking Part Survey (Buraimo et al. 2010), can be found on the DCMS website.7
Regression analysis controls for the effect of other factors (e.g. age, sex, socio-economic status, employment, academic qualifications etc.) and is thus able to determine which factors are the most significant demographic and economic drivers of participation. Buraimo et al. (2010) examined sports participation in three dimensions:
1. The decision to participate 2. The frequency of participation 3. The time spent participating
The decision to participate The first model examined the decision to participate in sport across two measures: any participation in the last 4 weeks and participation for 30 minutes or more at a moderate level of intensity. The analysis shows that the following groups have a greater likelihood of participating in sport: Those who participated in sport as a child (16.6% increase in the likelihood of
participation as an adult), compared with those who did not play sport as a child. The likelihood of participating for 30 minutes or more at moderate intensity is slightly lower at 7.4% for those who played sport as a child.
Those with very good health (11.4% increased likelihood of participation and 18.5% increased likelihood of participation for 30 minutes or more at moderate intensity.
The analysis also showed that the following groups have a lower likelihood of participating in sport:
Older people – there is a 0.8% reduction in participation for each year’s increase in age
compared to a 0.4% reduction for moderate levels of participation.
7 http://www.culture.gov.uk/what_we_do/research_and_statistics/6602.aspx
33
Those with a greater number of children in the household – there is a 1.9 reduction in the likelihood of participation for each additional child in the household; the effect is yet more pronounced (-3.8%) for moderate levels of participation lasting for 30 minutes or longer
Smokers (7.7% reduction in participation) and a 5.8% fall in moderate intensity participation by smokers, compared with non-smokers.
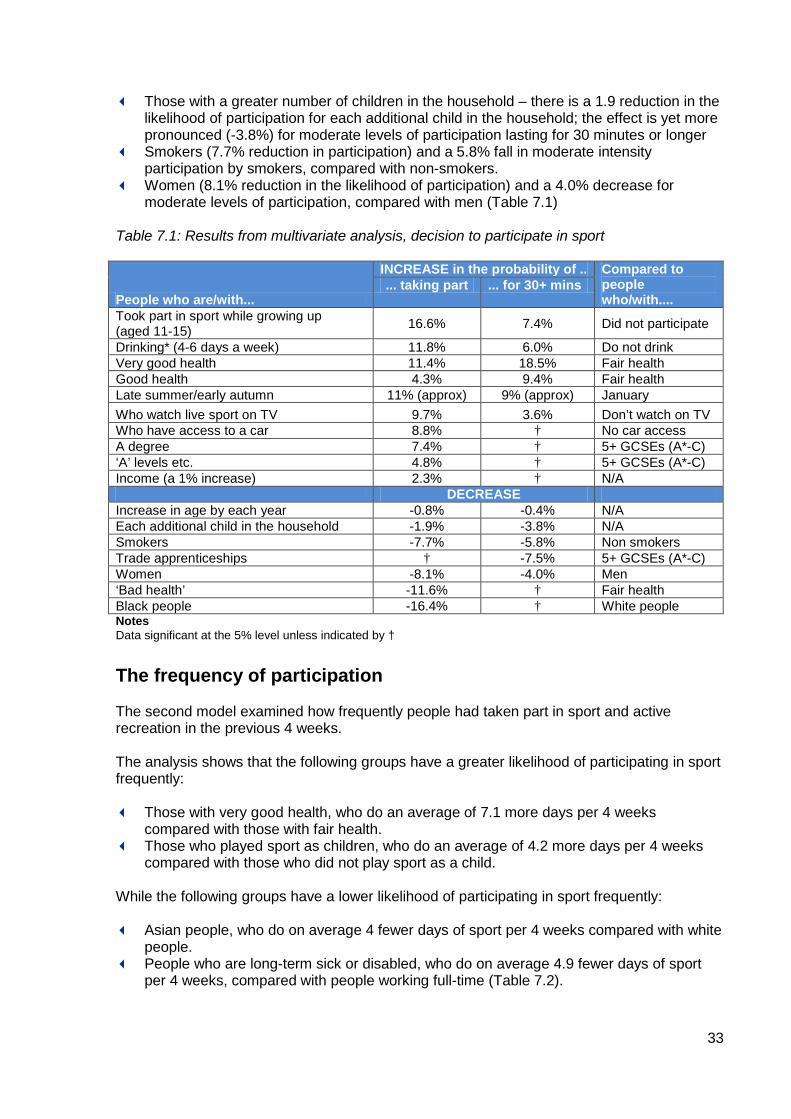
Women (8.1% reduction in the likelihood of participation) and a 4.0% decrease for moderate levels of participation, compared with men (Table 7.1)
Table 7.1: Results from multivariate analysis, decision to participate in sport
People who are/with...
INCREASE in the probability of .. Compared to people who/with....
... taking part ... for 30+ mins
Took part in sport while growing up (aged 11-15) 16.6% 7.4% Did not participate
Drinking* (4-6 days a week) 11.8% 6.0% Do not drink Very good health 11.4% 18.5% Fair health Good health 4.3% 9.4% Fair health Late summer/early autumn 11% (approx) 9% (approx) January Who watch live sport on TV 9.7% 3.6% Don’t watch on TV Who have access to a car 8.8% † No car access A degree 7.4% † 5+ GCSEs (A*-C) ‘A’ levels etc. 4.8% † 5+ GCSEs (A*-C) Income (a 1% increase) 2.3% † N/A DECREASE Increase in age by each year -0.8% -0.4% N/A Each additional child in the household -1.9% -3.8% N/A Smokers -7.7% -5.8% Non smokers Trade apprenticeships † -7.5% 5+ GCSEs (A*-C) Women -8.1% -4.0% Men ‘Bad health’ -11.6% † Fair health Black people -16.4% † White people Notes Data significant at the 5% level unless indicated by †
The frequency of participation
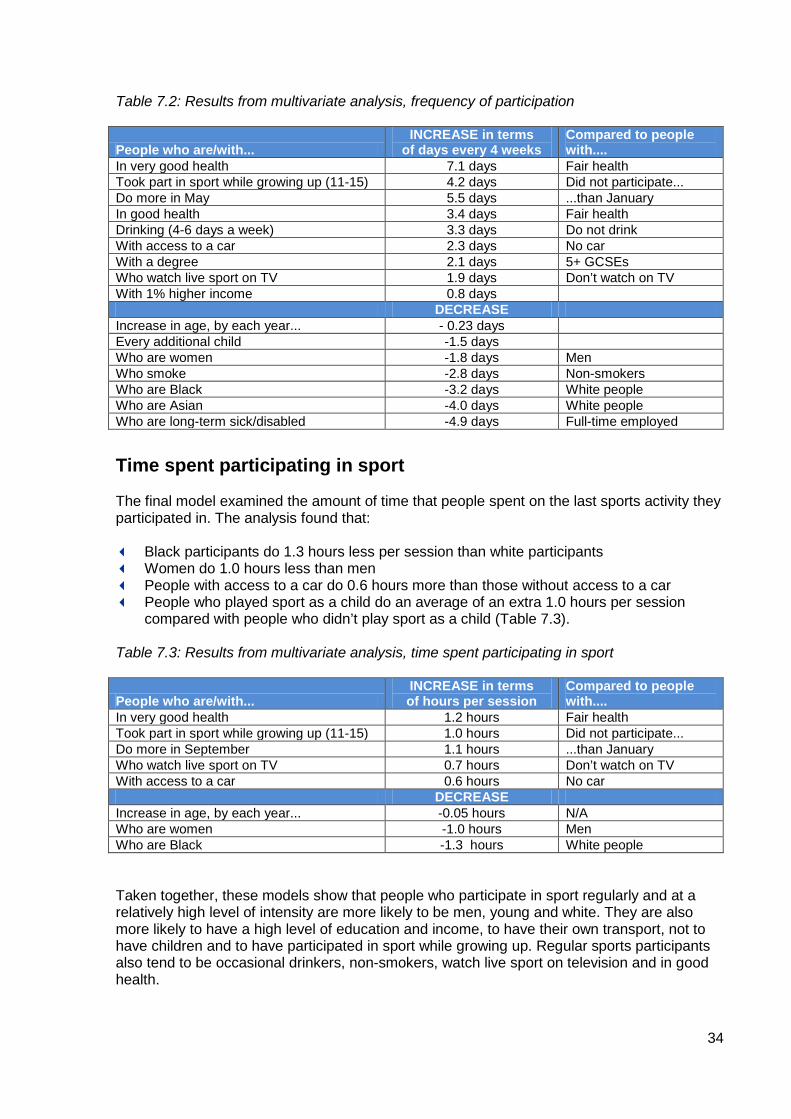
The second model examined how frequently people had taken part in sport and active recreation in the previous 4 weeks. The analysis shows that the following groups have a greater likelihood of participating in sport frequently: Those with very good health, who do an average of 7.1 more days per 4 weeks
compared with those with fair health. Those who played sport as children, who do an average of 4.2 more days per 4 weeks
compared with those who did not play sport as a child.
While the following groups have a lower likelihood of participating in sport frequently: Asian people, who do on average 4 fewer days of sport per 4 weeks compared with white
people. People who are long-term sick or disabled, who do on average 4.9 fewer days of sport
per 4 weeks, compared with people working full-time (Table 7.2).
34
Table 7.2: Results from multivariate analysis, frequency of participation
People who are/with... INCREASE in terms
of days every 4 weeks Compared to people with....
In very good health 7.1 days Fair health Took part in sport while growing up (11-15) 4.2 days Did not participate... Do more in May 5.5 days ...than January In good health 3.4 days Fair health Drinking (4-6 days a week) 3.3 days Do not drink With access to a car 2.3 days No car With a degree 2.1 days 5+ GCSEs Who watch live sport on TV 1.9 days Don’t watch on TV With 1% higher income 0.8 days DECREASE Increase in age, by each year... - 0.23 days Every additional child -1.5 days Who are women -1.8 days Men Who smoke -2.8 days Non-smokers Who are Black -3.2 days White people Who are Asian -4.0 days White people Who are long-term sick/disabled -4.9 days Full-time employed
Time spent participating in sport
The final model examined the amount of time that people spent on the last sports activity they participated in. The analysis found that:
Black participants do 1.3 hours less per session than white participants Women do 1.0 hours less than men People with access to a car do 0.6 hours more than those without access to a car People who played sport as a child do an average of an extra 1.0 hours per session
compared with people who didn’t play sport as a child (Table 7.3).
Table 7.3: Results from multivariate analysis, time spent participating in sport
People who are/with... INCREASE in terms of hours per session
Compared to people with....
In very good health 1.2 hours Fair health Took part in sport while growing up (11-15) 1.0 hours Did not participate... Do more in September 1.1 hours ...than January Who watch live sport on TV 0.7 hours Don’t watch on TV With access to a car 0.6 hours No car DECREASE Increase in age, by each year... -0.05 hours N/A Who are women -1.0 hours Men Who are Black -1.3 hours White people
Taken together, these models show that people who participate in sport regularly and at a relatively high level of intensity are more likely to be men, young and white. They are also more likely to have a high level of education and income, to have their own transport, not to have children and to have participated in sport while growing up. Regular sports participants also tend to be occasional drinkers, non-smokers, watch live sport on television and in good health.

35
Conversely, those least likely to take part in sport would have the following characteristics: female, elderly, low educational attainment, low income, no access to a car, Asian or Black ethnic origin, poor health, smoker, did not participate while growing up and lives in a household with several children.
36
8. Participation in sport, 2005/06 to 2008/09
Key findings Between 2005/06 and 2008/09 there were no significant changes in overall levels of sports participation. However, there were a number of such changes for participation in specific sports and activities. For example:
There was an increase in the proportion of men cycling for health and recreation, from
12.7% to 14.4% and in women running, from 3.5% to 4.8%. Meanwhile, there was a decrease in the proportion of men playing snooker, billiards and
pool, from 13.0% to 11.3%. The proportion of 25-44 year olds doing keep fit, aerobics and dance fell from 8.4% to
6.6%. The proportion of white people doing this also fell, from 6.9% to 5.8%. Meanwhile, there was an increase in proportion of people in Yorkshire and the Humber
doing health, fitness, gym and conditioning activities, from 12.1% to 15.9%.
Overview
Over the four years from 2005/06 to 2008/09 the proportion of people taking part in sports activities remained stable at around 54%. Sex time series
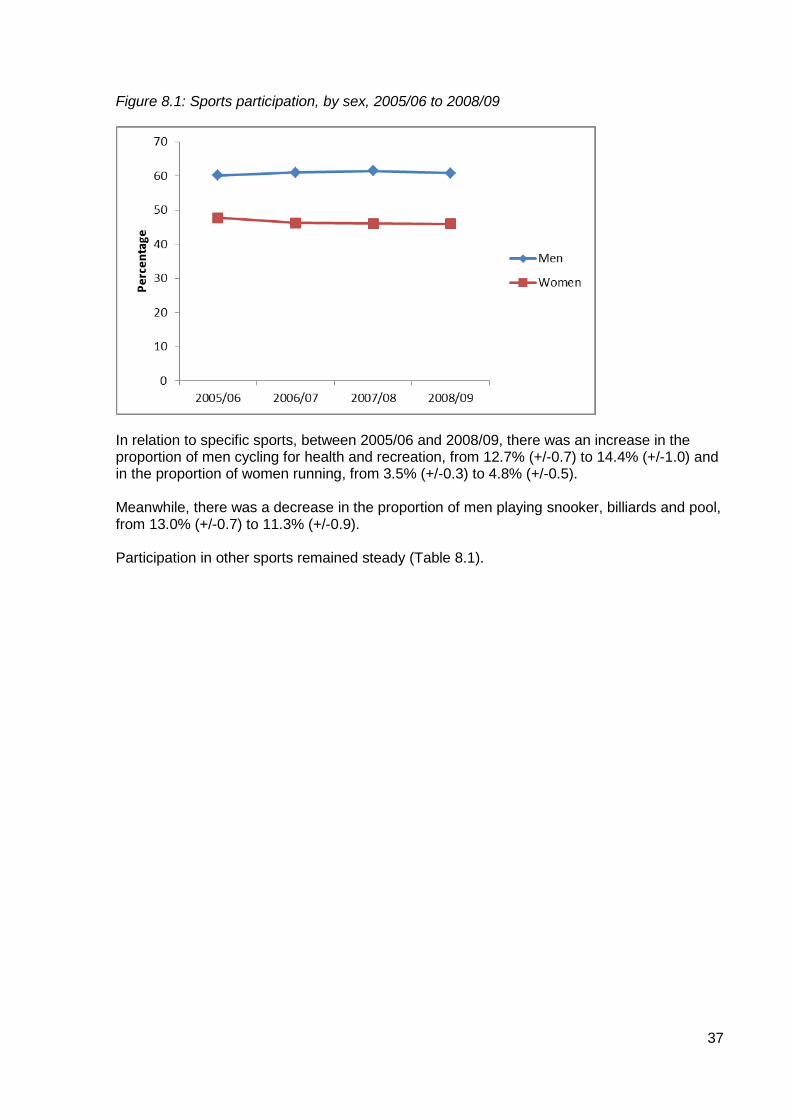
Between 2005/06 and 2008/09, there was no significant change in women’s or men’s sports participation. However, the difference between men and female participation rates increased over the same period from men being 12.5 percentage points more likely than women to take part in sports activities in 2005/06 to 14.8 percentage points more likely to do so by 2008/09 (Figure 8.1).
37
Figure 8.1: Sports participation, by sex, 2005/06 to 2008/09
In relation to specific sports, between 2005/06 and 2008/09, there was an increase in the proportion of men cycling for health and recreation, from 12.7% (+/-0.7) to 14.4% (+/-1.0) and in the proportion of women running, from 3.5% (+/-0.3) to 4.8% (+/-0.5). Meanwhile, there was a decrease in the proportion of men playing snooker, billiards and pool, from 13.0% (+/-0.7) to 11.3% (+/-0.9). Participation in other sports remained steady (Table 8.1).
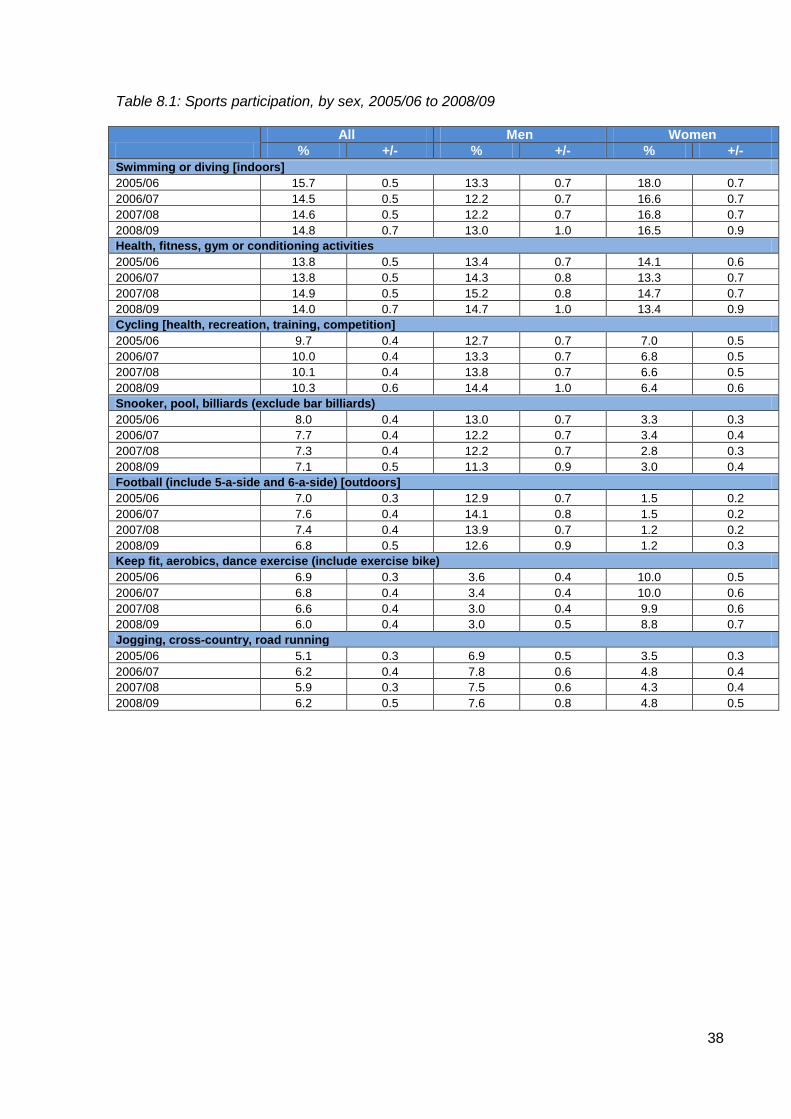
38
Table 8.1: Sports participation, by sex, 2005/06 to 2008/09
All Men Women
% +/- % +/- % +/- Swimming or diving [indoors] 2005/06 15.7 0.5 13.3 0.7 18.0 0.7 2006/07 14.5 0.5 12.2 0.7 16.6 0.7 2007/08 14.6 0.5 12.2 0.7 16.8 0.7 2008/09 14.8 0.7 13.0 1.0 16.5 0.9 Health, fitness, gym or conditioning activities 2005/06 13.8 0.5 13.4 0.7 14.1 0.6 2006/07 13.8 0.5 14.3 0.8 13.3 0.7 2007/08 14.9 0.5 15.2 0.8 14.7 0.7 2008/09 14.0 0.7 14.7 1.0 13.4 0.9 Cycling [health, recreation, training, competition] 2005/06 9.7 0.4 12.7 0.7 7.0 0.5 2006/07 10.0 0.4 13.3 0.7 6.8 0.5 2007/08 10.1 0.4 13.8 0.7 6.6 0.5 2008/09 10.3 0.6 14.4 1.0 6.4 0.6 Snooker, pool, billiards (exclude bar billiards) 2005/06 8.0 0.4 13.0 0.7 3.3 0.3 2006/07 7.7 0.4 12.2 0.7 3.4 0.4 2007/08 7.3 0.4 12.2 0.7 2.8 0.3 2008/09 7.1 0.5 11.3 0.9 3.0 0.4 Football (include 5-a-side and 6-a-side) [outdoors] 2005/06 7.0 0.3 12.9 0.7 1.5 0.2 2006/07 7.6 0.4 14.1 0.8 1.5 0.2 2007/08 7.4 0.4 13.9 0.7 1.2 0.2 2008/09 6.8 0.5 12.6 0.9 1.2 0.3 Keep fit, aerobics, dance exercise (include exercise bike) 2005/06 6.9 0.3 3.6 0.4 10.0 0.5 2006/07 6.8 0.4 3.4 0.4 10.0 0.6 2007/08 6.6 0.4 3.0 0.4 9.9 0.6 2008/09 6.0 0.4 3.0 0.5 8.8 0.7 Jogging, cross-country, road running 2005/06 5.1 0.3 6.9 0.5 3.5 0.3 2006/07 6.2 0.4 7.8 0.6 4.8 0.4 2007/08 5.9 0.3 7.5 0.6 4.3 0.4 2008/09 6.2 0.5 7.6 0.8 4.8 0.5
39
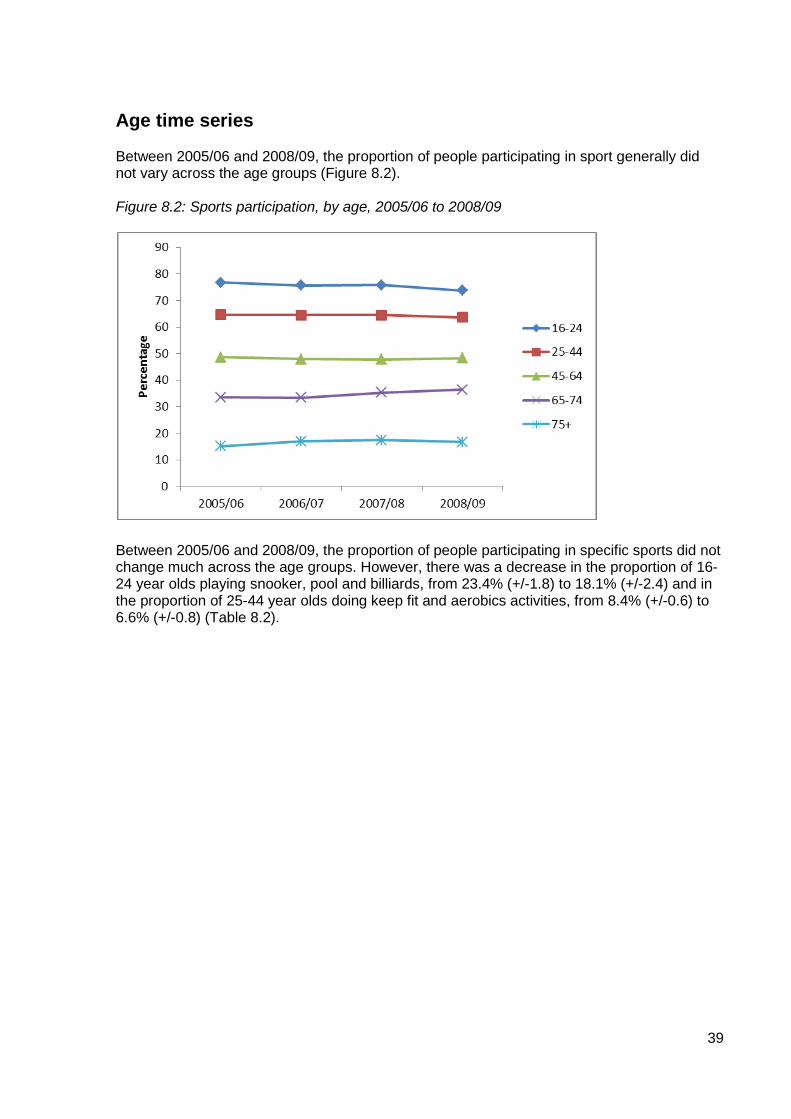
Age time series Between 2005/06 and 2008/09, the proportion of people participating in sport generally did not vary across the age groups (Figure 8.2). Figure 8.2: Sports participation, by age, 2005/06 to 2008/09
Between 2005/06 and 2008/09, the proportion of people participating in specific sports did not change much across the age groups. However, there was a decrease in the proportion of 16-24 year olds playing snooker, pool and billiards, from 23.4% (+/-1.8) to 18.1% (+/-2.4) and in the proportion of 25-44 year olds doing keep fit and aerobics activities, from 8.4% (+/-0.6) to 6.6% (+/-0.8) (Table 8.2).
40
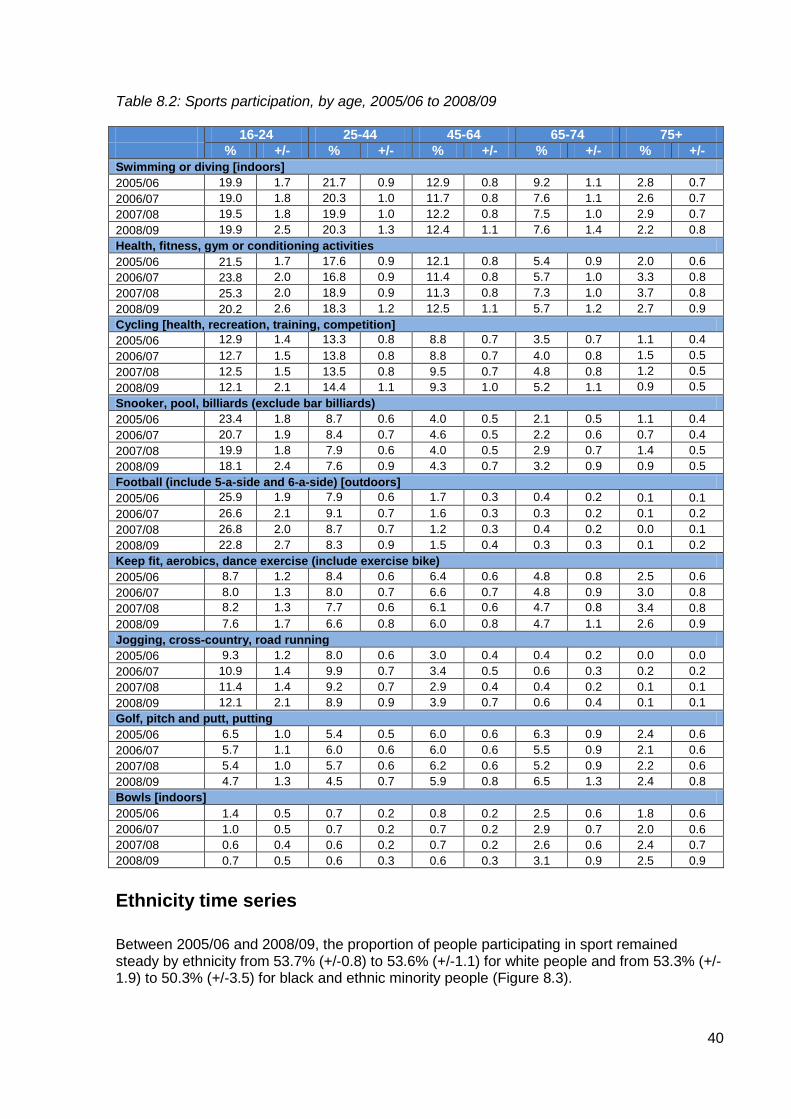
Table 8.2: Sports participation, by age, 2005/06 to 2008/09
16-24 25-44 45-64 65-74 75+ % +/- % +/- % +/- % +/- % +/-
Swimming or diving [indoors] 2005/06 19.9 1.7 21.7 0.9 12.9 0.8 9.2 1.1 2.8 0.7 2006/07 19.0 1.8 20.3 1.0 11.7 0.8 7.6 1.1 2.6 0.7 2007/08 19.5 1.8 19.9 1.0 12.2 0.8 7.5 1.0 2.9 0.7 2008/09 19.9 2.5 20.3 1.3 12.4 1.1 7.6 1.4 2.2 0.8 Health, fitness, gym or conditioning activities 2005/06 21.5 1.7 17.6 0.9 12.1 0.8 5.4 0.9 2.0 0.6 2006/07 23.8 2.0 16.8 0.9 11.4 0.8 5.7 1.0 3.3 0.8 2007/08 25.3 2.0 18.9 0.9 11.3 0.8 7.3 1.0 3.7 0.8 2008/09 20.2 2.6 18.3 1.2 12.5 1.1 5.7 1.2 2.7 0.9 Cycling [health, recreation, training, competition] 2005/06 12.9 1.4 13.3 0.8 8.8 0.7 3.5 0.7 1.1 0.4 2006/07 12.7 1.5 13.8 0.8 8.8 0.7 4.0 0.8 1.5 0.5 2007/08 12.5 1.5 13.5 0.8 9.5 0.7 4.8 0.8 1.2 0.5 2008/09 12.1 2.1 14.4 1.1 9.3 1.0 5.2 1.1 0.9 0.5 Snooker, pool, billiards (exclude bar billiards) 2005/06 23.4 1.8 8.7 0.6 4.0 0.5 2.1 0.5 1.1 0.4 2006/07 20.7 1.9 8.4 0.7 4.6 0.5 2.2 0.6 0.7 0.4 2007/08 19.9 1.8 7.9 0.6 4.0 0.5 2.9 0.7 1.4 0.5 2008/09 18.1 2.4 7.6 0.9 4.3 0.7 3.2 0.9 0.9 0.5 Football (include 5-a-side and 6-a-side) [outdoors] 2005/06 25.9 1.9 7.9 0.6 1.7 0.3 0.4 0.2 0.1 0.1 2006/07 26.6 2.1 9.1 0.7 1.6 0.3 0.3 0.2 0.1 0.2 2007/08 26.8 2.0 8.7 0.7 1.2 0.3 0.4 0.2 0.0 0.1 2008/09 22.8 2.7 8.3 0.9 1.5 0.4 0.3 0.3 0.1 0.2 Keep fit, aerobics, dance exercise (include exercise bike) 2005/06 8.7 1.2 8.4 0.6 6.4 0.6 4.8 0.8 2.5 0.6 2006/07 8.0 1.3 8.0 0.7 6.6 0.7 4.8 0.9 3.0 0.8 2007/08 8.2 1.3 7.7 0.6 6.1 0.6 4.7 0.8 3.4 0.8 2008/09 7.6 1.7 6.6 0.8 6.0 0.8 4.7 1.1 2.6 0.9 Jogging, cross-country, road running 2005/06 9.3 1.2 8.0 0.6 3.0 0.4 0.4 0.2 0.0 0.0 2006/07 10.9 1.4 9.9 0.7 3.4 0.5 0.6 0.3 0.2 0.2 2007/08 11.4 1.4 9.2 0.7 2.9 0.4 0.4 0.2 0.1 0.1 2008/09 12.1 2.1 8.9 0.9 3.9 0.7 0.6 0.4 0.1 0.1 Golf, pitch and putt, putting 2005/06 6.5 1.0 5.4 0.5 6.0 0.6 6.3 0.9 2.4 0.6 2006/07 5.7 1.1 6.0 0.6 6.0 0.6 5.5 0.9 2.1 0.6 2007/08 5.4 1.0 5.7 0.6 6.2 0.6 5.2 0.9 2.2 0.6 2008/09 4.7 1.3 4.5 0.7 5.9 0.8 6.5 1.3 2.4 0.8 Bowls [indoors] 2005/06 1.4 0.5 0.7 0.2 0.8 0.2 2.5 0.6 1.8 0.6 2006/07 1.0 0.5 0.7 0.2 0.7 0.2 2.9 0.7 2.0 0.6 2007/08 0.6 0.4 0.6 0.2 0.7 0.2 2.6 0.6 2.4 0.7 2008/09 0.7 0.5 0.6 0.3 0.6 0.3 3.1 0.9 2.5 0.9
Ethnicity time series
Between 2005/06 and 2008/09, the proportion of people participating in sport remained steady by ethnicity from 53.7% (+/-0.8) to 53.6% (+/-1.1) for white people and from 53.3% (+/-1.9) to 50.3% (+/-3.5) for black and ethnic minority people (Figure 8.3).
41
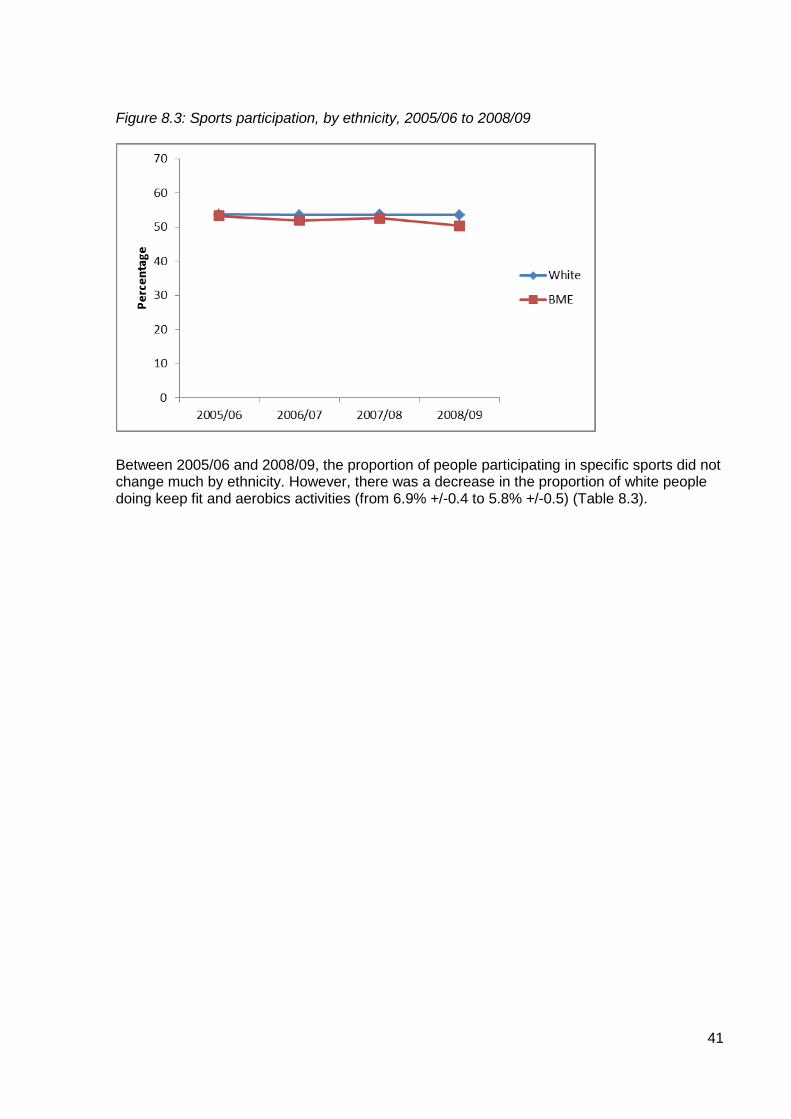
Figure 8.3: Sports participation, by ethnicity, 2005/06 to 2008/09
Between 2005/06 and 2008/09, the proportion of people participating in specific sports did not change much by ethnicity. However, there was a decrease in the proportion of white people doing keep fit and aerobics activities (from 6.9% +/-0.4 to 5.8% +/-0.5) (Table 8.3).
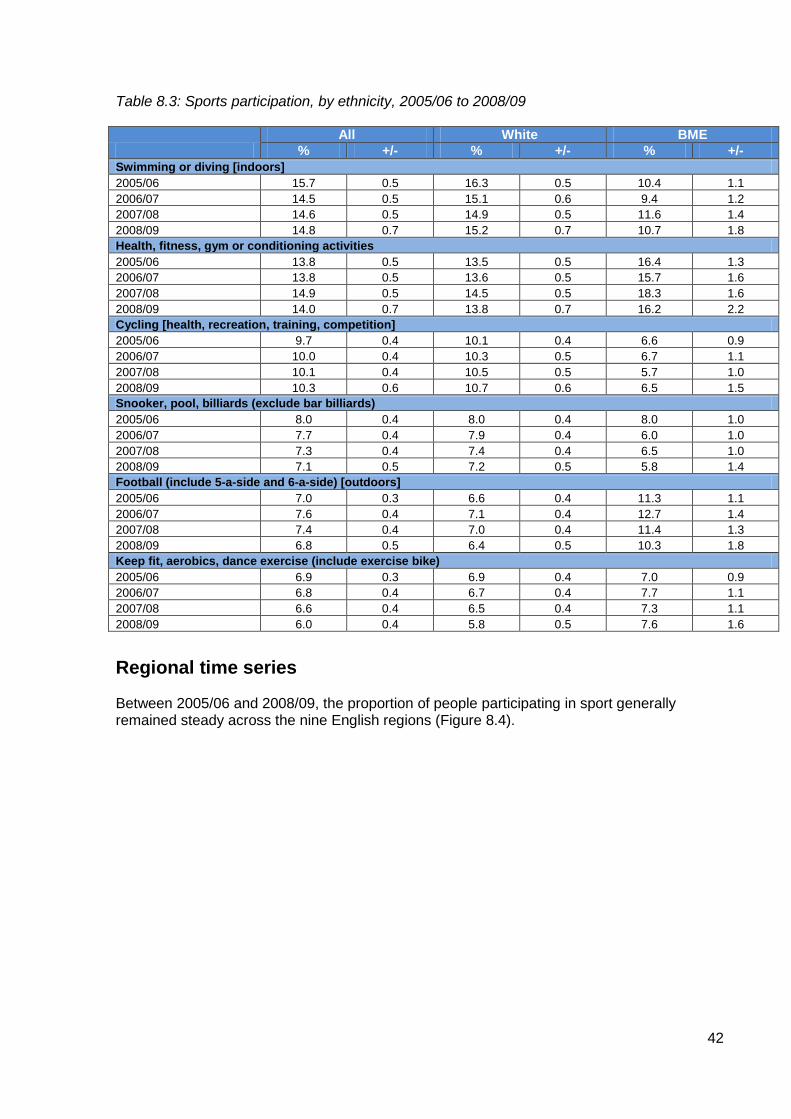
42
Table 8.3: Sports participation, by ethnicity, 2005/06 to 2008/09
All White BME
% +/- % +/- % +/- Swimming or diving [indoors] 2005/06 15.7 0.5 16.3 0.5 10.4 1.1 2006/07 14.5 0.5 15.1 0.6 9.4 1.2 2007/08 14.6 0.5 14.9 0.5 11.6 1.4 2008/09 14.8 0.7 15.2 0.7 10.7 1.8 Health, fitness, gym or conditioning activities 2005/06 13.8 0.5 13.5 0.5 16.4 1.3 2006/07 13.8 0.5 13.6 0.5 15.7 1.6 2007/08 14.9 0.5 14.5 0.5 18.3 1.6 2008/09 14.0 0.7 13.8 0.7 16.2 2.2 Cycling [health, recreation, training, competition] 2005/06 9.7 0.4 10.1 0.4 6.6 0.9 2006/07 10.0 0.4 10.3 0.5 6.7 1.1 2007/08 10.1 0.4 10.5 0.5 5.7 1.0 2008/09 10.3 0.6 10.7 0.6 6.5 1.5 Snooker, pool, billiards (exclude bar billiards) 2005/06 8.0 0.4 8.0 0.4 8.0 1.0 2006/07 7.7 0.4 7.9 0.4 6.0 1.0 2007/08 7.3 0.4 7.4 0.4 6.5 1.0 2008/09 7.1 0.5 7.2 0.5 5.8 1.4 Football (include 5-a-side and 6-a-side) [outdoors] 2005/06 7.0 0.3 6.6 0.4 11.3 1.1 2006/07 7.6 0.4 7.1 0.4 12.7 1.4 2007/08 7.4 0.4 7.0 0.4 11.4 1.3 2008/09 6.8 0.5 6.4 0.5 10.3 1.8 Keep fit, aerobics, dance exercise (include exercise bike) 2005/06 6.9 0.3 6.9 0.4 7.0 0.9 2006/07 6.8 0.4 6.7 0.4 7.7 1.1 2007/08 6.6 0.4 6.5 0.4 7.3 1.1 2008/09 6.0 0.4 5.8 0.5 7.6 1.6
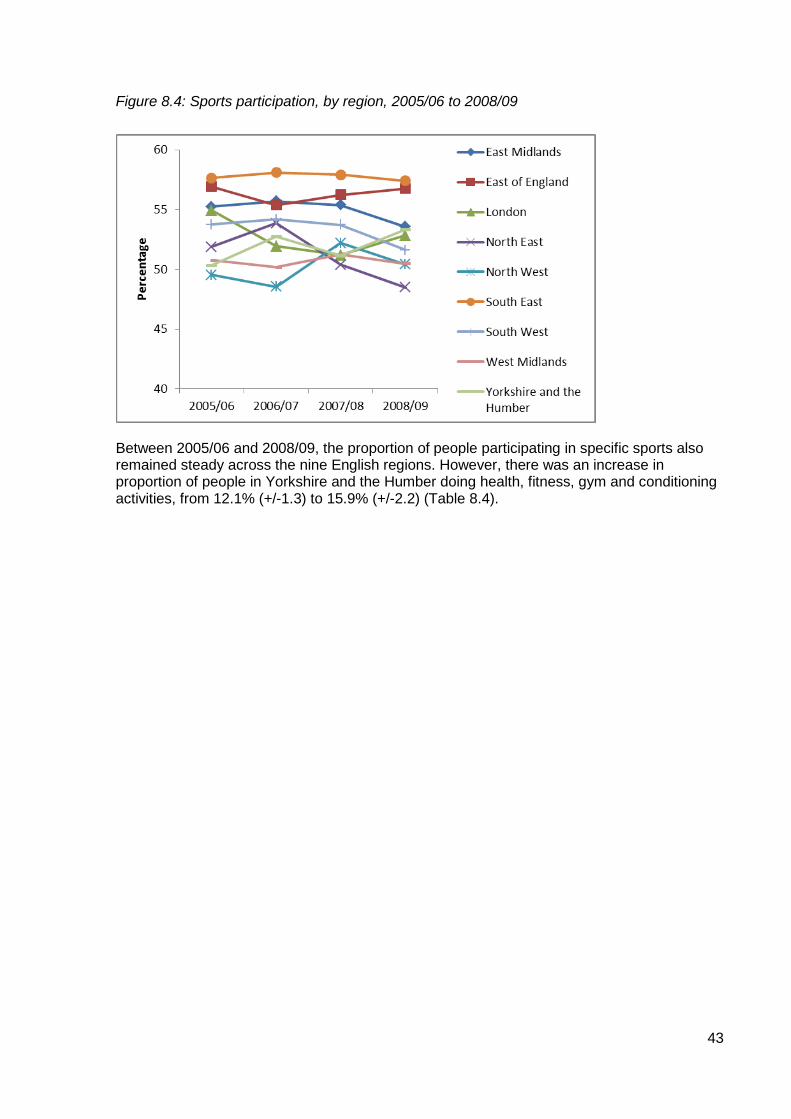
Regional time series Between 2005/06 and 2008/09, the proportion of people participating in sport generally remained steady across the nine English regions (Figure 8.4).
43
Figure 8.4: Sports participation, by region, 2005/06 to 2008/09
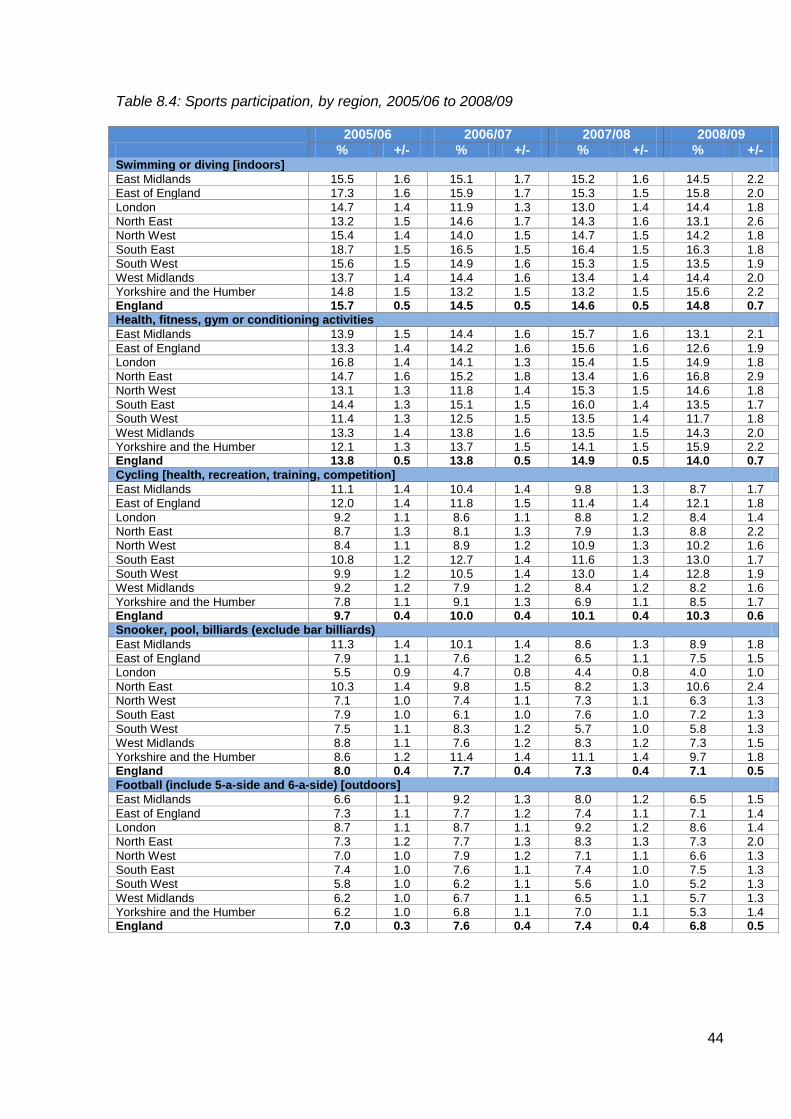
Between 2005/06 and 2008/09, the proportion of people participating in specific sports also remained steady across the nine English regions. However, there was an increase in proportion of people in Yorkshire and the Humber doing health, fitness, gym and conditioning activities, from 12.1% (+/-1.3) to 15.9% (+/-2.2) (Table 8.4).
44
Table 8.4: Sports participation, by region, 2005/06 to 2008/09
2005/06 2006/07 2007/08 2008/09
% +/- % +/- % +/- % +/- Swimming or diving [indoors] East Midlands 15.5 1.6 15.1 1.7 15.2 1.6 14.5 2.2 East of England 17.3 1.6 15.9 1.7 15.3 1.5 15.8 2.0 London 14.7 1.4 11.9 1.3 13.0 1.4 14.4 1.8 North East 13.2 1.5 14.6 1.7 14.3 1.6 13.1 2.6 North West 15.4 1.4 14.0 1.5 14.7 1.5 14.2 1.8 South East 18.7 1.5 16.5 1.5 16.4 1.5 16.3 1.8 South West 15.6 1.5 14.9 1.6 15.3 1.5 13.5 1.9 West Midlands 13.7 1.4 14.4 1.6 13.4 1.4 14.4 2.0 Yorkshire and the Humber 14.8 1.5 13.2 1.5 13.2 1.5 15.6 2.2 England 15.7 0.5 14.5 0.5 14.6 0.5 14.8 0.7 Health, fitness, gym or conditioning activities East Midlands 13.9 1.5 14.4 1.6 15.7 1.6 13.1 2.1 East of England 13.3 1.4 14.2 1.6 15.6 1.6 12.6 1.9 London 16.8 1.4 14.1 1.3 15.4 1.5 14.9 1.8 North East 14.7 1.6 15.2 1.8 13.4 1.6 16.8 2.9 North West 13.1 1.3 11.8 1.4 15.3 1.5 14.6 1.8 South East 14.4 1.3 15.1 1.5 16.0 1.4 13.5 1.7 South West 11.4 1.3 12.5 1.5 13.5 1.4 11.7 1.8 West Midlands 13.3 1.4 13.8 1.6 13.5 1.5 14.3 2.0 Yorkshire and the Humber 12.1 1.3 13.7 1.5 14.1 1.5 15.9 2.2 England 13.8 0.5 13.8 0.5 14.9 0.5 14.0 0.7 Cycling [health, recreation, training, competition] East Midlands 11.1 1.4 10.4 1.4 9.8 1.3 8.7 1.7 East of England 12.0 1.4 11.8 1.5 11.4 1.4 12.1 1.8 London 9.2 1.1 8.6 1.1 8.8 1.2 8.4 1.4 North East 8.7 1.3 8.1 1.3 7.9 1.3 8.8 2.2 North West 8.4 1.1 8.9 1.2 10.9 1.3 10.2 1.6 South East 10.8 1.2 12.7 1.4 11.6 1.3 13.0 1.7 South West 9.9 1.2 10.5 1.4 13.0 1.4 12.8 1.9 West Midlands 9.2 1.2 7.9 1.2 8.4 1.2 8.2 1.6 Yorkshire and the Humber 7.8 1.1 9.1 1.3 6.9 1.1 8.5 1.7 England 9.7 0.4 10.0 0.4 10.1 0.4 10.3 0.6 Snooker, pool, billiards (exclude bar billiards) East Midlands 11.3 1.4 10.1 1.4 8.6 1.3 8.9 1.8 East of England 7.9 1.1 7.6 1.2 6.5 1.1 7.5 1.5 London 5.5 0.9 4.7 0.8 4.4 0.8 4.0 1.0 North East 10.3 1.4 9.8 1.5 8.2 1.3 10.6 2.4 North West 7.1 1.0 7.4 1.1 7.3 1.1 6.3 1.3 South East 7.9 1.0 6.1 1.0 7.6 1.0 7.2 1.3 South West 7.5 1.1 8.3 1.2 5.7 1.0 5.8 1.3 West Midlands 8.8 1.1 7.6 1.2 8.3 1.2 7.3 1.5 Yorkshire and the Humber 8.6 1.2 11.4 1.4 11.1 1.4 9.7 1.8 England 8.0 0.4 7.7 0.4 7.3 0.4 7.1 0.5 Football (include 5-a-side and 6-a-side) [outdoors] East Midlands 6.6 1.1 9.2 1.3 8.0 1.2 6.5 1.5 East of England 7.3 1.1 7.7 1.2 7.4 1.1 7.1 1.4 London 8.7 1.1 8.7 1.1 9.2 1.2 8.6 1.4 North East 7.3 1.2 7.7 1.3 8.3 1.3 7.3 2.0 North West 7.0 1.0 7.9 1.2 7.1 1.1 6.6 1.3 South East 7.4 1.0 7.6 1.1 7.4 1.0 7.5 1.3 South West 5.8 1.0 6.2 1.1 5.6 1.0 5.2 1.3 West Midlands 6.2 1.0 6.7 1.1 6.5 1.1 5.7 1.3 Yorkshire and the Humber 6.2 1.0 6.8 1.1 7.0 1.1 5.3 1.4 England 7.0 0.3 7.6 0.4 7.4 0.4 6.8 0.5
45
Appendix 1: Sport clusters based Williams’ (2010)8 cluster analysis of culture and sport activities
8 http://www.culture.gov.uk/what_we_do/research_and_statistics/6602.aspx