Embed Size (px)
Citation preview
NISTADS Tracks in Policy Research: NISTADS/NTPR/STAPP/2017-1
CSIR–National Institute of Science, Technology and Development Studies
S&T applicaTionS To peopleS’ problemS
(STapp)
Adulteration Detection and Prevention
• Problem Identification with Socio-Economic Impacts
• Technology Landscaping
• Technology Outlook • R&D Ecosystem
• Strategy and Roadmap
Towards Efficient, Cost-Effective and Solution-centric R&D systems
September 2017
P Goswami
Praveen Sharma

Project Information
Project Team: Nodal Officer: Dr. P. Goswami,
Director CSIR-NISTADS
Principal Investigator: Dr. Praveen Sharma Funding Agency: CSIR Project Type: Translation Research for Policy Advocacy Publication Type: Research Report
Corresponding Author: Dr. P Goswami; [email protected]
Acknowledgement:
Disclaimer: The report is based on secondary data and information composed from related sources like reports, research papers, and books. Documents of various ministries/departments and organizations, web-sites have also been used. Due to the dynamic nature of the internet, resources that are free and publicly available may subsequently change and become restricted; likewise the location of items may change as menus and webpages are reorganized.
This Policy Advocacy benefitted from comments from a variety of sources, especially from CSIR laboratories; notable contributions came from CSIR-CFTRI and CSIR-IGIB. The analyses presented are based on mostly secondary sources (websites); while we have made sincere efforts to refer to all these sources, it is possible we have missed some. Finally, the critical comments on our earlier drafts from several reviewers are gratefully acknowledged.
CSIR-NISTADS September 2017
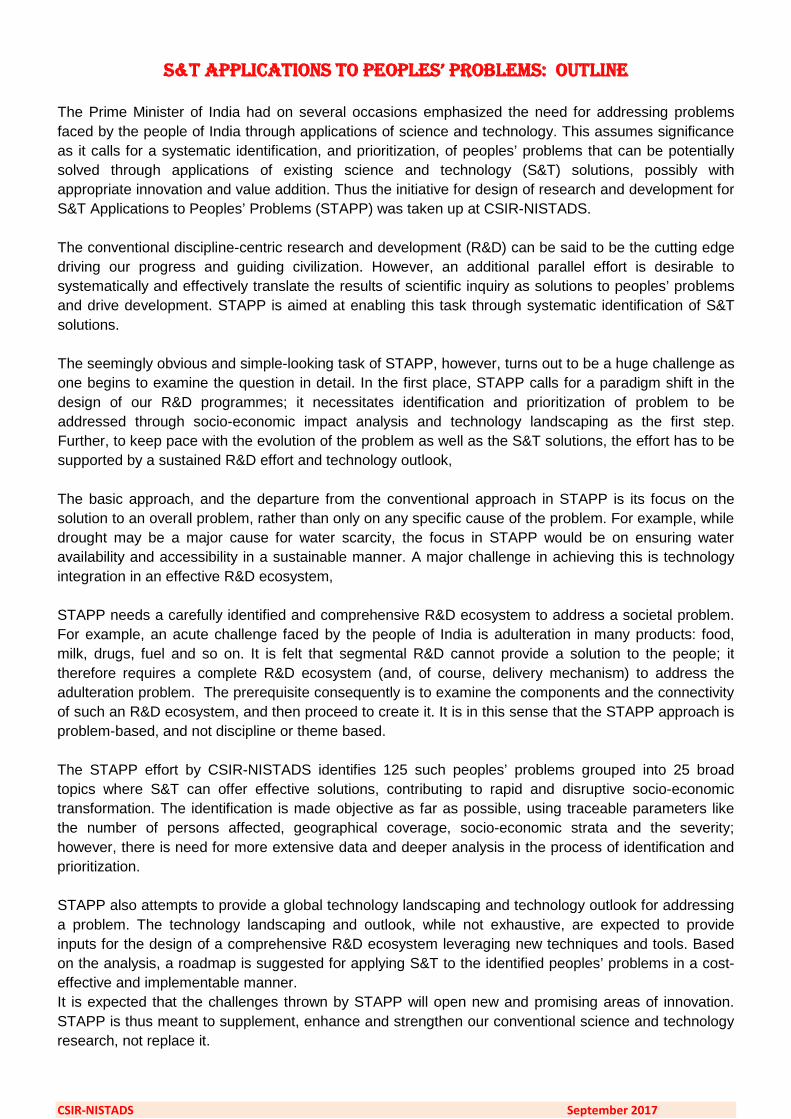
S&T applicaTionS To peopleS’ problemS: ouTline The Prime Minister of India had on several occasions emphasized the need for addressing problems faced by the people of India through applications of science and technology. This assumes significance as it calls for a systematic identification, and prioritization, of peoples’ problems that can be potentially solved through applications of existing science and technology (S&T) solutions, possibly with appropriate innovation and value addition. Thus the initiative for design of research and development for S&T Applications to Peoples’ Problems (STAPP) was taken up at CSIR-NISTADS. The conventional discipline-centric research and development (R&D) can be said to be the cutting edge driving our progress and guiding civilization. However, an additional parallel effort is desirable to systematically and effectively translate the results of scientific inquiry as solutions to peoples’ problems and drive development. STAPP is aimed at enabling this task through systematic identification of S&T solutions. The seemingly obvious and simple-looking task of STAPP, however, turns out to be a huge challenge as one begins to examine the question in detail. In the first place, STAPP calls for a paradigm shift in the design of our R&D programmes; it necessitates identification and prioritization of problem to be addressed through socio-economic impact analysis and technology landscaping as the first step. Further, to keep pace with the evolution of the problem as well as the S&T solutions, the effort has to be supported by a sustained R&D effort and technology outlook, The basic approach, and the departure from the conventional approach in STAPP is its focus on the solution to an overall problem, rather than only on any specific cause of the problem. For example, while drought may be a major cause for water scarcity, the focus in STAPP would be on ensuring water availability and accessibility in a sustainable manner. A major challenge in achieving this is technology integration in an effective R&D ecosystem, STAPP needs a carefully identified and comprehensive R&D ecosystem to address a societal problem. For example, an acute challenge faced by the people of India is adulteration in many products: food, milk, drugs, fuel and so on. It is felt that segmental R&D cannot provide a solution to the people; it therefore requires a complete R&D ecosystem (and, of course, delivery mechanism) to address the adulteration problem. The prerequisite consequently is to examine the components and the connectivity of such an R&D ecosystem, and then proceed to create it. It is in this sense that the STAPP approach is problem-based, and not discipline or theme based. The STAPP effort by CSIR-NISTADS identifies 125 such peoples’ problems grouped into 25 broad topics where S&T can offer effective solutions, contributing to rapid and disruptive socio-economic transformation. The identification is made objective as far as possible, using traceable parameters like the number of persons affected, geographical coverage, socio-economic strata and the severity; however, there is need for more extensive data and deeper analysis in the process of identification and prioritization. STAPP also attempts to provide a global technology landscaping and technology outlook for addressing a problem. The technology landscaping and outlook, while not exhaustive, are expected to provide inputs for the design of a comprehensive R&D ecosystem leveraging new techniques and tools. Based on the analysis, a roadmap is suggested for applying S&T to the identified peoples’ problems in a cost-effective and implementable manner. It is expected that the challenges thrown by STAPP will open new and promising areas of innovation. STAPP is thus meant to supplement, enhance and strengthen our conventional science and technology research, not replace it.
CSIR-NISTADS September 2017
STapp
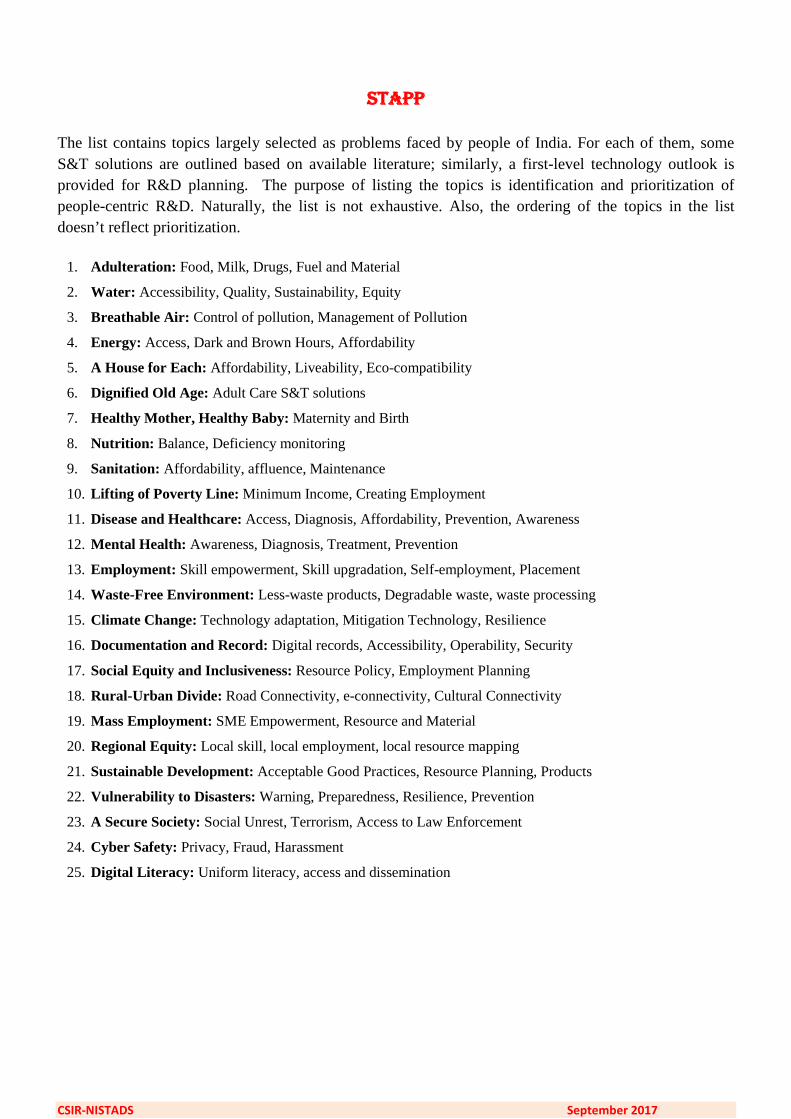
The list contains topics largely selected as problems faced by people of India. For each of them, some S&T solutions are outlined based on available literature; similarly, a first-level technology outlook is provided for R&D planning. The purpose of listing the topics is identification and prioritization of people-centric R&D. Naturally, the list is not exhaustive. Also, the ordering of the topics in the list doesn’t reflect prioritization.
1. Adulteration: Food, Milk, Drugs, Fuel and Material
2. Water: Accessibility, Quality, Sustainability, Equity
3. Breathable Air: Control of pollution, Management of Pollution
4. Energy: Access, Dark and Brown Hours, Affordability
5. A House for Each: Affordability, Liveability, Eco-compatibility
6. Dignified Old Age: Adult Care S&T solutions
7. Healthy Mother, Healthy Baby: Maternity and Birth
8. Nutrition: Balance, Deficiency monitoring
9. Sanitation: Affordability, affluence, Maintenance
10. Lifting of Poverty Line: Minimum Income, Creating Employment
11. Disease and Healthcare: Access, Diagnosis, Affordability, Prevention, Awareness
12. Mental Health: Awareness, Diagnosis, Treatment, Prevention
13. Employment: Skill empowerment, Skill upgradation, Self-employment, Placement
14. Waste-Free Environment: Less-waste products, Degradable waste, waste processing
15. Climate Change: Technology adaptation, Mitigation Technology, Resilience
16. Documentation and Record: Digital records, Accessibility, Operability, Security
17. Social Equity and Inclusiveness: Resource Policy, Employment Planning
18. Rural-Urban Divide: Road Connectivity, e-connectivity, Cultural Connectivity
19. Mass Employment: SME Empowerment, Resource and Material
20. Regional Equity: Local skill, local employment, local resource mapping
21. Sustainable Development: Acceptable Good Practices, Resource Planning, Products
22. Vulnerability to Disasters: Warning, Preparedness, Resilience, Prevention
23. A Secure Society: Social Unrest, Terrorism, Access to Law Enforcement
24. Cyber Safety: Privacy, Fraud, Harassment
25. Digital Literacy: Uniform literacy, access and dissemination

CSIR-NISTADS September 2017
STapp caSe STudy Adulteration: Food, Milk, Drugs, Fuel and Material
Summary Food ingredient fraud and economically motivated adulteration are emerging risks, being addition of low cost ingredients creates not only an economical problem but also a health risk for consumers (Sharma and Paradakar, 2010). Adulteration is adding a substance within other stuff although not permitted for legal or other reasons. Adulteration has emerged as a foremost problem for the Indian populace; it is found essentially in sectors like food, milk, drugs, fuels and material. Major food adulteration and contamination events occur with alarming regularity and are known to be episodic, with the question being not if but when another large-scale safety/integrity incident will occur. Indeed, the challenges of maintaining quality in food, drugs and other sectors are now internationally recognised. Adulteration, therefore, is a major societal problem; science and technology solutions are needed to address this problem. Within the philosophy and the scope of solution-centric R&D Design for Application of S&T to Peoples’ Problems (STAPP), the present report documents the nature and the magnitude of the problem of adulteration and possible S&T interventions. Here adulteration is viewed as a general problem, affecting food, milk, drugs, fuel and material due to bad practices by suppliers/vendors; therefore, some of the S&T and policy interventions are required.
The report first provides a macro-level socio-economic impact assessment of adulteration; these are based on secondary data available in the form of reports prepared by various agencies. The description highlights certain rules and regulations to control the adulteration, technologies advancing and survey of various technologies available and already in practice for the detection of adulteration, in the form of Technology Landscaping. New techniques developed specifically for detection and analysis are always emerging. As some of the standard assessment techniques become smaller, lighter and cheaper, the boundary between field and laboratory testing is blurring. The section on Technology Outlook outlines some recent developments.
Navigating the technological landscape is a formidable challenge, especially in low- and middle-income countries. At the same time, offenders develop new ways of circumventing the detection techniques. There is thus need for dedicated and sustained R&D efforts in adulteration detection.
In terms of an R&D system for adulteration detection, it is perceived that there are basically a few core technologies and methods involved. It would be therefore cost-effective and efficient to develop an Integrated R&D Eco-system for Adulteration Detection (IREAD). Such a system should have multi-disciplinary expertise; adulteration detection draws from physics, chemistry, biology, material, computer science, and a range of engineering disciplines.
A Roadmap is suggested to establish IREAD for sustained developments in adulteration detection by pooling existing expertise (for example, scientists on deputation) and infrastructure to create a world class facility at very little additional cost. There are agencies like CSIR where expertise and infrastructure may already exist in a distributed manner; an outline of CSIR's footprint in prevention/detection of adulteration is included to indicate feasibility of the proposed strategy.
It is argued that the establishment of an Integrated R&D Ecosystem for Adulteration Detection (IREAD) would address a major Peoples’ Problem and contribute to a Swasth Bharat.
CSIR-NISTADS September 2017
Macro Socio-Economic Analysis

CSIR-NISTADS September 2017
Food adulTeraTionNormally the adulteration in food is done either for financial gain or this results from lack of proper hygienic conditions of processing, storing, transportation and marketing. This ultimately leads to the juncture that the consumer is either cheated or becomes object of illnesses. Such forms of adulteration are quite common in developing countries. Food adulteration happens to be a major health hazard for people in day-to-day life. Adulteration of food stuff leads to a number of harmful effects on the digestive system, even cancerous and life threatening in some cases. Apart from health, food safety is vital for economic growth and progress as well. The Food Safety and Standards Act, 2006 is the primary law for the regulation of food products and formulation and enforcement of food safety standards in the country. Also to establish the Food Safety and Standards Authority of India (FSSAI) for laying down science based standards for articles of food and to regulate their manufacture, storage, distribution, sale and import, to ensure availability of safe and wholesome food for human consumption and related matters. As per FSSAI Report, there has been a surge in cases of food adulterations during the period 2011-15 as seen in Table 1. The rate of adulteration found in food samples tested in the different state has gone up from 8.43% in 2011-12 to 39.66% in 2015-16. As reported in 2014-2015 FSSAI document, food adulteration was found in all samples from all states and union territories, except for Mizoram where testing facility was not available.
Figure 1: Sample survey – FSSAI Technological solutions include periodic Demarcation of High Risk Zones, Portable food adulterant testing kits / Spot testing through Mobile Food Testing Vans and Telephonic / Online Complaint Mechanism through Food Safety Helpline by FSSAI.
Figure 2: Stakeholders in food safety sector1 Table 1: FSSAI Laboratory Testing Reports on Food Adulteration
Year Samples Analysed
% adulterated/ Misbranded
Cases Launched (Criminal/ Civil)
Penalties in (Rs lakhs)
2011-12 64593 12.7 6845 - 2012-13 69949 14.8 5840 525 2013-14 72200 18.7 10235 734 2014-15 74010 19.7 10536 1093
1 Source:https://www.slideshare.net/Adrienna/fssai-implication-for-food-industry-in-india-2013

CSIR-NISTADS September 2017
milk adulTeraTion As per the Economic Survey 2015-16, India ranks first in milk production, accounting for 18.5% of world production, attaining yearly output of about 146 million tonnes during 2014-15. The per capita availability of milk in India has increased from 176 grams per day in 1990-91 to 322 grams per day by 2014-15. It is more than the world average of 294 grams per day during 2013. This represents a sustained growth in availability of milk and milk products for the growing population. Dairying has become an important secondary source of income for millions of rural households engaged in agriculture.
Figure 3: Analysis of Sampling Source: National Survey of Milk Adulteration, 2011 Milk is subject to adulteration; numerous studies and other evidences have demonstrated milk adulteration in many countries, notwithstanding the prevailing inspection practices. Milk suppliers use methods to increase their margin from the sale of milk via dilution, extraction of valuable components, i.e. milk fat removed as cream and adding cheap sometimes potentially harmful bulking additives, like low-quality flour, to bring the total solids to a level acceptable to consumers. As a primary source of nutrition for infants, growing children as well as the elderly, adulteration of milk is particularly dangerous. Milk adulterants have hazardous health effects. The accumulation of detergent in milk can cause food poisoning and
other gastrointestinal complications. Its high alkaline level can also damage body tissue and destroy proteins. Other synthetic components can cause impairments, heart problems, cancer or even death. While the immediate effect of drinking milk adulterated with urea, caustic soda and formalin is gastroenteritis, the long-term effects are far more serious. “Urea can lead to vomiting, nausea and gastritis. Urea is particularly harmful for the kidneys, and caustic soda can be dangerous for people suffering from hypertension and heart ailments (Murthy, Kiranmai, & Kumar 2017). There are very few accounts in the literature about the validation of the classical qualitative methods generally employed to detect milk fraud and the practises as described in the legislation (Gondim et al 2015, Gondim et al 2016).
Figure 4: Milk safety in India Source: FSSAI Milk adulteration affects many strata of the society in a variety of ways. The National Survey on Milk Adulteration 2011 (snap shot survey) was conducted by the FSSAI to ascertain the quality of milk and identify different type of adulteration in the liquid milk throughout the country. The parameters analysed were Fat (%), solids-non-fat (SNF%), Neutralizers, Acidity, Hydrogen Peroxide, Sugar, Starch, Glucose, Urea, Salt, Detergent, Skimmed milk powder and vegetable

CSIR-NISTADS September 2017
fat to ascertain the presence of adulterants. The deviations were highest for fat (%) and SNF (%) in 46.8% samples of the total non–conformity. The second highest parameter of non-conformity was the skimmed milk powder in about 44.7% samples, including presence of glucose in 477 samples.
Figure 5: Monthly per capita consumption of milk Source: mospi.nic.in The survey also indicated that addition of water to milk is most common adulterant. Added water not only reduces the nutritional value of milk but contaminated water may also pose health risk to the consumers. Also, powdered milk is reconstituted to meet the demand of milk supply. The study exposed the occurrence of detergent in some samples which has health hazards and indicates lack of hygiene and sanitation in the milk handling. In urban parts of the country, nearly 70% of samples were found to be contaminated, while 31% contamination has been reported in samples from rural areas. Samples taken from two states - Goa and Puducherry were not contaminated.
drug adulTeraTion: Drug Adulteration is the practice of substituting original drug partially or wholly with other similar looking substances having inferior chemical or therapeutic properties and rendering it to be injurious to health. In addition to the adulteration of drugs, the problem of spurious or imitation drugs also exists in India. Spurious or imitation drug products are drug formulations
manufactured concealing the true identity of the product and made to resemble another drug, especially some popular brand, to deceive the buyer and cash on the popularity of the original product. The Drugs and Cosmetics Act, 1940 is the nodal law that regulates the import, manufacture and distribution of drugs in India. The primary objective of the act is to ensure that the drugs and cosmetics sold in India are safe, effective and conform to state quality standards. The Drugs and Cosmetics (Amendment) Act, 2008 provides deterrent penalties for offences relating to manufacture of spurious or adulterated drugs. The Ministry of Health and Family Welfare had carried out a National Survey of the extent of Problems of ‘Spurious and Not of Standard Quality (NSQ) Drugs’ (2014-16). A source wise distribution of samples and survey outcomes are depicted in figure 6. As such, the percentage of NSQ Drugs in India has been found to be 3.94% and that of spurious drugs is about .03%.
Figure 6: Drug quality: Based on survey: Ministry of Health and Family Welfare
Fuel adulTeraTion
Adulteration of the transport fuels at the point of sale and during transportation has become an acute problem in the country. Transport fuels are often adulterated with other cheaper or by-product or waste hydrocarbon stream for monetary gains. For example, gasoline (petrol)
Total Samples Tested -
47012
Spurious -13
NSQ - 1850
Samples fromRetail Outlets
33656Spurious - 8 NSQ - 1850
Samples from Govt. Outlets
8369Spurious - 5
NSQ - 839
Samples from Ports - 4987
Spurious - 0 NSQ - 0
CSIR-NISTADS September 2017
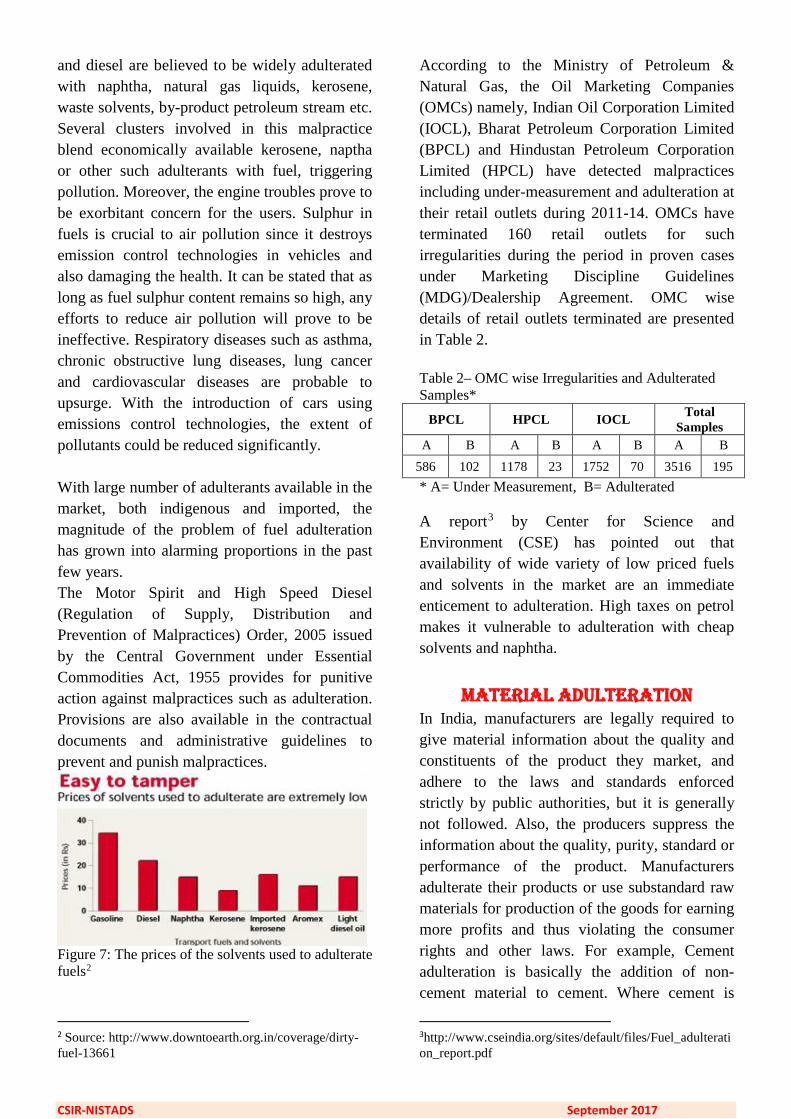
and diesel are believed to be widely adulterated with naphtha, natural gas liquids, kerosene, waste solvents, by-product petroleum stream etc. Several clusters involved in this malpractice blend economically available kerosene, naptha or other such adulterants with fuel, triggering pollution. Moreover, the engine troubles prove to be exorbitant concern for the users. Sulphur in fuels is crucial to air pollution since it destroys emission control technologies in vehicles and also damaging the health. It can be stated that as long as fuel sulphur content remains so high, any efforts to reduce air pollution will prove to be ineffective. Respiratory diseases such as asthma, chronic obstructive lung diseases, lung cancer and cardiovascular diseases are probable to upsurge. With the introduction of cars using emissions control technologies, the extent of pollutants could be reduced significantly. With large number of adulterants available in the market, both indigenous and imported, the magnitude of the problem of fuel adulteration has grown into alarming proportions in the past few years. The Motor Spirit and High Speed Diesel (Regulation of Supply, Distribution and Prevention of Malpractices) Order, 2005 issued by the Central Government under Essential Commodities Act, 1955 provides for punitive action against malpractices such as adulteration. Provisions are also available in the contractual documents and administrative guidelines to prevent and punish malpractices.
Figure 7: The prices of the solvents used to adulterate fuels2
2 Source: http://www.downtoearth.org.in/coverage/dirty-fuel-13661
According to the Ministry of Petroleum & Natural Gas, the Oil Marketing Companies (OMCs) namely, Indian Oil Corporation Limited (IOCL), Bharat Petroleum Corporation Limited (BPCL) and Hindustan Petroleum Corporation Limited (HPCL) have detected malpractices including under-measurement and adulteration at their retail outlets during 2011-14. OMCs have terminated 160 retail outlets for such irregularities during the period in proven cases under Marketing Discipline Guidelines (MDG)/Dealership Agreement. OMC wise details of retail outlets terminated are presented in Table 2. Table 2– OMC wise Irregularities and Adulterated Samples*
BPCL HPCL IOCL Total Samples
A B A B A B A B 586 102 1178 23 1752 70 3516 195 * A= Under Measurement, B= Adulterated A report3 by Center for Science and Environment (CSE) has pointed out that availability of wide variety of low priced fuels and solvents in the market are an immediate enticement to adulteration. High taxes on petrol makes it vulnerable to adulteration with cheap solvents and naphtha.
maTerial adulTeraTion In India, manufacturers are legally required to give material information about the quality and constituents of the product they market, and adhere to the laws and standards enforced strictly by public authorities, but it is generally not followed. Also, the producers suppress the information about the quality, purity, standard or performance of the product. Manufacturers adulterate their products or use substandard raw materials for production of the goods for earning more profits and thus violating the consumer rights and other laws. For example, Cement adulteration is basically the addition of non-cement material to cement. Where cement is
3http://www.cseindia.org/sites/default/files/Fuel_adulteration_report.pdf

CSIR-NISTADS September 2017
supposed to help in bonding to achieve strength in structures, adulterated cement will decline to bind when mixed even in proper proportion. This might lead to improper mortar formation, variation in setting time. Under the Bureau of Indian Standards Act, 1986, the Bureau ensures development of the activities of standardisation, marking and quality certification of goods. It has many standards for the various technical divisions including many products and materials related to various fields like - Electronics And Information Technology, Electrotechnical, Chemicals, Civil and Mechanical Engineering, Medical Equipment and Hospitals, Metallurgy and Production etc. The state enforced certification marks presently in India are ISI mark for industrial products. It certifies that a product conforms to a set of
standards laid by the Bureau of Indian Standards. Hallmarking is the accurate determination and official recording of the proportionate content of precious metal in valuable metal articles. BIS hallmark certifies the purity of gold jewellery. The BIS Precious Metals Sectional Committee (MTD 10) has formulated and published the following Indian Standards on Gold and Gold Alloys: a) IS 1417 Grades of gold and gold alloys,
Jewellery/Artefacts-Fineness and Marking b) IS 1418 Assaying of Gold in Gold Bullion,
Gold alloys and Gold Jewellery/ Artefacts - Cupellation (Fire Assay Method)
c) IS 2790 Guidelines for manufacture of 23,22,21,18,14 and 9 carat gold alloys
d) IS 3095 Gold Solders for use in manufacture of Jewellery

CSIR-NISTADS September 2017
Technology Landscaping

CSIR-NISTADS September 2017
Those working within and associated with the food industry strive for user-friendly methods to detect food fraud and contamination, and fast and high screening methods for the analysis of food in general (Ellis et al 2015). In addition to being robust and reproducible, these methods need to be portable and ideally handheld and/or remote sensor devices. They can be then taken to points of vulnerability along complex food supply networks. The ever increasing scale and complexity of food supply networks has made them significantly vulnerable to adulteration and contamination, and potentially dysfunctional. This has made the task of deciding which analytical methods are more suitable to collect and analyse (bio) chemical data within complex food supply chains, at targeted points of vulnerability, much more challenging. Mass spectrometry: Mass spectrometry (MS) is a powerful technology with many advantages and few current limitations for applications within the food supply chain. It provides abundant structural information and the precise molecular weight of the compound under investigation. The analytical methods like MS offer high chemical specificity and sensitivity for example, enabling the accurate identification and quantification of known analytes within complex food matrices at very minute level concentrations. These methods are considered to be the gold standard within many industries including the agri-food as well as the pharmaceutical, petrochemical, and defence industries. However, MS is a sophisticated analytical technique that requires extensive training and expertise to use. Some forms of MS can be considered as fingerprinting techniques (Ellis et al 2015) as they involve the direct introduction of samples into the mass spectrometer without prior chromatographic separation. Some recent examples of MS fingerprinting techniques include direct infusion/injection mass spectrometry (DIMS) for the characterization of the foodborne pathogen Campylobacter jejuni (Howlett et al 2004) desorption electrospray ionisation (DESI) for the analysis of melamine migration into foods from melamine tableware (Mattarozzi et al 2012), and matrix-assisted laser desorption (MALDI) MS for
detection of hazelnut oil in extra virgin olive oil (Calvano et al 2012). They are used for direct analysis in real-time (DART) MS for direct cleansing of fruit and vegetables for the detection of pesticides (Crawford and Musselman 2012) amongst many others. Whilst the MS methods are all relatively bulky and hence confined to conventional laboratories, there is enormous potential for these techniques outside the lab and in the food supply chain. Significant and progressive steps in portability and miniaturization have been achieved with reductions in size to less than 4 kg by Ouyang and Cooks (2009). MS methods are usually coupled with chromatographic techniques. The chromatography column chemistry needs to be carefully chosen in order to separate out the complex components of food adequately and thus comes with an additional analytical cost as well as being relatively slow. The development of entirely self-sustained, integrated, and truly handheld MS sensors may hopefully be equipped in future. Yet this could still be possible with simplified user interfaces, perhaps with the same MS core but with any number of interchangeable sample cartridges for a number of on-site applications (Zhou et al 2014). Such innovations would have place for the true democratisation of MS methods in becoming universal techniques able to be routinely used by non-specialists within a wide range of applications outside of laboratories, such as food supply chains. Infrared Spectroscopy- Methods for Food chain detection The infrared (IR) range of the EM spectrum can be divided into three sub regions: the NIR, mid-infrared (MIR), and far-infrared (FIR). Molecular vibration and rotation energies in the IR regions of the electro-magnetic spectrum may be observed with NIR or Raman spectrometers. These methods are relatively straightforward to use and moderately expensive, and routine comparative applications do not require extensive training.
CSIR-NISTADS September 2017
Fourier Transform Infrared (FT-IR) Spectroscopy: The potential of FT-IR spectroscopy for food analysis has been recognised for quite some time. The methods involve measuring the absorption of an IR beam within a sample, with every sample having its own unique spectral fingerprint (Ellis and Goodacre 2006). Rodriguez and Allendorf (2011) present a review of FT-IR for rapid authentication and detection of food adulteration. Unlike MS methods, on/at-line Near Infra-Red (NIR) instrumentation has been used within the food processing industry for a long time, mainly for the monitoring and control of product and process quality (Ellis et al 2012; Downey et al 1997). The range of FT-IR applications are significantly wide-ranging and contain the rapid detection of food spoilage bacteria at ambient temperatures in meat (Alexandrakis, Downey and Scannell 2012; Ellis, Broadhurst and Goodacre 2004; Ellis et al 2002; Ellis and Goodacre 2001). Others include the checking of bacterial interactions in milk (Nicolaou and Goodacre 2011) while few relate to speciation in meat and dairy products (Ellis et al 2005; Nicolaou, Xu and Goodacre 2010). Raman spectroscopy: Raman spectroscopy is another vibrational technique, which has to a large degree been made portable by many manufacturers (vide infra); it has high potential for use within food supply chains. While IR spectroscopy measures the absorption of energy, Raman spectroscopy contains the measurement of the exchange of energy with EM radiation of a specific wavelength, typically provided by a monochromatic light. The measurement in the shift of the incident laser light (the Raman shift) observed is also known as the inelastic light scattering effect. IR and Raman spectroscopy are complementary due to the selection rules, whereby molecules are either IR or Raman active. Molecules are infrared active only if the vibration induced by infrared light causes a change in the dipole moment; in contrast, Raman spectroscopy detects changes in the polarizability of molecules. Consequently there exist rules of mutual exclusion - the two approaches can deliver complementary (bio) chemical information, with
bands in Raman typically being much sharper and therefore more characteristic than in the IR. In terms of food analysis, Raman spectroscopy offers further distinctive benefits to IR spectroscopy, with water being a weak Raman scatterer for example, which is always an advantage when the huge bulk of foods or feed contain water in one form or the other. It is also a confocal method in the sense that it measures precisely at the point where the laser is focused on a sample, eliminating any out-of-focus signal. This is highly significant as it means that as long as the material the laser is passing through is transparent to laser light, conventional Raman spectroscopy can readily analyse samples through glass or plastic bottles/bags and other forms of transparent packaging, focusing directly on the contents inside including liquids and gather a (bio) chemical fingerprint quickly; this reduces the need to remove the sample, which becomes significant if the sample is highly hazardous. Therefore, Raman gives the user some advantages over the infrared methods. Hyperspectral Imaging: Use of NIR hyperspectral imaging for process control, food safety and quality has been well recognised. It has been accompanied by the application of chemometrics for data pre-treatment and analysis (Cheng and Sun 2015; Esquerre et al 2012) and multivariate screening and modelling (Lopez et al 2014). Other applications include test of melamine adulteration of soya bean meal (Haughey et al 2013; Haughey et al 2015) and non-targeted analysis of adulteration of milk powders (Botros et al 2013). DNA-based techniques and molecular methods DNA-based techniques and molecular methods allow fast and sensitive detection of Salmonella in food, detection of fraudulent seafood species substitution or the microbial composition of different foods. The detection of multiple genetically engineered crops is still an important topic in which the effect of food processing on plant DNA degradation and PCR-based analysis of transgenic foods has also been studied These DNA-

CSIR-NISTADS September 2017
based methods also allow the authenticity determination of meat and meat products the identification of animal species in food products, as well as the authentication of maize. Biosensors have been developed aimed at determining major and minor food components, preservatives, food colours and sweeteners, toxins, pesticides, antibiotics, and hormones. They have also been employed in tracking microbial contamination to follow food safety, processing, and to certify food quality and control the advantages of these methods include rapid response time, high degree of specificity and sensitivity, and the possibility of being used for inline processes monitoring food manufacturing (Kavita et al 2016). Other developments include peptide nucleic acid (PNA)-based technologies for food analysis/ authentication or the development of new immunoassay methodologies to analyse veterinary drug residues in foods and food products or to characterize plant food allergens (Sakai & Ikenaga 2013).
Micro-Electrical-Mechanical-Systems (MEMS): There are developments in the miniaturization of these approaches using handheld micro-electrical-mechanical-systems (MEMS) based NIR online in abattoirs. While NIR technology is still refining and is very suitable technology within the agri-food sector for rapid, bulk and high-throughput screening (Zamora et al 2012); Santos et al (2013). FT-IR is more sensitive and possibly more apt to the detection of low-level compounds within complex food matrices and subtle differences between samples from analogous backgrounds. The suitability and utility of portable/handheld FT-IR spectroscopy within the food supply chain has become increasingly evident. In addition to the relatively stable and restricted laboratory setting, portable and handheld spectroscopy has already proven effective in the more challenging and lively surroundings of the food supply chain. A considerable body of work by Saona and co-workers (2011) has shown the utility and efficacy of portable and handheld FT-IR for a range of
food-based applications, including monitoring oxidative stability (Allendorf, Subramanian and Saona 2012) as well as measuring trans-fat content in edible oils (Birkel and Saona, 2011). Thus handheld FT-IR can be a simple and quick substitute to MS for on-site analysis of acrylamides in potato chips (Ayvaz and Saona 2015), and in situ discernment and confirmation of conventionally produced and organic butter (Pujolras et al 2015). Nuclear Magnetic Resonance (NMR): This spectroscopy method analyzes the interaction of nuclei with EM radiation in magnetic fields. Like Raman and NIR spectrometry, it is a non-destructive, reliable technique, applicable to nuclei that have a non-zero spin, such as those in hydrogen and carbon-13 that yields quantitative data with little sample preparation. However, NMR instruments are expensive and require stable electrical power supplies, controlled temperatures, and skilled analysts for their operation. Integrating the area under each absorption peak can provide detailed information about molecular composition and structure; the area under each peak corresponds to the number of nuclei (in protons or carbon-13 atoms) contributing to that particular signal. Many common chemical contaminants produce characteristic absorption peaks (Gottlieb et al 1997). In NMR analysis, all of the compounds in that contain the nucleus under analysis will contribute to the spectrum. This can produce ambiguous spectra that may contain overlapping signals, so chemists typically isolate the components before analyzing them with NMR. However, newer, more sophisticated NMR technologies may be capable of separating drug components and producing clearer signals. Diffusion-ordered proton-NMR spectroscopy, for example, can identify the various types of ingredients in a mixture by taking advantage of differences in molecular mass (Martino et al 2010). The downside to this type of technique is that it is not quantitative, like normal NMR is, but, by using the two techniques together, a fuller, clearer molecular picture can be
CSIR-NISTADS September 2017
developed. Using these methods, scientists have successfully differentiated between many authentic and falsified versions of antimalarials, erectile dysfunction drugs, and antidepressants. X-ray diffraction and X-ray fluorescence are other techniques that can give substantial information about drug contents. X-ray diffraction can be used to analyze active ingredients and excipients, while X-ray fluorescence is used for elemental analyses that can often distinguish real from falsified drugs (Kaur et al 2010; Martino et al 2010). Detection of Drug Adulteration: A full evaluation of drug quality requires a range of qualitative and quantitative testing to verify the identities and amounts of active ingredients, check for impurities, and ensure acceptable disintegration, dissolution, stability over time, and sterility (USP 2007). Identifying falsified and substandard drugs does not always follow the same process as a rigorous quality evaluation. A few simple tests can identify a product with no active ingredient or one made under gross manufacturing negligence. More sophisticated adulterations resist easy detection. Appearance, content, and therapeutic effect can all be considered in classifying falsified drugs. Offenders in the business of making falsified drugs can buy crude active ingredients, chemicals that have not undergone the appropriate purification steps required to meet pharmacopeial standards or manufacturer's dossier requirements, for example. The drugs made from such chemicals would pass most tests. Only highly sophisticated and expensive assays could detect trace contaminates. Detection, Screening, and Analytical Techniques: The main techniques for pharmaceutical analysis are visual inspection of product and packaging; tests for physical properties such as disintegration, reflectance spectroscopy, and refractive index; chemical tests including colorimetry and dissolution; chromatography; spectroscopic techniques; and mass and Raman spectrometry. Within each of
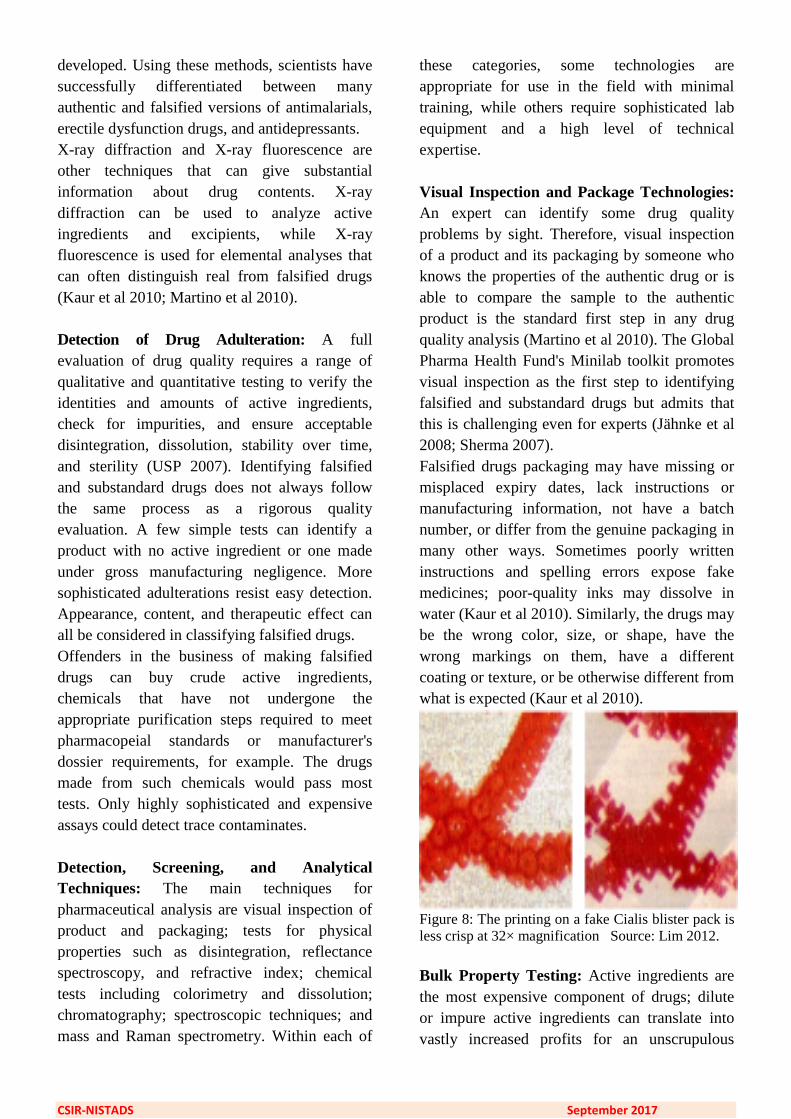
these categories, some technologies are appropriate for use in the field with minimal training, while others require sophisticated lab equipment and a high level of technical expertise. Visual Inspection and Package Technologies: An expert can identify some drug quality problems by sight. Therefore, visual inspection of a product and its packaging by someone who knows the properties of the authentic drug or is able to compare the sample to the authentic product is the standard first step in any drug quality analysis (Martino et al 2010). The Global Pharma Health Fund's Minilab toolkit promotes visual inspection as the first step to identifying falsified and substandard drugs but admits that this is challenging even for experts (Jähnke et al 2008; Sherma 2007). Falsified drugs packaging may have missing or misplaced expiry dates, lack instructions or manufacturing information, not have a batch number, or differ from the genuine packaging in many other ways. Sometimes poorly written instructions and spelling errors expose fake medicines; poor-quality inks may dissolve in water (Kaur et al 2010). Similarly, the drugs may be the wrong color, size, or shape, have the wrong markings on them, have a different coating or texture, or be otherwise different from what is expected (Kaur et al 2010).
Figure 8: The printing on a fake Cialis blister pack is less crisp at 32× magnification Source: Lim 2012.
Bulk Property Testing: Active ingredients are the most expensive component of drugs; dilute or impure active ingredients can translate into vastly increased profits for an unscrupulous
CSIR-NISTADS September 2017
manufacturer. Some tests that rely on pH and other bulk properties can help identify active ingredients. Bulk properties, also called intensive properties, are properties that do not depend on the amount of the chemical sampled. Density, solubility, reflectance spectra, refractive indices, and optical rotation are examples of bulk properties (Brown et al 2011). The malaria drug artesunate, for example, has some distinctive physical properties: It yields characteristic crystals when precipitated from water, and its extract acidifies water (Deisingh 2005; Newton et al 2006). These properties can be used to differentiate some genuine and false antimalarials.
The refractive index, can be used to measure the purity of liquids and is able to detect materials separated by liquid chromatography. Field inspectors can use handheld refractometers to measure the refractive index and use it as a quantitative test for some active ingredients (Kaur et al 2010). Colorimetry and Other Chemical Testing: A variety of simple chemical reactions can test for the presence of active ingredients. Colorimetry is one such technique. It relies on chemicals that undergo color changes when reacted with certain compounds to provide qualitative data about a drug's identity. Colorimetry protocols exist for the active ingredients in many essential drugs. Green and colleagues explored the practical use of refractive index to measure the amount of active ingredients selectively dissolved in certain solvents (Green et al 2007). They found that while the refractive index can measure the amount of an unknown active ingredient, colorimetry can be used to help confirm its presence (Green et al 2007). Fast Red TR dye tests for the active ingredient in some antimalarials by turning yellow in the presence of artesunate (Green et al 2001). In addition to verifying the presence of an active ingredient, colorimetry can serve as a semi-quantitative technique to provide information about tablet potency; a more drastic color change or deeper color generally indicates a larger amount of
ingredient. More precise colorimetric testing is possible with a handheld photometer, a spectroscopic device that measures absorbance of light through a substance (Newton et al 2006). Colorimetry gives limited information and destroys the sample under investigation, but it is invaluable to field inspectors because it is an inexpensive technique that requires very little training. Mass Spectrometry in Detection of Drug Adulteration: Mass spectrometer can identify many active ingredients and excipients, as well as some impurities (Kaur et al 2010; Martino et al 2010). This technique successfully detected falsified halofantrine syrup, an antimalarial, in West Africa that instead contained a sulphonamide antibiotic (Wolff et al 2003). When mass spectrometers were bulky, their worth was hard to appreciate in poor countries, but newer, portable machines can take this sophisticated technology into the field (Yang et al 2008). However, mass spectrometers need a steady electrical power source, which may be problematic to attain in some developing countries.
Other kinds of MS techniques are direct ionization, tandem, time-of-flight, secondary ion, and electrospray ionization (ESI). They can be used alone and in combination with other analyses to detect illegitimate drugs (Deisingh, 2005; Martino et al 2010; Wolff et al 2003). Direct ionization MS is a relatively new class of MS analysis that does not require lengthy sample preparation. Other techniques, such as direct analysis in real time (DART) mass spectroscopy and desorption ESI mass spectrpscopy, can identify correct and incorrect active ingredients and some excipients. Desorption ESI mass spectrometer in particular provides information about tablet surface homogeneity and the distribution of active ingredients and excipients in or on the surface of a tablet (Martino et al 2010). For example, an artesunate sample with homogeneous surface distribution of lactose and paracetamol, a fever reducer, is illegitimate; an authentic, good-quality sample should have

CSIR-NISTADS September 2017
homogeneous distribution of artesunate and scattered distribution of lactose (Martino et al., 2010). The most sophisticated drug copies may resist identification with any technology other than mass spectrometry. Among these are very close analogues of genuine active ingredients. These analogues can be so chemically and structurally similar that they behave the same under nearly any analysis. Mass spectrometry's ability to precisely measure molecular weight and compare fragmentation patterns can help distinguish between compounds that differ by only one or two atoms. For example, the erectile dysfunction drug Cialis is often copied with varying degrees of sophistication (Putze et al 2012; Trefi et al 2008). U.S. Food and Drug Administration (FDA) forensic chemists have discovered several analogues of the active ingredient, tadalafil, in so-called herbal remedies (Gamble et al 2008). IR Spectroscopy- Applications in Drug adulteration detection: The infrared (IR) range of the EM spectrum can be divided into three
sub regions: the NIR, mid-infrared (MIR), and far-infrared (FIR). Molecular vibration and rotation energies in the infrared regions of the EM spectrum may be observed with NIR or Raman
spectrometers. These methods are relatively straightforward to use and moderately expensive, and routine comparative applications do not require extensive training. Chemists analyze the absorption peaks in these spectra primarily to
identify molecular functional groups; most active pharmaceutical ingredients and some organic excipients and impurities have characteristic spectral peaks or spectral fingerprints that can be used to help identify them. Various spectra produced using the techniques elucidate different aspects of drug composition; characteristic absorption or emission peaks correspond to aspects of chemical composition and molecular structure. A chemist can extract detailed chemical and structural information from a spectrum, and an inspector with minimal training can also identify falsified and substandard medicines by comparing the drug spectra to reference materials in drug spectra databases (Kaur et al 2010). The World Health Organisation (WHO) maintains a digital form of the International Pharmacopoeia with drug quality determination protocols for various common medicines (WHO 2011). This guide includes a reference infrared spectrum for each drug. Out of the three sub regions of the EM radiation, MIR range is more discerning and commonly used region. There are several ways to collect infrared spectra, each having advantages and disadvantages. Attenuated total reflectance and FT-IR is particularly useful for drug quality analyses because it does not require sample preparation, does not destroy the sample, and provides information about the distribution of active ingredients and excipients on the surface of tablets (Martino et al 2010). Proper application of FT-IR can distinguish between some types of real and falsified packaging. Raman Spectroscopy can readily identify many active ingredients and give further information about excipients, as well as the relative concentration of active ingredients to excipients (Deisingh, 2005). These ratios can be key to detecting falsified and substandard drugs, because criminal manufacturers often take care to use the correct amount of active ingredient but may not be as exacting about the excipients,
Figure 9: Handheld Raman Spectrometer, source Zook

CSIR-NISTADS September 2017
which may vary even among genuine manufacturers (Deisingh, 2005; Nyadong et al 2009). For example, artesunate tablets may contain either of the highly similar sugars lactose or sucrose, depending on the manufacturer (Nyadong et al 2009). Raman can distinguish between these, and a Raman spectrum of Cialis identifies both the active ingredient, tadalafil, and the primary excipient, lactose (Lim 2012). Raman spectroscopy is particularly useful for detecting inorganic substances in drugs, such as titanium dioxide, a common component of tablet coatings (Witkowski, 2005). Data Analytics: Detection technologies provide both qualitative and quantitative data about drugs. Qualitative methods provide information about a drug's identity, such as its active ingredient, color, or labeling. Quantitative techniques provide data on a drug's content and how that content will be absorbed in the body. Qualitative assays may be used to quickly detect the least sophisticated falsified drugs, such as those with the wrong or no active ingredient. Quantitative deficiencies, such as an unacceptable level of impurities or an unacceptably low or high dosage of active ingredient, are more common among substandard drugs. Tests for drug quality use both qualitative data (e.g., the identity of ingredients, the presence and nature of any packaging and inserts, the presence or absence of impurities, and any data referring to the drug's appearance); quantitative data include the amount of an ingredient present, tablet hardness, the rate and extent of disintegration and dissolution, and levels of impurities. A few studies involving portable Raman spectroscopy have included the screening of melamine adulteration in milk powder (Cheng et al 2010) and infant formula, lactose, whey protein, wheat bran and wheat gluten and povidone (Mecker et al 2012). Portable Raman devices have been employed to detect organophosphate and organothiophosphate pesticides phorate and fenthion on apple skins (Li et al 2014), fungicide and parasiticide thiabendazole applied on citrus fruits and bananas (Muller et al 2014), vegetable
and essential oils (Jentzsch and Ciobota 2014). There are studies also for detection of marker compounds for illegal alcoholic beverages (Kwiatkowski et al 2014). In addition few research studies relate to detection and discrimination of pathogenic bacteria on food crops in the field (Wu et al 2013), detection of offal adulteration in beef (Zhao, Downey and O'Donnell 2015); and one relates to identification of rapid meat spoilage (Sowoidnich et al 2012). Chromatography: Chromatography is the most common analytical method used in drug evaluations. It separates mixtures into their constituent parts based on a variety of chemical and physical properties. It can be used to separate drug ingredients for further testing and, when used with appropriate detectors, provides both qualitative and quantitative information about active ingredients and impurities (Kaale et al 2011). Chromatographic techniques range from basic techniques, such as thin layer chromatography (TLC) with visual inspection, to more specialized laboratory methods, such as high-performance liquid chromatography (HPLC) coupled with mass spectrometry. TLC is a planar chromatographic technique that is ideal for field drug testing. In TLC comparisons, authentic samples travel the same distance on a TLC plate and yield main spots of highly similar shapes, colors, intensities, and sizes as reference standards. The distance the sample travels is associated with its identity; the intensity of the spot correlates with the amount of the drug present. High concentrations of impurities may be visible on a TLC plate as well (Kaur et al 2010). In a convenience sample of tuberculosis drugs in Botswana, TLC indicated 31% samples tested were substandard (Kenyon et al 1999). In China, researchers used TLC to distinguish between authentic and falsified versions of several antibiotics (Hu et al 2005). TLC is an uncomplicated assay useful in developing countries because it yields “versatile and robust” results at a low. Compared to other chromatographic techniques, TLC requires significantly less equipment and expertise. Modern instrumental TLC applications give
CSIR-NISTADS September 2017
quantitative assessments similar to those obtained with other instrumental chromatography procedures. The main drawbacks to TLC are its limited semi-quantitative data (when used with visual detection) and the need for accurate technique. TLC solvents are often toxic or flammable, so these chemicals may be difficult to transport for field use. Additionally, TLC delivers partial information about a drug's identity; two samples that travel unlike distances are definitely not the same substance, but two different substances could appear identical using any chromatography technique if they are chemically similar enough. Accurately estimating the amount of drug on a TLC plate can be difficult without experience (Kaale et al 2011). Advanced chromatography techniques: HPLC coupled with mass spectrometry is a more specialized laboratory method. HPLC is a more selective technique and, when coupled with sensitive detectors, is generally regarded as the definitive technique for drug content analysis (Martino et al 2010). Depending on the associated detection technology, it can be expensive and require skilled operators and costly, often scarce, solvents. The systems also require reliable electrical power, which can be an obstacle in developing countries. An HPLC chromatogram can clearly distinguish between the antimalarial chloroquine, mefloquine, and quinine. Although the drugs are chemically similar, mefloquine is significantly more expensive, and the cheaper drugs are sometimes sold labelled as mefloquine (Gaudiano et al 2006). HPLC can identify and measure active ingredients and many impurities, but may not detect excipients that are not soluble in the mobile phase. Diode array detection is now standard with many HPLC assays and can be used to confirm the
presence of active ingredients. It is a type of Ultra Violet spectroscopy that is particularly useful because it can operate at varying wavelengths, allowing it to be fine-tuned for analyses, and can help detect the presence of several components hidden in a single HPLC peak (Kazakevich and McNair 1996). Another study settled an HPLC with diode array detection method to detect and quantify eight antidepressants for use in cases of suspected poisonings (Titier et al 2003). The main advantages of the method were its speed, ease of use, and accuracy. Gas chromatography is a powerful technology which provides similar information as other chromatography systems. However, it may only be used for separation of volatile materials, such as residual solvents, undeclared ingredients, and any volatile impurities. This technique can only be used when the compounds of interest are gaseous in the analytical temperature range and do not degrade at or before the assay's minimum temperature. For example, artemisinin derivatives for treating malaria are too unstable for gas chromatography (Martino et al 2010). Unlike TLC, advanced chromatography techniques require considerable investment; the equipment needed is expensive to buy and maintain (Kaale et al 2011). These tests can only be done in central laboratories, and countries most affected by falsified and substandard drugs have limited access to such facilities (IOM, 2012). HPLC and gas chromatography are time-consuming, especially considering the time spent preparing the samples for analysis. The return on the time investment is mixed, as chromatography separates a minimum number of components present in a sample. A peak assumed to represent one compound may be hiding several other compounds.

CSIR-NISTADS September 2017
Figure 10: Schematic of SERS phenomenon for an organic analyte on AuNPs Source: Wei, Abtahi and Vikesland (2015)
Milk Adulteration detection: Several techniques have been developed for detection of adulteration in milk. Once again these techniques are mostly based on colorimetry and spectroscopy. Poonia Amrita et al (2016) give a review of several such techniques. Santos, Filho and Rodriguez (2013) use Soft Independent Modeling of Class Analogy (SIMCA) to detect levels of milk adulteration with whey, synthetic milk, synthetic urine, urea and hydrogen peroxide. Wu et (2015) use ELISA approach for the detection of Salmonella spp. in milk samples. The colorimetric method utilizes the color transformation of gold nanoparticle from red to blue or purple on interaction with melamine and was used for rapid screening. However, the colorimetric method presents false positive and inaccurate quantitative signals in the presence of interfering compounds. To overcome these limitations, the SERS method was employed as a rapid validation tool. The SERS method can directly utilize Au NPs from the colorimetric method. For the optimization of combining two methods, three sizes (15, 30, and 50 nm) of Au NPs were evaluated, and the 30 nm Au NPs were determined to be the best size for both colorimetric and SERS methods based on limits of detection and quantification capability of melamine. Wei, Abtahi and Vikesland (2015) developed a method integrating two gold nanoparticle (AuNP) based techniques, colorimetric and surface enhanced Raman spectroscopic (SERS) analyses, for rapid
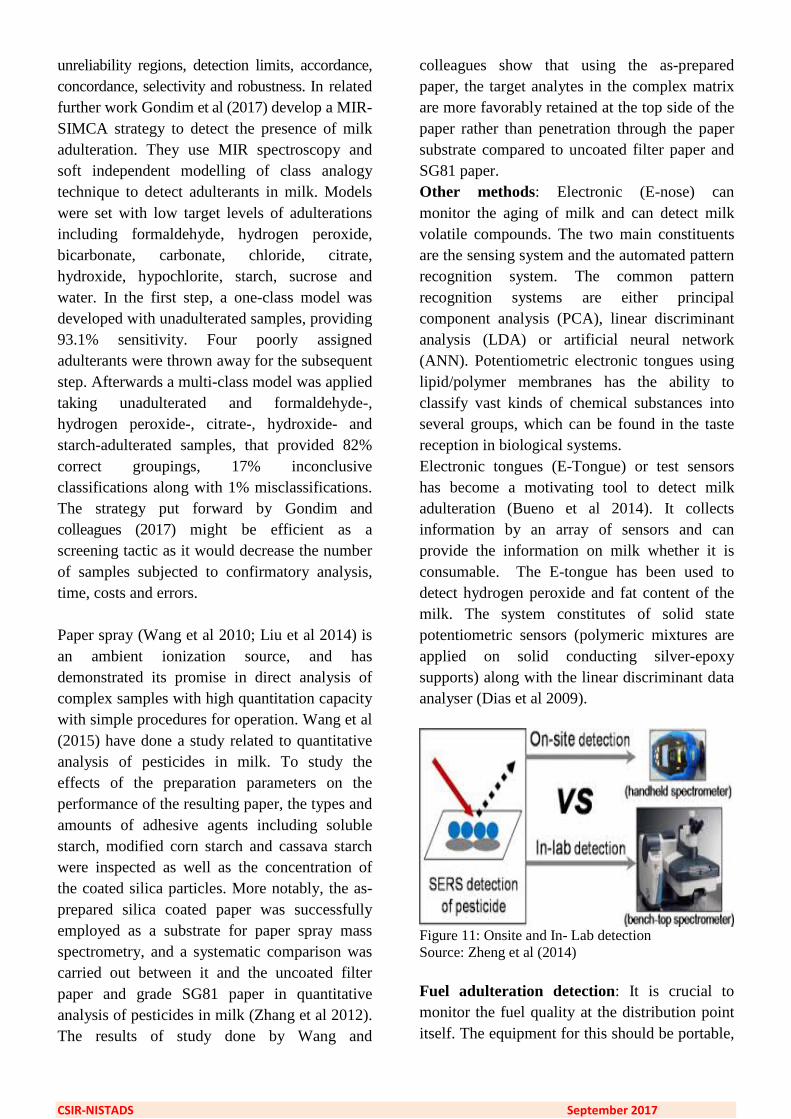
screening and validation of melamine in milk. By using the developed colorimetric–SERS method, Wei and colleagues (2015) have been able to rapidly screen and validate melamine in milk, as low as 0.25 ppm, within 20 minutes. Integrating colorimetric and SERS methods exploits the advantages of both methods, and provides a more rapid, accurate, and cost-effective way for monitoring melamine contamination in large amounts of food products. Zheng et al (2014) have evaluated and compared SERS detection using a handheld and a bench-top Raman spectrometer (figure 11). They used Silver dendrites as the SERS substrate, and two pesticides as the analytes. Capacity and performance were evaluated based on many. The results depict that the handheld Raman spectrometer had better data consistency, more accurate quantification capacity, as well as the capacity of on-site and intelligence for qualitative/semi-quantitative analysis. Nevertheless, the bench-top Raman spectrometer showed about 10 times higher sensitivity, and flexibility for optimization of the SERS measurements under different parameters Zheng et al (2014). In Gondim et al (2015), a novel validation approach has been applied on classical qualitative methods related to the detection of the density restoratives starch, chlorides and sucrose in raw milk, considering the official and modified versions. The study also estimated the rates,
CSIR-NISTADS September 2017
unreliability regions, detection limits, accordance, concordance, selectivity and robustness. In related further work Gondim et al (2017) develop a MIR-SIMCA strategy to detect the presence of milk adulteration. They use MIR spectroscopy and soft independent modelling of class analogy technique to detect adulterants in milk. Models were set with low target levels of adulterations including formaldehyde, hydrogen peroxide, bicarbonate, carbonate, chloride, citrate, hydroxide, hypochlorite, starch, sucrose and water. In the first step, a one-class model was developed with unadulterated samples, providing 93.1% sensitivity. Four poorly assigned adulterants were thrown away for the subsequent step. Afterwards a multi-class model was applied taking unadulterated and formaldehyde-, hydrogen peroxide-, citrate-, hydroxide- and starch-adulterated samples, that provided 82% correct groupings, 17% inconclusive classifications along with 1% misclassifications. The strategy put forward by Gondim and colleagues (2017) might be efficient as a screening tactic as it would decrease the number of samples subjected to confirmatory analysis, time, costs and errors. Paper spray (Wang et al 2010; Liu et al 2014) is an ambient ionization source, and has demonstrated its promise in direct analysis of complex samples with high quantitation capacity with simple procedures for operation. Wang et al (2015) have done a study related to quantitative analysis of pesticides in milk. To study the effects of the preparation parameters on the performance of the resulting paper, the types and amounts of adhesive agents including soluble starch, modified corn starch and cassava starch were inspected as well as the concentration of the coated silica particles. More notably, the as-prepared silica coated paper was successfully employed as a substrate for paper spray mass spectrometry, and a systematic comparison was carried out between it and the uncoated filter paper and grade SG81 paper in quantitative analysis of pesticides in milk (Zhang et al 2012). The results of study done by Wang and
colleagues show that using the as-prepared paper, the target analytes in the complex matrix are more favorably retained at the top side of the paper rather than penetration through the paper substrate compared to uncoated filter paper and SG81 paper. Other methods: Electronic (E-nose) can monitor the aging of milk and can detect milk volatile compounds. The two main constituents are the sensing system and the automated pattern recognition system. The common pattern recognition systems are either principal component analysis (PCA), linear discriminant analysis (LDA) or artificial neural network (ANN). Potentiometric electronic tongues using lipid/polymer membranes has the ability to classify vast kinds of chemical substances into several groups, which can be found in the taste reception in biological systems. Electronic tongues (E-Tongue) or test sensors has become a motivating tool to detect milk adulteration (Bueno et al 2014). It collects information by an array of sensors and can provide the information on milk whether it is consumable. The E-tongue has been used to detect hydrogen peroxide and fat content of the milk. The system constitutes of solid state potentiometric sensors (polymeric mixtures are applied on solid conducting silver-epoxy supports) along with the linear discriminant data analyser (Dias et al 2009).
Figure 11: Onsite and In- Lab detection Source: Zheng et al (2014) Fuel adulteration detection: It is crucial to monitor the fuel quality at the distribution point itself. The equipment for this should be portable,
CSIR-NISTADS September 2017
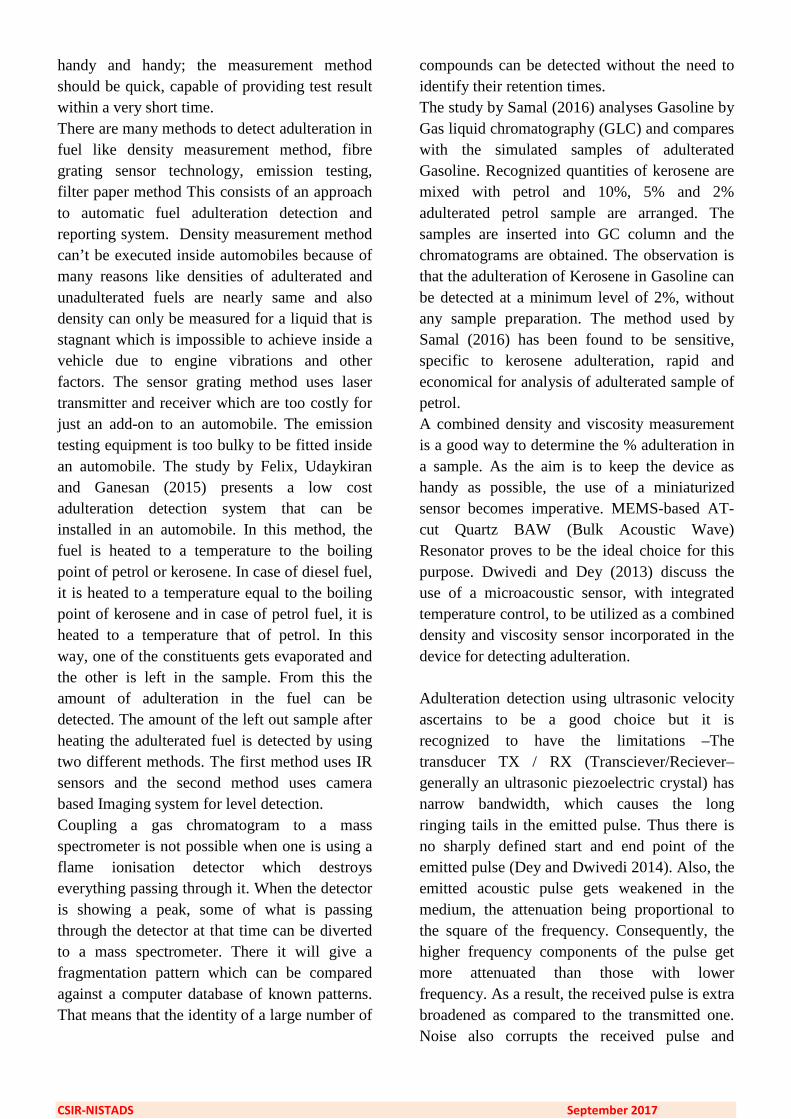
handy and handy; the measurement method should be quick, capable of providing test result within a very short time. There are many methods to detect adulteration in fuel like density measurement method, fibre grating sensor technology, emission testing, filter paper method This consists of an approach to automatic fuel adulteration detection and reporting system. Density measurement method can’t be executed inside automobiles because of many reasons like densities of adulterated and unadulterated fuels are nearly same and also density can only be measured for a liquid that is stagnant which is impossible to achieve inside a vehicle due to engine vibrations and other factors. The sensor grating method uses laser transmitter and receiver which are too costly for just an add-on to an automobile. The emission testing equipment is too bulky to be fitted inside an automobile. The study by Felix, Udaykiran and Ganesan (2015) presents a low cost adulteration detection system that can be installed in an automobile. In this method, the fuel is heated to a temperature to the boiling point of petrol or kerosene. In case of diesel fuel, it is heated to a temperature equal to the boiling point of kerosene and in case of petrol fuel, it is heated to a temperature that of petrol. In this way, one of the constituents gets evaporated and the other is left in the sample. From this the amount of adulteration in the fuel can be detected. The amount of the left out sample after heating the adulterated fuel is detected by using two different methods. The first method uses IR sensors and the second method uses camera based Imaging system for level detection. Coupling a gas chromatogram to a mass spectrometer is not possible when one is using a flame ionisation detector which destroys everything passing through it. When the detector is showing a peak, some of what is passing through the detector at that time can be diverted to a mass spectrometer. There it will give a fragmentation pattern which can be compared against a computer database of known patterns. That means that the identity of a large number of
compounds can be detected without the need to identify their retention times. The study by Samal (2016) analyses Gasoline by Gas liquid chromatography (GLC) and compares with the simulated samples of adulterated Gasoline. Recognized quantities of kerosene are mixed with petrol and 10%, 5% and 2% adulterated petrol sample are arranged. The samples are inserted into GC column and the chromatograms are obtained. The observation is that the adulteration of Kerosene in Gasoline can be detected at a minimum level of 2%, without any sample preparation. The method used by Samal (2016) has been found to be sensitive, specific to kerosene adulteration, rapid and economical for analysis of adulterated sample of petrol. A combined density and viscosity measurement is a good way to determine the % adulteration in a sample. As the aim is to keep the device as handy as possible, the use of a miniaturized sensor becomes imperative. MEMS-based AT-cut Quartz BAW (Bulk Acoustic Wave) Resonator proves to be the ideal choice for this purpose. Dwivedi and Dey (2013) discuss the use of a microacoustic sensor, with integrated temperature control, to be utilized as a combined density and viscosity sensor incorporated in the device for detecting adulteration. Adulteration detection using ultrasonic velocity ascertains to be a good choice but it is recognized to have the limitations –The transducer TX / RX (Transciever/Reciever–generally an ultrasonic piezoelectric crystal) has narrow bandwidth, which causes the long ringing tails in the emitted pulse. Thus there is no sharply defined start and end point of the emitted pulse (Dey and Dwivedi 2014). Also, the emitted acoustic pulse gets weakened in the medium, the attenuation being proportional to the square of the frequency. Consequently, the higher frequency components of the pulse get more attenuated than those with lower frequency. As a result, the received pulse is extra broadened as compared to the transmitted one. Noise also corrupts the received pulse and

CSIR-NISTADS September 2017
echoes from other objects making it hard to recognise the echo from the object under study. Dey and Dwivedi (2014) utilize an alternate method to overcome the limitations of ultrasonic method and propose an economical and hand-held portable device for easy detection of adulteration in fuel beyond permissible limits. With this aim, they develop basic device using Computer Aided Three-dimensional Interactive Application (CATIA)v5, which would employ a special kind of micro-acoustic sensor to fulfil the purpose. CATIA is Computer Aided Design (CAD) software that greatly simplifies the development of 3D models and doesn’t require any special design skills. A microacoustic sensor is basically a microfabricated or miniaturized sensor and in its widest meaning can be used to indicate a number of significantly different devices with the common characteristic being that acoustic waves are involved in the operating principle. The general advantages of microacoustic sensors are high sensitivity, simple fabrication and quasidigital frequency readout (Herrmann et al 2001). Roy (1999) developed a simple, intrinsic intensity modulated fibre optic sensor for determining adulteration of petrol and diesel by kerosene. The sensor is useful due to its simple construction, operation, safety with inflammable fuels and the possibility of making it compact and portable for on-road measurements. Fibre grating sensor technology has also been used by Mishra et al (2008) for detection of fuel adulteration. A method for detection of adulteration of biodiesel by soybean oil using UV-VIS spectrophotometer has been proposed by (Fernandes et al 2014). The observation of adulteration of diesel has been observed by using kinetic viscosity and opacity value as test parameters (Yadav et al 2005). A field survey of excessive crankcase dilution of lubricating oil in petrol driven vehicle has done (Ehsan et al 2010). Obeidat et al (2014) employ the excitation emission matrices fluorescence spectroscopy and
multiway principal component analysis to classify several petroleum products (gasoline, diesel, and kerosene) and some organic solvents (hexane, paint thinner). The study considered 60 samples in all including the petroleum and organic samples. The same protocol was also used successfully for uncovering the adulteration detection of gasoline with less expensive petroleum or organic substances of different compositions. The methodology was also used to uncover the adulteration of diesel with kerosene. Mendes and Barbeira (2013) have shown that the use of distillation curves combined with PCA (Principal Component Analysis) and PLS-DA (Partial Least Squares Discriminant Analysis) provides a model with enough sensitivity to discriminate adulterated and unadulterated gasoline samples, as well as, the determination of the solvent used in adulteration with minimum percentage of 97% accuracy. Cement Adulteration: It has been made possible to determine the dielectric parameters of many materials and composites using Material Measurement equipment of the Agilent Technologies. The conventional methods of testing the cement yield only the physical and chemical properties of cement. To control the quality of cement for utilization, there is a need to carry out other advanced tests like Non- Destructive Evaluation of Cement using Microwaves (Mary, Srimathi and Vakul 2015)

CSIR-NISTADS September 2017
Technology Outlook

CSIR-NISTADS September 2017
Advances in S&T have opened up many new avenues for adulteration detection. These methods are not only powerful but are also relatively expensive; forensic chemistry techniques can now give information on the unique fingerprints manufacturers leave on their products. Such an analysis can give authorities the evidence necessary to tie falsified drugs to particular sources; however, such sensitivity is still expensive. Forensic chemistry assays are not practical for routine product quality market surveillance and may be out of reach entirely in many of the low- and middle-income countries most affected by the problem (Fernandez et al 2008; Power 2008). There exists a need of inexpensive and sustainable detection technologies to be used for routine product quality assessments in all markets. As offenders become more sophisticated, there will be an increased need for expensive technologies to detect falsified medicines. There are several categories of techniques to analyze pharmaceuticals including visual inspection of product and packaging; tests for physical properties such as disintegration, reflectance spectroscopy, and refractive index; chemical tests including colorimetry and dissolution; chromatography; spectroscopic techniques; and mass spectrometry. Novel technologies are constantly being developed to detect falsified and substandard medicines. Improved colorimetric–SERS method has been used (Lang and others, 2015) to rapidly screen and validate melamine in milk, as low as 0.25 ppm, within 20 minutes. Integrating colorimetric and SERS methods exploits the advantages of both methods, and provides a more rapid, accurate, and cost-effective way for monitoring melamine contamination in large amounts of food products. It is felt that, along with the many other methods currently in development, mobile handheld (as well as static, benchtop, fixed at-line) spectroscopy, will play a far greater role within the area of food and feed fraud detection, and indeed food analysis/screening in general, within increasingly complex and globalized food supply chains. It is believed that ever expanding portfolio of sensor
platforms and technologies and future pervasive, predictive computation will together take on the role of a technology-based capable guardian for food systems (Hollis-Peel and Welsh 2014; Cohen and Felson 1979). As food fraud has repeatedly been shown to be a problem of systems, and it therefore requires systems level solutions and thinking (Capra and Luisi 2014), holism, as opposed to one-eyed reductionism.
Innovative technologies to detect falsified and substandard drugs are constantly emerging. Many of the most promising examples draw from a range of scientific disciplines. A team of researchers from U.S. Pharmacopeia and Boston University is developing another new technology called PharmaCheck. It uses microfluidics, the control of fluids at a sub-millimeter scale, for rapid field drug testing (EurekAlert 2012). PharmaCheck, which will weigh less than 10 pounds and fit in a shoebox, promises to greatly reduce the need for confirmatory laboratory testing (Barlow 2012; Gaffney 2012).
Combined NIR/FT-IR methods: Evaluation and direct comparison of both NIR and MIR spectroscopy methods show these have their own advantages and limitations. FT-IR is more sensitive to vibrations from liquid, bound and atmospheric water than NIR, which can be overcome to some extent via the use of very narrow path lengths or attenuated total reflectance (ATR) (Hashim et al 2010; Koca et al 2010 ). On the contrary NIR, while not as sensitive to water as FT-IR is able to infiltrate much deeper into the surface of samples. However, the ability to combine these methods into one component, ideally handheld, can be a very valuable tool for many applications across the food supply chain. Lab-based benchtop combined MIR/NIR spectroscopy permits to select of the most suitable range to choose as per context, what is fit-for-purpose, allowing for a wider and more varied range of samples to analyse quickly using a single instrument. It is only a matter of time before such benchtop innovations are significantly reduced in size and available on/at-line, and handheld combination single package MIR/NIR instruments
CSIR-NISTADS September 2017
can be used within the food supply chain. These would be simple to use, truly democratised analytical technology much closer to development and commercialisation than handheld MS for use in the food supply chain, with the ability to switch to reduced wavenumber ranges when and if required and generate highly reproducible and easily interpretable data. Spatially Offset Raman spectroscopy (SORS): This is another recent and rousing innovation and variant of Raman spectroscopy is (Matousek et al 2005a). With SORS, Raman spectra are collected from locations within a sample at depth that are spatially separate from the point at which the sample is illuminated by the laser on the sample's surface. SORS can be undertaken in seconds, by shining a laser light onto a surface/container and detecting the Raman signal at the point of excitation and one or more offset positions, the resultant spectra subtracted using a scaled subtraction, which produce two spectra representing the surface and subsurface of samples (Matousek et al 2005b). Consequently, SORS enables the user to isolate and retrieve chemically rich spectral information from distinct layers, substructures, and indeed through other barriers, which would not be accessible even via conventional Raman spectroscopy, or indeed, any of the other techniques (handheld or otherwise) mentioned thus far. When commenting from the perspective of its potential use for food product analysis, the ability of SORS to penetrate through barriers/packaging and retrieve chemically rich information is especially pertinent and it appears to be a readily transferable technology, and one may even suggest it has the potential to be a highly disruptive technology. Food-related SORS applications to date include one to demonstrate the potential utility of subsurface detection of lycopene and product quality through the pericarp of tomato fruit (Qin,
Chao and Kim 2011). There are studies about the qualitative and quantitative characterization of quality parameters of salmon through the skin (Afseth et al 2014). It can be said that there is rarity of available food-based SORS studies, nevertheless, the wide range of applications published thus far in the other areas illustrate the specific and seemingly unique combined capabilities of this technique. These techniques clearly demonstrate that SORS remains an exciting area, ready for more exploration, development, and detailed investigation within the region of food authenticity, wider food analysis in general within supply chains/networks and its use within other forms of logistic networks.
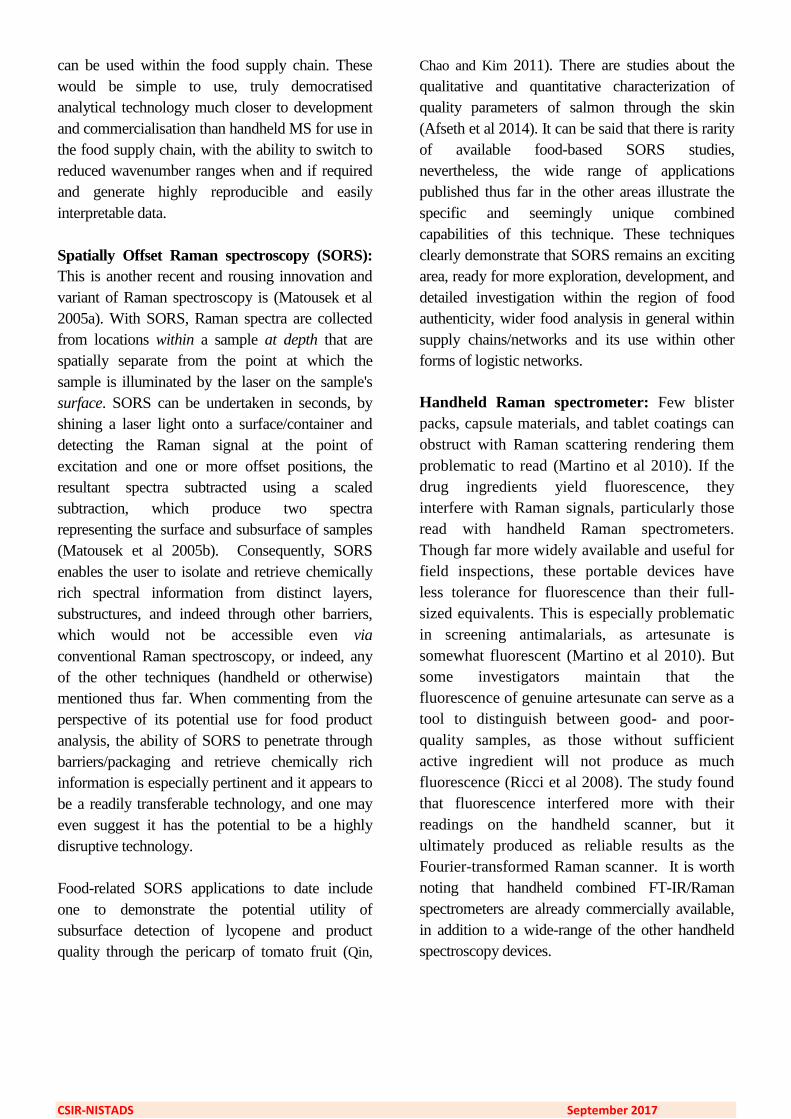
Handheld Raman spectrometer: Few blister packs, capsule materials, and tablet coatings can obstruct with Raman scattering rendering them problematic to read (Martino et al 2010). If the drug ingredients yield fluorescence, they interfere with Raman signals, particularly those read with handheld Raman spectrometers. Though far more widely available and useful for field inspections, these portable devices have less tolerance for fluorescence than their full-sized equivalents. This is especially problematic in screening antimalarials, as artesunate is somewhat fluorescent (Martino et al 2010). But some investigators maintain that the fluorescence of genuine artesunate can serve as a tool to distinguish between good- and poor-quality samples, as those without sufficient active ingredient will not produce as much fluorescence (Ricci et al 2008). The study found that fluorescence interfered more with their readings on the handheld scanner, but it ultimately produced as reliable results as the Fourier-transformed Raman scanner. It is worth noting that handheld combined FT-IR/Raman spectrometers are already commercially available, in addition to a wide-range of the other handheld spectroscopy devices.

CSIR-NISTADS September 2017
Figure 12: A commercially available handheld Raman spectrometer (CBEx 1064, Snowy Range Instruments, Laramie, USA) and a range of Raman spectra. Source: Ellis et al (2015) Figure 12 depicts a commercially available handheld Raman spectrometer and a range of Raman spectra developed from this scheme either directly through plastic packaging, commercial glass and plastic bottles, or from vials. These are from several sample types commonly associated with food fraud, and include extra virgin olive oil, honey, red wine, beef, whisky, and saffron. NIR and Raman spectroscopy: Recent developments of portable NIR and Raman spectrometers have led to an increase in the use of these techniques for drug quality analysis (Fernandez et al 2011). These methods are non-destructive, quick, and no sample preparation is needed. The radiation can pass through samples in blister packs (Kaur et al 2010; Martino et al 2010). NIR is better suited than MIR method to quantitative analysis of drug contents. Computer modelling can produce limited quantitative characterization from all vibrational spectroscopy, but NIR and UV-visible spectroscopy yield more reliable quantitative data (Hsu 1997). NIR can identify active ingredients and is particularly useful for detecting incorrect concentrations of excipients, a common inconsistency in falsified and substandard drugs (Deisingh 2005). NIR spectra of two different compounds are often only slightly different, and accurately
interpreting results may require significant training (Martino et al, 2010). Portable, battery-powered NIR spectrometers are a more accessible alternative to traditional spectrometers (Dowell et al 2008). Bate and colleagues compared the effectiveness of a handheld model to TLC and disintegration tests and found that the handheld spectrometer detected significantly more poor-quality antimalarial drugs and antibiotics than the other tests (Bate et al 2009a). The model they used weighed 4 pounds and contained a battery that could operate for 10 hours after a full charge, making it a powerful field tool. Combining Techniques: Combining analytical techniques is a challenge both in the field and in the laboratory. It is difficult to determine which tests can be combined to allow inspectors to use the minimum number of different techniques. It is usually best to work through tests beginning with the easiest or least expensive ones and to only move on to the more expensive or difficult tests if the sample passes the earlier ones. For example, a drug that fails an identity test does not need to be tested for the amount of incorrect active ingredient. This is the basis of the minimum testing scheme used by the Pharmaceutical Security Institute (USP, 2007). The question remains as to how to use analytical methods in parts of the world with limited laboratory capacity and trained chemists. Reliable reference materials to test samples against are often scarce in poor countries (Fernandez et al 2011). Manufacturers are reluctant to release reference standards when they fear the information could be used to make an illegitimate drug. Although any one test may suffice to label a drug substandard or falsified, no single analytical technique provides enough information to confirm that a drug is genuine. Similarly, while colorimetry and TLC are field techniques for testing for the presence of a particular ingredient, knowing a sample's full content requires more testing. Spectroscopic techniques are useful for identifying active ingredients but cannot rule out the presence of

CSIR-NISTADS September 2017
countless possible impurities. Chromatographic techniques may suggest that the drug contains sufficient active ingredient, but they do not provide any information about how much of that active ingredient will reach the patient. Time and budget allowing, the best understanding of drug quality comes from the several complementary experiments. Even combinations of techniques from within a class, such as spectroscopy, can be helpful. One study illustrated how, due to differences in the ranges of their spectral regions, infrared spectroscopy may at times be better at identifying organic substances in tablet coatings, whereas Raman spectroscopy may better identify the inorganic components (Witkowski 2005). Experiments that looked at the coating on Cialis tablets found that Raman spectroscopy did not distinguish between the real coating and falsified coating, but infrared spectroscopy did (Lim 2012). Chemists often pair mass spectroscopy with separation techniques, such as HPLC, to achieve a more definitive analysis. These hyphenated techniques have broad capabilities. For example, liquid chromatography-mass spectrometry is a highly reliable separation technique, but does not directly provide quantitative data about the amount of active ingredient present; analysts must compare results to standards to determine content (Kaur et al 2010). A type of combined gas chromatography and mass spec (GC-MS) can provide information missing in HPLC-MS analysis. A study found that automated equilibrium headspace sampling with capillary gas chromatography provides information about volatile impurities, but adding mass spec analysis provides extra qualitative information about the identity of any impurities present (Mulligan et al 1996). Technologies for field detection of falsified and substandard drugs in developing countries must be portable, relatively simple to use, sturdy, and inexpensive to buy, use, and maintain. They must also provide reliable, useful data. Field techniques (including visual inspection, colorimetry, disintegration tests, TLC, and
handheld spectrometry) can detect many falsified and substandard drugs. These techniques are durable, fast, relatively inexpensive, and fairly easy to use, making them attractive to regulators interested in monitoring drug quality. Package verification technologies can also aid in field detection of falsified drugs, although these methods are useful more to the patient at the point of use than to the regulator. The Chinese drug regulatory authority uses mobile labs for drug surveillance (Jin 2007). Although fairly inexpensive TLC and disintegration testing are useful field techniques, according to a study, they are less reliable than handheld spectrometric devices (Bate et al 2009a). Of 78 samples tested in one study, 17 passed both TLC and disintegration tests but did not pass either Raman or near-infrared spectroscopic analysis (Bate et al 2009a). Field tests are no substitute for definitive laboratory techniques and cannot test all aspects of a product's quality, including its drug content, impurity profile, and dissolution profile. Noting the cost of laboratory pharmaceutical testing and the dearth of qualified laboratories in developing countries, the German Pharma Health Fund (now known as the Global Pharma Health Fund) developed the Minilab, a portable quality-analysis laboratory (Jähnke et al 2001; Kaale et al 2011). During a November 2012 Minilab training session in Angola, trainees tested an illegal shipment of various pharmaceuticals seized by customs officials along the African coast (Minilab Saves Lives, 2012; World Customs Organization, 2012). Using the TLC and visual inspection techniques, they identified many drugs with no or little active ingredient. Merck S.A. in Portugal provided 10 Minilabs to Angola, which has no drug testing labs. Other similar field kits also exist, such as the Thermo Scientific FirstDefender and TruDefender field laboratory devices used by the Singaporean regulatory authority (Lim 2012). In addition to the advantages of portable/handheld spectrometers being taken out into the supply chain, optics/photonic technologies in general also
CSIR-NISTADS September 2017
readily lend themselves to be utilized as fixed/embedded on/at-line technologies. Therefore, one must not overlook ongoing technological developments within the whole suite of optical technologies, and the future potential of these within food supply chains, such as the use of vertical-cavity surface emitting lasers (VCSELs) as minute low-power light sources( Mora et al 2015), UV-Vis (Souto et al 2010), and blue LED (Ghate et al 2015). With further innovation and future developments in sensor technologies and computing, such as wired or wireless connectivity (i.e. Wi-Fi, Bluetooth) and/or remote access capability (Evans et al 2014) built into the portable and handheld devices, these rapid methods could be networked and thus used to detect trends in the food market and thus could very easily sit within the umbrella of the Internet of Things (IoT). This, like cloud computing, will not be one but rather a series of paradigms and platforms which are set to explode and impact on all our lives within the next decade (Atzori and Morabito 2010; Gubbi et al 2013; Miorandi et al 2012). Internet of Things (IoT): It is worth mentioning that the first use of the term the ‘Internet of Things’ (IoT- by the British technology pioneer Kevin Ashton) was for its direct application to supply chains (Ashton 2009). IoT is comprised of networks of interconnected communicating sensor/actuating physical objects (Things) able to identify each other, and generate, analyse, share and act upon information across common operating platforms and applications. Currently, at the forefront of IoT sensor technologies are radio frequency identification (RFID) tags/togs/labels, characterized by unique identifiers which can be passive, semi-passive and active, as small as an adhesive sticker, and used to monitor objects in real-time (Atzori and Morabito 2010) e.g., to track luggage at airports. Within food supply chains RFID approaches can be used to monitor product quality in terms of expiry dates on perishable goods (Dada and Thiesse 2008), determine the probability of goods such as RFID-tagged oils as being counterfeit using mathematical algorithms (Dada and Magerkurth 2008), establish traceability
systems (Zhang and Chen 2014) enable low cost and ultra-low power food logistics (Zou and Chen,2014), low-cost chipless short range ID and temperature/humidity monitoring (Feng et al 2015), and the detection of food freshness and bacterial growth (Potyrailo et al 2012). However, as the IoT continues to evolve it will be comprised of many more sensor modalities and innovations in addition to RFID and become fully formed via a much larger analytical sensor (Ilic, Staake and Fleisch 2009), biosensor (Zhao et al 2015; McGrath, Elliott and Fodey 2012) and computational toolbox (Chen 2015; Wu, Weng and Liao 2014). These will include machine-to-machine communicating fixed/embedded as well as portable/handheld sensor devices with direct human input. These people-centric sensing platforms are able to acquire rapid, timely, and context specific data associated with predicted or anticipated events, compared to data from fixed sensor networks alone (Gubbi et al 2013) and particularly so when in the hands of operatives with experience of supply chains and non-specialists in spectroscopy or science in general. This ability to ensure at the developmental stage that handheld detection methods can be used by non-specialists is in itself an extremely important part of the development process of these devices. It forms a part of the knowledge exchange process, is an exercise in mutual learning, and allows the translation of re into practical applications, with positive impacts on the food supply chains and therefore society as a whole. In addition, whilst fixed or benchtop spectroscopic devices could be based at major distribution and transport nodes/hubs within complex food supply networks, the handheld devices can be taken to changing points of vulnerability to fraud within these increasingly complex and dynamic networks. Points of vulnerability in food supply networks that, in the future, may well have been automatically identified/predicted and targeted for further investigation by pervasive and automated computational systems analysis embedded within an IoT network. Pervasive computing in
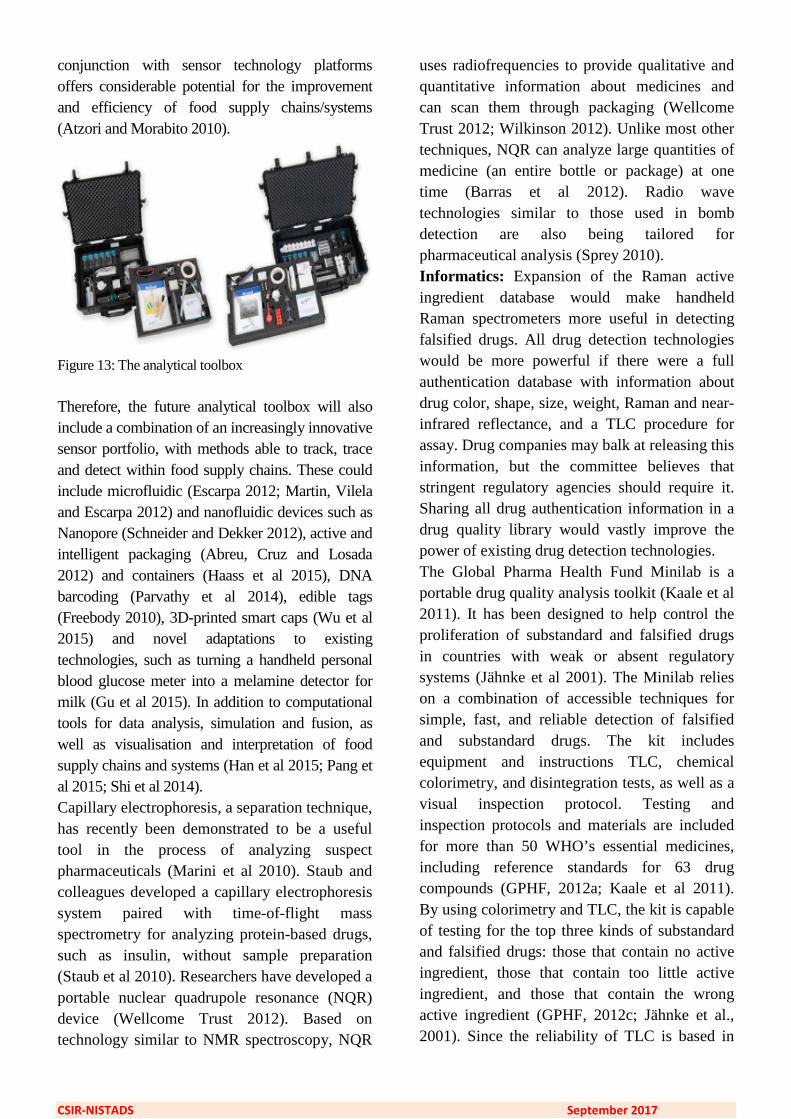
CSIR-NISTADS September 2017
conjunction with sensor technology platforms offers considerable potential for the improvement and efficiency of food supply chains/systems (Atzori and Morabito 2010).
Figure 13: The analytical toolbox Therefore, the future analytical toolbox will also include a combination of an increasingly innovative sensor portfolio, with methods able to track, trace and detect within food supply chains. These could include microfluidic (Escarpa 2012; Martin, Vilela and Escarpa 2012) and nanofluidic devices such as Nanopore (Schneider and Dekker 2012), active and intelligent packaging (Abreu, Cruz and Losada 2012) and containers (Haass et al 2015), DNA barcoding (Parvathy et al 2014), edible tags (Freebody 2010), 3D-printed smart caps (Wu et al 2015) and novel adaptations to existing technologies, such as turning a handheld personal blood glucose meter into a melamine detector for milk (Gu et al 2015). In addition to computational tools for data analysis, simulation and fusion, as well as visualisation and interpretation of food supply chains and systems (Han et al 2015; Pang et al 2015; Shi et al 2014). Capillary electrophoresis, a separation technique, has recently been demonstrated to be a useful tool in the process of analyzing suspect pharmaceuticals (Marini et al 2010). Staub and colleagues developed a capillary electrophoresis system paired with time-of-flight mass spectrometry for analyzing protein-based drugs, such as insulin, without sample preparation (Staub et al 2010). Researchers have developed a portable nuclear quadrupole resonance (NQR) device (Wellcome Trust 2012). Based on technology similar to NMR spectroscopy, NQR
uses radiofrequencies to provide qualitative and quantitative information about medicines and can scan them through packaging (Wellcome Trust 2012; Wilkinson 2012). Unlike most other techniques, NQR can analyze large quantities of medicine (an entire bottle or package) at one time (Barras et al 2012). Radio wave technologies similar to those used in bomb detection are also being tailored for pharmaceutical analysis (Sprey 2010). Informatics: Expansion of the Raman active ingredient database would make handheld Raman spectrometers more useful in detecting falsified drugs. All drug detection technologies would be more powerful if there were a full authentication database with information about drug color, shape, size, weight, Raman and near-infrared reflectance, and a TLC procedure for assay. Drug companies may balk at releasing this information, but the committee believes that stringent regulatory agencies should require it. Sharing all drug authentication information in a drug quality library would vastly improve the power of existing drug detection technologies. The Global Pharma Health Fund Minilab is a portable drug quality analysis toolkit (Kaale et al 2011). It has been designed to help control the proliferation of substandard and falsified drugs in countries with weak or absent regulatory systems (Jähnke et al 2001). The Minilab relies on a combination of accessible techniques for simple, fast, and reliable detection of falsified and substandard drugs. The kit includes equipment and instructions TLC, chemical colorimetry, and disintegration tests, as well as a visual inspection protocol. Testing and inspection protocols and materials are included for more than 50 WHO’s essential medicines, including reference standards for 63 drug compounds (GPHF, 2012a; Kaale et al 2011). By using colorimetry and TLC, the kit is capable of testing for the top three kinds of substandard and falsified drugs: those that contain no active ingredient, those that contain too little active ingredient, and those that contain the wrong active ingredient (GPHF, 2012c; Jähnke et al., 2001). Since the reliability of TLC is based in
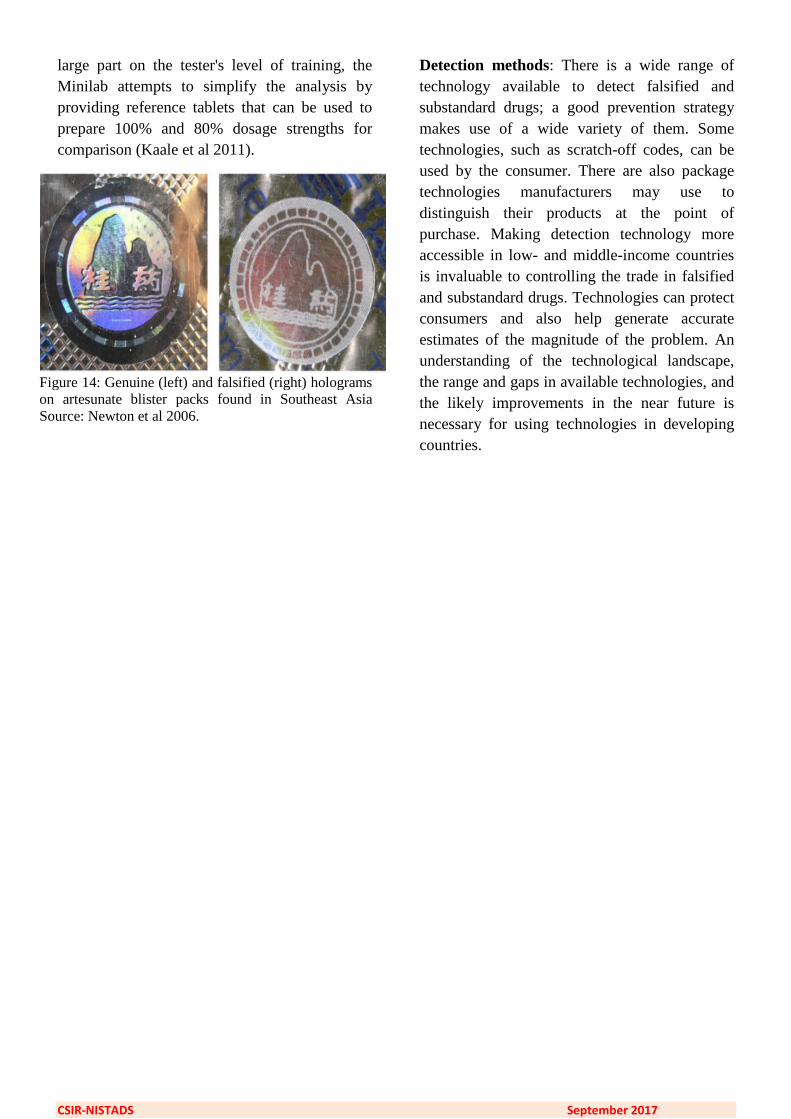
CSIR-NISTADS September 2017
large part on the tester's level of training, the Minilab attempts to simplify the analysis by providing reference tablets that can be used to prepare 100% and 80% dosage strengths for comparison (Kaale et al 2011).
Figure 14: Genuine (left) and falsified (right) holograms on artesunate blister packs found in Southeast Asia Source: Newton et al 2006.
Detection methods: There is a wide range of technology available to detect falsified and substandard drugs; a good prevention strategy makes use of a wide variety of them. Some technologies, such as scratch-off codes, can be used by the consumer. There are also package technologies manufacturers may use to distinguish their products at the point of purchase. Making detection technology more accessible in low- and middle-income countries is invaluable to controlling the trade in falsified and substandard drugs. Technologies can protect consumers and also help generate accurate estimates of the magnitude of the problem. An understanding of the technological landscape, the range and gaps in available technologies, and the likely improvements in the near future is necessary for using technologies in developing countries.
CSIR-NISTADS September 2017
r&d ecoSySTem
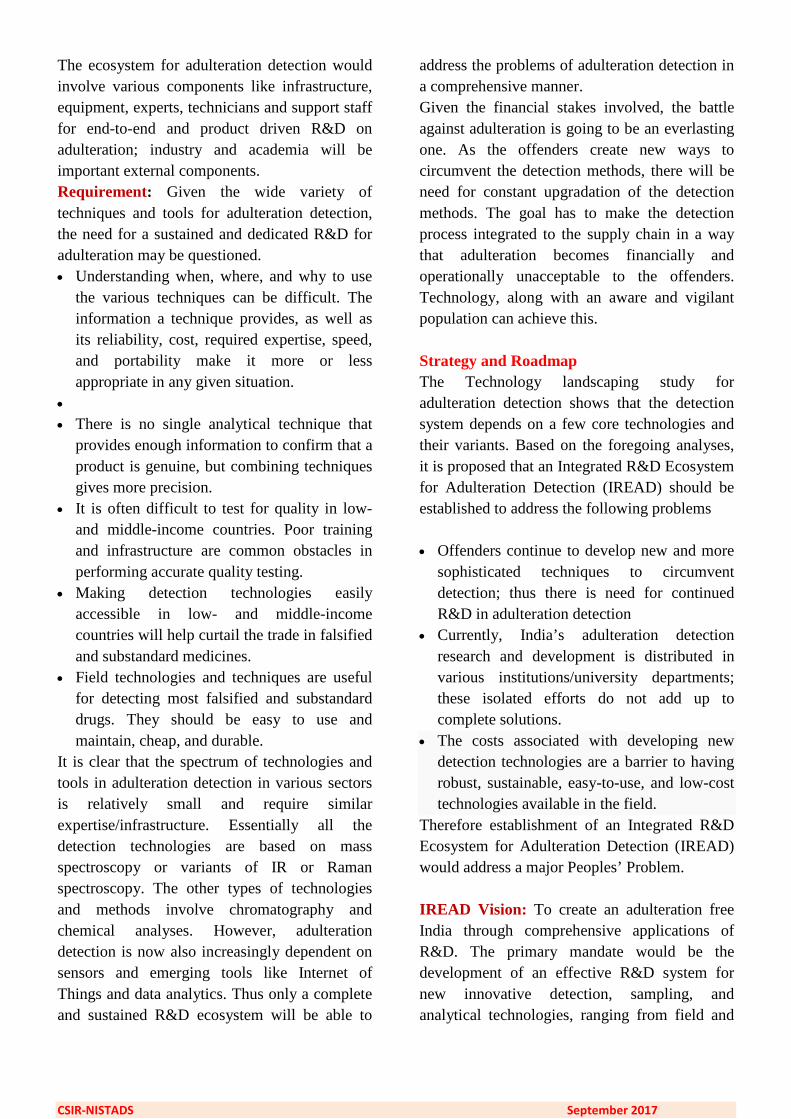
CSIR-NISTADS September 2017
The ecosystem for adulteration detection would involve various components like infrastructure, equipment, experts, technicians and support staff for end-to-end and product driven R&D on adulteration; industry and academia will be important external components. Requirement: Given the wide variety of techniques and tools for adulteration detection, the need for a sustained and dedicated R&D for adulteration may be questioned. • Understanding when, where, and why to use
the various techniques can be difficult. The information a technique provides, as well as its reliability, cost, required expertise, speed, and portability make it more or less appropriate in any given situation.
• • There is no single analytical technique that
provides enough information to confirm that a product is genuine, but combining techniques gives more precision.
• It is often difficult to test for quality in low- and middle-income countries. Poor training and infrastructure are common obstacles in performing accurate quality testing.
• Making detection technologies easily accessible in low- and middle-income countries will help curtail the trade in falsified and substandard medicines.
• Field technologies and techniques are useful for detecting most falsified and substandard drugs. They should be easy to use and maintain, cheap, and durable.
It is clear that the spectrum of technologies and tools in adulteration detection in various sectors is relatively small and require similar expertise/infrastructure. Essentially all the detection technologies are based on mass spectroscopy or variants of IR or Raman spectroscopy. The other types of technologies and methods involve chromatography and chemical analyses. However, adulteration detection is now also increasingly dependent on sensors and emerging tools like Internet of Things and data analytics. Thus only a complete and sustained R&D ecosystem will be able to
address the problems of adulteration detection in a comprehensive manner. Given the financial stakes involved, the battle against adulteration is going to be an everlasting one. As the offenders create new ways to circumvent the detection methods, there will be need for constant upgradation of the detection methods. The goal has to make the detection process integrated to the supply chain in a way that adulteration becomes financially and operationally unacceptable to the offenders. Technology, along with an aware and vigilant population can achieve this. Strategy and Roadmap The Technology landscaping study for adulteration detection shows that the detection system depends on a few core technologies and their variants. Based on the foregoing analyses, it is proposed that an Integrated R&D Ecosystem for Adulteration Detection (IREAD) should be established to address the following problems • Offenders continue to develop new and more
sophisticated techniques to circumvent detection; thus there is need for continued R&D in adulteration detection
• Currently, India’s adulteration detection research and development is distributed in various institutions/university departments; these isolated efforts do not add up to complete solutions.
• The costs associated with developing new detection technologies are a barrier to having robust, sustainable, easy-to-use, and low-cost technologies available in the field.
Therefore establishment of an Integrated R&D Ecosystem for Adulteration Detection (IREAD) would address a major Peoples’ Problem. IREAD Vision: To create an adulteration free India through comprehensive applications of R&D. The primary mandate would be the development of an effective R&D system for new innovative detection, sampling, and analytical technologies, ranging from field and

CSIR-NISTADS September 2017
rapid screening technology to sophisticated laboratory-based assessments. Major Objectives: 1. Provide complete solutions for adulteration
detection and prevention from lab to field 2. Industrialisation/ Commercialisation/
Adulteration detection and prevention technologies
3. Create a comprehensive R&D Ecosystem in a cost-effective manner
4. To develop/translate/adopt new and emerging methods and technologies in adulteration detection
5. Identify organisation with existing/similar mandate/facilities/business augment/upgrade
Such a system will be cost-effective as it will avoid unnecessary duplication of infrastructure/equipment. Feasibility and Implementation: (a) There are many commonalities in the
requirements of equipment/expertise for detection of adulteration in various sectors; an integrated IREAD facility is practically implementable
(b) There are many institutions and agencies, including CSIR with expertise in adulteration detection; thus ready expertise and skill are available
(c) Agencies that already have basic expertise and infrastructures can be engaged to integrate, enhance and catalyse adulteration detection techniques
(d) Task Teams can be formed by pooling expertise through scientists in deputation, making IREAD financially feasible.
CSIR Initiatives - Adulteration and Quality Control Research Central Food Technological Research Institute (CFTRI); The lab played a vital role in improving the quality of food and monitoring its safety in the country. The lab stands out as a leading laboratory involved in all facets of scientific investigation related to food analysis serving small, medium and large food industries, regulatory/academic organizations and society at large. The institute leads the way in implementation of food standards in the country. Responding to Hon’ble Supreme court of India’s request, the testing of safety parameters for 16 samples of instant noodles was undertaken at CFTRI and scientifically backed opinion were given on the test results. Scientific investigations carried out at the Institute thus facilitate decision making for both the industry as well as the regulatory agencies. CFTRI is involved in research activities on various aspects of food quality and safety. The Institute is committed to providing high quality analytical services and guidance to food industries and government agencies with its sound scientific knowledge-base supported by state-of-the-art instrumentation. It offers a wide range of science-based food analytical services to the food industries through the Customer Service Cell for compliance under the provision of FSSA 2006, Bureau of Indian Standard (BIS), AGMARK, and other national and international standards. The institute is also NABL accredited for testing and analysis of more than 250 chemical and biological samples.
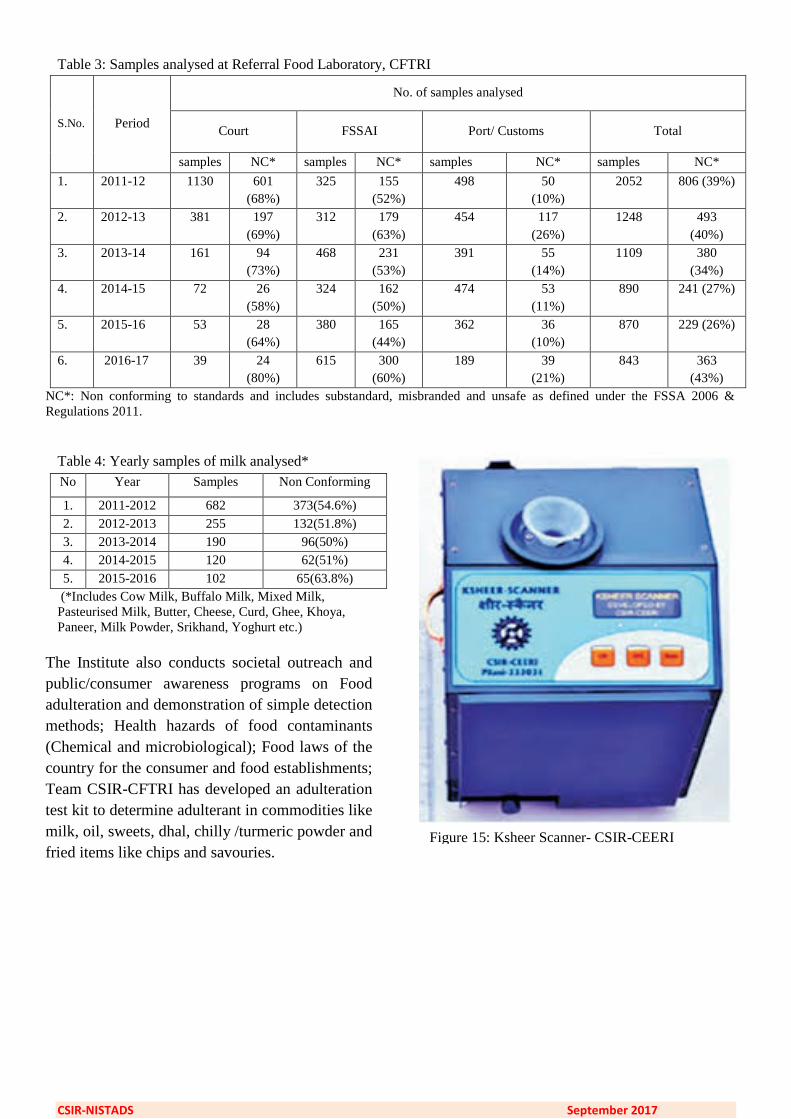
CSIR-NISTADS September 2017
Table 3: Samples analysed at Referral Food Laboratory, CFTRI
S.No. Period
No. of samples analysed
Court FSSAI Port/ Customs Total
samples NC* samples NC* samples NC* samples NC* 1. 2011-12 1130 601
(68%) 325 155
(52%) 498 50
(10%) 2052 806 (39%)
2. 2012-13 381 197 (69%)
312 179 (63%)
454 117 (26%)
1248 493 (40%)
3. 2013-14 161 94 (73%)
468 231 (53%)
391 55 (14%)
1109 380 (34%)
4. 2014-15 72 26 (58%)
324 162 (50%)
474 53 (11%)
890 241 (27%)
5. 2015-16 53
28 (64%)
380 165 (44%)
362 36 (10%)
870 229 (26%)
6. 2016-17 39 24 (80%)
615 300 (60%)
189 39 (21%)
843 363 (43%)
NC*: Non conforming to standards and includes substandard, misbranded and unsafe as defined under the FSSA 2006 & Regulations 2011.
Table 4: Yearly samples of milk analysed*
(*Includes Cow Milk, Buffalo Milk, Mixed Milk, Pasteurised Milk, Butter, Cheese, Curd, Ghee, Khoya, Paneer, Milk Powder, Srikhand, Yoghurt etc.)
The Institute also conducts societal outreach and public/consumer awareness programs on Food adulteration and demonstration of simple detection methods; Health hazards of food contaminants (Chemical and microbiological); Food laws of the country for the consumer and food establishments; Team CSIR-CFTRI has developed an adulteration test kit to determine adulterant in commodities like milk, oil, sweets, dhal, chilly /turmeric powder and fried items like chips and savouries.
No Year Samples Non Conforming
1. 2011-2012 682 373(54.6%) 2. 2012-2013 255 132(51.8%) 3. 2013-2014 190 96(50%) 4. 2014-2015 120 62(51%) 5. 2015-2016 102 65(63.8%)
Figure 15: Ksheer Scanner- CSIR-CEERI
CSIR-NISTADS September 2017
Central Electronics and Engineering Research Institute (CEERI) has developed handheld GPS-enabled version of the recently launched Ksheer Scanner Technology to check adulteration in milk. The device would enable to track the location of the tested sample and receive the test results through SMS on the device.
Central Scientific Instruments Organization (CSIO) has wide ranging expertise in developing sophisticated instruments and sensors.
Indian Institute of Chemical Biology (IICB)
is putting emphasis on quality basic research, on projects having applied potential and is looking forward to a successful Industry-Institute liaison towards closer partnership.
Indian Institute of Integrative Medicine
(IIIM), has primary focus of research on drug discovery from natural products (medicinal plants and microbial species).
Central Drug Research Institute (CDRI),
has the basic objective of discovery and development of new drugs and contraceptive agents, and development of innovative,
economic and environment friendly process technologies for known drugs and drug intermediates.
Indian Institute of Toxicology Research
(IITR), aims to predict the harmful effects of chemicals and other environmental stressors at different levels and identify key events leading to adverse health outcomes.
Central Institute of Mining and Fuel
Research (CIMFR) deals with research on fuel efficiency, Oxy-fuel combustion studies etc.
Indian Institute of Petroleum (IIP), is
engaged in multidisciplinary areas of research & development including petroleum refining and value addition to refinery systems, automotive engines & emissions, tribology, industrial and domestic combustion etc. The institute provides technical and analytical services to petroleum refining and related industry including technology transfer for developing novel, state-of-art technologies and products.
(Data/Information based on Institute Inputs/Public Domain)

CSIR-NISTADS September 2017
Cited and related references
1. A. Dada and C. Magerkurth, RFID based anti-counterfeiting utilizing supply chain proximity, Insticc-Inst Syst Technologies Information Control & Communication, Setubal, 2008.
2. A. Dada and F. Thiesse, in Internet of Things, Proceedings, ed. C. Floerkemeier, M. Langheinrich, E. Fleisch, F. Mattern and S. E. Sarma, Springer-Verlag Berlin, Berlin, 2008, vol. 4952, pp. 140–154.
3. A. Dalla Mora, D. Contini, S. Arridge, F. Martelli, A. Tosi, G. Boso, A. Farina, T. Durduran, E. Martinenghi, A. Torricelli and A. Pifferi, Biomed. Opt. Express, 2015, 6, 1749–1760
4. A. Escarpa, Chem. Rec., 2012, 12, 72–91 . 5. A. Ilic, T. Staake and E. Fleisch, IEEE
Pervasive Comput., 2009, 8, 22–29 . 6. A. Kwiatkowski, M. Czerwicka, J. Smulko and
P. Stepnowski, J. Forensic Sci., 2014, 59, 1358–1363
7. A. Martin, D. Vilela and A. Escarpa, Electrophoresis, 2012, 33, 2212–2227.
8. Barlow R. BU Today. Jul 26, 2012. A new counterfeit problem: Anti-malarial drugs.
9. Barras J, Althoefer K, Rowe MD, Poplett IJ, Smith JAS. The emerging field of medicines authentication by nuclear quadrupole resonance spectroscopy. Applied Magnetic Resonance. 2012; 43(4):511–529.
10. Bate R, Tren R, Hess K, Mooney L, Porter K. Pilot study comparing technologies to test for substandard drugs in field settings. African Journal of Pharmacy and Pharmacology. 2009a; 3(4):165–170.
11. Brown T, LeMay HE, Bursten B, Murphy C, Woodward P. Chemistry: The central science. 12th. Boston, MA: Prentice Hall; 2011.
12. C. A. T. dos Santos, M. Lopo, R. Pascoa and J. A. Lopes, Appl. Spectrosc., 2013, 67, 1215–1233 .
13. C. D. Calvano, C. de Ceglie, L. D'Accolti and C. G. Zambonin, Food Chem., 2012, 134, 1192–1198
14. C. Esquerre, A. A. Gowen, J. Burger, G. Downey and C. P. O'Donnell, Chemom. Intell. Lab. Syst., 2012, 117, 129–137 .
15. C. Gu, T. Lan, H.-C. Shi and Y. Lu, Anal. Chem., 2015, 87, 7676–7682 .
16. C. Muller, L. David, V. Chis and S. C. Pinzaru, Food Chem., 2014, 145, 814–820
17. Carina de Souza Gondim, Roberto Cesar Santos de Souza, Marina de Paula Penna e Palhares, Roberto Gonçalves Junqueiraa and Scheilla Vitorino Carvalho de Souza. Performance improvement and single laboratory validation of classical qualitative methods for the detection of adulterants in milk: starch, chlorides and sucrose Anal. Methods, 2015, 9692-9701.
18. Carina de Souza Gondim, Roberto Gonçalves Junqueira, Scheilla Vitorino Carvalho de Souza, Itziar Ruisánchez and M. Pilar Callao. Detection of several common adulterants in raw milk by MID-infrared spectroscopy and one-class and multi-class multivariate strategies. Food Chemistry, 2017, 230, 68-75.
19. Carina de Souza Gondim, Roberto Gonçalves Junqueira,Scheilla Vitorino Carvalho de Souza. Interlaboratory Validation of Modified Classical Qualitative Methods for Detection of Adulterants in Milk: Starch, Chloride, and Sucrose. Food Analytical Methods, 2016, 9, Issue 9, 2509–2520.
20. D. A. P. de Abreu, J. M. Cruz and P. P. Losada, Food Rev. Int., 2012, 28, 146–187 .
21. D. Alexandrakis, G. Downey and A. G. M. Scannell, Food Bioprocess Technol., 2012, 5, 338–347 .
22. D. I. Ellis and R. Goodacre, Analyst, 2006, 131, 875–885 .
23. D. I. Ellis and R. Goodacre, Trends Food Sci. Technol., 2001, 12, 414–424.
24. D. I. Ellis, D. Broadhurst and R. Goodacre, Anal. Chim. Acta, 2004, 514, 193–201.
25. D. I. Ellis, D. Broadhurst, D. B. Kell, J. J. Rowland and R. Goodacre, Appl. Environ. Microbiol., 2002, 68, 2822–2828.
26. D. I. Ellis, D. Broadhurst, S. J. Clarke and R. Goodacre, Analyst, 2005, 130, 1648–1654 .
27. D. M. Hashim, Y. B. C. Man, R. Norakasha, M. Shuhaimi, Y. Salmah and Z. A. Syahariza, Food Chem., 2010, 118, 856–860.
28. D. Miorandi, S. Sicari, F. De Pellegrini and I. Chlamtac, Ad Hoc Networks, 2012, 10, 1497–1516.
29. Deisingh AK. Pharmaceutical counterfeiting. Analyst. 2005; 130 (3):271–279. [PubMed]
30. Dey, R., & Dwivedi, A. (2014). Design and Simulation of Portable Fuel Adulteration Detection Kit. Journal of Energy and Chemical Engineering, 2(2), 74-80.

CSIR-NISTADS September 2017
31. Dias, L. A., Peres, A. M., Veloso, A. C., Reis, F. S., Vilas-Boas, M., & Machado, A. A. (2009). An electronic tongue taste evaluation: Identification of goat milk adulteration with bovine milk. Sensors and Actuators B: Chemical, 136(1), 209-217.
32. Dowell FE, Maghirang EB, Fernandez FM, Newton PN, Green MD. Detecting counterfeit antimalarial tablets by near-infrared spectroscopy. Journal of Pharmaceutical and Biomedical Analysis. 2008; 48:1011–1014. [PubMed]
33. E. Birkel and L. Rodriguez-Saona, J. Am. Oil Chem. Soc., 2011, 88, 1477–1483
34. E. Crawford and B. Musselman, Anal. Bioanal. Chem., 2012, 403, 2807–2812
35. E. Zamora-Rojas, D. Perez-Marin, E. De Pedro-Sanz, J. E. Guerrero-Ginel and A. Garrido-Varo, Meat Sci., 2012, 90, 636–642
36. D. I. Ellis, Muhamadali, H., Haughey, S. A., Elliott, C. T., & Goodacre, R. (2015). Point-and-shoot: rapid quantitative detection methods for on-site food fraud analysis–moving out of the laboratory and into the food supply chain. Analytical Methods, 7(22), 9401-9414.
37. EurekAlert. New technology represents next-generation tool for detecting substandard and counterfeit medicines. 2012. [January 31, 2013]. http://www.eurekalert.org/pub_releases/2012-07/up-ntr072612.php.
38. F. Capra and P. L. Luisi, The Systems View of Life: A Unifying Vision, Cambridge University Press, Cambridge, UK, 2014 .
39. Fernandez FM, Green MD, Newton PN. Prevalence and detection of counterfeit pharmaceuticals: A mini review. Industrial and Engineering Chemistry Research. 2008; 47:585–590.
40. Fernandez FM, Hostetler D, Powell K, Kaur H, Green MD, Mildenhall DC, Newton PN. Poor quality drugs: Grand challenges in high throughput detection, countrywide sampling, and forensics in developing countries. Analyst. 2011;136(15):3073–3082. [PMC free article] [PubMed]
41. G. Downey, R. Briandet, R. H. Wilson and E. K. Kemsley, J. Agric. Food Chem., 1997, 45, 4357–4361 .
42. G. F. Schneider and C. Dekker, Nat. Biotechnol., 2012, 30, 326–328
43. G. Zhao, Y. Guo, X. Sun and X. Wang, Int. J. Electrochem. Sci., 2015, 10, 3387–3399 .
44. Gamble BM, Gratz SR, Litzau JJ, Mulligan KJ, Flurer RA. FDA forensic investigations using mass spectrometry; Paper presented at Conference on Small Molecule Science; San Jose, CA: 2008.
45. Gaudiano MC, Antoniella E, Bertocchi P, Valvo L. Development and validation of a reversed-phase lc method for analysing potentially counterfeit antimalarial medicines. Journal of Pharmaceutical and Biomedical Analysis. 2006; 42:132–135. [PubMed]
46. Gisele Mendes, Paulo J.S. Barbeira. Detection and quantification of adulterants in gasoline using distillation curves and multivariate methods. Fuel 112 (2013) 163–17.
47. Gottlieb HE, Kotlyar V, Nudelman A. NMR chemical shifts of common laboratory solvents as trace impurities. Journal of Organic Chemistry. 1997; 62:7512–7515. [PubMed]
48. GPHF (Global Pharma Health Fund) GPHF-Minilab®—fact sheet. 2012a. [July 30, 2012].http://www.gphf.org/web /en/minilab/factsheet.htm.
49. GPHF (Global Pharma Health Fund) The GPHF-Minilab®—protection against counterfeit medicines. 2012c. [July 30, 2012]. http://www.gphf.org/web/en/minilab/index.htm
50. Green MD, Mount DL, Wirtz RA. Short communication: Authentication of artemether, artesunate and dihydroartemisinin antimalarial tablets using a simple colorimetric method. Tropical Medicine & International Health. 2001; 6(12):980–982. [PubMed]
51. Green MD, Nettey H, Rojas OV, Pamanivong C, Khounsaknalath L, Ortiz MG, Newton PN, Fernández FM, Vongsack L, Manolin O. Use of refractometry and colorimetry as field methods to rapidly assess antimalarial drug quality. Journal of Pharmaceutical and Biomedical Analysis. 2007; 43(1):105–110. [PubMed]
52. H. Ayvaz and L. E. Rodriguez-Saona, Food Chem., 2015, 174, 154–162
53. H. Wang, J. Liu, R. G. Cooks and Z. Ouyang, Angew. Chem., Int. Ed., 2010, 49, 877–880. 16 Z.-P. Zhang, X.-N. Liu and Y.-J. Zheng, Chin. J. Anal. Chem., 2014, 42, 145–152.
54. H. Zhang and X. Chen, in Re on Food Packaging Technology, ed. O. Yun, X. Min, Y. T. Li and L. Xunting, 2014, vol. 469, pp. 481–485
55. Herrmann, F., Jakoby, B., Rabe, J., and Büttgenbach, S. (2001). Microacoustic
CSIR-NISTADS September 2017
sensors for liquid monitoring. Sensors Update,9(1), 105-160.
56. Hsu CPS. Infrared spectroscopy. In: Settle F, editor. In Handbook of instrumental techniques for analytical chemistry. Arlington, VA: National Science Foundation; 1997. pp. 247–283.
57. Hu CQ, Zou WB, Hu WS, Ma KK, Yang MZ, Zhou SL, Sheng JF, Li Y, Cheng SH, Xue J. Establishment of a fast chemical identification system for screen of counterfeit drugs of macrolide antibiotics. Journal of Pharmaceutical and Biomedical Analysis. 2005;40: 68–74.
58. IOM (Institute of Medicine) Ensuring safe foods and medical products through stronger regulatory systems abroad. Washington, DC: The National Academies Press; 2012.
59. J. Gubbi, R. Buyya, S. Marusic and M. Palaniswami, Future Generat Comput. Syst., 2013, 29, 1645–1660.
60. J. H. Cheng and D. W. Sun, Compr. Rev. Food Sci. Food Saf., 2015, 14, 478–490.
61. J. W. Qin, K. L. Chao and M. S. Kim, J. Food Eng., 2011, 107, 277–288.
62. Jähnke RWO, Kallmayer HJ, Breyer C, Green MD, Rubeau V, Paulke A. A concise quality control guide on essential drugs and other medicines: Colour reaction tests. Germany: Global Pharma Health Fund; 2008.
63. Jähnke RWO, Küsters G, Fleischer K. Low-cost quality assurance of medicines using the GPHF-Minilab® Drug Information Journal. 2001; 35:941–945.
64. Jin S. Mobile labs developed in China for detection of counterfeit drugs; Paper read at 3rd Global Forum on Pharmaceutical Anticounterfeiting; Prague, Czech Republic; 2007.
65. K. Ashton, That ‘Internet of Things’ Thing, RFID Journal http://www.rfidjournal.com/articles/view?4986, 2009.
66. K. Sowoidnich, H. Schmidt, H. D. Kronfeldt and F. Schwagele, Vib. Spectrosc., 2012, 62, 70–76.
67. Kaale E, Risha P, Layloff T. TLC for pharmaceutical analysis in resource limited countries. Journal of Chromatography A. 2011;1218(19):2732–2736.
68. Kaur H, Green MD, Hostetler DM, Fernández FM, Newton PN. Antimalarial drug quality: Methods to detect suspect drugs. Therapy. 2010;7(1):49–57.
69. Kavita Rathee, Vikas Dhull, Rekha Dhull, Sandeep Singh, Biosensors based on electrochemical lactate detection: A comprehensive review, Biochemistry and Biophysics Reports, Vol 5, 2016, 35- 54.
70. Kazakevich Y, McNair H. In Basic liquid chromatography: Text book on high performance liquid chromatography (HPLC). 1996. [March 7, 2013]. Diode-array detectors.
71. Kenyon TA, Kenyon AS, Kgarebe BV, Mothibedi D, Binkin NJ, Layloff TP. Detection of substandard fixed-dose combination tuberculosis drugs using thin-layer chromatography. International Journal of Tuberculosis and Lung Disease. 1999;3(11):5347–5350.
72. L. Atzori, A. Iera and G. Morabito, Comput. Network, 2010, 54, 2787–2805.
73. L. C. Mecker, K. M. Tyner, J. F. Kauffman, S. Arzhantsev, D. J. Mans and C. M. Gryniewicz-Ruzicka, Anal. Chim. Acta, 2012, 733, 48–55
74. L. E. Cohen and M. Felson, Am. Socio. Rev., 1979, 44, 588–608.
75. L. L. Botros, J. Jablonski, C. Chang, M. M. Bergana, P. Wehling, J. M. Harnly, G. Downey, P. Harrington, A. R. Potts and J. C. Moore, J. Agric. Food Chem., 2013, 61, 9810-9818.
76. Lim CC. Detection of counterfeit drugs—Singapore's approach; Presentation at Understanding the Global Public Health Implications of Counterfeit, Falsified, and Substandard Drugs: Meeting One; March 12-13.Washington, DC: 2012.
77. M. Allendorf, A. Subramanian and L. Rodriguez-Saona, J. Am. Oil Chem. Soc., 2012, 89, 79–88.
78. M. E. Hollis-Peel and B. C. Welsh, Secur. J., 2014, 27, 320–337.
79. M. Freebody, Photonics Spectra, 2010, 44, 20–21.
80. M. I. Lopez, E. Trullols, M. P. Callao and I. Ruisanchez, Food Chem., 2014, 147, 177–181
81. M. J. Evans, G. Clemens, C. ey and M. J. Baker, Vib. Spectrosc., 2014, 72, 37–43.
82. M. Mattarozzi, M. Milioli, C. Cavalieri, F. Bianchi and M. Careri, Talanta, 2012, 101, 453–459.
83. M. P. Pujolras, H. Ayvaz, M. L. Shotts, R. A. Pittman, S. Herringshaw and L. E. Rodriguez-Saona, J. Am. Oil Chem. Soc., 2015, 92, 175–184
84. M. Wu, Y. Weng and Z. Liao, in Advances in Mechatronics, Automation and Applied
CSIR-NISTADS September 2017
Information Technologies, Pts 1 and 2, ed. Q. Lu and C. G. Zhang, 2014, vol. 846–847, pp. 1830–1835.
85. M. Zhao, G. Downey and C. P. O'Donnell, J. Agric. Food Chem., 2015, 63, 1433–1441.
86. Marini RD, Rozet E, Montes MLA, Rohrbasser C, Roht S, Rhème D, Bonnabry P, Schappler J, Veuthey JL, Hubert P, Rudaz S. Reliable low-cost capillary electrophoresis for drug quality control and counterfeit medicines. Journal of Pharmaceutical and Biomedical Analysis. 2010; 53(5):1278–1287.
87. Martino R, Malet-Martino M, Gilard V, Balayssac S. Counterfeit drugs: Analytical techniques for their identification. Analytical and Bioanalytical Chemistry. 2010; 398(1):77–92.
88. Md Ehsan, Md Mahmudur Rahman, et al. Effect of fuel adulteration on engine crankcase dilution, Journal of Mechanical Engineering, December 2010; 41.
89. MEMS-based Handy Fuel Adulteration Detection Device Anumeha Dwivedi, R. Dey 2013. Proceedings of COMSOL Conference.
90. Minilab Saves Lives. Caught in the act, first by customs, then by minilabs. 2012. [November 14, 2012].
91. Mulligan KJ, Bruggemeyer TW, Crockett DF, Schepman JB. Analysis of organic volatile impurities as a forensic tool for the examination of bulk pharmaceuticals. Journal of Chromatography B. 1996; 686:85–95.
92. Murthy, V. J., Kiranmai, N. S., & Kumar, S. (2017, August). Study of dielectric properties of adulterated milk concentration and freshness. In IOP Conference Series: Materials Science and Engineering (Vol. 225, No. 1, p. 012285). IOP Publishing.
93. N. K. Afseth, M. Bloomfield, J. P. Wold and P. Matousek, Appl. Spectrosc., 2014, 68, 255–262.
94. N. Koca, N. A. Kocaoglu-Vurma, W. J. Harper and L. E. Rodriguez-Saona, Food Chem., 2010, 121, 778–782.
95. N. Nicolaou, Y. Xu and R. Goodacre, Anal. Chem., 2011, 83, 5681–5687.
96. N. Nicolaou, Y. Xu and R. Goodacre, J. Dairy Sci., 2010, 93, 5651–5660
97. Newton PN, Green MD, Fernández FM, Day NPJ, White NJ. Counterfeit anti-infective drugs. Lancet Infectious Diseases. 2006; 6(9):602–613.
98. Nilimamayee Samal, Detection of Adulteration in Petrol Using Gas Chromatographic
Technique. International Journal of Advanced Research in Electrical, Electronics and Instrumentation Engineering Vol. 5, no. 6, 2016
99. P. Matousek, I. P. Clark, E. R. C. Draper, M. D. Morris, A. E. Goodship, N. Everall, M. Towrie, W. F. Finney and A. W. Parker, Appl. Spectrosc., 2005, 59, 393–400
100. P. Matousek, M. D. Morris, N. Everall, I. P. Clark, M. Towrie, E. Draper, A. Goodship and A. W. Parker, Appl. Spectrosc., 2005, 59, 1485–1492.
101. P. V. Jentzsch and V. Ciobota, Flavour Fragrance J., 2014, 29, 287–295.
102. Poonia Amrita, Alok Jha, Rajan Sharma Harikesh Bahadur Singh, AK Rai and Nitya Sharma, Detection of adulteration in milk: A review, International Journal of Dairy Technology, November 2016
103. Putze E, Conway E, Reilly M, Madrid O. The deadly world of fake drugs. Washington, DC: American Enterprise Institute; 2012.
104. R. A. Potyrailo, N. Nagraj, Z. X. Tang, F. J. Mondello, C. Surman and W. Morris, J. Agric. Food Chem., 2012, 60, 8535–8543.
105. R. Haass, P. Dittmer, M. Veigt and M. Luetjen, Int. J. Prod. Econ., 2015, 164, 400–408.
106. R. Shi, K. Yang, Q. Su, X. Zhou and H. Shi, in Re on Food Packaging Technology, ed. O. Yun, X. Min, Y. T. Li and L. Xunting, 2014, vol. 469, pp. 467–472.
107. R. Y. Chen, Food Control, 2015, 51, 70–84.
108. Ricci C, Nyadong L, Yang F, Fernandez FM, Brown CD, Newton PN, Kazarian SG. Assessment of hand-held Raman instrumentation for in situ screening for potentially counterfeit artesunate antimalarial tablets by ft-Raman spectroscopy and direct ionizatoin mass spectrometry. Analytica Chimica Acta. 2008; 623:178–186.
109. S. A. Haughey, P. Galvin-King, A. Malechaux and C. T. Elliott, Anal. Methods, 2015, 7, 181–186.
110. S. A. Haughey, S. F. Graham, E. Cancouet and C. T. Elliott, Food Chem., 2013, 136, 1557–1561.
111. S. Y. Wu, C. Yang, W. Hsu and L. Lin, Microsystems & Nanoengineering, 2015, 1, 1–9.
112. Safwan M. Obeidat, Mohammad M. Al-Ktash, Idrees F. Al-Momani. Study of Fuel Assessment and Adulteration Using EEMF and
CSIR-NISTADS September 2017
Multiway PCA. Energy Fuels, 2014, 28 (8), 4889–4894.
113. Sakai, M., & Ikenaga, M. (2013). Application of peptide nucleic acid (PNA)-PCR clamping technique to investigate the community structures of rhizobacteria associated with plant roots. J of microbiological methods, 92(3), 281-288.
114. Santos P.M., E.R. Pereira-Filho, L.E. Rodriguez-Saona. Food Chemistry 138 (2013) 19–24
115. Sh. R Yadav, VK. Murthy, D. Mishra, B. Baral. Estimation of petrol and diesel adulteration with kerosene and assessment of usefulness of selected automobile fuel quality test parameters, International Journal of Environmental Science and Technology, Dec 2005; 1: 253-255.
116. Sherma J. Analysis of counterfeit drugs by thin layer chromatography. Acta Chromatographica. 2007; 19:5–20.
117. Sprey K. Using radio waves to identify counterfeit drugs. 2010. [March 7, 2013]. http://www.gizmag.com/using-radio-waves-to-identify-counterfeit-drugs/16233.
118. Sharma, K., and Paradakar, M. (2010). The melamine adulteration scandal. Food Security, 2, 97–107.
119. Staub A, Rudaz S, Veuthey JL, Schappler J. Multiple injection technique for the determination and quantitation of insulin formulations by capillary electrophoresis and time-of-flight mass spectrometry. Journal of Chromatography A. 2010; 1217(51):8041–8047.
120. Sukhdev Roy. Fiber optic sensor for determining adulteration of petrol and diesel by kerosene. Sensors and Actuators B: Chemical Volume 55, 1999, 212-216.
121. T. F. McGrath, C. T. Elliott and T. L. Fodey, Anal. Bioanal. Chem., 2012, 403, 75–92.
122. Tingting Lang, Shintaro Pang, Lili He. Integration of colorimetric and SERS detection for rapid screening and validation of melamine in milk. Anal. Methods, 2015,7, 6426-6431
123. Titier K, Castaing N, Scotto-Gomez E, Pehourchq F, Moore N, Molimard M. High-performance liquid chromatographic method with diode array detection for identification and quantification of the eight new antidepressants and five of their active metabolites in plasma after overdose. Therapeutic Drug Monitor. 2003; 25(5):581–587.
124. Trefi S, Routaboul C, Hamieh S, Gillard V, Malet-Martino M, Martino R. Analysis of illegally manufactured formulations of tadalafil (Cialis®) by 1h NMR, 2D DOSY 1h NMR and Raman spectroscopy. Journal of Pharmaceutical and Biomedical Analysis. 2008; 47(1):103–113.
125. U. Souto, M. J. C. Pontes, E. C. Silva, R. K. H. Galvao, M. C. U. Araujo, F. A. C. Sanches, F. A. S. Cunha and M. S. R. Oliveira, Food Chem., 2010, 119, 368–371.
126. USP (U.S. Pharmacopeia) Ensuring the quality of medicines in resource-limited countries: An operational guide. Rockville, MD: U.S. Pharmacopeia Drug Quality and Information Program; 2007.
127. V. Jersha Felix, Purohitam Adithya Udaykiran , K. Ganesan, Fuel Adulteration Detection System, Indian Journal of Science and Technology, January 2015; 8: 90-95.
128. V. A. Parvathy, V. P. Swetha, T. E. Sheeja, N. K. Leela, B. Chempakam and B. Sasikumar, Food Biotechnol., 2014, 28, 25–40.
129. V. Ghate, A. L. Leong, A. Kumar, W. S. Bang, W. B. Zhou and H. G. Yuk, Food Microbiol., 2015, 48, 49–57.
130. W. Han, Y. Gu, W. Wang, Y. Zhang, Y. Yin, J. Wang and L.-R. Zheng, Inform. Syst. Front., 2015, 17, 275–287.
131. Wellcome Trust. Enabling technology. 2012.
132. WHO (World Health Organization) The international pharmacopoeia: Fourth edition 2011.
133. Wilkinson N. Briefcase encounter: An invention to detect fake drugs. Wellcome Trust; 2012. [March 7, 2013]. http: //wellcometrust.wordpress.com/2012/11/12/briefcase-encounter-an-invention-to-detect-fake-drugs.
134. Witkowski MR. The use of Raman spectroscopy in the detection of counterfeit and adulterated pharmaceutical products. American Pharmaceutical Review. 2005; 8:56–62.
135. Wolff JC, Thomson LA, Eckers C. Identification of the “wrong” active pharmaceutical ingredient in a counterfeit Halfan™ drug product using accurate mass electrospray ionisation mass spectrometry, accurate mass tandem mass spectrometry and liquid chromatography/mass spectrometry. Rapid Communications in Mass Spectrometry. 2003;17:215–221.
CSIR-NISTADS September 2017
136. World Customs Organization. High-impact customs operation tackles illicit medicines in Africa. 2012.
137. X. M. Wu, C. Xu, R. A. Tripp, Y. W. Huang and Y. P. Zhao, Analyst, 2013, 138, 3005–3012
138. X. Y. Zhou, J. J. Liu, R. G. Cooks and Z. Ouyang, Bioanalysis, 2014, 6, 1497–1508
139. X. Z. Li, S. Zhang, Z. Yu and T. Y. Yang, Appl. Spectrosc., 2014, 68, 483–487.
140. Xiaoling Wu, Wenbin Wang, Liqiang Liu, Hua Kuang and Chuanlai Xu. Monoclonal antibody-based cross-reactive sandwich ELISA for the detection of Salmonella spp. in milk samples. Anal. Methods, 2015,7, 9047-9053
141. Y. Cheng, Y. Y. Dong, J. H. Wu, X. R. Yang, H. Bai, H. Y. Zheng, D. M. Ren, Y. D. Zou and M. Li, J. Food Compos. Anal., 2010, 23, 199–202
142. Y. Feng, L. Xie, Q. Chen and L. R. Zheng, IEEE Sens. J., 2015, 15, 3201–3208 .
143. Yang M, Kim TY, Hwang HC, Yi SK, Kim DH. Development of a palm portable mass spectrometer. Journal of the American Society for Mass Spectrometry. 2008;19:1442–1448. [PubMed]
144. Z. B. Pang, Q. Chen, W. L. Han and L. R. Zheng, Inform. Syst. Front., 2015, 17, 289–319.
145. Z. Ouyang and R. G. Cooks, Annu. Rev. Anal. Chem., 2009, 2, 187–214.
146. Z. Zhang, W. Xu, N. E. Manicke, R. G. Cooks and Z. Ouyang, Anal. Chem., 2012, 84, 931–938.
147. Z. Zou, Q. Chen, I. Uysal and L. R. Zheng, Philos. Trans. R. Soc., A, 2014, 372, 16 .
148. Haoran Wei, Seyyed M. Hossein Abtahi, Peter J. Vikesland, Plasmonic colorimetric and SERS sensors for environmental analysis, Environ. Sci.: Nano, 2015, 2, 120-135
149. Tingting Lang, Shintaro Pang and Lili He, Integration of colorimetric and SERS detection for rapid screening and validation of melamine in milk, Anal. Methods, 2015,7, 6426-6431
150. UV-Vis spectrometric detection of biodiesel/diesel blend adulterations with soybean oil, David D. S. Fernandes; Adriano A. Gomes; Marcelo M. de Fontes; Gean B. da Costa; Valber E. de Almeida; Mario C. U. de Araújo; Roberto K. H. Galvão; Germano Véras, Journal of the Brazilian Chemical Society, vol.25 no.1 2014.
151. Zheng J, Pang S, Labuza TP, He L. Evaluation of surface-enhanced Raman scattering detection using a handheld and a bench-top Raman spectrometer: a comparative study. Talanta. 2014 Nov ;129: 79-85.
152. Lígia Bueno, William R. de Araujo, Maiara O. Salles, Marcos Y. Kussuda and Thiago R. L. C. Paixão, Voltammetric Electronic Tongue for Discrimination of Milk Adulterated with Urea, Formaldehyde and Melamine, Chemosensors 2014, 2, 251-266.
153. Mary S.Arul, S.Srimathi, S.Sudarsan Vakul, Quality Assessment of Cement based on its dielectric parameters, International Journal of Mechanical Civil and Control Engineering Vol. 1, Issue. 2, April, 2015
154. Zook, A. 2012. Detection of counterfeit pharmaceuticals: Merck case study. Presentation at Committee on Understanding the Global Public Health Implications of Substandard, Falsified, and Counterfeit Medical Products: Meeting One, Institute of Medicine, Washington, DC.