Embed Size (px)
Citation preview

Impurities in Plasma-Derived Therapeutic Protein ProductsProtein Products
Advanced Analytical Techniques:Advanced Analytical Techniques: Examples How These Match
R ti L b t A l ti f P t iRoutine Laboratory Analytics of Protein Bio-therapeutics
Dr. Peter L. TurecekAss Professor of Pharmacology University of ViennaAss. Professor of Pharmacology, University of Vienna
Senior Director Biologics R&D - Drug DevelopmentBaxter BioScience Vienna Austria
Copyright Baxter – do not copy or distribute
Baxter BioScience, Vienna, Austria
PL Turecek, WCBP, Jan. 31, 2013 1

Plasma protein therapeutics:What makes them special?
• More than 50 years history in pharmacy and medicine
• Could be considered as the best investigated biological products• Could be considered as the best investigated biological products
• Very complex molecules and protein compositions
C l h l i l f ti• Complex pharmacological functions
• Some plasma products represent intermediate purity plasma fractions
– What is the API, what a product related impurity?
• Analytical methods required by pharmacopoeia monographs sometimes d t ( t) t k i t t tti d l ti l t h i fdo not (cannot) take into account cutting-edge analytical techniques of today´s protein biochemistry
• Application of such methods to plasma products could be valuable• Application of such methods to plasma products could be valuable complementary tools
Copyright Baxter – do not copy or distributePL Turecek, WCBP, Jan. 31, 2013 2

Plasma protein therapeutics:What do current guidelines teach?
• EMA/CHMP/BWP/706271/2010CHMP Guideline on plasma-derived medicinal products
All products must comply with the appropriate European Pharmacopoeia monographs. All relevant parameters should be measured in each batch of the final product. Appropriate limits for all these parameters should be set reflecting the capability of the Appropriate limits for all these parameters should be set reflecting the capability of the
production process in line with Guideline Q6B For certain parameters, testing of either the drug substance or the drug product may not
be necessary on a routine basis and may not need to be included in the specifications ifbe necessary on a routine basis and may not need to be included in the specifications if efficient control or acceptable and consistent results have been satisfactorily demonstrated.
Any differences in their manufacturing process in comparison to the commercial process y g p p pshould be clear
The variability of the starting material and the heterogeneity of the plasma-derived medicinal products are important considerations in the validation of analytical methods
If methods other than those specified by the European Pharmacopoeia are used, the alternative procedures should be shown to give consistently equivalent results on several batches of product.
Copyright Baxter – do not copy or distribute
Very general requirements
PL Turecek, WCBP, Jan. 31, 2013 3

Plasma protein therapeutics:What do current guidelines teach?
• U.S. Department of Health and Human Services, Food and Drug Administration, Center for Biologics Evaluation and Research (CBER); February 1999
Guidance for Industry: For the Submission of Chemistry, Manufacturing and Controls and Establishment Description Information for Human Plasma-Derived Biological Products Animal Plasma or Serum-Derived ProductsInformation for Human Plasma-Derived Biological Products, Animal Plasma or Serum-Derived Products
Physicochemical Characterization (Biological Specifications) In general, characterization may include, but need not be limited to the following:• Potency Assays,• Chromatographic Assays• Chromatographic Assays,• Electrophoresis, e.g., Sodium Dodecyl Sulfate-Polyacrylamide Gel Electrophoresis (SDS-PAGE),• Immunoblot Analysis,• Fluorescence Activated Cell Sorter (FACS) Analysis,• Enzyme-Linked Immunosorbent Assay (ELISA)
Specifications/Analytical Methods• Specifications and analytical methods used for release testing, expiration dating, acceptable regulatory specifications and tests
for the product, sufficient to assure its identity, purity, strength, or potency and lot-to-lot consistency should be submitted.
• Validation of the analytical systems and the data should be provided for noncompendial methods to demonstrate the system• Validation of the analytical systems and the data should be provided for noncompendial methods to demonstrate the system suitability.
Impurities Profile• A discussion of the impurity profiles, with supporting analytical data, should be provided.
• Profiles of variants of the protein including proteolytic break down products, aggregated forms, chemically modified forms which are all product related substances should be determined. Non-product related impurities, e.g., process reagents,should be identified where possible.
• In addition, other active plasma components that may be present should be identified.
S ifi i h ld b f h f h i f i i
Copyright Baxter – do not copy or distribute
• Specifications should be set for each of these categories of impurity.
Very general requirementsPL Turecek, WCBP, Jan. 31, 2013 4

Plasma protein therapeutics:Examples of analytical challenges
• Intermediate purity plasma products: Prothrombin complex concentrate
• The “underestimated” impurity:The underestimated impurity: Coagulation factor IX
• Characterization of a complex API – similarity of different• Characterization of a complex API – similarity of different plasma products with same indication: Protease inhibitor alpha-1-antitrypsin Protease inhibitor alpha 1 antitrypsin
Copyright Baxter – do not copy or distributePL Turecek, WCBP, Jan. 31, 2013 5

Plasma protein therapeutics:Examples of analytical challenges
• Intermediate purity plasma products: Prothrombin complex concentrate
• The “underestimated” impurity:The underestimated impurity: Coagulation factor IX
• Characterization of a complex API – similarity of different• Characterization of a complex API – similarity of different plasma products with same indication: Protease inhibitor alpha-1-antitrypsin Protease inhibitor alpha 1 antitrypsin
Copyright Baxter – do not copy or distributePL Turecek, WCBP, Jan. 31, 2013 6

Prothrombin complex concentrate (PCC): Development of a novel pathogen inactivation technology for a plasma product
H t t t t ll i
Develpment goal was to have 3 virus inactivation steps:
Heat treatment all viruses
Detergent LEV Additional feature
CPMP guidelinesg
UV-C light (focus on SNLEV)
Additional feature
• Efforts to establish UV-irradiation technology platform
• A dedicated new development consisting ofA dedicated new development consisting of
- a novel irradiation device- a UV reactor optimized by CFD (Computational fluid dynamics)p y ( p y )- unique methods for calibration, validation, standardization and
process control
Copyright Baxter – do not copy or distribute
• Should result in a tviPCC
PL Turecek, WCBP, Jan. 31, 2013 7

tviPCC: Flowchart of manufacture
cryocryo--poorpoor plasmaplasma
purificationpurification((ii hh b t hb t h h t hh t h ))((ionion exchangeexchange batchbatch chromatographychromatography))
virus inactivation I virus inactivation I (detergent treatment in solution)(detergent treatment in solution)
i i ti ti IIi i ti ti II (UV(UV C i di ti i l ti )C i di ti i l ti )
detergent detergent removalremoval((ionion exchangeexchange batchbatch chromatographychromatography))
lyophilizationlyophilization
virus inactivation II virus inactivation II (UV(UV--C irradiation in solution)C irradiation in solution)
y py p
virusvirus inactivationinactivation III (III (heatheat treatmenttreatment in solid in solid statestate))
fillingfilling andand formulationformulation
finalfinal productproduct
Copyright Baxter – do not copy or distribute
final final productproduct
PL Turecek, WCBP, Jan. 31, 2013 8

Development of an irradiation device (UV reactor) in manufacturing scale
• Batch process performed in a stirred quartz
li d
30 L UV reactor
cylinder• Stacked propeller stirrer
with 90 ± 10 rpm• Nine low pressure
monochromatic Hg lamps (254 nm)No product contact with• No product contact with and no heat-transfer from UV-C lamps
• Irradiating UV dose• Irradiating UV dose corresponding to an effective dose of 20 ± 1 mJ/cm2 measured by
30 L UV reactory
radiometers• Process controlled by
sensor reading correlated t t t l i di ti d
Lamphousingwithreflector
30 L UV reactor
Copyright Baxter – do not copy or distribute
to total irradiating dose [mJ/cm²]
PL Turecek, WCBP, Jan. 31, 2013 9

UV-C irradiation can induce protein damageMultiple reactions in UV photolysis of chromophors result in formation of reactive radicals:
hdenaturation, crosslinking, etc.(free radical reactions)
AA 1AA* 3AA* Pb
e g : Tryptophan photolysis aq-ee.g.: Tryptophan photolysisUV-C
Trp [ Trp ] ** Trp+ +
[aq] aq
-e
e
- [S-S] -- [S-S] --TrpFL
330-3501Trp*
•
3Trp*TyrTyr
PHOS 2 -S + -e
Back reactions of -Sradicals may result in formation of original or new intra- and/or inter-molecular disulfide bonds.These cause either loss of function or oligomerization.
Copyright Baxter – do not copy or distribute
These cause either loss of function or oligomerization.
PL Turecek, WCBP, Jan. 31, 2013 10

Susceptibility of different plasma proteins to UV-C irradiation
100%0 – 4 S-S bridges
[%]
70%
80%
90%
12 S S b id
activ
ity [
50%
60%
70% 12 S-S bridges>12 S-S bridges
30%
40%
protein C antithrombin IIItit i th bi
0%
10%
20% antitrypsin prothrombinthrombin (n=1) factor XVWF (n=1) VWF + cystine (n=1) results: mean of 3
Inactivation of plasma proteins by UV-C irradiation depends
0%0 10 20 30 40 50 60 70 80 90
effective UV dose [mJ/cm²]
Copyright Baxter – do not copy or distribute
Inactivation of plasma proteins by UV C irradiation dependson number of disulfide bonds
PL Turecek, WCBP, Jan. 31, 2013 11

Impact of UV-C irradiation on PCCProduct comparison by conventional 2D-electrophoresis
4 0 7 0kDa pH
4 07 04.0 7.0250
4.07.0
1515
before UV after UV (28 mJ/cm2)
No alterations in protein pattern upon UV-C irradiation at 28 mJ/cm2
Copyright Baxter – do not copy or distribute 12PL Turecek, WCBP, Jan. 31, 2013

Protein profile of PCC:Influence of UV-C treatment
50
60w/o UV (n=5)
with UV (n=5)
30
40ot
al p
rote
inwith UV (n=5)
10
20%of
to
0
10
No alterations in protein pattern
Copyright Baxter – do not copy or distribute 13PL Turecek, WCBP, Jan. 31, 2013

In vitro efficacy test of PCCThrombin generation capacity
160w/o UV-Ctreatment
Maximum thrombin values induced by 1 U Maximum thrombin values induced by 1 U FII/mlFII/ml
120
140
M)
with UV-treatment
80
100
hrom
bin
(nM
40
60
80
Max
imum
Th
20
40
UV-C irradiation does not impact thrombin generation capacity of PCC
0PCC reference standard # 028 # 041 # 043 # 045 # 051
Copyright Baxter – do not copy or distribute 14PL Turecek, WCBP, Jan. 31, 2013

2D-Difference Gel ElectrophoresisLysis and
Minimal CyDyelabeling
FluorescenceImaging
Mix and Resolveby 2-DE
Image analysis(DeCyder™)
A/Cy3A/Cy3Control
A+B/Cy2Standard
A/Cy3
B/Cy5A+B/Cy2
UV treated
MINIMAL LABELING• 8M urea/2M thiourea/4% CHAPS/
B/Cy5 Merged image
UV-treated
Pick gel spots8M urea/2M thiourea/4% CHAPS/7 mM Tris pH 8.3
• 4 pmol dye/µg protein for 30’ on ice• Quench with lysine, DTT reduce
Copyright Baxter – do not copy or distributePL Turecek, WCBP, Jan. 31, 2013 15

NHS-CyDye experiment 1
Control
UV-treated
Copyright Baxter – do not copy or distribute
UV treated
PL Turecek, WCBP, Jan. 31, 2013 16

Example: Spot 542 is increased followingUV-treatment
Cy2 Standard Cy3 Control Cy5 UV treatmentbu
ndan
ce 21.81.61 4
Cy3 Control Cy5 UV treatment
anda
rdis
ed A
b 1.41.2
10.80.60 4
Sta 0.4
0.20
Copyright Baxter – do not copy or distributePL Turecek, WCBP, Jan. 31, 2013 17

UV-C Irradiation of PCC: Conclusions
+ Conventional 2D electrophoresis did not show an impact on protein compositioncomposition
+ ELISA tests of proteins contained in the PCC did not show quantitative differences
+ Functionality seemed not to be altered by UV-C irradiation Reproducible differences in the levels of low-abundance proteins in PCC
were observed by lysine and cysteine-labeling 2D-DIGE after UVwere observed by lysine and cysteine labeling 2D DIGE after UV treatment
UV treatment results in increase in labeling to thiol groups (Cys-SH) becoming available (data not shown)becoming available (data not shown)
• tviPCC project was terminated UV C i di ti lt i t i d t ti d f ti f l UV-C irradiation can result in protein denaturation and formation of novel
protein structures Risk was considered low but outweighed benefit of UV-light viral
inactivation
Copyright Baxter – do not copy or distribute
inactivation
PL Turecek, WCBP, Jan. 31, 2013 18

Plasma protein therapeutics:Examples of analytical challenges
• Intermediate purity plasma products: Prothrombin complex concentrate
• The “underestimated” impurity:The underestimated impurity: Coagulation factor IX
• Characterization of a complex API – similarity of different• Characterization of a complex API – similarity of different plasma products with same indication: Protease inhibitor alpha-1-antitrypsin Protease inhibitor alpha 1 antitrypsin
Copyright Baxter – do not copy or distributePL Turecek, WCBP, Jan. 31, 2013 19

FIXa issue on assay and recovery in patients
• Pharmacokinetic studies in haemophilia B have found in vivo recovery of FIX to be uniformly lower than the factor VIII recovery in haemophilia A.
• Recovery of FIX antigen was significantly greater than the recovery of FIX activity
– Liebman HA et al., Kinetics of factor IX activity differ from that of factor IX antigen in patients with haemophilia B receiving high-purity factor IX replacement. Haemophilia.1999 May;5(3):174-80
• The recovery following rFIX infusion (expressed as FIX activity increase in U/dL per IU FIX concentrate/kg body weight infused) was significantly lower than that following the last plasma-derived factor IX (pdFIX)
– Poon MC, et al., Recombinant factor IX recovery and inhibitor safety: a Canadian post-licensure surveillance study. Thromb Haemost. 2002 Mar;87(3):431-5.
• Is the lower recovery a result from rapid binding to high-affinity receptors on platelets and y p g g y p pendothelium?
• Methods discrepancy with rFIX: Does chromogenic/clotting discrepancy indicate presence of activated FIX in some FIX products?p
• Are FIX products correctly labeled because FIX activity might reflect the sum of FIX and (smaller amounts of FIXa) also contained in the products?
Copyright Baxter – do not copy or distributePL Turecek, WCBP, Jan. 31, 2013 20

The effect of increasing FIXa samples on FIX clotting levels (FIX:C)g ( )
Pickering and Gray, 2007 (Poster for Geneva ISTH Congress)• One-stage assay is sensitive to activated FIX.
• Factor IXa at 0.4 IU/1000 IU FIX or above produced a significantly higher potency measurement when assayed by the one-stage clotting method.
% increase in FIX:C after the addition of FIXa (IU/ml/1000 IU FIX)Time (hrs)
% increase in FIX:C after the addition of FIXa (IU/ml/1000 IU FIX)0.2 0.4 1.0 5.0
0 5 ± 5.3 8 ± 1.6* 20 ± 2.1** 29 ± 1.5**0.5 5 ± 4.1 8 ± 2.4* 4 ± 2.8** 27 ± 1.3**1.0 5 ± 3.8 9 ± 2.0* 26 ± 2.4** 27 ± 3.4**2 0 5 ± 3 5 9 ± 3 3* 25 ± 2 7** 26 ± 2 0**2.0 5 ± 3.5 9 ± 3.3 25 ± 2.7 26 ± 2.03.0 4 ± 3.1 8 ± 0.5* 20 ± 1.2** 27 ± 1.4**
* = p value >0.05 and ** = p value <0.005
At 0 hour, 0.2, 0.4 and 1.0 IU/FIXa/ 1000 IU FIX increased the FIX:C activity of the concentrate by 5 ± 5.3, 8 ± 1.6 and 20 ± 2.1 %, respectively.
Three hours incubation did not return the FIX:C to a level found in the unspiked sample and
Copyright Baxter – do not copy or distributePL Turecek, WCBP, Jan. 31, 2013 21
Three hours incubation did not return the FIX:C to a level found in the unspiked sample and the activities were found to have increased by 4 ± 3.1, 8 ± 0.5 and 20 ± 1.2%.

FIXa assay issue: Conclusions
These results indicate that FIXa can affect the measurements of FIX clotting activity in therapeutic FIX concentrates
A FIXa level above 0.4 IU/1000 IU FIX in a therapeutic product may lead to an apparently higher potency measurement when assayed b th t l tti th dby the one-stage clotting method.
(Pickering and Gray, 2007)
Is the presence of FIXa in commercial FIX products (particularly rFIX) the reason for the lower than
t d i h hili B ti t ?expected recovery in hemophilia B patients?
Copyright Baxter – do not copy or distributePL Turecek, WCBP, Jan. 31, 2013 22

FIX assay sensitive for FIXa
FIX+ FXIa, FX, FVIII, PL-vesicles and CaCl2
XIa
IX IXa
Ca++
FXIa mediated FIX activationFVIIIa/FX complex formation FXa generation
Subsamples (1 40 min)X
IX IXa
VIIIIXa
Ca++Subsamples (1 - 40 min) + chromogenic substrate
measurement ofFXa concentration CH3OCO-D-CHA-Gly-Arg-pNA
Xa
FXa concentration
Kinetics of FXa generation depends on FXa generation curve vs.time
10
CH3OCO D CHA Gly Arg pNA
g p- rate of FIX activation- rate of FIXa-FVIII-PL complex assembly- rate of FX activation 6
8
ratio
n (n
M) 1 U/ml FIX
0.75 U/ml FIX
0.5 U/ml FIX
0
2
4
FXa
gene
r
0.25 U/ml FIX
0.125 U/ml FIX
0 U/ml FIX
In the absence of FXIa only the effect of the endogenous FIXa is measured
Copyright Baxter – do not copy or distribute
0
0 5 10 15 20 25 30 35 40
Time (min)
0 U/ml FIX endogenous FIXa is measured
PL Turecek, WCBP, Jan. 31, 2013 23
Different pd and r FIX products in FIX assay
FIX assay without FXIaexperimental rFIX product (n=13)
2,0
M)
experimental rFIX product (n=13)
commercial rFIX (n=3)
commercial pdFIX (n=1)
1,0
1,5ne
ratio
n (n
M
0,5
,0
FXa
gen
0,00 10 20 30 40 50
Measurable FIXa levels in the commercial pd FIX and rFIX M h l i i t l FIX d t tl i l t t li i l
Time (min)
Copyright Baxter – do not copy or distribute
Much less in new experimental rFIX product currently in late stage clinical development
PL Turecek, WCBP, Jan. 31, 2013 24

Plasma protein therapeutics:Examples of analytical challenges
• Intermediate purity plasma products: Prothrombin complex concentrate
• The “underestimated” impurity:The underestimated impurity: Coagulation factor IX
• Characterization of a complex API – similarity of different• Characterization of a complex API – similarity of different plasma products with same indication: Protease inhibitor alpha-1-antitrypsin Protease inhibitor alpha 1 antitrypsin
Copyright Baxter – do not copy or distributePL Turecek, WCBP, Jan. 31, 2013 25

Molecular characteristics of A1PI fromhuman plasma
Single chain glycoprotein of 394 amino acids
pI
4.2Single chain glycoprotein of 394 amino acidsCarries a high negative charge because of sialic acidresidues on three complex N-glycans
M0/M1
M2Exhibits multiple bands reflecting microheterogeneityupon IEF (M0/M1 anodal-low pI to M8 cathodal–high pI)
2 minor cathodal isoforms M7 and M8 are truncated at the
M2
M42 minor cathodal isoforms, M7 and M8, are truncated at theN-terminus lacking 5 AA leading to an additional cathodalshift due to the loss of negatively charged glutamic and asparticacid
M6M7
acid
1 single cysteine covalently bound to either Cys orglutathione via a disulfide bridge
M8g gAsn116 and Asn314 are susceptible to deamidation(Asn Asp) due to the sequence as Gly follows 4.9
Copyright Baxter – do not copy or distributePL Turecek, WCBP, Jan. 31, 2013 26

A1PI Preparations investigated
3 US FDA-approved A1PI concentrates are available:
Prolastin (Talecris, approved 1987)
Aralast (Baxter, approved 2002)
Zemaira (CSL Behring, approved 2003)
Upstream manufacturing and downstream purificationprocesses including pathogen reduction/inactivation steps vary to different extents among the productsy g p
Starting material for the downstream purification is Cohn fraction IV-1 (Prolastin) orCohn fraction IV 1 (Prolastin) or Cohn fraction IV-1 + IV-4 (Aralast and Zemaira)
Kolarich D, Turecek PL, Weber A, et al. Biochemical, molecular characterization, and glycoproteomic analyses of alpha(1)-proteinase inhibitor products used for replacement therapy. Transfusion. 2006 Nov;46(11):1959-77
Copyright Baxter – do not copy or distributePL Turecek, WCBP, Jan. 31, 2013 27
Kolarich D, Weber A, Turecek PL, et al. Comprehensive glyco-proteomic analysis of human alpha1-antitrypsin and its charge isoforms. Proteomics. 2006 Jun;6(11):3369-80
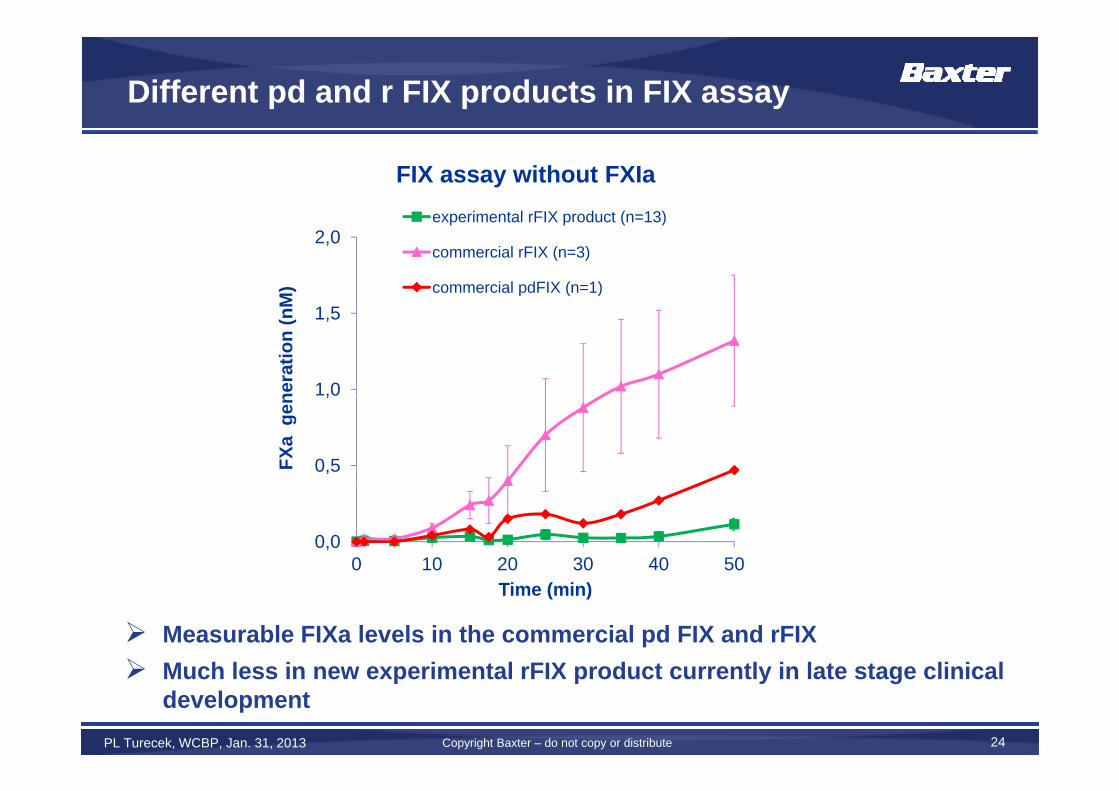
Investigations
High-resolution IEF analysis of native A1PIAnalysis of enzymatically released and fluorescently labelledN-glycansMS analysis of tryptic glycopeptides allowing site specificMS analysis of tryptic glycopeptides allowing site-specific assignment of N-glycan structuresMeasurement of deamidation levels by an enzymatic test andy yby MS of tryptic peptidesInvestigation of cysteinylation of Cys232 by MSTryptic peptide mappingDetection and measurement of C-terminal tryptic peptidesProtein structural investigations
Copyright Baxter – do not copy or distributePL Turecek, WCBP, Jan. 31, 2013 28

IEF pattern of the A1PI concentrates
Normal resolution IEF
PL A P Z
High resolution IEF
M0
PL A P Z +pI 4.2
M0
M2
M4
M6
*M6
pI 4.9-
Anodal shift in banding on normal resolution IEF can be attributed to a “new” band in Aralast (indicated by *) on high-resolution IEF
-
Copyright Baxter – do not copy or distribute
to a new band in Aralast (indicated by ) on high-resolution IEF (for similar normal resolution results see also: Marszal E, Shrake A (2006): Transfusion 46, 872)
PL Turecek, WCBP, Jan. 31, 2013 29

N-Glycan structures of plasma A1PI
N-glycan structures of plasma A1PI described for the first time:
74% 4% 13% 1% 6% <1% 1% <1%
g y p
2,3-bound NeuAc Si l l L i X Sialyl-Lewis X
(fucose is attached to the 4-GlcNAc on the 3-arm) Tetraantennary structures
Sialyl Lewis X Tetraantennary structures
(Kolarich D. et al, 2006, Proteomics 6, 3369)
2,3 N-Acetyl neuraminic acid2,6 N-Acetyl neuraminic acidGalactoseN-Acetyl glucosamine
Copyright Baxter – do not copy or distribute
y gMannoseFucose
PL Turecek, WCBP, Jan. 31, 2013 30

N-Glycan analysis of A1PI concentratesHPLC Analysis
No difference in the N-glycan profile between Aralast, Prolastin and Zemaira and the pattern is similar to that found
Copyright Baxter – do not copy or distribute
Prolastin and Zemaira and the pattern is similar to that found for A1PI from human plasma
PL Turecek, WCBP, Jan. 31, 2013 31

Measurement of deamidationMS Analysis of tryptic peptides to detect deamidation on Asn116
Deamidation was detected qualitatively on Asn116 in all three concentrates asthree concentrates as indicated by the distribution of isotopes
Enzymatic assay (IsoQuant Kit, Promega) based on the methylation of isoaspartate, a final product of Asn deamidation
Aralast (mean of 3 lots) 6%Zemaira (1 lot) 7%
% of molecules withone isoaspartate
Product
Zemaira (1 lot) 7%Prolastin (1 lot) 10%
Deamidation as primary sequence modification which also might introduce an additional negative charge into a protein resulting in an anodal shift on
Copyright Baxter – do not copy or distribute
an additional negative charge into a protein resulting in an anodal shift on an IEF gel occurs in all A1PI concentrates investigated.
PL Turecek, WCBP, Jan. 31, 2013 32

Cysteinylation of Cys232
MS Analysis of tryptic peptidesIEF With/without reduction+
pI4.2
A A* P P* Z Z* S1 S1*pI4.9A A P P Z Z S1 S1
* indicates reduced samples (5 mM DTE)
4.9
Aralast Prolastin and A1PI from plasma exhibit cysteinylation
Copyright Baxter – do not copy or distribute
Aralast, Prolastin, and A1PI from plasma exhibit cysteinylation on Cys232—not detected in Zemaira
PL Turecek, WCBP, Jan. 31, 2013 33

Tryptic peptide mapping
Very similar chromatograms obtained for all concentrates with two exceptions:
peak 2 was identified as A1PI resistant against trypsin in the presence of 4 M urea
hydrophilic C-terminal tryptic peptide 388-394 of A1PI (VVNPTQK; arrow 1) eluted in two different entities:
Copyright Baxter – do not copy or distributePL Turecek, WCBP, Jan. 31, 2013 34
two different entities: earlier peptide lacked the C-terminal Lys as shown by MS identification

C-terminal Lys truncation analysisMS Analysis
MS spectra showing C-terminal peptides of A1PI
K-A1PI lacking C-terminal amino acid lysine found in all
Copyright Baxter – do not copy or distribute
products: Aralast (67%), Zemaira (6%) and Prolastin (2%)
PL Turecek, WCBP, Jan. 31, 2013 35

Summary of A1PI modifications
Aralast Prolastin ZemairaGlycoisoforms no major differenceGlycoisoforms
Deamidation- qualitative
no major difference
detectableq- quantitative 6% 10% 7%
Methionine oxidation not observed (A1PI fully functionally active)
C-terminal Lys truncation 67% *1 2% 6%
*1 Removal of C-terminal Lys eliminates a positive charge from A1PI – observed as extra negative charge and anodal shift of isoforms on IEF gels
Cys232 cysteinylation + + -g g g
A1PI in all products differs from A1PI found in plasmaProteomic approach showed all A1PI products have at least one primary structure modification (d id ti t i difi ti d C
Copyright Baxter – do not copy or distributePL Turecek, WCBP, Jan. 31, 2013 36
primary structure modification (deamidation, cysteine modification, and C-terminal lysine truncation)

Functional relevance of C-terminal truncation of A1PI
300
slope: 438 7
slope: 441.8r = 0.9916
A1PI dependent inhibition of porcine elastase:Response of different A1PI concentrates
200
slope: 438.7r = 0.9850
slope: 443.0r = 0.9894
nM A
1PI
slope: 448.6r = 0.9974
100
Prolastin (n = 6 lots / 22 dilution series)Zemaira (n = 2 lots / 7 dilution series)
00% 10% 20% 30% 40% 50% 60% 70%
Zemaira (n = 2 lots / 7 dilution series)ARALAST (n = 15 lots / 21 dilution series)100%-K-A1PI (n = 1 lot / 3 dilution series)
0% 10% 20% 30% 40% 50% 60% 70%
% inhibition of porcine elastase
• No difference in activity of Aralast, Prolastin, Zemaira & K-A1PITh t lik l d t l b t ti l bi l i l l b ll d t
Copyright Baxter – do not copy or distribute
• These most likely do not play a substantial biological role because all products have similar half-lives in humans and similarly neutralize neutrophil elastase
PL Turecek, WCBP, Jan. 31, 2013 37
Conclusions
By applying cutting edge protein chemical methods and proteomic analysis previously not identified molecularproteomic analysis previously not identified molecular features can be found in plasma products
Such techniques help to better and effectively characterizeSuch techniques help to better and effectively characterize intermediate purity plasma products
Some of these methods might not be feasible to beSome of these methods might not be feasible to be performed on a routine basis in batch release of plasma productsproducts
Copyright Baxter – do not copy or distributePL Turecek, WCBP, Jan. 31, 2013 38

Acknowledgement
University of Natural Resources and Life Sciences, Vienna, y , ,AustriaD. Kolarich, G.A.F. Nicolaes, F. Altmann, ,
University College London, UKJ. Timms, M. Waterfield
Baxter BioScience Vienna AustriaBaxter BioScience, Vienna, AustriaH. Gritsch, G. Schrenk, K. Varadi, J. Siekmann, H. Rottensteiner, A Weber M Graninger P Matthiessen A Mitterer MA. Weber, M. Graninger, P. Matthiessen, A. Mitterer, M. Hasslacher, M. Kaliwoda, M. Graninger, H.P. Schwarz, F. Scheiflinger, H. Ehrlich
Copyright Baxter – do not copy or distributePL Turecek, WCBP, Jan. 31, 2013 39