Embed Size (px)
Citation preview
ORIGINAL RESEARCH ARTICLEpublished: 17 December 2013doi: 10.3389/fnagi.2013.00090
Advanced BrainAGE in older adults with type 2 diabetesmellitusKatja Franke1,2*, Christian Gaser1,2, Brad Manor3,4 and Vera Novak5
1 Structural Brain Mapping Group, Department of Psychiatry, Jena University Hospital, Jena, Germany2 Department of Neurology, Jena University Hospital, Jena, Germany3 Institute for Aging Research, Hebrew SeniorLife, Boston, MA, USA4 Division of Gerontology, Beth Israel Deaconess Medical Center, Harvard Medical School, Boston, MA, USA5 Department of Neurology, Stroke Division, Harvard Medical School, Boston, MA, USA
Edited by:
P. Hemachandra Reddy, OregenHealth and Science University, USA
Reviewed by:
Nikolaos Koutsouleris,Ludwig-Maximilian-University,GermanySubbiah Pugazhenthi, Denver VAMedical Center, USA
*Correspondence:
Katja Franke, Structural BrainMapping Group, Department ofPsychiatry, Jena University Hospital,Jahnstr. 3, D – 07743 Jena, Germanye-mail: [email protected]
Aging alters brain structure and function and diabetes mellitus (DM) may accelerate thisprocess. This study investigated the effects of type 2 DM on individual brain aging as wellas the relationships between individual brain aging, risk factors, and functional measures.To differentiate a pattern of brain atrophy that deviates from normal brain aging, we usedthe novel BrainAGE approach, which determines the complex multidimensional agingpattern within the whole brain by applying established kernel regression methods toanatomical brain magnetic resonance images (MRI). The “Brain Age Gap Estimation”(BrainAGE) score was then calculated as the difference between chronological age andestimated brain age. 185 subjects (98 with type 2 DM) completed an MRI at 3Tesla,laboratory and clinical assessments. Twenty-five subjects (12 with type 2 DM) alsocompleted a follow-up visit after 3.8 ± 1.5 years. The estimated brain age of DM subjectswas 4.6 ± 7.2 years greater than their chronological age (p = 0.0001), whereas withinthe control group, estimated brain age was similar to chronological age. As comparedto baseline, the average BrainAGE scores of DM subjects increased by 0.2 years perfollow-up year (p = 0.034), whereas the BrainAGE scores of controls did not changebetween baseline and follow-up. At baseline, across all subjects, higher BrainAGE scoreswere associated with greater smoking and alcohol consumption, higher tumor necrosisfactor alpha (TNFα) levels, lower verbal fluency scores and more severe depression. Withinthe DM group, higher BrainAGE scores were associated with longer diabetes duration(r = 0.31, p = 0.019) and increased fasting blood glucose levels (r = 0.34, p = 0.025). Inconclusion, type 2 DM is independently associated with structural changes in the brainthat reflect advanced aging. The BrainAGE approach may thus serve as a clinically relevantbiomarker for the detection of abnormal patterns of brain aging associated with type 2 DM.
Keywords: aging, BrainAGE , diabetes mellitus (DM), magnetic resonance imaging (MRI), voxel-based
morphometry (VBM)
INTRODUCTIONThe global prevalence of type 2 diabetes mellitus (DM) is pro-jected to rise sharply over the coming decades. Individuals aged65 years and older have a particularly high risk of developingdiabetes complications, due to the combination of both mod-ifiable (i.e., lifestyle), and non-modifiable risk factors (Zimmetet al., 2001). Within this population, type 2 DM has been linkedto increased brain atrophy (Araki et al., 1994; Schmidt et al.,2004; Last et al., 2007; De Bresser et al., 2010; Van Elderen et al.,2010; Novak et al., 2011), impaired cognitive function (Reijmeret al., 2011), increased risk of depression (Anderson et al., 2001;Ali et al., 2006) and dementia, including both vascular demen-tia and Alzheimer’s disease (AD) (Janson et al., 2004; Xu et al.,2004; Biessels et al., 2006; Velayudhan et al., 2010; Tan et al., 2011;Cheng et al., 2012).
Chronic hyperglycemia is associated with vascular diseaseand neurotoxicity leading to neuronal damage (Tomlinsonand Gardiner, 2008). Within the brain, hyperglycemia appearsto induce structural abnormalities resembling the progres-sive, widespread atrophy often associated with biological aging(Gispen and Biessels, 2000; Biessels et al., 2006). Moreover, withinthe DM population, such generalized atrophy may be detectedat an earlier age (Araki et al., 1994). Clinical manifestations ofDM-related brain abnormalities include worse functional status(Stewart and Liolitsa, 1999; Biessels et al., 2006), deficits in cogni-tion [i.e., verbal memory, mental flexibility, and processing speed(Gispen and Biessels, 2000; Cheng et al., 2012)], and depression(Heuser, 2002; Wolkowitz et al., 2010, 2011; Katon et al., 2012).As such, recognition and quantification of subtle deviations fromaging-related brain atrophy may afford prospective identification
Frontiers in Aging Neuroscience www.frontiersin.org December 2013 | Volume 5 | Article 90 | 1
AGING NEUROSCIENCE
Franke et al. Advanced brain aging in diabetes
and subsequent treatment of patients with DM who are at risk forclinically-significant functional decline.
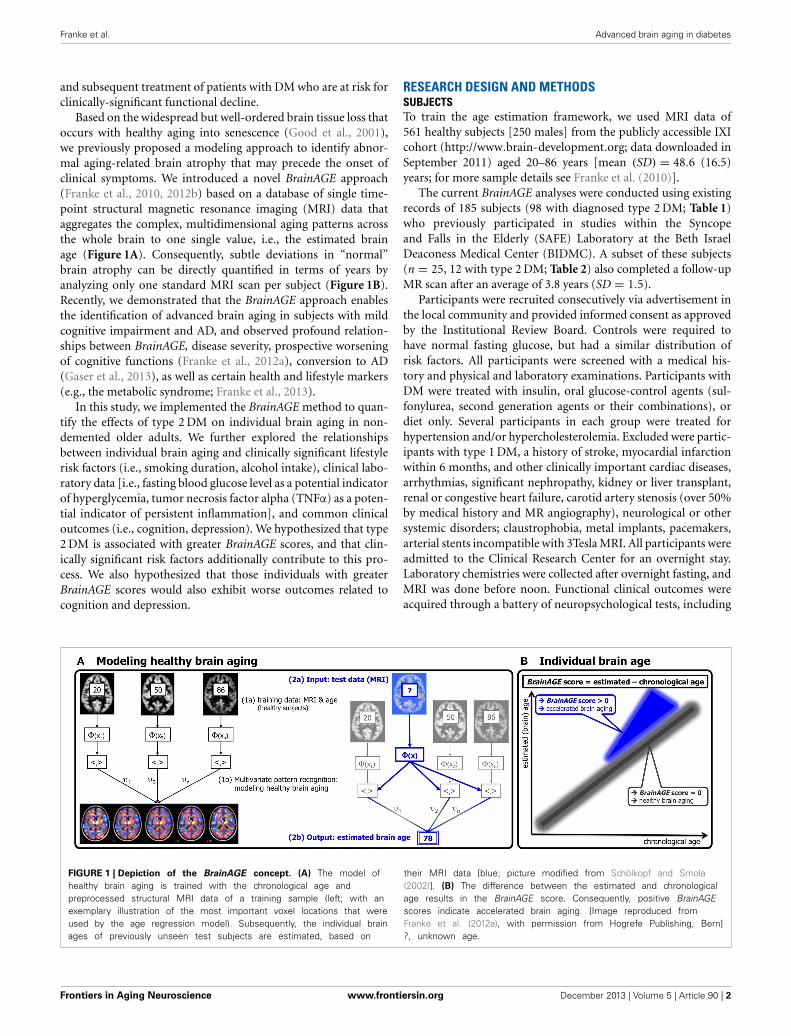
Based on the widespread but well-ordered brain tissue loss thatoccurs with healthy aging into senescence (Good et al., 2001),we previously proposed a modeling approach to identify abnor-mal aging-related brain atrophy that may precede the onset ofclinical symptoms. We introduced a novel BrainAGE approach(Franke et al., 2010, 2012b) based on a database of single time-point structural magnetic resonance imaging (MRI) data thataggregates the complex, multidimensional aging patterns acrossthe whole brain to one single value, i.e., the estimated brainage (Figure 1A). Consequently, subtle deviations in “normal”brain atrophy can be directly quantified in terms of years byanalyzing only one standard MRI scan per subject (Figure 1B).Recently, we demonstrated that the BrainAGE approach enablesthe identification of advanced brain aging in subjects with mildcognitive impairment and AD, and observed profound relation-ships between BrainAGE, disease severity, prospective worseningof cognitive functions (Franke et al., 2012a), conversion to AD(Gaser et al., 2013), as well as certain health and lifestyle markers(e.g., the metabolic syndrome; Franke et al., 2013).
In this study, we implemented the BrainAGE method to quan-tify the effects of type 2 DM on individual brain aging in non-demented older adults. We further explored the relationshipsbetween individual brain aging and clinically significant lifestylerisk factors (i.e., smoking duration, alcohol intake), clinical labo-ratory data [i.e., fasting blood glucose level as a potential indicatorof hyperglycemia, tumor necrosis factor alpha (TNFα) as a poten-tial indicator of persistent inflammation], and common clinicaloutcomes (i.e., cognition, depression). We hypothesized that type2 DM is associated with greater BrainAGE scores, and that clin-ically significant risk factors additionally contribute to this pro-cess. We also hypothesized that those individuals with greaterBrainAGE scores would also exhibit worse outcomes related tocognition and depression.
RESEARCH DESIGN AND METHODSSUBJECTSTo train the age estimation framework, we used MRI data of561 healthy subjects [250 males] from the publicly accessible IXIcohort (http://www.brain-development.org; data downloaded inSeptember 2011) aged 20–86 years [mean (SD) = 48.6 (16.5)years; for more sample details see Franke et al. (2010)].
The current BrainAGE analyses were conducted using existingrecords of 185 subjects (98 with diagnosed type 2 DM; Table 1)who previously participated in studies within the Syncopeand Falls in the Elderly (SAFE) Laboratory at the Beth IsraelDeaconess Medical Center (BIDMC). A subset of these subjects(n = 25, 12 with type 2 DM; Table 2) also completed a follow-upMR scan after an average of 3.8 years (SD = 1.5).
Participants were recruited consecutively via advertisement inthe local community and provided informed consent as approvedby the Institutional Review Board. Controls were required tohave normal fasting glucose, but had a similar distribution ofrisk factors. All participants were screened with a medical his-tory and physical and laboratory examinations. Participants withDM were treated with insulin, oral glucose-control agents (sul-fonylurea, second generation agents or their combinations), ordiet only. Several participants in each group were treated forhypertension and/or hypercholesterolemia. Excluded were partic-ipants with type 1 DM, a history of stroke, myocardial infarctionwithin 6 months, and other clinically important cardiac diseases,arrhythmias, significant nephropathy, kidney or liver transplant,renal or congestive heart failure, carotid artery stenosis (over 50%by medical history and MR angiography), neurological or othersystemic disorders; claustrophobia, metal implants, pacemakers,arterial stents incompatible with 3Tesla MRI. All participants wereadmitted to the Clinical Research Center for an overnight stay.Laboratory chemistries were collected after overnight fasting, andMRI was done before noon. Functional clinical outcomes wereacquired through a battery of neuropsychological tests, including
FIGURE 1 | Depiction of the BrainAGE concept. (A) The model ofhealthy brain aging is trained with the chronological age andpreprocessed structural MRI data of a training sample (left; with anexemplary illustration of the most important voxel locations that wereused by the age regression model). Subsequently, the individual brainages of previously unseen test subjects are estimated, based on
their MRI data [blue; picture modified from Schölkopf and Smola(2002)]. (B) The difference between the estimated and chronologicalage results in the BrainAGE score. Consequently, positive BrainAGEscores indicate accelerated brain aging. [Image reproduced fromFranke et al. (2012a), with permission from Hogrefe Publishing, Bern]?, unknown age.
Frontiers in Aging Neuroscience www.frontiersin.org December 2013 | Volume 5 | Article 90 | 2
Franke et al. Advanced brain aging in diabetes
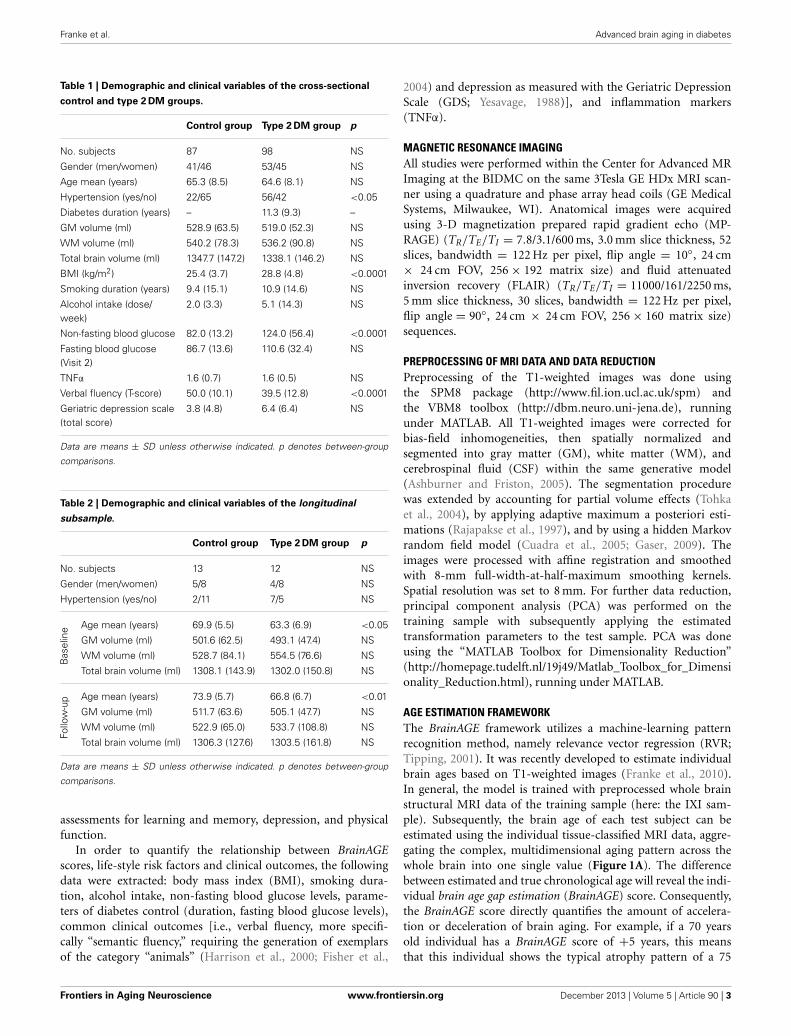
Table 1 | Demographic and clinical variables of the cross-sectional
control and type 2 DM groups.
Control group Type 2 DM group p
No. subjects 87 98 NS
Gender (men/women) 41/46 53/45 NS
Age mean (years) 65.3 (8.5) 64.6 (8.1) NS
Hypertension (yes/no) 22/65 56/42 <0.05
Diabetes duration (years) – 11.3 (9.3) –
GM volume (ml) 528.9 (63.5) 519.0 (52.3) NS
WM volume (ml) 540.2 (78.3) 536.2 (90.8) NS
Total brain volume (ml) 1347.7 (147.2) 1338.1 (146.2) NS
BMI (kg/m2) 25.4 (3.7) 28.8 (4.8) <0.0001
Smoking duration (years) 9.4 (15.1) 10.9 (14.6) NS
Alcohol intake (dose/week)
2.0 (3.3) 5.1 (14.3) NS
Non-fasting blood glucose 82.0 (13.2) 124.0 (56.4) <0.0001
Fasting blood glucose(Visit 2)
86.7 (13.6) 110.6 (32.4) NS
TNFα 1.6 (0.7) 1.6 (0.5) NS
Verbal fluency (T-score) 50.0 (10.1) 39.5 (12.8) <0.0001
Geriatric depression scale(total score)
3.8 (4.8) 6.4 (6.4) NS
Data are means ± SD unless otherwise indicated. p denotes between-group
comparisons.
Table 2 | Demographic and clinical variables of the longitudinal
subsample.
Control group Type 2 DM group p
No. subjects 13 12 NS
Gender (men/women) 5/8 4/8 NS
Hypertension (yes/no) 2/11 7/5 NS
Bas
elin
e Age mean (years) 69.9 (5.5) 63.3 (6.9) <0.05
GM volume (ml) 501.6 (62.5) 493.1 (47.4) NS
WM volume (ml) 528.7 (84.1) 554.5 (76.6) NS
Total brain volume (ml) 1308.1 (143.9) 1302.0 (150.8) NS
Follo
w-u
p Age mean (years) 73.9 (5.7) 66.8 (6.7) <0.01
GM volume (ml) 511.7 (63.6) 505.1 (47.7) NS
WM volume (ml) 522.9 (65.0) 533.7 (108.8) NS
Total brain volume (ml) 1306.3 (127.6) 1303.5 (161.8) NS
Data are means ± SD unless otherwise indicated. p denotes between-group
comparisons.
assessments for learning and memory, depression, and physicalfunction.
In order to quantify the relationship between BrainAGEscores, life-style risk factors and clinical outcomes, the followingdata were extracted: body mass index (BMI), smoking dura-tion, alcohol intake, non-fasting blood glucose levels, parame-ters of diabetes control (duration, fasting blood glucose levels),common clinical outcomes [i.e., verbal fluency, more specifi-cally “semantic fluency,” requiring the generation of exemplarsof the category “animals” (Harrison et al., 2000; Fisher et al.,
2004) and depression as measured with the Geriatric DepressionScale (GDS; Yesavage, 1988)], and inflammation markers(TNFα).
MAGNETIC RESONANCE IMAGINGAll studies were performed within the Center for Advanced MRImaging at the BIDMC on the same 3Tesla GE HDx MRI scan-ner using a quadrature and phase array head coils (GE MedicalSystems, Milwaukee, WI). Anatomical images were acquiredusing 3-D magnetization prepared rapid gradient echo (MP-RAGE) (TR/TE/TI = 7.8/3.1/600 ms, 3.0 mm slice thickness, 52slices, bandwidth = 122 Hz per pixel, flip angle = 10◦, 24 cm× 24 cm FOV, 256 × 192 matrix size) and fluid attenuatedinversion recovery (FLAIR) (TR/TE/TI = 11000/161/2250 ms,5 mm slice thickness, 30 slices, bandwidth = 122 Hz per pixel,flip angle = 90◦, 24 cm × 24 cm FOV, 256 × 160 matrix size)sequences.
PREPROCESSING OF MRI DATA AND DATA REDUCTIONPreprocessing of the T1-weighted images was done usingthe SPM8 package (http://www.fil.ion.ucl.ac.uk/spm) andthe VBM8 toolbox (http://dbm.neuro.uni-jena.de), runningunder MATLAB. All T1-weighted images were corrected forbias-field inhomogeneities, then spatially normalized andsegmented into gray matter (GM), white matter (WM), andcerebrospinal fluid (CSF) within the same generative model(Ashburner and Friston, 2005). The segmentation procedurewas extended by accounting for partial volume effects (Tohkaet al., 2004), by applying adaptive maximum a posteriori esti-mations (Rajapakse et al., 1997), and by using a hidden Markovrandom field model (Cuadra et al., 2005; Gaser, 2009). Theimages were processed with affine registration and smoothedwith 8-mm full-width-at-half-maximum smoothing kernels.Spatial resolution was set to 8 mm. For further data reduction,principal component analysis (PCA) was performed on thetraining sample with subsequently applying the estimatedtransformation parameters to the test sample. PCA was doneusing the “MATLAB Toolbox for Dimensionality Reduction”(http://homepage.tudelft.nl/19j49/Matlab_Toolbox_for_Dimensionality_Reduction.html), running under MATLAB.
AGE ESTIMATION FRAMEWORKThe BrainAGE framework utilizes a machine-learning patternrecognition method, namely relevance vector regression (RVR;Tipping, 2001). It was recently developed to estimate individualbrain ages based on T1-weighted images (Franke et al., 2010).In general, the model is trained with preprocessed whole brainstructural MRI data of the training sample (here: the IXI sam-ple). Subsequently, the brain age of each test subject can beestimated using the individual tissue-classified MRI data, aggre-gating the complex, multidimensional aging pattern across thewhole brain into one single value (Figure 1A). The differencebetween estimated and true chronological age will reveal the indi-vidual brain age gap estimation (BrainAGE) score. Consequently,the BrainAGE score directly quantifies the amount of accelera-tion or deceleration of brain aging. For example, if a 70 yearsold individual has a BrainAGE score of +5 years, this meansthat this individual shows the typical atrophy pattern of a 75
Frontiers in Aging Neuroscience www.frontiersin.org December 2013 | Volume 5 | Article 90 | 3

Franke et al. Advanced brain aging in diabetes
years old individual (Figure 1B). Recent work has demonstratedthat this method provides reliable and stable estimates (Frankeet al., 2012a). Specifically, the BrainAGE scores calculated fromtwo shortly delayed scans on the same MRI scanner, as well as onseparate 1.5T and 3.0T scanners, produced intraclass correlationcoefficients (ICC) of 0.93 and 0.90, respectively.
Within this study, the BrainAGE framework was applied usingthe linear combination of preprocessed (as described in the sec-tion “Preprocessing of MRI data and data reduction”) GM andWM images. For training the model as well as for predicting indi-vidual brain ages, we used “The Spider” (http://www.kyb.mpg.de/bs/people/spider/main.html), a freely available toolbox run-ning under MATLAB. For an illustration of the most importantfeatures (i.e., the importance of voxel locations for regression withage) that were used by the RVR to model normal brain aging andmore detailed information please refer to Franke et al. (2010).
STATISTICAL ANALYSISDescriptive statistics were used to summarize all variables.Demographic and laboratory data were compared betweenthe control and the DM groups using analysis of variance(ANOVA) for continuous variables or Kruskal–Wallis tests forcategorical variables and variables that were not normally dis-tributed. Normality was tested using Shapiro–Wilk tests. Cross-sectionally, within-group differences between estimated brain ageand chronological age were tested using Student’s t-test.
The effect of DM on BrainAGE was determined with ANOVA.The dependent variable was the BrainAGE score. Model effectsincluded group (i.e., DM and non-DM controls), hypertension(i.e., with/without hypertension), and gender.
Relationships between BrainAGE and clinical parameters werethen analyzed in the whole sample (i.e., DM and non-DM sub-jects together), controlling for age, gender, and diabetes duration(with diabetes duration = 0 years for non-DM controls). As notall subjects had values for all clinical variables, univariate correla-tion analyses were used (instead of multivariate models) to assessthe relationships between BrainAGE and distinguished lifestylemeasures (i.e., BMI, smoking duration, alcohol intake), clini-cal laboratory data (i.e., fasting blood glucose level, TNFα) andfunctional measures (i.e., T-score for verbal fluency, total GDSscore for depression). In order to control for covariates, Pearson’spairwise correlation were used for normally distributed variables,and Spearman’s correlations were used for variables that are notnormally distributed, with adjustment for age, gender, and dia-betes duration (right-tailed for verbal fluency, left-tailed for allothers). To control for multiple comparisons, Bonferroni–Holmcorrection (Holm, 1979) was applied, adjusting the p-value forthe number of variables analyzed (i.e., 7).
The effect of diabetes-status within the relationships betweenBrainAGE and lifestyle parameters, clinical laboratory data andoutcome measures were investigated by performing analysis ofcovariance (ANCOVA). Each specific ANCOVA included allthose subjects who were measured in each specific clinical vari-able, sub-grouped by DM. Since fasting blood glucose levelswere provided for only three non-DM control subjects, thisvariable was excluded from this analysis. For all other vari-ables, the model fitted separate lines for both groups, thus,
allowing the intercept as well as the slopes to vary between bothgroups.
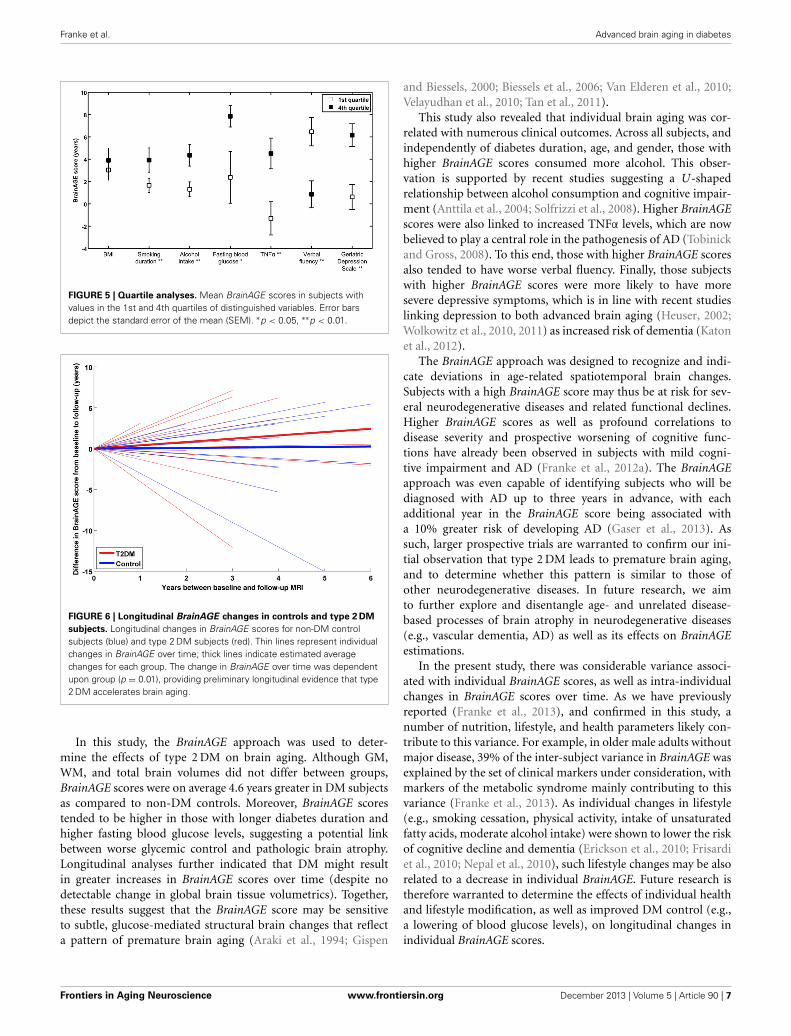
To further explore the relationship between BrainAGE andclinical parameters, the whole sample was divided into quartilesfor each of the significantly related lifestyle measures (i.e., smok-ing duration, alcohol intake), clinical laboratory data (i.e., fastingblood glucose level, TNFα), and outcome measures (i.e., ver-bal fluency, depression). To illustrate the relationships betweenindividual brain aging and extreme levels in each of these vari-ables, the BrainAGE scores in the 1st quartile (lowest 25% ofvalues) of each lifestyle and functionality measure were testedagainst the BrainAGE scores in 4th quartile (highest 25% of val-ues) of each lifestyle and functionality measure, using one-tailedt-tests (right-tailed for verbal fluency, left-tailed for all oth-ers). Bonferroni–Holm-adjusted p-values were used to determinesignificance.
Within the subsample that completed two MRI scans, thelongitudinal changes in individual BrainAGE scores were fittedagainst time between both scans with a multivariate linear regres-sion model. BrainAGE scores at baseline and follow-up visit, aswell as longitudinal changes in BrainAGE were compared betweenboth groups using ANOVA.
The Shapiro–Wilk test was performed using JMP 9.0 (www.
jmp.com). All other testing was performed using MATLAB 7.11.(www.mathworks.com).
RESULTSGROUP CHARACTERISTICSAll variables except diabetes duration, BMI, alcohol intake andGDS scores were normally distributed. Age, gender, GM, WM,and total brain volumes did not differ between groups (Table 1).The DM group had higher BMI (p < 0.0001), higher non-fastingblood glucose levels (p < 0.0001), greater prevalence of hyper-tension (p < 0.05), and worse performance in verbal fluency(p < 0.0001) than controls (Table 1).
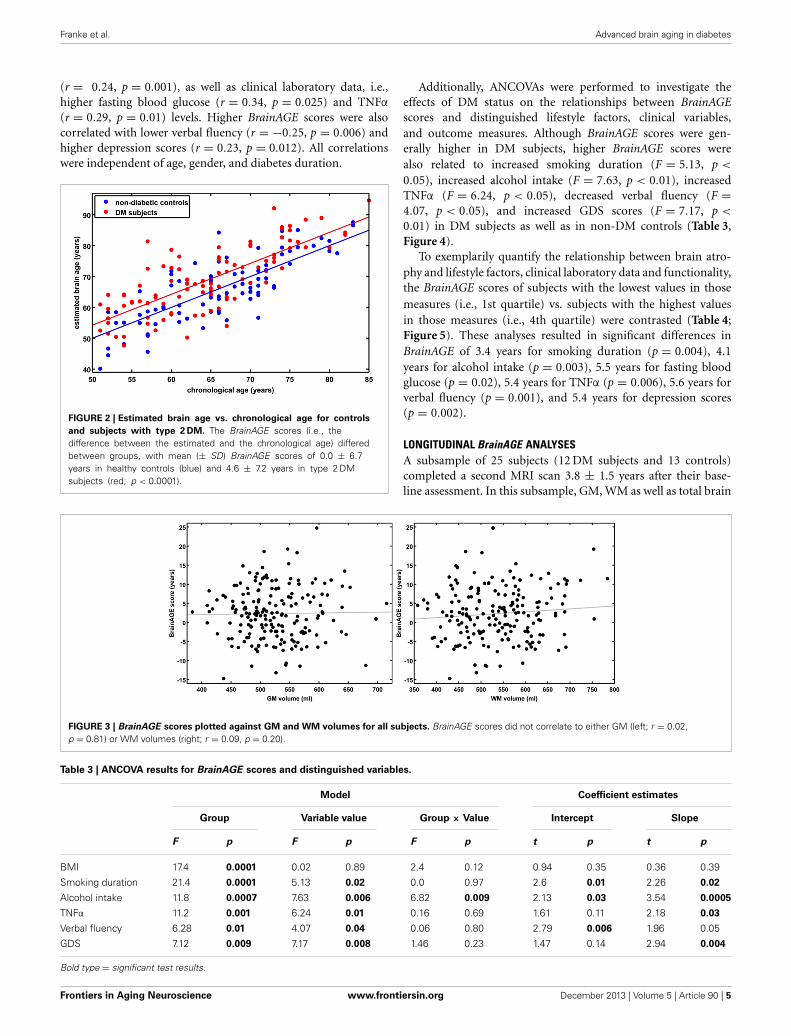
CROSS-SECTIONAL BrainAGE ANALYSESAlthough brain volumes did not differ between the groups, theDM subjects had significantly higher BrainAGE scores than con-trols (F = 17.2; p = 0.0001; Figure 2). Additionally, BrainAGEscores did not correlate to brain volumes (Figure 3). Within thecontrol group, estimated brain age was similar to chronologi-cal age [t(0.975, 86) = 0.0; p = 1.0]. In DM subjects, however, theaverage BrainAGE score was 4.6 years (SD = 7.2); i.e., their esti-mated brain age was 4.6 years greater than their chronologicalage [t(0.975, 97) = 6.4; p = 0.0001]. Additionally, within the DMgroup, those with longer diabetes duration had higher BrainAGEscores (r = 0.31, p = 0.019). This relationship was independentof age, gender, and duration of hypertension history.
Across all subjects, BrainAGE scores were higher in males ascompared to females (F = 7.7; p = 0.006). There were no effectsfor hypertension (F = 0.0; p = 0.9), or any interaction (group ∗hypertension: F = 0.6; p = 0.46; group ∗ gender: F = 0.7; p =0.41; hypertension ∗ gender: F = 0.1; p = 0.79).
Across all subjects, higher BrainAGE scores were signifi-cantly correlated with lifestyle factors, i.e., increased duration ofsmoking (r = 0.20, p = 0.007) and greater alcohol consumption
Frontiers in Aging Neuroscience www.frontiersin.org December 2013 | Volume 5 | Article 90 | 4
Franke et al. Advanced brain aging in diabetes
(r = 0.24, p = 0.001), as well as clinical laboratory data, i.e.,higher fasting blood glucose (r = 0.34, p = 0.025) and TNFα
(r = 0.29, p = 0.01) levels. Higher BrainAGE scores were alsocorrelated with lower verbal fluency (r = −0.25, p = 0.006) andhigher depression scores (r = 0.23, p = 0.012). All correlationswere independent of age, gender, and diabetes duration.
FIGURE 2 | Estimated brain age vs. chronological age for controls
and subjects with type 2 DM. The BrainAGE scores (i.e., thedifference between the estimated and the chronological age) differedbetween groups, with mean (± SD) BrainAGE scores of 0.0 ± 6.7years in healthy controls (blue) and 4.6 ± 7.2 years in type 2 DMsubjects (red; p < 0.0001).
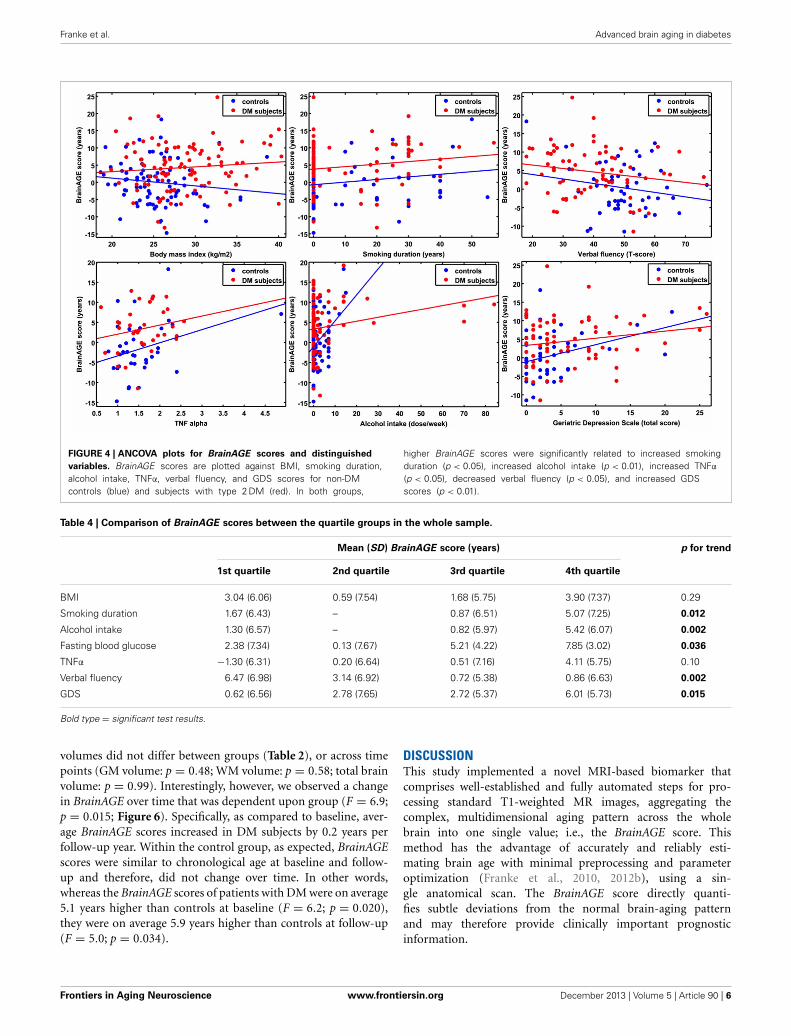
Additionally, ANCOVAs were performed to investigate theeffects of DM status on the relationships between BrainAGEscores and distinguished lifestyle factors, clinical variables,and outcome measures. Although BrainAGE scores were gen-erally higher in DM subjects, higher BrainAGE scores werealso related to increased smoking duration (F = 5.13, p <
0.05), increased alcohol intake (F = 7.63, p < 0.01), increasedTNFα (F = 6.24, p < 0.05), decreased verbal fluency (F =4.07, p < 0.05), and increased GDS scores (F = 7.17, p <
0.01) in DM subjects as well as in non-DM controls (Table 3,Figure 4).
To exemplarily quantify the relationship between brain atro-phy and lifestyle factors, clinical laboratory data and functionality,the BrainAGE scores of subjects with the lowest values in thosemeasures (i.e., 1st quartile) vs. subjects with the highest valuesin those measures (i.e., 4th quartile) were contrasted (Table 4;Figure 5). These analyses resulted in significant differences inBrainAGE of 3.4 years for smoking duration (p = 0.004), 4.1years for alcohol intake (p = 0.003), 5.5 years for fasting bloodglucose (p = 0.02), 5.4 years for TNFα (p = 0.006), 5.6 years forverbal fluency (p = 0.001), and 5.4 years for depression scores(p = 0.002).
LONGITUDINAL BrainAGE ANALYSESA subsample of 25 subjects (12 DM subjects and 13 controls)completed a second MRI scan 3.8 ± 1.5 years after their base-line assessment. In this subsample, GM, WM as well as total brain
FIGURE 3 | BrainAGE scores plotted against GM and WM volumes for all subjects. BrainAGE scores did not correlate to either GM (left; r = 0.02,p = 0.81) or WM volumes (right; r = 0.09, p = 0.20).
Table 3 | ANCOVA results for BrainAGE scores and distinguished variables.
Model Coefficient estimates
Group Variable value Group × Value Intercept Slope
F p F p F p t p t p
BMI 17.4 0.0001 0.02 0.89 2.4 0.12 0.94 0.35 0.36 0.39
Smoking duration 21.4 0.0001 5.13 0.02 0.0 0.97 2.6 0.01 2.26 0.02
Alcohol intake 11.8 0.0007 7.63 0.006 6.82 0.009 2.13 0.03 3.54 0.0005
TNFα 11.2 0.001 6.24 0.01 0.16 0.69 1.61 0.11 2.18 0.03
Verbal fluency 6.28 0.01 4.07 0.04 0.06 0.80 2.79 0.006 1.96 0.05
GDS 7.12 0.009 7.17 0.008 1.46 0.23 1.47 0.14 2.94 0.004
Bold type = significant test results.
Frontiers in Aging Neuroscience www.frontiersin.org December 2013 | Volume 5 | Article 90 | 5
Franke et al. Advanced brain aging in diabetes
FIGURE 4 | ANCOVA plots for BrainAGE scores and distinguished
variables. BrainAGE scores are plotted against BMI, smoking duration,alcohol intake, TNFα, verbal fluency, and GDS scores for non-DMcontrols (blue) and subjects with type 2 DM (red). In both groups,
higher BrainAGE scores were significantly related to increased smokingduration (p < 0.05), increased alcohol intake (p < 0.01), increased TNFα
(p < 0.05), decreased verbal fluency (p < 0.05), and increased GDSscores (p < 0.01).
Table 4 | Comparison of BrainAGE scores between the quartile groups in the whole sample.
Mean (SD) BrainAGE score (years) p for trend
1st quartile 2nd quartile 3rd quartile 4th quartile
BMI 3.04 (6.06) 0.59 (7.54) 1.68 (5.75) 3.90 (7.37) 0.29
Smoking duration 1.67 (6.43) – 0.87 (6.51) 5.07 (7.25) 0.012
Alcohol intake 1.30 (6.57) – 0.82 (5.97) 5.42 (6.07) 0.002
Fasting blood glucose 2.38 (7.34) 0.13 (7.67) 5.21 (4.22) 7.85 (3.02) 0.036
TNFα −1.30 (6.31) 0.20 (6.64) 0.51 (7.16) 4.11 (5.75) 0.10
Verbal fluency 6.47 (6.98) 3.14 (6.92) 0.72 (5.38) 0.86 (6.63) 0.002
GDS 0.62 (6.56) 2.78 (7.65) 2.72 (5.37) 6.01 (5.73) 0.015
Bold type = significant test results.
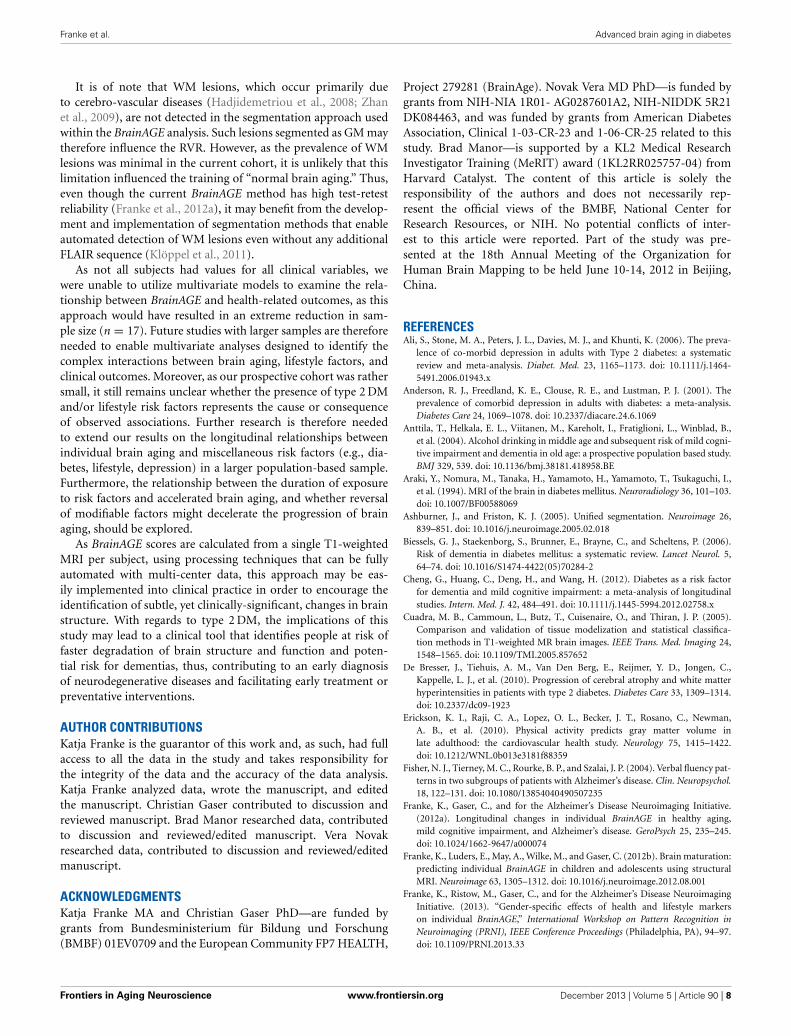
volumes did not differ between groups (Table 2), or across timepoints (GM volume: p = 0.48; WM volume: p = 0.58; total brainvolume: p = 0.99). Interestingly, however, we observed a changein BrainAGE over time that was dependent upon group (F = 6.9;p = 0.015; Figure 6). Specifically, as compared to baseline, aver-age BrainAGE scores increased in DM subjects by 0.2 years perfollow-up year. Within the control group, as expected, BrainAGEscores were similar to chronological age at baseline and follow-up and therefore, did not change over time. In other words,whereas the BrainAGE scores of patients with DM were on average5.1 years higher than controls at baseline (F = 6.2; p = 0.020),they were on average 5.9 years higher than controls at follow-up(F = 5.0; p = 0.034).
DISCUSSIONThis study implemented a novel MRI-based biomarker thatcomprises well-established and fully automated steps for pro-cessing standard T1-weighted MR images, aggregating thecomplex, multidimensional aging pattern across the wholebrain into one single value; i.e., the BrainAGE score. Thismethod has the advantage of accurately and reliably esti-mating brain age with minimal preprocessing and parameteroptimization (Franke et al., 2010, 2012b), using a sin-gle anatomical scan. The BrainAGE score directly quanti-fies subtle deviations from the normal brain-aging patternand may therefore provide clinically important prognosticinformation.
Frontiers in Aging Neuroscience www.frontiersin.org December 2013 | Volume 5 | Article 90 | 6
Franke et al. Advanced brain aging in diabetes
FIGURE 5 | Quartile analyses. Mean BrainAGE scores in subjects withvalues in the 1st and 4th quartiles of distinguished variables. Error barsdepict the standard error of the mean (SEM). ∗p < 0.05, ∗∗p < 0.01.
FIGURE 6 | Longitudinal BrainAGE changes in controls and type 2 DM
subjects. Longitudinal changes in BrainAGE scores for non-DM controlsubjects (blue) and type 2 DM subjects (red). Thin lines represent individualchanges in BrainAGE over time; thick lines indicate estimated averagechanges for each group. The change in BrainAGE over time was dependentupon group (p = 0.01), providing preliminary longitudinal evidence that type2 DM accelerates brain aging.
In this study, the BrainAGE approach was used to deter-mine the effects of type 2 DM on brain aging. Although GM,WM, and total brain volumes did not differ between groups,BrainAGE scores were on average 4.6 years greater in DM subjectsas compared to non-DM controls. Moreover, BrainAGE scorestended to be higher in those with longer diabetes duration andhigher fasting blood glucose levels, suggesting a potential linkbetween worse glycemic control and pathologic brain atrophy.Longitudinal analyses further indicated that DM might resultin greater increases in BrainAGE scores over time (despite nodetectable change in global brain tissue volumetrics). Together,these results suggest that the BrainAGE score may be sensitiveto subtle, glucose-mediated structural brain changes that reflecta pattern of premature brain aging (Araki et al., 1994; Gispen
and Biessels, 2000; Biessels et al., 2006; Van Elderen et al., 2010;Velayudhan et al., 2010; Tan et al., 2011).
This study also revealed that individual brain aging was cor-related with numerous clinical outcomes. Across all subjects, andindependently of diabetes duration, age, and gender, those withhigher BrainAGE scores consumed more alcohol. This obser-vation is supported by recent studies suggesting a U-shapedrelationship between alcohol consumption and cognitive impair-ment (Anttila et al., 2004; Solfrizzi et al., 2008). Higher BrainAGEscores were also linked to increased TNFα levels, which are nowbelieved to play a central role in the pathogenesis of AD (Tobinickand Gross, 2008). To this end, those with higher BrainAGE scoresalso tended to have worse verbal fluency. Finally, those subjectswith higher BrainAGE scores were more likely to have moresevere depressive symptoms, which is in line with recent studieslinking depression to both advanced brain aging (Heuser, 2002;Wolkowitz et al., 2010, 2011) as increased risk of dementia (Katonet al., 2012).
The BrainAGE approach was designed to recognize and indi-cate deviations in age-related spatiotemporal brain changes.Subjects with a high BrainAGE score may thus be at risk for sev-eral neurodegenerative diseases and related functional declines.Higher BrainAGE scores as well as profound correlations todisease severity and prospective worsening of cognitive func-tions have already been observed in subjects with mild cogni-tive impairment and AD (Franke et al., 2012a). The BrainAGEapproach was even capable of identifying subjects who will bediagnosed with AD up to three years in advance, with eachadditional year in the BrainAGE score being associated witha 10% greater risk of developing AD (Gaser et al., 2013). Assuch, larger prospective trials are warranted to confirm our ini-tial observation that type 2 DM leads to premature brain aging,and to determine whether this pattern is similar to those ofother neurodegenerative diseases. In future research, we aimto further explore and disentangle age- and unrelated disease-based processes of brain atrophy in neurodegenerative diseases(e.g., vascular dementia, AD) as well as its effects on BrainAGEestimations.
In the present study, there was considerable variance associ-ated with individual BrainAGE scores, as well as intra-individualchanges in BrainAGE scores over time. As we have previouslyreported (Franke et al., 2013), and confirmed in this study, anumber of nutrition, lifestyle, and health parameters likely con-tribute to this variance. For example, in older male adults withoutmajor disease, 39% of the inter-subject variance in BrainAGE wasexplained by the set of clinical markers under consideration, withmarkers of the metabolic syndrome mainly contributing to thisvariance (Franke et al., 2013). As individual changes in lifestyle(e.g., smoking cessation, physical activity, intake of unsaturatedfatty acids, moderate alcohol intake) were shown to lower the riskof cognitive decline and dementia (Erickson et al., 2010; Frisardiet al., 2010; Nepal et al., 2010), such lifestyle changes may be alsorelated to a decrease in individual BrainAGE. Future research istherefore warranted to determine the effects of individual healthand lifestyle modification, as well as improved DM control (e.g.,a lowering of blood glucose levels), on longitudinal changes inindividual BrainAGE scores.
Frontiers in Aging Neuroscience www.frontiersin.org December 2013 | Volume 5 | Article 90 | 7
Franke et al. Advanced brain aging in diabetes
It is of note that WM lesions, which occur primarily dueto cerebro-vascular diseases (Hadjidemetriou et al., 2008; Zhanet al., 2009), are not detected in the segmentation approach usedwithin the BrainAGE analysis. Such lesions segmented as GM maytherefore influence the RVR. However, as the prevalence of WMlesions was minimal in the current cohort, it is unlikely that thislimitation influenced the training of “normal brain aging.” Thus,even though the current BrainAGE method has high test-retestreliability (Franke et al., 2012a), it may benefit from the develop-ment and implementation of segmentation methods that enableautomated detection of WM lesions even without any additionalFLAIR sequence (Klöppel et al., 2011).
As not all subjects had values for all clinical variables, wewere unable to utilize multivariate models to examine the rela-tionship between BrainAGE and health-related outcomes, as thisapproach would have resulted in an extreme reduction in sam-ple size (n = 17). Future studies with larger samples are thereforeneeded to enable multivariate analyses designed to identify thecomplex interactions between brain aging, lifestyle factors, andclinical outcomes. Moreover, as our prospective cohort was rathersmall, it still remains unclear whether the presence of type 2 DMand/or lifestyle risk factors represents the cause or consequenceof observed associations. Further research is therefore neededto extend our results on the longitudinal relationships betweenindividual brain aging and miscellaneous risk factors (e.g., dia-betes, lifestyle, depression) in a larger population-based sample.Furthermore, the relationship between the duration of exposureto risk factors and accelerated brain aging, and whether reversalof modifiable factors might decelerate the progression of brainaging, should be explored.
As BrainAGE scores are calculated from a single T1-weightedMRI per subject, using processing techniques that can be fullyautomated with multi-center data, this approach may be eas-ily implemented into clinical practice in order to encourage theidentification of subtle, yet clinically-significant, changes in brainstructure. With regards to type 2 DM, the implications of thisstudy may lead to a clinical tool that identifies people at risk offaster degradation of brain structure and function and poten-tial risk for dementias, thus, contributing to an early diagnosisof neurodegenerative diseases and facilitating early treatment orpreventative interventions.
AUTHOR CONTRIBUTIONSKatja Franke is the guarantor of this work and, as such, had fullaccess to all the data in the study and takes responsibility forthe integrity of the data and the accuracy of the data analysis.Katja Franke analyzed data, wrote the manuscript, and editedthe manuscript. Christian Gaser contributed to discussion andreviewed manuscript. Brad Manor researched data, contributedto discussion and reviewed/edited manuscript. Vera Novakresearched data, contributed to discussion and reviewed/editedmanuscript.
ACKNOWLEDGMENTSKatja Franke MA and Christian Gaser PhD—are funded bygrants from Bundesministerium für Bildung und Forschung(BMBF) 01EV0709 and the European Community FP7 HEALTH,
Project 279281 (BrainAge). Novak Vera MD PhD—is funded bygrants from NIH-NIA 1R01- AG0287601A2, NIH-NIDDK 5R21DK084463, and was funded by grants from American DiabetesAssociation, Clinical 1-03-CR-23 and 1-06-CR-25 related to thisstudy. Brad Manor—is supported by a KL2 Medical ResearchInvestigator Training (MeRIT) award (1KL2RR025757-04) fromHarvard Catalyst. The content of this article is solely theresponsibility of the authors and does not necessarily rep-resent the official views of the BMBF, National Center forResearch Resources, or NIH. No potential conflicts of inter-est to this article were reported. Part of the study was pre-sented at the 18th Annual Meeting of the Organization forHuman Brain Mapping to be held June 10-14, 2012 in Beijing,China.
REFERENCESAli, S., Stone, M. A., Peters, J. L., Davies, M. J., and Khunti, K. (2006). The preva-
lence of co-morbid depression in adults with Type 2 diabetes: a systematicreview and meta-analysis. Diabet. Med. 23, 1165–1173. doi: 10.1111/j.1464-5491.2006.01943.x
Anderson, R. J., Freedland, K. E., Clouse, R. E., and Lustman, P. J. (2001). Theprevalence of comorbid depression in adults with diabetes: a meta-analysis.Diabetes Care 24, 1069–1078. doi: 10.2337/diacare.24.6.1069
Anttila, T., Helkala, E. L., Viitanen, M., Kareholt, I., Fratiglioni, L., Winblad, B.,et al. (2004). Alcohol drinking in middle age and subsequent risk of mild cogni-tive impairment and dementia in old age: a prospective population based study.BMJ 329, 539. doi: 10.1136/bmj.38181.418958.BE
Araki, Y., Nomura, M., Tanaka, H., Yamamoto, H., Yamamoto, T., Tsukaguchi, I.,et al. (1994). MRI of the brain in diabetes mellitus. Neuroradiology 36, 101–103.doi: 10.1007/BF00588069
Ashburner, J., and Friston, K. J. (2005). Unified segmentation. Neuroimage 26,839–851. doi: 10.1016/j.neuroimage.2005.02.018
Biessels, G. J., Staekenborg, S., Brunner, E., Brayne, C., and Scheltens, P. (2006).Risk of dementia in diabetes mellitus: a systematic review. Lancet Neurol. 5,64–74. doi: 10.1016/S1474-4422(05)70284-2
Cheng, G., Huang, C., Deng, H., and Wang, H. (2012). Diabetes as a risk factorfor dementia and mild cognitive impairment: a meta-analysis of longitudinalstudies. Intern. Med. J. 42, 484–491. doi: 10.1111/j.1445-5994.2012.02758.x
Cuadra, M. B., Cammoun, L., Butz, T., Cuisenaire, O., and Thiran, J. P. (2005).Comparison and validation of tissue modelization and statistical classifica-tion methods in T1-weighted MR brain images. IEEE Trans. Med. Imaging 24,1548–1565. doi: 10.1109/TMI.2005.857652
De Bresser, J., Tiehuis, A. M., Van Den Berg, E., Reijmer, Y. D., Jongen, C.,Kappelle, L. J., et al. (2010). Progression of cerebral atrophy and white matterhyperintensities in patients with type 2 diabetes. Diabetes Care 33, 1309–1314.doi: 10.2337/dc09-1923
Erickson, K. I., Raji, C. A., Lopez, O. L., Becker, J. T., Rosano, C., Newman,A. B., et al. (2010). Physical activity predicts gray matter volume inlate adulthood: the cardiovascular health study. Neurology 75, 1415–1422.doi: 10.1212/WNL.0b013e3181f88359
Fisher, N. J., Tierney, M. C., Rourke, B. P., and Szalai, J. P. (2004). Verbal fluency pat-terns in two subgroups of patients with Alzheimer’s disease. Clin. Neuropsychol.18, 122–131. doi: 10.1080/13854040490507235
Franke, K., Gaser, C., and for the Alzheimer’s Disease Neuroimaging Initiative.(2012a). Longitudinal changes in individual BrainAGE in healthy aging,mild cognitive impairment, and Alzheimer’s disease. GeroPsych 25, 235–245.doi: 10.1024/1662-9647/a000074
Franke, K., Luders, E., May, A., Wilke, M., and Gaser, C. (2012b). Brain maturation:predicting individual BrainAGE in children and adolescents using structuralMRI. Neuroimage 63, 1305–1312. doi: 10.1016/j.neuroimage.2012.08.001
Franke, K., Ristow, M., Gaser, C., and for the Alzheimer’s Disease NeuroimagingInitiative. (2013). “Gender-specific effects of health and lifestyle markerson individual BrainAGE,” International Workshop on Pattern Recognition inNeuroimaging (PRNI), IEEE Conference Proceedings (Philadelphia, PA), 94–97.doi: 10.1109/PRNI.2013.33
Frontiers in Aging Neuroscience www.frontiersin.org December 2013 | Volume 5 | Article 90 | 8
Franke et al. Advanced brain aging in diabetes
Franke, K., Ziegler, G., Klöppel, S., Gaser, C., and the Alzheimer’s DiseaseNeuroimaging Initiative. (2010). Estimating the age of healthy subjects from T1-weighted MRI scans using kernel methods: exploring the influence of variousparameters. Neuroimage 50, 883–892. doi: 10.1016/j.neuroimage.2010.01.005
Frisardi, V., Panza, F., Seripa, D., Imbimbo, B. P., Vendemiale, G., Pilotto, A.,et al. (2010). Nutraceutical properties of Mediterranean diet and cognitivedecline: possible underlying mechanisms. J. Alzheimers Dis. 22, 715–740. doi:10.3233/JAD-2010-100942
Gaser, C. (2009). Partial volume segmentation with adaptive maximum a posteriori(MAP) approach. Neuroimage 47, S121. doi: 10.1016/S1053-8119(09)71151-6
Gaser, C., Franke, K., Kloppel, S., Koutsouleris, N., and Sauer, H. (2013). BrainAGEin mild cognitive impaired patients: predicting the conversion to Alzheimer’sDisease. PLoS ONE 8:e67346. doi: 10.1371/journal.pone.0067346
Gispen, W. H., and Biessels, G. J. (2000). Cognition and synaptic plastic-ity in diabetes mellitus. Trends Neurosci. 23, 542–549. doi: 10.1016/S0166-2236(00)01656-8
Good, C. D., Johnsrude, I. S., Ashburner, J., Henson, R. N., Friston, K.J., and Frackowiak, R. S. (2001). A voxel-based morphometric study ofageing in 465 normal adult human brains. Neuroimage 14, 21–36. doi:10.1006/nimg.2001.0786
Hadjidemetriou, S., Lorenzen, P., Schuff, N., Mueller, S., and Weiner, M. (2008).Computational atlases of severity of white matter lesions in elderly subjects withMRI. Med. Image Comput. Comput. Assist. Interv. 11, 450–458. doi: 10.1007/978-3-540-85988-8_54
Harrison, J. E., Buxton, P., Husain, M., and Wise, R. (2000). Short test of seman-tic and phonological fluency: normal performance, validity and test-retestreliability. Br. J. Clin. Psychol. 39, 181–191. doi: 10.1348/014466500163202
Heuser, I. (2002). Depression, endocrinologically a syndrome of premature aging?Maturitas 41(Suppl. 1), S19–S23. doi: 10.1016/S0378-5122(02)00012-9
Holm, S. (1979). A simple sequentially rejective multiple test procedure. Scand. J.Statist. 6, 65–70.
Janson, J., Laedtke, T., Parisi, J. E., O’brien, P., Petersen, R. C., and Butler, P. C.(2004). Increased risk of type 2 diabetes in Alzheimer disease. Diabetes 53,474–481. doi: 10.2337/diabetes.53.2.474
Katon, W., Lyles, C. R., Parker, M. M., Karter, A. J., Huang, E. S., and Whitmer, R.A. (2012). Association of depression with increased risk of dementia in patientswith type 2 diabetes: the diabetes and aging study. Arch. Gen. Psychiatry 69,410–417. doi: 10.1001/archgenpsychiatry.2011.154
Klöppel, S., Abdulkadir, A., Hadjidemetriou, S., Issleib, S., Frings, L., Thanh,T. N., et al. (2011). A comparison of different automated methods for thedetection of white matter lesions in MRI data. Neuroimage 57, 416–422. doi:10.1016/j.neuroimage.2011.04.053
Last, D., Alsop, D. C., Abduljalil, A. M., Marquis, R. P., De Bazelaire, C., Hu,K., et al. (2007). Global and regional effects of type 2 diabetes on brain tis-sue volumes and cerebral vasoreactivity. Diabetes Care 30, 1193–1199. doi:10.2337/dc06-2052
Nepal, B., Brown, L., and Ranmuthugala, G. (2010). Modelling the impact ofmodifying lifestyle risk factors on dementia prevalence in Australian popula-tion aged 45 years and over, 2006–2051. Australas. J. Ageing 29, 111–116. doi:10.1111/j.1741-6612.2010.00392.x
Novak, V., Zhao, P., Manor, B., Sejdic, E., Alsop, D., Abduljalil, A., et al. (2011).Adhesion molecules, altered vasoreactivity, and brain atrophy in type 2 diabetes.Diabetes Care 34, 2438–2441. doi: 10.2337/dc11-0969
Rajapakse, J. C., Giedd, J. N., and Rapoport, J. L. (1997). Statistical approach tosegmentation of single-channel cerebral MR images. IEEE Trans. Med. Imaging16, 176–186. doi: 10.1109/42.563663
Reijmer, Y. D., Van Den Berg, E., De Bresser, J., Kessels, R. P., Kappelle, L. J., Algra,A., et al. (2011). Accelerated cognitive decline in patients with type 2 diabetes:MRI correlates and risk factors. Diabetes Metab. Res. Rev. 27, 195–202. doi:10.1002/dmrr.1163
Schmidt, R., Launer, L. J., Nilsson, L. G., Pajak, A., Sans, S., Berger, K., et al.(2004). Magnetic resonance imaging of the brain in diabetes: the CardiovascularDeterminants of Dementia (CASCADE) Study. Diabetes 53, 687–692. doi:10.2337/diabetes.53.3.687
Schölkopf, B., and Smola, A. (2002). Learning with Kernels: Support VectorMachines, Regularization, Optimization, and Beyond. Cambridge, MA: MITPress.
Solfrizzi, V., Capurso, C., D’introno, A., Colacicco, A. M., Santamato, A., Ranieri,M., et al. (2008). Lifestyle-related factors in predementia and dementia syn-dromes. Expert Rev. Neurother. 8, 133–158. doi: 10.1586/14737175.8.1.133
Stewart, R., and Liolitsa, D. (1999). Type 2 diabetes mellitus, cognitive impairmentand dementia. Diabet. Med. 16, 93–112. doi: 10.1046/j.1464-5491.1999.00027.x
Tan, Z. S., Beiser, A. S., Fox, C. S., Au, R., Himali, J. J., Debette, S., et al. (2011).Association of metabolic dysregulation with volumetric brain magnetic reso-nance imaging and cognitive markers of subclinical brain aging in middle-agedadults: the Framingham offspring study. Diabetes Care 34, 1766–1770. doi:10.2337/dc11-0308
Tipping, M. E. (2001). Sparse bayesian learning and the relevance vector machine.J. Mach. Learn. Res. 1, 211–244. doi: 10.1162/15324430152748236
Tobinick, E. L., and Gross, H. (2008). Rapid improvement in verbal fluency andaphasia following perispinal etanercept in Alzheimer’s disease. BMC Neurol.8:27. doi: 10.1186/1471-2377-8-27
Tohka, J., Zijdenbos, A., and Evans, A. (2004). Fast and robust parameter estimationfor statistical partial volume models in brain MRI. Neuroimage 23, 84–97. doi:10.1016/j.neuroimage.2004.05.007
Tomlinson, D. R., and Gardiner, N. J. (2008). Glucose neurotoxicity. Nat. Rev.Neurosci. 9, 36–45. doi: 10.1038/nrn2294
Van Elderen, S. G., De Roos, A., De Craen, A. J., Westendorp, R. G., Blauw, G.J., Jukema, J. W., et al. (2010). Progression of brain atrophy and cognitivedecline in diabetes mellitus: a 3-year follow-up. Neurology 75, 997–1002. doi:10.1212/WNL.0b013e3181f25f06
Velayudhan, L., Poppe, M., Archer, N., Proitsi, P., Brown, R. G., and Lovestone, S.(2010). Risk of developing dementia in people with diabetes and mild cognitiveimpairment. Br. J. Psychiatry 196, 36–40. doi: 10.1192/bjp.bp.109.067942
Wolkowitz, O. M., Epel, E. S., Reus, V. I., and Mellon, S. H. (2010). Depressiongets old fast: do stress and depression accelerate cell aging? Depress. Anxiety 27,327–338. doi: 10.1002/da.20686
Wolkowitz, O. M., Reus, V. I., and Mellon, S. H. (2011). Of sound mind and body:depression, disease, and accelerated aging. Dialogues Clin. Neurosci. 13, 25–39.doi: 10.1002/da.20686
Xu, W. L., Qiu, C. X., Wahlin, A., Winblad, B., and Fratiglioni, L. (2004). Diabetesmellitus and risk of dementia in the Kungsholmen project: a 6-year follow-upstudy. Neurology 63, 1181–1186. doi: 10.1212/01.WNL.0000140291.86406.D1
Yesavage, J. A. (1988). Geriatric depression scale. Psychopharmacol. Bull. 24,709–711.
Zhan, W., Zhang, Y., Mueller, S. G., Lorenzen, P., Hadjidemetriou, S., Schuff, N.,et al. (2009). Characterization of white matter degeneration in elderly subjectsby magnetic resonance diffusion and FLAIR imaging correlation. Neuroimage47(Suppl. 2), T58–T65. doi: 10.1016/j.neuroimage.2009.02.004
Zimmet, P., Alberti, K. G., and Shaw, J. (2001). Global and societal implications ofthe diabetes epidemic. Nature 414, 782–787. doi: 10.1038/414782a
Conflict of Interest Statement: The authors declare that the research was con-ducted in the absence of any commercial or financial relationships that could beconstrued as a potential conflict of interest.
Received: 13 August 2013; accepted: 22 November 2013; published online: 17 December2013.Citation: Franke K, Gaser C, Manor B and Novak V (2013) Advanced BrainAGE inolder adults with type 2 diabetes mellitus. Front. Aging Neurosci. 5:90. doi: 10.3389/fnagi.2013.00090This article was submitted to the journal Frontiers in Aging Neuroscience.Copyright © 2013 Franke, Gaser, Manor and Novak. This is an open-access articledistributed under the terms of the Creative Commons Attribution License (CC BY).The use, distribution or reproduction in other forums is permitted, provided theoriginal author(s) or licensor are credited and that the original publication in thisjournal is cited, in accordance with accepted academic practice. No use, distribution orreproduction is permitted which does not comply with these terms.
Frontiers in Aging Neuroscience www.frontiersin.org December 2013 | Volume 5 | Article 90 | 9

![Diabetes Mellitus in Older Adults - Joslin Diabetes · PDF fileMicrosoft PowerPoint - Slides 16 Diabetes in Older Adults Munshi.ppt [Compatibility Mode]](https://img.pdfslide.net/doc/110x75/5a7d0c567f8b9ae9398d5a40/diabetes-mellitus-in-older-adults-joslin-diabetes-powerpoint-slides-16-diabetes.jpg)