Embed Size (px)
Citation preview
Advanced Corporate Finance
7. Investor behavior and capital market efficiency
Objectives of the session
1. So far => analysis of company value, of projects and of derivatives. Intuitively => Important to value stock prices
2. Help to determine the price of stocks or shares
3. If everybody has the same set of assumptions, is it possible to “beat the market”?
4. In this session, we will review the three forms of market efficiency (weak, semi-strong and strong) and their implications
5. We will also see a series of empirical analysis supporting or not the notion of market efficiency
6. We will discuss investor behavior
|2
Notions of Market Efficiency
• An Efficient market is one in which:
– Arbitrage is disallowed: rules out free lunches
– Purchase or sale of a security at the prevailing market price is never a positive NPV transaction
– Prices reveal information
• Three forms of Market Efficiency
(a) Weak Form Efficiency
• Prices reflect all information in the past record of stock prices
(b) Semi-strong Form Efficiency
• Prices reflect all publicly available information
(c) Strong form Efficiency
• Price reflect all information
|3
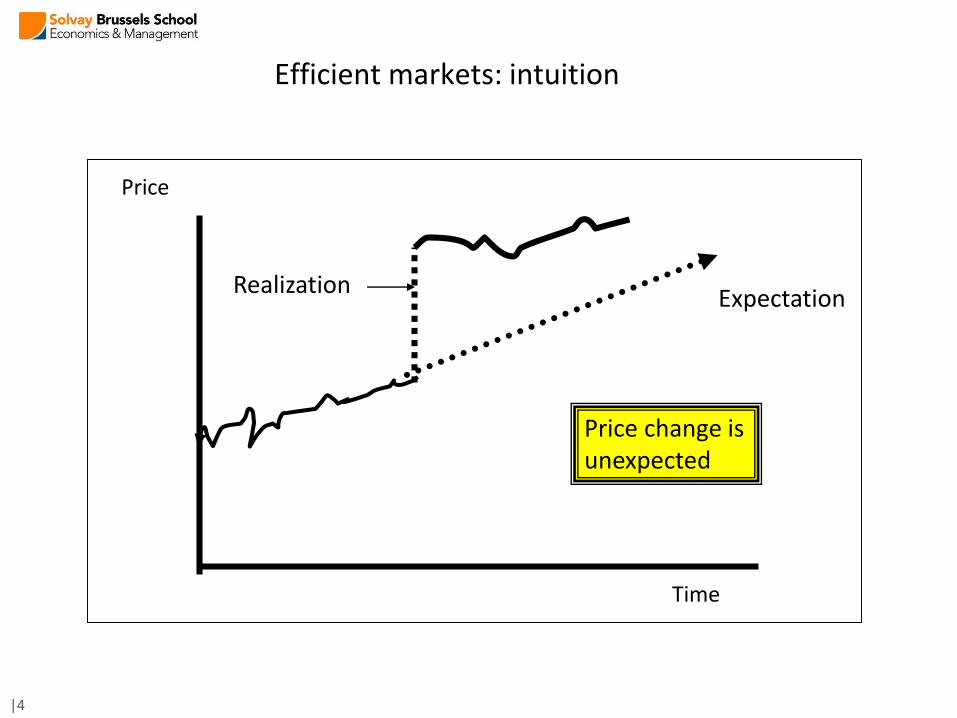
Efficient markets: intuition
Expectation
Time
Price
Realization
Price change is unexpected
|4
Weak Form Efficiency
• Random-walk model:
– Pt -Pt-1 = Pt-1 * (Expected return) + Random error
– Expected value (Random error) = 0
– Random error of period t unrelated to random component of any past period
• Implication:
– Expected value (Pt) = Pt-1 * (1 + Expected return)
– Technical analysis: useless
• Empirical evidence: serial correlation
– Correlation coefficient between current return and some past return
– Serial correlation = Cor (Rt, Rt-s)
|5
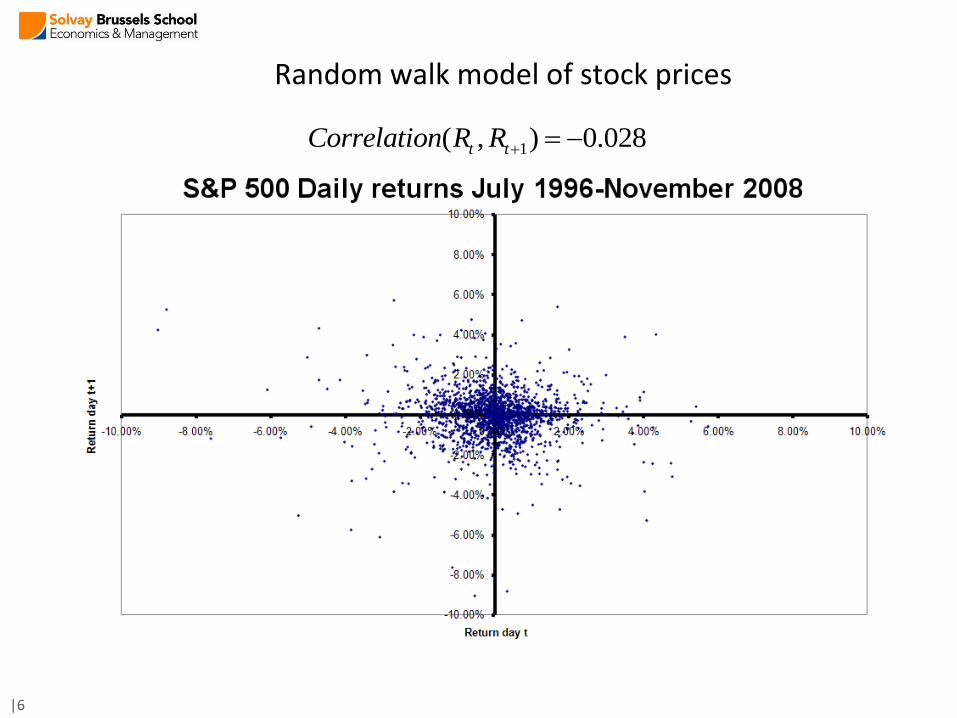
Random walk model of stock prices
1( , ) 0.028t tCorrelation R R
|6
Semi-strong Form Efficiency
• Prices reflect all publicly available information
• Empirical evidence: Event studies (MacKinlay, 1997)
– Test whether the release of information influences returns and when this influence takes place
– Abnormal return AR : ARt = Rt – Rmarket,t
– Cumulative abnormal return:
CARt = ARt0 + ARt0+1 + ARt0+2 +... + ARt0+n
where t0 is the announcement date
|7
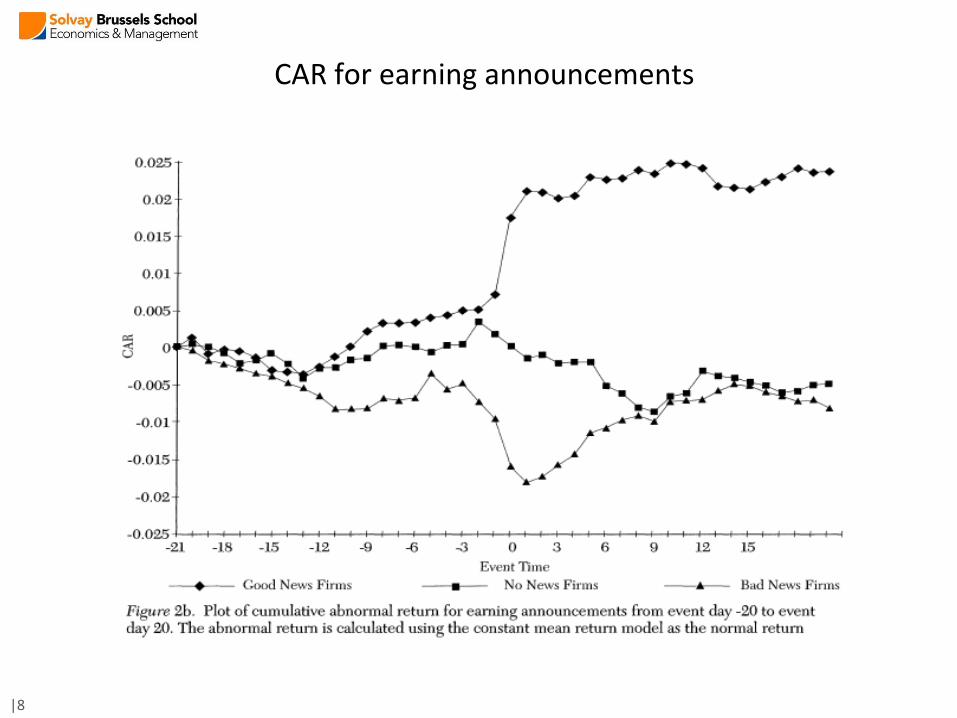
CAR for earning announcements
|8
Semi-strong form of efficiency
• How do professional portfolio managers perform?
• Jensen (1968): Mutual funds do not generate abnormal returns
• Rfund - Rf = + (RM - Rf)
• Insider trading: Insiders do seem to generate abnormal returns
(should cover their information acquisition activities)
|9
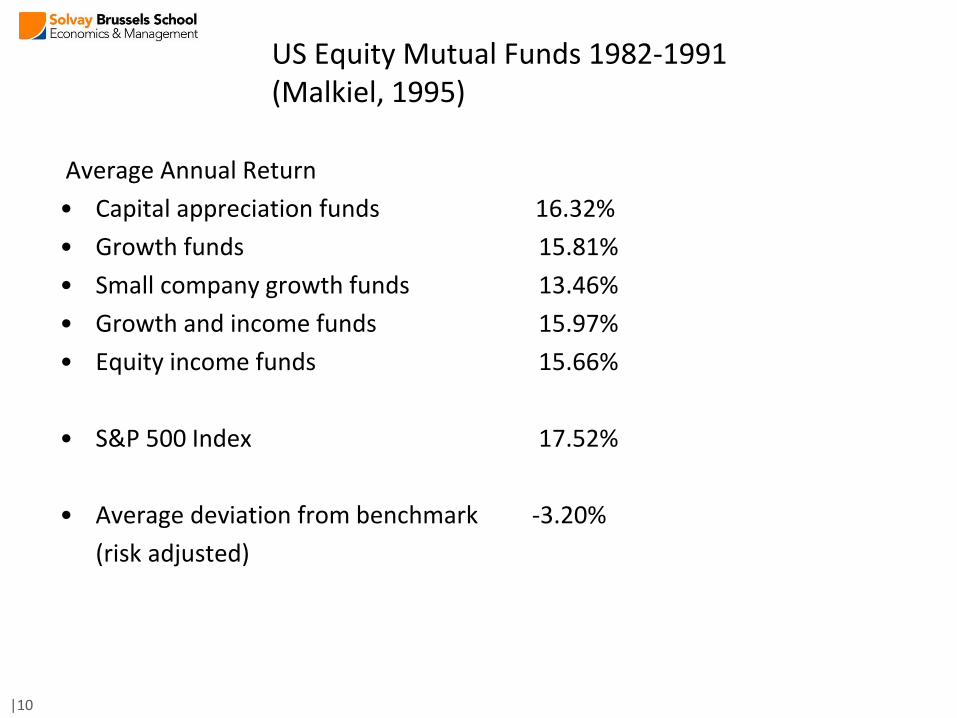
US Equity Mutual Funds 1982-1991(Malkiel, 1995)
Average Annual Return
• Capital appreciation funds 16.32%
• Growth funds 15.81%
• Small company growth funds 13.46%
• Growth and income funds 15.97%
• Equity income funds 15.66%
• S&P 500 Index 17.52%
• Average deviation from benchmark -3.20%
(risk adjusted)
|10
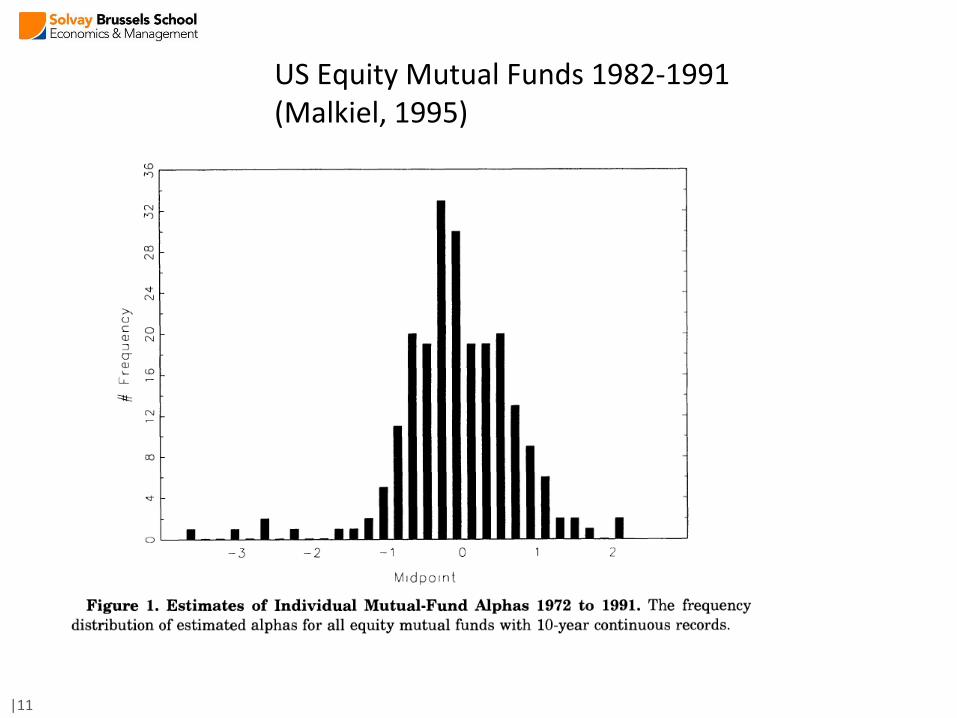
US Equity Mutual Funds 1982-1991(Malkiel, 1995)
|11
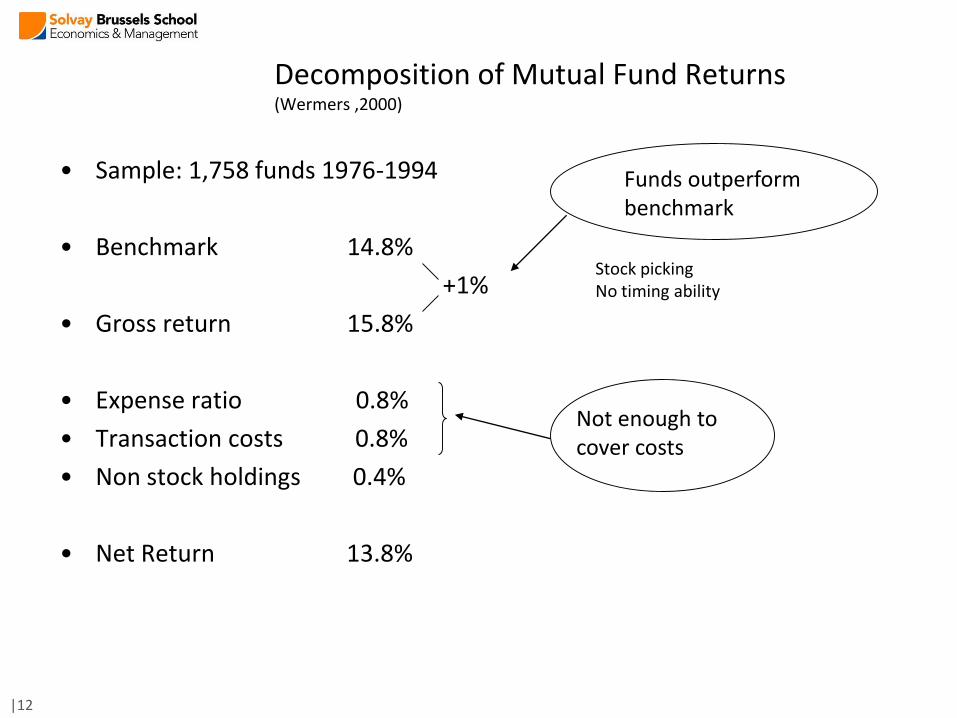
Decomposition of Mutual Fund Returns(Wermers ,2000)
• Sample: 1,758 funds 1976-1994
• Benchmark 14.8%
+1%
• Gross return 15.8%
• Expense ratio 0.8%
• Transaction costs 0.8%
• Non stock holdings 0.4%
• Net Return 13.8%
Stock picking No timing ability
Funds outperform benchmark
Not enough to cover costs
|12
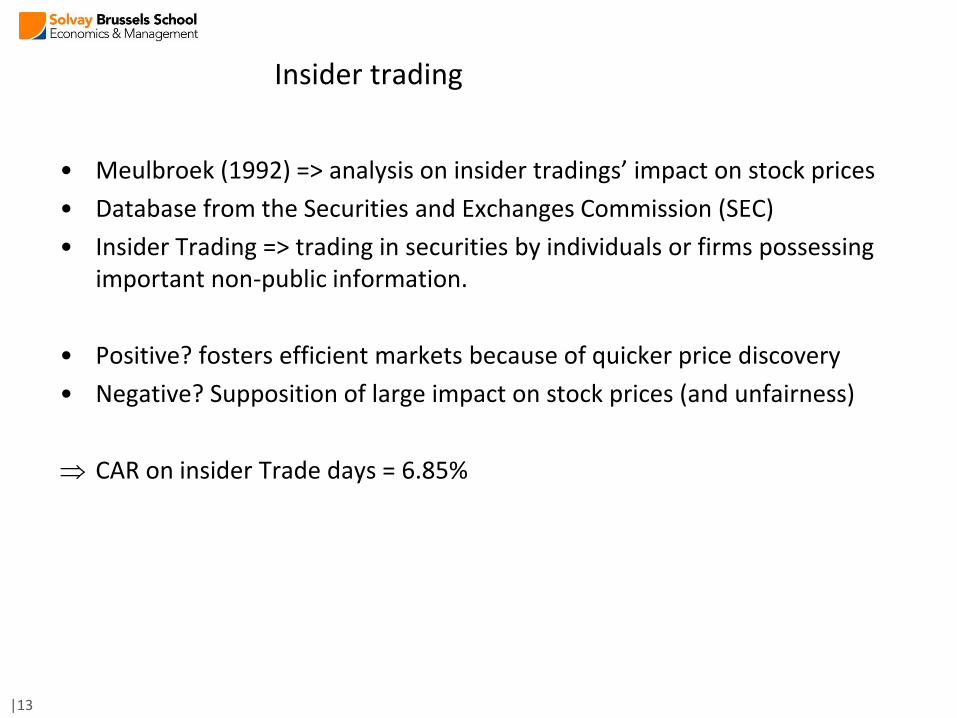
Insider trading
• Meulbroek (1992) => analysis on insider tradings’ impact on stock prices
• Database from the Securities and Exchanges Commission (SEC)
• Insider Trading => trading in securities by individuals or firms possessing important non-public information.
• Positive? fosters efficient markets because of quicker price discovery
• Negative? Supposition of large impact on stock prices (and unfairness)
CAR on insider Trade days = 6.85%
|13
What moves the market?
• Who knows?
• Lot of noise:
– 1985-1990: 120 days with |DJ| > 5%
• 28 cases (1/4) identified with specific event
(Siegel Stocks for the Long Run Irwin 1994, p 184)
– Orange juice futures (Roll 1984)
• 90% of the day-to-day variability cannot be explained by fundamentals
• Financial journalists?
|14
In practice what do we see?
• In theory, investors should hold the market portfolio
• But in practice??? Campbell, Calvet, Sodini (2009) for Swedish data:
– Real estate 70% of assets;
– Bank deposits and money 11%,
– Stocks and mutual funds 6%,
– Bonds, derivatives, capital insurance for the remainder
|15
In practice what do we see?
Underdiversification (concentration of investments in stocks from companies in the same industry or same region, especially importance of investments in the company where people work)
– Median of number of individual stocks held = 3
Large number of stocks from the employer
– Example: Coca-Cola in Benartzi (2001) => 90% of allocation of retirement saving plans in the Cy, on top of that 76% of employees’ discretionary amount!
Intensive trade habits
|16

Trading Is Hazardous to Your Wealth(Barber and Odean, 2000)
• Sample: trading activity of 78,000 households 1991-1997
• Main conclusions:
1. Average household underperforms benchmark by 1.1% annually
2. Trading reduces net annualized mean returns
Infrequent traders: 18.5% Frequent traders: 11.4%
3. Households trade frequently (75% annual turnover)
4. Trading costs are high: for average round-trip trade 4%
(Commissions 3%, bid-ask spread 1%)
|17
Potential explanations
• Huberman (2001):
– Home bias see French and Poterba (1991): US, Japan, UK all have over 90% of domestic ownership!
• Barber and Odean (2001)
– Greater overconfidence => greater trading => greater costs and lower performance
– Proxy for overconfidence? Gender?
– Men => more time and money on security analysis, more present in the financial sector, less likely to listen to brokers
– If men overconfident then one would expect :
• Men trade more than women
• By trading more they hurt their performance
|18
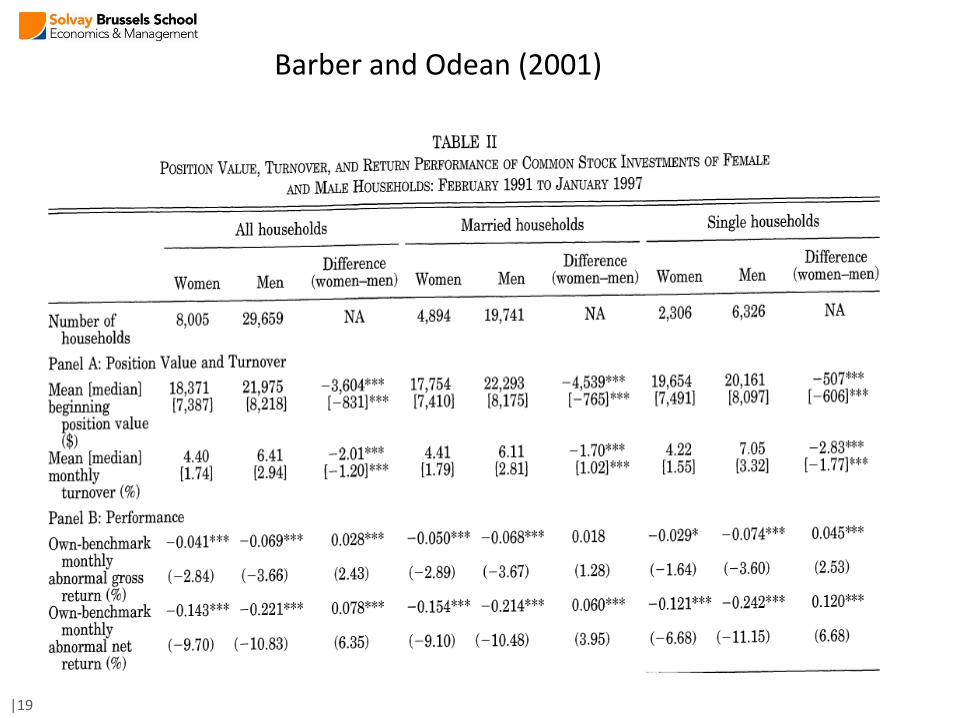
Barber and Odean (2001)
|19
Barber and Odean (2001)
• Other observations
• Impact of marriage
• Women => less risky assets
• Young and Single => more volatile portfolios with more volatile stocks, more likely to invest in small stocks, more willing to accept market risk
• Higher incomes => more willing to accept market risk
|20
Stock market participation?
• Surprisingly few people invest in stock => 50% in the US, less in Europe
• Reasons advanced => costs
• Alternatively, people may not perceive the benefits
• Does cognitive ability play a role?
• Grinblatt, Keloharju and Linnainmaa (2011)
– Participation and diversification decisions positively linked to IQ (even when using many controls)
– IQ influences trading behavior, performance and transaction costs => More diversification, superior market timing and stock picking
|21
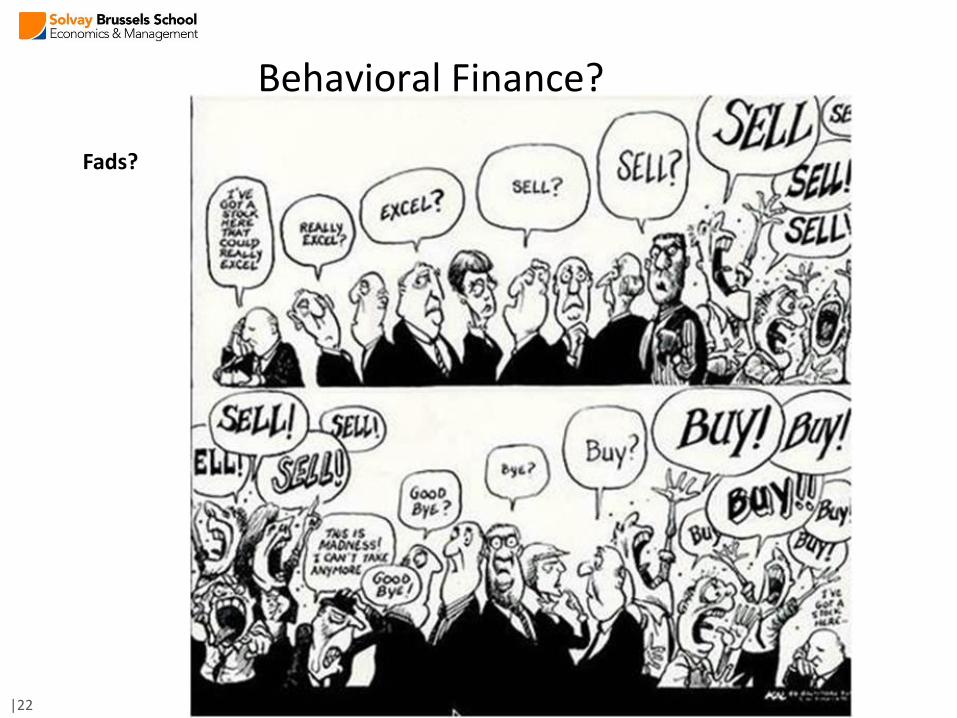
Fads?
|22
Behavioral Finance?
Mood?
• May traders’ mood influence stock market prices?
• Edmans, Garcia and Norli (2007) => look at 39 countries and results from World Cups (Soccer, cricket, ice hockey, basketball and rugby)
• Most important effects associated to soccer:
– Loss reduces next day return => loss in World Cup elimination stage, linked to a 49 bp negative abnormal return
– Impact more important for small stocks (known to be disproportionately held by nationals)
|23
• Other elements may influence mood…
• Hirshleifer and Shumway (2003): impact of sunlight on markets– Sunlight would affect mood positively, bring agents to view the world
more favorably and as consequence lead to a more bullish than usual market
– Conclusion: strong correlation between sunshine and stock returns (none for snow and rain when controlling for sunshine)
• Other studies: disruption of sleep patterns, lunar cycles, temperature…
|24
Mood?
Market efficiency?
• Professional traders => do not seem to outperform
• Are there generic strategies which could be used? And beat the market? What is the impact of investment style?
• “Anomalies”
– Size effect
– Book-to-market ratio
– Momentum strategy
|25
Size and Book-to-Market effects
• Fama and French (1993): Investing in small stocks (by market capitalization) would lead to positive alphas (NB: this means that the Betas were used to assess the expected return )
• Positive relationship between average return and book-to-market equity measures => high figure value stocks => investing in value stocks would bring positive alphas
• Data mining or real element playing a role?
• Stock with positive alpha => higher expected return and thus lower price => lower value of market equity => higher B/M measure
|26
Momentum
• Trading strategy which buys past winners and sells past losers
• Jegadeesh and Titman (1993)
– Momentum strategy would have lead to abnormal returns for the period 1965-1989
– Selection based on past 6 months returns => compounded excess return of 12.01% per year on average!
|27