Embed Size (px)
Citation preview

ADVANCED GCE 2804BIOLOGY
Central Concepts
TUESDAY 19 JUNE 2007 Morning
Time: 1 hour 30 minutesAdditional materials: Electronic calculator Ruler (cm/mm)
This document consists of 17 printed pages and 3 blank pages.
SP (DR/DR) T26250/4 © OCR 2007 [J/100/3766] OCR is an exempt Charity [Turn over
INSTRUCTIONS TO CANDIDATES
• Write your name, Centre Number and Candidate Number in the boxes above.
• Answer all the questions.
• Use blue or black ink. Pencil may be used for graphs and diagrams only.
• Read each question carefully and make sure you know what you have to do before starting your answer.
• Do not write in the bar code.
• Do not write outside the box bordering each page.
• WRITE YOUR ANSWER TO EACH QUESTION IN THE SPACE PROVIDED. ANSWERS WRITTEN ELSEWHERE WILL NOT BE MARKED.
INFORMATION FOR CANDIDATES
• The number of marks for each question is given in brackets [ ] at the end of each question or part question.
• You will be awarded marks for the quality of written communication where this is indicated in the question.
• You may use an electronic calculator.
• You are advised to show all the steps in any calculation.
FOR EXAMINER’S USE
Qu. Max. Mark
1 17
2 13
3 19
4 11
5 14
6 16
TOTAL 90
*CUP/T26250*
2
Answer all the questions.
1 Primary succession is the simplest type of succession, beginning with a bare surface such as rock or sand. The first organisms to colonise the area form the pioneer community.
(a) Describe two effects of the pioneer community on the habitat.
...................................................................................................................................................
...................................................................................................................................................
...................................................................................................................................................
...............................................................................................................................................[2]
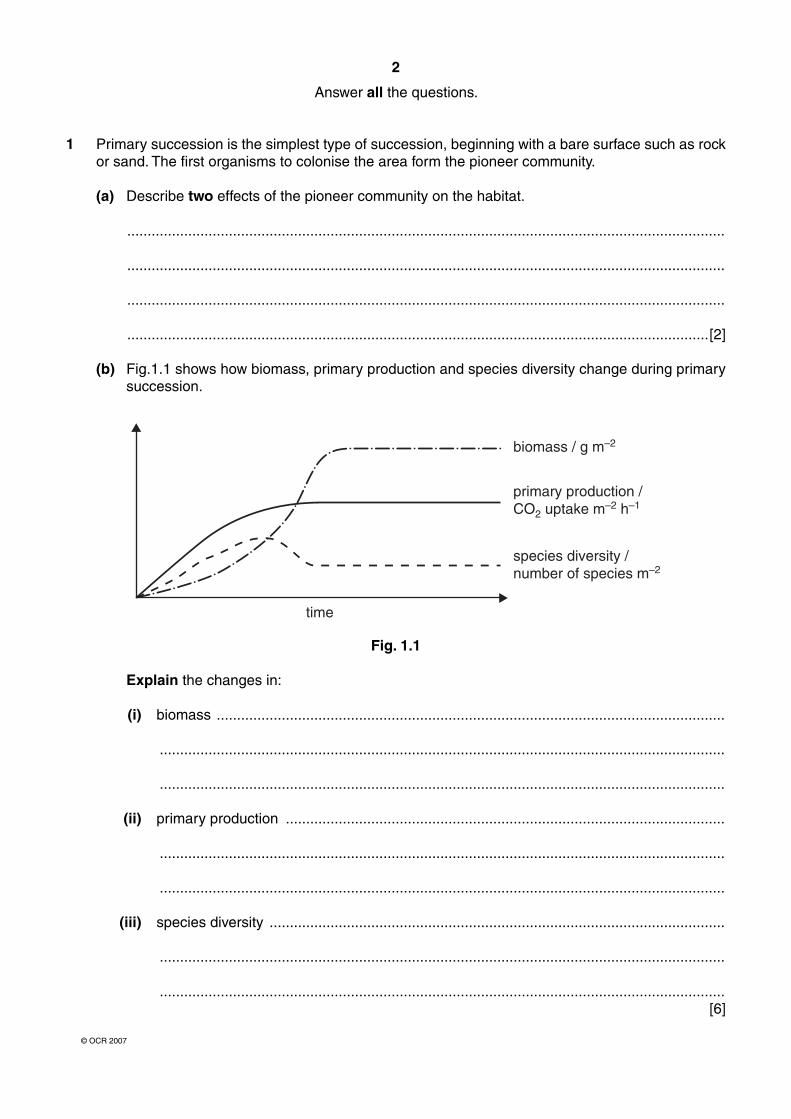
(b) Fig.1.1 shows how biomass, primary production and species diversity change during primary succession.
biomass / g m–2
primary production /CO2 uptake m–2 h–1
species diversity /number of species m–2
time
Fig. 1.1
Explain the changes in:
(i) biomass .............................................................................................................................
...........................................................................................................................................
...........................................................................................................................................
(ii) primary production ............................................................................................................
...........................................................................................................................................
...........................................................................................................................................
(iii) species diversity ................................................................................................................
...........................................................................................................................................
........................................................................................................................................... [6]
© OCR 2007
3
[Turn over
(c) Chalk grassland communities are found in areas of southern England such as the South Downs. Woodland rather than grassland is the climax community for this habitat. Grazing by sheep and rabbits maintains the grassland.
(i) De�ne the term climax community .
...........................................................................................................................................
.......................................................................................................................................[1]
(ii) Suggest how grazing by sheep and rabbits could prevent a woodland climax community from developing.
...........................................................................................................................................
.......................................................................................................................................[1]
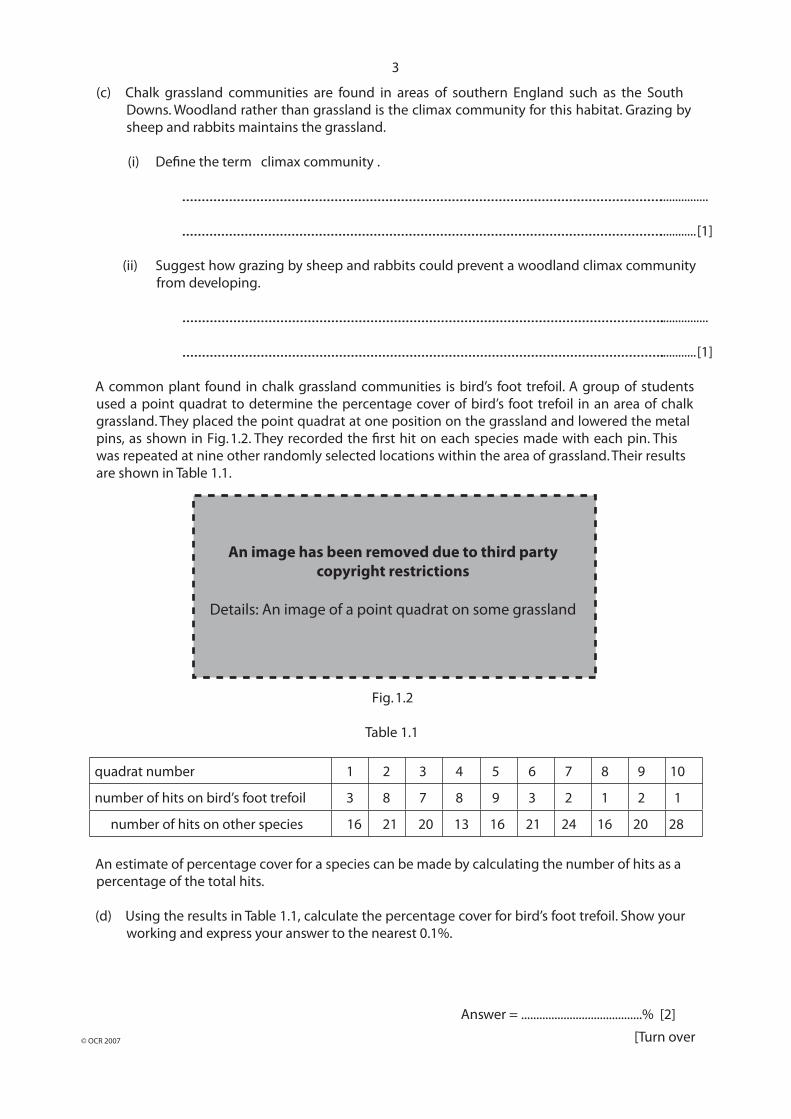
A common plant found in chalk grassland communities is bird’s foot trefoil. A group of students used a point quadrat to determine the percentage cover of bird’s foot trefoil in an area of chalk grassland. They placed the point quadrat at one position on the grassland and lowered the metal pins, as shown in Fig.1.2. They recorded the �rst hit on each species made with each pin. This was repeated at nine other randomly selected locations within the area of grassland. Their results are shown in Table 1.1.
Fig.1.2
Table 1.1
quadrat number 1 2 3 4 5 6 7 8 9 10
number of hits on bird’s foot trefoil 3 8 7 8 9 3 2 1 2 1
number of hits on other species 16 21 20 13 16 21 24 16 20 28
An estimate of percentage cover for a species can be made by calculating the number of hits as a percentage of the total hits.
(d) Using the results in Table 1.1, calculate the percentage cover for bird’s foot trefoil. Show your working and express your answer to the nearest 0.1%.
Answer = ........................................% [2]
© OCR 2007
An image has been removed due to third party copyright restrictions
Details: An image of a point quadrat on some grassland

4
© OCR 2007
(e) A footpath runs through the area of grassland and one student observed that very few bird’s foot trefoil plants were found on the trampled areas.
Explain how the students could use a transect to determine whether there is a link between trampling and the abundance of bird’s foot trefoil on this footpath.
...................................................................................................................................................
...................................................................................................................................................
...................................................................................................................................................
...................................................................................................................................................
...................................................................................................................................................
...................................................................................................................................................
...................................................................................................................................................
...................................................................................................................................................
...................................................................................................................................................
...................................................................................................................................................
...............................................................................................................................................[5]
[Total: 17]

5
BLANK PAGE
PLEASE DO NOT WRITE ON THIS PAGE
[Turn over© OCR 2007
6
© OCR 2007
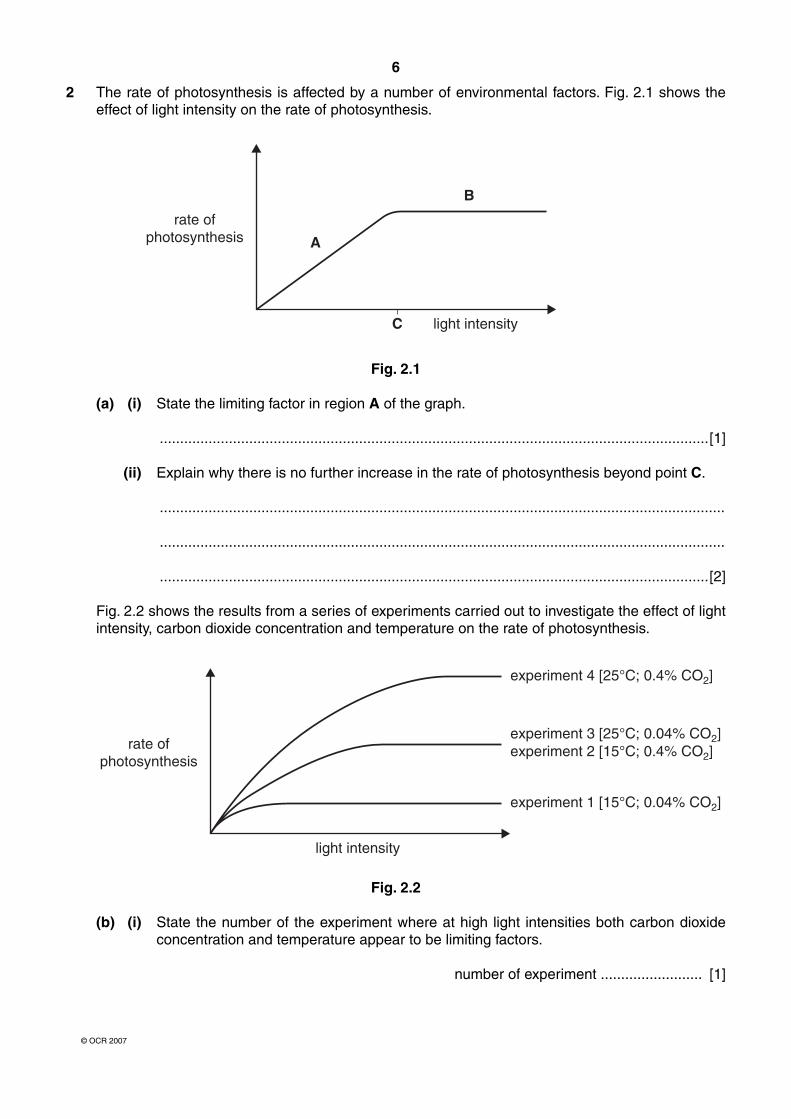
2 The rate of photosynthesis is affected by a number of environmental factors. Fig. 2.1 shows the effect of light intensity on the rate of photosynthesis.
A
B
C light intensity
rate ofphotosynthesis
Fig. 2.1
(a) (i) State the limiting factor in region A of the graph.
.......................................................................................................................................[1]
(ii) Explain why there is no further increase in the rate of photosynthesis beyond point C.
...........................................................................................................................................
...........................................................................................................................................
.......................................................................................................................................[2]
Fig. 2.2 shows the results from a series of experiments carried out to investigate the effect of light intensity, carbon dioxide concentration and temperature on the rate of photosynthesis.
light intensity
rate ofphotosynthesis
experiment 4 [25°C; 0.4% CO2]
experiment 3 [25°C; 0.04% CO2]experiment 2 [15°C; 0.4% CO2]
experiment 1 [15°C; 0.04% CO2]
Fig. 2.2
(b) (i) State the number of the experiment where at high light intensities both carbon dioxide concentration and temperature appear to be limiting factors.
number of experiment ......................... [1]

7
[Turn over© OCR 2007
(ii) Explain your answer in (b) (i).
...........................................................................................................................................
...........................................................................................................................................
...........................................................................................................................................
.......................................................................................................................................[2]
(c) For many plants living in temperate regions the optimum temperature for photosynthesis is approximately 25°C.
Explain why the rate of photosynthesis decreases at temperatures above 25°C.
...................................................................................................................................................
...................................................................................................................................................
...................................................................................................................................................
...................................................................................................................................................
...................................................................................................................................................
...................................................................................................................................................
...............................................................................................................................................[4]
(d) Plants that live in the Arctic have a relatively short growing season in which the light intensity is always relatively low. Many species growing in these conditions have a high level of anthocyanin pigments in their leaves. The combined effect of these red pigments with the green chlorophyll makes the leaves appear dark purple or black.
Suggest why this adaptation is useful in increasing photosynthetic rates.
...................................................................................................................................................
...................................................................................................................................................
...................................................................................................................................................
...................................................................................................................................................
...............................................................................................................................................[3]
[Total: 13]

8
© OCR 2007
3 All organisms require energy in order to remain alive. Plants use solar energy to combine water and carbon dioxide into complex organic molecules. Both plants and animals then break down organic molecules in respiration. Energy released in this process is used in the formation of ATP.
(a) Describe the structure of ATP.
...................................................................................................................................................
...................................................................................................................................................
...................................................................................................................................................
...................................................................................................................................................
...............................................................................................................................................[4]
(b) List three uses of ATP in birds and mammals.
1 ................................................................................................................................................
2 ................................................................................................................................................
3 ............................................................................................................................................[3]
(c) The synthesis of ATP from ADP involves the addition of a phosphate molecule. This phosphorylation is catalysed by a specific enzyme.
(i) Name an enzyme which catalyses the phosphorylation of ADP.
.......................................................................................................................................[1]
(ii) Name three ways that phosphorylation of ADP can occur in a photosynthetic plant cell.
1 ........................................................................................................................................
2 ........................................................................................................................................
3 ....................................................................................................................................[3]
9
[Turn over© OCR 2007
(d) In this question, one mark is available for the quality of use and organisation of scientific terms.
There are a number of organic molecules in cells whose role is to transfer hydrogen atoms from one compound to another. Examples include NAD, FAD and NADP.
NAD, FAD and NADP are important molecules in plant cells. Describe, in detail, the role of these molecules within a palisade mesophyll cell.
...................................................................................................................................................
...................................................................................................................................................
...................................................................................................................................................
...................................................................................................................................................
...................................................................................................................................................
...................................................................................................................................................
...................................................................................................................................................
...................................................................................................................................................
...................................................................................................................................................
...................................................................................................................................................
...................................................................................................................................................
...................................................................................................................................................
...................................................................................................................................................
...................................................................................................................................................
...................................................................................................................................................
...................................................................................................................................................
...................................................................................................................................................
...................................................................................................................................................
...................................................................................................................................................
...................................................................................................................................................
...............................................................................................................................................[7]
Quality of Written Communication [1]
[Total: 19]
10
© OCR 2007
4 Coat colour in rabbits is determined by a single gene which has four separate alleles. The gene is not sex linked.
• The allele for agouti colour, CA, is dominant to all the other alleles.
• The allele for albino, Ca, is recessive to all the other alleles.
• The allele for chinchilla, CCh, is dominant to the Himalayan allele, CH.
(a) State all the possible genotypes for the following phenotypes:
chinchilla ...................................................................................................................................
agouti ....................................................................................................................................[2]
(b) A young girl owns a pet female Himalayan rabbit. She wants to know whether it is homozygous (pure breeding) for this trait. Her friend owns a male albino rabbit, and says that if they cross the two rabbits and they find any albino offspring she can be sure that the female is not pure breeding.
(i) Name the type of cross that they will carry out.
.......................................................................................................................................[1]
(ii) The friend’s statement is valid. Explain why.
You may use genetic diagrams in your answer.
...........................................................................................................................................
...........................................................................................................................................
...........................................................................................................................................
...........................................................................................................................................
...........................................................................................................................................
...........................................................................................................................................
...........................................................................................................................................
[3]

11
[Turn over© OCR 2007
(c) In the wild, rabbits have a high reproductive rate. However the population size remains fairly stable.
Explain how this stability is maintained and how the gene pool of the rabbit population may be affected.
...................................................................................................................................................
...................................................................................................................................................
...................................................................................................................................................
...................................................................................................................................................
...................................................................................................................................................
...................................................................................................................................................
...................................................................................................................................................
...................................................................................................................................................
...................................................................................................................................................
...................................................................................................................................................
...............................................................................................................................................[5]
[Total: 11]

12
© OCR 2007
BLANK PAGE
PLEASE DO NOT WRITE ON THIS PAGE

13
[Turn over© OCR 2007
5 Plants must respond to changes in both their external and internal environments. Communication in plants is achieved by using a number of plant growth regulators.
(a) List three stimuli that plants respond to.
1 ................................................................................................................................................
2 ................................................................................................................................................
3 ............................................................................................................................................[3]
(b) Describe how plant growth regulators are transported within a plant.
...................................................................................................................................................
...................................................................................................................................................
...................................................................................................................................................
...............................................................................................................................................[2]
(c) In this question, one mark is available for the quality of spelling, punctuation and grammar.
Students carried out an experiment to investigate the role of plant growth regulators on the production of α-amylase in germinating barley grains.
• Four sterile starch agar plates were prepared. • Barley grains that had been soaked for 24 hours were sterilised and then cut in half
using a sterile razor blade, as shown in Fig. 5.1.
cut
embryo
non-embryo
Fig. 5.1
• Four non-embryo halves were placed cut side down onto each agar plate. • 0.5cm3 of the following solutions were added to the agar plates:
Plate 1 – distilled water (control)
Plate 2 – gibberellic acid (GA) solution
Plate 3 – abscisic acid (ABA) solution
Plate 4 – GA and ABA solution
THIS QUESTION CONTINUES ON PAGE 14

14
© OCR 2007
• The plates were incubated at 20°C for 96 hours. • After incubation iodine solution was added to each plate. • The appearance of a plate after adding iodine solution is shown in Fig. 5.2.
non-embryohalf of barley
grain
blue / black
clear area
Fig. 5.2
The maximum diameter of the clear area surrounding each non-embryo half was recorded.
The students’ results are shown in Table 5.1.
Table 5.1
agar platemaximum diameter of clear area surrounding each of the
four non-embryo halves after 96 hours / cm
1 distilled water 1.5 2.4 1.5 1.4
2 GA 2.0 1.3 2.5 2.2
3 ABA 0.9 0.8 1.5 1.2
4 GA and ABA 1.2 1.2 1.0 1.2
15
[Turn over© OCR 2007
Using the results in Table 5.1, describe and explain the role of the plant growth regulators GA and ABA in seed germination.
...................................................................................................................................................
...................................................................................................................................................
...................................................................................................................................................
...................................................................................................................................................
...................................................................................................................................................
...................................................................................................................................................
...................................................................................................................................................
...................................................................................................................................................
...................................................................................................................................................
...................................................................................................................................................
...................................................................................................................................................
...................................................................................................................................................
...................................................................................................................................................
...................................................................................................................................................
...................................................................................................................................................
...................................................................................................................................................
...................................................................................................................................................
...................................................................................................................................................
...................................................................................................................................................
...................................................................................................................................................
...................................................................................................................................................
...................................................................................................................................................
...................................................................................................................................................
...............................................................................................................................................[8]
Quality of Written Communication [1]
[Total: 14]
16
© OCR 2007
6 The �rst stage in the formation of urine is glomerular �ltration. This results in the production of glomerular �ltrate in the Bowman’s (renal) capsules. Fig. 6.1 is a diagram that shows the structures and forces involved in the �ltration process.
Fig. 6.1
(a) The normal blood hydrostatic pressure in other capillaries is 3.3 kPa.
(i) Using Fig. 6.1, explain why the blood pressure in the glomerular capillaries is considerably higher than in other capillaries.
...........................................................................................................................................
...........................................................................................................................................
...........................................................................................................................................
...........................................................................................................................................
.......................................................................................................................................[2]
An image has been removed due to third party copyright restrictions
Details: An image of glomerular capillaries, Bowman’s capsule and surrounding cells
17
[Turn over© OCR 2007
(ii) Using the data given in Fig. 6.1, calculate the effective filtration pressure.
Answer = ........................................kPa [2]
(b) The presence of protein molecules in the urine of an individual is a sign of kidney disease or kidney damage.
(i) Explain why it is unusual for protein molecules to appear in the urine.
...........................................................................................................................................
...........................................................................................................................................
...........................................................................................................................................
.......................................................................................................................................[2]
(ii) Explain why protein in the urine is often a symptom of chronic high blood pressure.
...........................................................................................................................................
...........................................................................................................................................
...........................................................................................................................................
.......................................................................................................................................[2]
(c) A complex barrier exists between the blood plasma in the glomerular capillaries and the fluid in the renal capsule.
Describe in detail the structure of the region labelled A on Fig. 6.1.
...................................................................................................................................................
...................................................................................................................................................
...................................................................................................................................................
...................................................................................................................................................
...................................................................................................................................................
...................................................................................................................................................
...................................................................................................................................................
...................................................................................................................................................
...............................................................................................................................................[4]

18
© OCR 2007
(d) Coffee contains the drug caffeine, which inhibits the release of ADH.
Describe and explain the effect of drinking coffee on the volume and concentration of urine produced.
...................................................................................................................................................
...................................................................................................................................................
...................................................................................................................................................
...................................................................................................................................................
...................................................................................................................................................
...................................................................................................................................................
...................................................................................................................................................
...............................................................................................................................................[4]
[Total: 16]
END OF QUESTION PAPER

19
BLANK PAGE
PLEASE DO NOT WRITE ON THIS PAGE
© OCR 2007

20
© OCR 2007
Permission to reproduce items where third-party owned material protected by copyright is included has been sought and cleared where possible. Every reasonable effort has been made by the publisher (OCR) to trace copyright holders, but if any items requiring clearance have unwittingly been included, the publisher will be pleased to make amends at the earliest possible opportunity.
OCR is part of the Cambridge Assessment Group. Cambridge Assessment is the brand name of University of Cambridge Local Examinations Syndicate (UCLES), which is itself a department of the University of Cambridge.
PLEASE DO NOT WRITE ON THIS PAGE