Embed Size (px)
Citation preview

Advanced General Aviation Transport Experiments
A – Basis and B – Basis Design Allowables
for Epoxy – Based Prepreg
TORAY 7781 Finish 558/#2510
Fiberglass Fabric [SI Units]
AGATE-WP3.3-033051-136 November 2002 J. Tomblin, J. Sherraden, W. Seneviratne, K. S. Raju National Institute for Aviation Research Wichita State University Wichita, KS 67260-0093

ii
TABLE OF CONTENTS
1. INTRODUCTION .............................................................................................. 1
1.1. Scope.....................................................................................................2
1.2. Symbols Used........................................................................................3
1.3. Acronyms and Definitions ......................................................................4
1.4. References.............................................................................................5
1.5. Methodology ..........................................................................................9
1.5.1. Test Matrix .......................................................................................9
1.5.2. Environmental Conditioning ...........................................................11
1.5.3. Fluid Sensitivity Screening .............................................................11
1.5.4. Normalization Procedures..............................................................13
1.5.5. Statistical Analysis .........................................................................14
1.5.6. Material Performance Envelope and Interpolation .........................14
1.5.6.1. Interpolation Example.................................................................16
2. TORAY 7781 FINISH 558/#2510 PROCEDURES AND PREPREG PROPERTIES.......................................................................................................... 18
2.1. GENERAL............................................................................................19
2.1.1. Materials ........................................................................................19
2.1.2. Lay-up/Bagging..............................................................................19
2.1.3. Cure ...............................................................................................20
2.1.4. Non-Destructive Inspection (NDI) ..................................................20
2.1.5. Tabbing ..........................................................................................23
2.1.6. FAA Test Coupon Conformity and Test Witness............................23
2.1.6.1. Test Coupon Conformity.............................................................23
2.1.6.2. Test Witness...............................................................................24
2.2. Prepreg Documentation by Prepreg Lot...............................................25
2.3. Data Documentation ............................................................................26
3. TORAY 7781 FINISH 558/#2510 LAMINA PROPERTIES............................. 28
3.1. Test Results .........................................................................................29

iii
3.1.1. Summary........................................................................................29
3.1.2. Individual Test Summaries.............................................................30
3.1.2.1. Tension, 1-axis ...........................................................................31
3.1.2.2. Tension, 2-axis ...........................................................................32
3.1.2.3. Compression, 1-axis...................................................................33
3.1.2.4. Compression, 2-axis...................................................................34
3.1.2.5. Shear, 12 axis ............................................................................35
3.1.2.6. Shear, 13 axis ............................................................................36
3.1.3. Individual Test Charts ....................................................................37
3.1.3.1. Tension, 1-axis ...........................................................................38
3.1.3.2. Tension, 2-axis ...........................................................................39
3.1.3.3. Compression, 1-axis...................................................................40
3.1.3.4. Compression, 2-axis...................................................................41
3.1.3.5. Shear, 12 axis ............................................................................42
3.1.3.6. Shear, 13 axis ............................................................................43
3.2. Raw Data .............................................................................................44
3.2.1. Raw Data Spreadsheets and Scatter Charts .................................45
3.2.2. Fluid Sensitivity Raw Data Spreadsheets and Scatter Charts........88
3.2.3. Representative Shear Stress-Strain Curve ....................................93
3.3. Statistical Results.....................................................................................95
APPENDIX A. PHYSICAL AND MECHANICAL TEST PROCEDURES.............. 106
A.1. Physical Properties................................................................................107
A.1.1. Uncured Resin Content ...................................................................107
A.1.2. Uncured Volatile Content.................................................................107
A.1.3. Resin Gel Time................................................................................107
A.1.4. Resin Flow.......................................................................................107
A.1.5. Uncured Fiber Areal Weight ............................................................107
A.1.6. Infrared Spectroscopy .....................................................................107
A.1.7. High Performance Liquid Chromatography (HPLC).........................108
A.1.8. Differential Scanning Calorimetry (DSC) .........................................108
A.1.9. Cured Neat Resin Density ...............................................................108

iv
A.1.10. Fiber Volume .................................................................................108
A.1.11. Resin Volume ................................................................................108
A.1.12. Void Content..................................................................................109
A.1.13. Cured Laminate Tg by DMA ..........................................................109
A.2. TENSILE PROPERTIES .......................................................................109
A.2.1. 0° (Warp) and 90° (Fill) Tensile Properties ......................................109
A.2.1.1. Tensile Calculations ..................................................................110
A.2.1.1.1. Tensile Strength (Un-normalized) ........................................110 A.2.1.1.2. Tensile Strength (Normalized) .............................................111 A.2.1.1.3. Tensile Modulus of Elasticity (Un-normalized) .....................111 A.2.1.1.4. Tensile Modulus of Elasticity (Normalized) ..........................111 A.2.1.1.5. 0° (Warp) Tensile Poisson’s Ratio .......................................111
A.3. COMPRESSIVE STRENGTH................................................................112
A.3.1. 0° (Warp) and 90° (Fill) Compressive Strength Properties ..............112
A.3.1.1. Compressive Strength Calculations...........................................113
A.3.1.1.1. Compressive Strength Calculation (Un-normalized) ............113 A.3.1.1.2. Compressive Strength Calculation (Normalized) .................113
A.4. COMPRESSIVE MODULUS .................................................................113
A.4.1. 0° (Warp) and 90° (Fill) Compression Modulus Properties ..............113
A.4.1.1. Compression Modulus Calculations ..........................................114
A.4.1.1.1. Compressive Modulus Calculation (Un-normalized) ............114 A.4.1.1.2. Compressive Modulus Calculation (Normalized) .................115
A.5. IN-PLANE (IOSIPESCU) SHEAR..........................................................115
A.5.1. In-plane (Iosipescu) Shear Strength Calculations............................116
A.5.1.1. In-plane (Iosipescu) Shear, Ultimate Strength Calculation ........116
A.5.1.2. In-plane (Iosipescu) Shear, Modulus Calculation ......................116
A.6. SHORT BEAM SHEAR .........................................................................116
A.6.1. Short Beam Shear Strength Calculations ........................................117
A.6.1.1. Short Beam Shear Strength Calculation....................................117
APPENDIX B. MOISTURE CONDITIONING HISTORY CHARTS....................... 118
APPENDIX C. PHYSICAL TEST RESULTS ........................................................ 128
APPENDIX D. STATISTICAL ANALYSIS SUMMARY ........................................ 153

v
APPENDIX E. METHOD FOR TRANSFORMING VARIANCES OF TEST SAMPLES (SUPPLEMENT TO DOT/FAA/AR-47/00)........................................... 168
APPENDIX F. RAW TESTING SUMMARIES....................................................... 174
APPENDIX G. DATES OF PANEL MANUFACTURE AND COPY OF FAA FORM 8130-3 ........................................................................................................ 198

1
1. INTRODUCTION This material characterization program was performed to characterize the lamina properties of Toray Composites (America), Fiberglass Style 7781 Finish 558/#2510, 295 g/m2, fiberglass woven fabric, herein designated FGF7781-071. The FGF7781-071 prepreg material system designation shall be used to refer the material in this report. The material qualification was conducted under FAA project number TC1616SE-A through Lancair Company that wanted to use the aforementioned material prepreg system on their LC40 aircraft. This report contains the test results obtained from the tests conducted for the material qualification of FGF7781-071 in accordance with FAA Document DOT/FAA/AR-00/47: Material Qualification and Equivalency for Polymer Matrix Composite Material Systems and Toray Composites (America), Inc. (TCA) Material Process Specification, TCSPF-T-FG03, Revision 1 dated February 4, 2000. Toray Composites (America), Inc. (TCA), Integrated Technologies (Intec), National Institute for Aviation Research (NIAR) and Rose Consulting performed the testing on the unexposed and exposed prepreg materials for lamina baseline test properties in accordance with ASTM test methods, SACMA test methods, and TCA test work instructions. Three batches of FGF7781-071 and the corresponding mixed resins were tested for baseline test properties. The data reported herein will be used to set material acceptance criteria for future material production and material receipt. The Raw Test Data, Inspection Records, Fabrication Records, Processing Records and all other relevant documents of this report, TCQAL-T-1014, are archived at Toray Composites (America), Inc., and it is available only upon request. The physical and chemical tests were performed on the mixed resins, the uncured prepreg materials and cured prepreg laminates. The mixed resins were evaluated for cured neat resin density. The uncured prepreg samples were evaluated for resin content, fiber areal weight, volatile content, gel time, flow, IR (Infrared Spectroscopy), HPLC (High Performance Liquid Chromatography) and DSC (Differential Scanning Calorimetry). The cured prepreg laminates were tested for fiber volume, resin volume, void content, cured ply thickness and Tg (glass transition temperature) by DMA (Dynamic Mechanical Analyzer). TCA Test Laboratories performed all the physical and chemical tests on the mixed resins, the uncured prepreg materials and cured prepreg laminates, except for fiber volume, resin volume and void content that Intec performed and cured laminate glass transition temperature, dry and wet conditions, that Rose Consulting performed. TCA Test Laboratories performed the fabrication of all the test panels and test specimens, ultrasonic inspection, chemical and humidity conditioning, except for 0° and 90° Compressive Strength specimens that NIAR tabbed and machined.

2
Also, the TCA Test Laboratories performed the attachment of strain gauges and mechanical testing, except for specimens tested at –65 °F (Dry) that Intec performed. Moreover, TCA Test Laboratories performed the fluid sensitivity on one qualification batch by testing in-plane (iosipescu) shear strength only. All TCA and Intec test equipments were calibrated with standards traceable to the NIST.
1.1. Scope
The test methods and results described in this document are intended to provide basic composite properties essential to most methods of analysis. These properties are considered to provide the initial base of the “building block” approach. Additional coupon level tests and sub-element tests may be required to fully substantiate the full-scale design. The test methods and results contained in this document are consistent with MIL-HDBK-17-1E,2D,3E - Military Handbook for Polymer Matrix Composites. All material, specimens, fixtures and test results contained within this document were traceable and conformed by the Federal Aviation Administration (FAA). It should be noted that before application of the basis values presented in this document to design, demonstration of the ability to consistently produce equivalent material properties as that evaluated during this program should be substantiated through an acceptable test program.

3
1.2. Symbols Used
ν12tu major Poisson’s ratio, tension
µε micro-strain E1
c compressive modulus, longitudinal E1
t tensile modulus, longitudinal E2
c compressive modulus, transverse E2
t tensile modulus, transverse F12
su in – plane shear strength F13
su apparent interlaminar shear strength F1
cu compressive strength, longitudinal F1
tu tensile strength, longitudinal F2
cu compressive strength, transverse F2
tu tensile strength, transverse G12
s in – plane shear modulus Superscripts c compression cu compression ultimate s shear su shear ultimate t tension tu tension ultimate Subscripts 1 1 – axis; longitudinal
(parallel to warp direction of reinforcement) 2 2 – axis; transverse
(parallel to fill direction of reinforcement) 12 in – plane shear 13 interlaminar shear (apparent)

4
1.3. Acronyms and Definitions
A – Basis 95% lower confidence limit on the first population percentile
AGATE Advanced General Aviation Transport Experiments ASTM American Society for Testing and Materials B – Basis 95% lower confidence limit on the tenth population
percentile C. V. coefficient of variation CTD cold temperature dry CPT cured ply thickness DMA dynamic mechanical analysis Dry specimen tested with an “as fabricated” moisture
content ETD elevated temperature dry ETW elevated temperature wet FAR Federal Aviation Regulations FAW fiber areal weight Gr/Ep graphite/epoxy NASA National Aeronautics and Space Administration RTD room temperature dry SACMA Suppliers of Advanced Composite Materials
Association SRM SACMA Recommended Method Tg glass transition temperature tply cured ply thickness wet specimen tested with an equilibrium moisture content
per section 1.5.2
5
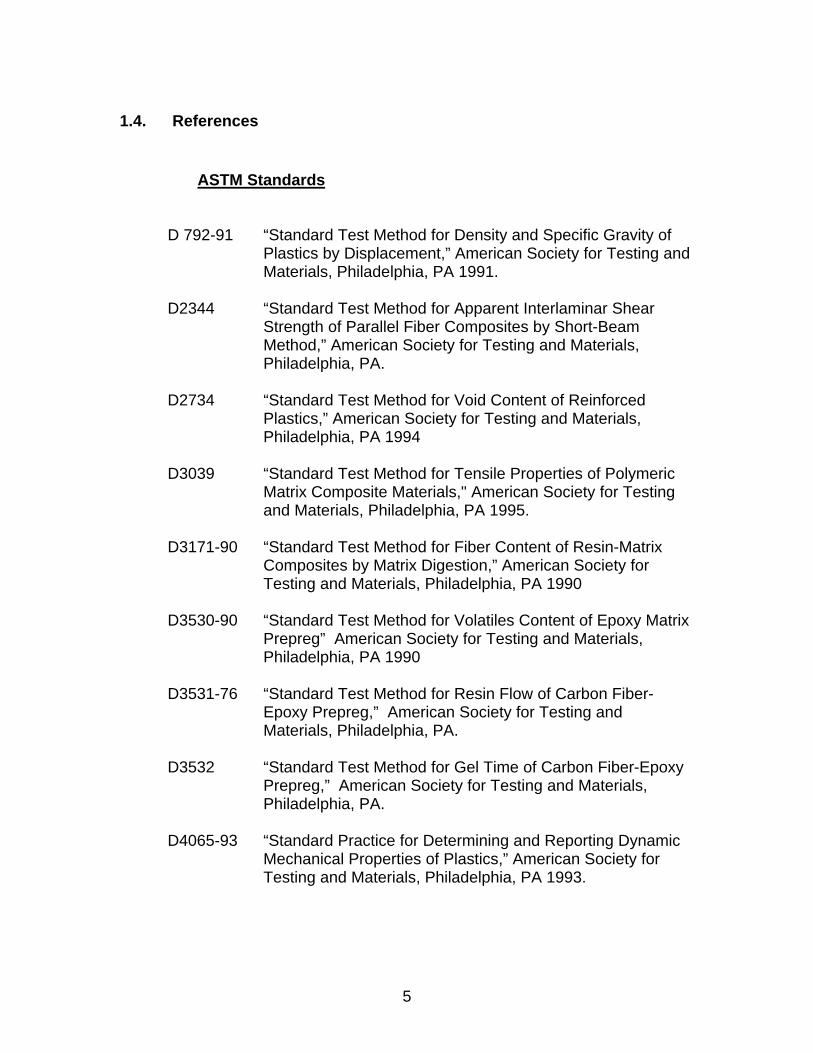
1.4. References
ASTM Standards
D 792-91 “Standard Test Method for Density and Specific Gravity of Plastics by Displacement,” American Society for Testing and Materials, Philadelphia, PA 1991.
D2344 “Standard Test Method for Apparent Interlaminar Shear
Strength of Parallel Fiber Composites by Short-Beam Method,” American Society for Testing and Materials, Philadelphia, PA.
D2734 “Standard Test Method for Void Content of Reinforced Plastics,” American Society for Testing and Materials, Philadelphia, PA 1994
D3039 “Standard Test Method for Tensile Properties of Polymeric
Matrix Composite Materials," American Society for Testing and Materials, Philadelphia, PA 1995.
D3171-90 “Standard Test Method for Fiber Content of Resin-Matrix
Composites by Matrix Digestion,” American Society for Testing and Materials, Philadelphia, PA 1990
D3530-90 “Standard Test Method for Volatiles Content of Epoxy Matrix
Prepreg” American Society for Testing and Materials, Philadelphia, PA 1990
D3531-76 “Standard Test Method for Resin Flow of Carbon Fiber-
Epoxy Prepreg,” American Society for Testing and Materials, Philadelphia, PA.
D3532 “Standard Test Method for Gel Time of Carbon Fiber-Epoxy
Prepreg,” American Society for Testing and Materials, Philadelphia, PA.
D4065-93 “Standard Practice for Determining and Reporting Dynamic
Mechanical Properties of Plastics,” American Society for Testing and Materials, Philadelphia, PA 1993.

6
D4473 “Standard Practice for Determining Cure Behavior of Thermosetting Resins Using dynamic Mechanical Procedures,” American Society for Testing and Materials, Philadelphia, PA.
D5379-98 “Shear Properties of Composite Materials by the V-Notched Beam Method,” American Society for Testing and Materials, Philadelphia, PA 1998.
E168 “General Techniques of Infrared Quantitative Analysis,” American Society for Testing and Materials, Philadelphia, PA 1992.
E1252 “Standard Practice for General Techniques for Qualitative Infrared Analysis,” American Society for Testing and Materials, Philadelphia, PA 1995.
E1356 “Glass Transition Termperature by Differential Scanning Calorimetry or Differential Thermal Analysis,” American Society for Testing and Materials, Philadelphia, PA 1995.
SACMA Standards
SRM-1R-94 “Compressive Properties of Oriented Fiber-Resin Composites," Suppliers of Advanced Composite Materials Association, 1994.
SRM-18R-94 “Glass Transition Temperature (Tg) Determination by DMA of Oriented Fiber-Resin Composites," Suppliers of Advanced Composite Materials Association, 1994.
SRM-19R-94 “Viscosity characteristics of Matrix Resins," Suppliers of
Advanced Composite Materials Association, 1994.
SRM-20R-94 “High Performance Liquid Chromatography of Thermoset Resins," Suppliers of Advanced Composite Materials Association, 1994.
SRM-22R-94 “Determining the Resin Flow of Preimpregnated “B” Staged Material," Suppliers of Advanced Composite Materials Association, 1994.
SRM-23R-94 “Determination of Resin Content and Fiber Areal Weight of Thermoset Prepreg with Destructive Technique," Suppliers
of Advanced Composite Materials Association, 1994.

7
SRM-25R-94 “Onset Temperature and Peak Temperature for Composite
System Resins Using Differential Scanning Calorimetry (DSC)," Suppliers of Advanced Composite Materials Association, 1994.
Toray Documents
TCSPF-T-FG03 “Material and Process Specification,” Revision 1, Toray Composites (America), Inc., Puyallup, WA, February 4, 2000.
TCWIN-U-C002 “Fourier Transform Infrared Analysis," Toray
Composites (America), Inc., Puyallup, WA, 1998.
TCWIN-U-C003 “Differential Scanning Calorimetry," Toray Composites (America), Inc., Puyallup, WA, 1998.
TCWIN-U-C004 “High Performance Liquid Chromatography," Toray Composites (America), Inc., Puyallup, WA, 1998.
TCWIN-U-M003 “Lay-up/Vacuum Debulking,” Toray Composites
America), Inc., Puyallup, WA, 1998.
TCWIN-U-M006 “Autoclave Curing,” Toray Composites (America),
Inc., Puyallup, WA, 1998.
TCWIN-U-M008 “Panel Tabbing,” Toray Composites (America), Inc., Puyallup, WA, 1998.
TCWIN-U-M101 “Tensile Specimen Machining," Toray Composites (America), Inc., Puyallup, WA, 1998.
TCWIN-U-M102 “Compression Specimen Machining," Toray
Composites (America), Inc., Puyallup, WA, 1998.
TCWIN-U-M103 “Compression Modulus Specimen Machining," Toray Composites (America), Inc., Puyallup, WA, 1998.
TCWIN-U-M111 “90 Degree Tensile Specimen Machining," Toray
Composites (America), Inc., Puyallup, WA, 1998.

8
TCWIN-U-M201 “Tensile Testing,” Toray Composites (America), Inc., Puyallup, WA, 1998.
TCWIN-U-M204 “Compressive Strength Testing," Toray Composites
(America), Inc., Puyallup, WA, 1998.
TCWIN-U-M206 “Compressive Modulus Testing,” Toray Composites (America), Inc., Puyallup, WA, 1998.
TCWIN-U-M214 “Strain Gauge Attachment," Toray Composites (America), Inc., Puyallup, WA, 1998.
TCWIN-U-M215 “Laminate Density/Fiber Volume Testing," Toray
Composites (America), Inc., Puyallup, WA, 1998.
TCWIN-U-M216 “Strain Gauge Calibration," Toray Composites (America), Inc., Puyallup, WA, 1998.
TCWIN-U-P001 “Volatile Content," Toray Composites (America), Inc.,
Puyallup, WA, 1998.
TCWIN-U-P004 “Resin Content/Fiber Areal Weight," Toray Composites (America), Inc., Puyallup, WA, 1998.
TCWIN-U-P007 “Gel Time," Toray Composites America), Inc.,
Puyallup, WA, 1998.
TCWIN-U-P008 “Flow," Toray Composites (America), Inc., Puyallup, WA, 1998
Other Documents
FAA Document DOT/FAA/AR-00/47: Material Qualification and Equivalency for Polymer Matrix Composite Material Systems, J.S. Tomblin, Y.C. Ng and K.S. Raju, 2001. MIL-HDBK-17 1E, 2D, 3E – Military Handbook for Polymer Matrix Composites

9
1.5. Methodology
1.5.1. Test Matrix Testing was performed according to the test methods delineated in the test matrix, with modifications as referenced in FAA Document DOT/FAA/AR-00/47: Material Qualification and Equivalency for Polymer Matrix Composite Material Systems. The test matrix for properties included in this document is listed on the next page, with the following notation cited in each column:
# x # where the first # represents the required number of prepreg batches, defined as: Prepreg containing T700 12K graphite fibers from one mill roll, impregnated with one batch of resin in one continuous manufacturing operation with traceability to all components. The second # represents the required number of replicates per prepreg batch. For example, “3 x 6” refers to three prepreg batches of material and six specimens per prepreg batch for a total requirement of 18 test specimens.

10
Table 1.5.1: Minimum Recommended Test Matrix and Standards Used for
Testing
NO. OF REPLICATES PER TEST CONDITION
TEST
METHOD
CTD1
RTD2
ETW3
ETD4 0o (warp) Tension Strength
ASTM D3039-95 1x4
3x4
3x4
3x4
0o (warp) Tension Modulus, Strength and Poisson’s Ratio
ASTM D3039-95
1x2 3x2
3x2
3x2
90o (fill) Tension Strength
ASTM D3039-95
1x4
3x4
3x4
3x4
90o (fill) Tension Modulus and Strength
ASTM D3039-95
1x2 3x2
3x2
3x2
0o (warp) Compression Strength
SACMA SRM 1-94
1x6 3x6
3x6
3x6
0o (warp) Compression Modulus
SACMA SRM 1-94
1x2 3x2
3x2 3x2
90o (fill) Compression Strength
SACMA SRM 1-94
1x6
3x6
3x6
3x6
90o (fill) Compression Modulus SACMA SRM 1-94
1x2 3x2
3x2 3x2
In-Plane Shear Strength
ASTM D5379-93
1x4 3x4
3x4
3x4
In-Plane Shear Modulus and Strength
ASTM D5379-93
1x2 3x2
3x2 3x2
Short Beam Shear
ASTM D2344-89 1x6
3x6 3x6 3x6
Fiber Volume ASTM D3171-90 One sample per panel Resin Volume ASTM D3171-90 One sample per panel Void Content ASTM D2734-94 One sample per panel Cured Neat Resin Density --- Supplied by manufacturer for
material Glass Transition Temperature SACMA SRM 18-94 3 dry, 3 wet per prepreg batch Notes : 1 CTD: One prepreg batch of material tested (test temperature = -65 ± 5o F,
moisture content = as fabricated, soak time at –65 was 5 min.) 2 RTD: Three prepreg batches of material tested (test temperature = 70 ±
10o F, moisture content = as fabricated) 3 ETW: Three prepreg batches of material tested (test temperature = 180 ±
5o F, moisture content = equilibrium per section 1.5.2, soak time at 180 was 2 min.)
4 ETD: Three prepreg batches of material tested (test temperature = 180 ± 5o F, moisture content = as fabricated, soak time at 180 was 2 min.)

11
1.5.2. Environmental Conditioning All ‘wet’ conditioned samples were exposed to elevated temperature and humidity conditions to establish moisture saturation of the material. Specimens were exposed to 85 ± 5 % relative humidity and 145 ± 5 °F until an equilibrium moisture weight gain of traveler, or witness coupons (1” x 1” x specimen thickness) was achieved. ASTM D5229 and SACMA SRM 11 were used as guidelines for environmental conditioning and moisture absorption. Effective moisture equilibrium was achieved when the average moisture content of the traveler specimen changed by less than 0.05% for two consecutive readings within a span of 7 ± 0.5 days and was expressed by:
where Wi = weight at current time
Wi-1 = weight at previous time Wb = baseline weight prior to conditioning
It is common to see small fluctuations in an unfitted plot of the weight gain vs. time curve. There were no fluctuations that made significant errors in results or caused rejection in the moisture equilibrium criteria. Once the traveler coupons passed the criteria for two consecutive readings, the samples were removed from the environmental chamber and placed in a sealed bag with a moist paper or cotton towel for a maximum of 14 days until mechanical testing. Strain gauged specimens were removed from the controlled environment for a maximum of 2 hours for application of gages in ambient laboratory conditions.
1.5.3. Fluid Sensitivity Screening Although epoxy-based materials historically have not been shown to be sensitive to fluids other than water or moisture, the influence of some fluids other than water or moisture on the mechanical properties were characterized. These fluids fell into two exposure classifications. The first class was considered to be in contact with the material for an extended period of time, and the second class was considered to be wiped on and off (or evaporate) with relatively short exposure times. To assess the degree of sensitivity of fluids other than water or moisture, Table 1.5.2 shows the fluids which were used in this qualification plan.
0.0005 < WW - W
b
1 - ii

12
Table 1.5.2: Fluid Types Used for Sensitivity Studies
Fluid Type Specification
Exposure Classification
Jet Fuel (JP-4) MIL-T-5624 Extended Period
Hydraulic Fluid (Tri-N-butyl phosphate ester) MIL-H-5606G Extended Period
Solvent (Methyl Ethyl Ketone) Laboratory Grade Extended Period
To assess the influence of various fluids types, a test method sensitive to matrix degradation was used as an indicator of fluid sensitivity and compared to the unexposed results at both room temperature dry and elevated temperature dry conditions. Table 1.5.3 describes the fluid sensitivity-testing matrix with respect to the fluids defined in Table 1.5.2. Engineering judgment and statistical tests were used to assess the degree of material degradation. The results of this screening are included following the data sheets in section 3.2.2.
Table 1.5.3: Material Qualification Program for Fluid Resistance
Fluid Type Test Method
Test Temp. (o F)
Exposure1
Number of Replicates2
Jet Fuel JP-4 ASTM D53793 180 See note 4 5
Hydraulic Fluid ASTM D53793 180 See note 5 5 Solvent (MEK) ASTM D53793 Ambient See note 5 5
Notes : 1 Soaking in fluid at ambient temperature (immersion). 2 Only a single batch of material is required. 3 Shear strength only. 4 Immersion duration = 500 hours ± 50 hours 5 Immersion duration = 60 to 90 minutes
13
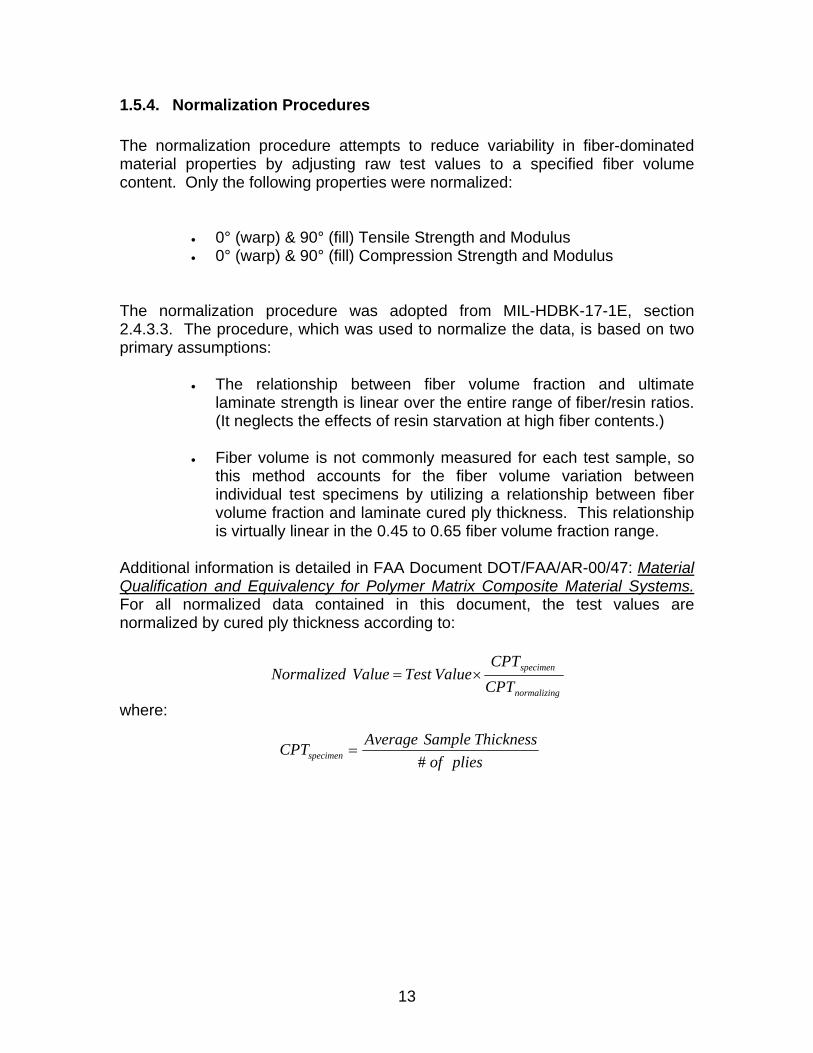
1.5.4. Normalization Procedures The normalization procedure attempts to reduce variability in fiber-dominated material properties by adjusting raw test values to a specified fiber volume content. Only the following properties were normalized:
• 0° (warp) & 90° (fill) Tensile Strength and Modulus • 0° (warp) & 90° (fill) Compression Strength and Modulus
The normalization procedure was adopted from MIL-HDBK-17-1E, section 2.4.3.3. The procedure, which was used to normalize the data, is based on two primary assumptions:
• The relationship between fiber volume fraction and ultimate laminate strength is linear over the entire range of fiber/resin ratios. (It neglects the effects of resin starvation at high fiber contents.)
• Fiber volume is not commonly measured for each test sample, so
this method accounts for the fiber volume variation between individual test specimens by utilizing a relationship between fiber volume fraction and laminate cured ply thickness. This relationship is virtually linear in the 0.45 to 0.65 fiber volume fraction range.
Additional information is detailed in FAA Document DOT/FAA/AR-00/47: Material Qualification and Equivalency for Polymer Matrix Composite Material Systems. For all normalized data contained in this document, the test values are normalized by cured ply thickness according to:
where:
gnormalizin
specimen
CPTCPT
ValueTestValueNormalized ×=
pliesofThicknessSampleAverageCPTspecimen #
=

14
1.5.5. Statistical Analysis When compared to metallic materials, fiber reinforced composite materials exhibit a high degree of material property variability. This variability is due to many factors, including but not limited to: raw material and prepreg manufacture, material handling, part fabrication techniques, ply stacking sequence, environmental conditions, and testing techniques. This inherent variability drives up the cost of composite testing and tends to render smaller data sets than those produced for metallic materials. This necessitates the usage of statistical techniques for determining reasonable design allowables for composites. The analyses and design allowable generation for both A and B basis values were performed using the procedure detailed in section 5.3 of FAA Document DOT/FAA/AR-00/47: Material Qualification and Equivalency for Polymer Matrix Composite Material Systems.
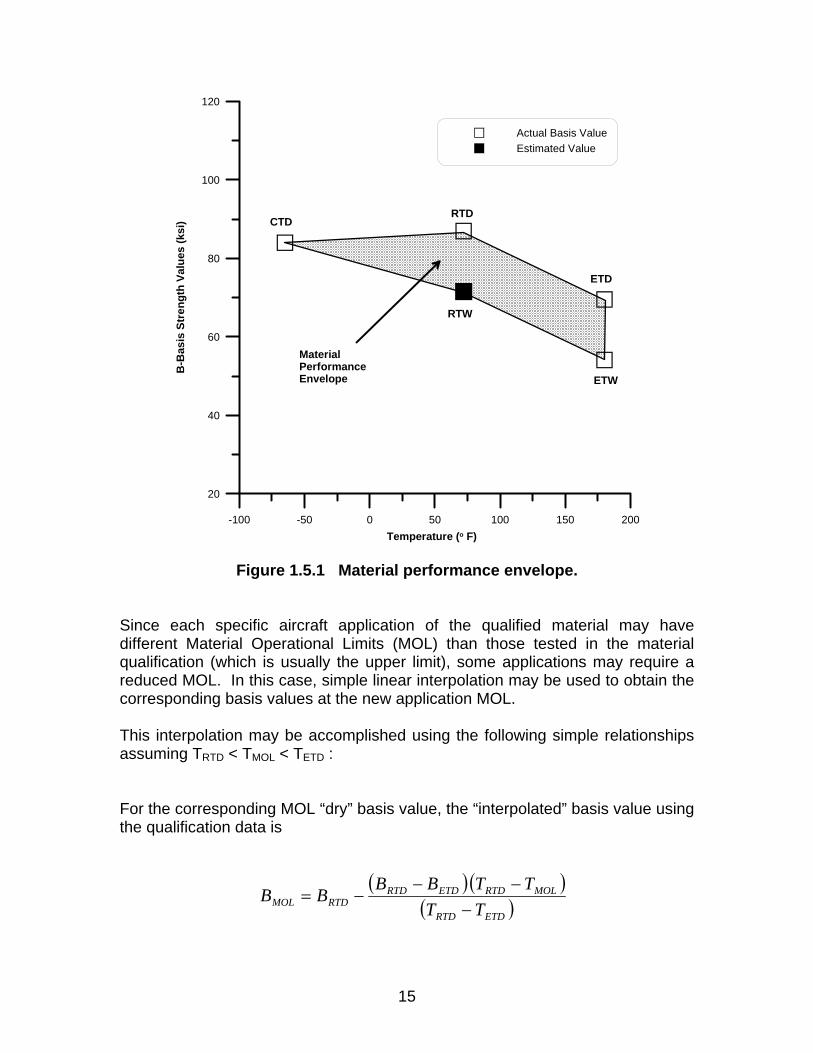
1.5.6. Material Performance Envelope and Interpolation Using the B-basis numbers, a material performance envelope may be generated for the material system by plotting these values as a function of temperature. Figure 1.5.1 shows an example material performance envelope using B-basis values.
15
-100 -50 0 50 100 150 200Temperature (o F)
20
40
60
80
100
120
B-B
asis
Str
engt
h Va
lues
(ksi
)
Actual Basis ValueEstimated Value
CTDRTD
ETD
ETW
RTW
MaterialPerformanceEnvelope
Figure 1.5.1 Material performance envelope. Since each specific aircraft application of the qualified material may have different Material Operational Limits (MOL) than those tested in the material qualification (which is usually the upper limit), some applications may require a reduced MOL. In this case, simple linear interpolation may be used to obtain the corresponding basis values at the new application MOL. This interpolation may be accomplished using the following simple relationships assuming TRTD < TMOL < TETD : For the corresponding MOL “dry” basis value, the “interpolated” basis value using the qualification data is
( ) ( )
( )ETDRTD
MOLRTDETDRTDRTDMOL TT
TTBBBB−
−−−=

16
where BMOL = new application basis value interpolated to TMOL BRTD = basis RTD strength value BETD = basis ETD strength value TRTD = RTD test temperature
TETD = ETD test temperature TMOL = new application MOL temperature
For the corresponding MOL “wet” basis value, an estimated Room Temperature Wet (RTW) value must be calculated. This may be accomplished by the simple relation
)( ETWETDRTDRTW BBBB −−= The “interpolated” wet basis value using the qualification data may then be obtained by
( ) ( )( )ETWRTW
MOLRTWETWRTWRTWMOL TT
TTBBBB−
−−−=
where: BMOL = new application basis value interpolated to TMOL BRTW = estimated basis RTW strength value BETW = basis ETW strength value TRTW = RTW (i.e., RTD) test temperature
TETW = ETW test temperature TMOL = new application MOL temperature
These equations may also be used for interpolated mean strengths as well as A-basis values with the appropriate substitutions. It should be noted that because unforeseen material property drop-offs with respect to temperature and environment can occur, extrapolation to a higher MOL should not be attempted without additional testing and verification. In addition, the interpolation equations shown above are practical for materials obeying typical mechanical behavior. In most cases, some minimal amount of testing may also be required to verify the interpolated values.
1.5.6.1. Interpolation Example This section provides an example of linear interpolations to a specific application environment less than the tested upper material limit used in qualification.

17
Assuming a specific application environment of 150o F, Figure 1.5.2 depicts the linear interpolation of the B-basis design allowable to this environment. Using the above equations along with the nominal testing temperatures (see Table 1.5.1), the interpolated basis values at 150o F become ETD : BMOL = 75.106 ksi ETW : BMOL = 59.746 ksi
-100 -50 0 50 100 150 200Temperature (o F)
20
40
60
80
100
120
B-B
asis
Str
engt
h Va
lues
(ksi
)
Actual Basis ValueEstimated Value
CTD
RTD
ETD
ETW
RTW
Figure 1.5.2 Example of 150o F interpolation for B-basis values.

18
2. TORAY 7781 FINISH 558/#2510 PROCEDURES AND PREPREG PROPERTIES

19
2.1. GENERAL All of the testing described in the report took place at Toray Composites (America), Inc. in Tacoma, Washington, except for the following tests:
Test Laboratory Test Property Integrated Technologies (Intec), Bothell, WA
-65°F (Dry) mechanical tests (0° & 90° Tension, 0° & 90° Comp. Modulus and In-plane Shear)
Rose Consultant, Half Moon Bay, CA
cured laminate transition glass temperature, Tg
2.1.1. Materials The Fiberglass Style 7781 Finish 558/#2510, FGF7781-07I, Plain Weave Fabric prepreg batches were manufactured by the hot melt method of resin impregnation. Advanced Glassfiber Yarns, Llc of Aiken, South Carolina manufactured the fiberglass fiber. BGF Industries of Altavista, Virginia performed the weaving of the fiberglass fabric. The resin mixing and impregnation were done by Toray Composites (America), Inc. at the Frederickson, WA facilities. This material qualification program characterized the physical, chemical and mechanical properties of FGF7781-07I prepreg material, namely; batches AF991102, AF991103 and AF991104. The prepreg batches were manufactured with two lots of fiberglass fabric and three batches of resin matrix. The FGF7781-07I batches were manufactured to nominal uncured resin content of 38 % (by weight) and a fiber areal weight (FAW) of 295 grams per square meter.
2.1.2. Lay-up/Bagging TCA Test Laboratories manufactured all the mechanical test laminates by laying up plies of the FGF7781-07I prepreg material in the desired orientations, and by vacuum bag cure. Both the ply orientation and vacuum bag assembly for cure were in accordance with Advanced General Aviation Transport Experiments (AGATE) “Material Qualification Methodology for Epoxy-Based Prepreg Composite Material System”, dated February 1999, TCA Material Process Specification, TCSPF-T-FG03, Revision 1 dated February 4, 2000, and TCA work instructions. Figure 2-1 describes the vacuum bag assembly for cure of the test laminates. The test laminates were vacuum debulked in accordance with TCA work instructions, TCWIN-U-M003.

20
2.1.3. Cure The test panels were cured in accordance with TCWIN-Q-M006 and per Figure 2-2. For the specimen selection methodology and batch traceability of each test property, batch replicates were sampled from at least two different panels covering at least two independent cycles per Figure 2-3. Test specimens were selected from each individual test panel. The test specimens were extracted from panel areas that were good, visually and based on non-destructive inspection techniques.
2.1.4. Non-Destructive Inspection (NDI) Laminates fabricated for mechanical testing were non-destructively inspected using a Sonix/KrautKramer Branson Ultrasonic equipment at 5MHz pulse.
Figure 2-1. Vacuum Bagging Stack Sequence
1 The solid FEP may not be necessary when the caul plate is treated with a release agent, for example, Frekote release agent.
Vacuum Sealant (Tack tape)
Caul
Vacuum Sealant (Tack tape)
Glass yarn
Solid FEP (optional)1
Edge dam (3 sides tack tape)
Laminate
Pressure plate
Surface breather
Vacuum bagMetal dam* (one edge only)
Edge breather
Edge breather Solid FEP (optional)1

21
0
50
100
150
200
250
300
0 50 100 150 200 250
Time, minutes
Tem
p, °
F
0
5
10
15
20
25
30
Vacuum, in H
g
Temperature
V acuum
Notes: (1) Apply 22 inches Hg minimum vacuum to the vacuum bag assembly and
check for leak before beginning the cure cycle. The leak rate shall be less than 2.0 inches Hg over 5 minutes.
(2) Apply the temperature ramp from ambient to 270 ± 10 °F at a rate of 3.0 ± 1.0 °F per minute.
(3) Maintain the cure temperature at 270 ± 10 °F for 120 ∼ 150 minutes. (4) Cool down the temperature to 170 °F or lower at a rate of 4.5 ± 0.5 °F per
minute before removing the vacuum. (5) Remove the bagged laminates from the autoclave and de-bag for inspection.
FIGURE 2-2. #2510 CURE CYCLE

22
FIGURE 2-3: SPECIMEN SELECTION METHODOLOGY AND BATCH TRACEABILITY
PER ENVIRONMENTAL CONDITION AND TEST METHOD
Material Batch
Autoclave Load (Independent cure Process)
Panel Manufacturing
Typical Number of Specimens (1)
BATCH 1
LOAD “A”
LOAD “B”
PANEL “A1”
PANEL “A2”
PANEL “B1”
PANEL “B2”
1 1 1 1
BATCH 2
LOAD “A”
LOAD “B”
PANEL “A1”
PANEL “A2”
PANEL “B1”
PANEL “B2”
1 1 1 1
BATCH 3
LOAD “A”
LOAD “B”
PANEL “A1”
PANEL “A2”
PANEL “B1”
PANEL “B2”
1 1 1 1
(1) 6 specimens for Tension, Compression Strength, In-plane Shear and Interlaminar Shear 2 specimens for Compression Modulus

23
2.1.5. Tabbing Tabs were used to ensure the accuracy of the tensile and compressive strength specimens. Tabs were applied to the tension and compression strength specimens in accordance with Section 3.1.4 of the AGATE “ Material Qualification Methodology for Epoxy-Based Prepreg Composite Material System”, dated February 1999, with the following exceptions; 1.) AF 163-2 film adhesive used to bond the tabs to the test specimens described below was further cured by placing the test specimens in a temperature chamber at 180 °F for 24 hours. This was because the AF163 was not fully cured, initially, at 180°F for 5 hours. The 180°F cure temperature was selected because it was the maximum temperature allowed by the AGATE methodology, described in section 3.1.4, since the cure temperature of the P707AG-15 was 270 ± 10°F
a.) 0° (warp) & 90° (fill) tension specimens for testing at -65°F (Dry), 75°F (Dry), 180°F (Dry) and 180°F (Wet).
2.) Hysol EA9628 film adhesive used to bond the tabs to the specimens described below was cured up to 260 °F for up to 120 minutes.
a.) 0° (warp) & 90° (fill) compressive strength tested -65°F (Dry), 75°F (Dry), 180°F (Dry) and 180°F (Wet).
The same material or strain compatible material tabs as the test coupon were used for compressive strength specimens. Fiberglass tabs were used for tension specimens. To retard the absorption of moisture into the tabs and bond lines of the tension specimens tested at hot/wet condition, the tab section (including the edges) were masked with a room-temperature curing “Plasti Dip” rubber coating prior to humidity conditioning. The rubber coat was peeled off just before testing. The National Institute for Aviation Research (NIAR) of Wichita State University bonded the tabs and machined the 0° (warp) & 90° (fill) compressive strength specimens that were tested at 180°F (Wet).
2.1.6. FAA Test Coupon Conformity and Test Witness The material traceability and test specimen conformity were performed for the cured laminate mechanical test properties of the program. For the physical properties, material traceability was verified by TCA inspection section only.
2.1.6.1. Test Coupon Conformity A conformity traveler accompanied each group of test specimens for cured lamina mechanical properties. The conformity traveler recorded the materials and process definition, completion and verification by inspection of each process, that included lay-up, cure cycle, tabbing and final coupon dimensions. The FAA Designated Airworthiness Representative (DAR) performed the test specimen conformity and reviewed the completeness of traveler conformity records. Finally, the FAA DAR

24
prepared a statement of conformity, FAA 8130-3 tags for all the test panels and test specimens, prior to environmental conditioning and testing of the test specimens. The conformity of all the test panels was performed December 21, 1999. However, additional test panels, specifically for compressive strength test, were fabricated and conformed on April 12, 2000 and August 1, 2000 due to problems in the testing process, for example, tabbing and machining of specimens. The conformed additional test panels, for compressive strength test, were replacements for previously fabricated test panels. The conformity of all the test specimens was performed February 8, 2000, except 0° compressive strength that was performed February 23, 2000. However, the additional compressive strength specimens were conformed April 14, 2000 and April 21, 2000, to replace the test specimen with “out-of-mode” failure, for example, tab failure due to adhesive failure.
2.1.6.2. Test Witness The FAA Designated Engineering Representative (DER) witnessed all the cured lamina mechanical test property testing of at least one batch of the prepreg material for the program. TCA personnel that were authorized to witness on behalf of the FAA DER witnessed the rest of the tests. The test dates of the lamina mechanical test properties were described in the tables of test results.

25
2.2. Prepreg Documentation by Prepreg Lot Prepreg Documentation Prepreg Manufacturer & Product ID: Toray Composites FGF7781-07I
Material Identification (weave, form, class, etc.): Fiberglass/Epoxy 8HS Woven Fabric Impregnation Method: Hot Melt
Prepreg Batch or Lot # AF991102 AF991103 AF991104 Batch (Lot) ID as labeled on samples 911-081 911-082 911-083 Date of Manufacture 11/24/1999 11/24/1999 11/24/1999 Expiration Date 11/24/2001 11/24/2001 11/24/2001 Resin Content [%] 39.0% 38.0% 37.8% Reinforcement Areal Weight & Test Method
292 g/m2 SACMA SRM 23R-94
296 g/m2
SACMA SRM 23R-94 291 g/m2
SACMA SRM 23R-94 Resin Flow & Test Conditions
24.5% @ 250°F
23.0% @ 250°F
23.5% @ 250°F
Gel Time & Test Conditions
9.9 minutes @ 250°F
10.0 minutes @ 250°F
10.7 minutes @ 250°F
Volatile Content 0.17% 0.16% 0.17%
Reinforcement Documentation Fiber/Fabric Manufacturer & Product ID: BGF Industries, Inc Style 7781 Finish 558 Precursor Type: E-glass Nominal Filament Count: Finish/Sizing Type and %: 558 (0.1%) Nominal tow or yarn count/inch: /inch Twist:
Fabric Batch or Lot # 920351 920351 920352 Date of Manufacture 11/1999 11/1999 11/1999 Average Fiber Density per Lot & Test Method
2.565 g/cc 2.565 g/cc 2.565 g/cc
Matrix Documentation Resin Manufacturer & Product ID: Toray Composites #2510 Matrix Batch or Lot # 1-BRS 1-BRW 1-BRX
Date of Manufacture 11/17/1999 11/21/1999 11/22/1999 Average Neat Resin Density by Lot & Test Method
1.265 g/cc ASTM D792
1.265 g/cc ASTM D792
1.260 g/cc ASTM D792
Notes: (1)Test methods to determine resin content, reinforcement areal weight, resin flow, gel time, and volatile content are defined in TORAY Material Specifications (see reference section). (2) These information and test results were submitted to NIAR by TORAY Composites (AMERICA), Inc.

26
2.3. Data Documentation MATERIAL IDENTIFICATION R material identification Style 7781/#2510 8-harness Fiberglass Fabric R material class Fiberglass/Epoxy PREPREG ANALYSIS R ply manufacturer Toray Composites (America), Inc R date of manufacture 11/1999 R material lot number AF991102, AF991103, AF991104 R commercial designation FGF7781-07I R material form 8-harness Fiberglass Woven Fabric Prepreg R reinforcement areal weight 285 – 305 g/m2 reinforcement areal weight test method Solvent Extraction R resin content 35 – 41 % REINFORCEMENT ANALYSIS F precursor type Silica R commercial designation Style 7781 Finish 558 R manufacturer BGF Industries, Inc. R date of manufacture 11/1999 R lot number 920351, 920352 R surface treatment (Y/N) Y R surface finish (sizing) identification 558 R density (Average per lot) 2.565 g/cm3 density test method R nominal filament count 1/tow R nominal tow or yarn count/inch 3.0 R twist No Twist R fiber areal weight (when applicable) 285 – 305 g/m2 fiber areal weight test method SRM 23 MATRIX MATERIAL ANALYSIS R commercial designation #2510 R manufacturer Toray Composites (America), Inc R date of manufacture 11/1999 R lot number (R – not prepregged, 1-BRS, 1-BRW, 1-BRX F – prepregged) R nominal density and test method 1.263 g/cc ASTM D792 PROCESSING INFORMATION F part (panel) manufacturer Toray Composites (America), Inc R date of manufacture (date completed) 12/1999 – 7/2000 cure cycle (for each state) R process stage type Cure Cycle R process time 120 +10/-0 minutes R process temperature 270 ± 3 °F R process pressure none R other critical control parameters minimum 22 inHg vacuum

27
LAMINA ANALYSIS R form (panel, tube, etc.) Panel R ply count 10 – warp & fill tensile; 12 – warp & fill comp strength; 12 – warp & fill comp modulus; 12 – IPS; 10 – ILSS R lay-up code (warp)10 – warp tensile; (fill)10 – fill tensile; (warp)12 – warp comp strength; (fill)12 – fill comp strength; (warp)12 – warp comp modulus; (fill)12 – fill comp modulus; (warp/fill)3S – IPS; (warp)10 – ILSS R fiber volume 44.9% Average F void content 3.3% Average density 1.806g/cc Average R glass transition temperature (wet, nominal) 261°F R glass transition temperature (dry, nominal) 290°F R glass transition temperature test method DMA E’ SPECIMEN PREPARATION R specimen orientation fill, warp, fill/warp F tab adhesive curing temperature (nominal) up to 260°F MECHANICAL TESTING R number of specimens See data files R test procedure ASTM D 3039 (Tensile), (citing all deviations from standard SACMA SRM 1 (Comp), procedures including reporting ASTM D 5379 (IPS), requirements) ASTM D 2344 (ILSS) R date of applicable standard 1995(Ten), 1994(Comp), 1993(IPS), 1989(ILSS) R date of testing 2/2000 – 7/2000 R specimen thickness for each specimen nominal: 0.1040”(warp & fill tensile), 0.1248”(warp & fill comp strength), 0.1248” (warp & fill comp modulus), 0.1248” (IPS), 0.1040” (ILSS) R specimen conditioning method DOT/FAA/AR-00/47 Section 3.2, Sept. 2000 R conditioning temperature 145 ± 5°F R conditioning humidity 85 ± 5% R conditioning time until saturation (9 to 14 weeks) R conditioning environment (if not lab air) for fluid sensitivity: Jet Fuel, Hydraulic Fluid & MEK (IPS only) R fastener type (if any) N/A R fastener torque-up conditions (if any) N/A R test temperature -65 ± 5°F, 75 ± 5°F, 180 ± 5°F F moisture content Dry : 0.1 - 0.4 % Wet : 1.1 – 1.6% R soak time at test conditions -65°F: 5 – 6 minutes 180°F: 2 – 3 minutes R failure mode identification and location Per specimen R all non-normalized (raw) data Per specimen R method of calculating modulus 1000 – 3000 microstrain (Tens) 1000 – 3000 microstrain (Comp) 2500 – 6500 microstrain (IPS) nominal ply thickness 0.0104 in. nominal fiber density 2.565 g/cm3 nominal fiber areal weight 295 g/m2
R – Required for all data F – Required for fully-approved data These requirements are current for MIL-HDBK-17-1E, which supercedes for any discrepancies.

28
3. TORAY 7781 FINISH 558/#2510 LAMINA PROPERTIES

29
3.1. Test Results
3.1.1. Summary
MATERIAL: Toray Composites Style 7781/#2510 8-harness Fiberglass Fabric 7781 FG/#2510
PREPREG: Toray Composites FGF7781-07I Summary
FIBER: BGF Industries, Inc. Style 7781 Finish 558 RESIN: Toray Composites #2510
Tg (dry): 143 °C Tg (wet): 127 °C Tg METHOD: DMA (SRM 18-94)
PROCESSING: Vacuum bag cure (minimum 560 mmHg): 132 ± 2 °F for 120 +10/-0 minutes
Date of fiber manufacture 11/1999 Date of testing 02/2000 – 07/2000
Date of resin manufacture 11/1999 Date of data submittal 04/2002 – 07/2002
Date of prepreg manufacture 11/1999 Date of analysis 07/2002 – 09/2002
Date of composite manufacture 12/1999
LAMINA MECHANICAL PROPERTY SUMMARY
Data Reported as: Measured (Normalized by CPT= 0.2642 mm)
CTD RTD ETD ETW
B-Basis Mean B-Basis Mean B-Basis Mean B-Basis Mean
F1tu (MPa) 526.56
(519.28) 565.56
(558.84) 418.02
(415.11) 444.60
(442.26) 419.52
(420.13) 446.20
(447.60) 318.25
(319.04) 338.48
(339.90)
E1t (GPa) --- 25.86
(25.48) --- 23.77
(23.61) --- 22.84
(22.91) --- 21.61
(21.71)
ν12tu --- 0.163 --- 0.140 --- 0.128 --- 0.115
F2tu (MPa) 397.80
(399.07) 431.89
(432.84) 326.49
(323.89) 350.47
(347.39) 350.80
(350.52) 376.56
(375.95) 272.19
(272.29) 292.18
(292.05)
E2t (GPa) --- 24.22
(24.25) --- 22.97
(22.75) --- 21.71
(21.69) --- 20.17
(20.18)
F1cu (MPa) 555.65
(543.08) 623.72
(609.21) 477.49
(476.09) 527.40
(525.55) 393.52
(393.79) 434.65
(434.70) 315.28
(318.01) 348.23
(351.04)
E1c (GPa) --- 26.01
(26.65) --- 26.49
(26.36) --- 26.42
(26.33) --- 24.30
(24.27)
F2cu (MPa) 492.68
(494.61) 544.56
(543.25) 413.92
(416.61) 451.16
(451.17) 339.00
(340.81) 369.50
(369.48) 269.65
(274.22) 293.52
(296.91)
E2c (GPa) --- 25.33
(25.43) --- 24.97
(24.91) --- 24.65
(24.61) --- 23.24
(23.24)
F12su (MPa) 150.79 163.67 118.50 127.18 98.60 105.82 74.83 80.32
G12s (GPa) --- 4.96 --- 4.37 --- 3.71 --- 3.15
F13su** (MPa) --- --- 52.15 59.93 --- --- --- ---
** Apparent interlaminar shear strength

30
3.1.2. Individual Test Summaries
31
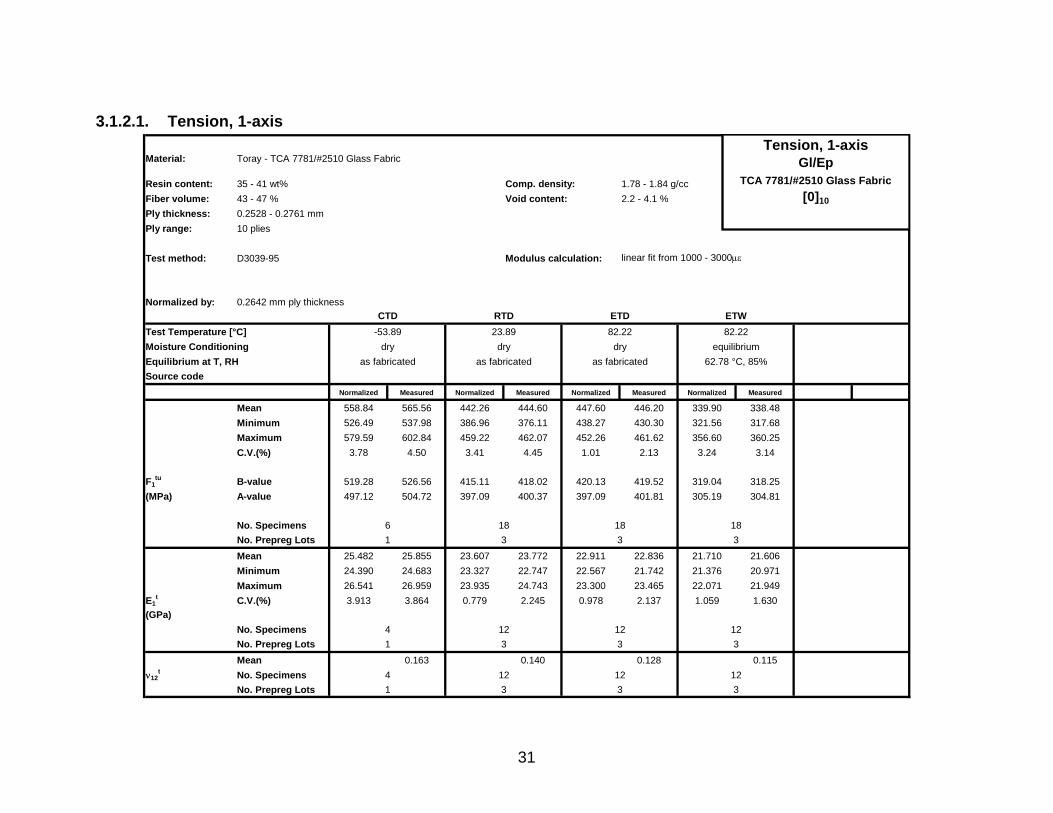
3.1.2.1. Tension, 1-axis
Material: Toray - TCA 7781/#2510 Glass Fabric
Resin content: 35 - 41 wt% Comp. density: 1.78 - 1.84 g/ccFiber volume: 43 - 47 % Void content: 2.2 - 4.1 %Ply thickness: 0.2528 - 0.2761 mmPly range: 10 plies
Test method: D3039-95 Modulus calculation: linear fit from 1000 - 3000µε
Normalized by: 0.2642 mm ply thickness
Test Temperature [°C] -53.89 23.89 82.22Moisture Conditioning dry dry dryEquilibrium at T, RH as fabricated as fabricated as fabricatedSource code
Normalized Measured Normalized Measured Normalized Measured Normalized Measured
Mean 558.84 565.56 442.26 444.60 447.60 446.20 339.90 338.48Minimum 526.49 537.98 386.96 376.11 438.27 430.30 321.56 317.68Maximum 579.59 602.84 459.22 462.07 452.26 461.62 356.60 360.25C.V.(%) 3.78 4.50 3.41 4.45 1.01 2.13 3.24 3.14
F1tu B-value 519.28 526.56 415.11 418.02 420.13 419.52 319.04 318.25
(MPa) A-value 497.12 504.72 397.09 400.37 397.09 401.81 305.19 304.81
No. SpecimensNo. Prepreg LotsMean 25.482 25.855 23.607 23.772 22.911 22.836 21.710 21.606Minimum 24.390 24.683 23.327 22.747 22.567 21.742 21.376 20.971Maximum 26.541 26.959 23.935 24.743 23.300 23.465 22.071 21.949
E1t C.V.(%) 3.913 3.864 0.779 2.245 0.978 2.137 1.059 1.630
(GPa)No. SpecimensNo. Prepreg LotsMean 0.163 0.140 0.128 0.115
ν12t No. Specimens
No. Prepreg Lots
183
12
82.22equilibrium
62.78 °C, 85%
18
123
3
123
CTD RTD ETD ETW
3
61
4
41
123
183
1123
123
Tension, 1-axisGl/Ep
TCA 7781/#2510 Glass Fabric[0]10

32
3.1.2.2. Tension, 2-axis
Material: Toray - TCA 7781/#2510 Glass Fabric
Resin content: 35 - 41 wt% Comp. density: 1.78 - 1.90 g/ccFiber volume: 43 - 49 % Void content: 0.0 - 4.2 %Ply thickness: 0.2565 - 0.2699 mmPly range: 10 plies
Test method: D3039-95 Modulus calculation: linear fit from 1000 - 3000µε
Normalized by: 0.2642 mm ply thickness
Test Temperature [°C] -53.89 23.89 82.22Moisture Conditioning dry dry dryEquilibrium at T, RH as fabricated as fabricated as fabricatedSource code
Normalized Measured Normalized Measured Normalized Measured Normalized Measured
Mean 432.84 431.89 347.39 350.47 375.95 376.56 292.05 292.18Minimum 402.18 397.21 317.73 318.56 360.29 365.28 274.66 275.86Maximum 458.87 460.64 373.96 380.14 387.20 389.56 305.43 302.75C.V.(%) 5.28 5.63 4.39 4.04 1.63 1.61 2.82 3.31
F2tu B-value 399.07 397.80 323.89 326.49 350.52 350.80 272.29 272.19
(MPa) A-value 380.15 378.71 308.29 310.57 333.63 333.69 259.17 258.92
No. SpecimensNo. Prepreg LotsMean 24.251 24.218 22.746 22.973 21.689 21.707 20.178 20.165Minimum 23.970 23.856 22.478 22.252 21.367 21.098 19.808 19.821Maximum 24.630 24.821 23.019 23.633 22.465 22.596 20.375 20.623
E2t C.V.(%) 1.160 1.730 0.640 1.867 1.320 1.781 0.936 1.423
(GPa)No. SpecimensNo. Prepreg Lots
41
123
183
61
CTD RTD ETD ETW
3
183
123
3
12
82.22equilibrium
62.78 °C, 85%
18
Tension, 2-axisGl/Ep
TCA 7781/#2510 Glass Fabric[0]10

33
3.1.2.3. Compression, 1-axis
Material: Toray - TCA 7781/#2510 Glass Fabric
Resin content: 35 - 41 wt% Comp. density: 1.74 - 1.85 g/ccFiber volume: 41 - 48 % Void content: 1.9 - 7.5 %Ply thickness: 0.2519 - 0.2841 mm Ply range: 12 plies
Test method: SRM 1-94 Modulus calculation: linear fit from 1000 - 3000µε
Normalized by: 0.2642 mm ply thickness
Test Temperature [°C] -53.89 23.89 82.22Moisture Conditioning dry dry dryEquilibrium at T, RH as fabricated as fabricated as fabricatedSource code
Normalized Measured Normalized Measured Normalized Measured Normalized Measured
Mean 609.21 623.72 525.55 527.40 434.70 434.65 351.04 348.23Minimum 577.47 596.92 463.65 442.76 395.32 397.81 310.18 317.30Maximum 677.08 677.62 574.62 581.00 462.35 469.68 386.59 380.49C.V.(%) 6.10 4.56 5.43 6.19 3.49 4.72 6.85 5.83
F1cu B-value 543.08 555.65 476.09 477.49 393.79 393.52 318.01 315.28
(MPa) A-value 506.05 517.52 443.26 444.36 366.63 366.22 296.08 293.40
No. SpecimensNo. Prepreg LotsMean 26.654 26.012 26.356 26.488 26.333 26.415 24.272 24.299Minimum 26.328 25.091 25.587 24.308 24.980 24.213 23.874 23.250Maximum 26.981 26.932 26.901 27.828 28.187 28.981 24.508 25.118
E1c C.V.(%) 1.733 5.004 2.082 4.714 4.444 6.846 1.246 2.634(GPa)
No. SpecimensNo. Prepreg Lots
6
82.22equilibrium
62.78 °C, 85%
18
3
183
63
3
CTD RTD ETD ETW
183
62
22
63
Compression, 1-axisGl/Ep
TCA 7781/#2510 Glass Fabric[0]12

34
3.1.2.4. Compression, 2-axis
Material: Toray - TCA 7781/#2510 Glass Fabric
Resin content: 35 - 41 wt% Comp. density: 1.79 - 1.82 g/ccFiber volume: 43 - 48 % Void content: 1.6 - 4.8 %Ply thickness: 0.2562 - 0.2731 mmPly range: 12 plies
Test method: SRM 1-94 Modulus calculation: linear fit from 1000 - 3000µε
Normalized by: 0.2642 mm ply thickness
Test Temperature [°C] -53.89 23.89 82.22Moisture Conditioning dry dry dryEquilibrium at T, RH as fabricated as fabricated as fabricatedSource code
Normalized Measured Normalized Measured Normalized Measured Normalized Measured
Mean 543.25 544.56 451.17 451.16 369.48 369.50 296.91 293.52Minimum 531.06 535.78 403.69 403.37 335.33 335.06 264.65 256.03Maximum 552.43 552.64 475.01 478.64 394.55 402.69 318.97 316.40C.V.(%) 1.33 1.17 4.34 4.70 4.58 5.11 5.14 5.23
F2cu B-value 494.61 492.68 416.61 413.92 340.81 339.00 274.22 269.65
(MPa) A-value 467.42 463.68 467.42 389.25 321.83 318.79 258.90 253.54
No. SpecimensNo. Prepreg LotsMean 25.431 25.329 24.908 24.969 24.611 24.650 23.240 23.241Minimum 25.132 25.193 24.191 23.993 23.374 23.247 22.829 22.549Maximum 25.730 25.465 26.231 26.069 26.268 26.523 23.795 23.763
E2c C.V.(%) 1.662 0.759 3.034 3.319 4.120 4.715 1.902 2.017(GPa)
No. SpecimensNo. Prepreg Lots
22
63
183
62
CTD RTD ETD ETW
3
183
63
3
6
82.22equilibrium
62.78 °C, 85%
21
Compression, 2-axisGl/Ep
TCA 7781/#2510 Glass Fabric[0]12
35
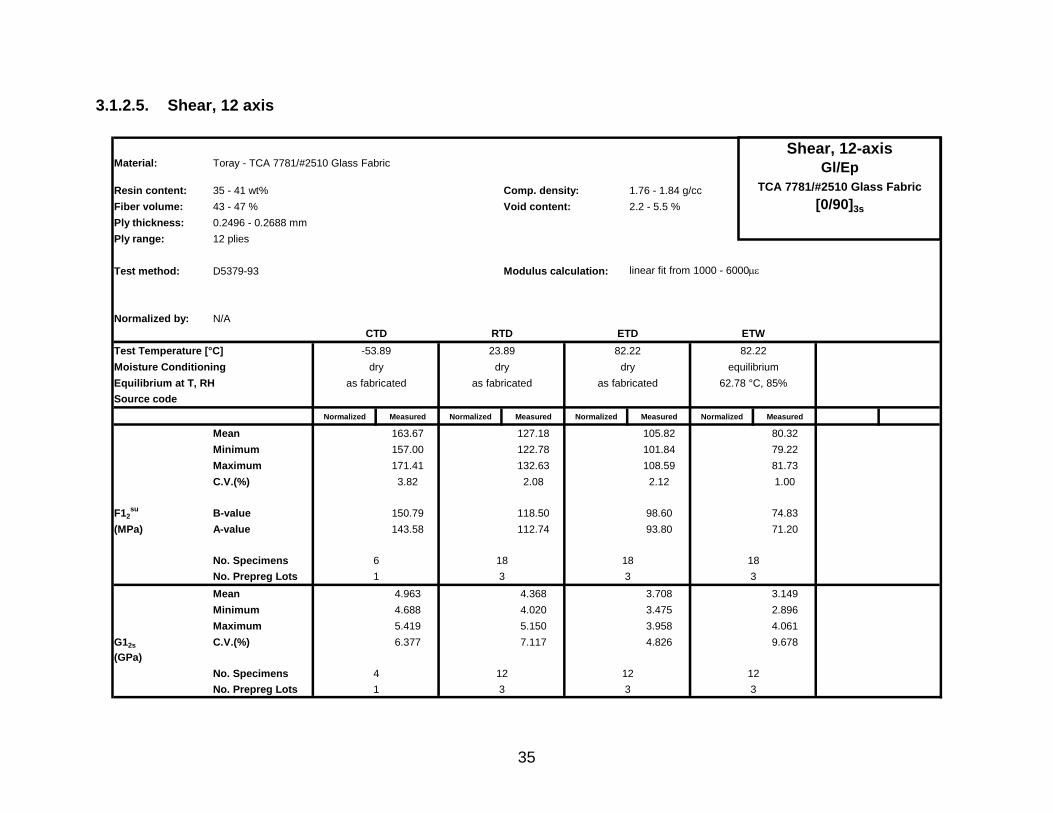
3.1.2.5. Shear, 12 axis
Material: Toray - TCA 7781/#2510 Glass Fabric
Resin content: 35 - 41 wt% Comp. density: 1.76 - 1.84 g/ccFiber volume: 43 - 47 % Void content: 2.2 - 5.5 %Ply thickness: 0.2496 - 0.2688 mmPly range: 12 plies
Test method: D5379-93 Modulus calculation: linear fit from 1000 - 6000µε
Normalized by: N/A
Test Temperature [°C] -53.89 23.89 82.22Moisture Conditioning dry dry dryEquilibrium at T, RH as fabricated as fabricated as fabricatedSource code
Normalized Measured Normalized Measured Normalized Measured Normalized Measured
Mean 163.67 127.18 105.82 80.32Minimum 157.00 122.78 101.84 79.22Maximum 171.41 132.63 108.59 81.73C.V.(%) 3.82 2.08 2.12 1.00
F12su B-value 150.79 118.50 98.60 74.83
(MPa) A-value 143.58 112.74 93.80 71.20
No. SpecimensNo. Prepreg LotsMean 4.963 4.368 3.708 3.149Minimum 4.688 4.020 3.475 2.896Maximum 5.419 5.150 3.958 4.061
G12s C.V.(%) 6.377 7.117 4.826 9.678(GPa)
No. SpecimensNo. Prepreg Lots
12
82.22equilibrium
62.78 °C, 85%
18
3
183
123
3
CTD RTD ETD ETW
183
61
41
123
Shear, 12-axisGl/Ep
TCA 7781/#2510 Glass Fabric[0/90]3s

36
3.1.2.6. Shear, 13 axis NOTES: These values represent the apparent interlaminar shear properties and are to be used for quality control purposes only. Do not use these values for interlaminar shear strength design values.
Material: Toray - TCA 7781/#2510 Glass Fabric
Resin content: 35 - 41 wt% Comp. density: 1.72 - 1.81 g/ccFiber volume: 41 - 45 % Void content: 2.1 - 8.5 %Ply thickness: 0.2480 - 0.2752 mmPly range: 10 plies
Test method: D2344-89 Modulus calculation: linear fit from 1000 - 6000µε
Normalized by: N/A
Test Temperature [°C] -53.89 23.89 82.22Moisture Conditioning dry dry dryEquilibrium at T, RH as fabricated as fabricated as fabricatedSource code
Normalized Measured Normalized Measured Normalized Measured Normalized Measured
Mean 59.935Minimum 52.403Maximum 68.707C.V.(%) 5.213
F13su B-value 52.150
(MPa) A-value 46.522
No. SpecimensNo. Prepreg Lots
82.22equilibrium
62.78 °C, 85%
CTD RTD ETD ETW
183
Shear, 13-axisGl/Ep
TCA 7781/#2510 Glass Fabric[0]10

37
3.1.3. Individual Test Charts

38
3.1.3.1. Tension, 1-axis NOTE: The symbols represent the ‘pooled’ average of all tests, and the bars represent the upper and lower limit of the data. The 180° dry and wet data has been staggered for clarity
0° Tension -- Normalized StrengthTCA 7781/#2510 Glass Fabric
0
100
200
300
400
500
600
-100 -50 0 50 100
Temperature (°C)
Stre
ngth
(MPa
)
Conditioning X Dry O Wet

39
3.1.3.2. Tension, 2-axis
NOTE: The symbols represent the ‘pooled’ average of all tests, and the bars represent the upper and lower limit of the data. The 180° dry and wet data has been staggered for clarity.
90° Tension -- Normalized StrengthTCA 7781/#2510 Glass Fabric
0
100
200
300
400
500
600
-100 -50 0 50 100
Temperature (°C)
Stre
ngth
(MPa
)
Conditioning X Dry O Wet

40
3.1.3.3. Compression, 1-axis NOTE: The symbols represent the ‘pooled’ average of all tests, and the bars represent the upper and lower limit of the data. The 180° dry and wet data has been staggered for clarity.
0° Compression -- Normalized StrengthTCA 7781/#2510 Glass Fabric
0
100
200
300
400
500
600
700
-100 -50 0 50 100
Temperature (°C)
Stre
ngth
(Mpa
)
Conditioning X Dry O Wet

41
3.1.3.4. Compression, 2-axis NOTE: The symbols represent the ‘pooled’ average of all tests, and the bars represent the upper and lower limit of the data. The 180° dry and wet data has been staggered for clarity.
90° Compression -- Normalized StrengthTCA 7781/#2510 Glass Fabric
0
100
200
300
400
500
600
-100 -50 0 50 100
Temperature (°C)
Str
engt
h (M
Pa)
Conditioning X Dry O Wet

42
3.1.3.5. Shear, 12 axis NOTE: The symbols represent the ‘pooled’ average of all tests, and the bars represent the upper and lower limit of the data. The 180° dry and wet data has been staggered for clarity
In-Plane Shear -- Measured StrengthTCA 7781/#2510 Glass Fabric
0
50
100
150
200
-100 -50 0 50 100
Temperature (°C)
Stre
ngth
(MPa
)
Conditioning X Dry O Wet

43
3.1.3.6. Shear, 13 axis NOTE: The symbols represent the ‘pooled’ average of all tests, and the bars represent the upper and lower limit of the data. The 180° dry and wet data has been staggered for clarity.
ILSS -- Measured StrengthTCA 7781/#2510 Glass Fabric
0
10
20
30
40
50
60
70
0 5 10 15 20 25 30
Temperature (°C)
Stre
ngth
(MPa
)
Conditioning X Dry

44
3.2. Raw Data
Specimen Naming Convention
Test coupons were identified using a ten-digit specimen code, with the significance of each digit delineated below. A representative sample ID is shown for reference purposes.
A1 – 910-041 – 1-3 0° Tension
1st Character: Independent Cure Cycle ‘A’ designates a cure cycle that was independently cured from ‘B’ cure cycle
2nd Character: Panel Number Numeric order of the panel fabricated for each cure cycle
3rd ~ 8th Character: Master Roll Number Prepreg Master Roll number used to fabricate the panel
9th ~ 10th Character: Sample Number The samples cut from each panel, increasing numerically.
Panel Type ID Panels/specimens were also identified with the test type

45
3.2.1. Raw Data Spreadsheets and Scatter Charts

46
normalizing tply[mm]
0.2642
Specimen Cure Prepreg ASAP Strength Modulus Poisson's Avg. Specimen # Plies in Avg. tply Strengthnorm ModulusnormNumber Cycle Lot # Batch # [MPa] [GPa] Ratio Thickn. [mm] Laminate [mm] [MPa] [GPa]
A1-911-081-1-3 A 1 1 434.156 23.221 0.144 2.691 10 0.26911 442.296 23.656A2-911-081-1-3 A 1 1 434.224 23.458 0.144 2.687 10 0.26873 441.740 23.864A1-911-081-1-4 A 1 1 429.181 2.699 10 0.26993 438.549B1-911-081-1-3 B 1 2 457.026 24.151 0.141 2.618 10 0.26180 452.939 23.935B2-911-081-1-3 B 1 2 376.114 22.747 0.140 2.718 10 0.27178 386.964 23.403B1-911-081-1-4 B 1 2 456.282 2.659 10 0.26586 459.222A1-911-082-1-1 A 2 3 437.019 23.430 0.137 2.658 10 0.26576 439.666 23.572A2-911-082-1-1 A 2 3 459.453 24.226 0.142 2.583 10 0.25827 449.204 23.685A1-911-082-1-2 A 2 3 443.527 2.677 10 0.26767 449.412B1-911-082-1-1 B 2 4 462.065 24.071 0.139 2.597 10 0.25966 454.201 23.661B2-911-082-1-1 B 2 4 446.359 23.622 0.140 2.609 10 0.26086 440.779 23.327B1-911-082-1-2 B 2 4 452.859 2.616 10 0.26162 448.505A1-911-083-1-1 A 3 5 451.775 24.161 0.141 2.568 10 0.25679 439.177 23.488A2-911-083-1-1 A 3 5 460.891 24.743 0.135 2.528 10 0.25281 441.082 23.679A1-911-083-1-2 A 3 5 457.950 2.576 10 0.25756 446.501B1-911-083-1-1 B 3 6 445.863 23.718 0.140 2.605 10 0.26053 439.733 23.392B2-911-083-1-1 B 3 6 452.239 23.718 0.136 2.631 10 0.26307 450.369 23.620B1-911-083-1-2 B 3 6 445.857 2.609 10 0.26091 440.370
Average 444.602 23.772 0.140 Averagenorm 0.26293 442.262 23.607Standard Dev. 19.775 0.534 0.003 Standard Dev.norm 15.084 0.184
Coeff. of Var. [%] 4.448 2.245 2.095 Coeff. of Var. [%]norm 3.411 0.779Min. 376.114 22.747 0.135 Min. 0.2528 386.964 23.327Max. 462.065 24.743 0.144 Max. 0.2718 459.222 23.935
Number of Spec. 18 12 12 Number of Spec. 18 12
0° Tension -- (RTD)Strength & ModulusTCA 7781/#2510 Glass Fabric

47
0
1
2
3
4
5
6
0 100 200 300 400 500 600 700 800
0° Tensile Strength [MPa]
ASAP
Bat
ch #
0
1
2
3
Prepeg Lot #
ASAP Batch #
Prepreg Lot #
0° Tension -- (RTD)Normalized StrengthTCA 7781/#2510 Glass Fabric
Pooled Average = 442.262 [MPa]Pooled Standard Deviation = 15.084 [MPa]
Pooled Coeff. of Variation = 3.411 [%]
0
1
2
3
4
5
6
0 5 10 15 20 25 30 35 40 45 50
0° Tensile Modulus [GPa]
ASA
P Ba
tch
#
0
1
2
3
Prepreg Lot #
ASAP Batch #
Prepreg Lot #
0° Tension -- (RTD)Normalized ModulusTCA 7781/#2510 Glass Fabric
Pooled Average = 23.607 [GPa]Pooled Standard Deviation = 0.184 [GPa]Pooled Coeff. of Variation = 0.779 [%]

48
normalizing tply[mm]
0.2642
Specimen Cure Prepreg ASAP Strength Modulus Poisson's Avg. Specimen # Plies in Avg. tply Strengthnorm ModulusnormNumber Cycle Lot # Batch # [MPa] [GPa] Ratio Thickn. [mm] Laminate [mm] [MPa] [GPa]
A2-911-081-1-2 A 1 1 552.163 24.683 0.140 2.667 10 0.26670 557.472 24.921A2-911-081-1-1 A 1 1 537.978 26.338 0.190 2.662 10 0.26619 542.116 26.541A1-911-081-1-2 A 1 1 569.727 2.687 10 0.26873 579.588B1-911-081-1-1 B 1 2 602.836 25.442 0.140 2.532 10 0.25324 577.912 24.390B2-911-081-1-1 B 1 2 544.280 26.959 0.180 2.555 10 0.25552 526.486 26.077B1-911-081-1-2 B 1 2 586.405 2.565 10 0.25654 569.489
Average 565.565 25.855 0.163 Averagenorm 0.26115 558.844 25.482Standard Dev. 25.434 0.999 0.026 Standard Dev.norm 21.147 0.997
Coeff. of Var. [%] 4.497 3.864 16.184 Coeff. of Var. [%]norm 3.784 3.913Min. 537.978 24.683 0.140 Min. 0.2532 526.486 24.390Max. 602.836 26.959 0.190 Max. 0.2687 579.588 26.541
Number of Spec. 6 4 4 Number of Spec. 6 4
0° Tension -- (CTD)Strength & ModulusTCA 7781/#2510 Glass Fabric

49
0
1
2
3
4
5
6
0 100 200 300 400 500 600 700 800 900 1000
0° Tensile Strength [MPa]
ASAP
Bat
ch #
0
1
2
3
Prepeg Lot #
ASAP Batch #
Prepreg Lot #
0° Tension -- (CTD)Normalized StrengthTCA 7781/#2510 Glass Fabric
Pooled Average = 558.844 [MPa]Pooled Standard Deviation = 21.147 [MPa]
Pooled Coeff. of Variation = 3.784 [%]
0
1
2
3
4
5
6
0 5 10 15 20 25 30 35 40 45 50
0° Tensile Modulus [GPa]
ASAP
Bat
ch #
0
1
2
3
Prepreg Lot #
ASAP Batch #
Prepreg Lot #
0° Tension -- (CTD)Normalized ModulusTCA 7781/#2510 Glass Fabric
Pooled Average = 25.482 [GPa]Pooled Standard Deviation = 0.997 [GPa]Pooled Coeff. of Variation = 3.913 [%]

50
normalizing tply[mm]
0.2642
Specimen Cure Prepreg ASAP Strength Modulus Poisson's Avg. Specimen # Plies in Avg. tply Strengthnorm ModulusnormNumber Cycle Lot # Batch # [MPa] [GPa] Ratio Thickn. [mm] Laminate [mm] [MPa] [GPa]
A1-911-081-1-7 A 1 1 340.487 21.304 0.115 2.666 10 0.26657 343.598 21.498A2-911-081-1-7 A 1 1 345.717 21.458 0.116 2.694 10 0.26944 352.631 21.887A1-911-081-1-8 A 1 1 349.883 2.680 10 0.26805 355.031B1-911-081-1-7 B 1 2 343.299 21.075 0.114 2.744 10 0.27440 356.601 21.891B2-911-081-1-7 B 1 2 333.825 20.971 0.116 2.698 10 0.26980 340.951 21.419B1-911-081-1-8 B 1 2 333.811 2.725 10 0.27247 344.307A1-911-082-1-4 A 2 3 329.220 21.699 0.117 2.677 10 0.26767 333.588 21.987A2-911-082-1-4 A 2 3 335.981 21.924 0.118 2.628 10 0.26276 334.204 21.808A1-911-082-1-5 A 2 3 317.680 2.674 10 0.26739 321.560B1-911-082-1-4 B 2 4 345.762 21.917 0.112 2.605 10 0.26053 341.008 21.616B2-911-082-1-4 B 2 4 333.416 21.407 0.112 2.638 10 0.26378 332.935 21.376B1-911-082-1-5 B 2 4 331.460 2.598 10 0.25977 325.946A1-911-083-1-4 A 3 5 360.245 21.932 0.118 2.593 10 0.25933 353.664 21.531A2-911-083-1-1 A 3 5 334.931 21.878 0.114 2.665 10 0.26650 337.894 22.071A1-911-083-1-5 A 3 5 349.619 2.593 10 0.25933 343.231B1-911-083-1-4 B 3 6 325.145 21.755 0.116 2.626 10 0.26259 323.207 21.625B2-911-083-1-4 B 3 6 351.412 21.949 0.112 2.626 10 0.26256 349.283 21.816B1-911-083-1-5 B 3 6 330.829 2.624 10 0.26238 328.603
Average 338.485 21.606 0.115 Averagenorm 0.26529 339.902 21.710Standard Dev. 10.627 0.352 0.002 Standard Dev.norm 10.998 0.230
Coeff. of Var. [%] 3.139 1.630 1.962 Coeff. of Var. [%]norm 3.236 1.059Min. 317.680 20.971 0.112 Min. 0.2593 321.560 21.376Max. 360.245 21.949 0.118 Max. 0.2744 356.601 22.071
Number of Spec. 18 12 12 Number of Spec. 18 12
0° Tension -- (ETW)Strength & ModulusTCA 7781/#2510 Glass Fabric

51
0
1
2
3
4
5
6
0 100 200 300 400 500 600 700 800 900 1000
0° Tensile Strength [MPa]
ASAP
Bat
ch #
0
1
2
3
Prepeg Lot #
ASAP Batch #
Prepreg Lot #
0° Tension -- (ETW)Normalized StrengthTCA 7781/#2510 Glass Fabric
Pooled Average = 339.902 [MPa]Pooled Standard Deviation = 10.998 [MPa]
Pooled Coeff. of Variation = 3.236 [%]
0
1
2
3
4
5
6
0 5 10 15 20 25 30 35 40 45 50
0° Tensile Modulus [GPa]
ASAP
Bat
ch #
0
1
2
3
Prepreg Lot #
ASAP Batch #
Prepreg Lot #
0° Tension -- (ETW)Normalized ModulusTCA 7781/#2510 Glass Fabric
Pooled Average = 21.710 [GPa]Pooled Standard Deviation = 0.230 [GPa]Pooled Coeff. of Variation = 1.059 [%]

52
normalizing tply[mm]
0.2642
Specimen Cure Prepreg ASAP Strength Modulus Poisson's Avg. Specimen # Plies in Avg. tply Strengthnorm ModulusnormNumber Cycle Lot # Batch # [MPa] [GPa] Ratio Thickn. [mm] Laminate [mm] [MPa] [GPa]
A1-911-081-1-5 A 1 1 434.192 22.187 0.126 2.697 10 0.26970 443.293 22.652A2-911-081-1-5 A 1 1 440.707 22.661 0.131 2.707 10 0.27071 451.640 23.223A2-911-081-1-4 A 1 1 437.359 2.695 10 0.26954 446.274B1-911-081-1-5 B 1 2 430.300 22.578 0.130 2.695 10 0.26954 439.071 23.038B2-911-081-1-5 B 1 2 433.503 21.742 0.133 2.756 10 0.27559 452.261 22.683B2-911-081-1-4 B 1 2 431.224 2.761 10 0.27610 450.712A1-911-082-1-7 A 2 3 455.152 23.189 0.120 2.617 10 0.26167 450.864 22.970A2-911-082-1-3 A 2 3 454.429 23.001 0.128 2.620 10 0.26200 450.715 22.813A2-911-082-1-2 A 2 3 451.600 2.601 10 0.26015 444.740B1-911-082-1-3 B 2 4 453.049 23.092 0.128 2.617 10 0.26167 448.780 22.874B2-911-082-1-3 B 2 4 452.490 23.088 0.129 2.631 10 0.26307 450.619 22.993B2-911-082-1-2 B 2 4 455.100 2.624 10 0.26243 452.124A1-911-083-1-3 A 3 5 447.303 23.259 0.127 2.588 10 0.25883 438.271 22.790A2-911-083-1-3 A 3 5 452.513 23.465 0.128 2.623 10 0.26231 449.337 23.300A2-911-083-1-2 A 3 5 461.624 2.577 10 0.25768 450.306B1-911-083-1-3 B 3 6 446.605 22.738 0.129 2.622 10 0.26218 443.256 22.567B2-911-083-1-3 B 3 6 443.493 23.035 0.124 2.641 10 0.26408 443.365 23.029B2-911-083-1-2 B 3 6 450.912 2.643 10 0.26434 451.215
Average 446.198 22.836 0.128 Averagenorm 0.26509 447.602 22.911Standard Dev. 9.525 0.488 0.003 Standard Dev.norm 4.521 0.224
Coeff. of Var. [%] 2.135 2.137 2.552 Coeff. of Var. [%]norm 1.010 0.978Min. 430.300 21.742 0.120 Min. 0.2577 438.271 22.567Max. 461.624 23.465 0.133 Max. 0.2761 452.261 23.300
Number of Spec. 18 12 12 Number of Spec. 18 12
0° Tension -- (ETD)Strength & ModulusTCA 7781/#2510 Glass Fabric

53
0
1
2
3
4
5
6
0 100 200 300 400 500 600 700 800 900 1000
0° Tensile Strength [MPa]
ASAP
Bat
ch #
0
1
2
3
Prepeg Lot #
ASAP Batch #
Prepreg Lot #
0° Tension -- (ETD)Normalized StrengthTCA 7781/#2510 Glass Fabric
Pooled Average = 447.602 [MPa]Pooled Standard Deviation =4.521 [MPa]Pooled Coeff. of Variation = 1.01 [%]
0
1
2
3
4
5
6
0 5 10 15 20 25 30 35 40 45 50
0° Tensile Modulus [GPa]
ASAP
Bat
ch #
0
1
2
3
Prepreg Lot #
ASAP Batch #
Prepreg Lot #
0° Tension -- (ETD)Normalized ModulusTCA 7781/#2510 Glass Fabric
Pooled Average = 22.911 [GPa]Pooled Standard Deviation = 0.224 [GPa]Pooled Coeff. of Variation = 0.978 [%]

54
normalizing tply[mm]
0.2642
Specimen Cure Prepreg ASAP Strength Modulus Avg. Specimen # Plies in Avg. tply Strengthnorm ModulusnormNumber Cycle Lot # Batch # [MPa] [GPa] Thickn. [mm] Laminate [mm] [MPa] [GPa]
A1-911-081-1-3 A 1 1 362.164 22.252 2.678 10 0.26777 367.109 22.556A2-911-081-1-3 A 1 1 356.515 22.326 2.688 10 0.26878 362.754 22.716A1-911-081-1-4 A 1 1 337.100 2.678 10 0.26777 341.703B1-911-081-1-3 B 1 2 341.745 22.844 2.633 10 0.26332 340.661 22.771B2-911-081-1-3 B 1 2 369.099 22.466 2.676 10 0.26764 373.961 22.762B1-911-081-1-4 B 1 2 318.561 2.635 10 0.26347 317.734A1-911-082-1-1 A 2 3 334.907 23.043 2.577 10 0.25768 326.695 22.478A2-911-082-1-1 A 2 3 346.058 23.020 2.612 10 0.26119 342.165 22.761A1-911-082-1-2 A 2 3 380.138 2.590 10 0.25895 372.645B1-911-082-1-1 B 2 4 347.260 23.330 2.581 10 0.25814 339.347 22.798B2-911-082-1-1 B 2 4 355.932 23.633 2.573 10 0.25730 346.691 23.019B1-911-082-1-2 B 2 4 367.734 2.606 10 0.26060 362.784A1-911-083-1-1 A 3 5 344.621 23.167 2.592 10 0.25916 338.093 22.728A2-911-083-1-1 A 3 5 343.603 23.025 2.612 10 0.26119 339.737 22.766A1-911-083-1-2 A 3 5 356.049 2.608 10 0.26078 351.496B1-911-083-1-1 B 3 6 347.116 23.239 2.607 10 0.26073 342.610 22.937B2-911-083-1-1 B 3 6 348.773 23.333 2.565 10 0.25649 338.646 22.656B1-911-083-1-2 B 3 6 351.136 2.620 10 0.26195 348.198
Average 350.473 22.973 Averagenorm 0.26183 347.390 22.746Standard Dev. 14.143 0.429 Standard Dev.norm 15.234 0.146
Coeff. of Var. [%] 4.035 1.867 Coeff. of Var. [%]norm 4.385 0.640Min. 318.561 22.252 Min. 0.2565 317.734 22.478Max. 380.138 23.633 Max. 0.2688 373.961 23.019
Number of Spec. 18 12 Number of Spec. 18 12
90° Tension -- (RTD)Strength & ModulusTCA 7781/#2510 Glass Fabric

55
0
1
2
3
4
5
6
0 100 200 300 400 500 600 700
90° Tensile Strength [MPa]
ASAP
Bat
ch #
0
1
2
3
Prepeg Lot #
ASAP Batch #
Prepreg Lot #
90° Tension -- (RTD)Normalized StrengthTCA 7781/#2510 Glass Fabric
Pooled Average = 347.390 [MPa]Pooled Standard Deviation = 15.234 [MPa]
Pooled Coeff. of Variation = 4.385 [%]
0
1
2
3
4
5
6
0 5 10 15 20 25 30 35 40 45 50
90° Tensile Modulus [GPa]
ASAP
Bat
ch #
0
1
2
3
Prepreg Lot #
ASAP Batch #
Prepreg Lot #
90° Tension -- (RTD)Normalized ModulusTCA 7781/#2510 Glass Fabric
Pooled Average = 22.746 [GPa]Pooled Standard Deviation = .146 [GPa]Pooled Coeff. of Variation = 0.640 [%]

56
normalizing tply[mm]
0.2642
Specimen Cure Prepreg ASAP Strength Modulus Avg. Specimen # Plies in Avg. tply Strengthnorm ModulusnormNumber Cycle Lot # Batch # [MPa] [GPa] Thickn. [mm] Laminate [mm] [MPa] [GPa]
A1-911-081-1-1 A 1 1 439.135 23.856 2.672 10 0.26721 444.202 24.131A2-911-081-1-1 A 1 1 435.002 24.132 2.657 10 0.26568 437.512 24.271A1-911-081-1-2 A 1 1 397.211 2.675 10 0.26746 402.176B1-911-081-1-1 B 1 2 408.981 24.063 2.631 10 0.26314 407.408 23.970B2-911-081-1-1 B 1 2 450.342 24.821 2.621 10 0.26213 446.878 24.630B1-911-081-1-2 B 1 2 460.640 2.631 10 0.26314 458.868
Average 431.885 24.218 Averagenorm 0.26480 432.841 24.251Standard Dev. 24.317 0.419 Standard Dev.norm 22.858 0.281
Coeff. of Var. [%] 5.630 1.730 Coeff. of Var. [%]norm 5.281 1.160Min. 397.211 23.856 Min. 0.2621 402.176 23.970Max. 460.640 24.821 Max. 0.2675 458.868 24.630
Number of Spec. 6 4 Number of Spec. 6 4
90° Tension -- (CTD)Strength & ModulusTCA 7781/#2510 Glass Fabric

57
0
1
2
3
4
5
6
0 100 200 300 400 500 600 700
90° Tensile Strength [MPa]
ASAP
Bat
ch #
0
1
2
3
Prepeg Lot #
ASAP Batch #
Prepreg Lot #
90° Tension -- (CTD)Normalized StrengthTCA 7781/#2510 Glass Fabric
Pooled Average = 432.841 [MPa]Pooled Standard Deviation = 22.858 [MPa]
Pooled Coeff. of Variation = 5.281 [%]
0
1
2
3
4
5
6
0 5 10 15 20 25 30 35 40 45 50
90° Tensile Modulus [GPa]
ASAP
Bat
ch #
0
1
2
3
Prepreg Lot #
ASAP Batch #
Prepreg Lot #
90° Tension -- (CTD)Normalized ModulusTCA 7781/#2510 Glass Fabric
Pooled Average = 24.251 [GPa]Pooled Standard Deviation = .281 [GPa]Pooled Coeff. of Variation = 1.16 [%]

58
normalizing tply[mm]
0.2642
Specimen Cure Prepreg ASAP Strength Modulus Avg. Specimen # Plies in Avg. tply Strengthnorm ModulusnormNumber Cycle Lot # Batch # [MPa] [GPa] Thickn. [mm] Laminate [mm] [MPa] [GPa]
A1-911-081-1-8 A 1 1 301.729 19.906 2.639 10 0.26391 301.438 19.886A2-911-081-1-8 A 1 1 302.754 20.025 2.665 10 0.26650 305.432 20.202A1-911-081-1-9 A 1 1 301.199 2.628 10 0.26284 299.693B1-911-081-1-8 B 1 2 299.268 20.595 2.612 10 0.26124 295.958 20.367B2-911-081-1-8 B 1 2 284.153 19.921 2.699 10 0.26993 290.355 20.355B1-911-081-1-9 B 1 2 301.634 2.600 10 0.25997 296.849A1-911-082-1-4 A 2 3 278.213 20.355 2.608 10 0.26078 274.655 20.095A2-911-082-1-4 A 2 3 276.321 19.821 2.684 10 0.26840 280.758 20.139A1-911-082-1-5 A 2 3 297.658 2.610 10 0.26104 294.138B1-911-082-1-4 B 2 4 275.861 19.977 2.686 10 0.26855 280.450 20.309B2-911-082-1-4 B 2 4 297.548 20.623 2.606 10 0.26055 293.486 20.341B1-911-082-1-5 B 2 4 281.302 2.683 10 0.26827 285.684A1-911-083-1-4 A 3 5 297.836 20.013 2.649 10 0.26492 298.695 20.071A2-911-083-1-4 A 3 5 299.098 20.339 2.623 10 0.26226 296.941 20.192A1-911-083-1-5 A 3 5 290.688 2.651 10 0.26513 291.750B1-911-083-1-4 B 3 6 294.580 20.449 2.632 10 0.26319 293.504 20.375B2-911-083-1-4 B 3 6 297.193 19.962 2.621 10 0.26213 294.907 19.808B1-911-083-1-5 B 3 6 282.197 2.641 10 0.26411 282.142
Average 292.180 20.165 Averagenorm 0.26410 292.046 20.178Standard Dev. 9.674 0.287 Standard Dev.norm 8.243 0.189
Coeff. of Var. [%] 3.311 1.423 Coeff. of Var. [%]norm 2.822 0.936Min. 275.861 19.821 Min. 0.2600 274.655 19.808Max. 302.754 20.623 Max. 0.2699 305.432 20.375
Number of Spec. 18 12 Number of Spec. 18 12
90° Tension -- (ETW)Strength & ModulusTCA 7781/#2510 Glass Fabric

59
0
1
2
3
4
5
6
0 100 200 300 400 500 600 700
90° Tensile Strength [MPa]
ASAP
Bat
ch #
0
1
2
3
Prepeg Lot #
ASAP Batch #
Prepreg Lot #
90° Tension -- (ETW)Normalized StrengthTCA 7781/#2510 Glass Fabric
Pooled Average = 292.046 [MPa]Pooled Standard Deviation = 8.283 [MPa]Pooled Coeff. of Variation = 2.822 [%]
0
1
2
3
4
5
6
0 5 10 15 20 25 30 35 40 45 50
90° Tensile Modulus [GPa]
ASAP
Bat
ch #
0
1
2
3
Prepreg Lot #
ASAP Batch #
Prepreg Lot #
90° Tension -- (ETW)Normalized ModulusTCA 7781/#2510 Glass Fabric
Pooled Average = 20.178 [GPa]Pooled Standard Deviation = .189 [GPa]Pooled Coeff. of Variation = .936 [%]

60
normalizing tply[mm]
0.2642
Specimen Cure Prepreg ASAP Strength Modulus Avg. Specimen # Plies in Avg. tply Strengthnorm ModulusnormNumber Cycle Lot # Batch # [MPa] [GPa] Thickn. [mm] Laminate [mm] [MPa] [GPa]
A1-911-081-1-5 A 1 1 374.765 21.098 2.675 10 0.26754 379.558 21.367A2-911-081-1-5 A 1 1 372.121 21.332 2.686 10 0.26861 378.383 21.691A2-911-081-1-4 A 1 1 373.277 2.694 10 0.26942 380.706B1-911-081-1-5 B 1 2 371.961 21.681 2.642 10 0.26416 371.961 21.681B2-911-081-1-5 B 1 2 372.755 21.319 2.687 10 0.26866 379.099 21.682B2-911-081-1-4 B 1 2 381.405 2.682 10 0.26817 387.200A1-911-082-1-3 A 2 3 381.673 21.794 2.604 10 0.26035 376.168 21.480A2-911-082-1-3 A 2 3 372.280 21.508 2.647 10 0.26467 372.996 21.549A2-911-082-1-2 A 2 3 370.552 2.625 10 0.26246 368.165B1-911-082-1-3 B 2 4 374.657 21.807 2.645 10 0.26449 375.126 21.834B2-911-082-1-3 B 2 4 382.743 22.018 2.606 10 0.26055 377.517 21.718B2-911-082-1-2 B 2 4 389.561 2.595 10 0.25951 382.707A1-911-083-1-3 A 3 5 381.653 22.596 2.626 10 0.26264 379.451 22.465A2-911-083-1-3 A 3 5 371.596 21.766 2.626 10 0.26264 369.452 21.641A2-911-083-1-2 A 3 5 377.369 2.616 10 0.26157 373.668B1-911-083-1-3 B 3 6 382.064 21.890 2.629 10 0.26294 380.301 21.789B2-911-083-1-3 B 3 6 365.278 21.672 2.606 10 0.26055 360.291 21.376B2-911-083-1-2 B 3 6 382.383 2.586 10 0.25865 374.405
Average 376.561 21.707 Averagenorm 0.26375 375.953 21.689Standard Dev. 6.073 0.387 Standard Dev.norm 6.128 0.286
Coeff. of Var. [%] 1.613 1.781 Coeff. of Var. [%]norm 1.630 1.320Min. 365.278 21.098 Min. 0.2586 360.291 21.367Max. 389.561 22.596 Max. 0.2694 387.200 22.465
Number of Spec. 18 12 Number of Spec. 18 12
90° Tension -- (ETD)Strength & ModulusTCA 7781/#2510 Glass Fabric

61
0
1
2
3
4
5
6
0 100 200 300 400 500 600 700
90° Tensile Strength [MPa]
ASAP
Bat
ch #
0
1
2
3
Prepeg Lot #
ASAP Batch #
Prepreg Lot #
90° Tension -- (ETD)Normalized StrengthTCA 7781/#2510 Glass Fabric
Pooled Average = 375.953 [MPa]Pooled Standard Deviation = 6.128 [MPa]Pooled Coeff. of Variation = 1.630 [%]
0
1
2
3
4
5
6
0 5 10 15 20 25 30 35 40 45 50
90° Tensile Modulus [GPa]
ASAP
Bat
ch #
0
1
2
3
Prepreg Lot #
ASAP Batch #
Prepreg Lot #
90° Tension -- (ETD)Normalized ModulusTCA 7781/#2510 Glass Fabric
Pooled Average = 21.689 [GPa]Pooled Standard Deviation = .286 [GPa]Pooled Coeff. of Variation = 1.320 [%]

62
normalizing tply[mm]
0.2642
Specimen Cure Prepreg ASAP Strength Modulus Avg. Specimen # Plies in Avg. tply Strengthnorm ModulusnormNumber Cycle Lot # Batch # [MPa] [GPa] Thickn. [mm] Laminate [mm] [MPa] [GPa]
A1-911-081-1-9 A 1 1 500.407 3.320 12 0.27663 524.024A1-911-081-1-10 A 1 1 477.422 3.320 12 0.27663 499.954A2-911-081-1-17 A 1 1 442.756 3.320 12 0.27663 463.652A2-911-081-1-3 A 1 1 24.308 3.365 12 0.28039 25.802B1-911-081-1-9 B 1 2 528.741 3.120 12 0.26003 520.479B2-911-081-1-17 B 1 2 553.774 3.120 12 0.26003 545.121B2-911-081-1-18 B 1 2 581.004 3.120 12 0.26003 571.926B2-911-081-1-3 B 1 2 26.021 3.117 12 0.25976 25.587A1-911-082-1-9 A 2 3 528.363 3.059 12 0.25489 509.820A1-911-082-1-10 A 2 3 521.288 3.059 12 0.25489 502.993A2-911-082-1-17 A 2 3 505.455 3.059 12 0.25489 487.715A2-911-082-1-1 A 2 3 27.828 3.047 12 0.25394 26.751B1-911-082-1-9 B 2 4 534.515 3.108 12 0.25902 524.108B2-911-082-1-17 B 2 4 538.432 3.108 12 0.25902 527.948B2-911-082-1-18 B 2 4 558.932 3.108 12 0.25902 548.049B2-911-082-1-1 B 2 4 27.101 3.147 12 0.26221 26.901A1-911-083-1-9 A 3 5 546.727 3.222 12 0.26854 555.795A1-911-083-1-10 A 3 5 526.437 3.222 12 0.26854 535.168A2-911-083-1-17 A 3 5 565.246 3.222 12 0.26854 574.622A2-911-083-1-1 A 3 5 26.379 3.214 12 0.26786 26.749B1-911-083-1-9 B 3 6 548.333 3.140 12 0.26164 543.105B2-911-083-1-17 B 3 6 514.680 3.140 12 0.26164 509.772B2-911-083-1-18 B 3 6 520.607 3.140 12 0.26164 515.643B2-911-083-1-1 B 3 6 27.290 3.060 12 0.25502 26.345
Average 527.395 26.488 Averagenorm 0.26339 525.550 26.356Standard Dev. 32.631 1.249 Standard Dev.norm 28.513 0.549
Coeff. of Var. [%] 6.187 4.714 Coeff. of Var. [%]norm 5.425 2.082Min. 442.756 24.308 Min. 0.2539 463.652 25.587Max. 581.004 27.828 Max. 0.2804 574.622 26.901
Number of Spec. 18 6 Number of Spec. 18 6
0° Compression -- (RTD)Strength & ModulusTCA 7781/#2510 Glass Fabric

63
0
1
2
3
4
5
6
0 100 200 300 400 500 600 700 800 900 1000
0° Compression Strength [MPa]
ASA
P Ba
tch
#
0
1
2
3
Prepeg Lot #
ASAP Batch #
Prepreg Lot #
0° Compression -- (RTD)Normalized StrengthTCA 7781/#2510 Glass Fabric
Pooled Average = 76.225 [ksi]Pooled Standard Deviation = 4.135 [ksi]Pooled Coeff. of Variation = 5.425 [%]
0
1
2
3
4
5
6
0 5 10 15 20 25 30 35 40 45 50
0° Compression Modulus [GPa]
ASA
P B
atch
#
0
1
2
3
Prepreg Lot #
ASAP Batch #
Prepreg Lot #
0° Compression -- (RTD)Normalized ModulusTCA 7781/#2510 Glass Fabric
Pooled Average = 26.356 [Msi]Pooled Standard Deviation = 0.549 [Msi]Pooled Coeff. of Variation = 2.082 [%]

64
normalizing tply[mm]
0.2642
Specimen Cure Prepreg ASAP Strength Modulus Avg. Specimen # Plies in Avg. tply Strengthnorm ModulusnormNumber Cycle Lot # Batch # [MPa] [GPa] Thickn. [mm] Laminate [mm] [MPa] [GPa]
A1-911-082-1-5 A 2 3 596.915 3.167 12 0.26395 596.437A1-911-082-1-6 A 2 3 626.978 3.167 12 0.26395 626.476A1-911-082-1-7 A 2 3 677.622 3.167 12 0.26395 677.079A2-911-081-1-1 A 1 1 25.091 3.409 12 0.28406 26.981B1-911-082-1-8 B 2 4 616.928 3.023 12 0.25188 588.257B1-911-082-1-9 B 2 4 618.255 3.023 12 0.25188 589.522B1-911-082-1-10 B 2 4 605.620 3.023 12 0.25188 577.474B2-911-081-1-1 B 1 2 26.932 3.099 12 0.25823 26.328
Average 623.720 26.012 Averagenorm 0.26122 609.207 26.654Standard Dev. 28.419 1.302 Standard Dev.norm 37.152 0.462
Coeff. of Var. [%] 4.556 5.004 Coeff. of Var. [%]norm 6.098 1.733Min. 596.915 25.091 Min. 0.2519 577.474 26.328Max. 677.622 26.932 Max. 0.2841 677.079 26.981
Number of Spec. 6 2 Number of Spec. 6 2
0° Compression -- (CTD)Strength & ModulusTCA 7781/#2510 Glass Fabric

65
0
1
2
3
4
5
6
0 100 200 300 400 500 600 700 800 900 1000
0° Compression Strength [MPa]
ASA
P B
atch
#
0
1
2
3
Prepeg Lot #
ASAP Batch #
Prepreg Lot #
Pooled Average = 609.207 [MPa]Pooled Standard Deviation = 37.152 [MPa]
Pooled Coeff. of Variation = 6.098 [%]0° Compression -- (CTD)
Normalized StrengthTCA 7781/#2510 Glass Fabric
0
1
2
3
4
5
6
0 5 10 15 20 25 30 35 40 45 50
0° Compression Modulus [GPa]
ASA
P B
atch
#
0
1
2
3
Prepreg Lot #
ASAP Batch #
Prepreg Lot #
Pooled Average = 26.654 [GPa]Pooled Standard Deviation = 0.462 [GPa]Pooled Coeff. of Variation = 1.733 [%]
0° Compression -- (CTD)Normalized ModulusTCA 7781/#2510 Glass Fabric

66
.
normalizing tply[mm]
0.2642
Specimen Cure Prepreg ASAP Strength Modulus Avg. Specimen # Plies in Avg. tply Strengthnorm ModulusnormNumber Cycle Lot # Batch # [MPa] [GPa] Thickn. [mm] Laminate [mm] [MPa] [GPa]
A1-911-081-1-1 A 1 1 375.454 3.264 12 0.27199 386.585A1-911-081-1-2 A 1 1 371.715 3.264 12 0.27199 382.736A1-911-081-1-3 A 1 1 367.459 3.264 12 0.27199 378.354A2-911-081-1-5 A 1 1 23.250 3.339 12 0.27828 24.493B1-911-081-1-1 B 1 2 345.100 3.264 12 0.27199 355.331B1-911-081-1-2 B 1 2 355.737 3.264 12 0.27199 366.283B1-911-081-1-3 B 1 2 341.210 3.264 12 0.27199 351.326B2-911-081-1-5 B 1 2 24.773 3.122 12 0.26020 24.402A1-911-082-1-1 A 2 3 327.691 3.175 12 0.26458 328.216A1-911-082-1-2 A 2 3 337.599 3.175 12 0.26458 338.140A1-911-082-1-3 A 2 3 350.429 3.175 12 0.26458 350.990A2-911-082-1-3 A 2 3 25.118 3.087 12 0.25722 24.458B1-911-082-1-1 B 2 4 317.302 3.099 12 0.25823 310.184B1-911-082-1-2 B 2 4 320.761 3.099 12 0.25823 313.564B1-911-082-1-3 B 2 4 321.652 3.099 12 0.25823 314.435B2-911-082-1-3 B 2 4 24.204 3.129 12 0.26077 23.893A1-911-083-1-1 A 3 5 344.773 3.217 12 0.26812 349.939A1-911-083-1-2 A 3 5 339.595 3.217 12 0.26812 344.684A1-911-083-1-3 A 3 5 336.477 3.217 12 0.26812 341.519A2-911-083-1-3 A 3 5 24.097 3.224 12 0.26867 24.508B1-911-083-1-1 B 3 6 378.847 3.145 12 0.26211 375.903B1-911-083-1-2 B 3 6 380.488 3.145 12 0.26211 377.531B1-911-083-1-3 B 3 6 355.844 3.145 12 0.26211 353.079B2-911-083-1-3 B 3 6 24.352 3.108 12 0.25897 23.874
Average 348.230 24.299 Averagenorm 0.26563 351.044 24.272Standard Dev. 20.286 0.640 Standard Dev.norm 24.037 0.303
Coeff. of Var. [%] 5.825 2.634 Coeff. of Var. [%]norm 6.847 1.246Min. 317.302 23.250 Min. 0.2572 310.184 23.874Max. 380.488 25.118 Max. 0.2783 386.585 24.508
Number of Spec. 18 6 Number of Spec. 18 6
0° Compression -- (ETW)Strength & ModulusTCA 7781/#2510 Glass Fabric

67
0
1
2
3
4
5
6
0 100 200 300 400 500 600 700 800 900 1000
0° Compression Strength [MPa]
AS
AP
Bat
ch #
0
1
2
3
Prepeg Lot #
ASAP Batch #
Prepreg Lot #
0° Compression -- (ETW)Normalized StrengthTCA 7781/#2510 Glass Fabric
Pooled Average = 50.915 [ksi]Pooled Standard Deviation = 3.486 [ksi]Pooled Coeff. of Variation = 6.847 [%]
0
1
2
3
4
5
6
0 5 10 15 20 25 30 35 40 45 50
0° Compression Modulus [GPa]
AS
AP
Bat
ch #
0
1
2
3
Prepreg Lot #
ASAP Batch #
Prepreg Lot #
0° Compression -- (ETW)Normalized ModulusTCA 7781/#2510 Glass Fabric
Pooled Average = 24.272 [Msi]Pooled Standard Deviation = 0.303 [Msi]Pooled Coeff. of Variation = 1.246 [%]

68
normalizing tply[mm]
0.2642
Specimen Cure Prepreg ASAP Strength Modulus Avg. Specimen # Plies in Avg. tply Strengthnorm ModulusnormNumber Cycle Lot # Batch # [MPa] [GPa] Thickn. [mm] Laminate [mm] [MPa] [Gpa]
A1-911-081-1-11 A 1 1 417.797 3.320 12 0.27663 437.515A2-911-081-1-18 A 1 1 412.965 3.320 12 0.27663 432.455A2-911-081-1-19 A 1 1 397.809 3.320 12 0.27663 416.584A2-911-081-1-4 A 1 1 24.213 3.350 12 0.27915 25.587B1-911-081-1-10 B 1 2 450.354 3.120 12 0.26003 443.317B1-911-081-1-11 B 1 2 469.685 3.120 12 0.26003 462.346B2-911-081-1-19 B 1 2 463.195 3.120 12 0.26003 455.958B2-911-081-1-4 B 1 2 26.137 3.122 12 0.26020 25.745A1-911-082-1-11 A 2 3 409.699 3.059 12 0.25489 395.320A2-911-082-1-18 A 2 3 457.572 3.059 12 0.25489 441.513A2-911-082-1-19 A 2 3 452.929 3.059 12 0.25489 437.033A2-911-082-1-2 A 2 3 27.167 3.073 12 0.25612 26.340B1-911-082-1-10 B 2 4 440.871 3.108 12 0.25902 432.287B1-911-082-1-11 B 2 4 443.346 3.108 12 0.25902 434.714B2-911-082-1-19 B 2 4 445.681 3.108 12 0.25902 437.003B2-911-082-1-2 B 2 4 27.398 3.142 12 0.26183 27.157A1-911-083-1-11 A 3 5 414.962 3.222 12 0.26854 421.845A2-911-083-1-18 A 3 5 442.934 3.222 12 0.26854 450.281A2-911-083-1-19 A 3 5 413.613 3.222 12 0.26854 420.474A2-911-083-1-2 A 3 5 24.596 3.219 12 0.26829 24.980B1-911-083-1-10 B 3 6 435.734 3.208 12 0.26736 441.006B1-911-083-1-11 B 3 6 429.816 3.208 12 0.26736 435.017B2-911-083-1-19 B 3 6 424.714 3.208 12 0.26736 429.853B2-911-083-1-2 B 3 6 28.981 3.083 12 0.25692 28.187
Average 434.649 26.415 Averagenorm 0.26425 434.696 26.333Standard Dev. 20.495 1.808 Standard Dev.norm 15.183 1.170
Coeff. of Var. [%] 4.715 6.846 Coeff. of Var. [%]norm 3.493 4.444Min. 397.809 24.213 Min. 0.2549 395.320 24.980Max. 469.685 28.981 Max. 0.2791 462.346 28.187
Number of Spec. 18 6 Number of Spec. 18 6
0° Compression -- (ETD)Strength & ModulusTCA 7781/#2510 Glass Fabric

69
0
1
2
3
4
5
6
0 5 10 15 20 25 30 35 40 45 50
0° Compression Modulus [GPa]
ASAP
Bat
ch #
0
1
2
3
Prepreg Lot #
ASAP Batch #
Prepreg Lot #
Pooled Average = 26.333 [Msi]Pooled Standard Deviation = 1.170 [Msi]Pooled Coeff. of Variation = 4.444 [%]
0° Compression -- (ETD)Normalized ModulusTCA 7781/#2510 Glass Fabric
0
1
2
3
4
5
6
0 100 200 300 400 500 600 700 800 900 1000
0° Compression Strength [MPa]
ASA
P B
atch
#
0
1
2
3
Prepeg Lot #
ASAP Batch #
Prepreg Lot #
Pooled Average = 63.047 [ksi]Pooled Standard Deviation = 2.202 [ksi]Pooled Coeff. of Variation = 3.493 [%]
0° Compression -- (ETD)Normalized StrengthTCA 7781/#2510 Glass Fabric

70
normalizing tply[mm]
0.2642
Specimen Cure Prepreg ASAP Strength Modulus Avg. Specimen # Plies in Avg. tply Strengthnorm ModulusnormNumber Cycle Lot # Batch # [MPa] [GPa] Thickn. [mm] Laminate [mm] [MPa] [GPa]
A1-911-081-1-9 A 1 1 462.344 3.210 12 0.26748 468.160A1-911-081-1-10 A 1 1 460.649 3.210 12 0.26748 466.444A2-911-081-1-17 A 1 1 420.842 3.210 12 0.26748 426.136A2-911-081-1-3 A 1 1 25.909 3.209 12 0.26744 26.231B1-911-081-1-9 B 1 2 463.923 3.166 12 0.26384 463.365B2-911-081-1-17 B 1 2 475.583 3.166 12 0.26384 475.012B2-911-081-1-18 B 1 2 459.100 3.166 12 0.26384 458.548B2-911-081-1-3 B 1 2 24.542 3.171 12 0.26422 24.548A2-911-082-1-17 A 2 3 478.637 3.106 12 0.25883 468.972A2-911-082-1-20 A 2 3 448.946 3.106 12 0.25883 439.880A2-911-082-1-21 A 2 3 464.512 3.106 12 0.25883 455.132A2-911-082-1-1 A 2 3 26.069 3.074 12 0.25616 25.280B1-911-082-1-9 B 2 4 434.270 3.209 12 0.26742 439.629B2-911-082-1-17 B 2 4 426.618 3.209 12 0.26742 431.882B2-911-082-1-18 B 2 4 432.891 3.209 12 0.26742 438.233B2-911-082-1-1 B 2 4 23.993 3.196 12 0.26634 24.191A1-911-083-1-9 A 3 5 471.997 3.172 12 0.26437 472.375A1-911-083-1-10 A 3 5 451.236 3.172 12 0.26437 451.597A2-911-083-1-17 A 3 5 403.370 3.172 12 0.26437 403.693A2-911-083-1-1 A 3 5 24.631 3.199 12 0.26655 24.854B1-911-083-1-9 B 3 6 455.676 3.161 12 0.26340 454.361B2-911-083-1-17 B 3 6 474.449 3.161 12 0.26340 473.081B2-911-083-1-18 B 3 6 435.907 3.161 12 0.26340 434.649B2-911-083-1-1 B 3 6 24.669 3.128 12 0.26067 24.343
Average 451.164 24.969 Averagenorm 0.26406 451.175 24.908Standard Dev. 21.185 0.829 Standard Dev.norm 19.584 0.756
Coeff. of Var. [%] 4.696 3.319 Coeff. of Var. [%]norm 4.341 3.034Min. 403.370 23.993 Min. 0.2562 403.693 24.191Max. 478.637 26.069 Max. 0.2675 475.012 26.231
Number of Spec. 18 6 Number of Spec. 18 6
90° Compression -- (RTD)Strength & ModulusTCA 7781/#2510 Glass Fabric

71
0
1
2
3
4
5
6
0 100 200 300 400 500 600 700 800
90° Compression Strength [MPa]
ASA
P Ba
tch
#
0
1
2
3
Prepeg Lot #
ASAP Batch #
Prepreg Lot #
90° Compression -- (RTD)Normalized StrengthTCA 7781/#2510 Glass Fabric
Pooled Average = 451.175 [MPa]Pooled Standard Deviation = 19.584 [MPa]
Pooled Coeff. of Variation = 4.341 [%]
0
1
2
3
4
5
6
0 5 10 15 20 25 30 35 40 45 50
90° Compression Modulus [GPa]
ASA
P B
atch
#
0
1
2
3
Prepreg Lot #
ASAP Batch #
Prepreg Lot #
90° Compression -- (RTD)Normalized ModulusTCA 7781/#2510 Glass Fabric
Pooled Average = 24.908 [GPa]Pooled Standard Deviation 0.756 [GPa]Pooled Coeff. of Variation = 3.034 [%]

72
normalizing tply[mm]
0.2642
Specimen Cure Prepreg ASAP Strength Modulus Avg. Specimen # Plies in Avg. tply Strengthnorm ModulusnormNumber Cycle Lot # Batch # [MPa] [GPa] Thickn. [mm] Laminate [mm] [MPa] [GPa]
A-911-082-1-1 A 2 3 535.783 3.142 12 0.26183 531.061A-911-082-1-2 A 2 3 552.638 3.142 12 0.26183 547.767A-911-082-1-3 A 2 3 546.147 3.142 12 0.26183 541.333
A2-911-081-1-1 A 1 1 25.465 3.203 12 0.26691 25.730B1-911-082-1-7 B 2 4 542.530 3.183 12 0.26522 544.704B1-911-082-1-8 B 2 4 550.227 3.183 12 0.26522 552.432B1-911-082-1-11 B 2 4 540.023 3.183 12 0.26522 542.187B2-911-081-1-1 B 1 2 25.193 3.162 12 0.26353 25.132
Average 544.558 25.329 Averagenorm 0.26395 543.247 25.431Standard Dev. 6.350 0.192 Standard Dev.norm 7.214 0.423
Coeff. of Var. [%] 1.166 0.759 Coeff. of Var. [%]norm 1.328 1.662Min. 535.783 25.193 Min. 0.2618 531.061 25.132Max. 552.638 25.465 Max. 0.2669 552.432 25.730
Number of Spec. 6 2 Number of Spec. 6 2
90° Compression -- (CTD)Strength & ModulusTCA 7781/#2510 Glass Fabric

73
0
1
2
3
4
5
6
0 100 200 300 400 500 600 700 800
90° Compression Strength [MPa]
ASAP
Bat
ch #
0
1
2
3
Prepeg Lot #
ASAP Batch #
Prepreg Lot #
90° Compression -- (CTD)Normalized StrengthTCA 7781/#2510 Glass Fabric
Pooled Average = 543.247 [MPa]Pooled Standard Deviation = 7.214 [MPa]Pooled Coeff. of Variation = 1.328 [%]
0
1
2
3
4
5
6
0 5 10 15 20 25 30 35 40 45 50
90° Compression Modulus [GPa]
ASA
P Ba
tch
#
0
1
2
3
Prepreg Lot #
ASAP Batch #
Prepreg Lot #
90° Compression -- (CTD)Normalized ModulusTCA 7781/#2510 Glass Fabric
Pooled Average = 25.431 [GPa]Pooled Standard Deviation = 0.423 [GPa]Pooled Coeff. of Variation = 1.662 [%]

74
normalizing tply[mm]
0.2642
Specimen Cure Prepreg ASAP Strength Modulus Avg. Specimen # Plies in Avg. tply Strengthnorm ModulusnormNumber Cycle Lot # Batch # [MPa] [GPa] Thickn. [mm] Laminate [mm] [MPa] [GPa]
A1-911-081-1-1 A 1 1 300.701 3.228 12 0.26899 306.195A1-911-081-1-2 A 1 1 309.693 3.228 12 0.26899 315.350A1-911-081-1-3 A 1 1 306.621 3.228 12 0.26899 312.222A2-911-081-1-5 A 1 1 22.549 3.214 12 0.26780 22.860B1-911-081-1-1 B 1 2 297.849 3.228 12 0.26899 303.290B1-911-081-1-2 B 1 2 313.251 3.228 12 0.26899 318.974B1-911-081-1-3 B 1 2 297.650 3.228 12 0.26899 303.088B2-911-081-1-5 B 1 2 22.801 3.174 12 0.26448 22.829A1-911-082-1-4 A 2 3 302.860 3.124 12 0.26035 298.492A1-911-082-1-5 A 2 3 277.340 3.188 12 0.26564 278.895A1-911-082-1-6 A 2 3 298.724 3.150 12 0.26247 296.809A2-911-082-1-2 A 2 3 268.701 3.162 12 0.26353 268.055A2-911-082-1-3 A 2 3 286.846 3.162 12 0.26353 286.157A2-911-082-1-3 A 2 3 23.552 3.098 12 0.25819 23.020A2-911-082-1-4 A 2 3 284.008 3.150 12 0.26247 282.187B1-911-082-1-1 B 2 4 281.040 3.277 12 0.27305 290.498B1-911-082-1-2 B 2 4 273.518 3.277 12 0.27305 282.723B1-911-082-1-3 B 2 4 256.035 3.277 12 0.27305 264.651B2-911-082-1-3 B 2 4 23.470 3.213 12 0.26772 23.786A1-911-083-1-1 A 3 5 316.402 3.183 12 0.26528 317.746A1-911-083-1-2 A 3 5 296.921 3.183 12 0.26528 298.182A1-911-083-1-3 A 3 5 299.718 3.183 12 0.26528 300.991A2-911-083-1-3 A 3 5 23.763 3.174 12 0.26452 23.795B1-911-083-1-1 B 3 6 304.707 3.221 12 0.26846 309.663B1-911-083-1-2 B 3 6 298.221 3.221 12 0.26846 303.071B1-911-083-1-3 B 3 6 293.124 3.221 12 0.26846 297.892B2-911-083-1-3 B 3 6 23.314 3.148 12 0.26230 23.150
Average 293.520 23.241 Averagenorm 0.26657 296.911 23.240Standard Dev. 15.361 0.469 Standard Dev.norm 15.257 0.442
Coeff. of Var. [%] 5.233 2.017 Coeff. of Var. [%]norm 5.139 1.902Min. 256.035 22.549 Min. 0.2582 264.651 22.829Max. 316.402 23.763 Max. 0.2731 318.974 23.795
Number of Spec. 21 6 Number of Spec. 21 6
90° Compression -- (ETW)Strength & ModulusTCA 7781/#2510 Glass Fabric

75
0
1
2
3
4
5
6
0 100 200 300 400 500 600 700 800
90° Compression Strength [MPa]
ASA
P B
atch
#
0
1
2
3
Prepeg Lot #
ASAP Batch #
Prepreg Lot #
90° Compression -- (ETW)Normalized StrengthTCA 7781/#2510 Glass Fabric
Pooled Average = 296.911 [MPa]Pooled Standard Deviation = 15.257 [MPa]
Pooled Coeff. of Variation = 5.139 [%]
0
1
2
3
4
5
6
0 5 10 15 20 25 30 35 40 45 50
90° Compression Modulus [GPa]
ASA
P B
atch
#
0
1
2
3
Prepreg Lot #
ASAP Batch #
Prepreg Lot #
90° Compression -- (ETW)Normalized ModulusTCA 7781/#2510 Glass Fabric
Pooled Average = 23.240 [GPa]Pooled Standard Deviation = 0.442 [GPa]Pooled Coeff. of Variation = 1.902 [%]

76
normalizing tply[mm]
0.2642
Specimen Cure Prepreg ASAP Strength Modulus Avg. Specimen # Plies in Avg. tply Strengthnorm ModulusnormNumber Cycle Lot # Batch # [MPa] [GPa] Thickn. [mm] Laminate [mm] [MPa] [GPa]
A1-911-081-1-11 A 1 1 362.949 3.210 12 0.26748 367.515A2-911-081-1-18 A 1 1 341.607 3.210 12 0.26748 345.905A2-911-081-1-19 A 1 1 364.861 3.210 12 0.26748 369.451A2-911-081-1-4 A 1 1 23.606 3.210 12 0.26748 23.903B1-911-081-1-10 B 1 2 375.475 3.166 12 0.26384 375.024B1-911-081-1-11 B 1 2 390.928 3.166 12 0.26384 390.458B2-911-081-1-19 B 1 2 386.562 3.166 12 0.26384 386.097B2-911-081-1-4 B 1 2 24.626 3.175 12 0.26458 24.665A2-911-082-1-18 A 2 3 402.686 3.106 12 0.25883 394.555A2-911-082-1-19 A 2 3 392.910 3.106 12 0.25883 384.976A2-911-082-1-23 A 2 3 380.231 3.106 12 0.25883 372.553A2-911-082-1-2 A 2 3 25.012 3.082 12 0.25686 24.321B1-911-082-1-10 B 2 4 366.241 3.209 12 0.26742 370.760B1-911-082-1-11 B 2 4 372.465 3.209 12 0.26742 377.062B2-911-082-1-19 B 2 4 363.130 3.209 12 0.26742 367.611B2-911-082-1-2 B 2 4 24.889 3.202 12 0.26681 25.138A1-911-083-1-11 A 3 5 377.446 3.172 12 0.26437 377.749A2-911-083-1-18 A 3 5 335.060 3.172 12 0.26437 335.329A2-911-083-1-19 A 3 5 344.690 3.172 12 0.26437 344.966A2-911-083-1-2 A 3 5 23.247 3.187 12 0.26560 23.374B1-911-083-1-10 B 3 6 372.709 3.161 12 0.26340 371.634B1-911-083-1-11 B 3 6 343.503 3.161 12 0.26340 342.512B2-911-083-1-19 B 3 6 377.524 3.161 12 0.26340 376.435B2-911-083-1-2 B 3 6 26.523 3.139 12 0.26162 26.268
Average 369.499 24.650 Averagenorm 0.26412 369.477 24.611Standard Dev. 18.893 1.162 Standard Dev.norm 16.914 1.014
Coeff. of Var. [%] 5.113 4.715 Coeff. of Var. [%]norm 4.578 4.120Min. 335.060 23.247 Min. 0.2569 335.329 23.374Max. 402.686 26.523 Max. 0.2675 394.555 26.268
Number of Spec. 18 6 Number of Spec. 18 6
90° Compression -- (ETD)Strength & ModulusTCA 7781/#2510 Glass Fabric
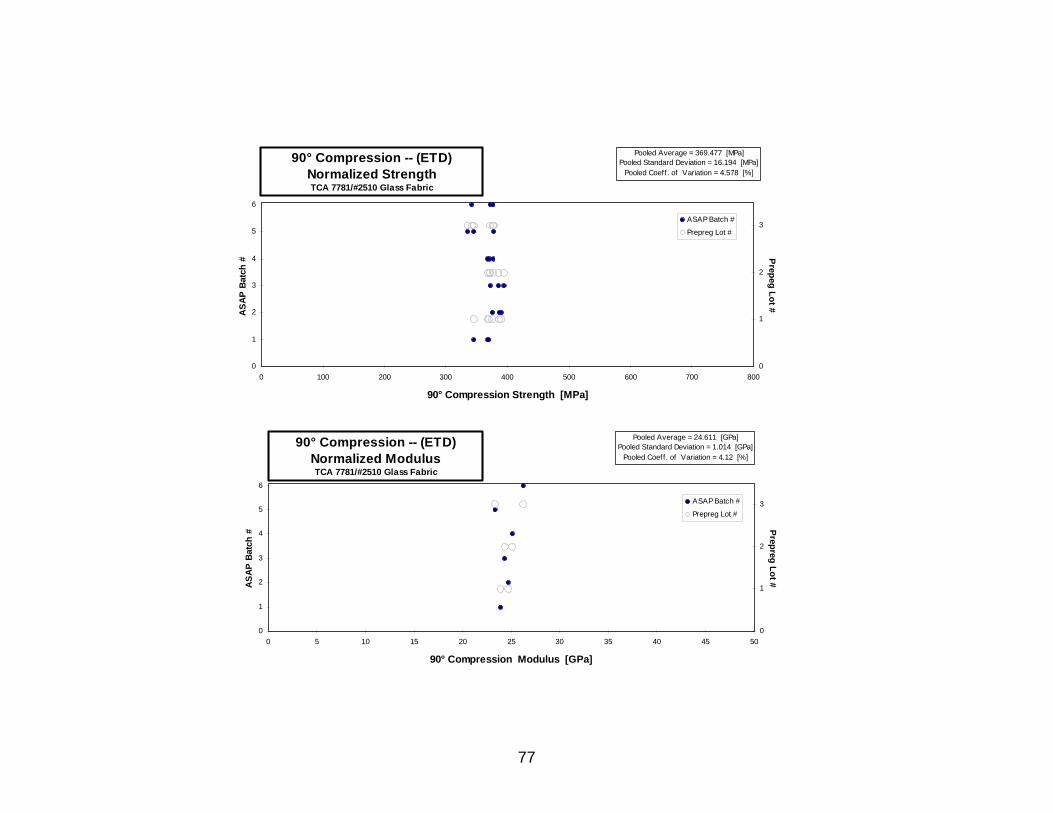
77
0
1
2
3
4
5
6
0 100 200 300 400 500 600 700 800
90° Compression Strength [MPa]
ASA
P Ba
tch
#
0
1
2
3
Prepeg Lot #
ASAP Batch #
Prepreg Lot #
90° Compression -- (ETD)Normalized StrengthTCA 7781/#2510 Glass Fabric
Pooled Average = 369.477 [MPa]Pooled Standard Deviation = 16.194 [MPa]
Pooled Coeff. of Variation = 4.578 [%]
0
1
2
3
4
5
6
0 5 10 15 20 25 30 35 40 45 50
90° Compression Modulus [GPa]
ASA
P B
atch
#
0
1
2
3
Prepreg Lot #
ASAP Batch #
Prepreg Lot #
90° Compression -- (ETD)Normalized ModulusTCA 7781/#2510 Glass Fabric
Pooled Average = 24.611 [GPa]Pooled Standard Deviation = 1.014 [GPa]
Pooled Coeff. of Variation = 4.12 [%]

78
Specimen Cure Prepreg ASAP Strength Modulus Avg. Specimen # Plies in Avg. tplyNumber Cycle Lot # Batch # [MPa] [GPa] Thickn. [mm] Laminate [mm]
A1-911-081-1-11 A 1 1 128.228 4.020 3.173 12 0.26441A1-911-081-2-2 A 1 1 128.842 4.116 3.129 12 0.26077A1-911-081-3-2 A 1 1 125.550 3.129 12 0.26071B1-911-081-1-2 B 1 2 129.155 4.233 3.119 12 0.25988B1-911-081-2-2 B 1 2 126.650 4.164 3.182 12 0.26518B1-911-081-3-2 B 1 2 124.821 3.131 12 0.26094A1-911-082-1-1 A 2 3 124.565 4.282 3.088 12 0.25732A1-911-082-2-1 A 2 3 124.121 4.399 3.119 12 0.25988A1-911-082-3-1 A 2 3 132.629 3.105 12 0.25876B1-911-082-1-1 B 2 4 125.296 4.357 3.099 12 0.25823B1-911-082-2-1 B 2 4 126.926 4.220 3.100 12 0.25834B1-911-082-3-1 B 2 4 130.768 3.097 12 0.25809A1-911-083-1-1 A 3 5 129.022 5.150 3.043 12 0.25362A1-911-083-2-1 A 3 5 129.014 4.289 3.051 12 0.25428A1-911-083-3-1 A 3 5 129.951 3.034 12 0.25279B1-911-083-1-1 B 3 6 124.712 4.778 2.995 12 0.24956B1-911-083-2-1 B 3 6 126.254 4.406 3.006 12 0.25051B1-911-083-3-1 B 3 6 122.777 3.026 12 0.25216
Average 127.182 4.368 Average 0.2575Standard Dev. 2.650 0.311
Coeff. of Var. [%] 2.084 7.117Min. 122.777 4.020 Min. 0.2496Max. 132.629 5.150 Max. 0.2652
Number of Spec. 18 12
In-Plane Shear -- (RTD)Strength & ModulusTCA 7781/#2510 Glass Fabric

79
0
1
2
3
4
5
6
0 50 100 150 200 250 300
In-Plane Shear Strength [MPa]
ASA
P B
atch
#
0
1
2
3
Prepreg Lot #
ASAP Batch #
Prepreg Lot #
In-Plane Shear -- (RTD)Measured StrengthTCA 7781/#2510 Glass Fabric
Pooled Average = 127.182 [MPa]Pooled Standard Deviation = 2.650 [MPa]Pooled Coeff. of Variation = 2.084 [%]
0
1
2
3
4
5
6
0 1 2 3 4 5 6 7 8 9 10
In-Plane Shear Modulus [GPa]
ASA
P B
atch
#
0
1
2
3
Prepreg Lot #
ASAP Batch #
Prepreg Lot #
In-Plane Shear -- (RTD)Measured ModulusTCA 7781/#2510 Glass Fabric
Pooled Average = 4.368 [GPa]Pooled Standard Deviation = .311 [GPa]Pooled Coeff. of Variation =7.117 [%]

80
Specimen Cure Prepreg ASAP Strength Modulus Avg. Specimen # Plies in Avg. tplyNumber Cycle Lot # Batch # [MPa] [GPa] Thickn. [mm] Laminate [mm]
A1-911-081-1-1 A 1 1 163.869 5.419 3.114 12 0.25950A1-911-081-2-1 A 1 1 159.949 4.868 3.129 12 0.26077A1-911-081-3-1 A 1 1 170.997 3.119 12 0.25993B1-911-081-1-1 B 1 2 158.813 4.875 3.094 12 0.25781B1-911-081-2-1 B 1 2 156.996 4.688 3.152 12 0.26268B1-911-081-3-1 B 1 2 171.414 3.101 12 0.25845
Average 163.673 4.963 Average 0.2599Standard Dev. 6.256 0.316
Coeff. of Var. [%] 3.822 6.377Min. 156.996 4.688 Min. 0.2578Max. 171.414 5.419 Max. 0.2627
Number of Spec. 6 4
In-Plane Shear -- (CTD)Strength & ModulusTCA 7781/#2510 Glass Fabric

81
0
1
2
3
4
5
6
0 50 100 150 200 250 300
In-Plane Shear Strength [MPa]
ASA
P Ba
tch
#
0
1
2
3
Prepreg Lot #ASAP Batch #
Prepreg Lot #
In-Plane Shear -- (CTD)Measured StrengthTCA 7781/#2510 Glass Fabric
Pooled Average = 163.673 [MPa]Pooled Standard Deviation = 6.256 [MPa]Pooled Coeff. of Variation = 3.822 [%]
0
1
2
3
4
5
6
0 1 2 3 4 5 6 7 8 9 10
In-Plane Shear Modulus [GPa]
ASA
P Ba
tch
#
0
1
2
3
Prepreg Lot #
ASAP Batch #
Prepreg Lot #
In-Plane Shear -- (CTD)Measured ModulusTCA 7781/#2510 Glass Fabric
Pooled Average = 4.963 [GPa]Pooled Standard Deviation = .316 [GPa]Pooled Coeff. of Variation = 6.377 [%]

82
Specimen Cure Prepreg ASAP Strength Modulus Avg. Specimen # Plies in Avg. tplyNumber Cycle Lot # Batch # [MPa] [GPa] Thickn. [mm] Laminate [mm]
A1-911-081-1-4 A 1 1 81.014 2.992 3.147 12 0.26226A1-911-081-1-5 A 1 1 79.335 4.061 3.158 12 0.26321A1-911-081-1-6 A 1 1 81.726 3.166 12 0.26380B1-911-081-1-4 B 1 2 79.743 3.041 3.195 12 0.26623B1-911-081-1-5 B 1 2 79.317 3.282 3.206 12 0.26719B1-911-081-1-6 B 1 2 79.774 3.206 12 0.26719A1-911-082-1-3 A 2 3 81.193 3.103 3.131 12 0.26088A1-911-082-1-4 A 2 3 80.280 2.992 3.150 12 0.26247A1-911-082-1-5 A 2 3 81.660 3.170 12 0.26416B1-911-082-1-3 B 2 4 79.848 2.999 3.136 12 0.26130B1-911-082-1-4 B 2 4 79.215 3.082 3.157 12 0.26306B1-911-082-1-5 B 2 4 81.038 3.166 12 0.26380A1-911-083-1-3 A 3 5 80.323 3.027 3.095 12 0.25796A1-911-083-1-4 A 3 5 79.730 2.896 3.114 12 0.25946A1-911-083-1-5 A 3 5 80.200 3.114 12 0.25946B1-911-083-1-3 B 3 6 79.694 3.116 3.026 12 0.25216B1-911-083-1-4 B 3 6 81.132 3.192 3.057 12 0.25474B1-911-083-1-5 B 3 6 80.448 3.091 12 0.25756
Average 80.315 3.149 Average 0.2615Standard Dev. 0.805 0.305
Coeff. of Var. [%] 1.002 9.678Min. 79.215 2.896 Min. 0.2522Max. 81.726 4.061 Max. 0.2672
Number of Spec. 18 12
In-Plane Shear -- (ETW)Strength & ModulusTCA 7781/#2510 Glass Fabric

83
0
1
2
3
4
5
6
0 50 100 150 200 250 300
In-Plane Shear Strength [MPa]
ASAP
Bat
ch #
0
1
2
3
Prepreg Lot #
ASAP Batch #
Prepreg Lot #
In-Plane Shear -- (ETW)Measured StrengthTCA 7781/#2510 Glass Fabric
Pooled Average = 80.315 [MPa]Pooled Standard Deviation = 0.805 [MPa]Pooled Coeff. of Variation = 1.002 [%]
0
1
2
3
4
5
6
0 1 2 3 4 5 6 7 8 9 10
In-Plane Shear Modulus [GPa]
AS
AP B
atch
#
0
1
2
3
Prepreg Lot #
ASAP Batch #
Prepreg Lot #
In-Plane Shear -- (ETW)Measured ModulusTCA 7781/#2510 Glass Fabric
Pooled Average = 3.149 [GPa]Pooled Standard Deviation = .305
[GPa]Pooled Coeff. of Variation = 9.678 [%]

84
Specimen Cure Prepreg ASAP Strength Modulus Avg. Specimen # Plies in Avg. tplyNumber Cycle Lot # Batch # [MPa] [GPa] Thickn. [mm] Laminate [mm]
A1-911-081-1-3 A 1 1 107.636 3.868 3.129 12 0.26073A1-911-081-2-3 A 1 1 107.639 3.551 3.144 12 0.26200A1-911-081-3-3 A 1 1 104.103 3.150 12 0.26247B1-911-081-1-3 B 1 2 104.564 3.475 3.156 12 0.26300B1-911-081-2-3 B 1 2 101.845 3.537 3.226 12 0.26882B1-911-081-3-3 B 1 2 104.767 3.175 12 0.26458A1-911-082-1-2 A 2 3 108.033 3.578 3.108 12 0.25897A1-911-082-2-2 A 2 3 103.531 3.833 3.138 12 0.26147A1-911-082-3-2 A 2 3 108.479 3.124 12 0.26035B1-911-082-1-2 B 2 4 108.478 3.930 3.113 12 0.25940B1-911-082-2-2 B 2 4 106.695 3.958 3.120 12 0.25997B1-911-082-3-2 B 2 4 107.387 3.124 12 0.26035A1-911-083-1-2 A 3 5 108.587 3.723 3.064 12 0.25531A1-911-083-2-2 A 3 5 104.949 3.489 3.086 12 0.25713A1-911-083-3-2 A 3 5 107.150 3.073 12 0.25612B1-911-083-1-2 B 3 6 102.149 3.868 2.996 12 0.24966B1-911-083-2-2 B 3 6 105.479 3.689 2.998 12 0.24987B1-911-083-3-2 B 3 6 103.287 3.023 12 0.25188
Average 105.820 3.708 Average 0.2590Standard Dev. 2.246 0.179
Coeff. of Var. [%] 2.122 4.826Min. 101.845 3.475 Min. 0.2497Max. 108.587 3.958 Max. 0.2688
Number of Spec. 18 12
In-Plane Shear -- (ETD)Strength & ModulusTCA 7781/#2510 Glass Fabric

85
0
1
2
3
4
5
6
0 50 100 150 200 250 300
In-Plane Shear Strength [MPa]
ASA
P B
atch
#
0
1
2
3
Prepreg Lot #
ASAP Batch #
Prepreg Lot #
In-Plane Shear -- (ETD)Measured StrengthTCA 7781/#2510 Glass Fabric
Pooled Average = 105.820 [MPa]Pooled Standard Deviation = 2.246 [MPa]Pooled Coeff. of Variation = 2.122 [%]
0
1
2
3
4
5
6
0 1 2 3 4 5 6 7 8 9 10
In-Plane Shear Modulus [GPa]
ASA
P Ba
tch
#
0
1
2
3
Prepreg Lot #
ASAP Batch #
Prepreg Lot #
In-Plane Shear -- (ETD)Measured ModulusTCA 7781/#2510 Glass Fabric
Pooled Average = 3.708 [GPa]Pooled Standard Deviation = .179 [GPa]Pooled Coeff. of Variation = 4.826 [%]

86
Specimen Cure Prepreg ASAP Strength Avg. Specimen # Plies in Avg. tply
Number Cycle Lot # Batch # [MPa] Thickn. [mm] Laminate [mm]A1-911-081-1-4 A 1 1 52.001 2.752 10 0.27521A1-911-081-1-5 A 1 1 54.500 2.752 10 0.27521A1-911-081-1-6 A 1 1 55.258 2.743 10 0.27432B1-911-081-1-1 B 1 2 64.890 2.644 10 0.26441B1-911-081-1-2 B 1 2 65.234 2.634 10 0.26340B1-911-081-1-3 B 1 2 63.119 2.639 10 0.26391A1-911-082-1-1 A 2 3 55.581 2.645 10 0.26454A1-911-082-1-2 A 2 3 63.561 2.635 10 0.26353A1-911-082-1-3 A 2 3 58.242 2.645 10 0.26454B1-911-082-1-1 B 2 4 61.488 2.650 10 0.26505B1-911-082-1-2 B 2 4 62.804 2.643 10 0.26429B1-911-082-1-3 B 2 4 61.464 2.659 10 0.26594A1-911-083-1-1 A 3 5 59.261 2.510 10 0.25095A1-911-083-1-2 A 3 5 56.858 2.507 10 0.25070A1-911-083-1-3 A 3 5 65.559 2.480 10 0.24803B1-911-083-1-1 B 3 6 59.868 2.704 10 0.27038B1-911-083-1-2 B 3 6 61.409 2.671 10 0.26708B1-911-083-1-3 B 3 6 60.168 2.692 10 0.26924
Average 60.070 Average 0.2645Standard Dev. 3.974
Coeff. of Var. [%] 6.616Min. 52.001 Min. 0.2480Max. 65.559 Max. 0.2752
Number of Spec. 18
Apparent Interlaminar Shear -- (RTD)Strength
TCA 7781/#2510 Glass Fabric

87
0
1
2
3
4
5
6
0 20 40 60 80 100 120
ILSS Strength [MPa]
ASA
P B
atch
#
0
1
2
3
Prepreg Lot #
ASAP Batch #Prepreg Lot #
Pooled Average = 60.070 [MPa]Pooled Standard Deviation = 3.974 [MPa]
Pooled Coeff. of Variation = 6.616 [%]
Apparent Interlaminar Shear -- (RTD)Measured Strength
TCA 7781/#2510 Glass Fabric

88
3.2.2. Fluid Sensitivity Raw Data Spreadsheets and Scatter Charts

89
Specimen Batch Strength Avg. Specimen # Plies in Avg. tply
Number Number [MPa] Thickn. [mm] Laminate [mm]A1-911-081-1-7 1 126.440 3.171 12 0.26422A1-911-081-2-7 1 127.506 3.184 12 0.26532A1-911-081-3-7 1 120.477 3.186 12 0.26554B1-911-081-1-7 2 124.733 3.210 12 0.26748B1-911-081-2-7 2 123.040 3.277 12 0.27305
Average 124.439 0.2671Standard Dev. 2.791
Coeff. of Var. [%] 2.242Min. 120.477 Min. 0.2642Max. 127.506 Max. 0.2731
Number of Spec. 5
In-Plane Shear -- (MEK - RTD)Strength
TCA 7781/#2510 Glass Fabric
0
1
2
3
0 50 100 150 200 250 300
In-Plane Shear Strength [MPa]
Bat
ch #
In-Plane Shear -- (MEK - RTD)Measured Strength
TCA 7781/#2510 Glass Fabric
Pooled Average = 124.439 [MPa]Pooled Standard Deviation = 2.791 [MPa]
Pooled Coeff. of Variation = 2.242 [%]

90
Specimen Batch Strength Avg. Specimen # Plies in Avg. tply
Number Number [MPa] Thickn. [mm] Laminate [mm]A1-911-081-1-9 1 105.856 3.200 12 0.26670A1-911-081-2-9 1 97.827 3.200 12 0.26670A1-911-081-3-9 1 100.670 3.175 12 0.26458B1-911-081-1-9 2 101.235 3.175 12 0.26458B1-911-081-2-9 2 103.535 3.226 12 0.26882
Average 101.825 0.2663Standard Dev. 3.035
Coeff. of Var. [%] 2.980Min. 97.827 Min. 0.2646Max. 105.856 Max. 0.2688
Number of Spec. 5
In-Plane Shear -- (JP-4 JET FUEL - ETD)Strength
TCA 7781/#2510 Glass Fabric
0
1
2
3
0 50 100 150 200 250 300
In-Plane Shear Strength [MPa]
Bat
ch #
In-Plane Shear -- (JP-4 JET FUEL - ETD)Measured Strength
TCA 7781/#2510 Glass Fabric
Pooled Average = 101.825 [MPa]Pooled Standard Deviation = 3.035 [MPa]
Pooled Coeff. of Variation = 2.980 [%]

91
Specimen Batch Strength Avg. Specimen # Plies in Avg. tply
Number Number [MPa] Thickn. [mm] Laminate [mm]A1-911-081-1-8 1 104.802 3.175 12 0.26458A1-911-081-2-8 1 101.647 3.175 12 0.26458A1-911-081-3-8 1 100.715 3.175 12 0.26458B1-911-081-1-8 2 100.561 3.200 12 0.26670B1-911-081-2-8 2 98.604 3.251 12 0.27093
Average 101.266 0.2663Standard Dev. 2.266
Coeff. of Var. [%] 2.238Min. 98.604 Min. 0.2646Max. 104.802 Max. 0.2709
Number of Spec. 5
In-Plane Shear -- (Hydraulic Fluid - ETD)Strength
TCA 7781/#2510 Glass Fabric
0
1
2
3
0 50 100 150 200 250 300
In-Plane Shear Strength [MPa]
Bat
ch #
In-Plane Shear -- (Hydraulic Fluid - ETD)Measured Strength
TCA 7781/#2510 Glass Fabric
Pooled Average = 101.266 [MPa]Pooled Standard Deviation = 2.266 [MPa]
Pooled Coeff. of Variation = 2.238 [%]

92
Fluid Sensitivity Comparison:
Average In-Plane Shear Strength with Fluid (MPa)
Same Environment In-Plane Shear Strength without Fluid (MPa)
Worst Case Environment In-Plane Shear Strength (MPa)
MEK (RTD)
124.439
(RTD)
127.182
(ETW)
80.315
The RTD average in-plane shear strength was reduced by 2% after exposure to MEK. However, it remained 55% higher than water exposure in ETW condition.
Average In-Plane Shear Strength with Fluid (MPa)
Same Environment In-Plane Shear Strength without Fluid (MPa)
Worst Case Environment In-Plane Shear Strength (MPa)
JP-4 JET FUEL (ETD)
101.825
(ETD)
105.820
(ETW)
80.315
The ETD average in-plane shear strength was reduced by 4% after exposure to JP-4 Jet Fuel. However it remained 27% higher than water exposure in ETW conditions.
Average In-Plane Shear Strength with Fluid (MPa)
Same Environment In-Plane Shear Strength without Fluid (MPa)
Worst Case Environment In-Plane Shear Strength (MPa)
HYDRAULIC FLUID (ETD)
101.266
(ETD)
105.820
(ETW)
80.315
The ETD average in-plane shear strength was reduced by 4% after exposure to hydraulic fluid. However it remained 26% higher than water exposure in ETW conditions.

93
3.2.3. Representative Shear Stress-Strain Curve The following stress-strain curve is representative of the TORAY 7781 Finish 558/#2510 Fiberglass Woven Fabric prepreg system. The tension and compression stress-strain curves are not presented in graphical form. If strain design allowables from these tests are required, simple one-dimensional linear stress-strain relationships may be used to obtain corresponding strain design values. This process should approximate tensile and compressive strain behavior relatively well but may produce extremely conservative strain values in shear due to the nonlinear behavior. A more realistic approach for shear strain design allowables is to use a maximum strain value of 5% (reference MIL-HDBK-17-1E, section 5.7.6). If a nonlinear analysis of the material’s shear behavior is required, the curve-fit of the shear stress-strain curve may be used. The representative shear stress-strain curve was obtained by taking the average of all the sample shear curves and determining the best-fit line through the data. The actual data points are also presented on the chart to demonstrate material variability.

94
Shear Stress vs. Shear Strain, RTD
0
2000
4000
6000
8000
10000
12000
14000
16000
18000
20000
0 0.02 0.04 0.06 0.08 0.1 0.12
Shear Strain [in/in]
Shea
r St
ress
[psi
]
Strain Data PointsBest Curve Fit Output
y-1 = a + b ln x/xr2 = 0.99942116
a = 6.6378862 e-05b = -2.1952899 e-07

95
3.3. Statistical Results

96
0.0
0.2
0.4
0.6
0.8
1.0
1.2
0 100 200 300 400 500 600 700
0° Measured Tension Strength
Prob
abili
ty o
f Sur
viva
l
CTD
RTD
ETD
ETW
NONE
NORMAL CURVE
NORMAL CURVE
NORMAL CURVE
NORMAL CURVE
NORMAL CURVE
0
0.1
0.2
0.3
0.4
0.5
0.6
0.7
0.8
0.9
1
0.5 0.6 0.7 0.8 0.9 1 1.1 1.2
Normalized Data
Prob
abilit
y of
Sur
viva
l
POOLED DATA
NORMALCURVE + 10%
- 10%
DISTRIBUTION OF DATA & NORMAL CURVES
DISTRIBUTION OF DATA AT INDIVIDUAL TEST CONDITIONS DISTRIBUTION OF POOLED DATA
TorayTCA 7781/#2510 Glass Fabric

97
0.0
0.2
0.4
0.6
0.8
1.0
1.2
0 100 200 300 400 500 600 700
0° Normalized Tension Strength
Prob
abili
ty o
f Sur
viva
l
CTD
RTD
ETD
ETW
NONE
NORMAL CURVE
NORMAL CURVE
NORMAL CURVE
NORMAL CURVE
NORMAL CURVE
0
0.1
0.2
0.3
0.4
0.5
0.6
0.7
0.8
0.9
1
0.5 0.6 0.7 0.8 0.9 1 1.1 1.2
Normalized Data
Prob
abilit
y of
Sur
viva
l
POOLED DATA
NORMALCURVE + 10%
- 10%
DISTRIBUTION OF DATA & NORMAL CURVES
DISTRIBUTION OF DATA AT INDIVIDUAL TEST CONDITIONS DISTRIBUTION OF POOLED DATA
TorayTCA 7781/#2510 Glass Fabric

98
0.0
0.2
0.4
0.6
0.8
1.0
1.2
0 100 200 300 400 500
90° Measured Tension Strength
Prob
abili
ty o
f Sur
viva
l
CTD
RTD
ETD
ETW
NONE
NORMAL CURVE
NORMAL CURVE
NORMAL CURVE
NORMAL CURVE
NORMAL CURVE
0
0.1
0.2
0.3
0.4
0.5
0.6
0.7
0.8
0.9
1
0.5 0.6 0.7 0.8 0.9 1 1.1 1.2
Normalized Data
Prob
abilit
y of
Sur
viva
l
POOLED DATA
NORMALCURVE + 10%
- 10%
DISTRIBUTION OF DATA & NORMAL CURVES
DISTRIBUTION OF DATA AT INDIVIDUAL TEST CONDITIONS DISTRIBUTION OF POOLED DATA
TorayTCA 7781/#2510 Glass Fabric

99
0.0
0.2
0.4
0.6
0.8
1.0
1.2
0 100 200 300 400 500
90° Normalized Tension Strength
Prob
abili
ty o
f Sur
viva
l
CTD
RTD
ETD
ETW
NONE
NORMAL CURVE
NORMAL CURVE
NORMAL CURVE
NORMAL CURVE
NORMAL CURVE
0
0.1
0.2
0.3
0.4
0.5
0.6
0.7
0.8
0.9
1
0.5 0.6 0.7 0.8 0.9 1 1.1 1.2
Normalized Data
Prob
abilit
y of
Sur
viva
l
POOLED DATA
NORMALCURVE + 10%
- 10%
DISTRIBUTION OF DATA & NORMAL CURVES
DISTRIBUTION OF DATA AT INDIVIDUAL TEST CONDITIONS DISTRIBUTION OF POOLED DATA
TorayTCA 7781/#2510 Glass Fabric

100
0.0
0.2
0.4
0.6
0.8
1.0
1.2
0 200 400 600 800
0° Measured Compression Strength
Prob
abili
ty o
f Sur
viva
l
CTD
RTD
ETD
ETW
NONE
NORMAL CURVE
NORMAL CURVE
NORMAL CURVE
NORMAL CURVE
NORMAL CURVE
0
0.1
0.2
0.3
0.4
0.5
0.6
0.7
0.8
0.9
1
0.5 0.6 0.7 0.8 0.9 1 1.1 1.2
Normalized Data
Prob
abilit
y of
Sur
viva
l
POOLED DATA
NORMALCURVE + 10%
- 10%
DISTRIBUTION OF DATA & NORMAL CURVES
DISTRIBUTION OF DATA AT INDIVIDUAL TEST CONDITIONS DISTRIBUTION OF POOLED DATA
TorayTCA 7781/#2510 Glass Fabric

101
0.0
0.2
0.4
0.6
0.8
1.0
1.2
0 200 400 600 800
0° Normalized Compression Strength
Prob
abili
ty o
f Sur
viva
l
CTD
RTD
ETD
ETW
NONE
NORMAL CURVE
NORMAL CURVE
NORMAL CURVE
NORMAL CURVE
NORMAL CURVE
0
0.1
0.2
0.3
0.4
0.5
0.6
0.7
0.8
0.9
1
0.5 0.6 0.7 0.8 0.9 1 1.1 1.2
Normalized Data
Prob
abilit
y of
Sur
viva
l
POOLED DATA
NORMALCURVE + 10%
- 10%
DISTRIBUTION OF DATA & NORMAL CURVES
DISTRIBUTION OF DATA AT INDIVIDUAL TEST CONDITIONS DISTRIBUTION OF POOLED DATA
TorayTCA 7781/#2510 Glass Fabric

102
0.0
0.2
0.4
0.6
0.8
1.0
1.2
0 100 200 300 400 500 600
90° Measured Compression Strength
Prob
abili
ty o
f Sur
viva
l
CTD
RTD
ETD
ETW
NONE
NORMAL CURVE
NORMAL CURVE
NORMAL CURVE
NORMAL CURVE
NORMAL CURVE
0
0.1
0.2
0.3
0.4
0.5
0.6
0.7
0.8
0.9
1
0.5 0.6 0.7 0.8 0.9 1 1.1 1.2
Normalized Data
Prob
abilit
y of
Sur
viva
l
POOLED DATA
NORMALCURVE + 10%
- 10%
DISTRIBUTION OF DATA & NORMAL CURVES
DISTRIBUTION OF DATA AT INDIVIDUAL TEST CONDITIONS DISTRIBUTION OF POOLED DATA
TorayTCA 7781/#2510 Glass Fabric

103
0.0
0.2
0.4
0.6
0.8
1.0
1.2
0 100 200 300 400 500 600
90° Normalized Compression Strength
Prob
abili
ty o
f Sur
viva
l
CTD
RTD
ETD
ETW
NONE
NORMAL CURVE
NORMAL CURVE
NORMAL CURVE
NORMAL CURVE
NORMAL CURVE
0
0.1
0.2
0.3
0.4
0.5
0.6
0.7
0.8
0.9
1
0.5 0.6 0.7 0.8 0.9 1 1.1 1.2
Normalized Data
Prob
abilit
y of
Sur
viva
l
POOLED DATA
NORMALCURVE + 10%
- 10%
DISTRIBUTION OF DATA & NORMAL CURVES
DISTRIBUTION OF DATA AT INDIVIDUAL TEST CONDITIONS DISTRIBUTION OF POOLED DATA
TorayTCA 7781/#2510 Glass Fabric

104
0.0
0.2
0.4
0.6
0.8
1.0
1.2
0 50 100 150 200
In-Plane Shear
Prob
abili
ty o
f Sur
viva
l
CTD
RTD
ETD
ETW
NONE
NORMAL CURVE
NORMAL CURVE
NORMAL CURVE
NORMAL CURVE
NORMAL CURVE
0
0.1
0.2
0.3
0.4
0.5
0.6
0.7
0.8
0.9
1
0.5 0.6 0.7 0.8 0.9 1 1.1 1.2
Normalized Data
Prob
abilit
y of
Sur
viva
l
POOLED DATA
NORMALCURVE + 10%
- 10%
DISTRIBUTION OF DATA & NORMAL CURVES
DISTRIBUTION OF DATA AT INDIVIDUAL TEST CONDITIONS DISTRIBUTION OF POOLED DATA
TorayTCA 7781/#2510 Glass Fabric

105
0.0
0.2
0.4
0.6
0.8
1.0
1.2
0 20 40 60 80
Apparent Interlaminar Shear
Prob
abili
ty o
f Sur
viva
l
CTD
RTD
ETD
ETW
NONE
NORMAL CURVE
NORMAL CURVE
NORMAL CURVE
NORMAL CURVE
NORMAL CURVE
0
0.1
0.2
0.3
0.4
0.5
0.6
0.7
0.8
0.9
1
0.5 0.6 0.7 0.8 0.9 1 1.1 1.2
Normalized Data
Prob
abilit
y of
Sur
viva
l
POOLED DATA
NORMALCURVE + 10%
- 10%
DISTRIBUTION OF DATA & NORMAL CURVES
DISTRIBUTION OF DATA AT INDIVIDUAL TEST CONDITIONS DISTRIBUTION OF POOLED DATA
TorayTCA 7781/#2510 Glass Fabric

106
APPENDIX A. PHYSICAL AND MECHANICAL TEST PROCEDURES
107
A.1. Physical Properties
A.1.1. Uncured Resin Content Three (100 mm X 100 mm) uncured samples were taken across the width of the prepreg ply sheet, from the start and end of the batch. These samples were tested for resin weight percentage in accordance with TCWIN-Q-P004, using N-Methyl Pyrrolidone (NMP) solvent to extract the resin matrix, and SACMA SRM 23-94, Method A.
A.1.2. Uncured Volatile Content The volatile content weight fraction was determined in accordance with TCWIN-Q-P001 that meets the intent of ASTM D3530. Three (100 mm X 100 mm) uncured samples were taken across the width of the prepreg ply sheet, from the start and end of the batch.
A.1.3. Resin Gel Time Three (6 mm X 6 mm) uncured samples were taken across the width of the prepreg ply sheet, from the start and end of the prepreg material batch. The gel time property was performed in accordance with ASTM D3532 and TCWIN-U-P007.
A.1.4. Resin Flow The resin flow property was determined in accordance with SACMA SRM 22-94 and TCWIN-U-P008.
A.1.5. Uncured Fiber Areal Weight The surface areas of resin content samples tested in accordance with 2.2.1 were precisely measured in accordance with TCWIN-Q-P004 and SACMA SRM 23R-94. The fiber areal weight (g/m2) was calculated by dividing the mass of the resin free fibrous residue by the measured surface area.
A.1.6. Infrared Spectroscopy The infrared spectroscopy signature tests were performed in accordance with TCWIN-U-C002 that meets the intent of ASTM D1252 and ASTM D168.

108
A.1.7. High Performance Liquid Chromatography (HPLC) HPLC signature tests were performed in accordance with TCWIN-U-C004 and SACMA SRM 20R-94.
A.1.8. Differential Scanning Calorimetry (DSC) DSC was performed to provide thermal property, specifically onset and peak temperature, data for prepreg material. The DSC tests were conducted in accordance with SACMA SRM 25R-94 and TCWIN-U-C003.
A.1.9. Cured Neat Resin Density Testing the specimens in accordance with ASTM D792 Method A and TCWIN-U-M215 determined the cured neat resin density. The density was calculated as follows:
⎟⎟⎠
⎞⎜⎜⎝
⎛−
=21
1sinRe WW
WLρρ
where: ρResin = Resin density, g/cc ρL = density of ethanol or water, g/cc W1 = weight of sample in air
W2 = weight of sample in ethanol or water
A.1.10. Fiber Volume The fiber volume of each mechanical test laminate was determined in accordance with ASTM D3171-90. The calculation was performed in accordance with the following equation;
⎟⎟⎠
⎞⎜⎜⎝
⎛=
F
CFCF
WVρ
ρ *
where: VF = calculated fiber volume, % ρC = laminate density, g/cc (same method as 2.2.9) WCF = weight of fibrous carbon fiber residue of acid digestion, g ρF = nominal carbon fiber density, g/cc = 1.79 for T700G
A.1.11. Resin Volume The resin volume of each mechanical test laminate was determined in accordance with ASTM D3171-90. The calculation was performed in accordance with the following equation;

109
⎟⎟⎠
⎞⎜⎜⎝
⎛ −=
R
CFCF
WVρ
ρ 100*
where: VF = calculated fiber volume, %(v) ρC = laminate density, g/cc (same method as 2.2.9) WCF = weight of fibrous carbon fiber residue of acid digestion, g ρR = nominal cured neat resin density, g/cc = 1.267
A.1.12. Void Content The void content of each mechanical test laminate was determined in accordance with ASTM D2734-94. The calculation was performed in accordance with the following equation;
⎥⎦
⎤⎢⎣
⎡⎟⎟⎠
⎞⎜⎜⎝
⎛+
−−=
F
CF
R
CFCV
WWVρρ
ρ 100*100
where: VV = Void content, %(v) ρC = laminate density, g/cc (same method as 2.2.9) WCF = weight of fibrous carbon fiber residue of acid digestion, g ρF = nominal carbon fiber density, g/cc = 1.79 for T700G ρR = nominal cured neat resin density, g/cc = 1.267
A.1.13. Cured Laminate Tg by DMA The dry and wet Tg by DMA was determined on three specimens per batch in accordance with SACMA SRM 18R-94. The wet Tg specimens were conditioned in accordance with method described in paragraph 2.1.7.1. The resultant wet Tg data reflected the plasticization of resin matrix due to moisture absorption that is anticipated for any operational environment.
A.2. TENSILE PROPERTIES Note: The following descriptions below apply to both 0° (Warp) and 90° (Fill) Tensile
specimens unless otherwise specified.
A.2.1. 0° (Warp) and 90° (Fill) Tensile Properties The 0° (warp) and 90° (fill) tensile tests were conducted in accordance with ASTM D3039 and TCWIN-U-M201. Six test specimens, 4 for tensile strength & modulus and 2 for tensile strength only, were tested for each test condition. Test specimens

110
from one batch were tested at -65°F (Dry). Test specimens from three batches were tested at 75°F (Dry), 180°F (Dry) and 180°F (Wet). Twelve plies were used to fabricate the initial test panels, for zero-degree (warp)12 and ninety-degree (fill)12 ply orientations. The panels were tabbed in accordance with para. 2.1.5. The zero-degree and ninety-degree test specimens were wet cut to 9.0 inches nominal length and 1.00 inch nominal width in accordance with TCWIN-Q-M101. The widths of the test specimens were measured with digital ¼” diameter flat anvil and spindle micrometer. The thickness of the specimens were measured with digital ¼” diameter hemispherical anvil and spindle micrometer. The measurements were recorded onto TCFOR-Q-033. The width and thickness measurements were entered into the test frame computer along with the material type, batch number, test condition and specimen identification. The 0° (warp) tensile test specimens were strain gauged with CEA-06-125UT-120 biaxial strain gage, except the –65 °F test specimens that were strain gauge with CEA-06-125UT-350 biaxial strain gage by Intec. The 90° (fill) tensile test specimens were strain gauged with C-960401-A axial strain gage, except the –65 °F test specimens that were strain gauge with CEA-06-125UW-350 axial strain gage by Intec. Instron 4505 load frame, operated in stroke control mode, was used to apply loading to the specimens at a crosshead rate of 0.05 inch/minute. For 0° (warp) tensile specimens, the loads, crosshead displacements, longitudinal strains and transverse strains were recorded throughout each test using a calibrated, computerized data assimilation system. For 90° (fill) tensile specimens, the loads, crosshead displacements and transverse strains only were recorded throughout each test using a calibrated, computerized data assimilation system.
A.2.1.1. Tensile Calculations The ultimate tensile strengths, moduli and the poisson’s ratio (zero-degree only) were calculated by transferring the raw data recorded, for example, ultimate loads, from the Instron computer into a Microsoft Excel spreadsheet program, in accordance with the following equations:
A.2.1.1.1. Tensile Strength (Un-normalized) The un-normalized tensile strength was calculated using the following equation:
dbP
ULT *=σ

111
where: σULT = the ultimate tensile stress (MPa) P = the maximum load, (N) b = the averaged measured width of the specimen (mm) d = the averaged measured thickness of the specimen (mm)
A.2.1.1.2. Tensile Strength (Normalized) The normalized tensile strength was calculated using the following equation:
gebatchavera
specimenULT CPT
CPTx
dbP*
=σ
A.2.1.1.3. Tensile Modulus of Elasticity (Un-normalized) The un-normalized longitudinal tensile modulus of elasticity was calculated using the following equation:
( )%1.0%3.0
%1.0%3.011 ** εε −
−=
dbPPE T
where: E11T = the tensile modulus of elasticity (GPa) b = the averaged measured width of the specimen (mm) d = the averaged measured thickness of the specimen (mm) P0.3% = the applied load at 3000 micron (N) P0.1% = the applied load at 1000 micron (N) ε0.3% = 0.3% measured longitudinal strain = 3000 micron (mm/m)
ε0.1% = 0.1% measured longitudinal strain = 1000 micron (mm/m)
A.2.1.1.4. Tensile Modulus of Elasticity (Normalized) The normalized longitudinal tensile modulus of elasticity was calculated using the following equation:
( ) gebatchavera
specimenT CPT
CPTx
dbPPE
%1.0%3.0
%1.0%3.011 ** εε −
−=
A.2.1.1.5. 0° (Warp) Tensile Poisson’s Ratio The poisson’s ratio (ν12) of 0° (warp) tensile specimen was calculated as follows:

112
υ12 = 002.0
12 YY εε −
where: υ12 = major Poisson’s ratio
εY1 = transverse strain at stress 1, mm/mm εY2 = transverse strain at stress 2, mm/mm 0.002 = the longitudinal strain range (εX2-εX1)=0.003–0.001 mm/mm
A.3. COMPRESSIVE STRENGTH Note: The following descriptions apply to both 0° (Warp) and 90° (Fill) Compressive
Strength specimens unless otherwise specified.
A.3.1. 0° (Warp) and 90° (Fill) Compressive Strength Properties The 0° (warp) and 90° (fill) compressive strength tests were conducted in accordance with SACMA SRM 1R-94 and TCWIN-U-M204. Six compressive strength specimens were tested for each test condition. Test specimens from one batch were tested at -65°F (Dry). Test specimens from three batches were tested at 75°F (Dry), 180°F (Dry) and 180°F (Wet). Twelve plies were used to fabricate the initial test panels, for zero-degree (warp)12 and ninety-degree (fill)12 ply orientations. The panels were tabbed in accordance with para. 2.1.5. The test specimens were wet cut, to nominal length of 3.18 inches and a nominal width of 0.50 inch. The test specimens were machined at NIAR, Wichita State University in accordance with SACMA SRM 1-94. The widths of the specimens were measured with digital ¼” diameter flat anvil and spindle micrometer. The thickness of the specimens used in calculations was the average of measurements on untabbed test panel with digital ¼” diameter hemispherical anvil and spindle micrometer. The measurements were recorded onto TCFOR-Q-033. The width and thickness measurements were entered into the test frame computer along with the material type, batch number, test condition and specimen identification. A modified ASTM D695 anti-buckling fixture was used to augment specimen stability during the compressive tests. Instron 4510 load frame, operated in stroke control mode, was used to apply loading to the specimens at 0.05 inch/minute crosshead rate. The loads and displacements were recorded throughout each test using a calibrated, computerized data assimilation system.
113
A.3.1.1. Compressive Strength Calculations The ultimate compressive strengths were calculated by transferring the raw data recorded, for example, ultimate loads, from the Instron 4510 into a Microsoft Excel spreadsheet program, in accordance with the following equations:
A.3.1.1.1. Compressive Strength Calculation (Un-normalized) The un-normalized 0° (warp) & 90° (fill) ultimate compressive strengths were calculated in accordance with the following formula:
tbPF*
=
where: F = the ultimate compressive strength (MPa)
P = the ultimate compressive load (N) b = the averaged measured specimen width (mm) t = the average thickness measured on untabbed compression panel (mm)
A.3.1.1.2. Compressive Strength Calculation (Normalized) The 0° (warp) & 90° (fill) compressive strengths were normalized in accordance with the following formula:
gebatchavera
specimen
CPTCPT
xtb
PF*
=
A.4. COMPRESSIVE MODULUS Note: The following descriptions apply to both 0° (Warp) and 90° (Fill) Compressive
Modulus specimens unless otherwise specified.
A.4.1. 0° (Warp) and 90° (Fill) Compression Modulus Properties The 0° (warp) and 90° (fill) compressive modulus tests were conducted in accordance with SACMA SRM 1R-94 and TCWIN-U-M206. Two test specimens were tested for each test condition. Test specimens from one batch were tested at -65°F (Dry). Test specimens from three batches were tested at 75°F (Dry), 180°F (Dry) and 180°F (Wet).

114
Fourteen plies were used to fabricate the initial test panels, for zero-degree (warp)14 and ninety-degree (fill)14 ply orientations. The test specimens were wet cut, to nominal length of 3.18 inches and a nominal width of 0.50 inch, in accordance with TCWIN-Q-M103. The widths of the test specimens were measured with digital ¼” diameter flat anvil and spindle micrometer. The thickness of the specimens were measured with digital ¼” diameter hemispherical anvil and spindle micrometer. The measurements were recorded onto TCFOR-Q-033. The width and thickness measurements were entered into the test frame computer along with the material type, batch number, test condition and specimen identification. A modified ASTM D695 anti-buckling fixture was used to augment specimen stability during the compressive tests. Instron 4510 load frame, operated in stroke control mode, was used to apply the loads. The crosshead displacement rate for each test was 0.05 in/min (1.27 mm/min) and the strains were measured with a FAE-12S-12-S6EL-2 uni-axial strain gauge, except for the –65°F test specimens that were strain gauged with CEA-06-125UW-350 uni-axial strain gauge and tested by Intec. The loads and strains were recorded throughout each test using computerized data assimilation system.
A.4.1.1. Compression Modulus Calculations The compression moduli were calculated by transferring the raw data recorded, for example, longitudinal strains, from the Instron 4510 into a Microsoft Excel spreadsheet program, in accordance with the following equations:
A.4.1.1.1. Compressive Modulus Calculation (Un-normalized) The un-normalized 0° (warp) & 90° (fill) compressive modulus was calculated as follows:
( )%1.0%3.0
%1.0%3.0
** εε −−
=db
PPE
where: E = compressive modulus (GPa) P0.3% = applied load at 3000 micron, (N) P0.1% = applied load at 1000 micron, (N) b = averaged measured specimen width, (mm) d = averaged measured specimen thickness, (mm) ε0.3% = 0.3% measured strain = 3000 micron (mm/m)
ε0.1% = 0.1% measured strain = 1000 micron (mm/m)
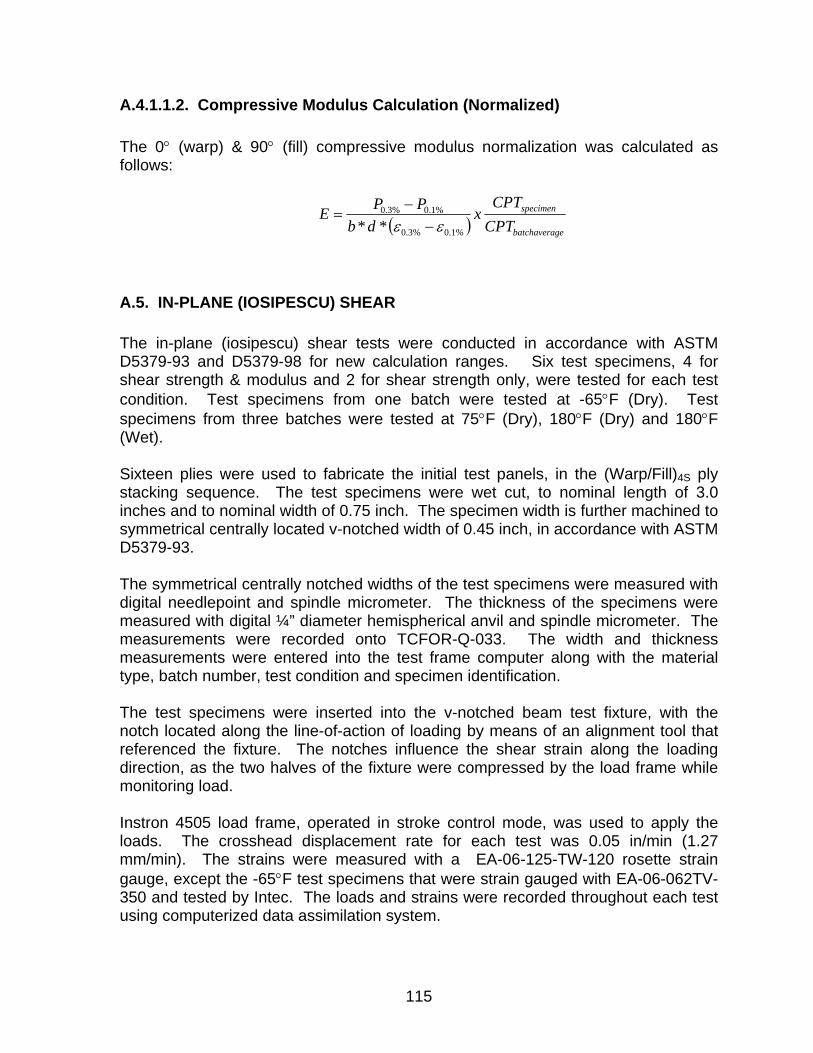
115
A.4.1.1.2. Compressive Modulus Calculation (Normalized) The 0° (warp) & 90° (fill) compressive modulus normalization was calculated as follows:
( ) gebatchavera
specimen
CPTCPT
xdb
PPE%1.0%3.0
%1.0%3.0
** εε −−
=
A.5. IN-PLANE (IOSIPESCU) SHEAR The in-plane (iosipescu) shear tests were conducted in accordance with ASTM D5379-93 and D5379-98 for new calculation ranges. Six test specimens, 4 for shear strength & modulus and 2 for shear strength only, were tested for each test condition. Test specimens from one batch were tested at -65°F (Dry). Test specimens from three batches were tested at 75°F (Dry), 180°F (Dry) and 180°F (Wet). Sixteen plies were used to fabricate the initial test panels, in the (Warp/Fill)4S ply stacking sequence. The test specimens were wet cut, to nominal length of 3.0 inches and to nominal width of 0.75 inch. The specimen width is further machined to symmetrical centrally located v-notched width of 0.45 inch, in accordance with ASTM D5379-93. The symmetrical centrally notched widths of the test specimens were measured with digital needlepoint and spindle micrometer. The thickness of the specimens were measured with digital ¼” diameter hemispherical anvil and spindle micrometer. The measurements were recorded onto TCFOR-Q-033. The width and thickness measurements were entered into the test frame computer along with the material type, batch number, test condition and specimen identification. The test specimens were inserted into the v-notched beam test fixture, with the notch located along the line-of-action of loading by means of an alignment tool that referenced the fixture. The notches influence the shear strain along the loading direction, as the two halves of the fixture were compressed by the load frame while monitoring load. Instron 4505 load frame, operated in stroke control mode, was used to apply the loads. The crosshead displacement rate for each test was 0.05 in/min (1.27 mm/min). The strains were measured with a EA-06-125-TW-120 rosette strain gauge, except the -65°F test specimens that were strain gauged with EA-06-062TV-350 and tested by Intec. The loads and strains were recorded throughout each test using computerized data assimilation system.

116
A.5.1. In-plane (Iosipescu) Shear Strength Calculations The strains were measured using the bonded strain gauge. The shear cord modulus was calculated in accordance with ASTM D5379-98, at 6500 microstrain and 2500 microstrain. The ultimate in-plane (iosipescu) shear strength and moduli were calculated by transferring the raw data recorded, for example, ultimate loads, measured strains, from the instron computer into a Microsoft Excel spreadsheet, in accordance with the following equations:
A.5.1.1. In-plane (Iosipescu) Shear, Ultimate Strength Calculation
dbP
Ult *. =τ
where: τUlt. = the ultimate in-plane shear strength (MPa) P = the ultimate load (N) b = the measured specimen width, in the symmetrical centrally located notch (mm) d = the average measured specimen thickness (mm)
A.5.1.2. In-plane (Iosipescu) Shear, Modulus Calculation
)(** %1.0%6.0
%1.0%6.012 γγ −
−=
dbPPG
where: G12 = shear chord modulus of elasticity (GPa) P0.65% = applied load at 6500 micron (N) P0.25% = applied load at 2500 micron (N). b = the measured specimen width, in the symmetrical
centrally located notch (mm) d = the average measured specimen thickness (mm) γ0.65% = ⏐ε+45⏐+⏐ε-45⏐= shear strain at 6500 micron (mm/m) γ0.25% = ⏐ε+45⏐+⏐ε-45⏐= shear strain at 2500 micron (mm/m)
A.6. SHORT BEAM SHEAR The short beam shear tests were conducted in accordance with ASTM 2344-89. Six test specimens from three batches were tested at 75°F (Dry) only.

117
Twelve plies were used to fabricate the initial test panels, in the zero-degree ply stacking sequence, (warp)12. The test specimens were wet cut, to nominal length of 6*average thickness, in inches and to nominal width of 0.25 inch. Instron 4505 load frame, operated in stroke control mode, was used to apply the loads. The crosshead displacement rate for each test was 0.05 in/min (1.27 mm/min). The loads and displacements were recorded throughout each test using computerized data assimilation system.
A.6.1. Short Beam Shear Strength Calculations The short beam shear strengths were calculated by transferring the raw data recorded from the Instron 4505 computer into Microsoft Excel spreadsheet program, in accordance with the following equation:
A.6.1.1. Short Beam Shear Strength Calculation
tbPF**4
*3=
where: F. = the short beam shear strength (MPa) P = the ultimate load (N) b = the measured specimen width (mm) t = the measured specimen thickness (mm)

118
APPENDIX B. MOISTURE CONDITIONING HISTORY CHARTS

119
Traveler #121
0.00
0.50
1.00
1.50
2.00
0 2 4 6 8 10
Time, days 1/2
% W
eigh
t Gai
n
Traveler #122
0.00
0.50
1.00
1.50
2.00
0 2 4 6 8 10
Time, days 1/2
% W
eigh
t Gai
n
Traveler #123
0.00
0.50
1.00
1.50
2.00
0 2 4 6 8 10
Time, days 1/2
% W
eigh
t Gai
n
Traveler #124
0.00
0.50
1.00
1.50
2.00
0 2 4 6 8 10
Time, days 1/2
% W
eigh
t Gai
n
Traveler #125
0.00
0.50
1.00
1.50
2.00
0 2 4 6 8 10
Time, days 1/2
% W
eigh
t Gai
n
Traveler #126
0.00
0.50
1.00
1.50
2.00
0 2 4 6 8 10
Time, days 1/2
% W
eigh
t Gai
n
Traveler #127
0.00
0.50
1.00
1.50
2.00
0 2 4 6 8 10
Time, days 1/2
% W
eigh
t Gai
n
Traveler #128
0.00
0.50
1.00
1.50
2.00
0 2 4 6 8 10
Time, days 1/2
% W
eigh
t Gai
n

120
Traveler #130M
0.00
0.50
1.00
1.50
2.00
0 2 4 6 8 10 12
Time, days 1/2
% W
eigh
t Gai
n
Traveler #132M
0.00
0.50
1.00
1.50
2.00
0 2 4 6 8 10 12
Time, days 1/2%
Wei
ght G
ain
Traveler #134M
0.00
0.50
1.00
1.50
2.00
0 2 4 6 8 10 12
Time, days 1/2
% W
eigh
t Gai
n
Traveler #136M
0.00
0.50
1.00
1.50
2.00
0 2 4 6 8 10 12
Time, days 1/2
% W
eigh
t Gai
n
Traveler #129S
0.00
0.50
1.00
1.50
2.00
0 2 4 6 8 10
Time, days 1/2
% W
eigh
t Gai
n
Traveler #130S
0.00
0.50
1.00
1.50
2.00
0 2 4 6 8 10
Time, days 1/2
% W
eigh
t Gai
n
Traveler #131S
0.00
0.50
1.00
1.50
2.00
0 2 4 6 8 10
Time, days 1/2
% W
eigh
t Gai
n
Traveler #132RW
0.00
0.50
1.00
1.50
2.00
0 2 4 6 8 10
Time, days 1/2
% W
eigh
t Gai
n

121
Traveler #133S
0.00
0.50
1.00
1.50
2.00
0 2 4 6 8 10
Time, days 1/2
% W
eigh
t Gai
n
Traveler #134S
0.00
0.50
1.00
1.50
2.00
0 2 4 6 8 10
Time, days 1/2%
Wei
ght G
ain
Traveler #135S
0.00
0.50
1.00
1.50
2.00
0 2 4 6 8 10
Time, days 1/2
% W
eigh
t Gai
n
Traveler #136S
0.00
0.50
1.00
1.50
2.00
0 2 4 6 8 10
Time, days 1/2
% W
eigh
t Gai
n
Traveler #137
0.00
0.50
1.00
1.50
2.00
0 2 4 6 8 10 12
Time, days 1/2
% W
eigh
t Gai
n
Traveler #138
0.00
0.50
1.00
1.50
2.00
0 2 4 6 8 10 12
Time, days 1/2
% W
eigh
t Gai
n
Traveler #141
0.00
0.50
1.00
1.50
2.00
0 2 4 6 8 10 12
Time, days 1/2
% W
eigh
t Gai
n
Traveler #142
0.00
0.50
1.00
1.50
2.00
0 2 4 6 8 10 12
Time, days 1/2
% W
eigh
t Gai
n

122
Traveler #143
0.00
0.50
1.00
1.50
2.00
0 2 4 6 8 10
Time, days 1/2
% W
eigh
t Gai
n
Traveler #144
0.00
0.50
1.00
1.50
2.00
0 2 4 6 8 10
Time, days 1/2
% W
eigh
t Gai
n
Traveler #145
0.00
0.50
1.00
1.50
2.00
0 2 4 6 8 10
Time, days 1/2
% W
eigh
t Gai
n
Traveler #146
0.00
0.50
1.00
1.50
2.00
0 2 4 6 8 10
Time, days 1/2
% W
eigh
t Gai
n
Traveler #147
0.00
0.50
1.00
1.50
2.00
0 2 4 6 8 10
Time, days 1/2
% W
eigh
t Gai
n
Traveler #148
0.00
0.50
1.00
1.50
2.00
0 2 4 6 8 10
Time, days 1/2
% W
eigh
t Gai
n
Traveler #149
0.00
0.50
1.00
1.50
2.00
0 2 4 6 8 10
Time, days 1/2
% W
eigh
t Gai
n
Traveler #150
0.00
0.50
1.00
1.50
2.00
0 2 4 6 8 10
Time, days 1/2
% W
eigh
t Gai
n

123
Traveler #152M
0.00
0.50
1.00
1.50
2.00
0 2 4 6 8 10 12
Time, days 1/2
% W
eigh
t Gai
n
Traveler #154M
0.00
0.50
1.00
1.50
2.00
0 2 4 6 8 10 12
Time, days 1/2
% W
eigh
t Gai
n
Traveler #156M
0.00
0.50
1.00
1.50
2.00
0 2 4 6 8 10 12
Time, days 1/2
% W
eigh
t Gai
n
Traveler #158M
0.00
0.50
1.00
1.50
2.00
0 2 4 6 8 10 12
Time, days 1/2
% W
eigh
t Gai
n
Traveler #151S
0.00
0.50
1.00
1.50
2.00
0 2 4 6 8 10
Time, days 1/2
% W
eigh
t Gai
n
Traveler #152S
0.00
0.50
1.00
1.50
2.00
0 2 4 6 8 10
Time, days 1/2
% W
eigh
t Gai
n
Traveler #153S
0.00
0.50
1.00
1.50
2.00
0 2 4 6 8 10
Time, days 1/2
% W
eigh
t Gai
n
Traveler #154RW
0.00
0.50
1.00
1.50
2.00
0 2 4 6 8 10
Time, days 1/2
% W
eigh
t Gai
n

124
Traveler #155S
0.00
0.50
1.00
1.50
2.00
0 2 4 6 8 10
Time, days 1/2
% W
eigh
t Gai
n
Traveler #156S
0.00
0.50
1.00
1.50
2.00
0 2 4 6 8 10
Time, days 1/2
% W
eigh
t Gai
n
Traveler #157S
0.00
0.50
1.00
1.50
2.00
0 2 4 6 8 10
Time, days 1/2
% W
eigh
t Gai
n
Traveler #157S
0.00
0.50
1.00
1.50
2.00
0 2 4 6 8 10
Time, days 1/2
% W
eigh
t Gai
n
Traveler #159
0.00
0.50
1.00
1.50
2.00
0 2 4 6 8 10 12
Time, days 1/2
% W
eigh
t Gai
n
Traveler #160
0.00
0.50
1.00
1.50
2.00
0 2 4 6 8 10 12
Time, days 1/2
% W
eigh
t Gai
n
Traveler #163
0.00
0.50
1.00
1.50
2.00
0 2 4 6 8 10 12
Time, days 1/2
% W
eigh
t Gai
n
Traveler #164
0.00
0.50
1.00
1.50
2.00
0 2 4 6 8 10 12
Time, days 1/2
% W
eigh
t Gai
n

125
Traveler #165
0.00
0.50
1.00
1.50
2.00
0 2 4 6 8 10
Time, days 1/2
% W
eigh
t Gai
n
Traveler #166
0.00
0.50
1.00
1.50
2.00
0 2 4 6 8 10
Time, days 1/2
% W
eigh
t Gai
n
Traveler #167
0.00
0.50
1.00
1.50
2.00
0 2 4 6 8 10
Time, days 1/2
% W
eigh
t Gai
n
Traveler #168
0.00
0.50
1.00
1.50
2.00
0 2 4 6 8 10
Time, days 1/2
% W
eigh
t Gai
n
Traveler #169
0.00
0.50
1.00
1.50
2.00
0 2 4 6 8 10
Time, days 1/2
% W
eigh
t Gai
n
Traveler #170
0.00
0.50
1.00
1.50
2.00
0 2 4 6 8 10
Time, days 1/2
% W
eigh
t Gai
n
Traveler #171
0.00
0.50
1.00
1.50
2.00
0 2 4 6 8 10
Time, days 1/2
% W
eigh
t Gai
n
Traveler #172
0.00
0.50
1.00
1.50
2.00
0 2 4 6 8 10
Time, days 1/2
% W
eigh
t Gai
n

126
Traveler #174M
0.00
0.50
1.00
1.50
2.00
0 2 4 6 8 10 12
Time, days 1/2
% W
eigh
t Gai
n
Traveler #176M
0.00
0.50
1.00
1.50
2.00
0 2 4 6 8 10 12
Time, days 1/2
% W
eigh
t Gai
n
Traveler #178M
0.00
0.50
1.00
1.50
2.00
0 2 4 6 8 10 12
Time, days 1/2
% W
eigh
t Gai
n
Traveler #180M
0.00
0.50
1.00
1.50
2.00
0 2 4 6 8 10 12
Time, days 1/2
% W
eigh
t Gai
n
Traveler #173RW
0.00
0.50
1.00
1.50
2.00
0 2 4 6 8 10
Time, days 1/2
% W
eigh
t Gai
n
Traveler #174S
0.00
0.50
1.00
1.50
2.00
0 2 4 6 8 10
Time, days 1/2
% W
eigh
t Gai
n
Traveler #175RW
0.00
0.50
1.00
1.50
2.00
0 2 4 6 8 10
Time, days 1/2
% W
eigh
t Gai
n
Traveler #176S
0.00
0.50
1.00
1.50
2.00
0 2 4 6 8 10
Time, days 1/2
% W
eigh
t Gai
n

127
Traveler #177S
0.00
0.50
1.00
1.50
2.00
0 2 4 6 8 10
Time, days 1/2
% W
eigh
t Gai
n
Traveler #178S
0.00
0.50
1.00
1.50
2.00
0 2 4 6 8 10
Time, days 1/2%
Wei
ght G
ain
Traveler #179S
0.00
0.50
1.00
1.50
2.00
0 2 4 6 8 10
Time, days 1/2
% W
eigh
t Gai
n
Traveler #180S
0.00
0.50
1.00
1.50
2.00
0 2 4 6 8 10
Time, days 1/2
% W
eigh
t Gai
n
Traveler #181
0.00
0.50
1.00
1.50
2.00
0 2 4 6 8 10 12
Time, days 1/2
% W
eigh
t Gai
n
Traveler #182
0.00
0.50
1.00
1.50
2.00
0 2 4 6 8 10 12
Time, days 1/2
% W
eigh
t Gai
n
3
Traveler #185
0.00
0.50
1.00
1.50
2.00
0 2 4 6 8 10 12
Time, days 1/2
% W
eigh
t Gai
n
Traveler #186
0.00
0.50
1.00
1.50
2.00
0 2 4 6 8 10 12
Time, days 1/2
% W
eigh
t Gai
n

128
APPENDIX C. PHYSICAL TEST RESULTS

129
Material Properties
Material Batch Uncured Fiber PrepregResin Areal Volatile Gel Resin
Content Weight Content Time Flow IR(%) (g/m2) (%) (minutes) (%)
P1 P2 P3 P4 P5 Onset PeakAF991102 39.0 292 0.17 9.9 24.5 scan 9.9 8.6 5.9 60.5 15.2 291 326AF991103 38.0 296 0.16 10.0 23.0 on 10.0 8.6 5.9 60.4 15.2 290 326AF991104 37.8 291 0.17 10.7 23.5 file 9.9 8.6 6.2 60.4 15.2 291 327
Grand Average 38.3 293 0.17 10.2 23.7 9.9 8.6 6.0 60.4 15.2 291 326Requirement 38 ± 3 295 ± 10 2.0 max 5 - 25 10 min TBD TBD
Material Properties
Material Batch ResinDensity(g/cc)
Dry Wet
AF991102 1.265 290 261AF991103 1.265 290 262
1.260 289 259Grand Average 1.263 290 261Requirement 1.26 ± 0.03 TBD TBD *
* FAA Recommended Hot/Wet Tg: 230°F, Based on Maximum Operation Temperature of 180°F + 50°F
Summary of Chemical and Physical Tests - Uncured
Summary of Chemical and Physical Tests - Cured
(°F)
TBD
Glass TransitionTemperature
by DMA
HPLC DSC(% Area) (°F)
Physical Chemical

130
Summary of Chemical and Physical Tests - Cured Material Properties, Batch AF991102
AutoclaveCured Cure
Batch No./ Test Laminate Fiber Resin Void Ply RunPanel ID Type Density Volume Volume Content Thickness ID
(g/cc) (%vol) (%vol) (%vol) (in.) -AF991102
A1-911-081 0° Tens 1.787 43.4 53.4 3.22 0.0106 99-708A2-911-081 0° Tens 1.811 44.2 53.6 2.23 0.0105 99-710B1-911-081 0° Tens 1.817 45.5 51.4 3.09 0.0104 99-707B2-911-081 0° Tens 1.803 45.4 50.5 4.05 0.0105 99-707A1-911-081 90° Tens 1.892 47.9 52.6 0.00 0.0105 99-708A2-911-081 90° Tens 1.822 45.9 51.1 3.02 0.0105 99-708
B1-911-081 90° Tens 1.812 45.1 51.9 3.03 0.0103 99-711
B2-911-081 90° Tens 1.830 45.4 52.8 1.85 0.0105 99-711A1-911-081 0° Comp 1.781 42.7 54.2 3.07 0.0107 99-706A2-911-081 0°Comp 1.754 41.6 54.4 4.02 0.0109 99-706B1-911-081 0°Comp 1.808 44.7 52.4 2.92 0.0107 99-707B2-911-081 0°Comp 1.845 46.6 51.5 1.94 0.0102 00-070A1-911-081 90°Comp 1.815 45.3 51.8 2.96 0.0106 99-706A2-911-081 90°Comp 1.793 43.5 53.7 2.83 0.0105 99-706B1-911-081 90°Comp 1.813 43.8 54.6 1.61 0.0106 99-709B2-911-081 90°Comp 1.806 44.7 52.3 3.07 0.0104 99-709A1-911-081 IPS 1.794 43.7 53.2 3.05 0.0104 99-710B1-911-081 IPS 1.766 43.9 50.6 5.47 0.0105 99-709A1-911-081 ILSS 1.750 41.7 53.9 4.41 0.0104 99-706B1-911-081 ILSS 1.810 44.1 53.8 2.13 0.0108 99-709
1.805 44.4 52.7 2.90 0.0105 -0.032 1.5 1.3 1.14 0.0002 -1.75 3.46 2.41 39.46 1.53 -TBD TBD TBD TBD TBD -Requirement
Standard DeviationCOV, %
Average

131
Summary of Chemical and Physical Tests - Cured Material Properties, Batch AF991103
AutoclaveCured Cure
Batch No./ Test Laminate Fiber Resin Void Ply RunPanel ID Type Density Volume Volume Content Thickness ID
(g/cc) (%vol) (%vol) (%vol) (in.) -AF991103
A1-911-082 0° Tens 1.830 46.4 50.6 2.97 0.0104 99-714A2-911-082 0° Tens 1.805 44.7 52.1 3.19 0.0103 99-714B1-911-082 0° Tens 1.837 46.9 50.2 2.94 0.0102 99-713B2-911-082 0° Tens 1.814 44.8 52.6 2.59 0.0103 99-713A1-911-082 90° Tens 1.788 43.4 53.4 3.18 0.0103 99-714A2-911-082 90° Tens 1.800 44.4 52.4 3.24 0.0104 99-714
B1-911-082 90° Tens 1.817 45.1 52.3 2.63 0.0103 99-713
B2-911-082 90° Tens 1.849 46.9 51.2 1.94 0.0102 99-713A1-911-082 0° Comp 1.805 44.0 53.6 2.41 0.0104 99-712A2-911-082 0°Comp 1.744 44.2 48.3 7.50 0.0100 99-712B1-911-082 0°Comp 1.811 45.7 50.7 3.66 0.0100 99-713B2-911-082 0°Comp 1.792 43.8 53.0 3.28 0.0102 00-070A1-911-082 90°Comp 1.805 43.8 53.9 2.28 0.0102 99-712A2-911-082 90°Comp 1.807 44.8 52.1 3.09 0.0102 99-712B1-911-082 90°Comp 1.796 43.8 53.3 2.95 0.0108 99-713B2-911-082 90°Comp 1.798 44.8 51.3 3.87 0.0105 99-713A1-911-082 IPS 1.836 46.2 51.6 2.26 0.0104 99-716B1-911-082 IPS 1.835 46.2 51.5 2.30 0.0103 99-715A1-911-082 ILSS 1.803 44.4 52.5 3.05 0.0104 99-712B1-911-082 ILSS 1.802 44.3 52.7 2.99 0.0104 99-715
1.809 44.9 52.0 3.12 0.0103 -0.023 1.1 1.3 1.14 0.0002 -1.26 2.41 2.59 36.61 1.60 -TBD TBD TBD TBD TBD -Requirement
Standard DeviationCOV, %
Average

132
Summary of Chemical and Physical Tests - Cured Material Properties, Batch AF991104
AutoclaveCured Cure
Batch No./ Test Laminate Fiber Resin Void Ply RunPanel ID Type Density Volume Volume Content Thickness ID
(g/cc) (%vol) (%vol) (%vol) (in.) -AF991104
A1-911-083 0° Tens 1.788 44.2 51.8 3.99 0.0102 99-716A2-911-083 0° Tens 1.804 45.3 50.9 3.85 0.0103 99-716B1-911-083 0° Tens 1.826 45.8 51.5 2.67 0.0103 99-717B2-911-083 0° Tens 1.832 46.7 50.3 3.03 0.0102 99-717A1-911-083 90° Tens 1.789 44.4 51.5 4.11 0.0103 99-718A2-911-083 90° Tens 1.811 45.9 50.1 4.01 0.0103 99-718
B1-911-083 90° Tens 1.809 44.6 52.7 2.73 0.0104 99-717
B2-911-083 90° Tens 1.864 48.2 49.8 2.04 0.0102 99-717A1-911-083 0° Comp 1.824 45.1 52.8 2.08 0.0106 00-071A2-911-083 0°Comp 1.778 44.5 50.3 5.15 0.0106 99-716B1-911-083 0°Comp 1.822 47.2 48.5 4.39 0.0103 00-070B2-911-083 0°Comp 1.796 44.7 51.4 3.87 0.0103 99-717A1-911-083 90°Comp 1.808 45.2 51.3 3.46 0.0104 99-718A2-911-083 90°Comp 1.794 45.3 50.0 4.67 0.0104 99-718B1-911-083 90°Comp 1.818 47.2 48.1 4.72 0.0106 99-719B2-911-083 90°Comp 1.797 44.9 51.1 4.04 0.0104 99-719A1-911-083 IPS 1.815 45.3 51.7 3.01 0.0102 99-716B1-911-083 IPS 1.815 45.3 51.7 3.02 0.0102 99-719A1-911-083 ILSS 1.723 43.6 47.9 8.52 0.0098 99-718B1-911-083 ILSS 1.764 42.9 52.5 4.56 0.0106 99-719
1.804 45.3 50.8 3.90 0.0103 -0.029 1.3 1.4 1.40 0.0002 -1.59 2.77 2.81 35.87 1.70 -TBD TBD TBD TBD TBD -Requirement
Standard DeviationCOV, %
Average

133

134

135

136

137

138

139

140

141

142

143

144

145
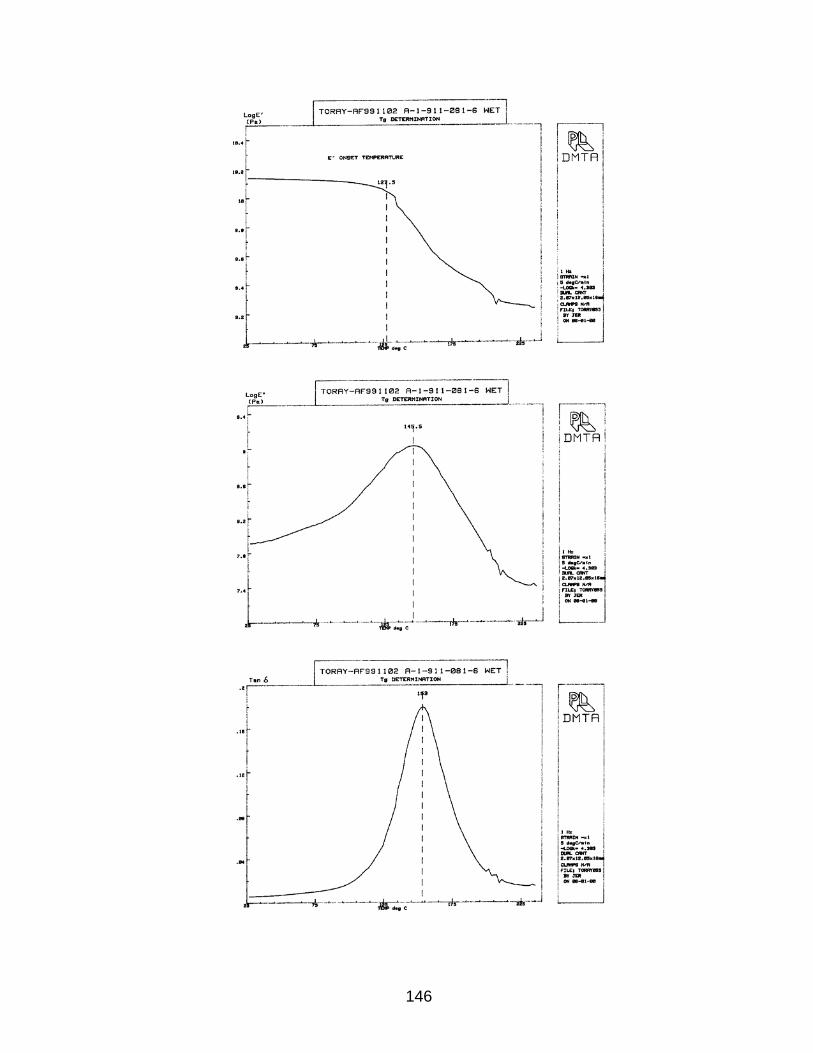
146

147

148

149

150

151

152

153
APPENDIX D. STATISTICAL ANALYSIS SUMMARY

154
COMPANY
MATERIAL PROPERTYCOMMENTSDATE
CTD RTD ETD ETW
Sample Size 6 18 18 18
No. of Batches 2 6 6 6
Mean 565.565 444.602 446.198 338.485
Std.dev 25.434 19.775 9.525 10.627
% Co. Variation 4.497 4.448 2.135 3.139
Minimum 537.978 376.114 430.300 317.680
Maximum 602.836 462.065 461.624 360.245
Kb 2.028 1.758 1.758 1.758
Ka 3.163 2.925 2.925 2.925
Equal C.V. Basis Values
B-Basis Value 526.564 418.020 419.520 318.247
A-Basis Value 504.721 400.373 401.810 304.812
Anderson Darling Test for Normality
O.S.L 0.645 0.001 0.075 0.486
Normality is Acceptable Questionable Acceptable Acceptable
O.S.L for pooled data is 0.0323 Normality is Acceptable
Check for Normality based on Normal Scores
r2 0.980 0.829 0.968 0.985
Normality is Acceptable Questionable Acceptable Acceptable
r2 for pooled data is 0.9376 Normality is Acceptable
k-sample Anderson Darling Test ( ADK < ADC for batches from same population)
ADK 1.018 1.387 2.134 1.178
ADC 2.105 1.501 1.501 1.501
SAME POPULATION YES YES NO YES N/A
Equality of Coeff. of Variations: Pooled Data ( FCALCULATED < FCRITICAL for equality)
α LEVEL 0.05 0.025 0.01F CALCULATED 1.10F CRITICAL 2.929 3.524 4.323
COMMENTS
December 26, 2002
STATISTIC
0° Measured Tension Strength
TCA 7781/#2510 Glass Fabric
Toray
TEST CONDITION
DATA SUMMARY

155
COMPANY
MATERIAL PROPERTYCOMMENTSDATE
CTD RTD ETD ETW
Sample Size 6 18 18 18
No. of Batches 2 6 6 6
Mean 558.844 442.262 447.602 339.902
Std.dev 21.147 15.084 4.521 10.998
% Co. Variation 3.784 3.411 1.010 3.236
Minimum 526.486 386.964 438.271 321.560
Maximum 579.588 459.222 452.261 356.601
Kb 2.028 1.758 1.758 1.758
Ka 3.163 2.925 2.925 2.925
Equal C.V. Basis Values
B-Basis Value 527.044 420.442 425.520 323.133
A-Basis Value 509.235 405.958 410.860 312.001
Anderson Darling Test for Normality
O.S.L 0.569 0.000 0.005 0.565
Normality is Acceptable Questionable Questionable Acceptable
O.S.L for pooled data is 0.0009 Normality is Questionable
Check for Normality based on Normal Scores
r2 0.969 0.765 0.933 0.989
Normality is Acceptable Questionable Acceptable Acceptable
r2 for pooled data is 0.9305 Normality is Acceptable
k-sample Anderson Darling Test ( ADK < ADC for batches from same population)
ADK 0.470 0.794 0.658 1.292
ADC 2.105 1.501 1.501 1.501
SAME POPULATION YES YES YES YES N/A
Equality of Coeff. of Variations: Pooled Data ( FCALCULATED < FCRITICAL for equality)
α LEVEL 0.05 0.025 0.01F CALCULATED 3.47F CRITICAL 2.929 3.524 4.323
COMMENTS* Equality of C.V.s not satisfied at a significance level of 0.05
Pooling of data across test environments not permissible
Use Mil-Hdbk-17e method for generating allowables
COV of ETD test samples is modifed to 4.00% using the method prescribed
in Appendix E.
DATA SUMMARY
December 26, 2002
STATISTIC
0° Normalized Tension Strength
TCA 7781/#2510 Glass Fabric
Toray
TEST CONDITION

156
COMPANY
MATERIAL PROPERTYCOMMENTSDATE
CTD RTD ETD ETW
Sample Size 6 18 18 18
No. of Batches 2 6 6 6
Mean 558.844 442.262 447.602 339.902
Std.dev 21.147 15.084 17.904 10.998
% Co. Variation 3.784 3.411 4.000 3.236
Minimum 526.486 386.964 410.652 321.560
Maximum 579.588 459.222 466.049 356.601
Kb 2.028 1.758 1.758 1.758
Ka 3.163 2.925 2.925 2.925
Equal C.V. Basis Values
B-Basis Value 519.279 415.114 420.127 319.038
A-Basis Value 497.120 397.092 401.888 305.187
Anderson Darling Test for Normality
O.S.L 0.569 0.000 0.005 0.565
Normality is Acceptable Questionable Questionable Acceptable
O.S.L for pooled data is 0.0044 Normality is Questionable
Check for Normality based on Normal Scores
r2 0.969 0.765 0.933 0.989
Normality is Acceptable Questionable Acceptable Acceptable
r2 for pooled data is 0.9558 Normality is Acceptable
k-sample Anderson Darling Test ( ADK < ADC for batches from same population)
ADK 0.470 0.794 0.658 1.292
ADC 2.105 1.501 1.501 1.501
SAME POPULATION YES YES YES YES N/A
Equality of Coeff. of Variations: Pooled Data ( FCALCULATED < FCRITICAL for equality)
α LEVEL 0.05 0.025 0.01F CALCULATED 0.95F CRITICAL 2.929 3.524 4.323
COMMENTSCOV of ETD test samples is modifed to 4.00% using the method prescribed
in Appendix E.
December 26, 2002
STATISTIC
0° Normalized Tension Strength
TCA 7781/#2510 Glass Fabric
Toray
TEST CONDITION
DATA SUMMARY

157
COMPANY
MATERIAL PROPERTYCOMMENTSDATE
CTD RTD ETD ETW
Sample Size 6 18 18 18
No. of Batches 2 6 6 6
Mean 431.885 350.473 376.561 292.180
Std.dev 24.317 14.143 6.073 9.674
% Co. Variation 5.630 4.035 1.613 3.311
Minimum 397.211 318.561 365.278 275.861
Maximum 460.640 380.138 389.561 302.754
Kb 2.028 1.758 1.758 1.758
Ka 3.163 2.925 2.925 2.925
Equal C.V. Basis Values
B-Basis Value 402.465 329.773 354.320 274.923
A-Basis Value 385.988 316.032 339.556 263.467
Anderson Darling Test for Normality
O.S.L 0.623 0.504 0.063 0.003
Normality is Acceptable Acceptable Acceptable Questionable
O.S.L for pooled data is 0.2272 Normality is Acceptable
Check for Normality based on Normal Scores
r2 0.978 0.978 0.963 0.935
Normality is Acceptable Acceptable Acceptable Acceptable
r2 for pooled data is 0.9876 Normality is Acceptable
k-sample Anderson Darling Test ( ADK < ADC for batches from same population)
ADK 1.018 0.806 0.996 1.654
ADC 2.105 1.501 1.501 1.501
SAME POPULATION YES YES YES NO N/A
Equality of Coeff. of Variations: Pooled Data ( FCALCULATED < FCRITICAL for equality)
α LEVEL 0.05 0.025 0.01F CALCULATED 2.98F CRITICAL 2.929 3.524 4.323
COMMENTS* Equality of C.V.s not satisfied at a significance level of 0.05
Pooling of data across test environments not permissible
Use Mil-Hdbk-17e method for generating allowables
COV of ETD test samples is modified to 4.00% using the method prescribed
in Append E.
DATA SUMMARY
December 26, 2002
STATISTIC
90° Measured Tension Strength
TCA 7781/#2510 Glass Fabric
Toray
TEST CONDITION

158
COMPANY
MATERIAL PROPERTYCOMMENTSDATE
CTD RTD ETD ETW
Sample Size 6 18 18 18
No. of Batches 2 6 6 6
Mean 431.885 350.473 376.561 292.180
Std.dev 24.317 14.143 15.062 9.674
% Co. Variation 5.630 4.035 4.000 3.311
Minimum 397.211 318.561 348.577 275.861
Maximum 460.640 380.138 408.806 302.754
Kb 2.028 1.758 1.758 1.758
Ka 3.163 2.925 2.925 2.925
Equal C.V. Basis Values
B-Basis Value 397.803 326.493 350.796 272.188
A-Basis Value 378.714 310.574 333.692 258.917
Anderson Darling Test for Normality
O.S.L 0.623 0.504 0.063 0.003
Normality is Acceptable Acceptable Acceptable Questionable
O.S.L for pooled data is 0.3187 Normality is Acceptable
Check for Normality based on Normal Scores
r2 0.978 0.978 0.963 0.935
Normality is Acceptable Acceptable Acceptable Acceptable
r2 for pooled data is 0.9930 Normality is Acceptable
k-sample Anderson Darling Test ( ADK < ADC for batches from same population)
ADK 1.018 0.806 0.996 1.654
ADC 2.105 1.501 1.501 1.501
SAME POPULATION YES YES YES NO N/A
Equality of Coeff. of Variations: Pooled Data ( FCALCULATED < FCRITICAL for equality)
α LEVEL 0.05 0.025 0.01F CALCULATED 0.64F CRITICAL 2.929 3.524 4.323
COMMENTSCOV of ETD test samples is modified to 4.00% using the method prescribed
in Append E.
December 26, 2002
STATISTIC
90° Measured Tension Strength
TCA 7781/#2510 Glass Fabric
Toray
TEST CONDITION
DATA SUMMARY

159
COMPANY
MATERIAL PROPERTYCOMMENTSDATE
CTD RTD ETD ETW
Sample Size 6 18 18 18
No. of Batches 2 6 6 6
Mean 432.841 347.390 375.953 292.046
Std.dev 22.858 15.234 6.128 8.243
% Co. Variation 5.281 4.385 1.630 2.822
Minimum 402.176 317.734 360.291 274.655
Maximum 458.868 373.961 387.200 305.432
Kb 2.028 1.758 1.758 1.758
Ka 3.163 2.925 2.925 2.925
Equal C.V. Basis Values
B-Basis Value 403.779 327.167 354.067 275.045
A-Basis Value 387.502 313.743 339.539 263.759
Anderson Darling Test for Normality
O.S.L 0.372 0.081 0.407 0.165
Normality is Acceptable Acceptable Acceptable Acceptable
O.S.L for pooled data is 0.3050 Normality is Acceptable
Check for Normality based on Normal Scores
r2 0.952 0.967 0.968 0.973
Normality is Acceptable Acceptable Acceptable Acceptable
r2 for pooled data is 0.9899 Normality is Acceptable
k-sample Anderson Darling Test ( ADK < ADC for batches from same population)
ADK 1.018 0.597 0.881 1.755
ADC 2.105 1.501 1.501 1.501
SAME POPULATION YES YES YES NO N/A
Equality of Coeff. of Variations: Pooled Data ( FCALCULATED < FCRITICAL for equality)
α LEVEL 0.05 0.025 0.01F CALCULATED 3.55F CRITICAL 2.929 3.524 4.323
COMMENTS* Equality of C.V.s not satisfied at a significance level of 0.05
Pooling of data across test environments not permissible
Use Mil-Hdbk-17e method for generating allowables
COV of ETD test samples is modified to 4.00% using the method prescribed
in Appendix E.
DATA SUMMARY
December 26, 2002
STATISTIC
90° Normalized Tension Strength
TCA 7781/#2510 Glass Fabric
Toray
TEST CONDITION

160
COMPANY
MATERIAL PROPERTYCOMMENTSDATE
CTD RTD ETD ETW
Sample Size 6 18 18 18
No. of Batches 2 6 6 6
Mean 432.841 347.390 375.953 292.046
Std.dev 22.858 15.234 15.038 8.243
% Co. Variation 5.281 4.385 4.000 2.822
Minimum 402.176 317.734 337.516 274.655
Maximum 458.868 373.961 403.554 305.432
Kb 2.028 1.758 1.758 1.758
Ka 3.163 2.925 2.925 2.925
Equal C.V. Basis Values
B-Basis Value 399.066 323.888 350.518 272.288
A-Basis Value 380.150 308.286 333.634 259.172
Anderson Darling Test for Normality
O.S.L 0.372 0.081 0.407 0.165
Normality is Acceptable Acceptable Acceptable Acceptable
O.S.L for pooled data is 0.6595 Normality is Acceptable
Check for Normality based on Normal Scores
r2 0.952 0.967 0.968 0.973
Normality is Acceptable Acceptable Acceptable Acceptable
r2 for pooled data is 0.9937 Normality is Acceptable
k-sample Anderson Darling Test ( ADK < ADC for batches from same population)
ADK 1.018 0.597 0.881 1.755
ADC 2.105 1.501 1.501 1.501
SAME POPULATION YES YES YES NO N/A
Equality of Coeff. of Variations: Pooled Data ( FCALCULATED < FCRITICAL for equality)
α LEVEL 0.05 0.025 0.01F CALCULATED 1.03F CRITICAL 2.929 3.524 4.323
COMMENTSCOV of ETD test samples is modified to 4.00% using the method prescribed
in Appendix E.
December 26, 2002
STATISTIC
90° Normalized Tension Strength
TCA 7781/#2510 Glass Fabric
Toray
TEST CONDITION
DATA SUMMARY

161
COMPANY
MATERIAL PROPERTYCOMMENTSDATE
CTD RTD ETD ETW
Sample Size 6 18 18 18
No. of Batches 2 6 6 6
Mean 623.720 527.395 434.649 348.230
Std.dev 28.419 32.631 20.495 20.286
% Co. Variation 4.556 6.187 4.715 5.825
Minimum 596.915 442.756 397.809 317.302
Maximum 677.622 581.004 469.685 380.488
Kb 2.028 1.758 1.758 1.758
Ka 3.163 2.925 2.925 2.925
Equal C.V. Basis Values
B-Basis Value 555.646 477.489 393.519 315.277
A-Basis Value 517.520 444.359 366.215 293.402
Anderson Darling Test for Normality
O.S.L 0.201 0.366 0.507 0.418
Normality is Acceptable Acceptable Acceptable Acceptable
O.S.L for pooled data is 0.7082 Normality is Acceptable
Check for Normality based on Normal Scores
r2 0.897 0.965 0.990 0.985
Normality is Questionable Acceptable Acceptable Acceptable
r2 for pooled data is 0.9916 Normality is Acceptable
k-sample Anderson Darling Test ( ADK < ADC for batches from same population)
ADK 1.018 1.742 1.815 2.307
ADC 2.105 1.501 1.501 1.501
SAME POPULATION YES NO NO NO N/A
Equality of Coeff. of Variations: Pooled Data ( FCALCULATED < FCRITICAL for equality)
α LEVEL 0.05 0.025 0.01F CALCULATED 0.62F CRITICAL 2.929 3.524 4.323
COMMENTS
December 26, 2002
STATISTIC
0° Measured Compression Strength
TCA 7781/#2510 Glass Fabric
Toray
TEST CONDITION
DATA SUMMARY

162
COMPANY
MATERIAL PROPERTYCOMMENTSDATE
CTD RTD ETD ETW
Sample Size 6 18 18 18
No. of Batches 2 6 6 6
Mean 609.207 525.550 434.696 351.044
Std.dev 37.152 28.513 15.183 24.037
% Co. Variation 6.098 5.425 3.493 6.847
Minimum 577.474 463.652 395.320 310.184
Maximum 677.079 574.622 462.346 386.585
Kb 2.028 1.758 1.758 1.758
Ka 3.163 2.925 2.925 2.925
Equal C.V. Basis Values
B-Basis Value 543.082 476.090 393.786 318.008
A-Basis Value 506.047 443.257 366.629 296.076
Anderson Darling Test for Normality
O.S.L 0.181 0.769 0.229 0.338
Normality is Acceptable Acceptable Acceptable Acceptable
O.S.L for pooled data is 0.2619 Normality is Acceptable
Check for Normality based on Normal Scores
r2 0.900 0.990 0.960 0.981
Normality is Acceptable Acceptable Acceptable Acceptable
r2 for pooled data is 0.9904 Normality is Acceptable
k-sample Anderson Darling Test ( ADK < ADC for batches from same population)
ADK 2.484 1.583 1.286 2.555
ADC 2.105 1.501 1.501 1.501
SAME POPULATION NO NO YES NO N/A
Equality of Coeff. of Variations: Pooled Data ( FCALCULATED < FCRITICAL for equality)
α LEVEL 0.05 0.025 0.01F CALCULATED 1.95F CRITICAL 2.929 3.524 4.323
COMMENTS
December 26, 2002
STATISTIC
0° Normalized Compression Strength
TCA 7781/#2510 Glass Fabric
Toray
TEST CONDITION
DATA SUMMARY

163
COMPANY
MATERIAL PROPERTYCOMMENTSDATE
CTD RTD ETD ETW
Sample Size 6 18 18 21
No. of Batches 2 6 6 6
Mean 544.558 451.164 369.499 293.520
Std.dev 6.350 21.185 18.893 15.361
% Co. Variation 1.166 4.696 5.113 5.233
Minimum 535.783 403.370 335.060 256.035
Maximum 552.638 478.637 402.686 316.402
Kb 2.024 1.754 1.754 1.728
Ka 3.155 2.915 2.915 2.894
Equal C.V. Basis Values
B-Basis Value 492.680 413.922 338.998 269.651
A-Basis Value 463.681 389.251 318.793 253.538
Anderson Darling Test for Normality
O.S.L 0.786 0.221 0.374 0.132
Normality is Acceptable Acceptable Acceptable Acceptable
O.S.L for pooled data is 0.0273 Normality is Acceptable
Check for Normality based on Normal Scores
r2 0.996 0.972 0.983 0.969
Normality is Acceptable Acceptable Acceptable Acceptable
r2 for pooled data is 0.9827 Normality is Acceptable
k-sample Anderson Darling Test ( ADK < ADC for batches from same population)
ADK 0.470 1.069 1.688 1.601
ADC 2.105 1.501 1.501 1.521
SAME POPULATION YES YES NO NO N/A
Equality of Coeff. of Variations: Pooled Data ( FCALCULATED < FCRITICAL for equality)
α LEVEL 0.05 0.025 0.01F CALCULATED 1.88F CRITICAL 2.920 3.511 4.302
COMMENTS
December 26, 2002
STATISTIC
90° Measured Compression Strength
TCA 7781/#2510 Glass Fabric
Toray
TEST CONDITION
DATA SUMMARY

164
COMPANY
MATERIAL PROPERTYCOMMENTSDATE
CTD RTD ETD ETW
Sample Size 6 18 18 21
No. of Batches 2 6 6 6
Mean 543.247 451.175 369.477 296.911
Std.dev 7.214 19.584 16.914 15.257
% Co. Variation 1.328 4.341 4.578 5.139
Minimum 531.061 403.693 335.329 264.651
Maximum 552.432 475.012 394.555 318.974
Kb 2.024 1.754 1.754 1.728
Ka 3.155 2.915 2.915 2.894
Equal C.V. Basis Values
B-Basis Value 494.608 416.173 340.814 274.219
A-Basis Value 467.420 392.986 321.825 258.900
Anderson Darling Test for Normality
O.S.L 0.630 0.211 0.034 0.325
Normality is Acceptable Acceptable Acceptable Acceptable
O.S.L for pooled data is 0.0150 Normality is Acceptable
Check for Normality based on Normal Scores
r2 0.965 0.965 0.956 0.980
Normality is Acceptable Acceptable Acceptable Acceptable
r2 for pooled data is 0.9790 Normality is Acceptable
k-sample Anderson Darling Test ( ADK < ADC for batches from same population)
ADK 1.018 0.907 1.361 1.941
ADC 2.105 1.501 1.501 1.521
SAME POPULATION YES YES YES NO N/A
Equality of Coeff. of Variations: Pooled Data ( FCALCULATED < FCRITICAL for equality)
α LEVEL 0.05 0.025 0.01F CALCULATED 2.14F CRITICAL 2.920 3.511 4.302
COMMENTS
December 26, 2002
STATISTIC
90° Normalized Compression Strength
TCA 7781/#2510 Glass Fabric
Toray
TEST CONDITION
DATA SUMMARY

165
COMPANY
MATERIAL PROPERTYCOMMENTSDATE
CTD RTD ETD ETW
Sample Size 6 18 18 18
No. of Batches 2 6 6 6
Mean 163.673 127.182 105.820 80.315
Std.dev 6.256 2.650 2.246 0.805
% Co. Variation 3.822 2.084 2.122 1.002
Minimum 156.996 122.777 101.845 79.215
Maximum 171.414 132.629 108.587 81.726
Kb 2.028 1.758 1.758 1.758
Ka 3.163 2.925 2.925 2.925
Equal C.V. Basis Values
B-Basis Value 156.973 122.668 102.064 77.464
A-Basis Value 153.220 119.671 99.570 75.572
Anderson Darling Test for Normality
O.S.L 0.369 0.423 0.135 0.164
Normality is Acceptable Acceptable Acceptable Acceptable
O.S.L for pooled data is 0.5180 Normality is Acceptable
Check for Normality based on Normal Scores
r2 0.952 0.986 0.972 0.975
Normality is Acceptable Acceptable Acceptable Acceptable
r2 for pooled data is 0.9939 Normality is Acceptable
k-sample Anderson Darling Test ( ADK < ADC for batches from same population)
ADK 1.018 1.163 1.184 0.977
ADC 2.105 1.501 1.501 1.501
SAME POPULATION YES YES YES YES N/A
Equality of Coeff. of Variations: Pooled Data ( FCALCULATED < FCRITICAL for equality)
α LEVEL 0.05 0.025 0.01F CALCULATED 6.11F CRITICAL 2.929 3.524 4.323
COMMENTS* Equality of C.V.s not satisfied at a significance level of 0.05
Pooling of data across test environments not permissible
Use Mil-Hdbk-17e method for generating allowables
COVs of RTD, ETD, and ETW test samples will be modified using the method
prescribed in Appendix E.
December 26, 2002
STATISTIC
In-Plane Shear
TCA 7781/#2510 Glass Fabric
Toray
TEST CONDITION
DATA SUMMARY

166
COMPANY
MATERIAL PROPERTYCOMMENTSDATE
CTD RTD ETD ETW
Sample Size 6 18 18 18
No. of Batches 2 6 6 6
Mean 163.673 127.182 105.820 80.315
Std.dev 6.256 5.087 4.233 3.213
% Co. Variation 3.822 4.000 4.000 4.000
Minimum 156.996 118.726 98.328 75.924
Maximum 171.414 137.638 111.035 85.947
Kb 2.028 1.758 1.758 1.758
Ka 3.163 2.925 2.925 2.925
Equal C.V. Basis Values
B-Basis Value 150.791 118.503 98.598 74.834
A-Basis Value 143.575 112.741 93.805 71.196
Anderson Darling Test for Normality
O.S.L 0.369 0.423 0.135 0.164
Normality is Acceptable Acceptable Acceptable Acceptable
O.S.L for pooled data is 0.0159 Normality is Acceptable
Check for Normality based on Normal Scores
r2 0.952 0.986 0.972 0.975
Normality is Acceptable Acceptable Acceptable Acceptable
r2 for pooled data is 0.9855 Normality is Acceptable
k-sample Anderson Darling Test ( ADK < ADC for batches from same population)
ADK 1.018 1.163 1.184 0.977
ADC 2.105 1.501 1.501 1.501
SAME POPULATION YES YES YES YES N/A
Equality of Coeff. of Variations: Pooled Data ( FCALCULATED < FCRITICAL for equality)
α LEVEL 0.05 0.025 0.01F CALCULATED 0.06F CRITICAL 2.929 3.524 4.323
COMMENTS COVs of RTD, ETD, and ETW test samples are modified using the method
prescribed in Appendix E.
DATA SUMMARY
December 26, 2002
STATISTIC
In-Plane Shear
TCA 7781/#2510 Glass Fabric
Toray
TEST CONDITION
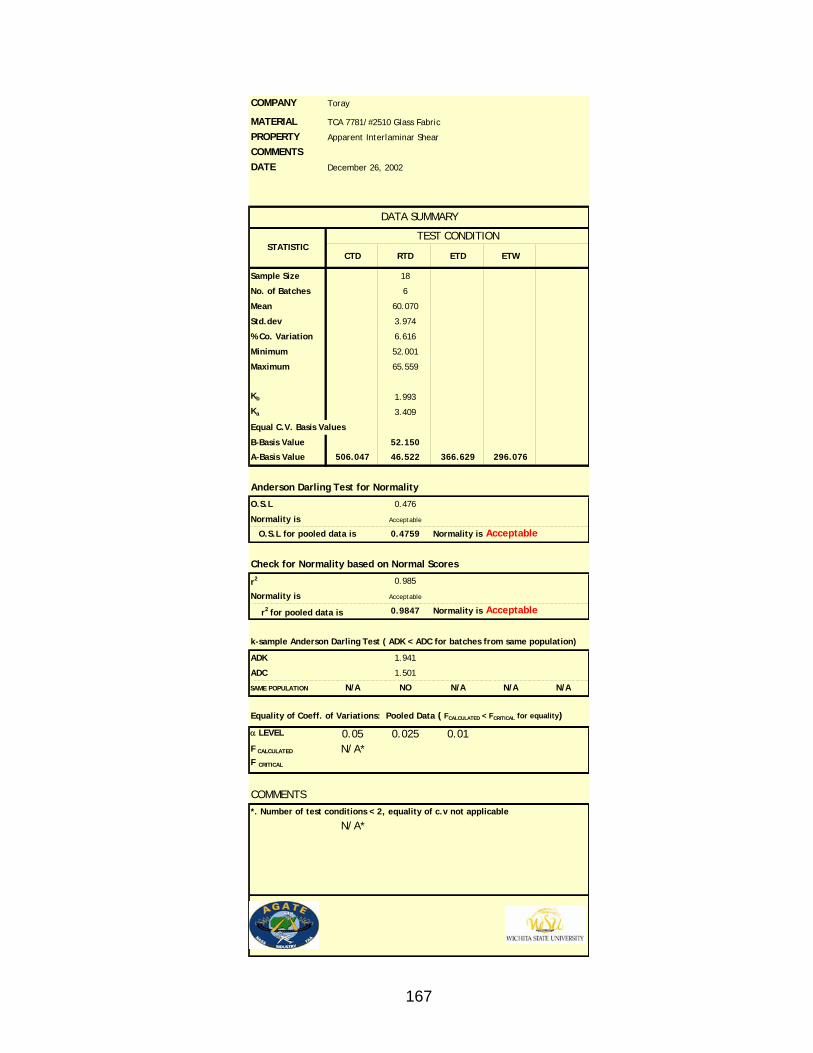
167
COMPANY
MATERIAL PROPERTYCOMMENTSDATE
CTD RTD ETD ETW
Sample Size 18
No. of Batches 6
Mean 60.070
Std.dev 3.974
% Co. Variation 6.616
Minimum 52.001
Maximum 65.559
Kb 1.993
Ka 3.409
Equal C.V. Basis Values
B-Basis Value 52.150
A-Basis Value 506.047 46.522 366.629 296.076
Anderson Darling Test for Normality
O.S.L 0.476
Normality is Acceptable
O.S.L for pooled data is 0.4759 Normality is Acceptable
Check for Normality based on Normal Scores
r2 0.985
Normality is Acceptable
r2 for pooled data is 0.9847 Normality is Acceptable
k-sample Anderson Darling Test ( ADK < ADC for batches from same population)
ADK 1.941
ADC 1.501
SAME POPULATION N/A NO N/A N/A N/A
Equality of Coeff. of Variations: Pooled Data ( FCALCULATED < FCRITICAL for equality)
α LEVEL 0.05 0.025 0.01F CALCULATED N/A*F CRITICAL
COMMENTS*. Number of test conditions < 2, equality of c.v not applicable
N/A*
December 26, 2002
STATISTIC
Apparent Interlaminar Shear
TCA 7781/#2510 Glass Fabric
Toray
TEST CONDITION
DATA SUMMARY

168
APPENDIX E. METHOD FOR TRANSFORMING VARIANCES OF TEST SAMPLES (SUPPLEMENT TO DOT/FAA/AR-47/00)

169
The following Appendix describes a procedure to supplement the process described in DOT/FAA/AR-47/00 for the case in which the variances are found to be unequal per section 5.3.1.3 of that document. A supplemental is given below which provides guidance in the situation of unequal variances and describes procedures to obtain a conservative design allowable. Note that these procedures must be combined with engineering judgment and that the failure modes must remain the same across environments. The follow excerpt is taken from DOT/FAA/AR-47/00, section 5.3.1.3 and is used as the basis for this procedure:
In general, a coefficient of variation between 4% and 10% is typical of composite materials. Experiences with large data sets have shown that this range is representative of most composite material systems. Lower coefficients of variation may be caused by the specimen fabrication and testing by a single laboratory while higher coefficients may point to lack of material and processing control. In cases where the coefficients of variation of the pooled data set are higher or lower than this range, the reason for the higher or lower coefficient of variation should be investigated before determining design allowable values from the pooled data set. For the coefficient of variation lower than 4%, an assigned value of 4% may be considered as an alternative engineering solution.
Using this philosophy, the data in this report, which demonstrates unequal variances per section 5.3.1.3 of DOT/FAA/AR-47/00 will be modified by the supplemental procedure described in this appendix with the revised presented below. The coefficient of variation to be used in this case will be 4% as suggested by DOT/FAA/AR-47/00.

170
Check Equality of Variance persection 5.3.1.3
VarianceEqual ?NO
YESUsing "engineering judgement",assess the degree of inequality using
α = 0.05, 0.025 and 0.01
QUESTIONABLE
ACCEPTABLE
Identify dataset problem looking atCoefficients of Variations (CV)
LOW CV
HIGH CV
analyze "problem" dataset usingprocedure per supplemental section
5.3.1.4 - substitute with modifieddataset
Proceed with analysis as presented insection 5.3.1
Use A and B basis allowables asgenerated
Figure E.1. Procedures to obtain design allowables in the case of variance inequality

171
A simple procedure for modifying the variance of a test sample to any desired value is presented. This procedure is useful in the case in which an environmental pooled dataset does not pass the equality of variance test per section 5.3.1.3 of DOT/FAA/AR-47/00. Consider a test sample ix of n specimens with an average value of x . Let the variance of this sample be CV which is given by
( )
11
2
−
−=
∑=
n
xxCV
n
ii
eq. 1
Let the desired variance of the sample be *CV . Consider a transformation of the form
( )∆+= iii xxx α* eq. 2
where *
ix is the transformed data, ∆ is a constant and )( ixα is a weighting function. Let the weighting function be
)()( xxx ii −=α eq. 3
The new variance for the transformed data is then given by
( )1
1
2**
*
−
−=
∑=
n
xxCV
n
ii
eq. 4
where *x is the average value of the transformed sample. Substituting equations (2) and (3) into equation (4) we obtain
( ){ }[ ]1
1
2*
*
−
−∆−+=
∑=
n
xxxxCV
n
iii
eq. 5
If we further let xx =* , equation (5) reduces to
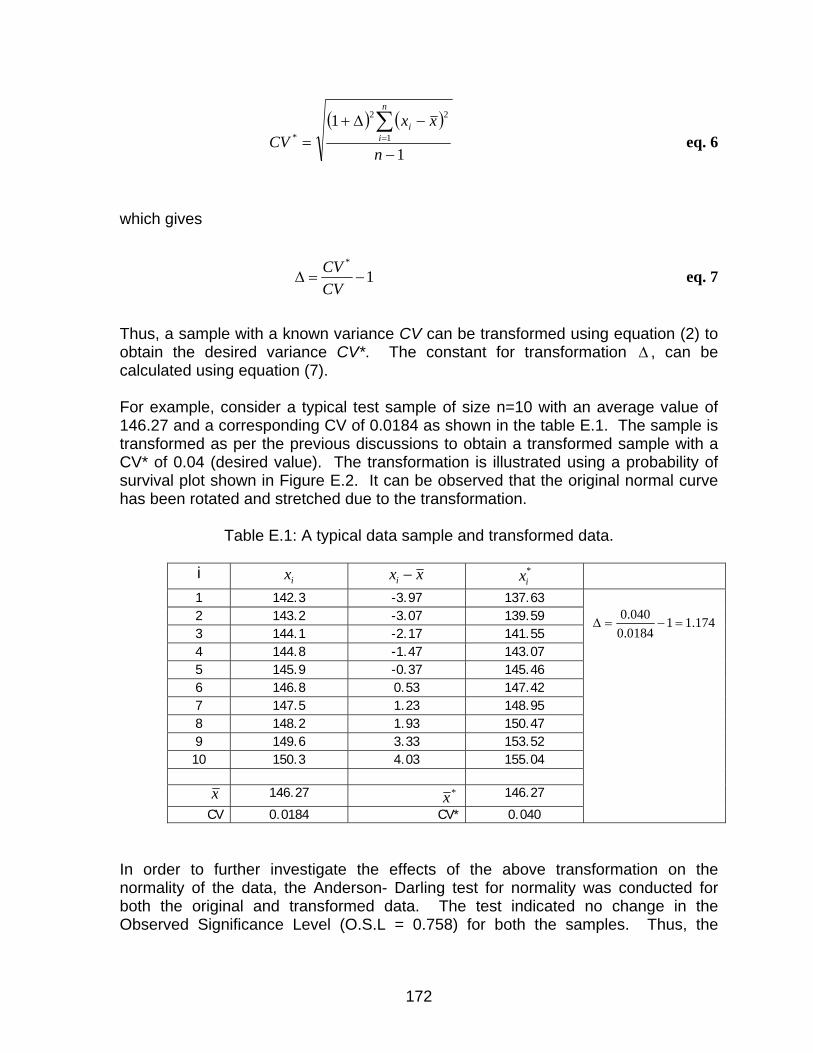
172
( ) ( )
1
11
22
*
−
−∆+=
∑=
n
xxCV
n
ii
eq. 6
which gives
1*
−=∆CVCV eq. 7
Thus, a sample with a known variance CV can be transformed using equation (2) to obtain the desired variance CV*. The constant for transformation ∆ , can be calculated using equation (7). For example, consider a typical test sample of size n=10 with an average value of 146.27 and a corresponding CV of 0.0184 as shown in the table E.1. The sample is transformed as per the previous discussions to obtain a transformed sample with a CV* of 0.04 (desired value). The transformation is illustrated using a probability of survival plot shown in Figure E.2. It can be observed that the original normal curve has been rotated and stretched due to the transformation.
Table E.1: A typical data sample and transformed data.
i ix xxi − *ix
1 142.3 -3.97 137.63 2 143.2 -3.07 139.59 3 144.1 -2.17 141.55 4 144.8 -1.47 143.07 5 145.9 -0.37 145.46 6 146.8 0.53 147.42 7 147.5 1.23 148.95 8 148.2 1.93 150.47 9 149.6 3.33 153.52 10 150.3 4.03 155.04
x 146.27 *x 146.27
CV 0.0184 CV* 0.040
174.110184.0040.0
=−=∆
In order to further investigate the effects of the above transformation on the normality of the data, the Anderson- Darling test for normality was conducted for both the original and transformed data. The test indicated no change in the Observed Significance Level (O.S.L = 0.758) for both the samples. Thus, the

173
transformation not only maintains the average value of the sample but also retains the normality of the sample.
130 140 150 160PROPERTY
0
0.2
0.4
0.6
0.8
1
PRO
BAB
ILIT
Y O
F S
UR
VIV
AL
ORIGINAL DATATRANSFORMED DATA
∆− )( xxi
Figure E.2: Original and transformed data points Once this sample has been transformed to the desired coefficient of variation, it may replaced and the data analyzed per the method described in section 5.3.1 of DOT/FAA/AR-47/00. It should be noted that this “replacement” is only for the calculation of basis values and the original data should be retained for all follow-on testing concerning material equivalence and acceptance.

174
APPENDIX F. RAW TESTING SUMMARIES [Raw test sheets report data in US units only. Please refer to Section 3 for data in SI units]

175
0° (Warp) Tension Properties, -65°F (Dry)
Material Type: FGF7781-07I Test Operator: Bryan Mines, Emmanuel DomingoBatch Number: AF991102 Test Frame: H, I
Test Method: ASTM D3039 Test Speed: 0.05 in/minSpecimen Preconditioning: as machined Control Mode: Stroke
Test Conditions: -65°F/Dry Strain Gage: One biaxial gage (CEA-06-125UT-350)Ply Orientation: (warp)10 Fiber Volume(normalizing): 44.2%Testing Facility: Intec CPT (average): 0.0104 in.
Test Date: 2/23/2000 Fiber Volume(batch average): 44.4%
Specimen Specimen Specimen Ultimate Load @ Load @ Poisson'sNumber Thickness Width Tensile 0.1% 0.3% Ratio
Load Actual Norm. Strain Strain Actual Norm. (0.1-0.3%)(in.) (in.) (lbs.) (ksi) (ksi) (lbs.) (lbs.) (msi) (msi) strain)
A2-911-081-1-2 0.1050 0.9930 8350 80.1 80.9 383.0 1128 3.58 3.61 0.140A2-911-081-1-1 0.1048 0.9930 8120 78.0 78.6 402.5 1213 3.82 3.85 0.190B1-911-081-1-1 0.0997 0.9900 8630 87.4 83.8 354.6 1066 3.69 3.54 0.140B2-911-081-1-1 0.1006 0.9910 7870 78.9 76.4 386.0 1162 3.91 3.78 0.180A1-911-081-1-2 0.1058 0.9940 8690 82.6 84.1 - - - - -B1-911-081-1-2 0.1010 0.9930 8530 85.1 82.6 - - - - -
Average 0.1028 0.9923 8365 82.0 81.1 3.75 3.70 0.163Std. Dev. 0.0027 0.0015 319 3.69 3.07 0.145 0.145 0.026COV, % 2.59 0.15 3.81 4.50 3.78 3.86 3.91 16.2
Ultimate Tensile Tensile Modulus Failure LocationStrength (0.1-0.3% strain) &
Comments
Delam/Tension failureDelam/Tension failureDelam/Tension failureDelam/Tension failureDelam/Tension failureDelam/Tension failure

176
0° (Warp) Tension Properties, 75°F (Dry)Material Type: FGF7781-07I Test Operator: John SmithBatch Number: AF991102 Test Frame: Instron 4505
Test Method: ASTM D3039 Test Speed: 0.05 in/minSpecimen Preconditioning: as machined Control Mode: Stroke
Test Conditions: RT/Dry Strain Gage: One biaxial gage (CEA-06-125UT-350)Ply Orientation: (warp)10 Fiber Volume(normalizing): 44.2%Testing Facility: Toray Composites (America) CPT (average): 0.0104 in.
Test Date: 2/24/2000 Fiber Volume(batch average): 44.4%
Specimen Specimen Specimen Ultimate Load @ Load @ Poisson'sNumber Thickness Width Tensile 0.1% 0.3% Ratio
Load Actual Norm. Strain Strain Actual Norm. (0.1-0.3%)(in.) (in.) (lbs.) (ksi) (ksi) (lbs.) (lbs.) (msi) (msi) strain)
A1-911-081-1-3 0.1060 0.9935 6628 63.0 64.1 389.1 1098 3.37 3.43 0.144A2-911-081-1-3 0.1058 0.9907 6601 63.0 64.1 382.3 1096 3.40 3.46 0.144B1-911-081-1-3 0.1031 0.9934 6787 66.3 65.7 417.0 1134 3.50 3.47 0.141B2-911-081-1-3 0.1070 0.9933 5798 54.6 56.1 364.0 1065 3.30 3.39 0.140A1-911-081-1-4 0.1063 0.9905 6552 62.2 63.6 - - - - -B1-911-081-1-4 0.1047 0.9908 6863 66.2 66.6 - - - - -
Average 0.1055 0.9920 6538 62.5 63.4 3.39 3.44 0.142Std. Dev. 0.0014 0.0015 381 4.28 3.73 0.08 0.03 0.002COV, % 1.32 0.15 5.83 6.84 5.88 2.50 1.01 1.58
Material Type: FGF7781-07I Test Operator: John SmithBatch Number: AF991103 Test Frame: Instron 4505
Test Method: ASTM D3039 Test Speed: 0.05 in/minSpecimen Preconditioning: as machined Control Mode: Stroke
Test Conditions: RT/Dry Strain Gage: One biaxial gage (CEA-06-125UT-120)Ply Orientation: (warp)10 Fiber Volume(normalizing): 44.2%Testing Facility: Toray Composites (America) CPT (average): 0.0104 in.
Test Date: 3/21/2000 Fiber Volume(batch average): 44.9%
Specimen Specimen Specimen Ultimate Load @ Load @ Poisson'sNumber Thickness Width Tensile 0.1% 0.3% Ratio
Load Actual Norm. Strain Strain Actual Norm. (0.1-0.3%)(in.) (in.) (lbs.) (ksi) (ksi) (lbs.) (lbs.) (msi) (msi) strain)
A1-911-082-1-1 0.1046 0.9931 6586 63.4 63.8 388.3 1095 3.40 3.42 0.137A2-911-082-1-1 0.1017 0.9931 6729 66.6 65.2 383.2 1093 3.51 3.44 0.142B1-911-082-1-1 0.1022 0.9931 6804 67.0 65.9 436.1 1145 3.49 3.43 0.139B2-911-082-1-1 0.1027 0.9933 6604 64.7 63.9 372.0 1071 3.43 3.38 0.140A1-911-082-1-2 0.1054 0.9932 6733 64.3 65.2 - - - - -B1-911-082-1-2 0.1030 0.9932 6719 65.7 65.1 - - - - -
Average 0.1033 0.9932 6696 65.3 64.8 3.46 3.42 0.139Std. Dev. 0.0014 0.0001 84 1.40 0.81 0.05 0.02 0.002COV, % 1.39 0.01 1.25 2.15 1.25 1.56 0.69 1.54
Material Type: FGF7781-07I Test Operator: John SmithBatch Number: AF991104 Test Frame: Instron 4505
Test Method: ASTM D3039 Test Speed: 0.05 in/minSpecimen Preconditioning: as machined Control Mode: Stroke
Test Conditions: RT/Dry Strain Gage: One biaxial gage (CEA-06-125UT-120)Ply Orientation: (warp)10 Fiber Volume(normalizing): 44.2%Testing Facility: Toray Composites (America) CPT (average): 0.0104 in.
Test Date: 3/21/2000 Fiber Volume(batch average): 45.3%
Specimen Specimen Specimen Ultimate Load @ Load @ Poisson'sNumber Thickness Width Tensile 0.1% 0.3% Ratio
Load Actual Norm. Strain Strain Actual Norm. (0.1-0.3%)(in.) (in.) (lbs.) (ksi) (ksi) (lbs.) (lbs.) (msi) (msi) strain)
A1-911-083-1-1 0.1011 0.9931 6579 65.5 63.7 405.2 1109 3.50 3.41 0.141A2-911-083-1-1 0.0995 0.9932 6608 66.8 64.0 444.8 1154 3.59 3.43 0.135B1-911-083-1-1 0.1026 0.9929 6586 64.7 63.8 430.3 1131 3.44 3.39 0.140B2-911-083-1-1 0.1036 0.9932 6747 65.6 65.3 380.7 1088 3.44 3.43 0.136A1-911-083-1-2 0.1014 0.9933 6690 66.4 64.8 - - - - -B1-911-083-1-2 0.1027 0.9933 6598 64.7 63.9 - - - - -
Average 0.1018 0.9932 6635 65.6 64.2 3.49 3.41 0.138Std. Dev. 0.0014 0.0001 68 0.89 0.66 0.07 0.02 0.003COV, % 1.41 0.01 1.03 1.36 1.02 2.02 0.55 2.11
Failure in gage areaFailure in gage areaFailure in gage areaFailure in gage area
Comments
Failure in gage areaFailure in gage area
Ultimate Tensile Tensile Modulus Failure LocationStrength (0.1-0.3% strain) &
Failure in gage areaFailure in gage areaFailure in gage areaFailure in gage area
Comments
Failure in gage areaFailure in gage area
Ultimate Tensile Tensile Modulus Failure LocationStrength (0.1-0.3% strain) &
Failure in gage areaFailure in gage areaFailure in gage areaFailure in gage area
Comments
Failure in gage areaFailure in gage area
Ultimate Tensile Tensile Modulus Failure LocationStrength (0.1-0.3% strain) &

177
0° (Warp) Tension Properties, 180°F (Dry)Material Type: FGF7781-07I Test Operator: John SmithBatch Number: AF991102 Test Frame: Instron 4505
Test Method: ASTM D3039 Test Speed: 0.05 in/minSpecimen Preconditioning: as machined Control Mode: Stroke
Test Conditions: 180°F/Dry Strain Gage: One biaxial gage (CEA-06-125UT-120)Ply Orientation: (warp)10 Fiber Volume(normalizing): 44.2%Testing Facility: Toray Composites (America) CPT (average): 0.0104 in.
Test Date: 3/3/2000 Fiber Volume(batch average): 44.4%
Specimen Specimen Specimen Ultimate Load @ Load @ Poisson'sNumber Thickness Width Tensile 0.1% 0.3% Ratio
Load Actual Norm. Strain Strain Actual Norm. (0.1-0.3%)(in.) (in.) (lbs.) (ksi) (ksi) (lbs.) (lbs.) (msi) (msi) strain)
A1-911-081-1-5 0.1062 0.9935 6643 63.0 64.3 369.6 1049 3.22 3.29 0.126A2-911-081-1-5 0.1066 0.9933 6767 63.9 65.5 400.4 1096 3.29 3.37 0.131B1-911-081-1-5 0.1061 0.9935 6580 62.4 63.7 401.7 1092 3.27 3.34 0.130B2-911-081-1-5 0.1085 0.9936 6778 62.9 65.6 366.3 1046 3.15 3.29 0.133A2-911-081-1-4 0.1061 0.9934 6687 63.4 64.7 - - - - -B2-911-081-1-4 0.1087 0.9911 6738 62.5 65.4 - - - - -
Average 0.1070 0.9931 6699 63.0 64.9 3.23 3.32 0.130Std. Dev. 0.0012 0.0010 77 0.57 0.77 0.06 0.04 0.003COV, % 1.15 0.10 1.15 0.90 1.18 1.89 1.21 2.32
Material Type: FGF7781-07I Test Operator: John SmithBatch Number: AF991103 Test Frame: Instron 4505
Test Method: ASTM D3039 Test Speed: 0.05 in/minSpecimen Preconditioning: as machined Control Mode: Stroke
Test Conditions: 180°F/Dry Strain Gage: One biaxial gage (CEA-06-125UT-120)Ply Orientation: (warp)10 Fiber Volume(normalizing): 44.2%Testing Facility: Toray Composites (America) CPT (average): 0.0104 in.
Test Date: 3/14/2000 Fiber Volume(batch average): 44.9%
Specimen Specimen Specimen Ultimate Load @ Load @ Poisson'sNumber Thickness Width Tensile 0.1% 0.3% Ratio
Load Actual Norm. Strain Strain Actual Norm. (0.1-0.3%)(in.) (in.) (lbs.) (ksi) (ksi) (lbs.) (lbs.) (msi) (msi) strain)
A1-911-082-1-7 0.1030 0.9931 6754 66.0 65.4 414.3 1103 3.36 3.33 0.120A2-911-082-1-3 0.1032 0.9908 6736 65.9 65.4 390.8 1073 3.34 3.31 0.128B1-911-082-1-3 0.1030 0.9901 6702 65.7 65.1 444.9 1128 3.35 3.32 0.128B2-911-082-1-3 0.1036 0.9906 6733 65.6 65.4 393.5 1081 3.35 3.33 0.129A2-911-082-1-2 0.1024 0.9932 6663 65.5 64.5 - - - - -B2-911-082-1-2 0.1033 0.9934 6775 66.0 65.6 - - - - -
Average 0.1031 0.9919 6727 65.8 65.2 3.35 3.32 0.126Std. Dev. 0.0004 0.0015 40 0.21 0.38 0.01 0.01 0.004COV, % 0.37 0.16 0.59 0.33 0.58 0.33 0.37 3.19
Material Type: FGF7781-07I Test Operator: John SmithBatch Number: AF991104 Test Frame: Instron 4505
Test Method: ASTM D3039 Test Speed: 0.05 in/minSpecimen Preconditioning: as machined Control Mode: Stroke
Test Conditions: 180°F/Dry Strain Gage: One biaxial gage (CEA-06-125UT-120)Ply Orientation: (warp)10 Fiber Volume(normalizing): 44.2%Testing Facility: Toray Composites (America) CPT (average): 0.0104 in.
Test Date: 3/14/2000 Fiber Volume(batch average): 45.3%
Specimen Specimen Specimen Ultimate Load @ Load @ Poisson'sNumber Thickness Width Tensile 0.1% 0.3% Ratio
Load Actual Norm. Strain Strain Actual Norm. (0.1-0.3%)(in.) (in.) (lbs.) (ksi) (ksi) (lbs.) (lbs.) (msi) (msi) strain)
A1-911-083-1-3 0.1019 0.9913 6553 64.9 63.6 388.3 1070 3.37 3.31 0.127A2-911-083-1-3 0.1033 0.9902 6711 65.6 65.2 420.9 1117 3.40 3.38 0.128B1-911-083-1-3 0.1032 0.9912 6627 64.8 64.3 414.0 1089 3.30 3.27 0.129B2-911-083-1-3 0.1040 0.9900 6621 64.3 64.3 395.0 1083 3.34 3.34 0.124A2-911-083-1-2 0.1015 0.9933 6747 67.0 65.3 - - - - -B2-911-083-1-2 0.1041 0.9931 6759 65.4 65.4 - - - - -
Average 0.1030 0.9915 6670 65.3 64.7 3.35 3.32 0.127Std. Dev. 0.0011 0.0014 82 0.92 0.74 0.05 0.05 0.002COV, % 1.05 0.14 1.23 1.41 1.15 1.35 1.37 1.59
Failure in gage areaFailure in gage areaFailure in gage areaFailure in gage area
Comments
Failure in gage areaFailure in gage area
Ultimate Tensile Tensile Modulus Failure LocationStrength (0.1-0.3% strain) &
Failure in gage areaFailure in gage areaFailure in gage areaFailure in gage area
Comments
Failure in gage areaFailure in gage area
Ultimate Tensile Tensile Modulus Failure LocationStrength (0.1-0.3% strain) &
Failure in gage areaFailure in gage areaFailure in gage areaFailure in gage area
Comments
Failure in gage areaFailure in gage area
Ultimate Tensile Tensile Modulus Failure LocationStrength (0.1-0.3% strain) &

178
0° (Warp) Tension Properties, 180°F (Wet)Material Type: FGF7781-07I Test Operator: John SmithBatch Number: AF991102 Test Frame: Instron 4505
Test Method: ASTM D3039 Test Speed: 0.05 in/minSpecimen Preconditioning: per Section 3.2 of AGATE Methodology Control Mode: Stroke
Test Conditions: 180°F Strain Gage: One biaxial gage (CEA-06-125UT-120)Ply Orientation: (warp)10 Fiber Volume(normalizing): 44.2%Testing Facility: Toray Composites (America) CPT (average): 0.0104 in.
Test Date: 5/2/00, 5/3/00 Fiber Volume(batch average): 44.4%
Specimen Specimen Specimen Ultimate Load @ Load @ Poisson'sNumber Thickness Width Tensile 0.1% 0.3% Ratio
Load Actual Norm. Strain Strain Actual Norm. (0.1-0.3%)(in.) (in.) (lbs.) (ksi) (ksi) (lbs.) (lbs.) (msi) (msi) strain)
A1-911-081-1-7 0.1050 0.9910 5136 49.4 49.8 392.6 1035 3.09 3.12 0.115A2-911-081-1-7 0.1061 0.9932 5283 50.1 51.1 408.8 1065 3.11 3.17 0.116B1-911-081-1-7 0.1080 0.9909 5330 49.8 51.7 428.3 1083 3.06 3.18 0.114B2-911-081-1-7 0.1062 0.9911 5097 48.4 49.5 425.4 1066 3.04 3.11 0.116A1-911-081-1-8 0.1055 0.9932 5319 50.7 51.5 - - - - -B1-911-081-1-8 0.1073 0.9936 5160 48.4 49.9 - - - - -
Average 0.1063 0.9922 5221 49.5 50.6 3.08 3.14 0.115Std. Dev. 0.0011 0.0013 102 0.94 0.97 0.03 0.04 0.001COV, % 1.06 0.13 1.95 1.90 1.92 1.04 1.16 0.79
Material Type: FGF7781-07I Test Operator: John SmithBatch Number: AF991103 Test Frame: Instron 4505
Test Method: ASTM D3039 Test Speed: 0.05 in/minSpecimen Preconditioning: per Section 3.2 of AGATE Methodology Control Mode: Stroke
Test Conditions: 180°F Strain Gage: One biaxial gage (CEA-06-125UT-120)Ply Orientation: (warp)10 Fiber Volume(normalizing): 44.2%Testing Facility: Toray Composites (America) CPT (average): 0.0104 in.
Test Date: 5/2/00, 5/3/00 Fiber Volume(batch average): 44.9%
Specimen Specimen Specimen Ultimate Load @ Load @ Poisson'sNumber Thickness Width Tensile 0.1% 0.3% Ratio
Load Actual Norm. Strain Strain Actual Norm. (0.1-0.3%)(in.) (in.) (lbs.) (ksi) (ksi) (lbs.) (lbs.) (msi) (msi) strain)
A1-911-082-1-4 0.1054 0.9931 4997 47.7 48.4 395.0 1054 3.15 3.19 0.117A2-911-082-1-4 0.1035 0.9936 5009 48.7 48.5 377.2 1031 3.18 3.16 0.118B1-911-082-1-4 0.1026 0.9903 5094 50.1 49.5 452.4 1098 3.18 3.14 0.112B2-911-082-1-4 0.1039 0.9905 4974 48.4 48.3 405.0 1044 3.10 3.10 0.112A1-911-082-1-5 0.1053 0.9935 4819 46.1 46.6 - - - - -B1-911-082-1-5 0.1023 0.9934 4884 48.1 47.3 - - - - -
Average 0.1038 0.9924 4963 48.2 48.1 3.15 3.15 0.114Std. Dev. 0.0013 0.0016 97 1.33 0.99 0.04 0.04 0.003COV, % 1.27 0.16 1.96 2.76 2.06 1.12 1.21 2.91
Material Type: FGF7781-07I Test Operator: John SmithBatch Number: AF991104 Test Frame: Instron 4505
Test Method: ASTM D3039 Test Speed: 0.05 in/minSpecimen Preconditioning: per Section 3.2 of AGATE Methodology Control Mode: Stroke
Test Conditions: 180°F Strain Gage: One biaxial gage (CEA-06-125UT-120)Ply Orientation: (warp)10 Fiber Volume(normalizing): 44.2%Testing Facility: Toray Composites (America) CPT (average): 0.0104 in.
Test Date: 5/2/00, 5/3/00 Fiber Volume(batch average): 45.3%
Specimen Specimen Specimen Ultimate Load @ Load @ Poisson'sNumber Thickness Width Tensile 0.1% 0.3% Ratio
Load Actual Norm. Strain Strain Actual Norm. (0.1-0.3%)(in.) (in.) (lbs.) (ksi) (ksi) (lbs.) (lbs.) (msi) (msi) strain)
A1-911-083-1-4 0.1021 0.9933 5299 52.2 51.3 363.1 1008 3.18 3.12 0.118A2-911-083-1-1 0.1049 0.9932 5062 48.6 49.0 411.5 1073 3.17 3.20 0.114B1-911-083-1-4 0.1034 0.9930 4841 47.2 46.9 423.0 1071 3.16 3.14 0.116B2-911-083-1-4 0.1034 0.9933 5233 51.0 50.7 426.2 1080 3.18 3.16 0.112A1-911-083-1-5 0.1021 0.9934 5143 50.7 49.8 - - - - -B1-911-083-1-5 0.1033 0.9934 4924 48.0 47.7 - - - - -
Average 0.1032 0.9933 5084 49.6 49.2 3.17 3.16 0.115Std. Dev. 0.0010 0.0002 177 1.99 1.71 0.01 0.03 0.003COV, % 1.01 0.02 3.49 4.01 3.48 0.40 1.10 2.20
Failure in gage areaFailure in gage areaFailure in gage areaFailure in gage area
Comments
Failure in gage areaFailure in gage area
Ultimate Tensile Tensile Modulus Failure LocationStrength (0.1-0.3% strain) &
Failure in gage areaFailure in gage areaFailure in gage areaFailure in gage area
Comments
Failure in gage areaFailure in gage area
Ultimate Tensile Tensile Modulus Failure LocationStrength (0.1-0.3% strain) &
Failure in gage areaFailure in gage areaFailure in gage areaFailure in gage area
Comments
Failure in gage areaFailure in gage area
Ultimate Tensile Tensile Modulus Failure LocationStrength (0.1-0.3% strain) &

179
90° (Fill) Tension Properties, -65°F (Dry)
Material Type: FGF7781-07I Test Operator: Bryan Mines, Emmanuel DomingoBatch Number: AF991102 Test Frame: I
Test Method: ASTM D3039 Test Speed: 0.05 in/minSpecimen Preconditioning: as machined Control Mode: Stroke
Test Conditions: -65°F/Dry Strain Gage: One axial gage (CEA-06-125UW-350)Ply Orientation: (fill)10 Fiber Volume(normalizing): 44.2%Testing Facility: Intec CPT (average): 0.0104 in.
Test Date: 2/23/2000 Fiber Volume(batch average): 44.4%
Specimen Specimen Specimen Ultimate Load @ Load @Number Thickness Width Tensile 0.1% 0.3%
Load Actual Norm. Strain Strain Actual Norm.(in.) (in.) (lbs.) (ksi) (ksi) (lbs.) (lbs.) (msi) (msi)
A1-911-081-1-1 0.1052 0.9910 6640 63.7 64.4 366 1096 3.46 3.50A2-911-081-1-1 0.1046 0.9910 6540 63.1 63.5 430 1159 3.50 3.52B1-911-081-1-1 0.1036 0.9910 6090 59.3 59.1 483 1193 3.49 3.48B2-911-081-1-1 0.1032 0.9910 6680 65.3 64.8 386 1119 3.60 3.57A1-911-081-1-2 0.1053 0.9940 6030 57.6 58.3 - - - -B1-911-081-1-2 0.1036 0.9940 6880 66.8 66.6 - - - -
Average 0.1043 0.9920 6477 62.6 62.8 3.51 3.52Std. Dev. 0.0009 0.0015 342 3.53 3.32 0.06 0.04COV, % 0.87 0.16 5.28 5.63 5.28 1.73 1.16
Ultimate Tensile Tensile Modulus Failure LocationStrength (0.1-0.3% strain) &
Comments
Failure in gage areaFailure in gage areaFailure in gage areaFailure in gage areaFailure in gage areaFailure in gage area

180
90° (Fill) Tension Properties, 75°F (Dry)Material Type: FGF7781-07I Test Operator: John SmithBatch Number: AF991102 Test Frame: Instron 4505
Test Method: ASTM D3039 Test Speed: 0.05 in/minSpecimen Preconditioning: as machined Control Mode: Stroke
Test Conditions: RT/Dry Strain Gage: One axial gage (C-960401-A)Ply Orientation: (fill)10 Fiber Volume(normalizing): 44.2%Testing Facility: Toray Composites (America) CPT (average): 0.0104 in.
Test Date: 2/24/2000 Fiber Volume(batch average): 44.4%
Specimen Specimen Specimen Ultimate Load @ Load @Number Thickness Width Tensile 0.1% 0.3%
Load Actual Norm. Strain Strain Actual Norm.(in.) (in.) (lbs.) (ksi) (ksi) (lbs.) (lbs.) (msi) (msi)
A1-911-081-1-3 0.1054 0.9934 5501 52.5 53.2 388 1064 3.23 3.27A2-911-081-1-3 0.1058 0.9937 5437 51.7 52.6 366 1046 3.24 3.29B1-911-081-1-3 0.1037 0.9935 5105 49.6 49.4 414 1097 3.31 3.30B2-911-081-1-3 0.1054 0.9933 5603 53.5 54.2 405 1087 3.26 3.30A1-911-081-1-4 0.1054 0.9905 5105 48.9 49.6 - - - -B1-911-081-1-4 0.1037 0.9905 4747 46.2 46.1 - - - -
Average 0.1049 0.9925 5250 50.4 50.9 3.26 3.29Std. Dev. 0.0009 0.0016 322 2.71 3.06 0.04 0.01COV, % 0.90 0.16 6.13 5.37 6.01 1.17 0.44
Material Type: FGF7781-07I Test Operator: John SmithBatch Number: AF991103 Test Frame: Instron 4505
Test Method: ASTM D3039 Test Speed: 0.05 in/minSpecimen Preconditioning: as machined Control Mode: Stroke
Test Conditions: RT/Dry Strain Gage: One axial gage (C-960401-A)Ply Orientation: (fill)10 Fiber Volume(normalizing): 44.2%Testing Facility: Toray Composites (America) CPT (average): 0.0104 in.
Test Date: 3/21/2000 Fiber Volume(batch average): 44.9%
Specimen Specimen Specimen Ultimate Load @ Load @Number Thickness Width Tensile 0.1% 0.3%
Load Actual Norm. Strain Strain Actual Norm.(in.) (in.) (lbs.) (ksi) (ksi) (lbs.) (lbs.) (msi) (msi)
A1-911-082-1-1 0.1015 0.9929 4893 48.6 47.4 389 1063 3.34 3.26A2-911-082-1-1 0.1028 0.9908 5114 50.2 49.6 400 1080 3.34 3.30B1-911-082-1-1 0.1016 0.9909 5072 50.4 49.2 371 1053 3.38 3.31B2-911-082-1-1 0.1013 0.9906 5180 51.6 50.3 409 1096 3.43 3.34A1-911-082-1-2 0.1020 0.9933 5583 55.1 54.0 - - - -B1-911-082-1-2 0.1026 0.9938 5438 53.3 52.6 - - - -
Average 0.1020 0.9920 5213 51.5 50.5 3.37 3.30Std. Dev. 0.0006 0.0014 253 2.37 2.42 0.04 0.03COV, % 0.62 0.14 4.86 4.60 4.79 1.24 0.98
Material Type: FGF7781-07I Test Operator: John SmithBatch Number: AF991104 Test Frame: Instron 4505
Test Method: ASTM D3039 Test Speed: 0.05 in/minSpecimen Preconditioning: as machined Control Mode: Stroke
Test Conditions: RT/Dry Strain Gage: One axial gage (C-960401-A)Ply Orientation: (fill)10 Fiber Volume(normalizing): 44.2%Testing Facility: Toray Composites (America) CPT (average): 0.0104 in.
Test Date: 3/21/2000 Fiber Volume(batch average): 45.3%
Specimen Specimen Specimen Ultimate Load @ Load @Number Thickness Width Tensile 0.1% 0.3%
Load Actual Norm. Strain Strain Actual Norm.(in.) (in.) (lbs.) (ksi) (ksi) (lbs.) (lbs.) (msi) (msi)
A1-911-083-1-1 0.1020 0.9908 5053 50.0 49.0 401 1080 3.36 3.30A2-911-083-1-1 0.1028 0.9906 5077 49.8 49.3 386 1066 3.34 3.30B1-911-083-1-1 0.1027 0.9910 5122 50.3 49.7 434 1119 3.37 3.33B2-911-083-1-1 0.1010 0.9907 5061 50.6 49.1 379 1056 3.38 3.29A1-911-083-1-2 0.1027 0.9936 5268 51.6 51.0 - - - -B1-911-083-1-2 0.1031 0.9937 5219 50.9 50.5 - - - -
Average 0.1024 0.9917 5133 50.6 49.8 3.36 3.30Std. Dev. 0.0008 0.0015 90 0.66 0.80 0.02 0.02COV, % 0.76 0.15 1.75 1.31 1.61 0.56 0.52
Failure in gage areaFailure in gage areaFailure in gage areaFailure in gage area
Comments
Failure in gage areaFailure in gage area
Ultimate Tensile Tensile Modulus Failure LocationStrength (0.1-0.3% strain) &
Failure in gage areaFailure in gage areaFailure in gage areaFailure in gage area
Comments
Failure in gage areaFailure in gage area
Ultimate Tensile Tensile Modulus Failure LocationStrength (0.1-0.3% strain) &
Failure in gage areaFailure in gage areaFailure in gage areaFailure in gage area
Comments
Failure in gage areaFailure in gage area
Ultimate Tensile Tensile Modulus Failure LocationStrength (0.1-0.3% strain) &
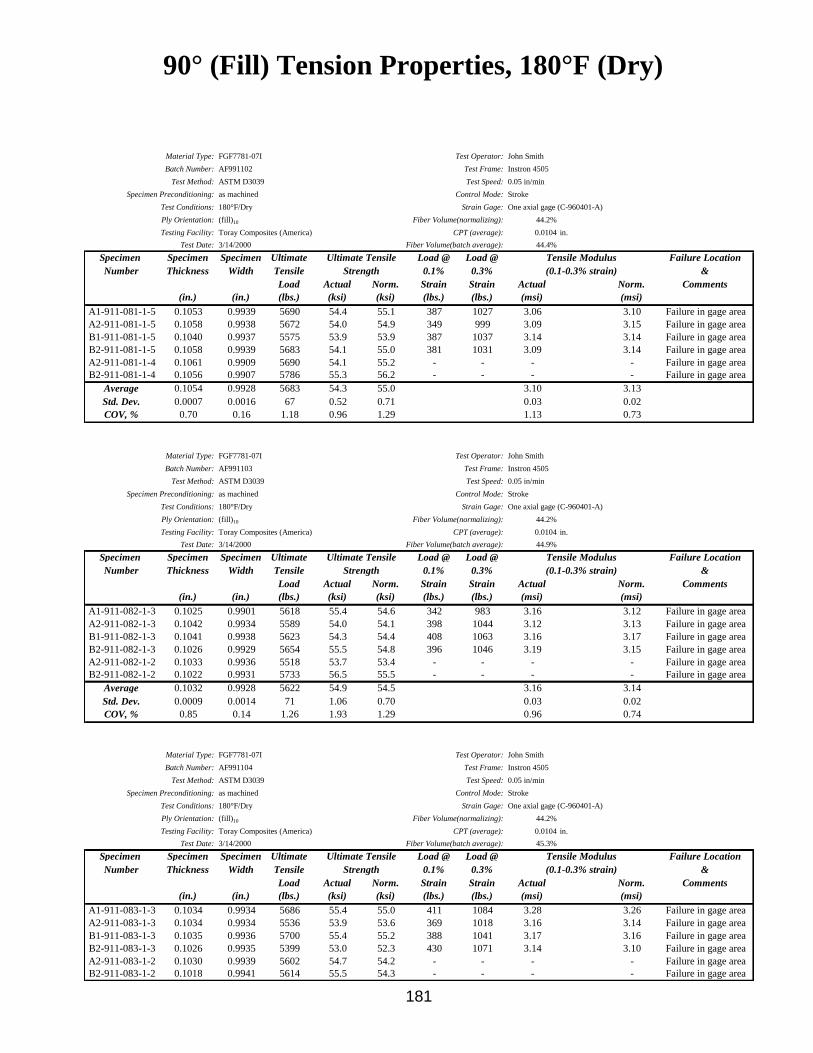
181
90° (Fill) Tension Properties, 180°F (Dry)
Material Type: FGF7781-07I Test Operator: John SmithBatch Number: AF991102 Test Frame: Instron 4505
Test Method: ASTM D3039 Test Speed: 0.05 in/minSpecimen Preconditioning: as machined Control Mode: Stroke
Test Conditions: 180°F/Dry Strain Gage: One axial gage (C-960401-A)Ply Orientation: (fill)10 Fiber Volume(normalizing): 44.2%Testing Facility: Toray Composites (America) CPT (average): 0.0104 in.
Test Date: 3/14/2000 Fiber Volume(batch average): 44.4%
Specimen Specimen Specimen Ultimate Load @ Load @Number Thickness Width Tensile 0.1% 0.3%
Load Actual Norm. Strain Strain Actual Norm.(in.) (in.) (lbs.) (ksi) (ksi) (lbs.) (lbs.) (msi) (msi)
A1-911-081-1-5 0.1053 0.9939 5690 54.4 55.1 387 1027 3.06 3.10A2-911-081-1-5 0.1058 0.9938 5672 54.0 54.9 349 999 3.09 3.15B1-911-081-1-5 0.1040 0.9937 5575 53.9 53.9 387 1037 3.14 3.14B2-911-081-1-5 0.1058 0.9939 5683 54.1 55.0 381 1031 3.09 3.14A2-911-081-1-4 0.1061 0.9909 5690 54.1 55.2 - - - -B2-911-081-1-4 0.1056 0.9907 5786 55.3 56.2 - - - -
Average 0.1054 0.9928 5683 54.3 55.0 3.10 3.13Std. Dev. 0.0007 0.0016 67 0.52 0.71 0.03 0.02COV, % 0.70 0.16 1.18 0.96 1.29 1.13 0.73
Material Type: FGF7781-07I Test Operator: John SmithBatch Number: AF991103 Test Frame: Instron 4505
Test Method: ASTM D3039 Test Speed: 0.05 in/minSpecimen Preconditioning: as machined Control Mode: Stroke
Test Conditions: 180°F/Dry Strain Gage: One axial gage (C-960401-A)Ply Orientation: (fill)10 Fiber Volume(normalizing): 44.2%Testing Facility: Toray Composites (America) CPT (average): 0.0104 in.
Test Date: 3/14/2000 Fiber Volume(batch average): 44.9%
Specimen Specimen Specimen Ultimate Load @ Load @Number Thickness Width Tensile 0.1% 0.3%
Load Actual Norm. Strain Strain Actual Norm.(in.) (in.) (lbs.) (ksi) (ksi) (lbs.) (lbs.) (msi) (msi)
A1-911-082-1-3 0.1025 0.9901 5618 55.4 54.6 342 983 3.16 3.12A2-911-082-1-3 0.1042 0.9934 5589 54.0 54.1 398 1044 3.12 3.13B1-911-082-1-3 0.1041 0.9938 5623 54.3 54.4 408 1063 3.16 3.17B2-911-082-1-3 0.1026 0.9929 5654 55.5 54.8 396 1046 3.19 3.15A2-911-082-1-2 0.1033 0.9936 5518 53.7 53.4 - - - -B2-911-082-1-2 0.1022 0.9931 5733 56.5 55.5 - - - -
Average 0.1032 0.9928 5622 54.9 54.5 3.16 3.14Std. Dev. 0.0009 0.0014 71 1.06 0.70 0.03 0.02COV, % 0.85 0.14 1.26 1.93 1.29 0.96 0.74
Material Type: FGF7781-07I Test Operator: John SmithBatch Number: AF991104 Test Frame: Instron 4505
Test Method: ASTM D3039 Test Speed: 0.05 in/minSpecimen Preconditioning: as machined Control Mode: Stroke
Test Conditions: 180°F/Dry Strain Gage: One axial gage (C-960401-A)Ply Orientation: (fill)10 Fiber Volume(normalizing): 44.2%Testing Facility: Toray Composites (America) CPT (average): 0.0104 in.
Test Date: 3/14/2000 Fiber Volume(batch average): 45.3%
Specimen Specimen Specimen Ultimate Load @ Load @Number Thickness Width Tensile 0.1% 0.3%
Load Actual Norm. Strain Strain Actual Norm.(in.) (in.) (lbs.) (ksi) (ksi) (lbs.) (lbs.) (msi) (msi)
A1-911-083-1-3 0.1034 0.9934 5686 55.4 55.0 411 1084 3.28 3.26A2-911-083-1-3 0.1034 0.9934 5536 53.9 53.6 369 1018 3.16 3.14B1-911-083-1-3 0.1035 0.9936 5700 55.4 55.2 388 1041 3.17 3.16B2-911-083-1-3 0.1026 0.9935 5399 53.0 52.3 430 1071 3.14 3.10A2-911-083-1-2 0.1030 0.9939 5602 54.7 54.2 - - - -B2-911-083-1-2 0.1018 0.9941 5614 55.5 54.3 - - - -
Ultimate Tensile Tensile Modulus Failure LocationStrength (0.1-0.3% strain) &
Comments
Failure in gage areaFailure in gage areaFailure in gage areaFailure in gage areaFailure in gage areaFailure in gage area
Ultimate Tensile Tensile Modulus Failure LocationStrength (0.1-0.3% strain) &
Comments
Failure in gage areaFailure in gage areaFailure in gage areaFailure in gage areaFailure in gage areaFailure in gage area
Ultimate Tensile Tensile Modulus Failure LocationStrength (0.1-0.3% strain) &
Comments
Failure in gage areaFailure in gage areaFailure in gage areaFailure in gage areaFailure in gage areaFailure in gage area

182
90° (Fill) Tension Properties, 180°F (Wet)Material Type: FGF7781-07I Test Operator: John SmithBatch Number: AF991102 Test Frame: Instron 4505
Test Method: ASTM D3039 Test Speed: 0.05 in/minSpecimen Preconditioning: per Section 3.2 of AGATE Methodology Control Mode: Stroke
Test Conditions: 180°F Strain Gage: One axial gage (C-960401-A)Ply Orientation: (fill)10 Fiber Volume(normalizing): 44.2%Testing Facility: Toray Composites (America) CPT (average): 0.0104 in.
Test Date: 5/2/00, 5/3/00 Fiber Volume(batch average): 44.4%
Specimen Specimen Specimen Ultimate Load @ Load @Number Thickness Width Tensile 0.1% 0.3%
Load Actual Norm. Strain Strain Actual Norm.(in.) (in.) (lbs.) (ksi) (ksi) (lbs.) (lbs.) (msi) (msi)
A1-911-081-1-8 0.1039 0.9934 4517 43.8 43.7 350 946 2.89 2.88A2-911-081-1-8 0.1049 0.9930 4575 43.9 44.3 427 1032 2.90 2.93B1-911-081-1-8 0.1029 0.9937 4436 43.4 42.9 381 992 2.99 2.95B2-911-081-1-8 0.1063 0.9935 4351 41.2 42.1 376 986 2.89 2.95A1-911-081-1-9 0.1035 0.9928 4488 43.7 43.5 - - - -B1-911-081-1-9 0.1024 0.9934 4448 43.7 43.1 - - - -
Average 0.1040 0.9933 4469 43.3 43.3 2.92 2.93Std. Dev. 0.0014 0.0003 77 1.03 0.75 0.05 0.03COV, % 1.38 0.03 1.71 2.38 1.73 1.62 1.11
Material Type: FGF7781-07I Test Operator: John SmithBatch Number: AF991103 Test Frame: Instron 4505
Test Method: ASTM D3039 Test Speed: 0.05 in/minSpecimen Preconditioning: per Section 3.2 of AGATE Methodology Control Mode: Stroke
Test Conditions: 180°F Strain Gage: One axial gage (C-960401-A)Ply Orientation: (fill)10 Fiber Volume(normalizing): 44.2%Testing Facility: Toray Composites (America) CPT (average): 0.0104 in.
Test Date: 5/2/00, 5/3/00 Fiber Volume(batch average): 44.9%
Specimen Specimen Specimen Ultimate Load @ Load @Number Thickness Width Tensile 0.1% 0.3%
Load Actual Norm. Strain Strain Actual Norm.(in.) (in.) (lbs.) (ksi) (ksi) (lbs.) (lbs.) (msi) (msi)
A1-911-082-1-4 0.1027 0.9933 4115 40.4 39.8 371 974 2.95 2.91A2-911-082-1-4 0.1057 0.9906 4195 40.1 40.7 389 991 2.87 2.92B1-911-082-1-4 0.1057 0.9910 4192 40.0 40.7 383 991 2.90 2.95B2-911-082-1-4 0.1026 0.9901 4383 43.2 42.6 365 973 2.99 2.95A1-911-082-1-5 0.1028 0.9935 4408 43.2 42.7 - - - -B1-911-082-1-5 0.1056 0.9937 4282 40.8 41.4 - - - -
Average 0.1042 0.9920 4263 41.3 41.3 2.93 2.93Std. Dev. 0.0016 0.0016 116 1.50 1.13 0.05 0.02COV, % 1.58 0.17 2.72 3.63 2.73 1.80 0.60
Material Type: FGF7781-07I Test Operator: John SmithBatch Number: AF991104 Test Frame: Instron 4505
Test Method: ASTM D3039 Test Speed: 0.05 in/minSpecimen Preconditioning: per Section 3.2 of AGATE Methodology Control Mode: Stroke
Test Conditions: 180°F Strain Gage: One axial gage (C-960401-A)Ply Orientation: (fill)10 Fiber Volume(normalizing): 44.2%Testing Facility: Toray Composites (America) CPT (average): 0.0104 in.
Test Date: 5/2/00, 5/3/00 Fiber Volume(batch average): 45.3%
Specimen Specimen Specimen Ultimate Load @ Load @Number Thickness Width Tensile 0.1% 0.3%
Load Actual Norm. Strain Strain Actual Norm.(in.) (in.) (lbs.) (ksi) (ksi) (lbs.) (lbs.) (msi) (msi)
A1-911-083-1-4 0.1043 0.9906 4463 43.2 43.3 343 942 2.90 2.91A2-911-083-1-4 0.1033 0.9902 4435 43.4 43.1 364 967 2.95 2.93B1-911-083-1-4 0.1036 0.9905 4385 42.7 42.6 371 980 2.97 2.96B2-911-083-1-4 0.1032 0.9900 4404 43.1 42.8 411 1002 2.90 2.87A1-911-083-1-5 0.1044 0.9935 4372 42.2 42.3 - - - -B1-911-083-1-5 0.1040 0.9937 4229 40.9 40.9 - - - -
Average 0.1038 0.9914 4381 42.6 42.5 2.93 2.92Std. Dev. 0.0005 0.0017 82 0.92 0.85 0.03 0.03COV, % 0.49 0.17 1.86 2.16 2.00 1.19 1.18
Ultimate Tensile Tensile Modulus Failure LocationStrength (0.1-0.3% strain) &
Comments
Failure in gage areaFailure in gage areaFailure in gage areaFailure in gage areaFailure in gage areaFailure in gage area
Ultimate Tensile Tensile Modulus Failure LocationStrength (0.1-0.3% strain) &
Comments
Failure in gage areaFailure in gage areaFailure in gage areaFailure in gage areaFailure in gage areaFailure in gage area
Ultimate Tensile Tensile Modulus Failure LocationStrength (0.1-0.3% strain) &
Comments
Failure in gage areaFailure in gage areaFailure in gage areaFailure in gage areaFailure in gage areaFailure in gage area

183
0° (Warp) Compression Properties, -65°F (Dry)
Material Type: FGF7781-07I Test Operator: John Smith Material Type: FGF7781-07I Test Operator: Bryan MinesBatch Number: AF991103 Test Frame: Instron 4510 Batch Number: AF991102 Test Frame: H
Test Method: SACMA SRM 1-94 Test Speed: 0.05 in/min Test Method: SACMA SRM 1-94 Test Speed: 0.05 in/minPreconditioning: as machined Control Mode: Stroke Preconditioning: as machined Control Mode: StrokeTest Conditions: -65°F/Dry Strain Gage: N/A Test Conditions: -65°F/Dry Strain Gage: One axial gage (CEA-06-125UW-350)Ply Orientation: (warp)12 FV(normalizing): 44.2% Ply Orientation: (warp)12 FV(normalizing): 44.2%Testing Facility: TCA CPT (average): 0.0104 in. Testing Facility: Intec CPT (average): 0.0104 in.
Test Date: 2/26/2000 FV(batch average): 44.9% Test Date: 2/23/2000 FV(batch average): 44.4%
Specimen Specimen Specimen Ult. Failure Specimen Specimen Specimen Load @ Load @Number Thickness Width Comp. Location Number Thickness Width 0.1% 0.3%
Load Actual Norm. & Strain Strain Actual Norm.(in.) (in.) (kips) (ksi) (ksi) Comments (in.) (in.) (lbs.) (lbs.) (msi) (msi)
A1-911-082-1-5 0.1247 0.5013 5.41 86.6 86.5 Failure in gage A2-911-081-1-1 0.1342 0.4990 417.8 905.2 3.64 3.91A1-911-082-1-6 0.1247 0.5013 5.68 90.9 90.9 Failure in gage B2-911-081-1-1 0.1220 0.4990 495.8 971.4 3.91 3.82A1-911-082-1-7 0.1247 0.4992 6.12 98.3 98.2 Failure in gageB1-911-082-1-8 0.1190 0.5006 5.33 89.5 85.3 Failure in gageB1-911-082-1-9 0.1190 0.5006 5.34 89.7 85.5 Failure in gageB1-911-082-1-10 0.1190 0.5004 5.23 87.8 83.8 Failure in gage
Average 0.1219 0.5005 5.52 90.5 88.4 Average 0.1281 0.4990 3.77 3.87Std. Dev. 0.0031 0.0008 0.33 4.12 5.39 Std. Dev. 0.0086 0.0000 0.19 0.07COV, % 2.56 0.15 6.00 4.56 6.10 COV, % 6.73 0.00 5.00 1.73
Ult. Comp. Comp. Mod.Strength (0.1-0.3% strain)

184
0° (Warp) Compression Properties, 75°F (Dry)Material Type: FGF7781-07I Test Operator: John Smith Material Type: FGF7781-07I Test Operator: John SmithBatch Number: AF991102 Test Frame: Instron 4510 Batch Number: AF991102 Test Frame: Instron 4510
Test Method: SACMA SRM 1-94 Loading Rate: 0.05 in/min Test Method: SACMA SRM 1-94 Loading Rate: 0.05 in/minPreconditioning: as machined Control Mode: Stroke Preconditioning: as machined Control Mode: StrokeTest Conditions: RT/Dry Strain Gage: N/A Test Conditions: RT/Dry Strain Gage: One axial gage (FAE-12S-AS-S6EL-2)Ply Orientation: (warp)12 FV(normalizing): 44.2% Ply Orientation: (warp)12 FV(normalizing): 44.2% in.Testing Facility: TCA CPT (average): 0.0104 in. Testing Facility: TCA CPT (average): 0.0104
Test Date: 2/24/2000 FV(batch average): 44.4% Test Date: 3/20/2000 FV(batch average): 44.4%
Specimen Specimen Specimen Ult. Failure Specimen Specimen Specimen Load @ Load @Number Thickness Width Comp. Location Number Thickness Width 0.1% 0.3%
Load Actual Norm. & Strain Strain Actual Norm.(in.) (in.) (kips) (ksi) (ksi) Comments (in.) (in.) (lbs.) (lbs.) (msi) (msi)
A1-911-081-1-9 0.1307 0.5008 4.75 72.6 76.0 Failure in gage A2-911-081-1- 0.1325 0.5009 273.7 741.6 3.53 3.74A1-911-081-1-10 0.1307 0.5008 4.53 69.2 72.5 Failure in gage B2-911-081-1-3 0.1227 0.4992 279.6 742.0 3.77 3.71A2-911-081-1-17 0.1307 0.5006 4.20 64.2 67.2 Failure in gageB1-911-081-1-9 0.1229 0.5009 4.72 76.7 75.5 Failure in gageB2-911-081-1-17 0.1229 0.4980 4.91 80.3 79.1 Failure in gageB2-911-081-1-18 0.1229 0.5005 5.18 84.3 83.0 Failure in gage
Average 0.1268 0.5003 4.72 74.6 75.5 Average 0.1276 0.5001 3.65 3.73Std. Dev. 0.0043 0.0011 0.33 7.36 5.39 Std. Dev. 0.0069 0.0012 0.18 0.02COV, % 3.39 0.22 7.07 9.88 7.14 COV, % 5.40 0.24 4.81 0.59
Material Type: FGF7781-07I Test Operator: John Smith Material Type: FGF7781-07I Test Operator: John SmithBatch Number: AF991103 Test Frame: Instron 4510 Batch Number: AF991103 Test Frame: Instron 4510
Test Method: SACMA SRM 1-94 Loading Rate: 0.05 in/min Test Method: SACMA SRM 1-94 Loading Rate: 0.05 in/minPreconditioning: as machined Control Mode: Stroke Preconditioning: as machined Control Mode: StrokeTest Conditions: RT/Dry Strain Gage: N/A Test Conditions: RT/Dry Strain Gage: One axial gage (FAE-12S-AS-S6EL-2)Ply Orientation: (warp)12 FV(normalizing): 44.2% Ply Orientation: (warp)12 FV(normalizing): 44.2%Testing Facility: TCA CPT (average): 0.0104 in. Testing Facility: TCA CPT (average): 0.0104 in.
Test Date: 3/13/2000 FV(batch average): 44.9% Test Date: 3/20/2000 FV(batch average): 44.9%
Specimen Specimen Specimen Ult. Failure Specimen Specimen Specimen Load @ Load @Number Thickness Width Comp. Location Number Thickness Width 0.1% 0.3%
Load Actual Norm. & Strain Strain Actual Norm.(in.) (in.) (kips) (ksi) (ksi) Comments (in.) (in.) (lbs.) (lbs.) (msi) (msi)
A1-911-082-1-9 0.1204 0.5010 4.62 76.6 73.9 Failure in gage A2-911-082-1- 0.1200 0.4987 284.0 767.0 4.04 3.88A1-911-082-1-10 0.1204 0.5006 4.56 75.6 73.0 Failure in gage B2-911-082-1- 0.1239 0.4992 292.4 778.5 3.93 3.90A2-911-082-1-17 0.1204 0.5010 4.42 73.3 70.7 Failure in gageB1-911-082-1-9 0.1224 0.5007 4.75 77.5 76.0 Failure in gageB2-911-082-1-17 0.1224 0.4980 4.76 78.1 76.6 Failure in gageB2-911-082-1-18 0.1224 0.5005 4.97 81.1 79.5 Failure in gage
Average 0.1214 0.5003 4.68 77.0 75.0 Average 0.1219 0.4990 3.98 3.89Std. Dev. 0.0011 0.0011 0.19 2.60 3.07 Std. Dev. 0.0028 0.0003 0.07 0.02COV, % 0.88 0.23 4.02 3.37 4.10 COV, % 2.27 0.07 1.87 0.39
Material Type: FGF7781-07I Test Operator: John Smith Material Type: FGF7781-07I Test Operator: John SmithBatch Number: AF991104 Test Frame: Instron 4510 Batch Number: AF991104 Test Frame: Instron 4510
Test Method: SACMA SRM 1-94 Loading Rate: 0.05 in/min Test Method: SACMA SRM 1-94 Loading Rate: 0.05 in/minPreconditioning: as machined Control Mode: Stroke Preconditioning: as machined Control Mode: StrokeTest Conditions: RT/Dry Strain Gage: N/A Test Conditions: RT/Dry Strain Gage: One axial gage (FAE-12S-AS-S6EL-2)Ply Orientation: (warp)12 FV(normalizing): 44.2% Ply Orientation: (warp)12 FV(normalizing): 44.2%Testing Facility: TCA CPT (average): 0.0104 in. Testing Facility: TCA CPT (average): 0.0104 in.
Test Date: 3/13/2000 FV(batch average): 45.3% Test Date: 3/20/2000 FV(batch average): 45.3%
Specimen Specimen Specimen Ult. Failure Specimen Specimen Specimen Load @ Load @Number Thickness Width Comp. Location Number Thickness Width 0.1% 0.3%
Load Actual Norm. & Strain Strain Actual Norm.(in.) (in.) (kips) (ksi) (ksi) Comments (in.) (in.) (lbs.) (lbs.) (msi) (msi)
A1-911-083-1-9 0.1269 0.5010 5.04 79.3 80.6 Failure in gage A2-911-083-1- 0.1266 0.4985 279.7 762.4 3.83 3.88A1-911-083-1-10 0.1269 0.4989 4.83 76.4 77.6 Failure in gage B2-911-083-1- 0.1205 0.4987 273.0 748.6 3.96 3.82A2-911-083-1-17 0.1269 0.5004 5.21 82.0 83.3 Failure in gageB1-911-083-1-9 0.1236 0.4988 4.90 79.5 78.8 Failure in gageB2-911-083-1-17 0.1236 0.5008 4.62 74.6 73.9 Failure in gageB2-911-083-1-18 0.1236 0.5007 4.67 75.5 74.8 Failure in gage
Average 0.1252 0.5001 4.88 77.9 78.2 Average 0.1235 0.4986 3.89 3.85Std. Dev. 0.0018 0.0010 0.22 2.83 3.54 Std. Dev. 0.0043 0.0002 0.09 0.04COV, % 1.43 0.20 4.53 3.63 4.53 COV, % 3.47 0.03 2.40 1.08
Ult. Comp. Comp. Mod.Strength (0.1-0.3% strain)
Ult. Comp. Comp. Mod.Strength (0.1-0.3% strain)
Ult. Comp. Comp. Mod.Strength (0.1-0.3% strain)

185
0° (Warp) Compression Properties, 180°F (Dry)Material Type: FGF7781-07I Test Operator: John Smith Material Type: FGF7781-07I Test Operator: John SmithBatch Number: AF991102 Test Frame: Instron 4510 Batch Number: AF991102 Test Frame: Instron 4510
Test Method: SACMA SRM 1-94 Loading Rate: 0.05 in/min Test Method: SACMA SRM 1-94 Loading Rate: 0.05 in/minPreconditioning: as machined Control Mode: Stroke Preconditioning: as machined Control Mode: StrokeTest Conditions: 180°F/Dry Strain Gage: N/A Test Conditions: 180°F/Dry Strain Gage: One axial gage (FAE-12S-AS-S6EL-2)Ply Orientation: (warp)12 FV(normalizing): 44.2% Ply Orientation: (warp)12 FV(normalizing): 44.2%Testing Facility: TCA CPT (average): 0.0104 in. Testing Facility: TCA CPT (average): 0.0104 in.
Test Date: 2/24/2000 FV(batch average): 44.4% Test Date: 3/20/2000 FV(batch average): 44.4%
Specimen Specimen Specimen Ult. Failure Specimen Specimen Specimen Load @ Load @Number Thickness Width Comp. Location Number Thickness Width 0.1% 0.3%
Load Actual Norm. & Strain Strain Actual Norm.(in.) (in.) (kips) (ksi) (ksi) Comments (in.) (in.) (lbs.) (lbs.) (msi) (msi)
A1-911-081-1-11 0.1307 0.5008 3.97 60.6 63.5 Failure in gage A2-911-081-1-4 0.1319 0.4995 297.1 759.7 3.51 3.71A2-911-081-1-18 0.1307 0.5004 3.92 59.9 62.7 Failure in gage B2-911-081-1-4 0.1229 0.5009 293.8 760.6 3.79 3.73A2-911-081-1-19 0.1307 0.5010 3.78 57.7 60.4 Failure in gageB1-911-081-1-10 0.1229 0.5009 4.02 65.3 64.3 Failure in gageB1-911-081-1-11 0.1229 0.5007 4.19 68.1 67.1 Failure in gageB2-911-081-1-19 0.1229 0.4979 4.11 67.2 66.1 Failure in gage
Average 0.1268 0.5003 4.00 63.1 64.0 Average 0.1274 0.5002 3.65 3.72Std. Dev. 0.0043 0.0012 0.15 4.30 2.40 Std. Dev. 0.0063 0.0010 0.20 0.02COV, % 3.39 0.24 3.64 6.81 3.74 COV, % 4.97 0.20 5.40 0.44
Material Type: FGF7781-07I Test Operator: John Smith Material Type: FGF7781-07I Test Operator: John SmithBatch Number: AF991103 Test Frame: Instron 4510 Batch Number: AF991103 Test Frame: Instron 4510
Test Method: SACMA SRM 1-94 Loading Rate: 0.05 in/min Test Method: SACMA SRM 1-94 Loading Rate: 0.05 in/minPreconditioning: as machined Control Mode: Stroke Preconditioning: as machined Control Mode: StrokeTest Conditions: 180°F/Dry Strain Gage: N/A Test Conditions: 180°F/Dry Strain Gage: One axial gage (FAE-12S-AS-S6EL-2)Ply Orientation: (warp)12 FV(normalizing): 44.2% Ply Orientation: (warp)12 FV(normalizing): 44.2%Testing Facility: TCA CPT (average): 0.0104 in. Testing Facility: TCA CPT (average): 0.0104 in.
Test Date: 3/21/2000 FV(batch average): 44.9% Test Date: 3/20/2000 FV(batch average): 44.9%
Specimen Specimen Specimen Ult. Failure Specimen Specimen Specimen Load @ Load @Number Thickness Width Comp. Location Number Thickness Width 0.1% 0.3%
Load Actual Norm. & Strain Strain Actual Norm.(in.) (in.) (kips) (ksi) (ksi) Comments (in.) (in.) (lbs.) (lbs.) (msi) (msi)
A1-911-082-1-11 0.1204 0.5000 3.58 59.4 57.3 Failure in gage A2-911-082-1-2 0.1210 0.5007 293.7 771.1 3.94 3.82A2-911-082-1-18 0.1204 0.5008 4.00 66.4 64.0 Failure in gage B2-911-082-1-2 0.1237 0.5005 314.3 806.4 3.97 3.94A2-911-082-1-19 0.1204 0.5007 3.96 65.7 63.4 Failure in gageB1-911-082-1-10 0.1224 0.5009 3.92 63.9 62.7 Failure in gageB1-911-082-1-11 0.1224 0.5009 3.94 64.3 63.0 Failure in gageB2-911-082-1-19 0.1224 0.4977 3.94 64.6 63.4 Failure in gage
Average 0.1214 0.5002 3.89 64.1 62.3 Average 0.1224 0.5006 3.96 3.88Std. Dev. 0.0011 0.0012 0.16 2.45 2.48 Std. Dev. 0.0019 0.0001 0.02 0.08COV, % 0.88 0.25 3.99 3.82 3.98 COV, % 1.56 0.02 0.60 2.16
Material Type: FGF7781-07I Test Operator: John Smith Material Type: FGF7781-07I Test Operator: John SmithBatch Number: AF991104 Test Frame: Instron 4510 Batch Number: AF991104 Test Frame: Instron 4510
Test Method: SACMA SRM 1-94 Loading Rate: 0.05 in/min Test Method: SACMA SRM 1-94 Loading Rate: 0.05 in/minPreconditioning: as machined Control Mode: Stroke Preconditioning: as machined Control Mode: StrokeTest Conditions: 180°F/Dry Strain Gage: N/A Test Conditions: 180°F/Dry Strain Gage: One axial gage (FAE-12S-AS-S6EL-2)Ply Orientation: (warp)12 FV(normalizing): 44.2% Ply Orientation: (warp)12 FV(normalizing): 44.2%Testing Facility: TCA CPT (average): 0.0104 in. Testing Facility: TCA CPT (average): 0.0104 in.
Test Date: 3/21/2000 FV(batch average): 45.3% Test Date: 3/20/2000 FV(batch average): 45.3%
Specimen Specimen Specimen Ult. Failure Specimen Specimen Specimen Load @ Load @Number Thickness Width Comp. Location Number Thickness Width 0.1% 0.3%
Load Actual Norm. & Strain Strain Actual Norm.(in.) (in.) (kips) (ksi) (ksi) Comments (in.) (in.) (lbs.) (lbs.) (msi) (msi)
A1-911-083-1-11 0.1269 0.5013 3.83 60.2 61.2 Failure in gage A2-911-083-1-2 0.1268 0.5006 288.0 740.7 3.57 3.62A2-911-083-1-18 0.1269 0.5011 4.08 64.2 65.3 Failure in gage B2-911-083-1-2 0.1214 0.5039 289.5 803.6 4.20 4.09A2-911-083-1-19 0.1269 0.5006 3.81 60.0 61.0 Failure in gageB1-911-083-1-10 0.1263 0.5012 4.00 63.2 64.0 Failure in gageB1-911-083-1-11 0.1263 0.4989 3.93 62.3 63.1 Failure in gageB2-911-083-1-19 0.1263 0.5007 3.90 61.6 62.3 Failure in gage
Average 0.1266 0.5006 3.92 61.9 62.8 Average 0.1241 0.5022 3.89 3.86Std. Dev. 0.0003 0.0009 0.10 1.68 1.66 Std. Dev. 0.0038 0.0023 0.45 0.33COV, % 0.24 0.18 2.66 2.71 2.65 COV, % 3.06 0.46 11.58 8.53
Ult. Comp. Comp. Mod.Strength (0.1-0.3% strain)
Ult. Comp. Comp. Mod.Strength (0.1-0.3% strain)
Ult. Comp. Comp. Mod.Strength (0.1-0.3% strain)

186
0° (Warp) Compression Properties, 180°F (Wet)Material Type: FGF7781-07I Test Operator: John Smith Material Type: FGF7781-07I Test Operator: John SmithBatch Number: AF991102 Test Frame: Instron 4510 Batch Number: AF991102 Test Frame: Instron 4510
Test Method: SACMA SRM 1-94 Loading Rate: 0.05 in/min Test Method: SACMA SRM 1-94 Loading Rate: 0.05 in/minPreconditioning: Section 3.2 of AGATE Control Mode: Stroke Preconditioning: Section 3.2 of AGATE Control Mode: StrokeTest Conditions: 180°F Strain Gage: N/A Test Conditions: 180°F Strain Gage: One axial gage (FAE-12S-AS-S6EL-2)Ply Orientation: (warp)12 FV(normalizing): 44.2% Ply Orientation: (warp)12 FV(normalizing): 44.2%Testing Facility: TCA CPT (average): 0.0104 in. Testing Facility: TCA CPT (average): 0.0104 in.
Test Date: 7/7/2000 FV(batch average): 44.4% Test Date: 6/8/2000 FV(batch average): 44.4%
Specimen Specimen Specimen Ult. Failure Specimen Specimen Specimen Load @ Load @Number Thickness Width Comp. Location Number Thickness Width 0.1% 0.3%
Load Actual Norm. & Strain Strain Actual Norm.(in.) (in.) (kips) (ksi) (ksi) Comments (in.) (in.) (lbs.) (lbs.) (msi) (msi)
A1-911-081-1-1 0.1285 0.5002 3.50 54.5 56.1 Failure in gage A2-911-081-1-5 0.1315 0.5007 264.3 708.2 3.37 3.55A1-911-081-1-2 0.1285 0.5012 3.47 53.9 55.5 Failure in gage B2-911-081-1-5 0.1229 0.5034 313.1 757.8 3.59 3.54A1-911-081-1-3 0.1285 0.5013 3.43 53.3 54.9 Failure in gageB1-911-081-1-1 0.1285 0.5000 3.22 50.1 51.5 Failure in gageB1-911-081-1-2 0.1285 0.4999 3.31 51.6 53.1 Failure in gageB1-911-081-1-3 0.1285 0.4994 3.18 49.5 51.0 Failure in gage
Average 0.1285 0.5003 3.35 52.1 53.7 Average 0.1272 0.5020 3.48 3.55Std. Dev. 0.0000 0.0007 0.14 2.07 2.14 Std. Dev. 0.0060 0.0020 0.16 0.01COV, % 0.00 0.15 4.09 3.98 3.98 COV, % 4.75 0.39 4.48 0.26
Material Type: FGF7781-07I Test Operator: John Smith Material Type: FGF7781-07I Test Operator: John SmithBatch Number: AF991103 Test Frame: Instron 4510 Batch Number: AF991103 Test Frame: Instron 4510
Test Method: SACMA SRM 1-94 Loading Rate: 0.05 in/min Test Method: SACMA SRM 1-94 Loading Rate: 0.05 in/minPreconditioning: Section 3.2 of AGATE Control Mode: Stroke Preconditioning: Section 3.2 of AGATE Control Mode: StrokeTest Conditions: 180°F Strain Gage: N/A Test Conditions: 180°F Strain Gage: One axial gage (FAE-12S-AS-S6EL-2)Ply Orientation: (warp)12 FV(normalizing): 44.2% Ply Orientation: (warp)12 FV(normalizing): 44.2%Testing Facility: TCA CPT (average): 0.0104 in. Testing Facility: TCA CPT (average): 0.0104 in.
Test Date: 7/7/2000 FV(batch average): 44.9% Test Date: 6/8/2000 FV(batch average): 44.9%
Specimen Specimen Specimen Ult. Failure Specimen Specimen Specimen Load @ Load @Number Thickness Width Comp. Location Number Thickness Width 0.1% 0.3%
Load Actual Norm. & Strain Strain Actual Norm.(in.) (in.) (kips) (ksi) (ksi) Comments (in.) (in.) (lbs.) (lbs.) (msi) (msi)
A1-911-082-1-1 0.1250 0.5009 2.98 47.5 47.6 Failure in gage A2-911-082-1-3 0.1215 0.4989 286.0 727.8 3.64 3.55A1-911-082-1-2 0.1250 0.5003 3.06 49.0 49.0 Failure in gage B2-911-082-1-3 0.1232 0.4993 263.3 695.2 3.51 3.47A1-911-082-1-3 0.1250 0.5004 3.18 50.8 50.9 Failure in gageB1-911-082-1-1 0.1220 0.5001 2.81 46.0 45.0 Failure in gageB1-911-082-1-2 0.1220 0.5002 2.84 46.5 45.5 Failure in gageB1-911-082-1-3 0.1220 0.5002 2.85 46.7 45.6 Failure in gage
Average 0.1235 0.5004 2.95 47.8 47.3 Average 0.1224 0.4991 3.58 3.51Std. Dev. 0.0016 0.0003 0.15 1.83 2.35 Std. Dev. 0.0012 0.0003 0.09 0.06COV, % 1.33 0.06 5.00 3.83 4.98 COV, % 0.97 0.06 2.62 1.65
Material Type: FGF7781-07I Test Operator: John Smith Material Type: FGF7781-07I Test Operator: John SmithBatch Number: AF991104 Test Frame: Instron 4510 Batch Number: AF991104 Test Frame: Instron 4510
Test Method: SACMA SRM 1-94 Loading Rate: 0.05 in/min Test Method: SACMA SRM 1-94 Loading Rate: 0.05 in/minPreconditioning: Section 3.2 of AGATE Control Mode: Stroke Preconditioning: Section 3.2 of AGATE Control Mode: StrokeTest Conditions: 180°F Strain Gage: N/A Test Conditions: 180°F Strain Gage: One axial gage (FAE-12S-AS-S6EL-2)Ply Orientation: (warp)12 FV(normalizing): 44.2% Ply Orientation: (warp)12 FV(normalizing): 44.2%Testing Facility: TCA CPT (average): 0.0104 in. Testing Facility: TCA CPT (average): 0.0104 in.
Test Date: 7/7/2000 FV(batch average): 45.3% Test Date: 6/8/2000 FV(batch average): 45.3%
Specimen Specimen Specimen Ult. Failure Specimen Specimen Specimen Load @ Load @Number Thickness Width Comp. Location Number Thickness Width 0.1% 0.3%
Load Actual Norm. & Strain Strain Actual Norm.(in.) (in.) (kips) (ksi) (ksi) Comments (in.) (in.) (lbs.) (lbs.) (msi) (msi)
A1-911-083-1-1 0.1267 0.5006 3.17 50.0 50.8 Failure in gage A2-911-083-1-3 0.1269 0.4990 271.2 713.9 3.49 3.55A1-911-083-1-2 0.1267 0.5009 3.13 49.3 50.0 Failure in gage B2-911-083-1-3 0.1224 0.5009 273.3 706.2 3.53 3.46A1-911-083-1-3 0.1267 0.5008 3.10 48.8 49.5 Failure in gageB1-911-083-1-1 0.1238 0.5006 3.41 54.9 54.5 Failure in gageB1-911-083-1-2 0.1238 0.5005 3.42 55.2 54.8 Failure in gageB1-911-083-1-3 0.1238 0.5006 3.20 51.6 51.2 Failure in gage
Average 0.1253 0.5007 3.24 51.6 51.8 Average 0.1246 0.5000 3.51 3.51Std. Dev. 0.0016 0.0002 0.14 2.83 2.28 Std. Dev. 0.0032 0.0014 0.03 0.06COV, % 1.24 0.03 4.38 5.47 4.40 COV, % 2.60 0.28 0.75 1.85
Ult. Comp. Comp. Mod.Strength (0.1-0.3% strain)
Ult. Comp. Comp. Mod.Strength (0.1-0.3% strain)
Ult. Comp. Comp. Mod.Strength (0.1-0.3% strain)

187
90° (Fill) Compression Properties, -65°F (Dry)
Material Type: FGF7781-07I Test Operator: John Smith Material Type: FGF7781-07I Test Operator: Bryan MinesBatch Number: AF991103 Test Frame: Instron 4510 Batch Number: AF991102 Test Frame: Instron 4505
Test Method: SACMA SRM 1-94 Test Speed: 0.05 in/min Test Method: SACMA SRM 1-94 Test Speed: 0.05 in/minPreconditioning: as machined Control Mode: Stroke Preconditioning: as machined Control Mode: StrokeTest Conditions: -65°F/Dry Strain Gage: N/A Test Conditions: -65°F/Dry Strain Gage: One axial gage (CEA-06-125UW-350)Ply Orientation: (fill)12 FV(normalizing): 44.2% Ply Orientation: (fill)12 FV(normalizing): 44.2%Testing Facility: TCA CPT (average): 0.0104 in. Testing Facility: Intec CPT (average): 0.0104 in.
Test Date: 2/25/2000 FV(batch average): 44.9% Test Date: 2/23/2000 FV(batch average): 44.4%
Specimen Specimen Specimen Ult. Failure Specimen Specimen Specimen Load @ Load @Number Thickness Width Comp. Location Number Thickness Width 0.1% 0.3%
Load Actual Norm. & Strain Strain Actual Norm.(in.) (in.) (kips) (ksi) (ksi) Comments (in.) (in.) (lbs.) (lbs.) (msi) (msi)
A-911-082-1-1 0.1237 0.5000 4.81 77.7 77.0 Failure in gage A2-911-081-1-1 0.1261 0.4990 433.8 898.6 3.69 3.73A-911-082-1-2 0.1237 0.4999 4.96 80.2 79.4 Failure in gage B2-911-081-1-1 0.1245 0.4990 428.3 882.3 3.65 3.65A-911-082-1-3 0.1237 0.4998 4.90 79.2 78.5 Failure in gageB1-911-082-1-7 0.1253 0.5004 4.93 78.7 79.0 Failure in gageB1-911-082-1-8 0.1253 0.5003 5.00 79.8 80.1 Failure in gageB1-911-082-1-11 0.1253 0.4999 4.91 78.3 78.6 Failure in gage
Average 0.1245 0.5000 4.92 79.0 78.8 Average 0.1253 0.4990 3.67 3.69Std. Dev. 0.0009 0.0003 0.07 0.92 1.05 Std. Dev. 0.0011 0.0000 0.03 0.06COV, % 0.70 0.05 1.35 1.17 1.33 COV, % 0.90 0.00 0.76 1.66
Ult. Comp. Comp. Mod.Strength (0.1-0.3% strain)

188
90° (Fill) Compression Properties, 75°F (Dry)Material Type: FGF7781-07I Test Operator: John Smith Material Type: FGF7781-07I Test Operator: John SmithBatch Number: AF991102 Test Frame: Instron 4510 Batch Number: AF991102 Test Frame: Instron 4510
Test Method: SACMA SRM 1-94 Loading Rate: 0.05 in/min Test Method: SACMA SRM 1-94 Loading Rate: 0.05 in/minPreconditioning: as machined Control Mode: Stroke Preconditioning: as machined Control Mode: StrokeTest Conditions: RT/Dry Strain Gage: N/A Test Conditions: RT/Dry Strain Gage: One axial gage (FAE-12S-AS-S6EL-2)Ply Orientation: (fill)12 FV(normalizing): 44.2% Ply Orientation: (fill)12 FV(normalizing): 44.2% in.Testing Facility: TCA CPT (average): 0.0104 in. Testing Facility: TCA CPT (average): 0.0104
Test Date: 2/24/2000 FV(batch average): 44.4% Test Date: 3/20/2000 FV(batch average): 44.4%
Specimen Specimen Specimen Ult. Failure Specimen Specimen Specimen Load @ Load @Number Thickness Width Comp. Location Number Thickness Width 0.1% 0.3%
Load Actual Norm. & Strain Strain Actual Norm.(in.) (in.) (kips) (ksi) (ksi) Comments (in.) (in.) (lbs.) (lbs.) (msi) (msi)
A1-911-081-1-9 0.1264 0.5005 4.24 67.1 67.9 Failure in gage A2-911-081-1-3 0.1264 0.5013 290.8 766.8 3.76 3.80A1-911-081-1-10 0.1264 0.5002 4.22 66.8 67.7 Failure in gage B2-911-081-1-3 0.1248 0.4990 270.1 713.6 3.56 3.56A2-911-081-1-17 0.1264 0.5004 3.86 61.0 61.8 Failure in gageB1-911-081-1-9 0.1247 0.5009 4.20 67.3 67.2 Failure in gageB2-911-081-1-17 0.1247 0.5002 4.30 69.0 68.9 Failure in gageB2-911-081-1-18 0.1247 0.5006 4.16 66.6 66.5 Failure in gage
Average 0.1255 0.5005 4.16 66.3 66.7 Average 0.1256 0.5001 3.66 3.68Std. Dev. 0.0009 0.0003 0.16 2.71 2.51 Std. Dev. 0.0011 0.0016 0.14 0.17COV, % 0.75 0.05 3.75 4.09 3.76 COV, % 0.86 0.31 3.83 4.69
Material Type: FGF7781-07I Test Operator: John Smith, Jeremy Bucholtz Material Type: FGF7781-07I Test Operator: John SmithBatch Number: AF991103 Test Frame: Instron 4510 Batch Number: AF991103 Test Frame: Instron 4510
Test Method: SACMA SRM 1-94 Loading Rate: 0.05 in/min Test Method: SACMA SRM 1-94 Loading Rate: 0.05 in/minPreconditioning: as machined Control Mode: Stroke Preconditioning: as machined Control Mode: StrokeTest Conditions: RT/Dry Strain Gage: N/A Test Conditions: RT/Dry Strain Gage: One axial gage (FAE-12S-AS-S6EL-2)Ply Orientation: (fill)12 FV(normalizing): 44.2% Ply Orientation: (fill)12 FV(normalizing): 44.2%Testing Facility: TCA CPT (average): 0.0104 in. Testing Facility: TCA CPT (average): 0.0104 in.
Test Date: 3/13/2000, 7/28/00 FV(batch average): 44.9% Test Date: 3/20/2000 FV(batch average): 44.9%
Specimen Specimen Specimen Ult. Failure Specimen Specimen Specimen Load @ Load @Number Thickness Width Comp. Location Number Thickness Width 0.1% 0.3%
Load Actual Norm. & Strain Strain Actual Norm.(in.) (in.) (kips) (ksi) (ksi) Comments (in.) (in.) (lbs.) (lbs.) (msi) (msi)
A2-911-082-1-17 0.1223 0.5009 4.25 69.4 68.0 Failure in gage A2-911-082-1-1 0.1210 0.4994 282.3 739.3 3.78 3.67B1-911-082-1-9 0.1263 0.5008 3.99 63.0 63.8 Failure in gage B2-911-082-1-1 0.1258 0.4987 228.1 664.9 3.48 3.51B2-911-082-1-17 0.1263 0.5007 3.91 61.9 62.6 Failure in gageB2-911-082-1-18 0.1263 0.5000 3.97 62.8 63.6 Failure in gageA2-911-082-1-20 0.1223 0.5009 3.99 65.1 63.8 Failure in gageA2-911-082-1-21 0.1223 0.5002 4.12 67.4 66.0 Failure in gage
Average 0.1243 0.5006 4.04 64.9 64.6 Average 0.1234 0.4991 3.63 3.59Std. Dev. 0.0022 0.0004 0.13 2.96 2.00 Std. Dev. 0.0034 0.0005 0.21 0.11COV, % 1.79 0.08 3.10 4.56 3.09 COV, % 2.76 0.09 5.87 3.11
Material Type: FGF7781-07I Test Operator: John Smith Material Type: FGF7781-07I Test Operator: John SmithBatch Number: AF991104 Test Frame: Instron 4510 Batch Number: AF991104 Test Frame: Instron 4510
Test Method: SACMA SRM 1-94 Loading Rate: 0.05 in/min Test Method: SACMA SRM 1-94 Loading Rate: 0.05 in/minPreconditioning: as machined Control Mode: Stroke Preconditioning: as machined Control Mode: StrokeTest Conditions: RT/Dry Strain Gage: N/A Test Conditions: RT/Dry Strain Gage: One axial gage (FAE-12S-AS-S6EL-2)Ply Orientation: (fill)12 FV(normalizing): 44.2% Ply Orientation: (fill)12 FV(normalizing): 44.2%Testing Facility: TCA CPT (average): 0.0104 in. Testing Facility: TCA CPT (average): 0.0104 in.
Test Date: 3/13/2000 FV(batch average): 45.3% Test Date: 3/20/2000 FV(batch average): 45.3%
Specimen Specimen Specimen Ult. Failure Specimen Specimen Specimen Load @ Load @Number Thickness Width Comp. Location Number Thickness Width 0.1% 0.3%
Load Actual Norm. & Strain Strain Actual Norm.(in.) (in.) (kips) (ksi) (ksi) Comments (in.) (in.) (lbs.) (lbs.) (msi) (msi)
A1-911-083-1-9 0.1249 0.5008 4.28 68.5 68.5 Failure in gage A2-911-083-1-1 0.1259 0.4987 277.6 726.3 3.57 3.60A1-911-083-1-10 0.1249 0.5007 4.09 65.4 65.5 Failure in gage B2-911-083-1-1 0.1232 0.4993 270.0 710.0 3.58 3.53A2-911-083-1-17 0.1249 0.5005 3.66 58.5 58.6 Failure in gageB1-911-083-1-9 0.1244 0.5012 4.12 66.1 65.9 Failure in gageB2-911-083-1-17 0.1244 0.5005 4.29 68.8 68.6 Failure in gageB2-911-083-1-18 0.1244 0.5007 3.94 63.2 63.0 Failure in gage
Average 0.1247 0.5007 4.06 65.1 65.0 Average 0.1245 0.4990 3.58 3.57Std. Dev. 0.0003 0.0003 0.24 3.83 3.79 Std. Dev. 0.0020 0.0004 0.00 0.05COV, % 0.20 0.05 5.85 5.88 5.83 COV, % 1.58 0.09 0.11 1.47
Ult. Comp. Comp. Mod.Strength (0.1-0.3% strain)
Ult. Comp. Comp. Mod.Strength (0.1-0.3% strain)
Ult. Comp. Comp. Mod.Strength (0.1-0.3% strain)

189
90° (Fill) Compression Properties, 180°F (Dry)Material Type: FGF7781-07I Test Operator: John Smith Material Type: FGF7781-07I Test Operator: John SmithBatch Number: AF991102 Test Frame: Instron 4510 Batch Number: AF991102 Test Frame: Instron 4510
Test Method: SACMA SRM 1-94 Loading Rate: 0.05 in/min Test Method: SACMA SRM 1-94 Loading Rate: 0.05 in/minPreconditioning: as machined Control Mode: Stroke Preconditioning: as machined Control Mode: StrokeTest Conditions: 180°F/Dry Strain Gage: N/A Test Conditions: 180°F/Dry Strain Gage: One axial gage (FAE-12S-AS-S6EL-2)Ply Orientation: (fill)12 FV(normalizing): 44.2% Ply Orientation: (fill)12 FV(normalizing): 44.2%Testing Facility: TCA CPT (average): 0.0104 in. Testing Facility: TCA CPT (average): 0.0104 in.
Test Date: 3/20/2000 FV(batch average): 44.4% Test Date: 3/20/2000 FV(batch average): 44.4%
Specimen Specimen Specimen Ult. Failure Specimen Specimen Specimen Load @ Load @Number Thickness Width Comp. Location Number Thickness Width 0.1% 0.3%
Load Actual Norm. & Strain Strain Actual Norm.(in.) (in.) (kips) (ksi) (ksi) Comments (in.) (in.) (lbs.) (lbs.) (msi) (msi)
A1-911-081-1-11 0.1264 0.5003 3.33 52.6 53.3 Failure in gage A2-911-081-1-4 0.1264 0.4989 261.6 693.3 3.42 3.47A2-911-081-1-18 0.1264 0.5002 3.13 49.5 50.2 Failure in gage B2-911-081-1-4 0.1250 0.5010 269.8 717.2 3.57 3.58A2-911-081-1-19 0.1264 0.5004 3.35 52.9 53.6 Failure in gageB1-911-081-1-10 0.1247 0.5003 3.40 54.5 54.4 Failure in gageB1-911-081-1-11 0.1247 0.5009 3.54 56.7 56.6 Failure in gageB2-911-081-1-19 0.1247 0.5007 3.50 56.1 56.0 Failure in gage
Average 0.1255 0.5004 3.37 53.7 54.0 Average 0.1257 0.5000 3.50 3.52Std. Dev. 0.0009 0.0003 0.15 2.6 2.3 Std. Dev. 0.0010 0.0015 0.10 0.08COV, % 0.75 0.05 4.30 4.87 4.25 COV, % 0.77 0.30 2.99 2.22
Material Type: FGF7781-07I Test Operator: John Smith, Jeremy Bucholtz Material Type: FGF7781-07I Test Operator: John SmithBatch Number: AF991103 Test Frame: Instron 4510 Batch Number: AF991103 Test Frame: Instron 4510
Test Method: SACMA SRM 1-94 Loading Rate: 0.05 in/min Test Method: SACMA SRM 1-94 Loading Rate: 0.05 in/minPreconditioning: as machined Control Mode: Stroke Preconditioning: as machined Control Mode: StrokeTest Conditions: 180°F/Dry Strain Gage: N/A Test Conditions: 180°F/Dry Strain Gage: One axial gage (FAE-12S-AS-S6EL-2)Ply Orientation: (fill)12 FV(normalizing): 44.2% Ply Orientation: (fill)12 FV(normalizing): 44.2%Testing Facility: TCA CPT (average): 0.0104 in. Testing Facility: TCA CPT (average): 0.0104 in.
Test Date: 3/21/2000, 7/28/00 FV(batch average): 44.9% Test Date: 3/20/2000 FV(batch average): 44.9%
Specimen Specimen Specimen Ult. Failure Specimen Specimen Specimen Load @ Load @Number Thickness Width Comp. Location Number Thickness Width 0.1% 0.3%
Load Actual Norm. & Strain Strain Actual Norm.(in.) (in.) (kips) (ksi) (ksi) Comments (in.) (in.) (lbs.) (lbs.) (msi) (msi)
A2-911-082-1-18 0.1223 0.5006 3.58 58.4 57.2 Failure in gage A2-911-082-1-2 0.1214 0.5010 284.9 725.9 3.63 3.53A2-911-082-1-19 0.1223 0.5006 3.49 57.0 55.8 Failure in gage B2-911-082-1-2 0.1261 0.5038 291.3 749.8 3.61 3.65B1-911-082-1-10 0.1263 0.5005 3.36 53.1 53.8 Failure in gageB1-911-082-1-11 0.1263 0.5008 3.42 54.0 54.7 Failure in gageB2-911-082-1-19 0.1263 0.5008 3.33 52.7 53.3 Failure in gageA2-911-082-1-23 0.1223 0.5008 3.38 55.1 54.0 Failure in gage
Average 0.1243 0.5007 3.42 55.1 54.8 Average 0.1237 0.5024 3.62 3.59Std. Dev. 0.0022 0.0001 0.09 2.26 1.47 Std. Dev. 0.0033 0.0020 0.01 0.08COV, % 1.79 0.03 2.67 4.10 2.68 COV, % 2.69 0.40 0.35 2.34
Material Type: FGF7781-07I Test Operator: John Smith Material Type: FGF7781-07I Test Operator: John SmithBatch Number: AF991104 Test Frame: Instron 4510 Batch Number: AF991104 Test Frame: Instron 4510
Test Method: SACMA SRM 1-94 Loading Rate: 0.05 in/min Test Method: SACMA SRM 1-94 Loading Rate: 0.05 in/minPreconditioning: as machined Control Mode: Stroke Preconditioning: as machined Control Mode: StrokeTest Conditions: 180°F/Dry Strain Gage: N/A Test Conditions: 180°F/Dry Strain Gage: One axial gage (FAE-12S-AS-S6EL-2)Ply Orientation: (fill)12 FV(normalizing): 44.2% Ply Orientation: (fill)12 FV(normalizing): 44.2%Testing Facility: TCA CPT (average): 0.0104 in. Testing Facility: TCA CPT (average): 0.0104 in.
Test Date: 3/21/2000 FV(batch average): 45.3% Test Date: 3/20/2000 FV(batch average): 45.3%
Specimen Specimen Specimen Ult. Failure Specimen Specimen Specimen Load @ Load @Number Thickness Width Comp. Location Number Thickness Width 0.1% 0.3%
Load Actual Norm. & Strain Strain Actual Norm.(in.) (in.) (kips) (ksi) (ksi) Comments (in.) (in.) (lbs.) (lbs.) (msi) (msi)
A1-911-083-1-11 0.1249 0.5006 3.42 54.7 54.8 Failure in gage A2-911-083-1-2 0.1255 0.5039 255.0 681.3 3.37 3.39A2-911-083-1-18 0.1249 0.5005 3.04 48.6 48.6 Failure in gage B2-911-083-1-2 0.1236 0.5031 313.8 792.2 3.85 3.81A2-911-083-1-19 0.1249 0.5010 3.13 50.0 50.0 Failure in gageB1-911-083-1-10 0.1244 0.5008 3.37 54.1 53.9 Failure in gageB1-911-083-1-11 0.1244 0.5008 3.11 49.8 49.7 Failure in gageB2-911-083-1-19 0.1244 0.5009 3.41 54.8 54.6 Failure in gage
Average 0.1247 0.5008 3.25 52.0 51.9 Average 0.1245 0.5035 3.61 3.60Std. Dev. 0.0003 0.0002 0.17 2.82 2.78 Std. Dev. 0.0013 0.0005 0.34 0.30COV, % 0.20 0.03 5.36 5.42 5.36 COV, % 1.07 0.11 9.31 8.24
Ult. Comp. Comp. Mod.Strength (0.1-0.3% strain)
Ult. Comp. Comp. Mod.Strength (0.1-0.3% strain)
Ult. Comp. Comp. Mod.Strength (0.1-0.3% strain)

190
90° (Fill) Compression Properties, 180°F (Wet)Material Type: FGF7781-07I Test Operator: John Smith Material Type: FGF7781-07I Test Operator: John SmithBatch Number: AF991102 Test Frame: Instron 4510 Batch Number: AF991102 Test Frame: Instron 4510
Test Method: SACMA SRM 1-94 Loading Rate: 0.05 in/min Test Method: SACMA SRM 1-94 Loading Rate: 0.05 in/minPreconditioning: Section 3.2 of AGATE Control Mode: Stroke Preconditioning: Section 3.2 of AGATE Control Mode: StrokeTest Conditions: 180°F Strain Gage: N/A Test Conditions: 180°F Strain Gage: One axial gage (FAE-12S-AS-S6EL-2)Ply Orientation: (fill)12 FV(normalizing): 44.2% Ply Orientation: (fill)12 FV(normalizing): 44.2%Testing Facility: TCA CPT (average): 0.0104 in. Testing Facility: TCA CPT (average): 0.0104 in.
Test Date: 7/7/2000 FV(batch average): 44.4% Test Date: 6/8/2000 FV(batch average): 44.4%
Specimen Specimen Specimen Ult. Failure Specimen Specimen Specimen Load @ Load @Number Thickness Width Comp. Location Number Thickness Width 0.1% 0.3%
Load Actual Norm. & Strain Strain Actual Norm.(in.) (in.) (kips) (ksi) (ksi) Comments (in.) (in.) (lbs.) (lbs.) (msi) (msi)
A1-911-081-1-1 0.1271 0.5003 2.77 43.6 44.4 Failure in gage A2-911-081-1-5 0.1265 0.5009 262.2 676.7 3.27 3.32A1-911-081-1-2 0.1271 0.5005 2.86 44.9 45.7 Failure in gage B2-911-081-1-5 0.1250 0.5039 260.4 676.8 3.31 3.31A1-911-081-1-3 0.1271 0.5006 2.83 44.5 45.3 Failure in gageB1-911-081-1-1 0.1271 0.5008 2.75 43.2 44.0 Failure in gageB1-911-081-1-2 0.1271 0.5006 2.89 45.4 46.3 Failure in gageB1-911-081-1-3 0.1271 0.5007 2.75 43.2 44.0 Failure in gage
Average 0.1271 0.5006 2.81 44.1 44.9 Average 0.1257 0.5024 3.29 3.31Std. Dev. 0.0000 0.0002 0.06 0.95 0.96 Std. Dev. 0.0011 0.0021 0.03 0.00COV, % 0.00 0.03 2.14 2.15 2.15 COV, % 0.88 0.42 0.79 0.10
Material Type: FGF7781-07I Test Operator: John Smith Material Type: FGF7781-07I Test Operator: John SmithBatch Number: AF991103 Test Frame: Instron 4510 Batch Number: AF991103 Test Frame: Instron 4510
Test Method: SACMA SRM 1-94 Loading Rate: 0.05 in/min Test Method: SACMA SRM 1-94 Loading Rate: 0.05 in/minPreconditioning: Section 3.2 of AGATE Control Mode: Stroke Preconditioning: Section 3.2 of AGATE Control Mode: StrokeTest Conditions: 180°F Strain Gage: N/A Test Conditions: 180°F Strain Gage: One axial gage (FAE-12S-AS-S6EL-2)Ply Orientation: (fill)12 FV(normalizing): 44.2% Ply Orientation: (fill)12 FV(normalizing): 44.2%Testing Facility: TCA CPT (average): 0.0104 in. Testing Facility: TCA CPT (average): 0.0104 in.
Test Date: 7/7/2000 FV(batch average): 44.9% Test Date: 6/8/2000 FV(batch average): 44.9%
Specimen Specimen Specimen Ult. Failure Specimen Specimen Specimen Load @ Load @Number Thickness Width Comp. Location Number Thickness Width 0.1% 0.3%
Load Actual Norm. & Strain Strain Actual Norm.(in.) (in.) (kips) (ksi) (ksi) Comments (in.) (in.) (lbs.) (lbs.) (msi) (msi)
A2-911-082-1-3 0.1220 0.4990 235.1 650.9 3.42 3.34B2-911-082-1-3 0.1265 0.5006 263.1 694.2 3.40 3.45
B1-911-082-1-1 0.1290 0.5004 2.63 40.8 42.1 Failure in gageB1-911-082-1-2 0.1290 0.5001 2.56 39.7 41.0 Failure in gageB1-911-082-1-3 0.1290 0.5002 2.40 37.1 38.4 Failure in gage
Average 0.1290 0.5002 2.53 39.2 40.5 Average 0.1242 0.4998 3.41 3.39Std. Dev. 0.0000 0.0002 0.12 1.86 1.92 Std. Dev. 0.0032 0.0011 0.01 0.08COV, % 0.00 0.03 4.76 4.75 4.75 COV, % 2.56 0.22 0.25 2.31
Material Type: FGF7781-07I Test Operator: John Smith Material Type: FGF7781-07I Test Operator: John SmithBatch Number: AF991104 Test Frame: Instron 4510 Batch Number: AF991104 Test Frame: Instron 4510
Test Method: SACMA SRM 1-94 Loading Rate: 0.05 in/min Test Method: SACMA SRM 1-94 Loading Rate: 0.05 in/minPreconditioning: Section 3.2 of AGATE Control Mode: Stroke Preconditioning: per Section 3.2 of AGATE MetControl Mode: StrokeTest Conditions: 180°F Strain Gage: N/A Test Conditions: 180°F Strain Gage: One axial gage (FAE-12S-AS-S6EL-2)Ply Orientation: (fill)12 FV(normalizing): 44.2% Ply Orientation: (fill)12 FV(normalizing): 44.2%Testing Facility: TCA CPT (average): 0.0104 in. Testing Facility: TCA CPT (average): 0.0104 in.
Test Date: 7/7/2000 FV(batch average): 45.3% Test Date: 6/8/2000 FV(batch average): 45.3%
Specimen Specimen Specimen Ult. Failure Specimen Specimen Specimen Load @ Load @Number Thickness Width Comp. Location Number Thickness Width 0.1% 0.3%
Load Actual Norm. & Strain Strain Actual Norm.(in.) (in.) (kips) (ksi) (ksi) Comments (in.) (in.) (lbs.) (lbs.) (msi) (msi)
A1-911-083-1-1 0.1253 0.5001 2.88 45.9 46.1 Failure in gage A2-911-083-1-3 0.1250 0.5012 265.1 696.8 3.45 3.45A1-911-083-1-2 0.1253 0.5006 2.70 43.1 43.2 Failure in gage B2-911-083-1-3 0.1239 0.5012 252.1 672.1 3.38 3.36A1-911-083-1-3 0.1253 0.5007 2.73 43.5 43.7 Failure in gageB1-911-083-1-1 0.1268 0.4999 2.80 44.2 44.9 Failure in gageB1-911-083-1-2 0.1268 0.5002 2.74 43.3 44.0 Failure in gageB1-911-083-1-3 0.1268 0.5002 2.70 42.5 43.2 Failure in gage
Average 0.1261 0.5003 2.76 43.7 44.2 Average 0.1244 0.5012 3.41 3.40Std. Dev. 0.0008 0.0003 0.07 1.19 1.12 Std. Dev. 0.0007 0.0000 0.05 0.07COV, % 0.65 0.06 2.50 2.72 2.54 COV, % 0.60 0.01 1.35 1.94
Ult. Comp. Comp. Mod.Strength (0.1-0.3% strain)
Ult. Comp. Comp. Mod.Strength (0.1-0.3% strain)
Ult. Comp. Comp. Mod.Strength (0.1-0.3% strain)

191
90° Compression - Ultimate Strength(180°F/Wet)
Toray Composites (America), Inc.FAA Project No: TC 1616SE-15 Test Plan Document: AGATE Material Qualification Methodology for
TCA Internal Specification: TCSPF-T-FG03 Epoxy-Based Prepreg Composite Material SystemsMaterial Type: FGF7781-07I Test Date: 7/7/2000, 12/15/2000Batch Number: AF991103 Test Operator: John Smith, Jeremy Buckholtz
Test Method: SACMA SRM 1-94 Test Frame: Instron 4510Specimen Preconditioning: per Section 3.2 of AGATE Methodology Loading Rate: 0.05 in/min
Test Conditions: 180°F Control Mode: StrokePly Orientation: (fill)12 Strain Gage: N/A
Panel Fabrication: TCA - vacuum bagged at 270°F Fiber Volume(normalizing): 44.2%Testing Facility: Toray Composites (America) CPT (average): 0.0104 in.
Fiber Volume(batch average): 44.9%
Specimen Specimen Specimen Ultimate Test DateNumber Thickness Width Compression
Load Actual Norm.(in.) (in.) (kips) (ksi) (ksi)
A1-911-082-1-4 0.1230 0.50010 2.702 43.9 43.3 12/15/2000A1-911-082-1-5 0.1255 0.49998 2.524 40.2 40.5 12/15/2000A1-911-082-1-6 0.1240 0.50033 2.688 43.3 43.0 12/15/2000A2-911-082-1-2 0.1245 0.50062 2.429 39.0 38.9 12/15/2000A2-911-082-1-3 0.1245 0.50100 2.595 41.6 41.5 12/15/2000A2-911-082-1-4 0.1240 0.50100 2.559 41.2 40.9 12/15/2000B1-911-082-1-1 0.1290 0.50036 2.631 40.8 42.1 7/7/2000B1-911-082-1-2 0.1290 0.50005 2.559 39.7 41.0 7/7/2000B1-911-082-1-3 0.1290 0.50017 2.396 37.1 38.4 7/7/2000
Average 0.1258 0.50040 2.565 40.8 41.1Std. Dev. 0.0025 0.00039 0.105 2.10 1.68COV, % 1.96 0.08 4.09 5.16 4.09
Ult. Compression Failure LocationStrength &
Comments
Failure in gage areaFailure in gage areaFailure in gage area
Failure in gage areaFailure in gage areaFailure in gage area
Failure in gage areaFailure in gage areaFailure in gage area

192
In-plane (Iosipescu) Shear Properties, -65°F (Dry)
Material Type: FGF7781-07I Test Operator: Bryan MinesBatch Number: AF991102 Test Frame: H
Test Method: ASTM D5379 Loading Rate: 0.05 in/minSpecimen Preconditioning: as machined Control Mode: Stroke
Test Conditions: -65°F/Dry Strain Gage: One biaxial gage (EA-06-062TW-350)Ply Orientation: (0/90)3S
Testing Facility: Intec CPT (average): 0.0104 in.Test Date: 2/23/2000 Fiber Volume(batch average): 44.4%
Specimen Specimen Notch Ultimate In-plane Shear IPS Modulus(1)Number Thickness Width Load Strength (0.25-0.65%)(2)
Actual(in.) (in.) (lbs.) (ksi) (msi)
A1-911-081-1-1 0.1226 0.4590 1340 23.8 0.786A1-911-081-2-1 0.1232 0.4590 1310 23.2 0.706B1-911-081-1-1 0.1218 0.4570 1280 23.0 0.707B1-911-081-2-1 0.1241 0.4510 1270 22.7 0.680A1-911-081-3-1 0.1228 0.4590 1400 24.8 -B1-911-081-3-1 0.1221 0.4520 1370 24.8 -
Average 0.1228 0.4562 1328 23.7 0.720Std. Dev. 0.0008 0.0037 51 0.93 0.046COV, % 0.67 0.81 3.85 3.94 6.38
(1) Modulus is determined to be the slope of the Stress-Shear Strain curve.(2) 0.25 ~ 0.65% strain range per ASTM D5379-98, Section 12.3.1
Shear failure in gageShear failure in gage
Shear failure in gageShear failure in gageShear failure in gageShear failure in gage
Failure Location&
Comments
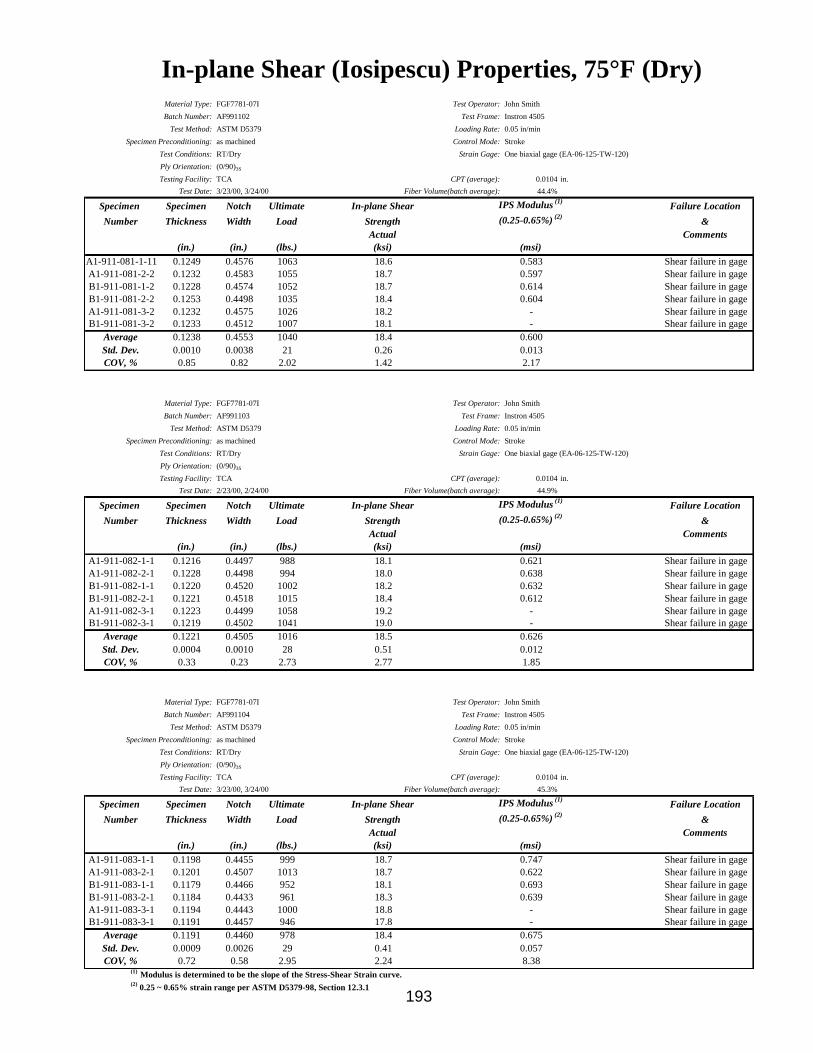
193
(1) Modulus is determined to be the slope of the Stress-Shear Strain curve.(2) 0.25 ~ 0.65% strain range per ASTM D5379-98, Section 12.3.1
In-plane Shear (Iosipescu) Properties, 75°F (Dry)Material Type: FGF7781-07I Test Operator: John SmithBatch Number: AF991102 Test Frame: Instron 4505
Test Method: ASTM D5379 Loading Rate: 0.05 in/minSpecimen Preconditioning: as machined Control Mode: Stroke
Test Conditions: RT/Dry Strain Gage: One biaxial gage (EA-06-125-TW-120)Ply Orientation: (0/90)3S
Testing Facility: TCA CPT (average): 0.0104 in.Test Date: 3/23/00, 3/24/00 Fiber Volume(batch average): 44.4%
Specimen Specimen Notch Ultimate In-plane Shear IPS Modulus (1)
Number Thickness Width Load Strength (0.25-0.65%) (2)
Actual(in.) (in.) (lbs.) (ksi) (msi)
A1-911-081-1-11 0.1249 0.4576 1063 18.6 0.583A1-911-081-2-2 0.1232 0.4583 1055 18.7 0.597B1-911-081-1-2 0.1228 0.4574 1052 18.7 0.614B1-911-081-2-2 0.1253 0.4498 1035 18.4 0.604A1-911-081-3-2 0.1232 0.4575 1026 18.2 -B1-911-081-3-2 0.1233 0.4512 1007 18.1 -
Average 0.1238 0.4553 1040 18.4 0.600Std. Dev. 0.0010 0.0038 21 0.26 0.013COV, % 0.85 0.82 2.02 1.42 2.17
Material Type: FGF7781-07I Test Operator: John SmithBatch Number: AF991103 Test Frame: Instron 4505
Test Method: ASTM D5379 Loading Rate: 0.05 in/minSpecimen Preconditioning: as machined Control Mode: Stroke
Test Conditions: RT/Dry Strain Gage: One biaxial gage (EA-06-125-TW-120)Ply Orientation: (0/90)3S
Testing Facility: TCA CPT (average): 0.0104 in.Test Date: 2/23/00, 2/24/00 Fiber Volume(batch average): 44.9%
Specimen Specimen Notch Ultimate In-plane Shear IPS Modulus (1)
Number Thickness Width Load Strength (0.25-0.65%) (2)
Actual(in.) (in.) (lbs.) (ksi) (msi)
A1-911-082-1-1 0.1216 0.4497 988 18.1 0.621A1-911-082-2-1 0.1228 0.4498 994 18.0 0.638B1-911-082-1-1 0.1220 0.4520 1002 18.2 0.632B1-911-082-2-1 0.1221 0.4518 1015 18.4 0.612A1-911-082-3-1 0.1223 0.4499 1058 19.2 -B1-911-082-3-1 0.1219 0.4502 1041 19.0 -
Average 0.1221 0.4505 1016 18.5 0.626Std. Dev. 0.0004 0.0010 28 0.51 0.012COV, % 0.33 0.23 2.73 2.77 1.85
Material Type: FGF7781-07I Test Operator: John SmithBatch Number: AF991104 Test Frame: Instron 4505
Test Method: ASTM D5379 Loading Rate: 0.05 in/minSpecimen Preconditioning: as machined Control Mode: Stroke
Test Conditions: RT/Dry Strain Gage: One biaxial gage (EA-06-125-TW-120)Ply Orientation: (0/90)3S
Testing Facility: TCA CPT (average): 0.0104 in.Test Date: 3/23/00, 3/24/00 Fiber Volume(batch average): 45.3%
Specimen Specimen Notch Ultimate In-plane Shear IPS Modulus (1)
Number Thickness Width Load Strength (0.25-0.65%) (2)
Actual(in.) (in.) (lbs.) (ksi) (msi)
A1-911-083-1-1 0.1198 0.4455 999 18.7 0.747A1-911-083-2-1 0.1201 0.4507 1013 18.7 0.622B1-911-083-1-1 0.1179 0.4466 952 18.1 0.693B1-911-083-2-1 0.1184 0.4433 961 18.3 0.639A1-911-083-3-1 0.1194 0.4443 1000 18.8 -B1-911-083-3-1 0.1191 0.4457 946 17.8 -
Average 0.1191 0.4460 978 18.4 0.675Std. Dev. 0.0009 0.0026 29 0.41 0.057COV, % 0.72 0.58 2.95 2.24 8.38
Failure Location&
Comments
Shear failure in gageShear failure in gageShear failure in gageShear failure in gageShear failure in gageShear failure in gage
Failure Location&
Comments
Shear failure in gageShear failure in gageShear failure in gageShear failure in gageShear failure in gageShear failure in gage
Failure Location&
Comments
Shear failure in gageShear failure in gage
Shear failure in gageShear failure in gageShear failure in gageShear failure in gage

194
(1) Modulus is determined to be the slope of the Stress-Shear Strain curve.(2) 0.25 ~ 0.65% strain range per ASTM D5379-98, Section 12.3.1
In-plane Shear (Iosipescu) Properties, 180°F (Dry)Material Type: FGF7781-07I Test Operator: John SmithBatch Number: AF991102 Test Frame: Instron 4505
Test Method: ASTM D5379 Loading Rate: 0.05 in/minSpecimen Preconditioning: as machined Control Mode: Stroke
Test Conditions: 180°F/Dry Strain Gage: One biaxial gage (EA-06-125-TW-120)Ply Orientation: (0/90)3S
Testing Facility: TCA CPT (average): 0.0104 in.Test Date: 3/16/2000 Fiber Volume(batch average): 44.4%
Specimen Specimen Notch Ultimate In-plane Shear IPS Modulus (1)
Number Thickness Width Load Strength (0.25-0.65%) (2)
Actual(in.) (in.) (lbs.) (ksi) (msi)
A1-911-081-1-3 0.1232 0.4572 879 15.6 0.561A1-911-081-2-3 0.1238 0.4557 881 15.6 0.515B1-911-081-1-3 0.1243 0.4574 862 15.2 0.504B1-911-081-2-3 0.1270 0.4499 844 14.8 0.513B1-911-081-3-3 0.1250 0.4503 855 15.2 -A1-911-081-3-3 0.1240 0.4572 856 15.1 -
Average 0.1245 0.4546 863 15.2 0.523Std. Dev. 0.0013 0.0036 14 0.32 0.026COV, % 1.08 0.78 1.68 2.12 4.90
Material Type: FGF7781-07I Test Operator: John SmithBatch Number: AF991103 Test Frame: Instron 4505
Test Method: ASTM D5379 Loading Rate: 0.05 in/minSpecimen Preconditioning: as machined Control Mode: Stroke
Test Conditions: 180°F/Dry Strain Gage: One biaxial gage (EA-06-125-TW-120)Ply Orientation: (0/90)3S
Testing Facility: TCA CPT (average): 0.0104 in.Test Date: 3/16/2000 Fiber Volume(batch average): 44.9%
Specimen Specimen Notch Ultimate In-plane Shear IPS Modulus (1)
Number Thickness Width Load Strength (0.25-0.65%) (2)
Actual(in.) (in.) (lbs.) (ksi) (msi)
A1-911-082-1-2 0.1224 0.4499 863 15.7 0.519A1-911-082-2-2 0.1235 0.4501 835 15.0 0.556B1-911-082-1-2 0.1226 0.4508 869 15.7 0.570B1-911-082-2-2 0.1228 0.4508 857 15.5 0.574A1-911-082-3-2 0.1230 0.4508 872 15.7 -B1-911-082-3-2 0.1230 0.4499 862 15.6 -
Average 0.1229 0.4504 860 15.5 0.555Std. Dev. 0.0004 0.0005 13 0.27 0.025COV, % 0.33 0.10 1.55 1.75 4.52
Material Type: FGF7781-07I Test Operator: John SmithBatch Number: AF991104 Test Frame: Instron 4505
Test Method: ASTM D5379 Loading Rate: 0.05 in/minSpecimen Preconditioning: as machined Control Mode: Stroke
Test Conditions: 180°F/Dry Strain Gage: One biaxial gage (EA-06-125-TW-120)Ply Orientation: (0/90)3S
Testing Facility: TCA CPT (average): 0.0104 in.Test Date: 3/16/2000 Fiber Volume(batch average): 45.3%
Specimen Specimen Notch Ultimate In-plane Shear IPS Modulus (1)
Number Thickness Width Load Strength (0.25-0.65%) (2)
Actual(in.) (in.) (lbs.) (ksi) (msi)
A1-911-083-1-2 0.1206 0.4455 846 15.7 0.540A1-911-083-2-2 0.1215 0.4434 820 15.2 0.506B1-911-083-1-2 0.1180 0.4463 780 14.8 0.561B1-911-083-2-2 0.1181 0.4438 801 15.3 0.535A1-911-083-3-2 0.1210 0.4433 834 15.5 -B1-911-083-3-2 0.1190 0.4445 792 15.0 -
Average 0.1197 0.4445 812 15.3 0.536Std. Dev. 0.0015 0.0012 25 0.35 0.023COV, % 1.29 0.27 3.13 2.26 4.23
Shear failure in gageShear failure in gage
Shear failure in gageShear failure in gageShear failure in gageShear failure in gage
Failure Location&
Comments
Shear failure in gageShear failure in gageShear failure in gageShear failure in gage
Comments
Shear failure in gageShear failure in gage
Shear failure in gageShear failure in gage
Failure Location&
Shear failure in gageShear failure in gageShear failure in gageShear failure in gage
Failure Location&
Comments

195
In-plane Shear (Iosipescu) Properties, 180°F (Wet)Material Type: FGF7781-07I Test Operator: John SmithBatch Number: AF991102 Test Frame: Instron 4505
Test Method: ASTM D5379 Loading Rate: 0.05 in/minSpecimen Preconditioning: per Section 3.2 of AGATE Methodology Control Mode: Stroke
Test Conditions: 180°F Strain Gage: One biaxial gage (EA-06-125-TW-120)Ply Orientation: (0/90)3S
Testing Facility: TCA CPT (average): 0.0104 in.Test Date: 6/6/00, 6/7/00 Fiber Volume(batch average): 44.4%
Specimen Specimen Notch Ultimate In-plane Shear IPS Modulus (1)
Number Thickness Width Load Strength (0.25-0.65%) (2)
Actual(in.) (in.) (lbs.) (ksi) (msi)
A1-911-081-1-4 0.1239 0.4574 666 11.8 0.434A1-911-081-1-5 0.1244 0.4588 656 11.5 0.589B1-911-081-1-4 0.1258 0.4580 666 11.6 0.441B1-911-081-1-5 0.1262 0.4587 666 11.5 0.476A1-911-081-1-6 0.1246 0.4578 676 11.9 -B1-911-081-1-6 0.1262 0.4577 668 11.6 -
Average 0.1252 0.4580 667 11.6 0.485Std. Dev. 0.0010 0.0006 6 0.14 0.072COV, % 0.81 0.12 0.95 1.23 14.79
Material Type: FGF7781-07I Test Operator: John SmithBatch Number: AF991103 Test Frame: Instron 4505
Test Method: ASTM D5379 Loading Rate: 0.05 in/minSpecimen Preconditioning: per Section 3.2 of AGATE Methodology Control Mode: Stroke
Test Conditions: 180°F Strain Gage: One biaxial gage (EA-06-125-TW-120)Ply Orientation: (0/90)3S
Testing Facility: TCA CPT (average): 0.0104 in.Test Date: 6/6/00, 6/7/00 Fiber Volume(batch average): 44.9%
Specimen Specimen Notch Ultimate In-plane Shear IPS Modulus (1)
Number Thickness Width Load Strength (0.25-0.65%) (2)
Actual(in.) (in.) (lbs.) (ksi) (msi)
A1-911-082-1-3 0.1233 0.4501 653 11.8 0.450A1-911-082-1-4 0.1240 0.4502 650 11.6 0.434B1-911-082-1-3 0.1235 0.4512 645 11.6 0.435B1-911-082-1-4 0.1243 0.4510 644 11.5 0.447A1-911-082-1-5 0.1248 0.4499 665 11.8 -B1-911-082-1-5 0.1246 0.4522 662 11.8 -
Average 0.1241 0.4507 653 11.7 0.442Std. Dev. 0.0006 0.0009 9 0.13 0.008COV, % 0.50 0.19 1.35 1.14 1.85
Material Type: FGF7781-07I Test Operator: John SmithBatch Number: AF991104 Test Frame: Instron 4505
Test Method: ASTM D5379 Loading Rate: 0.05 in/minSpecimen Preconditioning: per Section 3.2 of AGATE Methodology Control Mode: Stroke
Test Conditions: 180°F Strain Gage: One biaxial gage (EA-06-125-TW-120)Ply Orientation: (0/90)3S
Testing Facility: TCA CPT (average): 0.0104 in.Test Date: 6/6/00, 6/7/00 Fiber Volume(batch average): 45.3%
Specimen Specimen Notch Ultimate In-plane Shear IPS Modulus (1)
Number Thickness Width Load Strength (0.25-0.65%) (2)
Actual(in.) (in.) (lbs.) (ksi) (msi)
A1-911-083-1-3 0.1219 0.4447 631 11.6 0.439A1-911-083-1-4 0.1226 0.4452 631 11.6 0.420B1-911-083-1-3 0.1191 0.4437 611 11.6 0.452B1-911-083-1-4 0.1204 0.4438 629 11.8 0.463A1-911-083-1-5 0.1226 0.4471 638 11.6 -B1-911-083-1-5 0.1217 0.4459 633 11.7 -
Average 0.1214 0.4450 629 11.6 0.444Std. Dev. 0.0014 0.0013 9 0.08 0.018COV, % 1.13 0.29 1.47 0.66 4.17
Shear failure in gageShear failure in gage
Shear failure in gageShear failure in gageShear failure in gageShear failure in gage
Failure Location&
Comments
Shear failure in gageShear failure in gageShear failure in gageShear failure in gage
Comments
Shear failure in gageShear failure in gage
Shear failure in gageShear failure in gage
Failure Location&
Shear failure in gageShear failure in gageShear failure in gageShear failure in gage
Failure Location&
Comments
(1) Modulus is determined to be the slope of the Stress-Shear Strain curve.(2) 0.25 ~ 0.65% strain range per ASTM D5379-98, Section 12.3.1

196
In-plane Shear (Iosipescu) Strength, Fluid Sensitivity Fluid: Jet Fuel
Material Type: FGF7781-07I Test Operator: John SmithBatch Number: AF991102 Test Frame: Instron 4505
Test Method: ASTM D5379 Loading Rate: 0.05 in/minSpecimen Preconditioning: at RT for 500 hrs Control Mode: Stroke
Test Temperature: 180°F Strain Gage: N/APly Orientation: (0/90)3S
Testing Facility: TCA CPT (average): 0.0104 in.Test Date: 3/9/2000 Fiber Volume(batch average): 44.4%
Specimen Specimen Notch Ultimate In-plane ShearNumber Thickness Width Load Strength
Actual(in.) (in.) (lbs.) (ksi)
A1-911-081-1-9 0.1260 0.4580 886 15.4A1-911-081-2-9 0.1260 0.4580 819 14.2A1-911-081-3-9 0.1250 0.4586 837 14.6B1-911-081-1-9 0.1250 0.4574 839 14.7B1-911-081-2-9 0.1270 0.4521 862 15.0
Average 0.1258 0.4568 849 14.8Std. Dev. 0.0008 0.0027 26 0.44COV, % 0.67 0.59 3.05 2.98
Fluid: Hydraulic FluidMaterial Type: FGF7781-07I Test Operator: John SmithBatch Number: AF991102 Test Frame: Instron 4505
Test Method: ASTM D5379 Loading Rate: 0.05 in/minSpecimen Preconditioning: at RT for 60 - 90 minutes Control Mode: Stroke
Test Temperature: 180°F Strain Gage: N/APly Orientation: (0/90)3S
Testing Facility: TCA CPT (average): 0.0104 in.Test Date: 3/9/2000 Fiber Volume(batch average): 44.4%
Specimen Specimen Notch Ultimate In-plane ShearNumber Thickness Width Load Strength
Actual(in.) (in.) (lbs.) (ksi)
A1-911-081-1-8 0.1250 0.4582 871 15.2A1-911-081-2-8 0.1250 0.4575 843 14.7A1-911-081-3-8 0.1250 0.4579 836 14.6B1-911-081-1-8 0.1260 0.4579 841 14.6B1-911-081-2-8 0.1280 0.4509 825 14.3
Average 0.1258 0.4564 843 14.7Std. Dev. 0.0013 0.0031 17 0.33COV, % 1.04 0.68 1.98 2.24
Fluid: MEK SolventMaterial Type: FGF7781-07I Test Operator: John SmithBatch Number: AF991102 Test Frame: Instron 4505
Test Method: ASTM D5379 Loading Rate: 0.05 in/minSpecimen Preconditioning: at RT for 60 - 90 minutes Control Mode: Stroke
Test Temperature: RT Strain Gage: N/APly Orientation: (0/90)3S
Testing Facility: TCA CPT (average): 0.0104 in.Test Date: 3/23/2000 Fiber Volume(batch average): 44.4%
Specimen Specimen Notch Ultimate In-plane ShearNumber Thickness Width Load Strength
Actual(in.) (in.) (lbs.) (ksi)
A1-911-081-1-7 0.1248 0.4578 1048 18.3A1-911-081-2-7 0.1254 0.4577 1061 18.5A1-911-081-3-7 0.1255 0.4571 1002 17.5B1-911-081-1-7 0.1264 0.4571 1045 18.1B1-911-081-2-7 0.1290 0.4509 1038 17.8
Average 0.1262 0.4561 1039 18.0Std. Dev. 0.0017 0.0029 22 0.40COV, % 1.32 0.64 2.14 2.24
Failure Location&
Comments
Shear failure in gageShear failure in gageShear failure in gageShear failure in gageShear failure in gage
Failure Location&
Comments
Shear failure in gageShear failure in gageShear failure in gageShear failure in gageShear failure in gage
Failure Location&
Shear failure in gageShear failure in gageShear failure in gage
Comments
Shear failure in gageShear failure in gage

197
Apparent Interlaminar Shear Strength, 75°F (Dry)
Material Type: FGF7781-07I Test Operator: John SmithBatch Number: AF991102 Test Frame: Instron 4510
Test Method: ASTM D2344 Loading Rate: 0.05 in/minSpecimen Preconditioning: as machined Control Mode: Stroke
Test Conditions: RT/Dry Strain Gage: N/APly Orientation: (warp)10
Testing Facility: TCA CPT (average): 0.0104 in.Test Date: 3/10/2000 Fiber Volume(batch average): 44.4%
Specimen Specimen Specimen Span: Ultimate Short BeamNumber Depth Width Thickness Load Shear
Ratio Strength(in.) (in.) (kips) (ksi)
A1-911-081-1-4 0.1084 0.2518 5:1 274 7.54A1-911-081-1-5 0.1084 0.2519 5:1 288 7.90A1-911-081-1-6 0.1080 0.2518 5:1 291 8.01B1-911-081-1-1 0.1041 0.2517 5:1 329 9.41B1-911-081-1-2 0.1037 0.2520 5:1 330 9.46B1-911-081-1-3 0.1039 0.2519 5:1 319 9.15
Average 0.1061 0.2518 305 8.58Std. Dev. 0.0024 0.0001 24 0.855COV, % 2.24 0.03 7.80 9.96
Material Type: FGF7781-07I Test Operator: John SmithBatch Number: AF991103 Test Frame: Instron 4510
Test Method: ASTM D2344 Loading Rate: 0.05 in/minSpecimen Preconditioning: as machined Control Mode: Stroke
Test Conditions: RT/Dry Strain Gage: N/APly Orientation: (warp)10
Testing Facility: TCA CPT (average): 0.0104 in.Test Date: 3/22/2000 Fiber Volume(batch average): 44.9%
Specimen Specimen Specimen Span: Ultimate Short BeamNumber Depth Width Thickness Load Shear
Ratio Strength(in.) (in.) (kips) (ksi)
A1-911-082-1-1 0.1042 0.2508 5:1 281 8.06A1-911-082-1-2 0.1038 0.2509 5:1 320 9.22A1-911-082-1-3 0.1042 0.2508 5:1 294 8.45B1-911-082-1-1 0.1044 0.2515 5:1 312 8.92B1-911-082-1-2 0.1041 0.2514 5:1 318 9.11B1-911-082-1-3 0.1047 0.2514 5:1 313 8.91
Average 0.1042 0.2511 306 8.78Std. Dev. 0.0003 0.0003 15 0.439COV, % 0.30 0.13 5.04 5.01
Material Type: FGF7781-07I Test Operator: John SmithBatch Number: AF991104 Test Frame: Instron 4510
Test Method: ASTM D2344 Loading Rate: 0.05 in/minSpecimen Preconditioning: as machined Control Mode: Stroke
Test Conditions: RT/Dry Strain Gage: N/APly Orientation: (warp)10
Testing Facility: TCA CPT (average): 0.0104 in.Test Date: 3/22/2000 Fiber Volume(batch average): 45.3%
Specimen Specimen Specimen Span: Ultimate Short BeamNumber Depth Width Thickness Load Shear
Ratio Strength(in.) (in.) (kips) (ksi)
A1-911-083-1-1 0.0988 0.2522 5:1 286 8.60A1-911-083-1-2 0.0987 0.2522 5:1 274 8.25A1-911-083-1-3 0.0977 0.2521 5:1 312 9.51B1-911-083-1-1 0.1065 0.2517 5:1 310 8.68B1-911-083-1-2 0.1052 0.2517 5:1 314 8.91B1-911-083-1-3 0.1060 0.2518 5:1 311 8.73
Average 0.1021 0.2519 301 8.78Std. Dev. 0.0041 0.0002 17 0.419COV, % 4.05 0.10 5.68 4.77
Shear FailureShear FailureShear Failure
Comments
Shear FailureShear FailureShear Failure
Shear FailureShear Failure
Failure Location&
Shear FailureShear FailureShear FailureShear Failure
Shear Failure
Failure Location&
Comments
Shear FailureShear FailureShear FailureShear Failure
Failure Location&
Comments
Shear Failure

198
APPENDIX G. DATES OF PANEL MANUFACTURE AND COPY OF FAA FORM 8130-3
199

200

201

202

203

204

205

206

207

208

209

210

211

212

213

214

215

216

217

218

219

220

221

222

223

224

225

226

227

228

229

230

231

232

233

234

235

236

237

238

239

240

241

242

243

244

245