Embed Size (px)
Citation preview
Advanced Higher
STATISTICS
Linear Regression
To see if there is a relationship between two variables, we draw a scatter-graph. It is then possible to draw a ‘best-fit’ line through the
points on the graph. To draw the straight line, we try to have as many points as possible on either side of the line.
This is pretty difficult so we calculate a line of regression instead: this is called linear regression.
Advanced Higher
STATISTICS
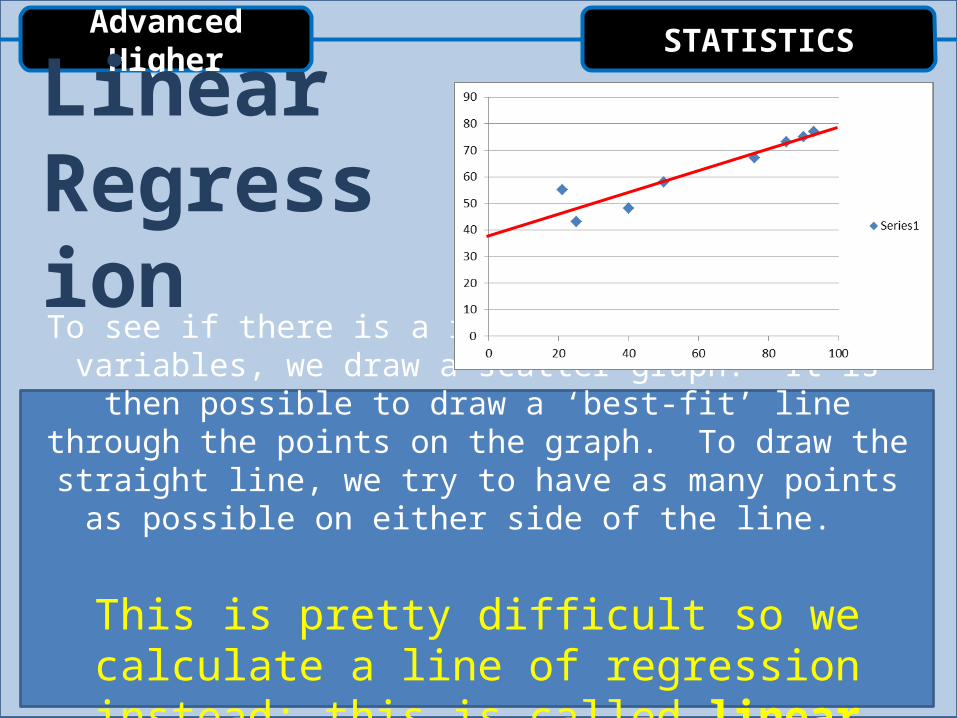
The formula for drawing the linear regression
The equation for a straight line is Y = a + bX
·‘a’ is known as the ‘intercept’. oIt is given by the formula: a = ӯ - bẊ
·‘b’ is the ‘regression coefficient’
·It is given by the formula: b = ∑(Ẋ-X)(y-ӯ) ∑(X-Ẋ)2
Advanced Higher
STATISTICS
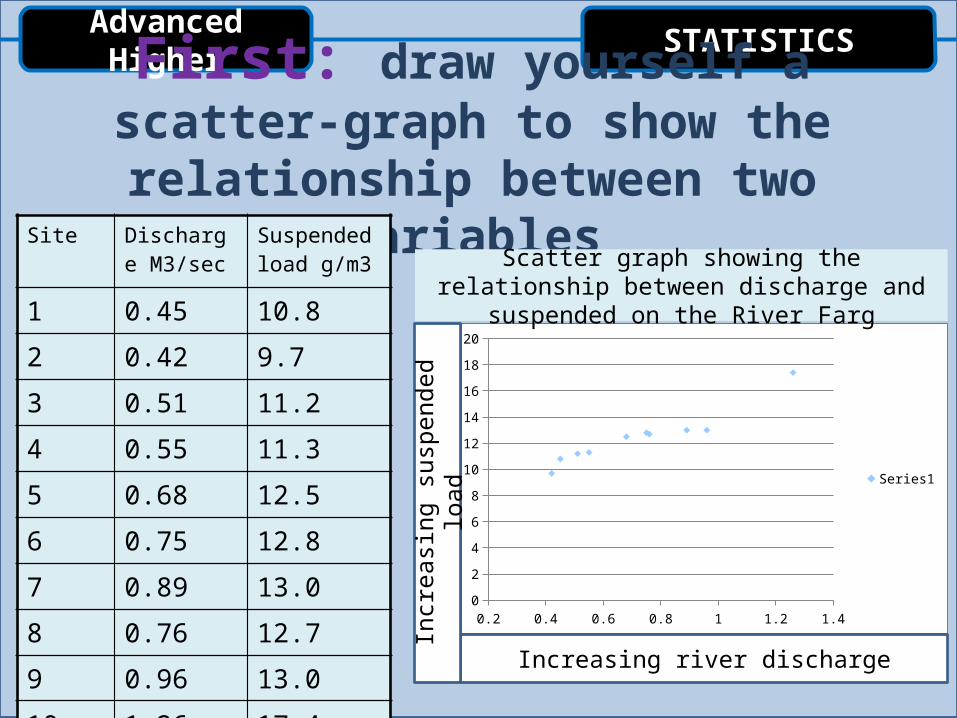
First: draw yourself a scatter-graph to show the relationship between two
variablesSite Discharge M3/sec
Suspended load g/m3
1 0.45 10.8
2 0.42 9.7
3 0.51 11.2
4 0.55 11.3
5 0.68 12.5
6 0.75 12.8
7 0.89 13.0
8 0.76 12.7
9 0.96 13.0
10 1.26 17.4
0.2 0.4 0.6 0.8 1 1.2 1.40
2
4
6
8
10
12
14
16
18
20
Series1
Increasing river discharge
Incr
easi
ng s
uspe
nded
load
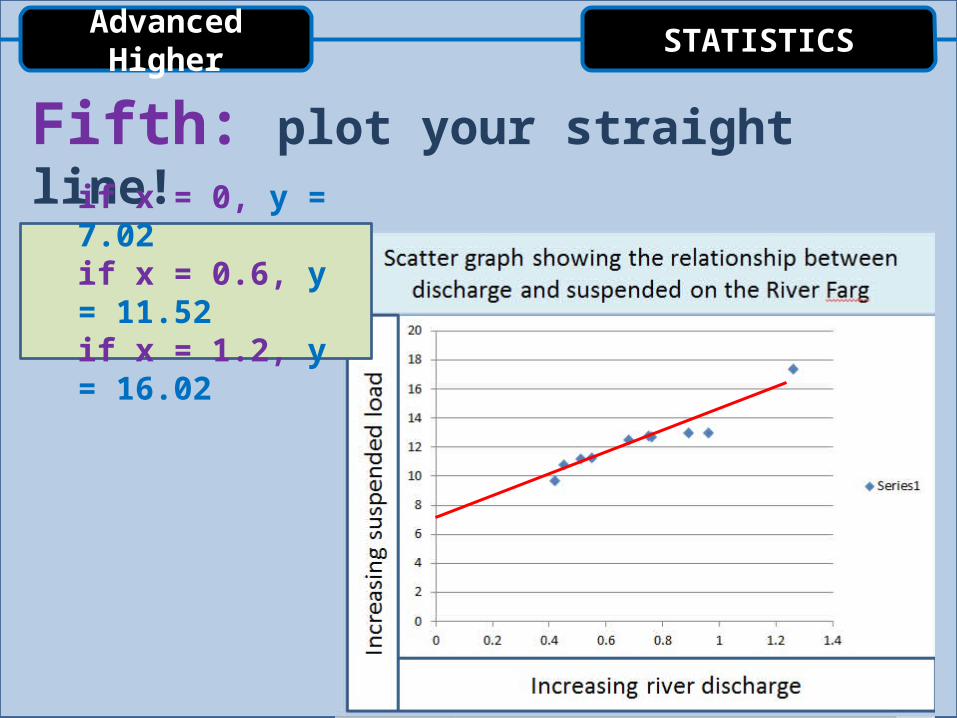
Scatter graph showing the relationship between discharge and suspended on the River Farg
Advanced Higher
STATISTICS
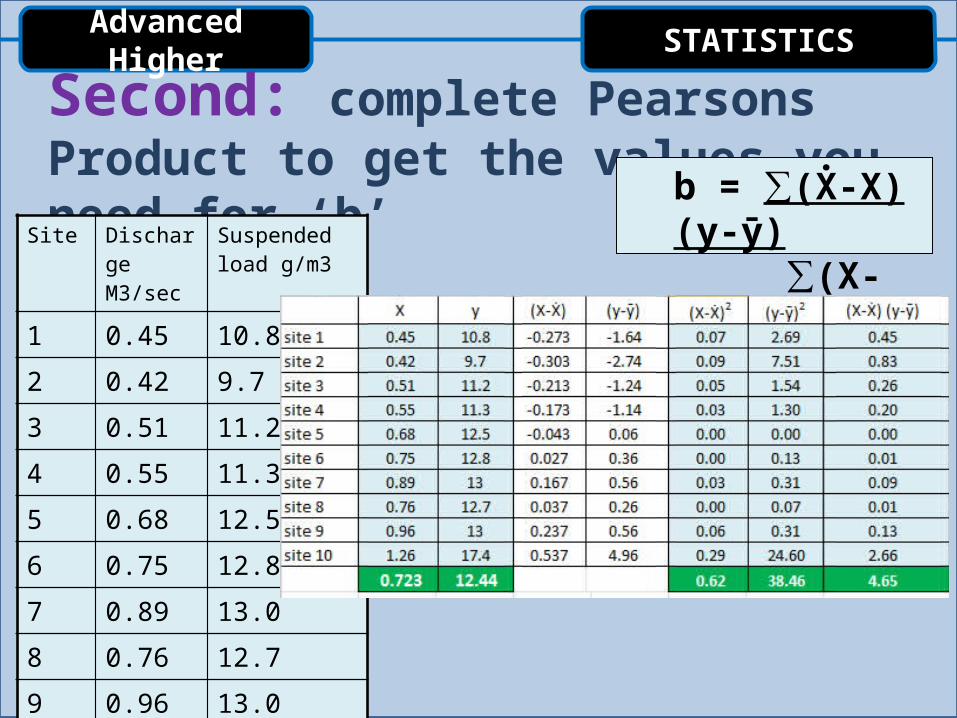
Second: complete Pearsons Product to get the values you need for ‘b’ b = ∑(Ẋ-X)(y-ӯ)
∑(X-Ẋ)2Site Discharge M3/sec
Suspended load g/m3
1 0.45 10.8
2 0.42 9.7
3 0.51 11.2
4 0.55 11.3
5 0.68 12.5
6 0.75 12.8
7 0.89 13.0
8 0.76 12.7
9 0.96 13.0
10 1.26 17.4
Advanced Higher
STATISTICS
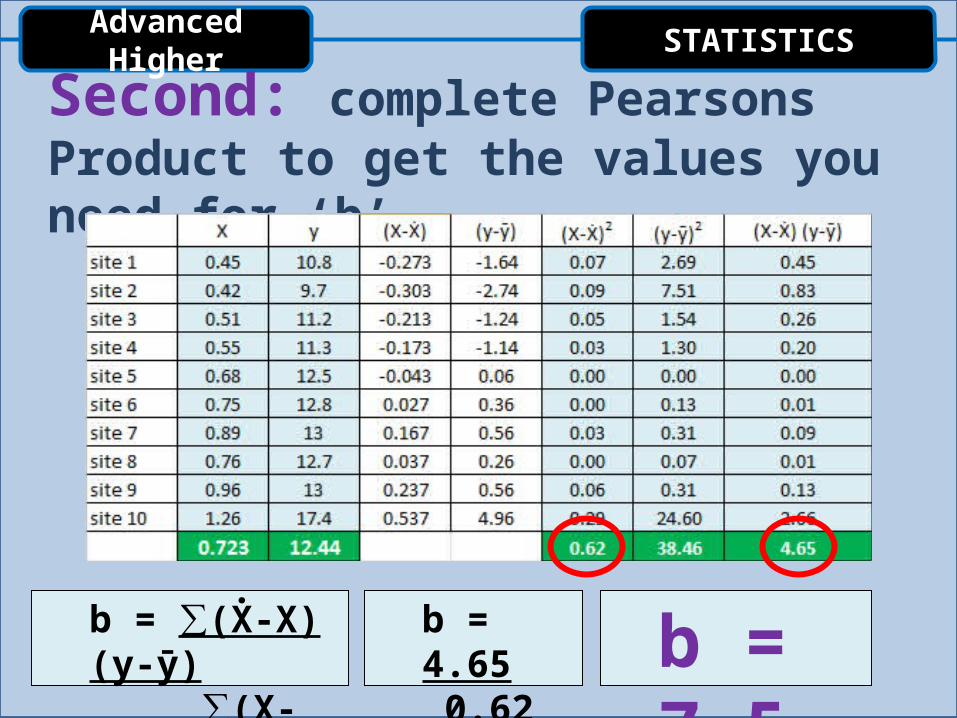
Second: complete Pearsons Product to get the values you need for ‘b’
b = ∑(Ẋ-X)(y-ӯ) ∑(X-Ẋ)2
b = 4.65 0.62 b = 7.5
Advanced Higher
STATISTICS
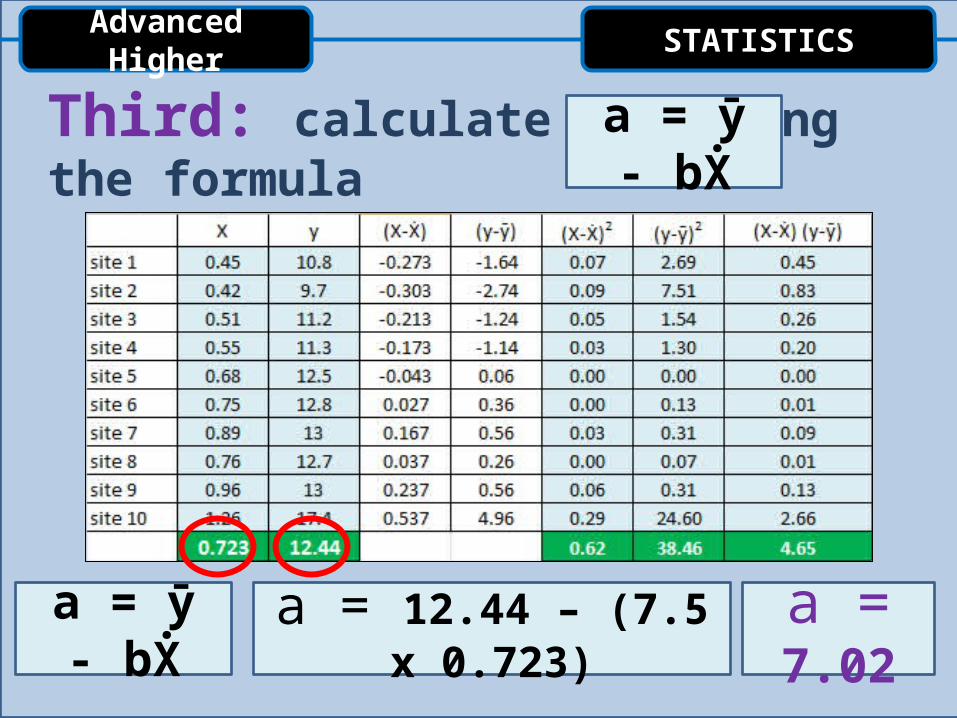
Third: calculate ‘a’ using the formula
a = 12.44 – (7.5 x 0.723) a = 7.02
a = ӯ - bẊ
a = ӯ - bẊ
Advanced Higher
STATISTICS
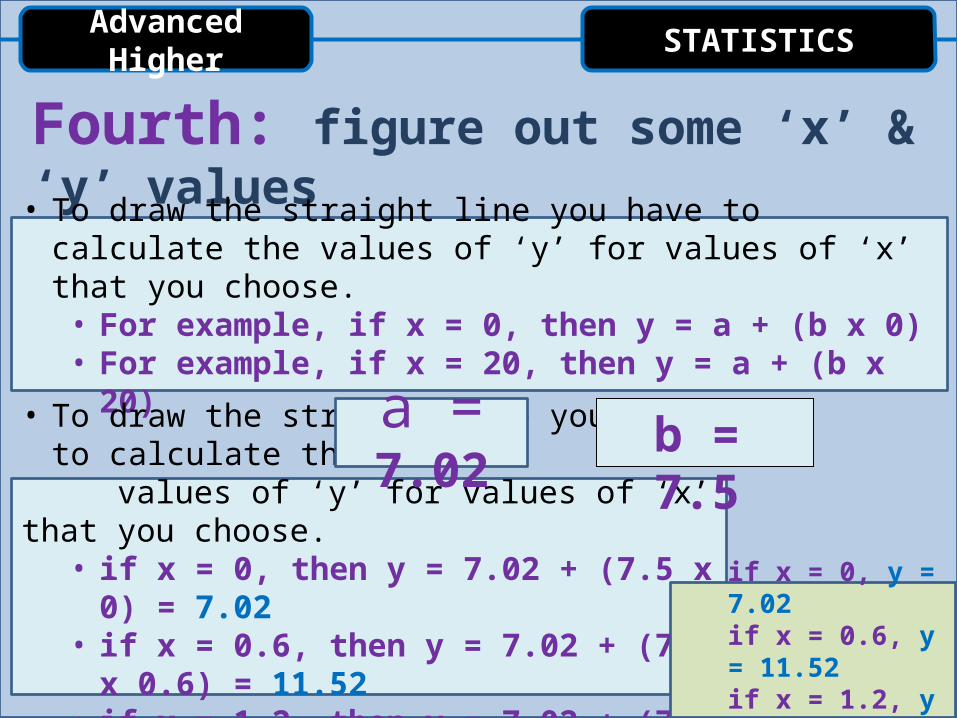
Fourth: figure out some ‘x’ & ‘y’ values
• To draw the straight line you have to calculate the values of ‘y’ for values of ‘x’ that you choose.• For example, if x = 0, then y = a + (b x 0)• For example, if x = 20, then y = a + (b x 20)
• To draw the straight line you have to calculate the values of ‘y’ for values of ‘x’ that you choose.• if x = 0, then y = 7.02 + (7.5 x 0) = 7.02• if x = 0.6, then y = 7.02 + (7.5 x 0.6) = 11.52• if x = 1.2, then y = 7.02 + (7.5 x 1.2) = 16.02
b = 7.5a = 7.02
if x = 0, y = 7.02if x = 0.6, y = 11.52if x = 1.2, y = 16.02
Advanced Higher
STATISTICS
Fifth: plot your straight line!
if x = 0, y = 7.02if x = 0.6, y = 11.52if x = 1.2, y = 16.02