Embed Size (px)
Citation preview

1
Advanced Imaging in Degenerative Disc Disease
Greg Petermann, MD Marshfield Clinic, Wisconsin
USA
Advanced Imaging in Degenerative Disc Disease
Special thanks for material from: Meng Law MD, FRACR
Keck School of Medicine, University of Southern California Los Angeles, California
Lawrence Tanenbaum, MD Mount Sinai Hospital, New York, New York
Advanced Imaging of Degenerative Discs
• Routine MRI items • Discogram • Diffusion and Diffusion tensor imaging of
the disc • MR Spectroscopy of the disc • DTI of the disc • SPECT CT • T1 rho • IDEAL imaging
Current items to help in degenerative disc evaluation
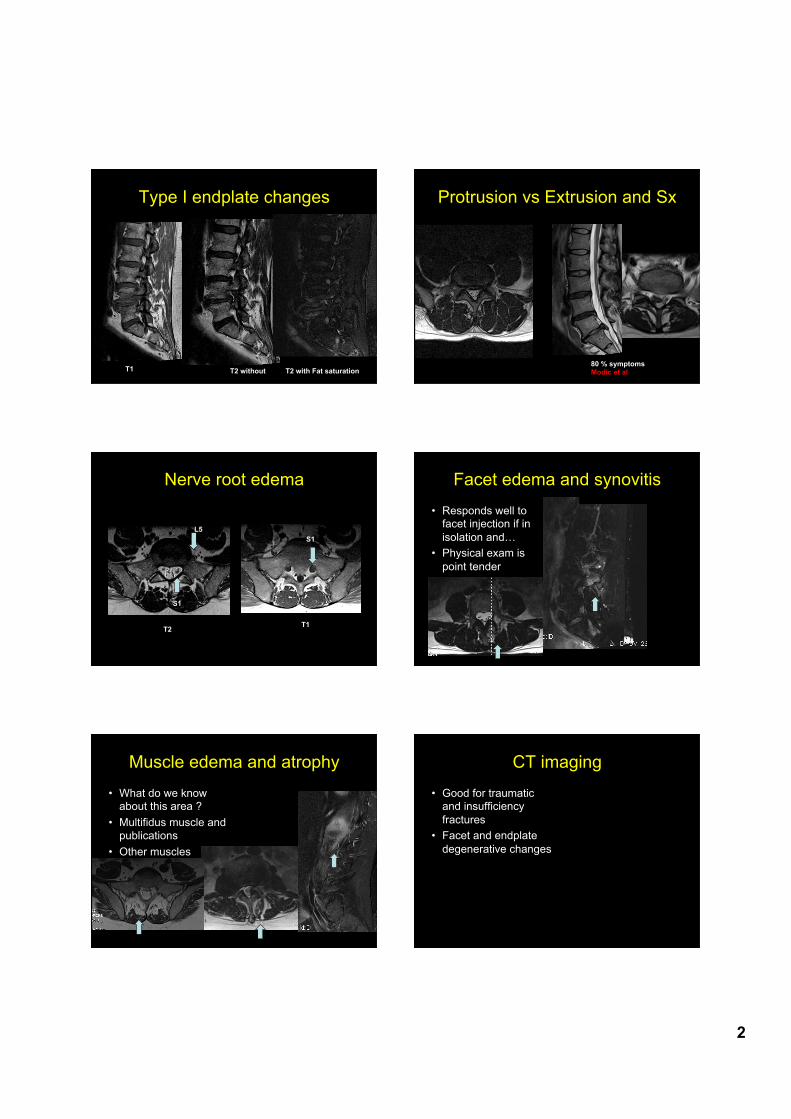
• On routine MRI : • Type I endplate changes • Extrusion vs protrusion • Nerve root edema • Facet edema and synovitis • Muscle edema and atrophy
Type I endplate changes Type I endplate changes
2
Type I endplate changes
T2 without T2 with Fat saturation T1
Protrusion vs Extrusion and Sx
80 % symptoms Modic et al
Nerve root edema
L5 S1
S1
T2 T1
Facet edema and synovitis
• Responds well to facet injection if in isolation and…
• Physical exam is point tender
Muscle edema and atrophy
• What do we know about this area ?
• Multifidus muscle and publications
• Other muscles
CT imaging
• Good for traumatic and insufficiency fractures
• Facet and endplate degenerative changes
3
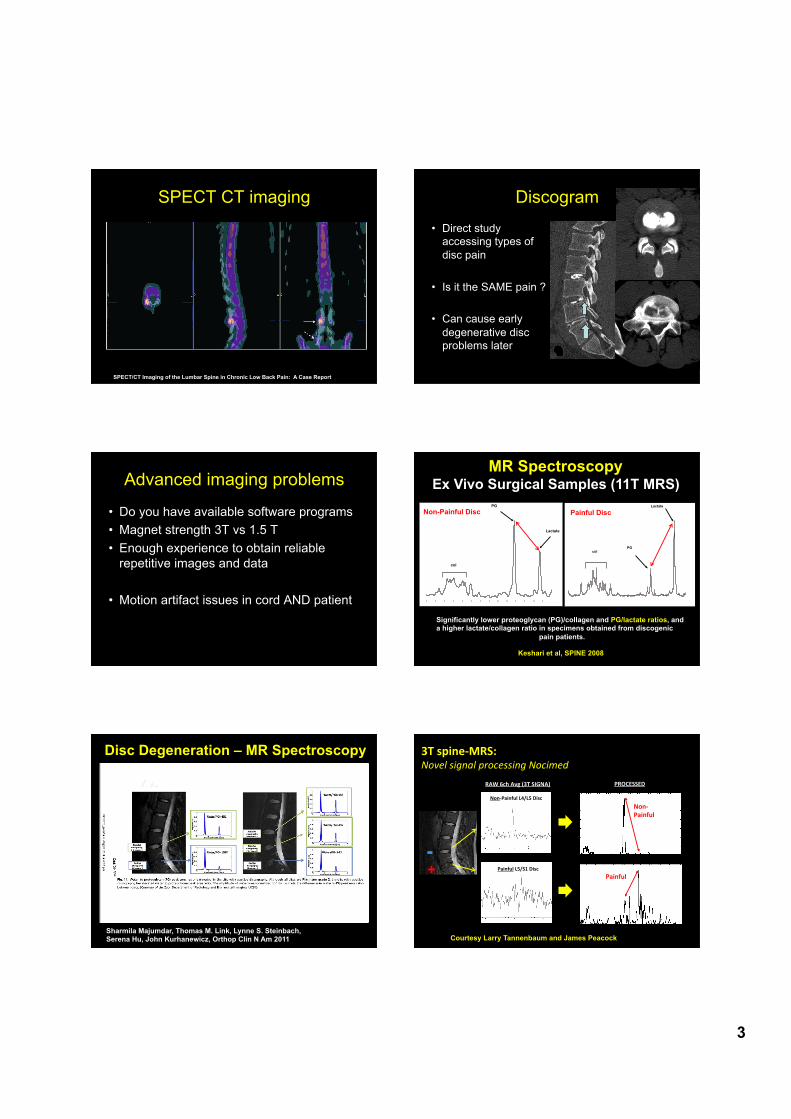
SPECT CT imaging
SPECT/CT Imaging of the Lumbar Spine in Chronic Low Back Pain: A Case Report
Discogram
• Direct study accessing types of disc pain
• Is it the SAME pain ?
• Can cause early degenerative disc problems later
Advanced imaging problems
• Do you have available software programs • Magnet strength 3T vs 1.5 T • Enough experience to obtain reliable
repetitive images and data
• Motion artifact issues in cord AND patient
Keshari et al, SPINE 2008
PG
Lactate
col
Painful Disc PG
Lactate
col
Non-Painful Disc
MR Spectroscopy Ex Vivo Surgical Samples (11T MRS)
Significantly lower proteoglycan (PG)/collagen and PG/lactate ratios, and a higher lactate/collagen ratio in specimens obtained from discogenic
pain patients.
Disc Degeneration – MR Spectroscopy
Sharmila Majumdar, Thomas M. Link, Lynne S. Steinbach, Serena Hu, John Kurhanewicz, Orthop Clin N Am 2011
Non-‐Painful L4/L5 Disc
RAW 6ch Avg (3T SIGNA) PROCESSED
Painful L5/S1 Disc
Non-‐ Painful
Painful
- +
3T spine-‐MRS: Novel signal processing Nocimed
Courtesy Larry Tannenbaum and James Peacock
4
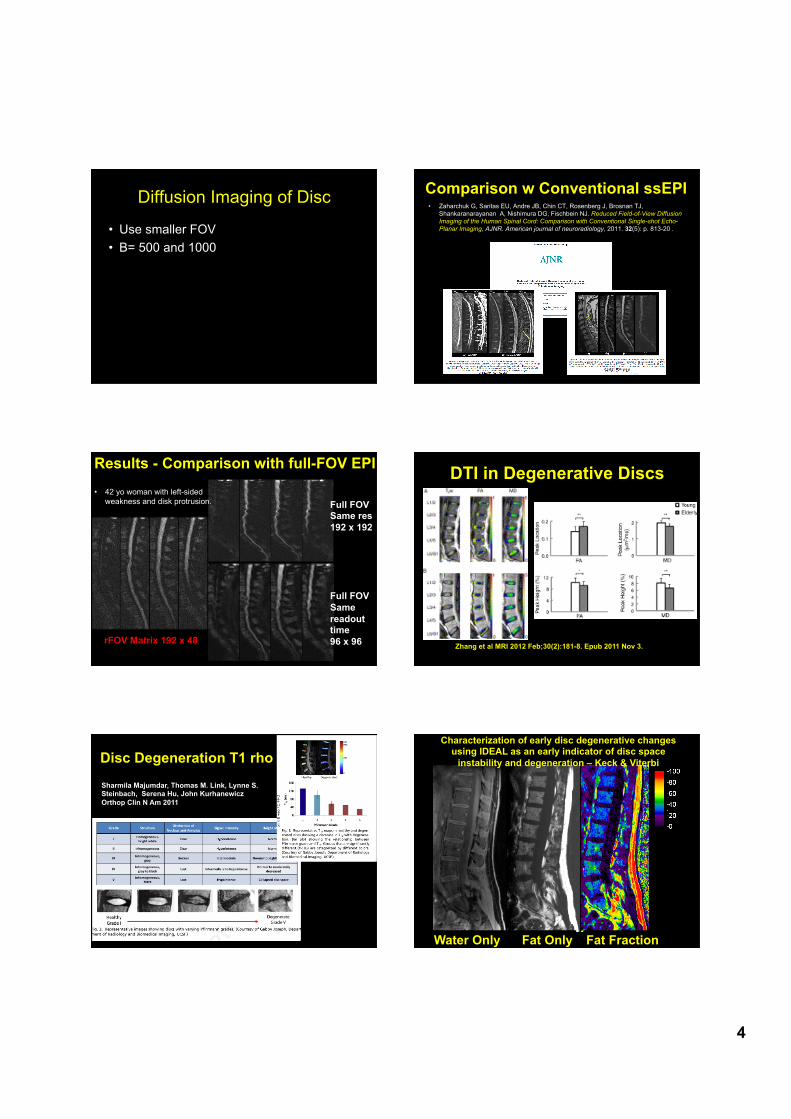
Diffusion Imaging of Disc
• Use smaller FOV • B= 500 and 1000
Comparison w Conventional ssEPI • Zaharchuk G, Saritas EU, Andre JB, Chin CT, Rosenberg J, Brosnan TJ,
Shankaranarayanan A, Nishimura DG, Fischbein NJ. Reduced Field-of-View Diffusion Imaging of the Human Spinal Cord: Comparison with Conventional Single-shot Echo-Planar Imaging, AJNR. American journal of neuroradiology, 2011. 32(5): p. 813-20 .
20
Results - Comparison with full-FOV EPI
rFOV Matrix 192 x 48
• 42 yo woman with left-sided weakness and disk protrusion. Full FOV
Same res 192 x 192 Full FOV Same readout time 96 x 96
DTI in Degenerative Discs
Zhang et al MRI 2012 Feb;30(2):181-8. Epub 2011 Nov 3.
Disc Degeneration T1 rho
Sharmila Majumdar, Thomas M. Link, Lynne S. Steinbach, Serena Hu, John Kurhanewicz Orthop Clin N Am 2011
Fat Fraction Fat Only Water Only
Characterization of early disc degenerative changes using IDEAL as an early indicator of disc space
instability and degeneration – Keck & Viterbi

5
Fat Fraction Water Only
20 mm3 ROI
IDEAL Quantitation Of Disc and End Plate Water-Fat
Results: Disc Water Signal
• Average water signal ratio for both groups decreases from T12/L1 to L4/L5 and then slightly increases at L5/S1
0.000
0.200
0.400
0.600
0.800
1.000
1.200
T12/L1 L1/2 L2/3 L3/4 L4/5 L5/S1
Wat
er S
igna
l Rat
io
Average Water Signal Ratio at each Disc
Patients
Normals
Chad Sarver, Houchun H. Hu, Alexander Lerner, Sam Valencerina, Krishna Nayak, Meng Law Viterbi & Keck USC
• Advanced Imaging the Disc is a challenge • Difficult to repeat – Bone causes inhomogenity of field • Chemical Shift (Vertebral Body Lipids) and Fat Suppression • Reimbursement
• Advanced Imaging Techniques – MRS, DWI, DTI, Perfusion, Permeability fMRI, MEG or MMG, IDEAL fat quantitation, SWI, dynamic, flexion-extension. T1 rho, T2 mapping, discography
• Remember to use the data we already have : • Extrusion, root edema, development of type I endplate
changes, isolated facet edema, muscle edema and atrophy
Review