Embed Size (px)
Citation preview

RUSS COLLEGE OF ENGINEERING AND TECHNOLOGY
Advanced Integrated Technologies for Treatment and Reutilization of Impaired Water in Fossil Fuel‐Based Power Plant Systems
David Ogden, Dora Lopez, Xiujuan Chen, Xingbo Liuand Jason TremblyThursday March 23, 2017
Institute for Sustainable Energy and the Environment
1

RUSS COLLEGE OF ENGINEERING AND TECHNOLOGYInstitute for Sustainable Energy and the Environment
ISEE OverviewInstitute Facts• Faculty: 3• Staff: 4 (Engineers and scientists)• Students: 16 GS; 14 UG• Space: 14,000 ft2
• Over $16M in external research since 2008
Research Capabilities• Thermocatalytic Processes• Process Engineering & Design• Process Modeling & Simulation
2
Water
• Brine treatment• Nutrient recovery• NORM capture
Coal
• Coal conversion (syngas & pyrolysis)• Coal liquefaction• Composite materials
Oil & Gas
• Reinjection & reservoir scaling studies• Reservoir nanofracturing and modeling• Modular alkanes separations
Biomass
• Algae growth & conversion• Thermocatalytic conversion• Biochemicals productionHome to Two Ohio Third
Frontier Innovation Platform Programs

RUSS COLLEGE OF ENGINEERING AND TECHNOLOGYInstitute for Sustainable Energy and the Environment
Project Specifics and Team
3
Project Specifics• DOE/NETL Cooperative Agreement No.
DE‐FE0026315• DOE Project Manager: Barbara Carney• Principal Investigator: Jason TremblyPeriod of Performance• September 1, 2015 to August 30, 2017
OHIO Project Team•Project Management
•Jason Trembly, Ph.D. (OHIO)
•Process Development•Xingbo Liu, Ph.D. (WVU)•David Ogden (OHIO)•Graduate Student(s)
•Process Modeling•Dora Lopez, Ph.D. (OHIO)

RUSS COLLEGE OF ENGINEERING AND TECHNOLOGYInstitute for Sustainable Energy and the Environment
Brine Treatment Process
• Technologies– UV Treatment– NORM Adsorption (Produced water)– Electrochemical Removal
• Minor constituent removal (Fe2+/Fe3+, Mn2+, Ru2+, Zn2+, and Cu2+)
– Selective precipitations• Minor constituents (Ba2+ and Sr2+)
– SCW Treatment• Bulk constituents
4
Brine Treatment Process

RUSS COLLEGE OF ENGINEERING AND TECHNOLOGYInstitute for Sustainable Energy and the Environment
Project Objectives
5
Overall• Develop a site deployable cost‐effective technology for treating brine generated from CO2 storage
operationsSmall Scale Testing• Validate technical and commercial feasibility of new internally heated SCW treatment methodology for
removal of major constituents from impaired water• Determine effectiveness of electrochemical stripping to remove minor constituents from impaired water• Determine effectiveness of corrosion resistant coatings to improve SS performance in high chloride
content waterProcess Engineering• Identify process configurations which maximize constituent removal, optimize heat integration, and
minimize water treatment costs

RUSS COLLEGE OF ENGINEERING AND TECHNOLOGY
Selective Ion Removal
Institute for Sustainable Energy and the Environment6

10
15
20
25
30
35
40
0
0.1
0.2
0.3
0.4
0.5
0.6
2.1 4.2 8.3 12.5
Tim
e (m
in)
Ener
gy C
onsu
mpt
ion
(kW
h/m
3)
Current Density (mA/cm2)
95-97% 99.5-100% 95-97% 99.5-100%
0
10
20
30
40
50
60
70
80
90
100
0 5 10 15 20 25 30
Remov
al (%
)
Time (min)
2.1 mA/cm2
4.2 mA/cm2
8.3 mA/cm2
12.5 mA/cm2
Fig. 2 Variation of energy consumption (bar) and required EC time(line) as a function of current densities for removal efficiency of96% and 99%.
Energy Consumption of Electro-Coagulation for Zn-ion Removal
Fig. 1 Evolution of zinc removal efficiency versus EC time at different current densities. C0 = 50 mg/L.

0
10
20
30
40
50
60
70
80
90
100
0 10 20 30 40 50 60
Rem
oval
(%)
Time (min)
Fe Cu Zn Mn
Fig. 3 Evolution of heavy metal ions removal efficiency versus EC time. Initial concentration of Fe3+, Cu2+, Zn2+ and Mn2+ = 25 mg/L in mixed solution.
Competitive removal of Fe3+, Cu2+, Zn2+ and Mn2+ in the mixed solution.
Removal rate of Zn2+ is almost two times slower than of Fe3+, and half times slower than Cu2+ during a short EC time, but it tends to similar removal efficiency as increasing of duration time.
What makes the different removal behavior of Fe3+, Cu2+, Zn2+ and Mn2+ ?
Typically, previous work focused on the zinc removal by EC.
Removal of Metal Ions from Multi-Ion Solution

0
20
40
60
80
100
0 5 10 15 20 25 30 35 40
Rem
oval
(%)
Time (min)
Zn Sr
Fig. 5 Evolution of heavy metal ions removal efficiency versus EC time. Initial concentration of Zn2+ and Sr2+ = 10 mg/L in mixed solution, current density is 4.2 mA/cm2.
09.63
40.729 42.25
121.28
78.57
1.19.565
0
20
40
60
80
100
120
140
4.2 8.3
Rem
oval
(mg/
L)
Current density (mA/cm2))
Ba Ca Mg Sr
Fig. 4 Evolution of metal ions removal versus EC time at different current densities. mixed solution: t = 30 minCBa = 249.15 mg/L, CCa = 729.73 mg/LCMg = 316.07 mg/L, CSr = 1760.22 mg/L
Remove rate: Mg > Ca > Sr > Ba Remove rate: Zn >> Sr
Removal of Metal Ions from Produced Water

Ionic solid Ksp (at 25oC)
Fe(OH)3 4.0×10-38
Al(OH)3 2.0×10⁻³²
Cu(OH)2 1.6×10⁻¹⁹
Zn(OH)2 4.5×10⁻¹⁷
Mn(OH)2 2.0×10⁻¹³
Mg(OH)2 8.9×10⁻¹²
Ca(OH)2 1.3×10⁻⁶
Sr(OH)2 3.2×10⁻⁴
Ba(OH)2 5.0×10⁻³
Co-precipitation of Cu2+, Zn2+ and Mn2+
at iron hydroxide surface, or Cu(OH)2and Zn(OH)2 surface
The differences of removal behavior between Fe3+, Cu2+, Zn2+ and Mn2+ could be attributed to the co-presence of different removal mechanisms.
Fe3+, Cu2+, Zn2+ and Mn2+ compete for hydroxide ions produced at the cathode.
Precipitation as hydroxide forms
Coprecipitation:adsorbed by Al(OH)3 coagulant
Fe3+, Cu2+, Zn2+ and Mn2+ compete for sorption sites at the aluminum hydroxide surface
Attributed to increase of removal efficiency
Possible Removal Mechanisms: co-precipitation, precipitation as hydroxide forms

RUSS COLLEGE OF ENGINEERING AND TECHNOLOGY
Brine Joule Treatment
Institute for Sustainable Energy and the Environment11

RUSS COLLEGE OF ENGINEERING AND TECHNOLOGY
• Design Specifications– Pressure: 310 bar (4,641 psi)– Temperature: 525 °C– Material of Construction: Hastelloy C‐276– Feed Rate: 0‐300 mL/min
• Safety Measures– Pressure relief valves (3) and rupture discs (3)– Interlocked control system monitoring system
temperature, pressure, and current
• Advantages– Cooler/thinner reactor wall– High throughput/small footprint
Experimental Setup
12Institute for Sustainable Energy and the Environment
Figure 6. OHIO Prototype Brine Treatment System

RUSS COLLEGE OF ENGINEERING AND TECHNOLOGY13
ICP
•Model: Thermo iCAP 6000 ICP
•Purpose: Determine Na+, Mg2+, Ca2+, and aqueous silicate content
IC
•Model: Metrohm 930 Compact IC
•Purpose: Determine HCO3‐
Cl‐ and SO42‐ content
Institute for Sustainable Energy and the Environment
Analytical Procedures
Test Solution 50 (g/L) 180 (g/L)Ions Concentration (mg/L)Na+ 14,956 53,429Ca2+ 4,261 15,222Ba2+ 27 97Sr2+ 109 389K+ 54 194Cl‐ 30,671 109,572HCO3
‐ 82 292SO4
2‐ 109 389NH3
‐ 109 389SiO2 10 34TDS (mg/L) 50,387 180,008Density (kg/m3) 1,032 1,115
Table 1. Experimental Test Solutions

RUSS COLLEGE OF ENGINEERING AND TECHNOLOGY
H2O‐NaCl Solution Properties
14Institute for Sustainable Energy and the Environment
300
320
340
360
380
400
420
440
1,000 1,500 2,000 2,500 3,000
Tempe
rature (°C)
Enthalpy (kJ/kg)
0 g/L50 g/L180 g/L
0
40
80
120
160
300 350 400 450 500
Specific Hea
t (kJ/kg∙K)
0
40
80
120
160
300 350 400 450 500Temperature (ºC)
0
40
80
120
160
300 350 400 450 500
0 g/L50 g/L180 g/L
230 bar
250 bar
280 bar
Figure 7. T‐h diagram with lines of constant NaClconcentration at 230 bar.
Figure 8. Specific heat capacity for water and NaCl solutions.[1]
[1] T. Driesner, Geochimica et Cosmochimica Acta, vol. 71, pp. 4902–4919, Jan. 2007.

RUSS COLLEGE OF ENGINEERING AND TECHNOLOGY
Results Summary
15Institute for Sustainable Energy and the Environment
Units 50 g/LPressure bar 230.01 ± 0.45 249.99 ± 0.97 280.00 ± 1.00
Temperature
Pseudocritical
ºC
377.5 384.9 395.4ExperimentalPsuedocritical 379.1 ± 0.47 386.3 ± 0.53 397.3 ± 2.65
Vapor Outlet 387.2 ± 0.64 391.0 ± 0.32 406.4 ± 0.06Liquid Outlet 369.5 ± 4.63 373.7 ± 10.91 388.2 ± 7.03
Total Dissolved Solids Water Product mg/L 655.1 ± 158.5 1,240.0 ± 237.7 2,836.1 ± 97.5
Units 180 g/LPressure Bar 230.00 ± 0.31 249.99 ± 0.89 280.00 ± 0.17
Temperature
Pseudocritical
ºC
377.5 384.9 395.4ExperimentalPsuedocritical 380.1 ± 1.43 387.8 ± 1.19 398.4 ± 1.55
Vapor Outlet 378.7 ± 0.87 390.3 ± 0.74 402.7 ± 0.63Liquid Outlet 381.9 ± 1.16 392.0 ± 0.74 404.2 ± 0.76
Total Dissolved Solids Water Product mg/L 589.4 ± 40.9 1,095.4 ± 75.2 2,616.1 ±247.2
Table 2. Experimental results summary for 50 and 180 g/L solutions

RUSS COLLEGE OF ENGINEERING AND TECHNOLOGY
Water Product Purity
16Institute for Sustainable Energy and the Environment
0
500
1,000
1,500
2,000
2,500
3,000
3,500
220 230 240 250 260 270 280 290
Prod
uct T
DS (m
g/L)
Pressure (bar)
50 g/L
180 g/L
380 °C
390 °C
400 °C
410 °C
200
220
240
260
280
300
320
0.1 1 10 100 1000
Pressure (ba
r)Product TDS (g/L)
Figure 10. Pressure with vapor TDS concentration and lines of constant temperature [2].
[2]J. L. Bischoff and K. S. Pitzer, American Journal of Science, p. 217, 1989.
Figure 9. Water product purity with pressure.

RUSS COLLEGE OF ENGINEERING AND TECHNOLOGY
Water Recovery
17Institute for Sustainable Energy and the Environment
Figure 12. Water recovery rates plotted with desalinator power. 100 g/minute.
0
10
20
30
40
50
60
70
80
90
100
600 800 1,000 1,200 1,400 1,600
Water Recov
ery (%
)
Reactor Power (Watts)
230 Bar250 Bar280 Bar
0
200
400
600
800
1,000
1,200
1,400
220 230 240 250 260 270 280 290 300En
thalpy
of V
aporization (kJ/kg)
Pressure (bar)
50 g/L
180 g/L
Figure 13. Experimentally derived enthalpy of vaporization estimates.

RUSS COLLEGE OF ENGINEERING AND TECHNOLOGY
Process Modeling & Techno‐economics
Institute for Sustainable Energy and the Environment18

RUSS COLLEGE OF ENGINEERING AND TECHNOLOGYInstitute for Sustainable Energy and the Environment
Model Overview
19
Aspen Plus® desalination simulation
Software Aspen Plus® V9
Thermodynamic property method ELECNRTL
Water chemistry Produced water
Nameplate plant capacity 500 GPM of brine (> 15 wt. %)
Feed conditions 25 °C and 1 bar
Economic Assessment
Capital Expense • APEA (Aspen Process Economic Analyzer)• AED&R (Aspen Exchanger Design & Rating)• Cost charts• Vendor quotes
Year basis 2015
Capacity factor 0.85
Interest rate (capital charge factor) 10 %
Cost Units U.S. dollars
Constituent Concentration (mg/L) Molarity (mol/L)
Na+ 37,939.0 1.650
Ca2+ 12,575.0 0.314
Ba2+ 7,944.6 0.058
Sr2+ 4,153.8 0.047
Mg2+ 1,106.4 0.046
Cl‐ 90,869.3 2.563
SO42‐ 779.0 0.008
TDS 155,336.1
Table 3. Model Brine Composition

RUSS COLLEGE OF ENGINEERING AND TECHNOLOGYInstitute for Sustainable Energy and the Environment
Model Scenarios (A & B)
20
Primary treatmentBrine
Softening
Minerals
Joule‐heat desalination
Minerals
Clean water
AChemical
Precipitation
BPrecipitation
with CO2 capturevs.

RUSS COLLEGE OF ENGINEERING AND TECHNOLOGYInstitute for Sustainable Energy and the Environment
Model Scenarios (C)
21
Primary treatmentBrine
Acid treatment
BaSO4
Joule‐heat desalination
Injectionproduct
Clean water
vs.Sulfuric acid

RUSS COLLEGE OF ENGINEERING AND TECHNOLOGYInstitute for Sustainable Energy and the Environment
Process Flow Diagrams
22
HPP
SC water
Saturated Brine
Na Salts
HX
UV unit
SCW‐R
Flash
Hypersaline brine
Treated Water
BaSO4 sludgeMg(OH)2 sludge
Sulfationtank
Liquid/Solids Separation tank 1
Na2SO4
Liquid/Solids Separation tank 2
Treated Water
NaOHpHtank
Liquid/Solids Separationtank 3
CaCO3/SrCO3 sludge
Softtank
Na2CO3
Filtration Suspended solids/Oil
Na‐rich brine
Vapor
COOL‐1
COOL‐2
Scenario A Scenario B

RUSS COLLEGE OF ENGINEERING AND TECHNOLOGYInstitute for Sustainable Energy and the Environment
Process Flow Diagrams
23
Scenario C
HPP
SC water
Injection product
HX
UV unit
SCW‐R
Hypersaline brine
Treated Water
BaSO4 sludge
SulfationtankLiquid/Solids
Separation tank 1
H2SO4
Treated Water
Filtration Suspended solids/Oil
Na‐rich brine
COOL‐1
COOL‐2
Injection product To well

RUSS COLLEGE OF ENGINEERING AND TECHNOLOGYInstitute for Sustainable Energy and the Environment
Joule Model Confirmation
24
Figure 14. Experimental and model water recovery with Joule heater power.

RUSS COLLEGE OF ENGINEERING AND TECHNOLOGYInstitute for Sustainable Energy and the Environment
Scenario Comparisons
25
Base case Range
CO2 credit ($/ton) 40 20‐60Product Credit (all in $/ton)
NaClBaSO4Mg(OH)2Ca/SrCO3
30200100150
0‐600 ‐ 4500 ‐ 2500 ‐ 300
Scenario A Scenario B Scenario C
Brine flow (GPM) 500 500 500
Capital cost ($M)* 7.8 8.6 7.5
Mineral product (tons/day)
597 594 40
Treatment cost($/bbl)
0.7 1.2 0.7
* uncertainty +40%/‐25 %
Table 4. Scenario Cost Comparison

RUSS COLLEGE OF ENGINEERING AND TECHNOLOGY
Summary
Institute for Sustainable Energy and the Environment26

RUSS COLLEGE OF ENGINEERING AND TECHNOLOGYInstitute for Sustainable Energy and the Environment
Summary• Selective ion removal
– Electrocoagulation tests completed with Marcellus shale brine– Removal selectivity likely based upon respective cation hydroxide solubility
• Joule brine treatment– Wide range of brine solutions containing 50 to 180 g/L tested– Ability to produce clean water product containing 600‐2,800 mg/L TDS – Over 1,000 hours of operational experience gained
• Process modeling & techno‐economics– Thermodynamic model accuracy for non‐ideal brine solutions confirmed with experimental results– Three process scenarios modeled ranging from zero liquid discharge to concentration with injection– Promising estimated brine treatment costs ranging from 0.7‐1.2 $/bbl
27

RUSS COLLEGE OF ENGINEERING AND TECHNOLOGYInstitute for Sustainable Energy and the Environment
Acknowledgements• WVU colleagues Ms. Xiujuan Chen and Dr. Xingbo Liu• Mr. David Ogden and Dr. Dora Lopez for their efforts in developing the experimental
apparatus/testing, process simulation, and costing• Project manager Barbara Carney for her insight and National Energy Technology
Laboratory (DE‐FE‐0026315) for their financial support
28

RUSS COLLEGE OF ENGINEERING AND TECHNOLOGYInstitute for Sustainable Energy and the Environment
Disclaimer"This report was prepared as an account of work sponsored by an agency of the United States Government. Neither the United States Government nor any agency thereof, nor any of their employees, makes any warranty, express or implied, or assumes any legal liability or responsibility for the accuracy, completeness, or usefulness of any information, apparatus, product, or process disclosed, or represents that its use would not infringe privately owned rights. Reference herein to any specific commercial product, process, or service by trade name, trademark, manufacturer, or otherwise does not necessarily constitute or imply its endorsement, recommendation, or favoring by the United States Government or any agency thereof. The views and opinions of authors expressed herein do not necessarily state or reflect those of the United States Government or any agency thereof."
29

Questions: Jason TremblyWebsite: https://www.ohio.edu/engineering/isee/E‐mail: [email protected]: (740) 566‐7046
30

RUSS COLLEGE OF ENGINEERING AND TECHNOLOGY
Supporting Slides
Institute for Sustainable Energy and the Environment31

Kinetic Modeling of Electro-Coagulation
The mass conservation of metal ions during EC process can be generally expressed as:
First-order model, (-rD) = -K1Ct ,
ln Ct= - K1t + ln C0
simplified as:
Pseudo-first order model, (-rD)= Kpse(Ct-Ce),(-rD) is proportional to the concentration distance at t and at equilibrium.
if the equilibrium concentration is extremelylow, even zero value, the pseudo-first ordermodel gets back to the first-order model.
Second order model, (-rD) = (K2(Ce -Ct)2,expressed as:
(-rD) is the removal rate of metal ions.
t/Ct =1/(K2Ce2) + t/Ce
Ct = Ce+ (C0-Ce) e-KpseutCt = C0 exp(-K1t)
( rD)

CD mA/cm2
First order model Pseudo-first order model
K1 (min-1) R2 Ce K1 (min-1) R2
2.1 0.0833 0.97912 0.0449 0.10926 0.98756
4.2 0.14775 0.99463 -0.554 0.14312 0.99387
8.3 0.21087 0.99868 -0.5129 0.20458 0.99887
12.5 0.30142 0.99956 -0.15781 0.29825 0.99991
Table 1. The kinetic parameters for first-order and pseudo-first order model at different current densities.
Effect of Current Densities on Removal Kinetics
Removal of zinc ions by EC process follows the first-order model with current- dependent parameters.
Fig. 5 Effect of current density on removal of Zn.
0 10 20 30 40 50 600
10
20
30
40
50
Zn re
sidu
al (m
g/L)
Time (min)
2.1 mA/cm2
4.2 mA/cm2
8.3 mA/cm2
12.5 mA/cm2
Based on first- order model

Initial Con.
mA/cm2
First order model Pseudo-first order model
K1 (min-1) R2 Ce K1 (min-1) R2
50 0.21087 0.99868 -0.5129 0.20458 0.99887
100 0.14848 0.9983 -0.68998 0.14534 0.99827
250 0.06486 0.99426 -12.32778 0.05747 0.99755
500 0.03619 0.96677 0.99755 0.05199 0.98110
1000 0.01304 0.90758 481.70668 0.04072 0.97532
2000 0.00962 0.84684 1213.02075 0.04663 0.97029
Table 2. The kinetic parameters for first-order and pseudo-first order model at different concentrations.
Effect of Initial Concentrations on Removal Kinetics
Removal of zinc ions fits with the first order model at related low concentration (50, 100 and 250 mg/L), and fits will with the pseudo-first order model at high concentrations (500, 1000 and 2000 mg/L).
Fig. 6 Effect of zinc initial concentration on removal of Zn.
0 10 20 30 40 50 600
500
1000
1500
2000
Zn R
esid
ual (
mg/
L)
Time (min)
50 mg/L 100 mg/L 250 mg/L 500 mg/L 1000 mg/L 2000 mg/L Based on first-order or
pseudo first-order model

0
20
40
60
80
2.1 4.2 8.3 12.5
Rem
oval
(%)
Current density (mA/cm2)
0
20
40
60
80
3.5 5.6 7.5
Rem
oval
(%)
InitIal pH
0
20
40
60
80
5 10 30
Rem
oval
(%)
Electrode spacing (mm)
C0 = 10 mg/L, t = 60 min, d = 10 mm, pH = 5.6
C0 = 10 mg/L, t = 30 min, d = 10 mm, CD = 2.1 mA/cm2
C0 = 10 mg/L, d = 10 mm, CD = 2.1 mA/cm2, pH = 5.6
The slower removal of Sr2+ compared to Fe3+, Cu2+ and Zn2+ is attributed to a difference in the removal mechanisms
Removal of Strontium Ions

Possible Removal Mechanisms: Electrostatic Attraction
http://www.ptable.com/
Atomic radius: Ba > Sr > Ca > Mg
Electronegativity: Mg > Ca > Sr > Ba
Mg, Ca, Sr and Ba locate in the same group
Ability of electrostatic attraction: Mg > Ca > Sr > Ba
Removal efficiency: Mg > Ca > Sr > Ba
Other possible removal mechanisms reported in literature include surface complexation.

RUSS COLLEGE OF ENGINEERING AND TECHNOLOGY
Water Product Purity
37Institute for Sustainable Energy and the Environment
Figure 11. Major cation concentrations found in water product with pressure.
0
200
400
600
800
1,000
1,200
0
5
10
15
20
25
30
35
220 230 240 250 260 270 280 290 300
Na+
TDS (m
g/L)
Ca2+, K
+ , Sr
2+TD
S (m
g/L)
Pressure (Bar)
CaKSrNa

RUSS COLLEGE OF ENGINEERING AND TECHNOLOGY
Aspen Plus model overview to estimate properties and validate the experimental results
38
We are currently in the process of estimating properties and desalination results
• Enthalpy of vaporization • Energy balances • TVLE
• Chemistry (precipitation) • Water recovery % • Power requirements
• pH • Heat Capacity
See appendix B for Chemistry
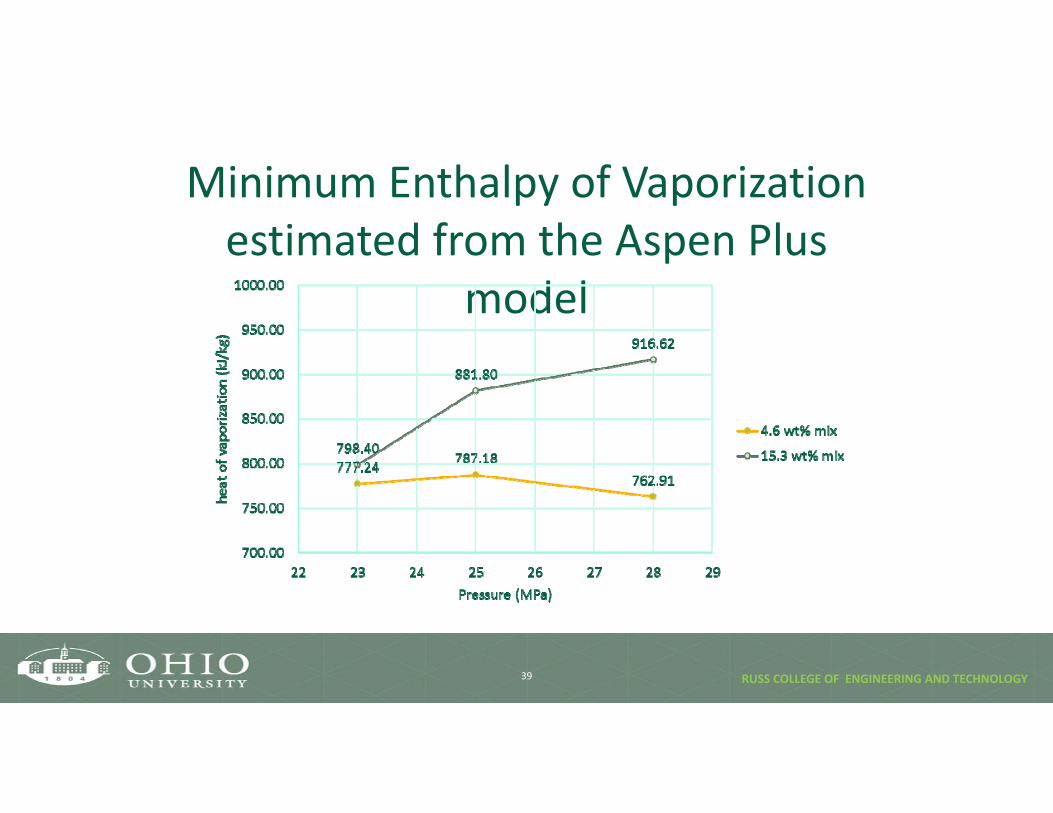
RUSS COLLEGE OF ENGINEERING AND TECHNOLOGY
Minimum Enthalpy of Vaporization estimated from the Aspen Plus
model
39

RUSS COLLEGE OF ENGINEERING AND TECHNOLOGY
TVLE from the Aspen Plus model
40

RUSS COLLEGE OF ENGINEERING AND TECHNOLOGY
Other supporting slides
41

RUSS COLLEGE OF ENGINEERING AND TECHNOLOGY
Solid product breakdown
42
100% of solid credit in Scenario C comes from BaSO4
RUSS COLLEGE OF ENGINEERING AND TECHNOLOGY
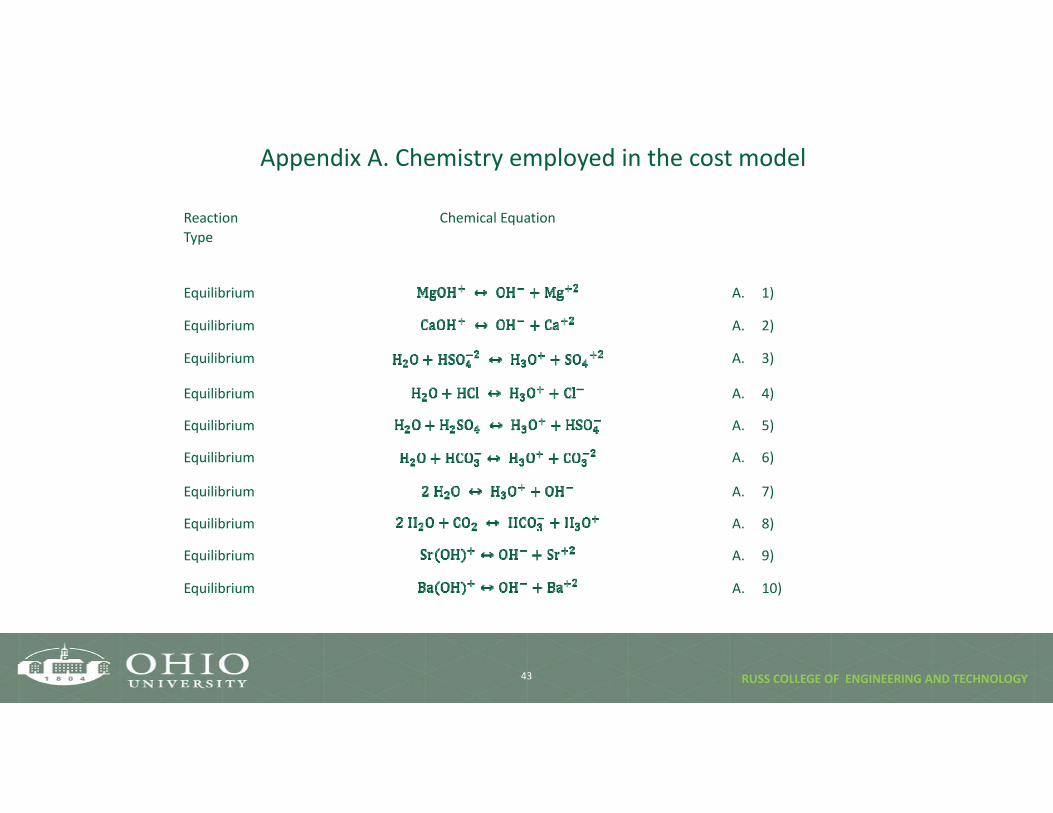
Appendix A. Chemistry employed in the cost model
43
Reaction Type
Chemical Equation
Equilibrium A. 1)
Equilibrium A. 2)
Equilibrium A. 3)
Equilibrium A. 4)
Equilibrium A. 5)
Equilibrium A. 6)
Equilibrium A. 7)
Equilibrium A. 8)
Equilibrium A. 9)
Equilibrium A. 10)

RUSS COLLEGE OF ENGINEERING AND TECHNOLOGY44
Appendix A. Chemistry employed in the cost model
Salt A. 11)
Salt A. 12)
Salt A. 13)
Salt A. 14)
Salt A. 15)
Salt A. 16)
Salt A. 17)
Salt A. 18)
Salt A. 19)
Salt A. 20)

RUSS COLLEGE OF ENGINEERING AND TECHNOLOGY45
Appendix A. Chemistry employed in the cost model
Salt A. 21)
Salt A. 22)
Salt A. 23)
Salt A. 24)
Salt A. 25)
Salt A. 26)
Salt A. 27)
Salt A. 28)
Salt A. 29)
Salt A. 30)

RUSS COLLEGE OF ENGINEERING AND TECHNOLOGY46
Salt A. 30)
Salt A. 31)
Salt A. 32)
Salt A. 33)
Salt A. 34)
Salt A. 35)
Dissociation A. 36)
Dissociation A. 37)
Dissociation A. 38)
Dissociation 39)
Dissociation A. 40)
Dissociation A. 41)
Dissociation 42)
Appendix A. Chemistry employed in the cost model

RUSS COLLEGE OF ENGINEERING AND TECHNOLOGY47
Appendix B. Chemistry employed to rigorously model the experimental trials at ISEE
Reaction Type Stoichiometry1 Equilibrium HCL + H2O <--> CL- + H3O+2 Equilibrium H2O + HSO4- <--> H3O+ + SO4--3 Equilibrium H2SO4 + H2O <--> H3O+ + HSO4-4 Equilibrium H2O + HCO3- <--> CO3-- + H3O+5 Equilibrium 2 H2O + CO2 <--> HCO3- + H3O+6 Equilibrium NH4+ + OH- <--> AMMON-01 + H2O7 Equilibrium H3O+ + OH- <--> 2 H2O8 Equilibrium CAOH+ <--> CA++ + OH-9 Equilibrium BAOH+ <--> BA++ + OH-10 Equilibrium SROH+ <--> SR++ + OH-CACO3(S) Salt CACO3(S) <--> CO3-- + CA++BACL2(S) Salt BACL2(S) <--> BA++ + 2 CL-K2SO4(S) Salt K2SO4(S) <--> SO4-- + 2 K+KHSO4(S) Salt KHSO4(S) <--> K+ + HSO4-KCL(S) Salt KCL(S) <--> CL- + K+CACL2(S) Salt CACL2(S) <--> CA++ + 2 CL- + 6 H2OSALT12 Salt SALT12 <--> CA++ + 2 CL-SRSO4(S) Salt SRSO4(S) <--> SO4-- + SR++SRCL2(S) Salt SRCL2(S) <--> SR++ + 2 CL-BASO4(S) Salt BASO4(S) <--> BA++ + SO4--WEGSC(S) Salt WEGSC(S) <--> CO3-- + 3 HCO3- + 5 NA+TRONA(S) Salt TRONA(S) <--> CO3-- + HCO3- + 2 H2O + 3 NA+BACO3(S) Salt BACO3(S) <--> BA++ + CO3--SALT4 Salt SALT4 <--> CO3-- + 2 NA+ + 10 H2OSALT3 Salt SALT3 <--> CO3-- + 2 NA+ + 7 H2OSALT2 Salt SALT2 <--> H2O + CO3-- + 2 NA+SALT1 Salt SALT1 <--> CO3-- + 2 NA+CASO4(S) Salt CASO4(S) <--> CA++ + SO4--SALT8 Salt SALT8 <--> CA++ + 2 CL- + 4 H2OSALT7 Salt SALT7 <--> H2O + CA++ + 2 CL-SALT6 Salt SALT6 <--> CA++ + 2 H2O + 2 CL-KHCO3(S) Salt KHCO3(S) <--> HCO3- + K+K2CO3(S) Salt K2CO3(S) <--> CO3-- + 2 K+SODIU(S) Salt SODIU(S) <--> SO4-- + 2 NA+NACL(S) Salt NACL(S) <--> CL- + NA+CA(OH)2 Salt CA(OH)2 <--> OH- + CAOH+BA(OH)2 Salt BA(OH)2 <--> BAOH+ + OH-SR(OH)2 Salt SR(OH)2 <--> SROH+ + OH-SALT9 Salt SALT9 <--> NA+ + 0.5 H2O + 0.5 CO2 + 0.5 CO3--