Embed Size (px)
Citation preview

Foundation Software User Conference 2012
Advanced Job Costing Data Genie Scott Kern Senior Consultant
This session will cover use and functionality of the Job Cost Data Genie
Report formatting will be discussed, covering simple reports that report one line per job, to more detailed reports that show details by Phase / Cost Code and Cost Class
We will look at the individual capsules in the report writer and examine just what each capsule means and does.
The Formula Editor allows for basic and advanced calculations within reports. When a value is not available in an individual capsule, chances are, it can be created by using a formula.
A number of report examples will be shown, revealing the capsules used to create the reports.
Additional Criteria options when running the reports will be covered.

Foundation Software User Conference 2012
Basics of Job Costing Reports created through the Data Genie
- Report listed by JOB
- Report run as a single line per job. - Note the “Header” check box is unchecked.

Foundation Software User Conference 2012
- Reports listed with COST CODE breakdown
- JOB ID has the “Header” checkbox enabled. This will allow the report to print a single page per job record.
- COST CODE capsules added to allow detail per row for available cost codes.
- If your company uses PHASES within FOUNDATION, you will want to include the PHASE ID\CODE capsule and the PHASE DESCRIPTION capsule

Foundation Software User Conference 2012
- Reports listed with COST CODE and COST CLASS detail.
- COST CLASS capsule is added. Note the Cost Class ID since it is redundant information; it is not included to conserve space on the report.

Foundation Software User Conference 2012
Additional Configuration criteria
- Cost Class Format: Detail / Condensed
Condensed:
Detail :

Foundation Software User Conference 2012
Job Totals

Foundation Software User Conference 2012
Print Contract Summary
Print Contract Summary
If this checkbox is enabled, a summary of the job’s contract information will be printed at the end of the report. It will also print at the end of each job if "Detail" is selected as the report's Cost Class Format on the "Criteria" tab. The summary will show the original contract amount, change orders, the revised contract amount, etc.
Show Job Description
If this option is enabled, the job description will be printed on the contract summary.

Foundation Software User Conference 2012
Report Change Orders by Status
If this checkbox is enabled, the change orders amount on the report will be broken out by the status(es) selected in the Status of Change Orders in Contract Summary section. The Status of Change Orders in Revised Contract Amount section will become enabled for selection of change order status(es) to be included in the revised contract amount; however, these will be summed and printed on one line on the report, rather than broken out by individual status.
If this checkbox is disabled, the change orders amount on the report will print the sum of the selected status(es) on one line, rather than broken out by individual status. Selecting a particular status in the Status of Change Orders in Contract Summary section will cause it to also be selected in the Status of Change Orders in Revised Contract Amount section. In addition, the Change Order Line Label field will be available to be modified.
Change Order Line Label
If the Print Contract Summary checkbox is enabled and the Report Change Orders by Status checkbox is disabled, information about the change order amount will appear on the report on one line. You can choose which change orders you wish to be included in this change order line amount based on status. By default, this line will be labeled “Change Orders to Date.” You may change the label for this line by typing a new one here.
Status of Change Orders in Contract Summary
If the Print Contract Summary checkbox is enabled, you may select the status of Job Costing change orders that should be included in the change order amount by setting these checkboxes. Enable the checkbox for each status of change order you want to include. If the Report Change Orders by Status checkbox is disabled, then enabling these status checkboxes will also enable the corresponding checkboxes in the Status of Change Orders in Revised Contract Amount section.
Status of Change Orders in Revised Contract Amount
These checkboxes allow you to select which change order status(es) should be included in the revised contract amount on the report. If the Print Contract Summary checkbox is enabled, any status checkbox that is enabled in the Status of Change Orders in Contract Summary section will cause the corresponding status checkbox in this section to become enabled. If the Report Change Orders by Status checkbox is also enabled, these checkboxes are selected independently of those in the Status of Change Orders in Contract Summary section. In both cases, these statuses will be summed and printed on one line on the report, rather than broken out by individual status.

Foundation Software User Conference 2012
Show Cash Received To Date
The default for this field will be set according to the default you defined in the fourth step J/C ActivityGenie. If the Print Contract Summary checkbox is enabled, this checkbox will become available. Enabling it will cause a line to print in the contract summary of the report showing total cash received to date for the job.
Show Retainage and Net Billings
The default for this field will be set according to the default you defined in the fourth step J/C ActivityGenie. If the Print Contract Summary checkbox is enabled, this checkbox will become available. Enabling it will cause two lines to print in the contract summary of the report showing retainage and net billings for the job.
Sorting and Subtotals
You may also run the J/C Activity Reports by Project Manager / Geographic Area / Project Class / Customer by selecting the appropriate field in the SORT ORDER field.
When the Subtotal by Sort option is selected, this will subtotal the report by the criteria defined in the Sort Order Field.
In the example below, this report would show the Total amounts for all the jobs per project manager.
Since the New Page on Sort option is checked, a new page would print for every Project Manager attached to jobs in FOUNDATION.
Foundation Software User Conference 2012
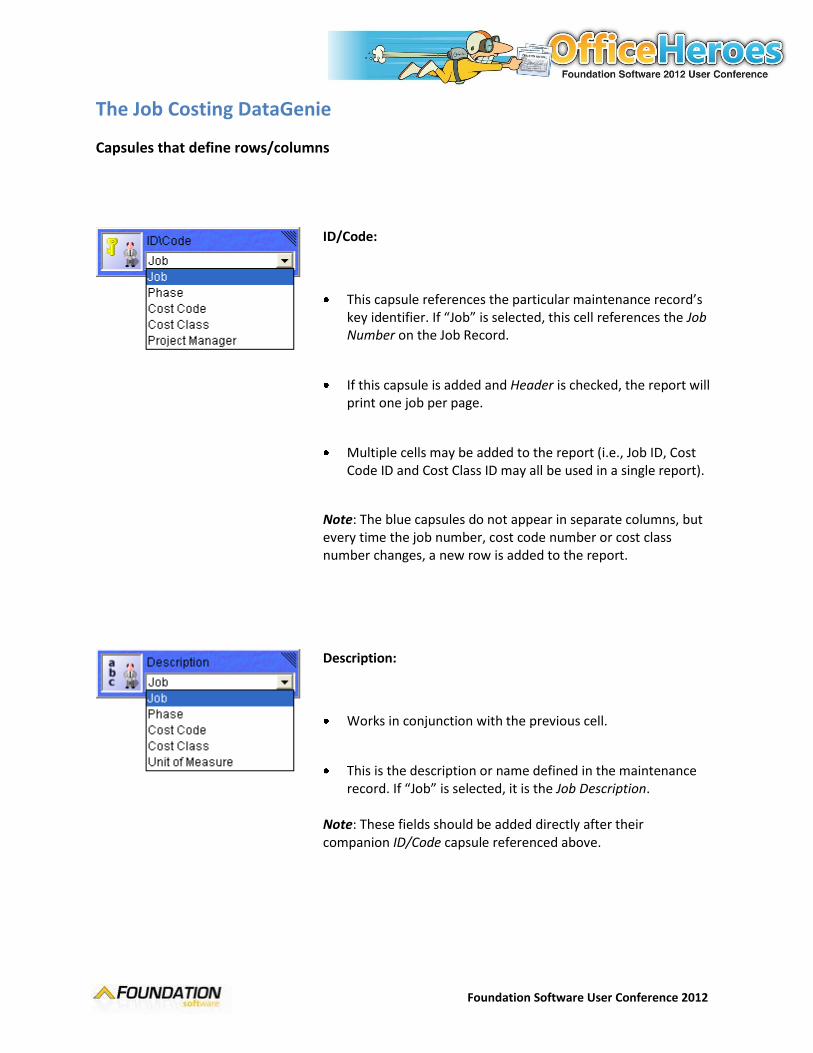
The Job Costing DataGenie
Capsules that define rows/columns
ID/Code:
This capsule references the particular maintenance record’s key identifier. If “Job” is selected, this cell references the Job Number on the Job Record.
If this capsule is added and Header is checked, the report will print one job per page.
Multiple cells may be added to the report (i.e., Job ID, Cost Code ID and Cost Class ID may all be used in a single report).
Note: The blue capsules do not appear in separate columns, but every time the job number, cost code number or cost class number changes, a new row is added to the report.
Description:
Works in conjunction with the previous cell.
This is the description or name defined in the maintenance record. If “Job” is selected, it is the Job Description.
Note: These fields should be added directly after their companion ID/Code capsule referenced above.

Foundation Software User Conference 2012
Capsules that define columns (Note: these capsules may be used multiple times in a single report.)
When defining a capsule, the first option is to select WHAT costs should be reported in a particular column. These definitions hold true for all Capsules (Cost, Hours/Units, Income, etc)
When the date range 06/01/08 – 06/30/08 is entered on the report criteria, the following will be returned
CURRENT: All activity posted BETWEEN 06/01/08 and 06/30/08
PREVIOUS: All activity posted BEFORE 06/01/08
TO DATE: All activity posted THROUGH 06/30/08 (regardless of Start Date)
YEAR TO DATE: J/C Activity reports have a YTD Start Date option on the criteria screen. If the YTD Start Date is set to 01/01/08, this column would report costs from 01/01/08 – 06/30/08.
QTR TO DATE: The Quarter to Date option looks at the ending date of the date range and reports activity for that particular quarter. In this example, the report would show activity posted between 04/01/08 and 06/30/08.
ORIGINAL ESTIMATE: This shows the Original Estimated Costs from the Job’s Budget Tab
CHANGE ORDERS: Change Orders Costs from the Change Order’s Distribution Tab
REVISED ESTIMATE: Original Estimated Cost plus Change Orders
Costs:
Posted transactions to the jobs through A/P, P/R, I/N, E/Q, G/L and J/C show in the Cost columns.
These columns will show costs for all cost classes by default. As shown in the Cost Class dropdown, you may select specific cost classes to report (i.e., you may define a separate column for LAB, MAT, SUB costs, etc.)

Foundation Software User Conference 2012
Option for “simple” Original Contract and Estimate amount (non-budget related values)
When the Original Estimate, Change Order or Revised Estimate option is selected, the button to the right of the cost class dropdown allows you to enable a JOB option. When selected, the data pulls from the following areas:
ORIGINAL ESTIMATE: The value in the Original Estimate field from the General Tab on the Job maintenance screen.
CHANGE ORDER: The value from the Cost field from the Change Order General Tab.
REVISED ESTIMATE: The sum of the previous two items (based on the Change Order status)

Foundation Software User Conference 2012
Change Order Options
Reporting Hours / Units by Cost Class
Hours/Units:
Posted transactions to the jobs through A/P, P/R, I/N, E/Q and G/L show in the Hours/ Units columns.
These columns will show all units from all cost classes, or you may individually select specific classes to report (i.e., you may select a column to specifically report on LAB hours).
When the Change Order or Revised Estimate option is selected, the “Status of Change Orders” options open. Column values will report for any and all change orders with the status selected.
Selecting multiple cells with different Change Order status will report different values.
In the example above the columns would return values as follows:
- Change Order Income for Change Orders with the status of Approved or Estimate - Change Order Income for Change Orders with the status of Pending
NOTE: the JOB option is also available on the Cost Cell when the Change Order or Revised Estimate is selected. When checked, the Change Order Costs pull from the General tab of the Change Order entry screen. When unchecked, the values pull from the Distribution Tab of the Change Order.

Foundation Software User Conference 2012
Reporting Committed Costs from Purchase Orders
Committed:
This capsule reports on dollar amounts entered on purchase orders. As PO/subs are not posted, as soon as the PO/sub is entered and saved, the amounts will appear when using this capsule.
“Invoiced” and “Paid” amounts report from the A/P module for invoices and checks, respectively.
The “Remaining” amount is a calculation of the “Revised” committed costs less the Invoiced amount through A/P.
Reporting Job Cost Quantities
Quantity:
This capsule reports on quantities posted through U/P, I/N, and P/R timecards.
Quantities are used for production reporting. I/N quantities are the actual number of items transferred to the jobs through various I/N postings.
U/P quantities are the quantities for particular bid items updated through the U/P Module when the J/C Quantity Tracking feature is enabled.

Foundation Software User Conference 2012
Reporting Percent Complete from Job Costing
% Complete:
This capsule reports on percentage of completion entered through J/C, Daily Transactions.
These values are “plugged” – entered in as a function of a job journal entry. If % complete information needs to be reported based on original estimates vs. actual costs or units, this column would be defined using a Calculation capsule.
The Job option on this capsule will report Percent Complete Journals entered through the “Enter Percent Complete” function. If the Job checkbox is left blank, the column will report on values posted through “Enter Period Percent” function. The Enter Period Percent function requires entering percentage of completion by Cost Code and Cost Class.
When the Job option is unchecked, you may select the percent complete value from a particular Cost Class.
Reporting Job Income (Billings)
Income:
This capsule reports on income posted to jobs through the A/R Module or estimated income amounts on the Job Record.
The Job checkbox is used to report on income for the entire job. When unchecked, the column will report on income by cost code (Must be enabled in the A/R control file)
Income by cost code may be updated through regular A/R invoices, AIA posting and U/P estimate posting.
When Contract\Bid is selected, and the JOB option is checked, the Values pull from the Job Maintenance, General Tab – Original Contract field. When the JOB option is unchecked, the values pull from the BID amount on the Job Maintenance, Budget tab.

Foundation Software User Conference 2012
Additional Options
Miscellaneous: This capsule includes a number of unique items:
Overhead Allocation (not enabled)
Received Job Dollars: Amounts posted through A/R cash receipts
A/R Discounts: Discounts entered on A/R invoices
A/P Invoices: Total A/P invoices entered per job
A/P Checks: A/P checks paying invoices coded to jobs
A/P Discounts: Discounts entered on A/P invoices by job
I/N Receipt Quantity : Qty. based on I/N Receipts (used only if your inventory items have a distinct Cost Code attached / used
Note: The last five items can only be run by job, not by cost code or class detail.
UDFs (User Defined Fields: This capsule includes any and all unique User Defined fields from the Job Maintenance record. These fields may contain characters or numeric values. Numeric values may be used in calculations. Examples of User Defined Fields for use in J/C reports:
- Billing Cycle - Estimator - Estimated Completion Date - Actual Completion Date - Previous Earned Revenue amount

Foundation Software User Conference 2012
Space: This capsule adds a space in between columns on the report. A space may be used in order to hand-write notes, or a fill in items such as:
- Percentage of Completion - Estimated Completion Date - Revised Contract/Cost values - Cost Adjustments - Change Order Requirements
Calculation:
The Calculation capsule offers great flexibility, allowing users to define computations based on data gathered by previous capsules used in the report.
The options available here are too numerous to list, but a few examples are listed on the following pages

Foundation Software User Conference 2012
Basic Equation Editing
- Formula Capsule in the Data Genie to calculate values
Equation Editor: Data Genie cell used to calculate the amount Over or Under the Revised Estimated Costs.
This value is not available as a predefined cell in the Data genie, but with a simple calculation, we can achieve the required field on the report
Revised Estimated Costs – Cost to Date
Foundation Software User Conference 2012
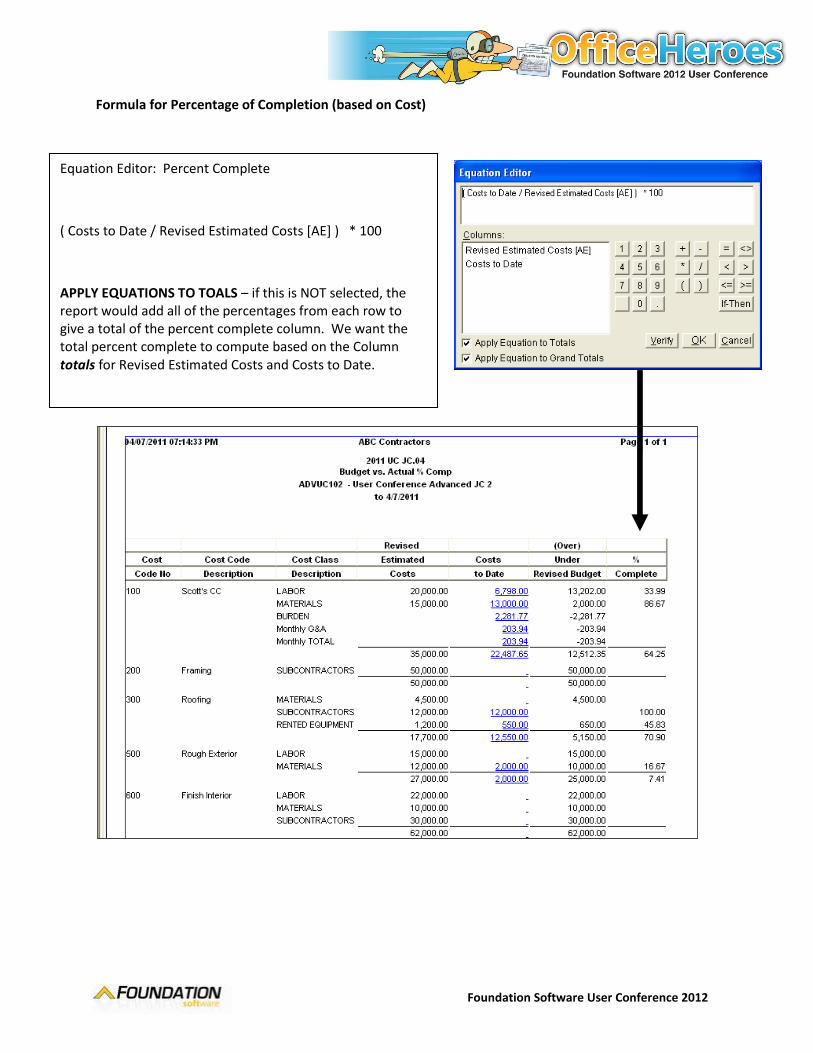
Formula for Percentage of Completion (based on Cost)
Equation Editor: Percent Complete
( Costs to Date / Revised Estimated Costs [AE] ) * 100
APPLY EQUATIONS TO TOALS – if this is NOT selected, the report would add all of the percentages from each row to give a total of the percent complete column. We want the total percent complete to compute based on the Column totals for Revised Estimated Costs and Costs to Date.

Foundation Software User Conference 2012
- Multiple Percentage of Completion Formulas - Percentage of Completion based on COST - Percentage of Completion based on BILLINGS

Foundation Software User Conference 2012
VARIANCE equation:
Percent Complete Income – Percent Complete Cost
These are previous calculations used in a subsequent calculation in the report.
AMT to Invoice equation:
This equation states that if the variance is less than 0 (and the project is underbilled), then use the variance as a percentage against the Revised Contract amount to determine how much needs to be billed to close the variance between % complete cost and % complete billings.

Foundation Software User Conference 2012
- If / Then Statements
Equation Editor: IF THEN Statement.
If A then B else C end
A = Cost Variance < 0
B = (Cost Variance*(-1))
C = 0
If Cost Variance < 0 then (Cost Variance*(-1)) else 0 end

Foundation Software User Conference 2012
- Adding specific criteria for Change Orders with a status of “Pending”
The “Revised Estimated Costs” column represents the original budgeted amount plus any and all Approved and Estimate Change Orders.
The “Pending Change Orders” column shows Change Orders coded with the status of “Pending” .

Foundation Software User Conference 2012
- Reporting % of Completion based on Hours/Units
The Hours/Units Capsules are used for this report.
The Percent Complete calculation is written as shown in report 2011 UC JC.04, but this time we use the Estimated and Actual LABOR hours/units instead of Cost.

Foundation Software User Conference 2012
- Enabling Drilldown to Detail on J/C Activity Reports.
When the < BLANK > column is clicked in this report, open the following <Predefined Report / J/C Activity Report>…<Select Report>
This selection is asking for the particular column to drill down on. We then define what report to drill down to. In most cases, Actual Cost and/or Hours/Units capsules will be selected for the drill down. Costs will drill down to the predefined report: Job History Detail, and Hours will drill down to the predefined report: Timecard History.
Additionally, Billings/Income may be coded to drill down to the predefined report: A/R Full Invoice Report shows job related invoices and cash receipts.
You may also drill down into previously defined Job Cost Activity reports.
It is not recommended to set additional criteria at the bottom of this screen, as it will limit the data returned in the drill down. If the drill down is pointed to another Job Cost Activity Report, then additional criteria may be required.

Foundation Software User Conference 2012
- Expanding previous report to print Cost Code Detail by Job.
The HEADER option is checked for this report.
The Cost Code ID and the Cost Code Description Capsules are added to show row by row detail.

Foundation Software User Conference 2012
- Calculating Average Hourly Rate
Total Labor Average Hourly Rate
Individual COST Capsules are added for the LAB and BUR Cost Classes. A Formula is then created to add the LAB and BUR amounts together to achieve the total Labor Cost.
A Capsule is added for the LAB Hours, using the same period reporting (current).
The Average Hourly Rate is calculated as follows:
(Total Labor / Current LABHours\Units)
Total Labor = (Labor Costs + Burden Costs)
Average Hourly Rate = Total Labor / Current Labor Hours (Units)
Foundation Software User Conference 2012
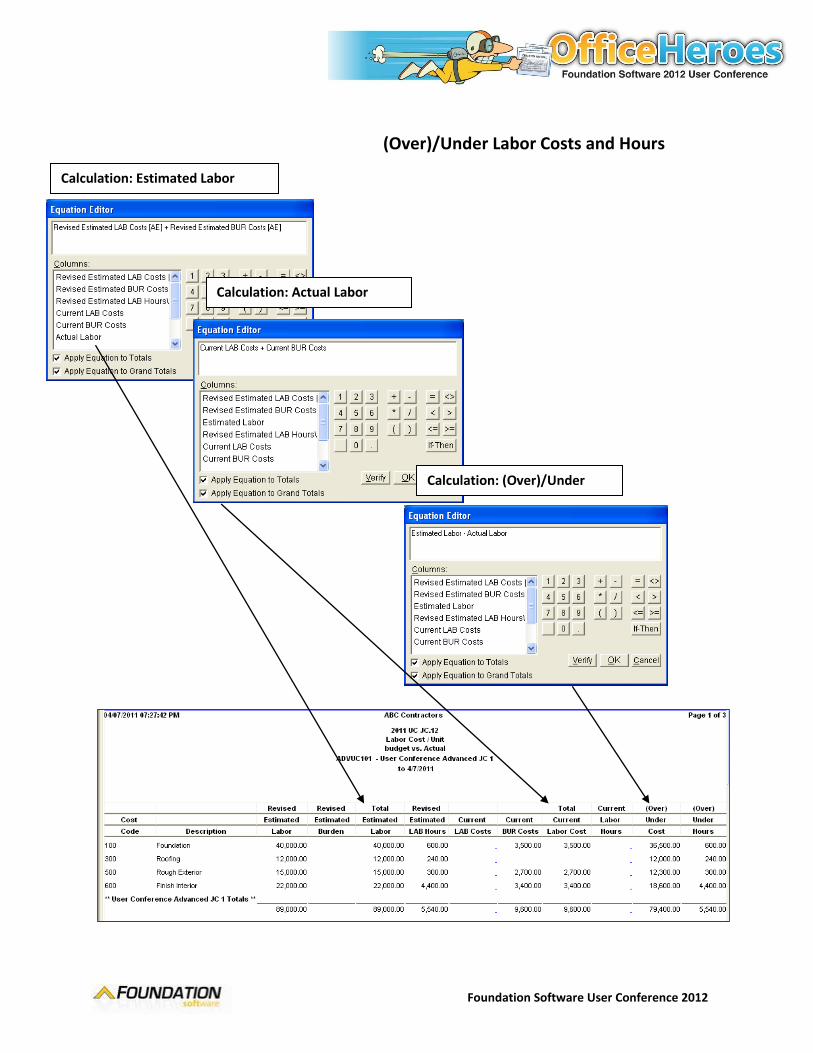
(Over)/Under Labor Costs and Hours
Calculation: (Over)/Under
Calculation: Actual Labor
Calculation: Estimated Labor

Foundation Software User Conference 2012
- Percentage of Completion: Labor Costs and Labor Hours
Calculation: % Complete Cost Calculation: % Complete Hours

Foundation Software User Conference 2012
Open Accounts Receivable
% of Cash Received to Contract
% of Open A/R to Contract

Foundation Software User Conference 2012
- Contract / Cost amounts based on JOB General Tab or Budgeted values
JOB Option on Revised Estimated Income and Revised Estimated Costs
When the JOB option is checked, the Estimated Income and Cost pull from the Job Maintenance Record General Tab. When this option is not checked, the information pulls from the Job Budget. The same holds true for Change Orders, when checked, the values pull from the General tab (income and Cost Field). If unchecked, the Change Order values pull from the Distribution tab.

Foundation Software User Conference 2012
- Quantity Tracking
Quantities may be entered through:
Job Cost Journal Entries
Quantity Worksheets
Unit Price Billing
Timecards Quantities differ from units/hours, as they are based on a Unit of Measure (LF, LBS, TONS, SQF, etc). Quantities are not entered against cost classes, they are posted to a particular cost code. Quantities are used to track production or lay rates. Calculations may be written to report quantities per hour for a particular cost code.

Foundation Software User Conference 2012
Estimated Cost Per Quantity Calculation:
Actual Cost Per Quantity Calculation:
(Over)/Under Estimated Cost Per Quantity Calculation:
Quantity to Complete Calculation:

Foundation Software User Conference 2012
Estimated Lay Rate (Quantity per Hour) Calculation:
Actual Lay Rate (Quantity per Hour) Calculation:

Foundation Software User Conference 2012
- Disabling totals in J/C Activity Report
Some reports may not require the total row for a particular column. Since Quantities are tracked against different Units of Measure, the totals for the Quantity columns (and all associated calculations based on quantities) should be disabled.
The Units of Measure are different across the cost codes listed. Therefore, we need to shut off the column totals for particular items. This is performed in the Data Genie Report section. Highlight the desired column and uncheck the TOTAL option in the Format box.
Click the desired column, then uncheck the TOTAL option in the Format header.
(Repeat for multiple columns as needed.)

Foundation Software User Conference 2012
- Percentage of Completion: Cost, Quantity, Hours
Calculation: % Complete Quantity
Calculation: % Complete Cost Calculation: % Complete Hours

Foundation Software User Conference 2012
Forecasted Hours at Completion:
This report shows the forecasted hours at completion, based on an entered % of completion. If the current labor hours are at 55 hours, and the % of completion is entered as 33.33%, the following calculation applies:
(Current LAB Hours\Units / (Current % Complete )) * 100
The report shows 55 hours / .3333, so 55/.3333 = 165.02. Based on the current hours consumed on the job, and the entered percentage of completion, the projected final hours for this cost code would be 110.
In order to handle the rows with no % complete entered, and if/then statement is used:
if Current % Complete <= 0 then Revised Estimated LAB Hours\Units [AE] else (Current LAB Hours\Units / (Current % Complete )) * 100 end
Foundation Software User Conference 2012
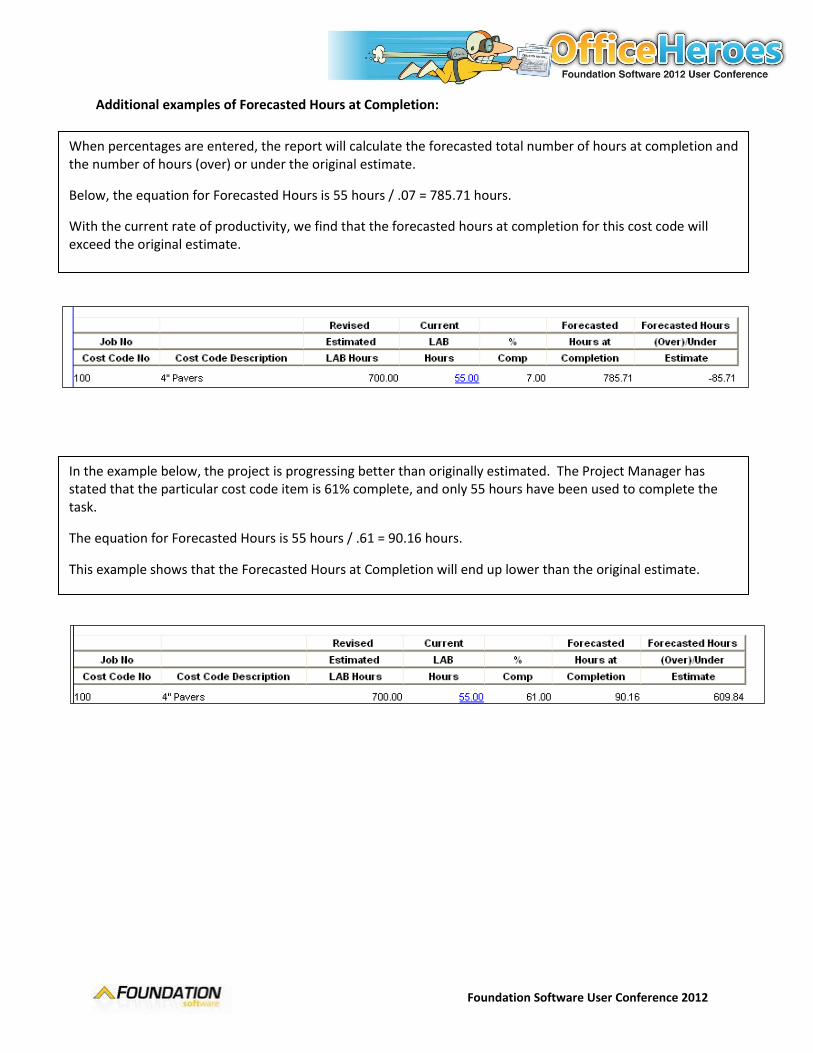
Additional examples of Forecasted Hours at Completion:
When percentages are entered, the report will calculate the forecasted total number of hours at completion and the number of hours (over) or under the original estimate.
Below, the equation for Forecasted Hours is 55 hours / .07 = 785.71 hours.
With the current rate of productivity, we find that the forecasted hours at completion for this cost code will exceed the original estimate.
In the example below, the project is progressing better than originally estimated. The Project Manager has stated that the particular cost code item is 61% complete, and only 55 hours have been used to complete the task.
The equation for Forecasted Hours is 55 hours / .61 = 90.16 hours.
This example shows that the Forecasted Hours at Completion will end up lower than the original estimate.
Foundation Software User Conference 2012
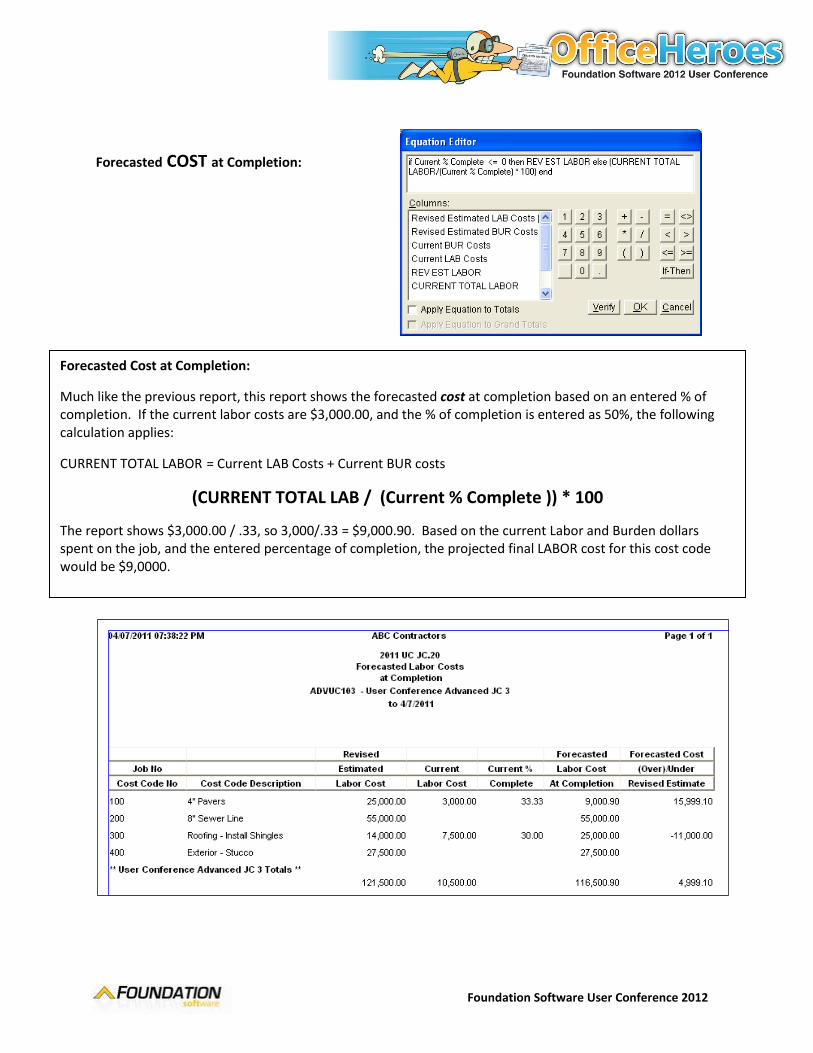
Forecasted COST at Completion:
Forecasted Cost at Completion:
Much like the previous report, this report shows the forecasted cost at completion based on an entered % of completion. If the current labor costs are $3,000.00, and the % of completion is entered as 50%, the following calculation applies:
CURRENT TOTAL LABOR = Current LAB Costs + Current BUR costs
(CURRENT TOTAL LAB / (Current % Complete )) * 100
The report shows $3,000.00 / .33, so 3,000/.33 = $9,000.90. Based on the current Labor and Burden dollars spent on the job, and the entered percentage of completion, the projected final LABOR cost for this cost code would be $9,0000.

Foundation Software User Conference 2012
Additional examples of Forecasted Cost at Completion:
When percentages are entered, the report will calculate the forecasted total Labor Cost at completion and the number of Labor Dollars (over) or under the original estimate.
Below, the equation for Forecasted Hours is $3,000.00 / .07 = $42,857.14 hours.
With the current rate of productivity, we find that the forecasted Labor Dollars at completion for this cost code will exceed the original estimate.
Knowing that the task is in trouble early may offer the opportunity to “fix” the problem before it gets out of control, causing a loss on the job/task.
In the example below, the project is progressing better than originally estimated. The Project Manager has stated that the particular cost code item is 61% complete, and only $3,000.00 Labor dollars have been spent to complete the task.
The equation for Forecasted Cost is $3,000.00 / .61 = 90.16 hours.
This example shows that the Forecasted Labor Cost at Completion will end up lower than the original estimate.

Foundation Software User Conference 2012
Combining Forecasted Labor $ and Labor Hours on one report Same Report, different outcome based on the current Percent Complete.

Foundation Software User Conference 2012
Validation Report to show difference in manually entered percent complete and calculated percent complete.
In the report below, we can see the difference in the manually entered Percentage of Completion and the Calculated Percentage of Completion on the project. The Forecasted Hours at Completion are calculated in the same manner, the purpose of this report is to show ACTUAL Percentages of Completion versus the manually entered values.
If the values entered on the report below are true, and productivity remains the same for this cost code, we will end up with a savings in hours for Cost Code 100.

Foundation Software User Conference 2012
Estimated Cost and Hours at Completion based on Quantity % Complete
In this report, the Percentage of Completion is based on Actual Quantities / Estimated Quantities. This is an ACTUAL percentage of completion based on production. We report the number in QUANTITY of 4” pavers and shingles that have been installed compared to the estimated quantity. The percentage of completion is calculated based on production. This calculated percentage is then used to forecast the Labor Dollars and Hours upon completion of the project.

Foundation Software User Conference 2012
Cost Code Percent Complete Worksheets These worksheets may be found under Job Cost – Daily Transactions – Enter Cost Code Percent Complete Worksheets. The worksheets may be used to enter percentages of completion for a job by cost code and cost class. The entry worksheets also calculate the Projected or Forecasted Cost at Completion.
Amounts reported per cost code:
Estimated Cost = Revised Estimated Cost
Costs To Date = Costs to Date for the selected Cost Code and Cost Class
Calculated % Complete = (Cost To Date / Estimated Cost) * 100
Previous % Complete = cumulative amounts entered in previous periods
Amounts to be entered on worksheet (choose 1, the remaining fields will calculate):
% Complete : The new cumulative % of completion amount for the particular Cost Code. (Entering in 60% in this field results in a period percent complete of 10%)
Period % Complete : The calculated change from last period to the current period. (You may also enter 10% in this field to achieve a total of 60% complete for this item)
Projected Cost : If the % Complete column is entered the Projected Cost calculates as follows:

Foundation Software User Conference 2012
There are TWO ways of calculating the Projected Final Cost. All of the examples in the previous reports have been based on “Actual Cost”. Below you will find an calculations used for the two methods:
When this worksheet is based on “Actual Cost” the fields compute with the calculation
Costs To Date / % Complete
In this case the result is $3,000.00 / .50 = $6,000.00
If the % complete is increased to 60% the equation calculates as follows:
$3,000.00 / .60 = $5,000.00 (this would post an increase of 10% in Period Percent Complete)
If the % complete is decreased to 35% the equation will calculate as follows:
$3,000.00 / .35 = $8,571.43 (this would post an decrease or -15% in Period Percent Complete)
These worksheets are posted to update Job Costing. They perform the same function as the Enter Period Percent Complete Journal. Please refer back to Reports 7, 8, 9 & 10 to see how the posted Period Percent Complete Journal amounts will effect calculations for the Forecasted Amounts and Hours at Completion.
Foundation Software User Conference 2012
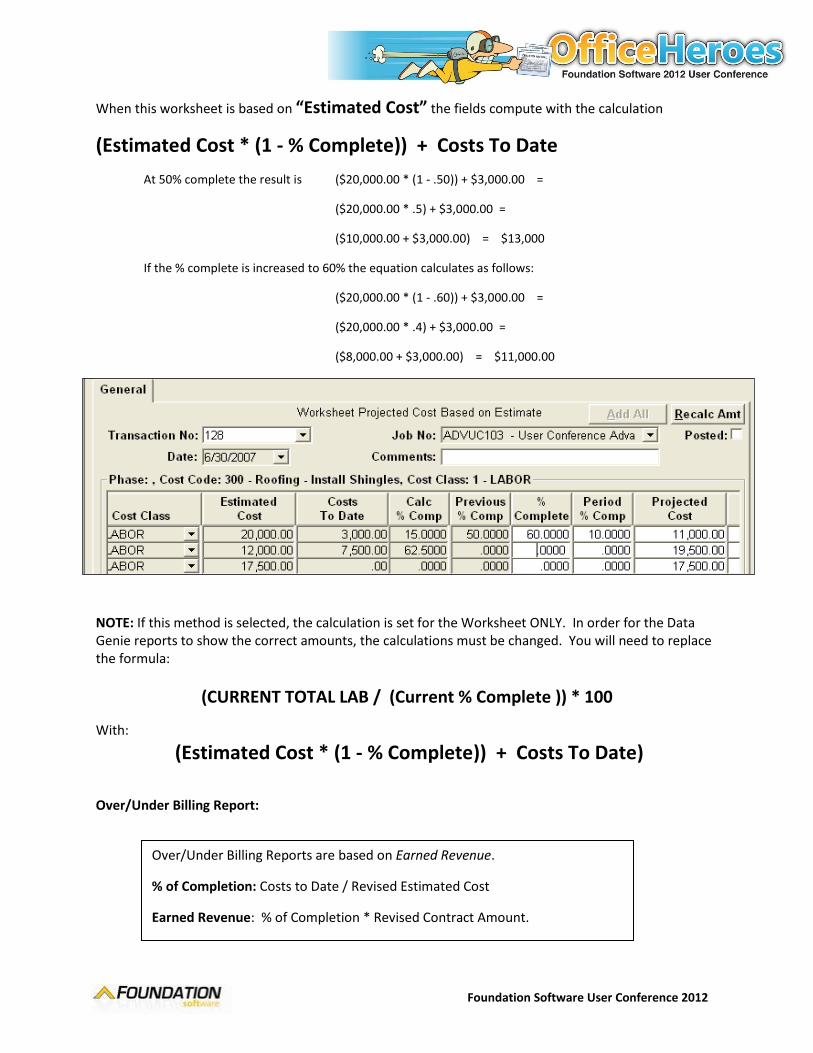
When this worksheet is based on “Estimated Cost” the fields compute with the calculation
(Estimated Cost * (1 - % Complete)) + Costs To Date
At 50% complete the result is ($20,000.00 * (1 - .50)) + $3,000.00 =
($20,000.00 * .5) + $3,000.00 =
($10,000.00 + $3,000.00) = $13,000
If the % complete is increased to 60% the equation calculates as follows:
($20,000.00 * (1 - .60)) + $3,000.00 =
($20,000.00 * .4) + $3,000.00 =
($8,000.00 + $3,000.00) = $11,000.00
NOTE: If this method is selected, the calculation is set for the Worksheet ONLY. In order for the Data Genie reports to show the correct amounts, the calculations must be changed. You will need to replace the formula:
(CURRENT TOTAL LAB / (Current % Complete )) * 100
With:
(Estimated Cost * (1 - % Complete)) + Costs To Date)
Over/Under Billing Report:
Over/Under Billing Reports are based on Earned Revenue.
% of Completion: Costs to Date / Revised Estimated Cost
Earned Revenue: % of Completion * Revised Contract Amount.

Foundation Software User Conference 2012
Sample Over / Under Billing (Work in Progress) Report
Over Billing
Under Billing

Foundation Software User Conference 2012
Calculations for Gross Profit
Estimated Gross Profit
Estimated Gross Profit Percentage
Actual Gross Profit
Actual Gross Profit Percentage

Foundation Software User Conference 2012
Cost by Cost Class Report
This report is an overview of the job cost by cost class. It is a nice report to run at the end of the month to tie out Job cost and General Ledger Balances.
Multiple COST Capsules are added to the report and the individual Cost Class is selected to report in an individual column.
NOTE: Your Cost Class structure may vary from the default setup in Foundation. Make sure all Cost Classes are added to the report. If you forget to add all cost classes, the sum of the individual columns will not add up to the TOTAL COST column on this report.

Foundation Software User Conference 2012
Importing Reports into FOUNDATION
All of the Reports in this session are available on our website. To import the reports into FOUNDATION when you are back at the office, save these reports to your hard drive, then follow these steps.
Access TOOLS – GENIES – DATA and create a new JOB COST ACTIVITY REPORT from the “NEW” tab.
In the Lower left hand corner, click the IMPORT button. This will open a browser. Navigate to the directory that has the .FGF files, and select the report that you wish to import into your system.

Foundation Software User Conference 2012
Once the .FGF file is selected, you may click “OPEN” in the browser window.
You will then receive the following message.
Click the IMPORT button.
All of the fields from the report will fill into the designer. You may make changes here, or simply click Next, Next, Next, Finish to save the report as it has been created for the class.
At the last screen in the Data Genie, you may rename the report to something more appropriate.
Once the report is saved, you may access the report through J/C – Reports – J/C Activity.